Embed Size (px)
Citation preview
October 4, 2016
IPO Review
ICICI Securities Ltd | Retail Equity Research
Enticing opportunity in ancillary space… Endurance Technologies (ETL), incorporated in 1999, is an auto ancillary company with a presence in aluminium casting & machining, suspension, transmission & braking systems. ETL is the No. 1 aluminium die-casting company in India. The company has a strong presence in India (accounting for 67% of revenue) & Europe (31% of revenue) with 25 facilities in eight locations across India & Europe. ETL has diversified its segment (caters to 2-W, 3-W & 4-W space) and has a long clientele list that includes names like Bajaj Auto, PCA Italy Spa, Royal Enfield, Suzuki, Yamaha, Piaggio, Daimler, Jeep, Tata Motors, Chrysler, etc. ETL has a strategy for the next phase of growth that includes 1) focusing on high growth markets, 2) increase its presence in aftermarket & 3) focus on operational efficiency. In FY12-16, ETL’s revenue, EBITDA, PAT registered a CAGR of 8%, 7%, 12%, respectively, outperforming industry growth. Further, its net debt to equity has reduced from 1x in FY12 to 0.3x in FY16. It has consistently generated free cash flow along with strong RoE & RoCE at 19.9% & 22.3%, respectively.
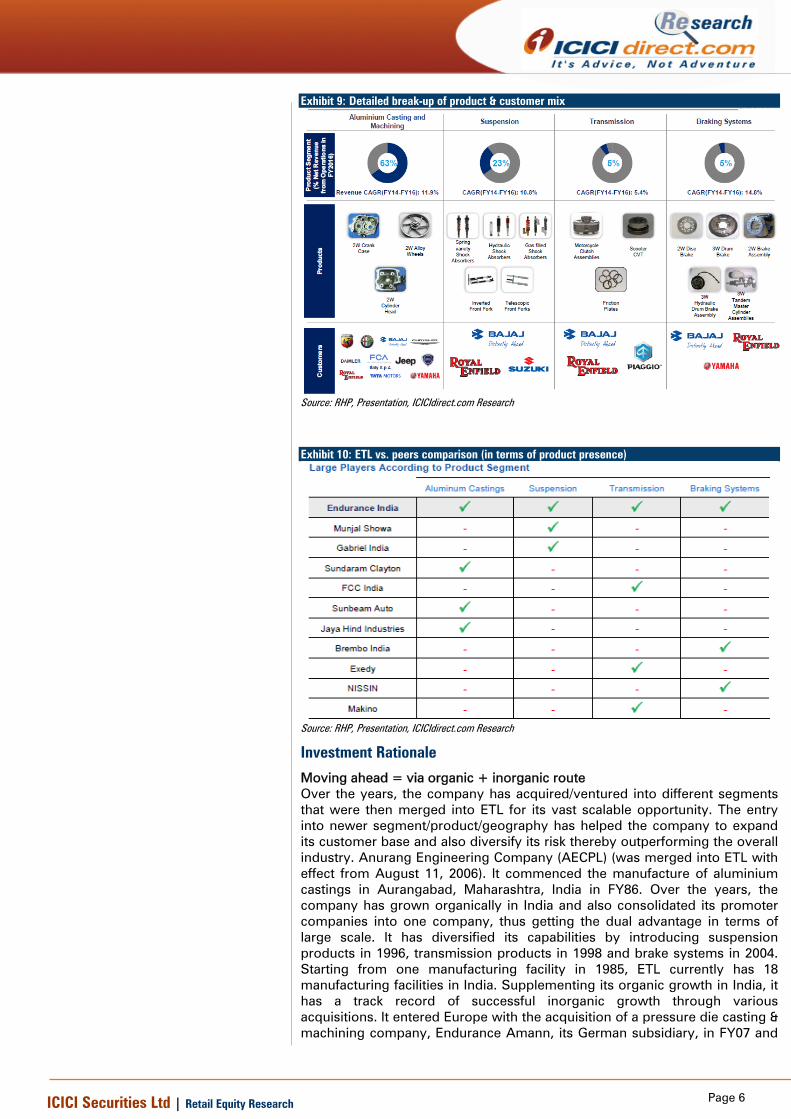
Key investment rationale Well diversified ancillary play = Product + Customer + Geography ETL is the largest 2-W & 3-W automotive component manufacturer in India. It also has operations in Europe with highly-automated manufacturing facilities in Italy & Germany. It has a diversified product portfolio like aluminium casting & machining (accounting for 63% of revenue) suspension (23%), transmission (6%), braking systems (4%) & aftermarket (4%). ETL is a Tier 1 supplier to OEMs for most products with a strong clientele that includes names like Bajaj Auto (drives 41% of revenue), PCA Italy Spa (14%), Royal Enfield (6%). Sales of its top eight customers account for 81.3% of its revenue as of FY16. The company also has a strong focus on R&D activity, which allows it to develop new products according to its customer requirements. ETL has a diversified product portfolio vis-à-vis its peers, thus having an edge in terms of higher association with major OEMs, thereby driving its performance. Strategy in place for next phase of growth
ETL has a vast opportunity to penetrate further and sell all its product segments to its different customers by increasing the share of business as well as tap newer customer base & newer product segments. The company’s strategy for its next phase of growth includes 1) focus on high growth market in India & Europe by pursuing organic & inorganic expansion, 2) focus on aftermarket sales services, 3) cost reduction strategies to improve operational efficiency and 4) improve its R&D capabilities.
Key risk & concerns
Some of the major risks for ETL are 1) slowdown in the overall automotive space; 2) customer concentration risk, 3) competitive industry and 4) unfavourable input price & currency movement impacting its prospects. Well placed among peers + stable financial performance = Subscribe We believe ETL has a diversified product portfolio vis-à-vis its peers thus having an edge in terms of higher association with major OEMs. The company has outperformed industry growth in the past with consistent free cash flow generation & strong return ratios (>20%). At upper price band of | 472, the stock is available at 22.9x on FY16 EPS of | 20.6. We believe ETL has a stable business model (strong customer base & diversified revenue) & financial performance. Hence we recommend SUBSCRIBE for the IPO.
Endurance Technologies Price band | 467-472
Rating matrix
Rating : Subscribe Issue Details Issue Details
Issue Closes 5-Oct-16
Issue Closes 7-Oct-16
Price Band (|) 467 - 472
Bid Multiples (no of shares) 30.0
No. of Shares on Offer (crore) 2.5
Issue Size (| crore) 1150 - 1162
QIB (%) 50.0
Non-Institutional (%) 15.0
Retail (%) 35.0
Objects of the Issue The object of the offer is to achieve the benefits of listing the equity shares on the stock exchanges & to carry out the Offer for sale
Shareholding Pattern Pre-Offer Post-Offer
Promoters & Prom 86.3 82.5
Public 13.7 17.5
*Assuming issue price of |472
Financial Summary | crore FY13 FY14 FY15 FY16
Total Revenues 4111 4522 5247 5628
EBITDA 493 541 605 677
EBITDA Margins 12.0 12.0 11.5 12.0
PAT 169 204 252 290
EPS 12.0 14.5 17.9 20.6
Valuation Summary (at |472; upper price band)
FY13 FY14 FY15 FY16
P/E 39.2 32.5 26.3 22.9
EV/EBITDA 14.8 13.0 11.8 10.5
P/BV 9.0 6.8 5.8 4.6
Research Analyst Nishit Zota [email protected] Vidrum Mehta [email protected]
Page 2ICICI Securities Ltd | Retail Equity Research
Exhibit 1: Consolidated Key Financials | crore FY12 FY13 FY14 FY15 FY16
Total Revenues 4083.8 4111.2 4521.7 5247.1 5627.8
EBITDA 514.9 492.7 540.8 604.9 677.0
EBITDA Margins (%) 12.6 12.0 12.0 11.5 12.0
PAT 182.2 169.3 204.5 252.4 289.8
PAT Margins (%) 4.5 4.1 4.5 4.8 5.1
Diluted EPS 13.0 12.0 14.5 17.9 20.6
RoE 29.9 23.0 20.9 22.1 19.9
RoCE 24.6 22.0 24.5 23.8 22.3
Source: RHP, ICICIdirect.com Research
About the Company
Endurance Technologies (ETL) is an auto ancillary play incorporated in 1999. The company is being managed by first generation entrepreneur Anurang Jain who is the promoter & managing director of ETL. He has a postgraduate degree in business administration from the University of Pittsburgh and has over 31 years of experience in the automobile components industry. ETL is the largest 2-W & 3-W automotive component manufacturer in India. According to the Aluminium Casters Association of India, ETL is the No. 1 aluminium die-casting company in India in terms of actual output and installed capacity in FY16. It also has operations in Europe with highly-automated manufacturing facilities in Italy and Germany. The company has 25 plants across India and Europe. ETL has 18 manufacturing plants in India, all of which are strategically located in the major automotive manufacturing belts of the country, with eight in Aurangabad, five in Pune, two in Pantnagar and one each in Manesar, Chennai and Sanand, with three in-house tool rooms. It also has two manufacturing plants in Germany and five in and around Italy.
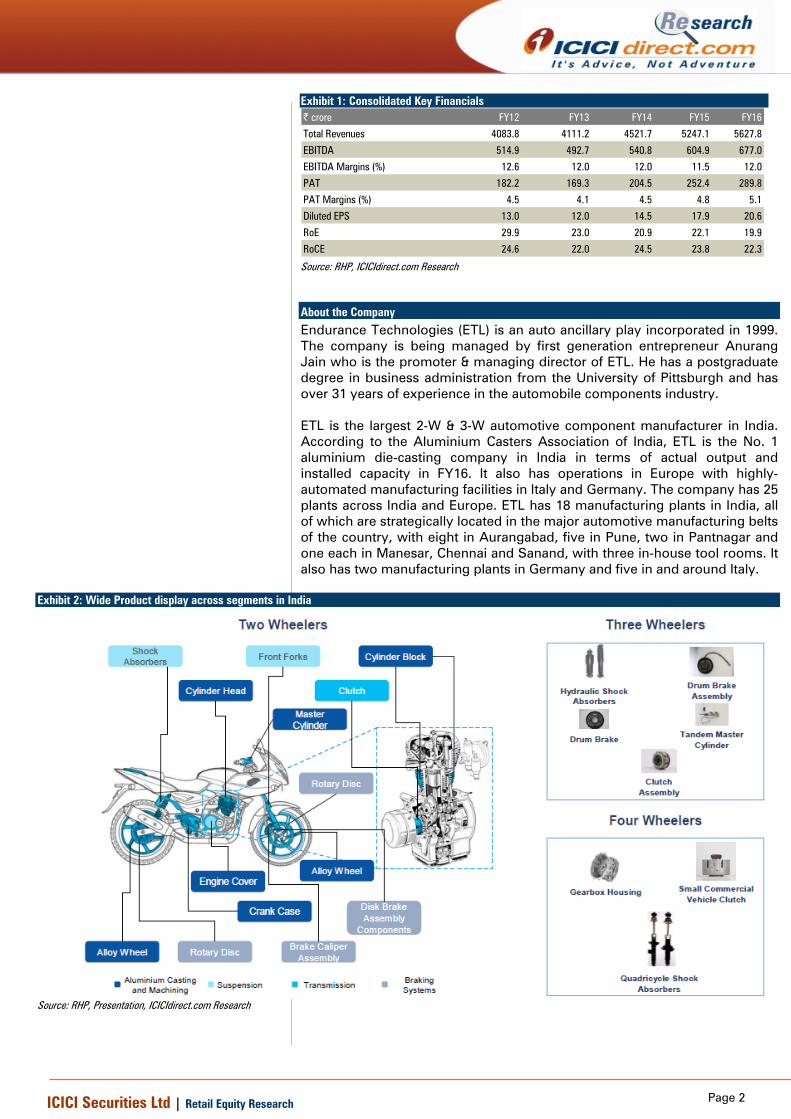
Exhibit 2: Wide Product display across segments in India
Source: RHP, Presentation, ICICIdirect.com Research
Page 3ICICI Securities Ltd | Retail Equity Research
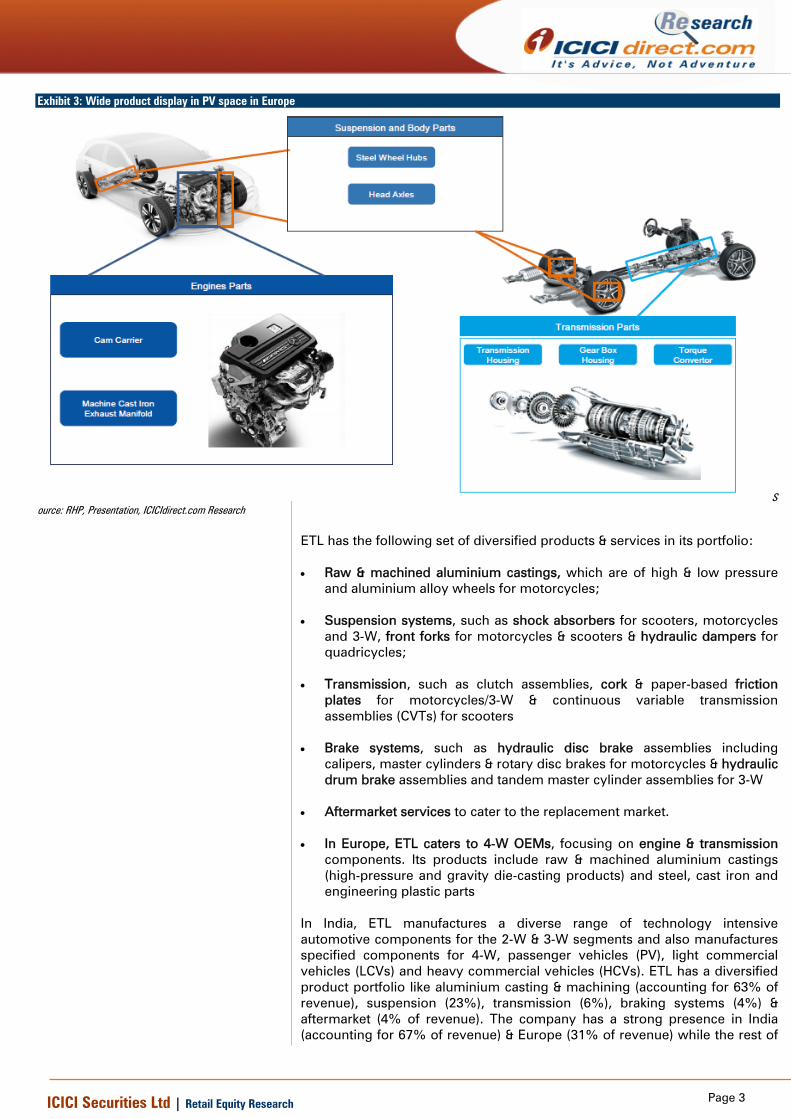
Exhibit 3: Wide product display in PV space in Europe
Source: RHP, Presentation, ICICIdirect.com Research
ETL has the following set of diversified products & services in its portfolio: • Raw & machined aluminium castings, which are of high & low pressure
and aluminium alloy wheels for motorcycles; • Suspension systems, such as shock absorbers for scooters, motorcycles
and 3-W, front forks for motorcycles & scooters & hydraulic dampers for quadricycles;
• Transmission, such as clutch assemblies, cork & paper-based friction
plates for motorcycles/3-W & continuous variable transmission assemblies (CVTs) for scooters
• Brake systems, such as hydraulic disc brake assemblies including
calipers, master cylinders & rotary disc brakes for motorcycles & hydraulic drum brake assemblies and tandem master cylinder assemblies for 3-W
• Aftermarket services to cater to the replacement market. • In Europe, ETL caters to 4-W OEMs, focusing on engine & transmission
components. Its products include raw & machined aluminium castings (high-pressure and gravity die-casting products) and steel, cast iron and engineering plastic parts
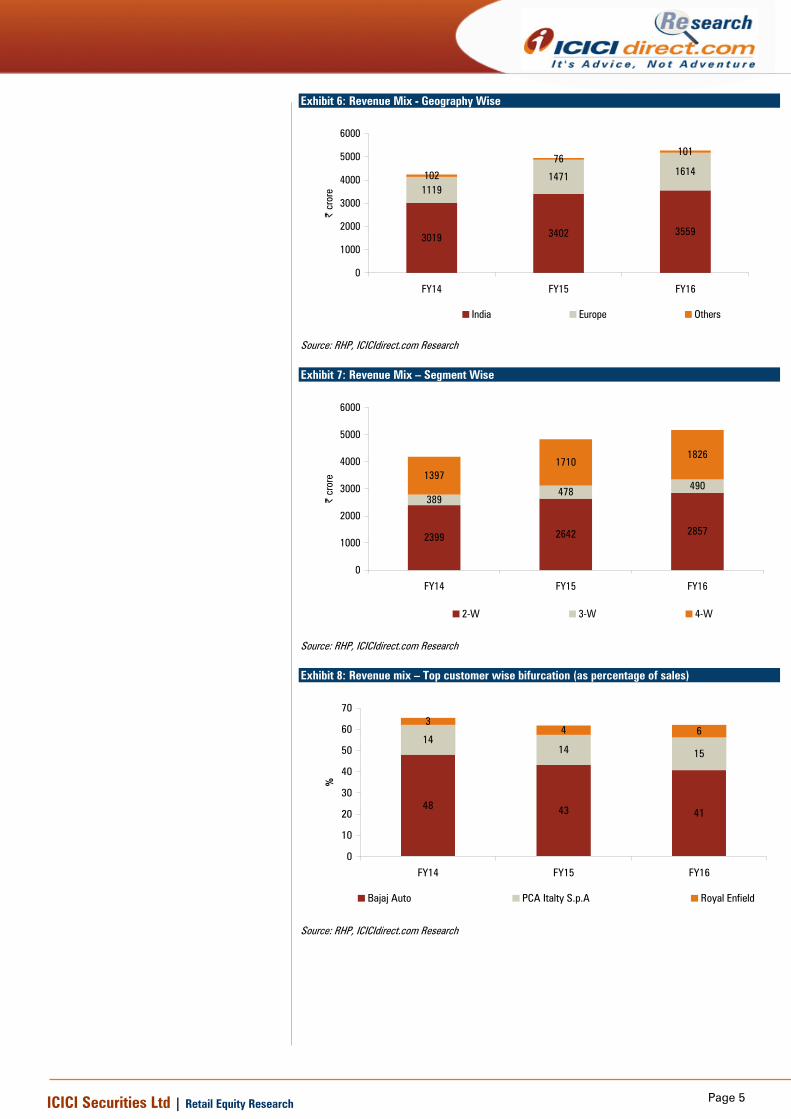
In India, ETL manufactures a diverse range of technology intensive automotive components for the 2-W & 3-W segments and also manufactures specified components for 4-W, passenger vehicles (PV), light commercial vehicles (LCVs) and heavy commercial vehicles (HCVs). ETL has a diversified product portfolio like aluminium casting & machining (accounting for 63% of revenue), suspension (23%), transmission (6%), braking systems (4%) & aftermarket (4% of revenue). The company has a strong presence in India (accounting for 67% of revenue) & Europe (31% of revenue) while the rest of
Page 4ICICI Securities Ltd | Retail Equity Research
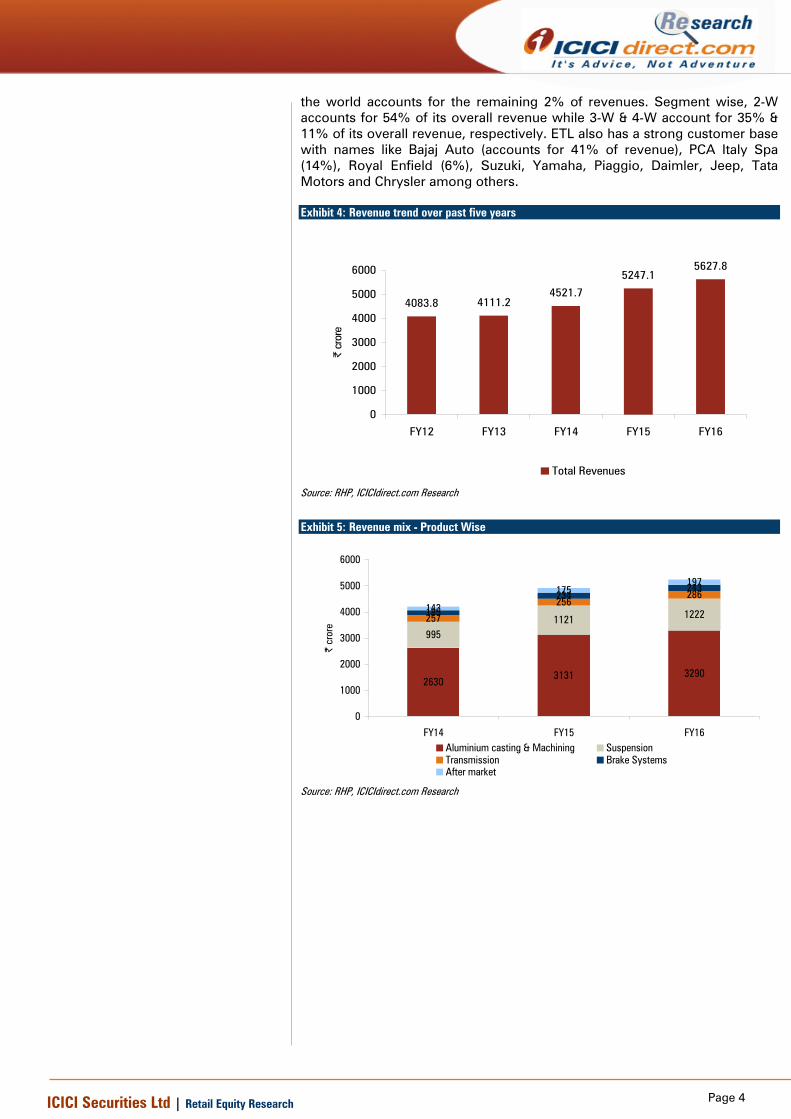
the world accounts for the remaining 2% of revenues. Segment wise, 2-W accounts for 54% of its overall revenue while 3-W & 4-W account for 35% & 11% of its overall revenue, respectively. ETL also has a strong customer base with names like Bajaj Auto (accounts for 41% of revenue), PCA Italy Spa (14%), Royal Enfield (6%), Suzuki, Yamaha, Piaggio, Daimler, Jeep, Tata Motors and Chrysler among others. Exhibit 4: Revenue trend over past five years
4083.8 4111.24521.7
5247.15627.8
0
1000
2000
3000
4000
5000
6000
FY12 FY13 FY14 FY15 FY16
| cr
ore
Total Revenues
Source: RHP, ICICIdirect.com Research
Exhibit 5: Revenue mix - Product Wise
26303131 3290
9951121 1222257
256185
234243
143
175197286
0
1000
2000
3000
4000
5000
6000
FY14 FY15 FY16
| cr
ore
Aluminium casting & Machining SuspensionTransmission Brake SystemsAfter market
Source: RHP, ICICIdirect.com Research
Page 5ICICI Securities Ltd | Retail Equity Research
Exhibit 6: Revenue Mix - Geography Wise
3019 3402 3559
11191471 1614102
76101
0
1000
2000
3000
4000
5000
6000
FY14 FY15 FY16
| cr
ore
India Europe Others
Source: RHP, ICICIdirect.com Research Exhibit 7: Revenue Mix – Segment Wise
2399 2642 2857
389478 490
13971710
1826
0
1000
2000
3000
4000
5000
6000
FY14 FY15 FY16
| cr
ore
2-W 3-W 4-W
Source: RHP, ICICIdirect.com Research Exhibit 8: Revenue mix – Top customer wise bifurcation (as percentage of sales)
48 43 41
1414 15
34 6
0
10
20
30
40
50
60
70
FY14 FY15 FY16
%
Bajaj Auto PCA Italty S.p.A Royal Enfield
Source: RHP, ICICIdirect.com Research
Page 6ICICI Securities Ltd | Retail Equity Research
Exhibit 9: Detailed break-up of product & customer mix
Source: RHP, Presentation, ICICIdirect.com Research Exhibit 10: ETL vs. peers comparison (in terms of product presence)
Source: RHP, Presentation, ICICIdirect.com Research
Investment Rationale
Moving ahead = via organic + inorganic route Over the years, the company has acquired/ventured into different segments that were then merged into ETL for its vast scalable opportunity. The entry into newer segment/product/geography has helped the company to expand its customer base and also diversify its risk thereby outperforming the overall industry. Anurang Engineering Company (AECPL) (was merged into ETL with effect from August 11, 2006). It commenced the manufacture of aluminium castings in Aurangabad, Maharashtra, India in FY86. Over the years, the company has grown organically in India and also consolidated its promoter companies into one company, thus getting the dual advantage in terms of large scale. It has diversified its capabilities by introducing suspension products in 1996, transmission products in 1998 and brake systems in 2004. Starting from one manufacturing facility in 1985, ETL currently has 18 manufacturing facilities in India. Supplementing its organic growth in India, it has a track record of successful inorganic growth through various acquisitions. It entered Europe with the acquisition of a pressure die casting & machining company, Endurance Amann, its German subsidiary, in FY07 and
Page 7ICICI Securities Ltd | Retail Equity Research
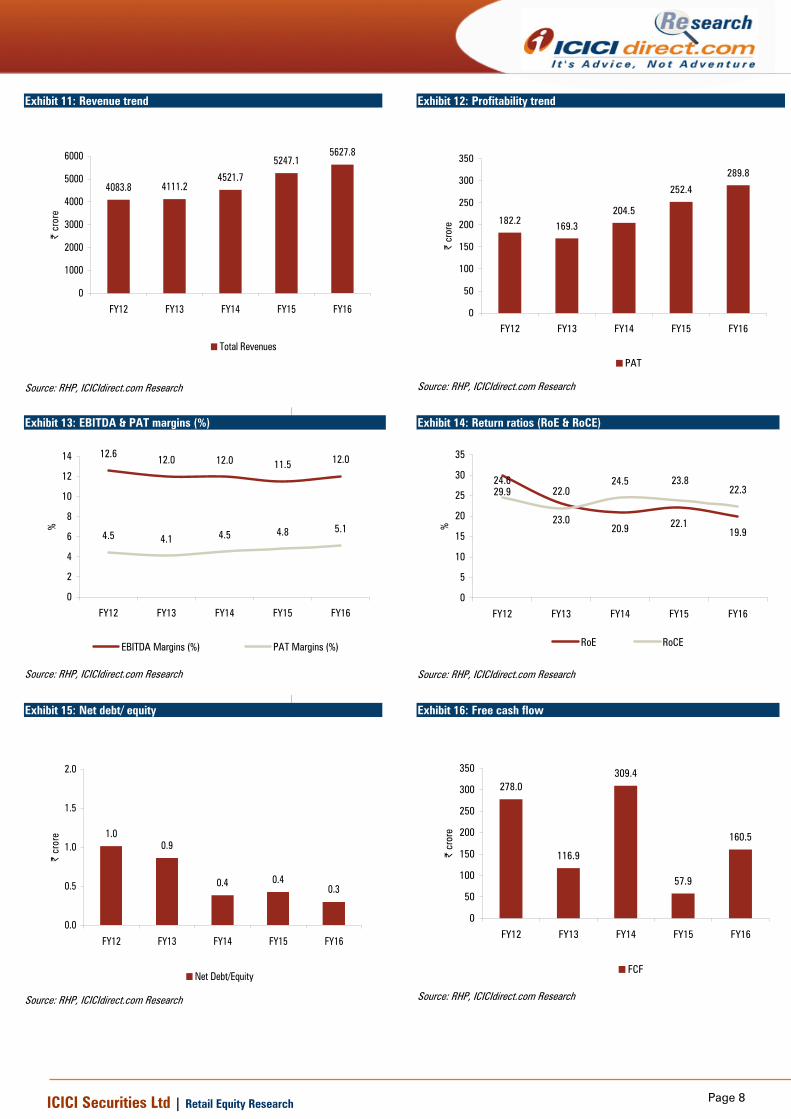
the acquisition of Endurance Fondalmec, its Italian subsidiary, in FY08. The company further expanded its European operations with the acquisition of Endurance FOA (acquired a 15% stake in FY13 and the remaining 85% stake in FY15) and Grana's business division engaged in the production of engineering moulded plastic components in FY15. It has outstripped growth in the broader industry in India through the successful expansion of its customer base and its focus on R&D & its ability to manage costs and effective production cycle. During FY14-16, ETL’s total revenue in India witnessed a CAGR of 8.4% compared to the 2-W & 3-W production in India, which registered CAGR of 5.6% & 6.1%, respectively. Similarly, for the same period, its total revenue in Europe grew at a CAGR of 19.6%. The company has not only witnessed growth in its topline but also seen good growth in its bottomline. Its PAT margin has improved from 4.8% in FY14 to 5.1% in FY15 to 5.5% in FY6. Largest 2-W, 3-W component manufacturer, strong client relationship! ETL is a multi-solution provider of a diverse product portfolio to a wide variety of OEMs. It is the largest 2-W & 3-W automotive component manufacturer in India in its product segments. According to the Aluminium Casters Association of India, ETL is the No. 1 aluminium die-casting company in India in terms of actual output & installed capacity in FY16. The company also has operations in Europe with highly automated manufacturing facilities in Italy and Germany. Its customers in India & Europe include leading domestic and global OEMs. ETL’s customers in India include Bajaj Auto, Royal Enfield, Honda and Yamaha. It has a longstanding relationship with Bajaj, which is its largest customer accounting 40% of its revenue. In addition to these customers, ETL also supplies to a variety of other OEMs in India, such as Hero, Mahindra, Tata Motors, H-D Motor Company & Fiat India. In Europe, its supplies to FCA Italy Spa, Daimler, as well as other 4-W OEMs operating from Europe. Growing & profitable European business ETL has seen strong growth in the European market, with revenues registering a CAGR of 19.4% in FY14-16. The company manufactures a wide range of raw & machined aluminium die-casting products, such as components for engines, transmissions and vehicle bodies. They also manufacture components for aspirated and turbocharged engines, many of which meet Euro VI emissions standards. The company’s strategy in Europe has been to expand with a focus on profitable growth, high margin products, and marquee customers and it has pursued this strategy through organic growth as well as a series of acquisitions. ETL has improved the capital efficiency of its European business through the diversification of product technology and material solutions, increasing its focus on machining products & introduction of higher-tonnage machines. Stable financial performance ETL has posted a decent financial performance in the past. Over FY12-16, revenue, EBITDA, PAT registered a CAGR of 8%, 7%, 12%, respectively. Over the years, the company has maintained its operating margin at ~12%. On the balance sheet front, its net debt to equity has reduced from 1x in FY12 to 0.3x in FY16. Also, strong free cash flow generation (FCF) has helped ETL to lower its debt levels. The company also has strong return ratios with RoE and RoCE at 19.9% and 22.3%, respectively, which is positive for the company.
Page 8ICICI Securities Ltd | Retail Equity Research
Exhibit 11: Revenue trend
4083.8 4111.24521.7
5247.15627.8
0
1000
2000
3000
4000
5000
6000
FY12 FY13 FY14 FY15 FY16
| cr
ore
Total Revenues
Source: RHP, ICICIdirect.com Research
Exhibit 12: Profitability trend
182.2 169.3204.5
252.4
289.8
0
50
100
150
200
250
300
350
FY12 FY13 FY14 FY15 FY16
| cr
ore
PAT
Source: RHP, ICICIdirect.com Research
Exhibit 13: EBITDA & PAT margins (%)
12.6 12.0 12.0 11.5 12.0
4.5 4.1 4.5 4.8 5.1
0
2
4
6
8
10
12
14
FY12 FY13 FY14 FY15 FY16
%
EBITDA Margins (%) PAT Margins (%)
Source: RHP, ICICIdirect.com Research
Exhibit 14: Return ratios (RoE & RoCE)
29.9
23.020.9 22.1
19.9
24.622.0
24.522.3
23.8
0
5
10
15
20
25
30
35
FY12 FY13 FY14 FY15 FY16
%
RoE RoCE
Source: RHP, ICICIdirect.com Research
Exhibit 15: Net debt/ equity
1.00.9
0.4 0.40.3
0.0
0.5
1.0
1.5
2.0
FY12 FY13 FY14 FY15 FY16
| cr
ore
Net Debt/Equity
Source: RHP, ICICIdirect.com Research
Exhibit 16: Free cash flow
278.0
116.9
309.4
57.9
160.5
0
50
100
150
200
250
300
350
FY12 FY13 FY14 FY15 FY16
| cr
ore
FCF
Source: RHP, ICICIdirect.com Research
Page 9ICICI Securities Ltd | Retail Equity Research
Company strategy = for next phase of growth
Focus on high growth market (2W & 3W in India & 4W in Europe)
With deep experience within the 2-W & 3-W market in India and with 2-W & 3-W automotive component manufacturing technology, as well as its focus on delivering quality products, ETL is well positioned to capture the growth of the Indian 2-W & 3-W automotive component manufacturing industry in India. The European Union is among the world's biggest producers of motor vehicles and passenger vehicles. With ETL growing its European business, it is well positioned to capture growth in the European automobile markets.
Expansion of presence in aftermarket sales services
Its presence in after market services provides significant opportunities for growth. The company’s aftermarket products are of the same quality standards as that which it supplies to OEMs, providing it with good brand equity among end-users of its products. ETL has expanded its reach from 12 distributor centres (in 2001) to 256 in India and 26 distributors outside India in FY16. Further, after market services have higher margins compared to OEMs, which are likely to benefit the company. It intends to grow its aftermarket sales services through a variety of initiatives, namely entering new countries, increasing product penetration through the introduction of new products & models and expanding its distribution network in India with focus on Maharashtra, Uttar Pradesh, Gujarat, Tamil Nadu & Rajasthan.
Looks for inorganic growth opportunities
ETL continues to pursue its strategic alliances & inorganic growth opportunities. This is largely focusing on technological & innovative acquisitions that can provide access to better technology with respect to its existing products, thereby diversifying its product and customer base. It seeks to combine low-cost base & manufacturing capabilities with high-end technologies through agreements with global automotive components manufacturers to obtain a competitive advantage. Currently, the company has a number of agreements with technology partners and will continue to pursue newer agreements.
Focus on operational efficiencies to improve returns
Offering quality products at attractive prices is a key aspect of maintaining and expanding its relationships with clients. For the same, the company has adopted a number of initiatives designed to improve its cost efficiency. It has adopted TPM initiative across all its manufacturing locations to improve its operational efficiency and the reliability of its manufacturing processes by lowering break downs and rejections. The company intends to use a variety of other manufacturing, sourcing & cost reduction strategies to continue to improve its operational efficiencies.
Improve R&D capabilities to focus on advanced technology, high value-add products
To enhance its R&D capabilities, the company has undertaken a number of short-term and long-term R&D initiatives. For example, it is developing a new automotive proving ground (test track) in India, which will enable it to test its products under simulated road conditions. This will enhance its ability to analyse & enhance product reliability, durability & performance. It intends to increase its share of value-added products by increasing its machining component of castings and sub assemblies as well as through the addition of high-value products.
Page 10ICICI Securities Ltd | Retail Equity Research
Key Risk & Concerns
Slowdown in overall demand environment (automotive space) ETL’s performance is largely dependent on the automotive space. Any slowdown in the space could directly impact its performance. Further, the company is highly dependent on the domestic 2-W & European 4-W space. Moderation in growth within the space would impact its performance. As of FY16, ~30% of the revenue is from European market and Brexit may adversely affect its business, results of operations, and prospects.
High customer concentration risk ETL has higher customer concentration risk which could impact its financial performance. As of FY16, Bajaj Auto & FCA Italy Spa account for 41% & 15% of its overall revenue, respectively. Further, sales from its top eight customers accounts for 81.3% of its overall revenues. Any slowdown or loss of order from its key customer could significantly impact its business. The company also does not have any long term purchase agreement with Bajaj Auto & FCA and instead relies only on short-term purchase orders. Thus, its significant customer dependence may impact its financial performance.
Competitive industry = risk for its growth prospects ETL competes with global competitors to retain its existing business as well as to acquire new business. The company’s failure to obtain new business or retain or increase its existing business could adversely affect its prospects. Further pricing pressure from customers may adversely affect its gross margin, profitability while its ability to increase product prices may impact its performance.
Unfavourable (input price movement) may impact its gross margins ETL’s primary raw material comprises aluminium & steel and any unfavourable movement in prices of the same could impact its gross margins. Historically, the company has passed on the rise in these costs to consumers. However, going ahead, it may get impacted if there is any gap in the time between the date of procurement of the primary raw materials & the date on which it can reset the component prices for its customers.
Adverse currency movement may impact its performance
ETL’s consolidated results of operations are in INR while its subsidiaries report their financial results in their respective local currencies. Hence, there could be an impact on consolidation of its financials primarily due to currency movement. Exchange rate fluctuations may have an adverse effect on their reported revenues & financial results.
Page 11ICICI Securities Ltd | Retail Equity Research
Objects of issue The object of the net proceeds is primarily to benefit from the listing of equity shares on stock exchanges and carry out an offer for sale. The listing of the equity shares will enhance the company’s brand name and provide liquidity to its existing shareholders. ETL will not receive any proceeds from the offer. All proceeds from the offer will directly go to the selling shareholders.
Valuations We believe ETL has a diversified product portfolio vis-à-vis its peers, thus giving it an edge in terms of higher association with major OEMs. The company has outperformed the industry growth in the past, consistently free cash flow generating & strong return ratios (>20%). At the upper price band of | 472, the stock is available at 22.9x on FY16 EPS of | 20.6. We believe ETL has a stable business model (strong customer base & diversified revenue) and financial performance. Hence, we recommend SUBSCRIBE on the IPO.
Page 12ICICI Securities Ltd | Retail Equity Research
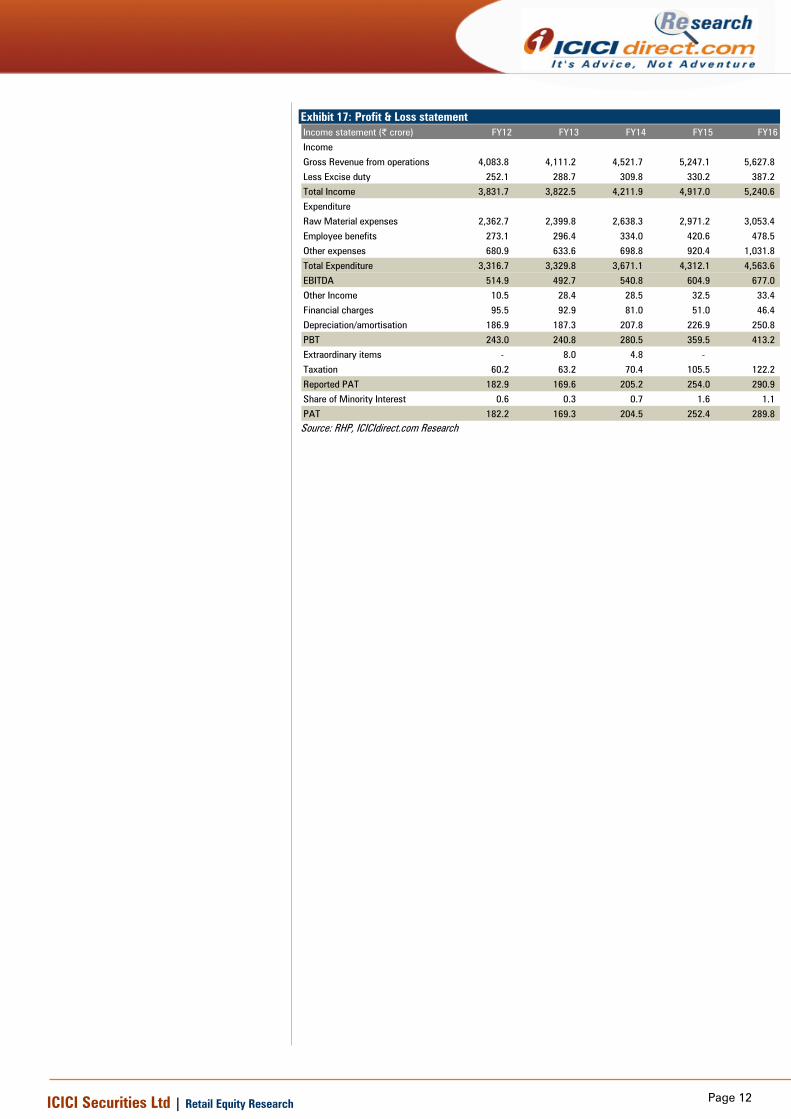
Exhibit 17: Profit & Loss statement Income statement (| crore) FY12 FY13 FY14 FY15 FY16
Income
Gross Revenue from operations 4,083.8 4,111.2 4,521.7 5,247.1 5,627.8
Less Excise duty 252.1 288.7 309.8 330.2 387.2
Total Income 3,831.7 3,822.5 4,211.9 4,917.0 5,240.6
Expenditure
Raw Material expenses 2,362.7 2,399.8 2,638.3 2,971.2 3,053.4
Employee benefits 273.1 296.4 334.0 420.6 478.5
Other expenses 680.9 633.6 698.8 920.4 1,031.8
Total Expenditure 3,316.7 3,329.8 3,671.1 4,312.1 4,563.6
EBITDA 514.9 492.7 540.8 604.9 677.0
Other Income 10.5 28.4 28.5 32.5 33.4
Financial charges 95.5 92.9 81.0 51.0 46.4
Depreciation/amortisation 186.9 187.3 207.8 226.9 250.8
PBT 243.0 240.8 280.5 359.5 413.2
Extraordinary items - 8.0 4.8 -
Taxation 60.2 63.2 70.4 105.5 122.2
Reported PAT 182.9 169.6 205.2 254.0 290.9
Share of Minority Interest 0.6 0.3 0.7 1.6 1.1
PAT 182.2 169.3 204.5 252.4 289.8 Source: RHP, ICICIdirect.com Research
Page 13ICICI Securities Ltd | Retail Equity Research
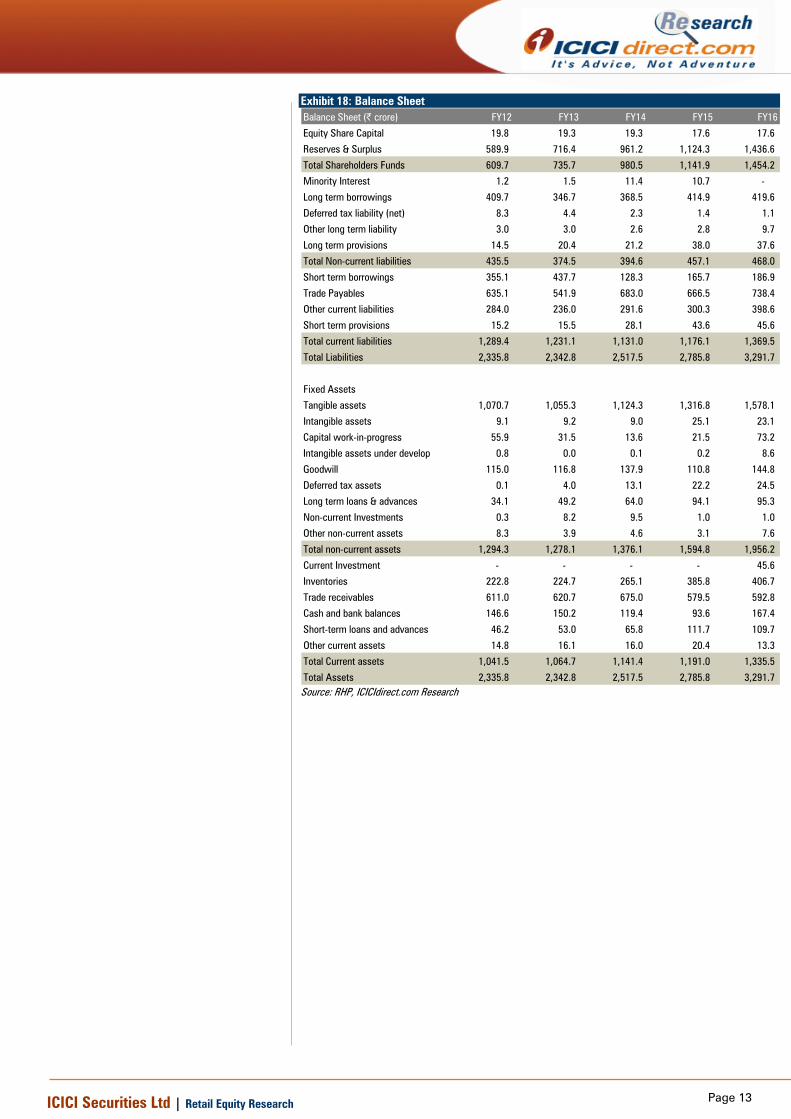
Exhibit 18: Balance Sheet Balance Sheet (| crore) FY12 FY13 FY14 FY15 FY16
Equity Share Capital 19.8 19.3 19.3 17.6 17.6
Reserves & Surplus 589.9 716.4 961.2 1,124.3 1,436.6
Total Shareholders Funds 609.7 735.7 980.5 1,141.9 1,454.2
Minority Interest 1.2 1.5 11.4 10.7 -
Long term borrowings 409.7 346.7 368.5 414.9 419.6
Deferred tax liability (net) 8.3 4.4 2.3 1.4 1.1
Other long term liability 3.0 3.0 2.6 2.8 9.7
Long term provisions 14.5 20.4 21.2 38.0 37.6
Total Non-current liabilities 435.5 374.5 394.6 457.1 468.0
Short term borrowings 355.1 437.7 128.3 165.7 186.9
Trade Payables 635.1 541.9 683.0 666.5 738.4
Other current liabilities 284.0 236.0 291.6 300.3 398.6
Short term provisions 15.2 15.5 28.1 43.6 45.6
Total current liabilities 1,289.4 1,231.1 1,131.0 1,176.1 1,369.5
Total Liabilities 2,335.8 2,342.8 2,517.5 2,785.8 3,291.7
Fixed Assets
Tangible assets 1,070.7 1,055.3 1,124.3 1,316.8 1,578.1
Intangible assets 9.1 9.2 9.0 25.1 23.1
Capital work-in-progress 55.9 31.5 13.6 21.5 73.2
Intangible assets under develop 0.8 0.0 0.1 0.2 8.6
Goodwill 115.0 116.8 137.9 110.8 144.8
Deferred tax assets 0.1 4.0 13.1 22.2 24.5
Long term loans & advances 34.1 49.2 64.0 94.1 95.3
Non-current Investments 0.3 8.2 9.5 1.0 1.0
Other non-current assets 8.3 3.9 4.6 3.1 7.6
Total non-current assets 1,294.3 1,278.1 1,376.1 1,594.8 1,956.2
Current Investment - - - - 45.6
Inventories 222.8 224.7 265.1 385.8 406.7
Trade receivables 611.0 620.7 675.0 579.5 592.8
Cash and bank balances 146.6 150.2 119.4 93.6 167.4
Short-term loans and advances 46.2 53.0 65.8 111.7 109.7
Other current assets 14.8 16.1 16.0 20.4 13.3
Total Current assets 1,041.5 1,064.7 1,141.4 1,191.0 1,335.5
Total Assets 2,335.8 2,342.8 2,517.5 2,785.8 3,291.7 Source: RHP, ICICIdirect.com Research
Page 14ICICI Securities Ltd | Retail Equity Research
RATING RATIONALE ICICIdirect.com endeavours to provide objective opinions and recommendations. ICICIdirect.com assigns ratings to its stocks according to their notional target price vs. current market price and then categorises them as Strong Buy, Buy, Hold and Sell. The performance horizon is two years unless specified and the notional target price is defined as the analysts' valuation for a stock. Strong Buy: >15%/20% for large caps/midcaps, respectively, with high conviction; Buy: >10%/15% for large caps/midcaps, respectively; Hold: Up to +/-10%; Sell: -10% or more;
Pankaj Pandey Head – Research [email protected]
ICICIdirect.com Research Desk, ICICI Securities Limited, 1st Floor, Akruti Trade Centre, Road No 7, MIDC, Andheri (East) Mumbai – 400 093
Page 15ICICI Securities Ltd | Retail Equity Research
ANALYST CERTIFICATION We /I, Nishit Zota MBA and Vidrum Mehta MBA, Research Analysts, authors and the names subscribed to this report, hereby certify that all of the views expressed in this research report accurately reflect our views about the subject issuer(s) or securities. We also certify that no part of our compensation was, is, or will be directly or indirectly related to the specific recommendation(s) or view(s) in this report.
Terms & conditions and other disclosures: ICICI Securities Limited is a Sebi registered Research Analyst having registration no. INH000000990. ICICI Securities Limited (ICICI Securities) is a full-service, integrated investment banking and is, inter alia, engaged in the business of stock brokering and distribution of financial products. ICICI Securities is a wholly-owned subsidiary of ICICI Bank which is India’s largest private sector bank and has its various subsidiaries engaged in businesses of housing finance, asset management, life insurance, general insurance, venture capital fund management, etc. (“associates”), the details in respect of which are available on www.icicibank.com. ICICI Securities is one of the leading merchant bankers/ underwriters of securities and participate in virtually all securities trading markets in India. We and our associates might have investment banking and other business relationship with a significant percentage of companies covered by our Investment Research Department. ICICI Securities generally prohibits its analysts, persons reporting to analysts and their relatives from maintaining a financial interest in the securities or derivatives of any companies that the analysts cover. The information and opinions in this report have been prepared by ICICI Securities and are subject to change without any notice. The report and information contained herein is strictly confidential and meant solely for the selected recipient and may not be altered in any way, transmitted to, copied or distributed, in part or in whole, to any other person or to the media or reproduced in any form, without prior written consent of ICICI Securities. While we would endeavour to update the information herein on a reasonable basis, ICICI Securitiesis is under no obligation to update or keep the information current. Also, there may be regulatory, compliance or other reasons that may prevent ICICI Securities from doing so. Non-rated securities indicate that rating on a particular security has been suspended temporarily and such suspension is in compliance with applicable regulations and/or ICICI Securities policies, in circumstances where ICICI Securities might be acting in an advisory capacity to this company, or in certain other circumstances. This report is based on information obtained from public sources and sources believed to be reliable, but no independent verification has been made nor is its accuracy or completeness guaranteed. This report and information herein is solely for informational purpose and shall not be used or considered as an offer document or solicitation of offer to buy or sell or subscribe for securities or other financial instruments. Though disseminated to all the customers simultaneously, not all customers may receive this report at the same time. ICICI Securities will not treat recipients as customers by virtue of their receiving this report. Nothing in this report constitutes investment, legal, accounting and tax advice or a representation that any investment or strategy is suitable or appropriate to your specific circumstances. The securities discussed and opinions expressed in this report may not be suitable for all investors, who must make their own investment decisions, based on their own investment objectives, financial positions and needs of specific recipient. This may not be taken in substitution for the exercise of independent judgment by any recipient. The recipient should independently evaluate the investment risks. The value and return on investment may vary because of changes in interest rates, foreign exchange rates or any other reason. ICICI Securities accepts no liabilities whatsoever for any loss or damage of any kind arising out of the use of this report. Past performance is not necessarily a guide to future performance. Investors are advised to see Risk Disclosure Document to understand the risks associated before investing in the securities markets. Actual results may differ materially from those set forth in projections. Forward-looking statements are not predictions and may be subject to change without notice. ICICI Securities or its associates might have managed or co-managed public offering of securities for the subject company or might have been mandated by the subject company for any other assignment in the past twelve months. ICICI Securities or its associates might have received any compensation from the companies mentioned in the report during the period preceding twelve months from the date of this report for services in respect of managing or co-managing public offerings, corporate finance, investment banking or merchant banking, brokerage services or other advisory service in a merger or specific transaction. ICICI Securities or its associates might have received any compensation for products or services other than investment banking or merchant banking or brokerage services from the companies mentioned in the report in the past twelve months. ICICI Securities encourages independence in research report preparation and strives to minimize conflict in preparation of research report. ICICI Securities or its analysts did not receive any compensation or other benefits from the companies mentioned in the report or third party in connection with preparation of the research report. Accordingly, neither ICICI Securities nor Research Analysts have any material conflict of interest at the time of publication of this report. It is confirmed that, Nishit Zota MBA and Vidrum Mehta MBA,, Research Analysts of this report have not received any compensation from the companies mentioned in the report in the preceding twelve months. Compensation of our Research Analysts is not based on any specific merchant banking, investment banking or brokerage service transactions. ICICI Securities or its subsidiaries collectively or Research Analysts do not own 1% or more of the equity securities of the Company mentioned in the report as of the last day of the month preceding the publication of the research report. Since associates of ICICI Securities are engaged in various financial service businesses, they might have financial interests or beneficial ownership in various companies including the subject company/companies mentioned in this report. It is confirmed that, Nishit Zota MBA and Vidrum Mehta MBA, Research Analysts do not serve as an officer, director or employee of the companies mentioned in the report. ICICI Securities may have issued other reports that are inconsistent with and reach different conclusion from the information presented in this report. Neither the Research Analysts nor ICICI Securities have been engaged in market making activity for the companies mentioned in the report. We submit that no material disciplinary action has been taken on ICICI Securities by any Regulatory Authority impacting Equity Research Analysis activities. This report is not directed or intended for distribution to, or use by, any person or entity who is a citizen or resident of or located in any locality, state, country or other jurisdiction, where such distribution, publication, availability or use would be contrary to law, regulation or which would subject ICICI Securities and affiliates to any registration or licensing requirement within such jurisdiction. The securities described herein may or may not be eligible for sale in all jurisdictions or to certain category of investors. Persons in whose possession this document may come are required to inform themselves of and to observe such restriction.