Embed Size (px)
Citation preview

Presentation by
Edward Kennedy, President & CEO
The North West Company
October 5, 1999; Toronto

“WHY INVEST IN NORTH WEST?”
1. Who We Are
2. Growth
3. Income


# of stores Revenue
Canada = 151 $494 million
Alaska = 25 $135 million

“WHY INVEST IN NORTH WEST?”
1. Who We Are !
2. Growth
3. Income

Source: Statistics Canada Census 1996
49%34%
Population Under 25Years of Age
NWC Markets
CanadianAverage
Northern CanadaGrowth Rate
CanadianGrowth Rate
2.3%1.1%

ECONOMIC DRIVERSECONOMIC DRIVERS
URBAN MARKET
Lower interest ratesHigher consumerconfidence
Increased housing turnover
Increased home improvement, appliances, electronic sales
ABORIGINAL MARKET
Population growth,Political action, Landclaims
Increased spending onhousing & infrastructure
Increased employment, spending in all non-food categories; Nunavut
NATURAL RESOURCES MARKET
Resource price cycle New capacity Jobs, overtime, increased employment and spending in all non-food categories.

" Achieve Canadian productivitygains
“V2K+” GROWTH STRATEGIES
# Increase Canadian market share
$ Accelerate Alaska performancetrend

% Admin. expenses reduced by $5 mm
" Achieve Canadian Productivity Gains
% Eliminate $35 million in under-performing assets
%Gains from technology (central MMS,auto replenish, tickets-off, autoreceiving)
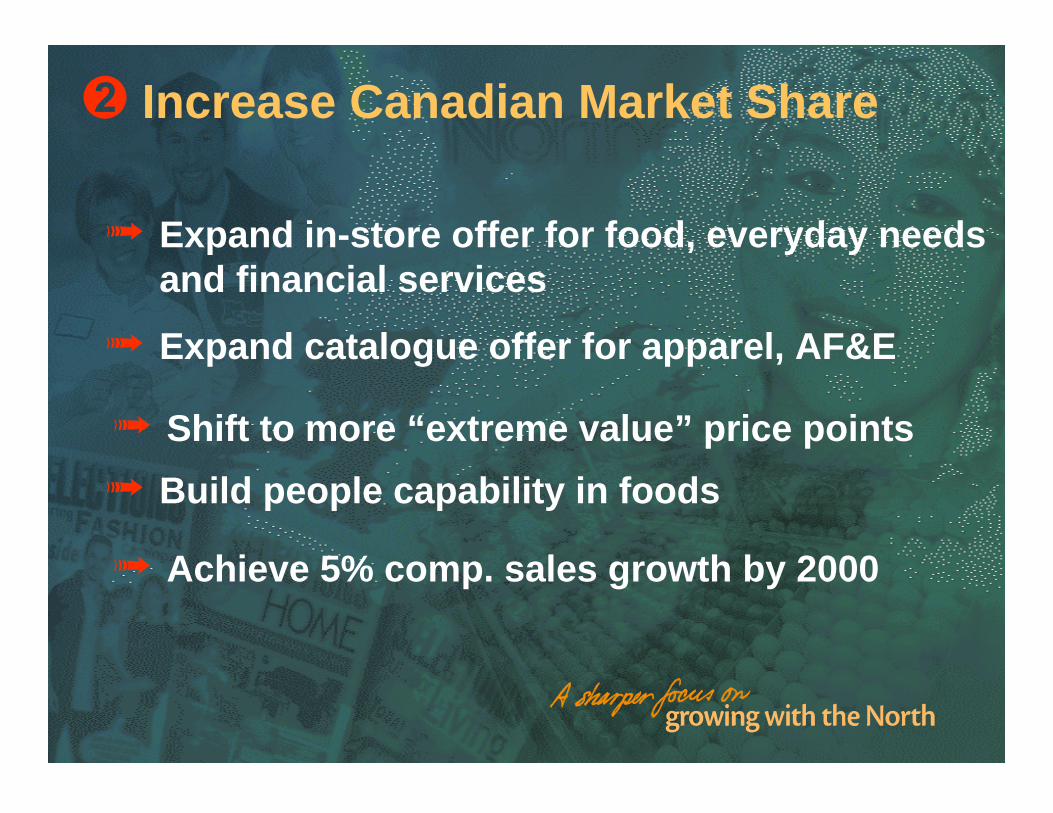
% Expand in-store offer for food, everyday needsand financial services
# Increase Canadian Market Share
% Expand catalogue offer for apparel, AF&E
% Shift to more “extreme value” price points
% Build people capability in foods
% Achieve 5% comp. sales growth by 2000


$ Accelerate Alaska Performance Trend
$1.8$2.2
$3.6
$6.3
$2.2
$3.3
$0.6
$0.0
$1.0
$2.0
$3.0
$4.0
$5.0
$6.0
$7.0
1994 1995 1996 1997 1998 19986Mos.
19996Mos.
EBITDA

% Leverage local market knowledge curve
$ Accelerate Alaska Performance Trend
% Increase “mid-sized” new store growth rate
% Move on opportunities created by localmarket consolidations
% Exit “can’t be fixed” locations

EARNINGS PER UNIT*
$0.68
$1.18$1.40
$1.82
$0.70$0.92
$0.00
$0.50
$1.00
$1.50
$2.00
1995 1996 1997 1998 19986Mos.
19996Mos.
Before Unusual Items * Earnings per share for 1995 - 1997


“WHY INVEST IN NORTH WEST?”
1. Who we are !
2. Growth !
3. Income

100% - 15 M units100% - 15 M units
NWF STRUCTURENWF STRUCTURE
UNITHOLDERS
100% - sub debt $175 M100% common 15 M shares
NWF
NWC
$11.67 sub debt @ 12.5%1 common share
EACH UNIT
NWF
NWC
Income distributable per unit:1998 - 1.251999 - 1.44

$37.9$33.3
$44.1 $42.2$45.1
$22.0
0.00
10.00
20.00
30.00
40.00
50.00
PRE-TAX CASH FLOW
1994 1995 19961997
1998
$ in millions
1999
6 Mos.

DEBT : EQUITY
177 175 172 172
178
$ Millions
169160 147 160
164
140
1.3
1.1
1.3
1.1
1.2
1.1
0
50
100
150
200
250
1994 1995 1996 1997 1998 SA 99
1.00
1.05
1.10
1.15
1.20
1.25
1.30
1.35
Debt Equity debt : equity

“WHY INVEST IN NORTH WEST?”
1. Who we are !
2. Growth !
3. Income !

MERCHANDISING INDICES:MERCHANDISING INDICES:
FOOD STORES 57.8%
NWF.UN 18.5%
SPECIALITY STORES 14.0%
TSE 2.1%
MERCHANDISING 0.3%
DEPARTMENT STORES -21.1%
WHOLESALE DIST. -31.1%
HOSPITALITY -54.7%

OTHER COMPARABLES:
Canadian Tire 41.10 1.0 19.2Sears Canada 26.00 0.9 18.3Wal-Mart 95.38 0.4 49.7
Empire 25.30 1.1 5.5Loblaws 40.50 0.5 38.2Safeway 51.50 -- 32.9
NWF.UN 14.35 8.3 7.9*
* Does not include a $0.74 charge related to Canadian re-structuring
ClosedApr.5 /99 Yield % P/E

QUESTIONS?

For additional information on the Fund orthe Company, please call 204-934-1501 ortoll-free 1-800-563-0002; fax 204-934-1317;e-mail [email protected]….or visit ourweb site www.northwest.ca.