Embed Size (px)
Citation preview
Providence St. Joseph HealthProvidence St. Joseph Health Digital Commons
Articles, Abstracts, and Reports
7-3-2017
ODELAY: A Large-scale Method for Multi-parameter Quantification of Yeast Growth.Thurston HerricksInstitute for Systems Biology
Fred D MastInstitute for Systems Biology
Song LiInstitute for Systems Biology
John D AitchisonInstitute for Systems Biology
Follow this and additional works at: https://digitalcommons.psjhealth.org/publications
Part of the Genetics and Genomics Commons
This Article is brought to you for free and open access by Providence St. Joseph Health Digital Commons. It has been accepted for inclusion in Articles,Abstracts, and Reports by an authorized administrator of Providence St. Joseph Health Digital Commons. For more information, please [email protected].
Recommended CitationHerricks, Thurston; Mast, Fred D; Li, Song; and Aitchison, John D, "ODELAY: A Large-scale Method for Multi-parameterQuantification of Yeast Growth." (2017). Articles, Abstracts, and Reports. 1233.https://digitalcommons.psjhealth.org/publications/1233

Journal of Visualized Experiments www.jove.com
Copyright © 2017 Creative Commons Attribution-NonCommercial-NoDerivs 3.0 UnportedLicense
July 2017 | 125 | e55879 | Page 1 of 11
Video Article
ODELAY: A Large-scale Method for Multi-parameter Quantification of YeastGrowthThurston Herricks1, Fred D. Mast1,2, Song Li1, John D. Aitchison1,2
1Institute for Systems Biology2Center for Infectious Disease Research
Correspondence to: Thurston Herricks at [email protected]
URL: https://www.jove.com/video/55879DOI: doi:10.3791/55879
Keywords: Cellular Biology, Issue 125, Growth rate, lag time, carrying capacity, fitness assessment, yeast, phenotype assay
Date Published: 7/3/2017
Citation: Herricks, T., Mast, F.D., Li, S., Aitchison, J.D. ODELAY: A Large-scale Method for Multi-parameter Quantification of Yeast Growth. J. Vis.Exp. (125), e55879, doi:10.3791/55879 (2017).
Abstract
Growth phenotypes of microorganisms are a strong indicator of their underlying genetic fitness and can be segregated into 3 growth regimes:lag-phase, log-phase, and stationary-phase. Each growth phase can reveal different aspects of fitness that are related to various environmentaland genetic conditions. High-resolution and quantitative measurements of all 3 phases of growth are generally difficult to obtain. Here we presenta detailed method to characterize all 3 growth phases on solid media using an assay called One-cell Doubling Evaluation of Living Arrays ofYeast (ODELAY). ODELAY quantifies growth phenotypes of individual cells growing into colonies on solid media using time-lapse microscopy.This method can directly observe population heterogeneity with each growth parameter in genetically identical cells growing into colonies.This population heterogeneity offers a unique perspective for understanding genetic and epigenetic regulation, and responses to genetic andenvironmental perturbations. While the ODELAY method is demonstrated using yeast, it can be utilized on any colony forming microorganismthat is visible by bright field microscopy.
Video Link
The video component of this article can be found at https://www.jove.com/video/55879/
Introduction
Growth phenotypes of microorganisms are a strong indicator of their underlying genetic fitness to a given environmental condition. Growth isclassically segregated into 3 different growth regimes: lag-phase, log-phase, and stationary-phase growth1. Each growth phase can revealdifferent aspects of fitness that are dependent on various environmental and genetic conditions. For example, lag time, or the length of timean organism spends in lag-phase before the start of exponential growth, can be indicative of an organism's ability to respond to alteredenvironmental conditions2. Doubling time during log-phase growth, the most common metric of cellular fitness, reveals the overall efficiency of anorganism's ability to divide by metabolizing and utilizing environmental materials for replication. Stationary phase, where growth after log-phaseis rapidly reduced, is another indicator of fitness, which is regularly used as a growth endpoint in spot-based yeast growth assays.
Several yeast growth assays are currently available and considered standard methods for evaluating growth phenotypes in yeast3,4,5. Theseassays are primarily based on methods for growing yeast either on solid or in liquid media. On solid media, colony pinning assays transfer asmall number of cells onto solid agar with a pin, and yeast cells are allowed to grow for a defined period of time. Colonies are then imaged andtheir sizes are compared at a terminal endpoint6. These colony pinning assays have proven robust and scalable to generate genome-widescreens. More recently, periodic imaging using flat-bed scanners and Single Lens Reflex (SLR) cameras have been incorporated into theseassays to record colony growth over time7,8,9. However, the resolution of these devices prevents them from detecting single cells and thus, thesecolony pinning assays do not directly observe lag time and cannot observe variation between the individual cells that grow into colonies.
Liquid-based growth assays have also been employed to perform genome-wide screens3. Coupling a liquid growth assay with time-lapsemicroscopy revealed population heterogeneity in the doubling time of genetically identical individual cells, which offers an important perspectivefor understanding genetic regulation and environmental adaptation. However, this assay does not measure other aspects of growth such aslag time and carrying capacity10. Here we present a method to characterize all three growth phases of colony forming microorganisms on solidmedia using an assay we term ODELAY11. ODELAY consists of utilizing high throughput time-lapse microscopy to record images of single cellsgrowing into colonies on solid media. This population of individual cells growing into colonies reveals the underlying population heterogeneity,which is not detected by other less sensitive measurements such as terminal endpoint scoring. We demonstrate the method on yeast, butODELAY may be applied to any organism that shows contrast in bright field microscopy.

Journal of Visualized Experiments www.jove.com
Copyright © 2017 Creative Commons Attribution-NonCommercial-NoDerivs 3.0 UnportedLicense
July 2017 | 125 | e55879 | Page 2 of 11
Protocol
1. Preparation of Agarose Gel Stock
1. Weigh out 2 g of high purity agarose.2. Add the agarose to a 500 mL bottle and record their combined mass.3. Calculate the target mass of the bottle plus 2 g agarose with 150 g of ultra-pure water, then add 150 g of ultra-pure water to within 0.1 g of
this target mass.4. Note the mass of the bottle plus the agarose and water.5. Place the bottle in a microwave and make sure to fit the bottle with a loose cap on top to minimize water evaporation while heating the
agarose.6. Microwave the bottle in 15 - 20 s bursts followed by briefly swirling the bottle to mix the agarose and water. Repeat this procedure until the
solution is boiling and the mixture is homogeneous.
CAUTION: Take care to avoid scalding skin with steam escaping from the bottle. Also, the bottle will become hot to the touch and appropriateprotection, such as an autoclave glove, is required to avoid injury.
7. After the molten agarose is homogeneous, weigh the bottle again and add ultrapure water to within 0.1 g of the original mass. This willreplace any water lost due to evaporation.
8. Before the molten agarose solidifies, swirl to mix in the added water to ensure homogeneity.9. Aliquot 15.2 g of agarose into 9 - 50 mL plastic tubes.10. Refrigerate the tubes until needed.
2. Preparing ODELAY Agarose Media
1. Heat 400 mL of deionized water to boil in a covered beaker, on a hotplate under gentle stirring with a magnetic stir bar.2. Add 2 mL of 10X media (e.g., Yeast Extract Peptone (YEP), or Complete Supplement Mixture (CSM)) to a 15.2 g agarose aliquot in a 50 mL
conical tube from step 1.10.
NOTE: CSM medium tends to stick to the glass slides. If using CSM media formulations, add 5 µL of 50% wt Polyethylene glycol (PEG) insterile water to the medium formulation. The PEG prevents the agar from sticking to the glass slides during mold release and does not inhibityeast growth.
3. Add additional 100X nutrient supplements, if needed, and use water to bring the total added volume from this step to 1 mL.4. Weigh the agarose aliquot with added media and supplements before placing the 50 mL conical tube into boiling water from step 2.1.5. After 16 min, take out the 50 mL tube and homogenize the mixture using a vortex. Keep the cap fastened tight on the 50 mL conical tube.
NOTE: A lid on the beaker helps heat the whole tube evenly otherwise a film of solid agarose will form and possibly not melt. Also during thistime, it is convenient to assemble the agarose mold (Figure 1).
6. Homogenize the mixture using a vortex.7. Boil for an additional 2 min to ensure all agar is mixed and melted.8. Weigh tube and replace any mass lost with ultra-pure sterile water.9. Add 2 mL of 10X carbon-source reagent (e.g., 20% w/v glucose) and vortex to obtain agarose medium solution.
NOTE: Separation of Glass Slides: When assembling the mold, care must be taken to make sure the long spacers are placed in the moldwith the correct orientation. This is because as the laser cuts the acrylic, it tends to cut as a cone leaving the part with slightly angled sidesinstead of exactly 90° sides. Then when the mold is placed on the benchtop to release the glass from the agar, the edge of spacer shouldbe at an acute angle with the agar. The acute angle helps compress the edge of the agar away from the upper piece of glass as the outsideedge of the mold spacer is pivoted about the lower edge (see Figure 1). The result is a more consistent separation of the agar from the toppiece of glass.
NOTE: Mold release agents applied to the glass like oils, silicon sprays or even commercial window treatments should not be used becausethey will contaminate the surface of the agar and possibly inhibit growth. These methods take some practice to be consistent.
10. Clean four 2 in x 3 in x 1 mm thick glass slides with 70% ethanol and dry using forced air.11. Clean acrylic molds with 70% ethanol, dry, and assemble as shown in Figure 1. Take the three bottom pieces, as shown, and assemble
them so that the two identical pieces sandwich the third piece (Figure 1B). Clamp the base pieces on each side using two small binder clips(Figure 1C). Place the uprights into the mold making sure that the laser kerf is correctly positioned (Figure 1E).
12. Place the cleaned and dried glass slide on the mold and hold it in place while placing a second glass slide on the other side. Clamp theassembly with a larger binder clip (Figure 1D). Clamp down both slides with larger binder clips (Figure 1D). Make sure the upper binder clipis in contact with the glass slide overlapping with the acrylic.
13. Add remaining binder clips. Again, make sure the clamps contact the slide where it overlaps the acrylic (Figure 1D).
NOTE: Before filling the assembled mold with molten agar, ensure the edges are sealed by pipetting about 70 µL of molten agar media alongthe inner side of the mold. This agar will quickly solidify and prevent any leaks.
14. Fill the mold with molten agar, making sure to avoid trapping air bubbles in the mold.
NOTE: This can be accomplished by slowly pipetting the molten agar along the edge of the mold. After it is filled, allow the mold to cool for 40min to 1 h at about 23 °C ambient temperature. If allowed to cool too long the agar may fracture in the mold.
NOTE: Mold Separation: Proper removal of the mold from the cast agar is essential to ensuring a uniform solid agar pad for yeast growth.Failure to ensure efficient separation of the mold at this step will cause growth differences that are attributable to imperfections in the solidagar pad. Practicing this step a few times is recommended.
15. Start by removing the bottom binder clip. Remove the bottom part of the mold that consists of the three sandwiched pieces. Hold the slides bycompressing them and then remove the binder clips. Be sure not to bump the mold sides while removing the binder clips. This will deform themedia.

Journal of Visualized Experiments www.jove.com
Copyright © 2017 Creative Commons Attribution-NonCommercial-NoDerivs 3.0 UnportedLicense
July 2017 | 125 | e55879 | Page 3 of 11
16. Place the mold on the edge of the bench top so that the side of the mold with the blue dot is facing up and in the lower left corner (Figure1E). Place thumbs underneath the acrylic and the first finger on the top towards the inner edge of the mold.
17. Slowly and carefully push up with thumb against the mold, as if pivoting the mold spacer about its lower edge (Figure 1F). Apply constant butslowly increasing pressure. Users will see a break and air bubble appear along the line where the top glass covers the mold spacer.
18. After seeing the initial break line, continue pushing up with thumbs and apply constant pressure. The agar should start breaking away fromthe glass at this point (Figure 1F). Continue to pivot the mold upwards. This will lift the glass without sliding it. A line where the agar is peelingaway from the glass should continue to move away from the initial break line.
NOTE: At this point, the agar is sticking to both the bottom and top of the glass. This will occasionally occur with the left most edge. As longas the area deformed is not in the area where yeast is spotted, this should be fine.
19. As the glass comes completely free, grab it and remove it completely from the mold. Then remove the other mold piece using a similar motionto lift the piece free without moving the agar. Place the slides in a sterile tip box with some sterile high purity water in the bottom. Close thebox and store at 4 °C O/N for use the next day. If stored for longer, the growth rates will become inconsistent.
3. ODELAY Culture Preparation
1. Lay out strains in a 96-well plate for O/N growth.2. The next day, dilute 20 µL of overnight culture into 200 µL media for 220 µL total volume in a new plate.3. Measure the optical density at 600 nm (OD600) of each culture in a plate reader. Using a plate reader and a liquid handling robot, follow the
automated dilution protocol of steps 3.3.1 - 3.3.6. Manually dilute the cultures in the plate to approximately 0.1 OD600 (optional).1. On the plate reader, hit "Experiment" under "create new". Choose ODELAYDilution.exp and run the experiment. Enter experiment
name as ODELAY "Date" "Time" "Experiment Name" iteration.2. Click on the statistics tab and then click on the Excel icon. Save the data to a thumb drive and transfer it to a liquid handling robot
computer.3. Open the Robot's Layout and Method Editor. Open the Method file "ODELAYDilution_v1.med". Run the Executable
"Convert_SynergyFiles.exe". Enter 0.09 for target OD600.4. Click on "Glu Correction" and "Gal Correction" to 0.05. Measure blank media in an identical plate. Click on "Generate File". Select the
file in the method editor. Click on the stoplight icon to start the method to open the runtime dilution program.5. Make sure tubes are uncapped and plates have lids removed and dust covers are removed from tips. Load plates, tubes and tips onto
the liquid handling robot's deck, as indicated by the deck layout.6. Click the "Play" button to run the dilution program. Select the correct number of 50 µL tips. Select the correct number of 300 µL tips.
Wait about 12 min for the process to run.
4. Take the dilution plate from the robot, cover the tips, and recap the 15 mL media tubes. Culture the plate for 5 - 6 h at 30 °C.5. About 1 - 2 h before starting the second dilution make sure to turn on the incubation chambers for the microscope. Allow them to equilibrate
at °C or the temperature required for the experiment.6. Repeat the dilution steps 3.3 - 3.4, but dilute cultures to an OD600 of 0.01 - 0.02 for spotting the cultures on agarose slides.7. Cover the dilution plate with a metal freezer seal.8. Sonicate the dilution plate in an ice bath for 30 s with the plate floating in ice water using a centrifuge metal bucket-fitting to hold the plate
(Figure 2A). Transfer the sonicated cultures from the dilution plate to a flat bottom plate. Label 4 x 96-well flat bottom plates 1, 2, 3 and 4(Figure 2B).
1. Transfer 150 µL of the dilution plate from wells A01 - D06 into wells C04 - F09 of plate labeled 1. Then transfer 150 µL of the dilutionplate from wells A07 - D12 into wells C04 - F09 of plate labeled 2. Then transfer 150 µL of the dilution plate from wells E01 - H06 intowells C04 - F09 of plate labeled 3. Finally transfer 150 µL of the dilution plate from wells E07 - H12 into wells C04 - F09 of plate labeled4.
9. Move on to step 4, Spotting on Agar.
4. Spotting on Agar using an Automated Liquid Spotting Robot
1. Remove the agarose slides stored at 4 °C O/N (from step 2.19) from their humidified sterile pipette boxes.2. If needed, trim the corners of the agarose medium with a clean razor blade to ensure that they will fit on the slide chamber.3. Remove the slide clamp off the mount. Carefully place the agar plate into the recessed area of the stage chamber mount.
NOTE: Make sure the orientation of the slide is consistent from experiment to experiment.4. Check to make sure the clamp is flush with the bottom of the chamber. If it is crooked, then the slide may not be fully seated in the recessed
area. Place the leveling spacer into the center plate position of the spotting robot. This spacer provides contact for the leveling screws so thatthe slide chamber can be leveled with the tips.
5. Place the plates on the table in order of their quadrant. Plates 1, 2, 3 and 4 ordered from left to right (Figure 2B).6. Lay out the tips so that the inner 24 wells C04 - F09 are occupied with tips into 4 empty tip boxes. A fifth box will need to have one tip in the
C10 position, as well as 4 tips with their ends cut off in the A01, A12, H01, and H12 positions. These 4 cut off tips provide stability for the tipplate clamp (Figure 2C and 2D).
7. Remove the top cover from the slide chamber mount.8. Place the first tip punch into the start site of the robot control spotting program. This should punch a hole in the agarose which will later be
used for aligning the origin coordinate. Place plate 1 on the liquid handling robot to spot the first quadrant. Make sure the lid is removed andcontinue the spotting program.
9. Check to make sure all spots are present. Also, wait ~30 s for them to dry. When the spots are about 1 mm in diameter, the program maycontinue. Empty the used tips into the biohazard container, and place fresh tips on the robot. Swap out plate 1 for the 2nd quadrant plate.
10. Repeat for the third quadrant. And repeat again for the 4th quadrant.11. When the spots are dry, replace the slide chamber cover and flip the apparatus over.12. Install the tubing connections with an air filter.
Journal of Visualized Experiments www.jove.com
Copyright © 2017 Creative Commons Attribution-NonCommercial-NoDerivs 3.0 UnportedLicense
July 2017 | 125 | e55879 | Page 4 of 11
13. Place a glass slide on the top side of the chamber.
NOTE: This slide is crucial for reducing the heat flux to the agar and minimizes the formation of condensation onto the objective cover slipside of the chamber. Do not forget this cover slip. Depending on the microscope configuration, this cover slip prevents heating from theillumination side from causing condensation on the objective side.
14. Position a fan to blow hot air onto the objective side of the chamber. This fan prevents condensation from forming on the cover slip. Set theair-flow rate through the bubbler to 10 mL/min.
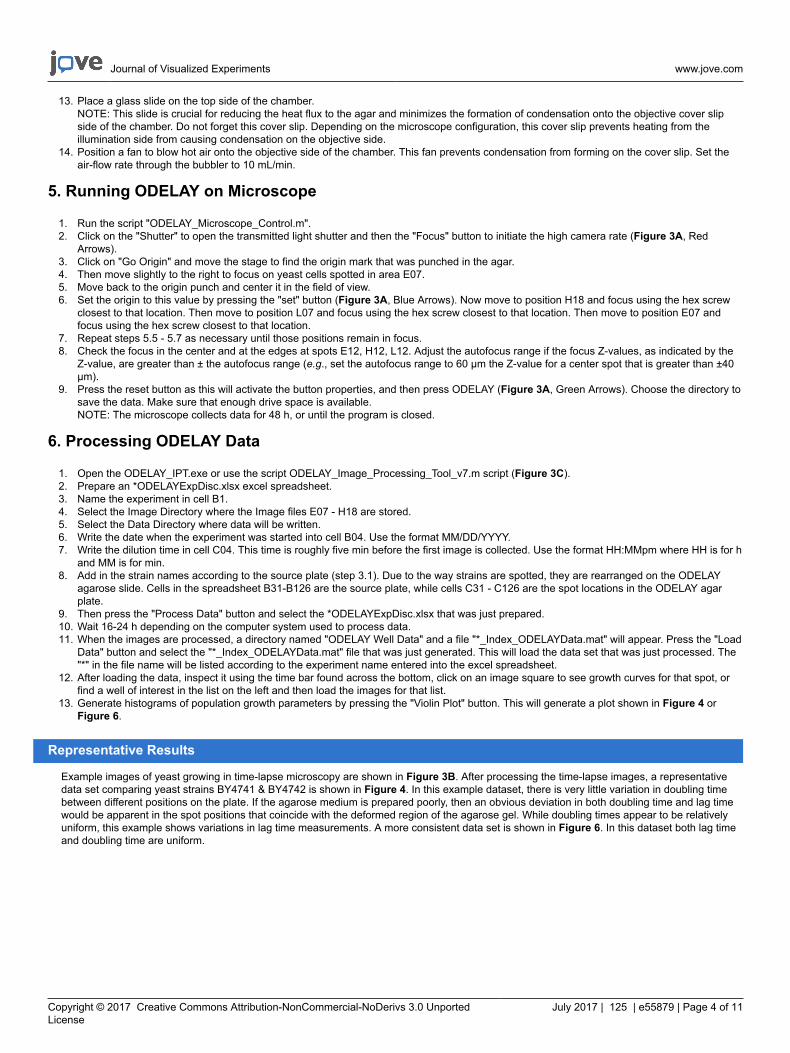
5. Running ODELAY on Microscope
1. Run the script "ODELAY_Microscope_Control.m".2. Click on the "Shutter" to open the transmitted light shutter and then the "Focus" button to initiate the high camera rate (Figure 3A, Red
Arrows).3. Click on "Go Origin" and move the stage to find the origin mark that was punched in the agar.4. Then move slightly to the right to focus on yeast cells spotted in area E07.5. Move back to the origin punch and center it in the field of view.6. Set the origin to this value by pressing the "set" button (Figure 3A, Blue Arrows). Now move to position H18 and focus using the hex screw
closest to that location. Then move to position L07 and focus using the hex screw closest to that location. Then move to position E07 andfocus using the hex screw closest to that location.
7. Repeat steps 5.5 - 5.7 as necessary until those positions remain in focus.8. Check the focus in the center and at the edges at spots E12, H12, L12. Adjust the autofocus range if the focus Z-values, as indicated by the
Z-value, are greater than ± the autofocus range (e.g., set the autofocus range to 60 µm the Z-value for a center spot that is greater than ±40µm).
9. Press the reset button as this will activate the button properties, and then press ODELAY (Figure 3A, Green Arrows). Choose the directory tosave the data. Make sure that enough drive space is available.
NOTE: The microscope collects data for 48 h, or until the program is closed.
6. Processing ODELAY Data
1. Open the ODELAY_IPT.exe or use the script ODELAY_Image_Processing_Tool_v7.m script (Figure 3C).2. Prepare an *ODELAYExpDisc.xlsx excel spreadsheet.3. Name the experiment in cell B1.4. Select the Image Directory where the Image files E07 - H18 are stored.5. Select the Data Directory where data will be written.6. Write the date when the experiment was started into cell B04. Use the format MM/DD/YYYY.7. Write the dilution time in cell C04. This time is roughly five min before the first image is collected. Use the format HH:MMpm where HH is for h
and MM is for min.8. Add in the strain names according to the source plate (step 3.1). Due to the way strains are spotted, they are rearranged on the ODELAY
agarose slide. Cells in the spreadsheet B31-B126 are the source plate, while cells C31 - C126 are the spot locations in the ODELAY agarplate.
9. Then press the "Process Data" button and select the *ODELAYExpDisc.xlsx that was just prepared.10. Wait 16-24 h depending on the computer system used to process data.11. When the images are processed, a directory named "ODELAY Well Data" and a file "*_Index_ODELAYData.mat" will appear. Press the "Load
Data" button and select the "*_Index_ODELAYData.mat" file that was just generated. This will load the data set that was just processed. The"*" in the file name will be listed according to the experiment name entered into the excel spreadsheet.
12. After loading the data, inspect it using the time bar found across the bottom, click on an image square to see growth curves for that spot, orfind a well of interest in the list on the left and then load the images for that list.
13. Generate histograms of population growth parameters by pressing the "Violin Plot" button. This will generate a plot shown in Figure 4 orFigure 6.
Representative Results
Example images of yeast growing in time-lapse microscopy are shown in Figure 3B. After processing the time-lapse images, a representativedata set comparing yeast strains BY4741 & BY4742 is shown in Figure 4. In this example dataset, there is very little variation in doubling timebetween different positions on the plate. If the agarose medium is prepared poorly, then an obvious deviation in both doubling time and lag timewould be apparent in the spot positions that coincide with the deformed region of the agarose gel. While doubling times appear to be relativelyuniform, this example shows variations in lag time measurements. A more consistent data set is shown in Figure 6. In this dataset both lag timeand doubling time are uniform.

Journal of Visualized Experiments www.jove.com
Copyright © 2017 Creative Commons Attribution-NonCommercial-NoDerivs 3.0 UnportedLicense
July 2017 | 125 | e55879 | Page 5 of 11
Figure 1: Agar Mold Assembly.
The components of the agar mold are shown in (A). Assemble the base as shown in (B) and then clamp the base with small binder clips. Placethe longer upright pieces in the cavity of the base (C) and then camp the slides to the mold as shown in (D). A side view showing the angle of themold and orientation of the mold kerf needed for consistent separation of the agar from the glass slide (E). Note the position of the thumb andforefingers, as well as the straight line of the agar separating from the slide (F) and note the horizontal arrow. The separation line should moveevenly away in the direction of the vertical arrows. Please click here to view a larger version of this figure.

Journal of Visualized Experiments www.jove.com
Copyright © 2017 Creative Commons Attribution-NonCommercial-NoDerivs 3.0 UnportedLicense
July 2017 | 125 | e55879 | Page 6 of 11
Figure 2: Sonication and Spotting Method.
Sonicate the plate in ice water and using a centrifuge bucket holder to help support the plate (A). Lay the plates from steps 3.8.1 out for thespotting onto the agarose plate (B). Also, arrange the tips so that the left most tip box has one tip at position C10 and then four other tips withtheir ends cut off so they do not crash the plate holder (C). Place the remaining tips in four boxes so that the inner 24 tips positions are occupied(D). Please click here to view a larger version of this figure.

Journal of Visualized Experiments www.jove.com
Copyright © 2017 Creative Commons Attribution-NonCommercial-NoDerivs 3.0 UnportedLicense
July 2017 | 125 | e55879 | Page 7 of 11
Figure 3: ODELAY Graphical User Interface.
A screen shot of the Graphical User Interface for "ODELAY_Microscopecontrol.m" (A). This interface allows monitoring of the camera and foradjusting the microscope illumination settings for epifluorescent and bright-field modes. Red arrows point to the Focus and Transmitted buttonsthat activate the camera to acquire images quickly and open the transmitted light shutter respectively. Blue arrows are used for moving the stagefor the origin and then setting the origin with the "Go Origin" button and "Set" button. Green arrows point to "Reset" and "ODELAY!!!" buttonsthat reset ODELAY image modes to the current conditions and initiates ODELAY image collection. Time-lapse images of yeast growing onsolid medium at 0, 3, 6, and 9 h after spotting (B). A screen shot of the Graphical User Interface for "ODELAY_IPT.m" or the ODELAY ImageProcessing Tool (C). Please click here to view a larger version of this figure.

Journal of Visualized Experiments www.jove.com
Copyright © 2017 Creative Commons Attribution-NonCommercial-NoDerivs 3.0 UnportedLicense
July 2017 | 125 | e55879 | Page 8 of 11
Figure 4: Example ODELAY Output.
This dataset compares strains BY4741 and BY4742 on YPD media. This figure is an example of a well-prepared agarose slide; however,autofocus settings are not optimal. The data presented in each column, from left to right, are: the carrying capacity in Log2 of the colony area;doubling time, given in min; and lag time, given in min. In this example, doubling times of all spots on the agar slide line up well with a smallamount of increased doubling time towards the column. However, lag times vary considerably in this dataset. Please click here to view a largerversion of this figure.

Journal of Visualized Experiments www.jove.com
Copyright © 2017 Creative Commons Attribution-NonCommercial-NoDerivs 3.0 UnportedLicense
July 2017 | 125 | e55879 | Page 9 of 11
Figure 5: Growth Curve Examples.
This example demonstrates how poor initial focus can cause the estimated lag time (tlag) to increase (A), while the adjacent position shows ashorter lag time (B). td is the doubling time in min, and tlag is the lag time in min. Please click here to view a larger version of this figure.
Figure 6: Example of Well Executed Test Experiment.
An example of the BY4742 strain tested after replacing a tungsten halogen bulb with a diode illuminator and ensuring the autofocus is setcorrectly. All doubling times appear to overlap well and the lag times appear to be consistent. Please click here to view a larger version of thisfigure.

Journal of Visualized Experiments www.jove.com
Copyright © 2017 Creative Commons Attribution-NonCommercial-NoDerivs 3.0 UnportedLicense
July 2017 | 125 | e55879 | Page 10 of 11
Discussion
The ODELAY assay has several critical points for ensuring reproducible and reliable phenotypic measurements. The first critical point isconsistent preparation of the yeast cultures. Care must be taken to harvest the yeast cells from logarithmic growth. If the cultures have saturated,then their population heterogeneity will be increased which may obfuscate heterogeneity caused by genetic or environmental (e.g., carbonsource) factors11. The second critical point is consistent preparation of the media. In general, a large volume of 10X stock media solutionshould be generated and then used over time to minimize batch effects. Formulating media by weight, whenever possible, helps improve theconsistency of the medium over time by ensuring the density of agar and the overall water content of the agarose can be closely monitored. Thethird critical point involves minimizing or eliminating any mechanical deformation of the agarose media. Mechanical deformation of the media willmost commonly occur during separation of the agarose from the glass slides. As with many laboratory techniques, practice is required to masterthis step.
Variation in lag time as depicted in Figure 4, is often related to one of the three factors: mechanical deformation of the agarose medium, variationin the molded agar thickness, or an unstable light source. If the agarose medium varies in Z-height across the spotted array, the height variationmay overwhelm the range of the autofocus routine, causing the initial images to be slightly out of focus. For this reason, check the focus heightat multiple spots in the center and along the edges of the spotted array to ensure the autofocus routine has sufficient Z-range to find focus. Ifneeded, use the Autofocus panel to increase the focus range and increase the number of focusing steps.
A third possible condition that may lead to poor focus is an unstable or flickering light source, which can disrupt the calculated focus score fora specific Z-height. Tungsten halogen bulbs tend to flicker well before the bulbs burn out. The effect of poor focus is observed in one examplewhere the growth curves dip between the first and second time points (Figure 5A), while the adjacent spot does not have the same dip (Figure5B). In this case, the poor focus condition was alleviated by replacing the tungsten halogen light source.
In practice, the authors have found that to reduce the flicker of 100W tungsten halogen bulbs, the bulbs need to be replaced every 500 h orroughly every 2 months when the microscopes are under heavy use. To avoid poor focus issues from a flickering bulb, replace the tungstenhalogen light source often or replace the halogen bulb with a diode light source. An example of a dataset that shows low variation in doublingtimes as well as more uniform lag times is shown in Figure 6. This dataset was taken with a diode illuminator which provides a more stableillumination over time while performing the autofocus.
While many of the points mentioned here for optimizing media preparation may appear to be obvious, in the literature most large scale screensdo not replicate well with each other8,11. Therefore, we have carefully described the preparation of cultures and agarose media so that morereproducible phenotypic screens may be generated.
The ODELAY assay is currently limited in throughput when compared to pinning based assays such as synthetic genetic arrays or the Scan-O-Matic assay. While these methods increase the number of strains that are measured, they lack an ability to resolve individual cells and thuscannot measure population heterogeneity that we observe within clonal yeast strains. The origin of this population heterogeneity is not currentlyunderstood, but the merging of technology and computation as demonstrated here offers an opportunity for objectively addressing the underlyingcellular mechanisms12.
The authors wish to note that ODELAY is currently only optimized for a specific microscope brand and body type. Modifying ODELAY for othermicroscope systems is straight forward but will require knowledge of the open source API13. However, both the API as well as the ODELAYscripts are written to be easily adapted to different systems and experimental assays.
While ODELAY was originally developed for yeast, we have been able to utilize it without modification to observe growth of Mycobacteriumsmegmatis. Observation of the other colony forming microorganisms is possible with alterations to the source code provided11. In general,ODELAY is a powerful and flexible tool for comparing microorganisms grown under different environmental conditions and genetic perturbations.
Disclosures
The authors have nothing to disclose.
Acknowledgements
The authors acknowledge support for this work by grants U54 RR022220 and P50 GM076547 to J.D.A from the U.S. National Institutes ofHealth. F.D.M. is a postdoctoral fellow with the Canadian Institutes for Health Research. We also thank the Luxembourg Centre for SystemsBiomedicine and the University of Luxembourg for support.
References
1. Zwietering, M. H., Jongenburger, I., Rombouts, F. M., van't Riet, K. Modeling of the bacterial growth curve. Appl Environ Microbiol. 56 (6),1875-1881 (1990).
2. Sellick, C. A., Campbell, R. N., Reece, R. J. Galactose metabolism in yeast-structure and regulation of the leloir pathway enzymes and thegenes encoding them. Int Rev Cell Mol Biol. 269, 111-150 (2008).
3. Yoshikawa, K., et al. Comprehensive phenotypic analysis for identification of genes affecting growth under ethanol stress in Saccharomycescerevisiae. FEMS Yeast Res. 9 (1), 32-44 (2009).

Journal of Visualized Experiments www.jove.com
Copyright © 2017 Creative Commons Attribution-NonCommercial-NoDerivs 3.0 UnportedLicense
July 2017 | 125 | e55879 | Page 11 of 11
4. Bryan, A. K., Goranov, A., Amon, A., Manalis, S. R. Measurement of mass, density, and volume during the cell cycle of yeast. Proc Natl AcadSci U S A. 107 (3), 999-1004 (2010).
5. Baryshnikova, A., et al. Quantitative analysis of fitness and genetic interactions in yeast on a genome scale. Nat Methods. 7 (12), 1017-1024(2010).
6. Costanzo, M., et al. The genetic landscape of a cell. Science. 327 (5964), 425-431 (2010).7. Collins, S. R., et al. Functional dissection of protein complexes involved in yeast chromosome biology using a genetic interaction map.
Nature. 446 (7137), 806-810 (2007).8. Zackrisson, M., et al. Scan-o-matic: High-Resolution Microbial Phenomics at a Massive Scale. G3 (Bethesda). 6 (9), 3003-3014 (2016).9. Bean, G. J., Jaeger, P. A., Bahr, S., Ideker, T. Development of ultra-high-density screening tools for microbial 'omics'. PloS One. 9 (1), e85177
(2014).10. Levy, S. F., Ziv, N., Siegal, M. L. Bet hedging in yeast by heterogeneous, age-correlated expression of a stress protectant. PLoS Biol. 10 (5),
e1001325 (2012).11. Herricks, T., et al. One-Cell Doubling Evaluation by Living Arrays of Yeast, ODELAY! G3 (Bethesda). 7 (1), 279-288 (2017).12. Mast, F. D., Ratushny, A. V., Aitchison, J. D. Systems cell biology. J Cell Biol. 206 (6), 695-706 (2014).13. Edelstein, A. D., et al. Advanced methods of microscope control using µManager software. J Biol Methods. 1 (2), e10 (2014).