Embed Size (px)
Citation preview
OECD Economic Surveys IrelandSeptember 2015
OVERVIEW
OECD Economic Surveys: Ireland
© OECD 2015
Executive summary
● Main findings
● Key recommendations
9

EXECUTIVE SUMMARY
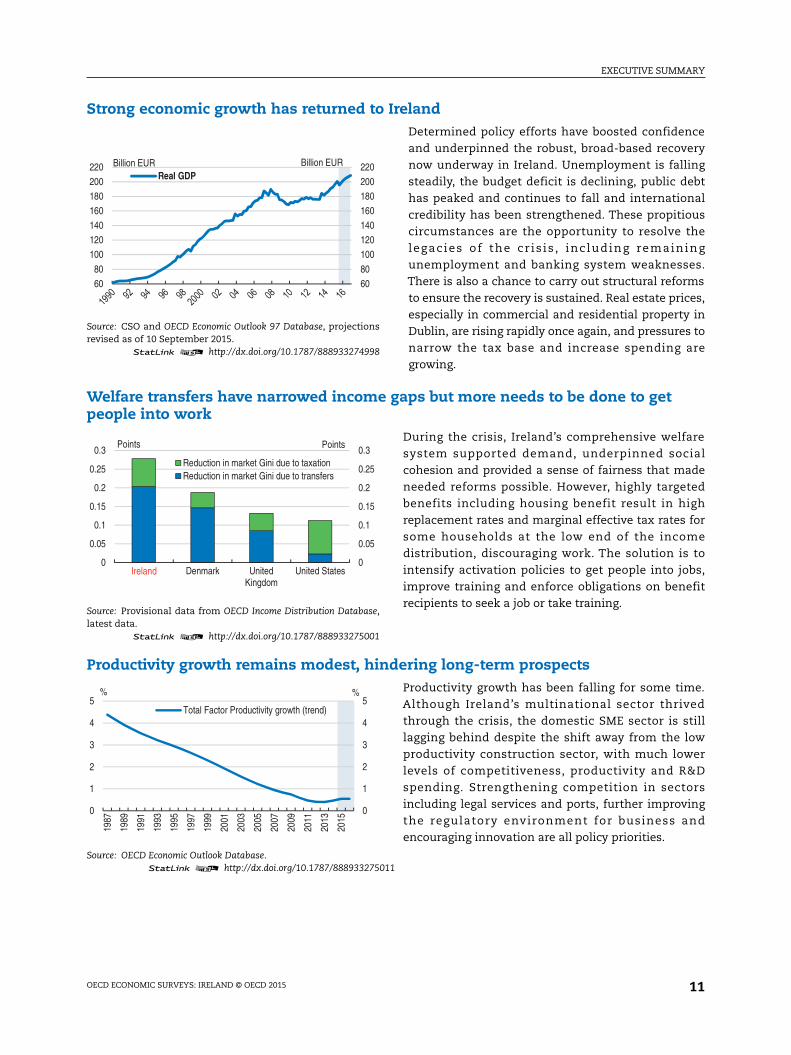
Strong economic growth has returned to IrelandDetermined policy efforts have boosted confidenceand underpinned the robust, broad-based recoverynow underway in Ireland. Unemployment is fallingsteadily, the budget deficit is declining, public debthas peaked and continues to fall and internationalcredibility has been strengthened. These propitiouscircumstances are the opportunity to resolve thelegacies of the cr is is , inc luding remainingunemployment and banking system weaknesses.There is also a chance to carry out structural reformsto ensure the recovery is sustained. Real estate prices,especially in commercial and residential property inDublin, are rising rapidly once again, and pressures tonarrow the tax base and increase spending aregrowing.
Welfare transfers have narrowed income gaps but more needs to be done to getpeople into work
During the crisis, Ireland’s comprehensive welfaresystem supported demand, underpinned socialcohesion and provided a sense of fairness that madeneeded reforms possible. However, highly targetedbenefits including housing benefit result in highreplacement rates and marginal effective tax rates forsome households at the low end of the incomedistribution, discouraging work. The solution is tointensify activation policies to get people into jobs,improve training and enforce obligations on benefitrecipients to seek a job or take training.
Productivity growth remains modest, hindering long-term prospectsProductivity growth has been falling for some time.Although Ireland’s multinational sector thrivedthrough the crisis, the domestic SME sector is stilllagging behind despite the shift away from the lowproductivity construction sector, with much lowerlevels of competitiveness, productivity and R&Dspending. Strengthening competition in sectorsincluding legal services and ports, further improvingthe regulatory environment for business andencouraging innovation are all policy priorities.
Source: CSO and OECD Economic Outlook 97 Database, projectionsrevised as of 10 September 2015.
1 2 http://dx.doi.org/10.1787/888933274998
6080
100120140160180200220
6080
100120140160180200220
Real GDPBillion EUR Billion EUR
Source: Provisional data from OECD Income Distribution Database,latest data.
1 2 http://dx.doi.org/10.1787/888933275001
0
0.05
0.1
0.15
0.2
0.25
0.3
0
0.05
0.1
0.15
0.2
0.25
0.3
Ireland Denmark UnitedKingdom
United States
Points
Reduction in market Gini due to taxationReduction in market Gini due to transfers
Ireland
Points
Source: OECD Economic Outlook Database.1 2 http://dx.doi.org/10.1787/888933275011
0
1
2
3
4
5
0
1
2
3
4
5
1987
1989
1991
1993
1995
1997
1999
2001
2003
2005
2007
2009
2011
2013
2015
Total Factor Productivity growth (trend)
% %
OECD ECONOMIC SURVEYS: IRELAND © OECD 2015 11
EXECUTIVE SUMMARY
thanllow
h.
fullyealthrs ofals.
thecingningg its
the
on of
singome
agile,tem.
ationand
ools,and
h thebl ic
andmorenefittract
care,
MAIN FINDINGS KEY RECOMMENDATIONS
Fiscal sustainability
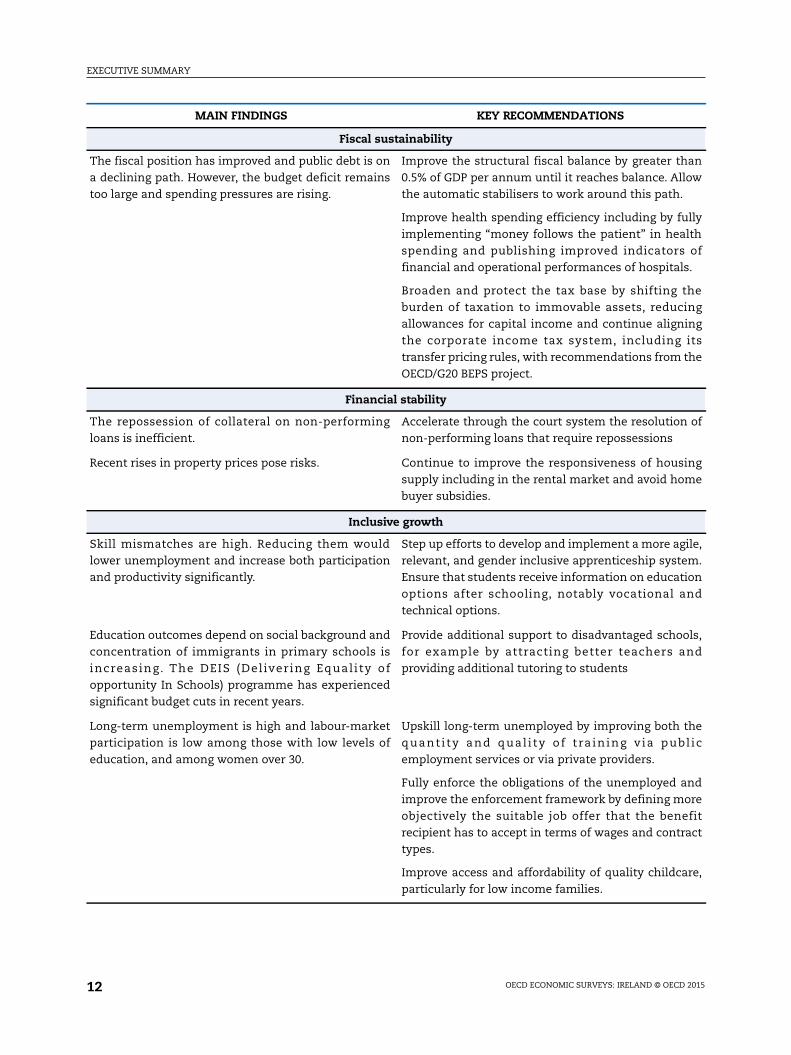
The fiscal position has improved and public debt is ona declining path. However, the budget deficit remainstoo large and spending pressures are rising.
Improve the structural fiscal balance by greater0.5% of GDP per annum until it reaches balance. Athe automatic stabilisers to work around this pat
Improve health spending efficiency including byimplementing “money follows the patient” in hspending and publishing improved indicatofinancial and operational performances of hospit
Broaden and protect the tax base by shiftingburden of taxation to immovable assets, reduallowances for capital income and continue aligthe corporate income tax system, includintransfer pricing rules, with recommendations fromOECD/G20 BEPS project.
Financial stability
The repossession of collateral on non-performingloans is inefficient.
Accelerate through the court system the resolutinon-performing loans that require repossessions
Recent rises in property prices pose risks. Continue to improve the responsiveness of housupply including in the rental market and avoid hbuyer subsidies.
Inclusive growth
Skill mismatches are high. Reducing them wouldlower unemployment and increase both participationand productivity significantly.
Step up efforts to develop and implement a morerelevant, and gender inclusive apprenticeship sysEnsure that students receive information on educoptions after schooling, notably vocationaltechnical options.
Education outcomes depend on social background andconcentration of immigrants in primary schools isincreasing. The DEIS (Del ivering Equal ity ofopportunity In Schools) programme has experiencedsignificant budget cuts in recent years.
Provide additional support to disadvantaged schfor example by attracting better teachersproviding additional tutoring to students
Long-term unemployment is high and labour-marketparticipation is low among those with low levels ofeducation, and among women over 30.
Upskill long-term unemployed by improving botquant i ty and qual i ty of tra ining via puemployment services or via private providers.
Fully enforce the obligations of the unemployedimprove the enforcement framework by definingobjectively the suitable job offer that the berecipient has to accept in terms of wages and contypes.
Improve access and affordability of quality childparticularly for low income families.
OECD ECONOMIC SURVEYS: IRELAND © OECD 201512
EXECUTIVE SUMMARY
duceome
ts.
nnelost-ting
ighlykills
tivityionalvity-
and
cy of
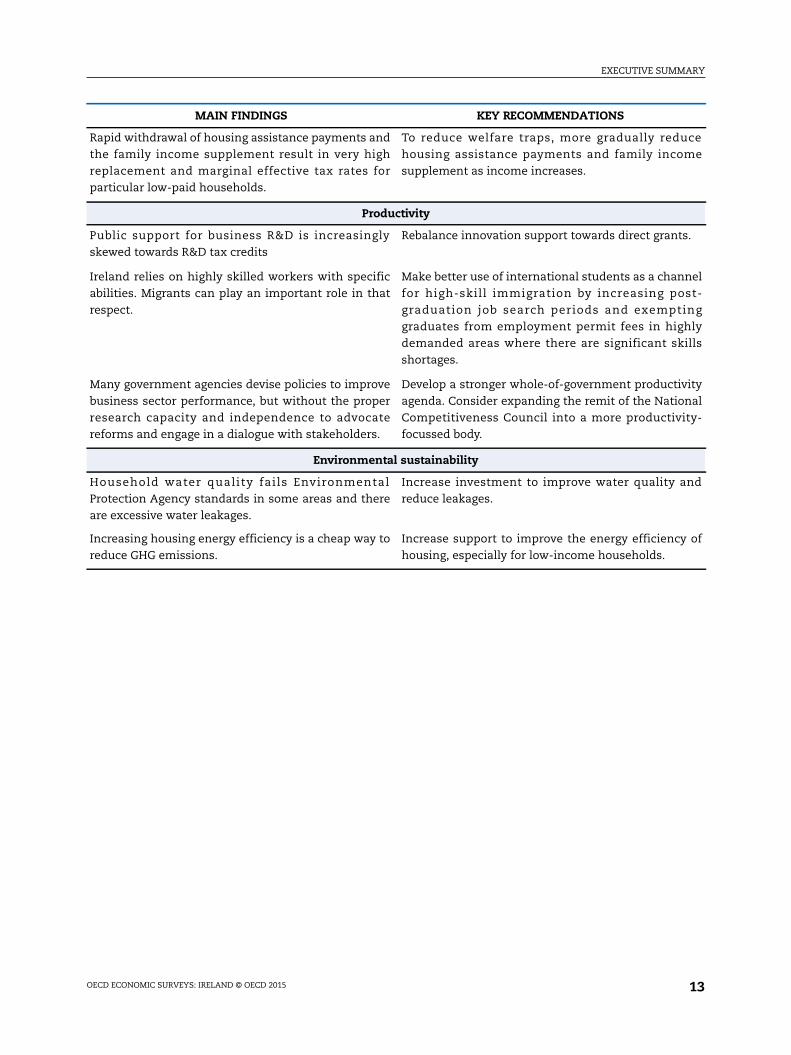
Rapid withdrawal of housing assistance payments andthe family income supplement result in very highreplacement and marginal effective tax rates forparticular low-paid households.
To reduce welfare traps, more gradually rehousing assistance payments and family incsupplement as income increases.
Productivity
Public support for business R&D is increasinglyskewed towards R&D tax credits
Rebalance innovation support towards direct gran
Ireland relies on highly skilled workers with specificabilities. Migrants can play an important role in thatrespect.
Make better use of international students as a chafor high-skill immigration by increasing pgraduation job search periods and exempgraduates from employment permit fees in hdemanded areas where there are significant sshortages.
Many government agencies devise policies to improvebusiness sector performance, but without the properresearch capacity and independence to advocatereforms and engage in a dialogue with stakeholders.
Develop a stronger whole-of-government producagenda. Consider expanding the remit of the NatCompetitiveness Council into a more productifocussed body.
Environmental sustainability
Household water quality fails EnvironmentalProtection Agency standards in some areas and thereare excessive water leakages.
Increasing housing energy efficiency is a cheap way toreduce GHG emissions.
Increase investment to improve water qualityreduce leakages.
Increase support to improve the energy efficienhousing, especially for low-income households.
MAIN FINDINGS KEY RECOMMENDATIONS
OECD ECONOMIC SURVEYS: IRELAND © OECD 2015 13

OECD Economic Surveys: Ireland 2015
© OECD 2015
Assessment and recommendations
● Macroeconomic performance and risks
● Further strengthening the fiscal position
● Ensuring financial stability
● Making growth more inclusive
● Fostering productivity
● Improving environmental sustainability
15
ASSESSMENT AND RECOMMENDATIONS
275027
70
75
80
85
90
95
100
105
110
115
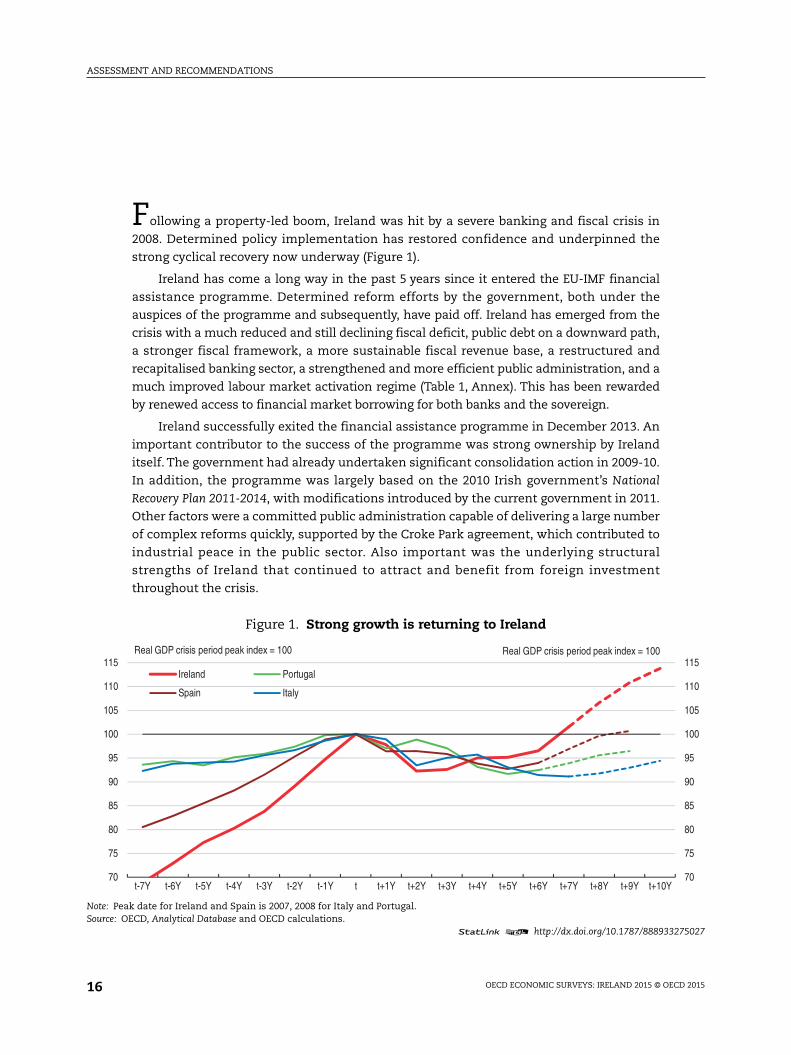
Following a property-led boom, Ireland was hit by a severe banking and fiscal crisis in
2008. Determined policy implementation has restored confidence and underpinned the
strong cyclical recovery now underway (Figure 1).
Ireland has come a long way in the past 5 years since it entered the EU-IMF financial
assistance programme. Determined reform efforts by the government, both under the
auspices of the programme and subsequently, have paid off. Ireland has emerged from the
crisis with a much reduced and still declining fiscal deficit, public debt on a downward path,
a stronger fiscal framework, a more sustainable fiscal revenue base, a restructured and
recapitalised banking sector, a strengthened and more efficient public administration, and a
much improved labour market activation regime (Table 1, Annex). This has been rewarded
by renewed access to financial market borrowing for both banks and the sovereign.
Ireland successfully exited the financial assistance programme in December 2013. An
important contributor to the success of the programme was strong ownership by Ireland
itself. The government had already undertaken significant consolidation action in 2009-10.
In addition, the programme was largely based on the 2010 Irish government’s National
Recovery Plan 2011-2014, with modifications introduced by the current government in 2011.
Other factors were a committed public administration capable of delivering a large number
of complex reforms quickly, supported by the Croke Park agreement, which contributed to
industrial peace in the public sector. Also important was the underlying structural
strengths of Ireland that continued to attract and benefit from foreign investment
throughout the crisis.
Figure 1. Strong growth is returning to Ireland
Note: Peak date for Ireland and Spain is 2007, 2008 for Italy and Portugal.Source: OECD, Analytical Database and OECD calculations.
1 2 http://dx.doi.org/10.1787/888933
70
75
80
85
90
95
100
105
110
115
t-7Y t-6Y t-5Y t-4Y t-3Y t-2Y t-1Y t t+1Y t+2Y t+3Y t+4Y t+5Y t+6Y t+7Y t+8Y t+9Y t+10Y
Ireland Portugal
Spain Italy
Real GDP crisis period peak index = 100 Real GDP crisis period peak index = 100
OECD ECONOMIC SURVEYS: IRELAND 2015 © OECD 201516
ASSESSMENT AND RECOMMENDATIONS
d water
ining.
Key structural reforms have also been rolled out. The government’s Action Plan for Jobs
provides momentum for designing and implementing a coherent set of labour-market
reforms and should continue. Ireland has also strengthened its institutional framework,
with a new independent fiscal council, fiscal rules, reformed public employment service
and activation policies, a vocational training authority, a stronger competition authority, a
new agency to facilitate knowledge transfer, and increased transparency and openness in
government. These welcome reforms will have long-lasting pay-offs but Ireland should be
careful to avoid complacency.
Ireland now faces three main challenges:
● enhancing its economic resilience by moving towards a balanced budget in structural
terms to reduce the high public debt, and by strengthening the banking system;
● making growth more inclusive by increasing labour market participation while further
reducing unemployment, particularly long-term unemployment; and
● improving long-term growth prospects by making the Irish-owned business sector more
dynamic, productive and innovative, while maintaining attractiveness to foreign
investment.
Macroeconomic performance and risksThe Irish economy is strongly rebounding from the crisis, with GDP growth of 5.2% in
2014, the fastest in the OECD. In part, this reflected temporary factors such as the fading of
the patent cliff (the expiry of a number of drug patents), which weighed on exports in 2013.
The initial stages of the recovery was largely driven by multi-national companies (MNCs)
that account for a large share of production in sectors that are less sensitive to cyclical
fluctuations, such as pharmaceuticals and medical devices.
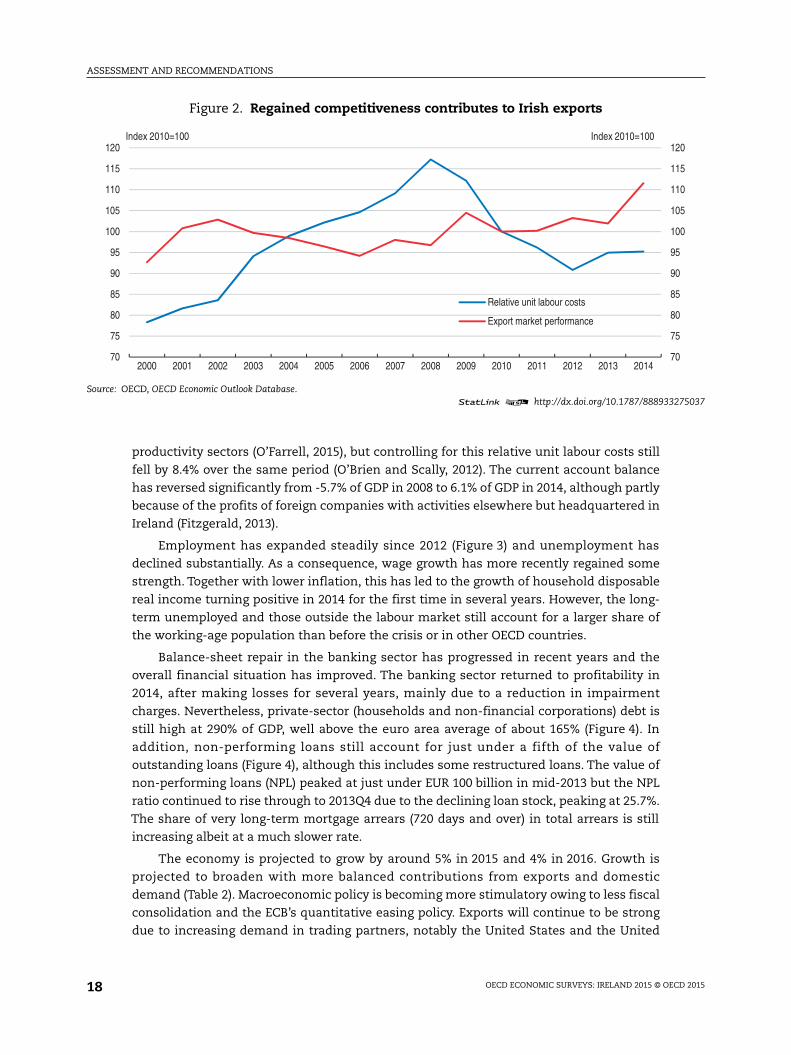
Consistent with the performance of the MNCs, export growth has been strong, as
Ireland has gained market share thanks partly to improved cost-competitiveness since
2009 (Figure 2). Labour costs adjusted swiftly after the onset of the crisis. Relative unit
labour costs (labour costs adjusted for productivity and compared with Ireland’s trading
partners) declined by around 15% by end-2010. Part of this reflected a shift to higher
Table 1. Progress on structural reforms
Reform Main Legislation Enacted New or empowered regulator Remaining steps to be taken
Fiscal December 2012 Yes …
Financial and banking October 2010 and August 2013 Yes …
Personal insolvency December 2013 Yes …
Competition July 2014 Yes …
Legal profession No Intended …
Corporate governance December 2014 No
Water March 2013 Yes Complete the roll-out of householmeters
Labour market activation No legislation. Pathways to WorkReforms start February 2012
Yes Full roll-out of contracting out ofjob-search services
Further education and training October 2013 Yes Design and implement newapprenticeships and vocational tra
Government accountability and transparency July 2013, July and October 2014 Yes
Health (pharmaceuticals pricing) May 2013 Yes
Source: OECD and Irish Statute Book.
OECD ECONOMIC SURVEYS: IRELAND 2015 © OECD 2015 17
ASSESSMENT AND RECOMMENDATIONS
275037
0
5
0
5
0
5
00
05
10
15
20
productivity sectors (O’Farrell, 2015), but controlling for this relative unit labour costs still
fell by 8.4% over the same period (O’Brien and Scally, 2012). The current account balance
has reversed significantly from -5.7% of GDP in 2008 to 6.1% of GDP in 2014, although partly
because of the profits of foreign companies with activities elsewhere but headquartered in
Ireland (Fitzgerald, 2013).
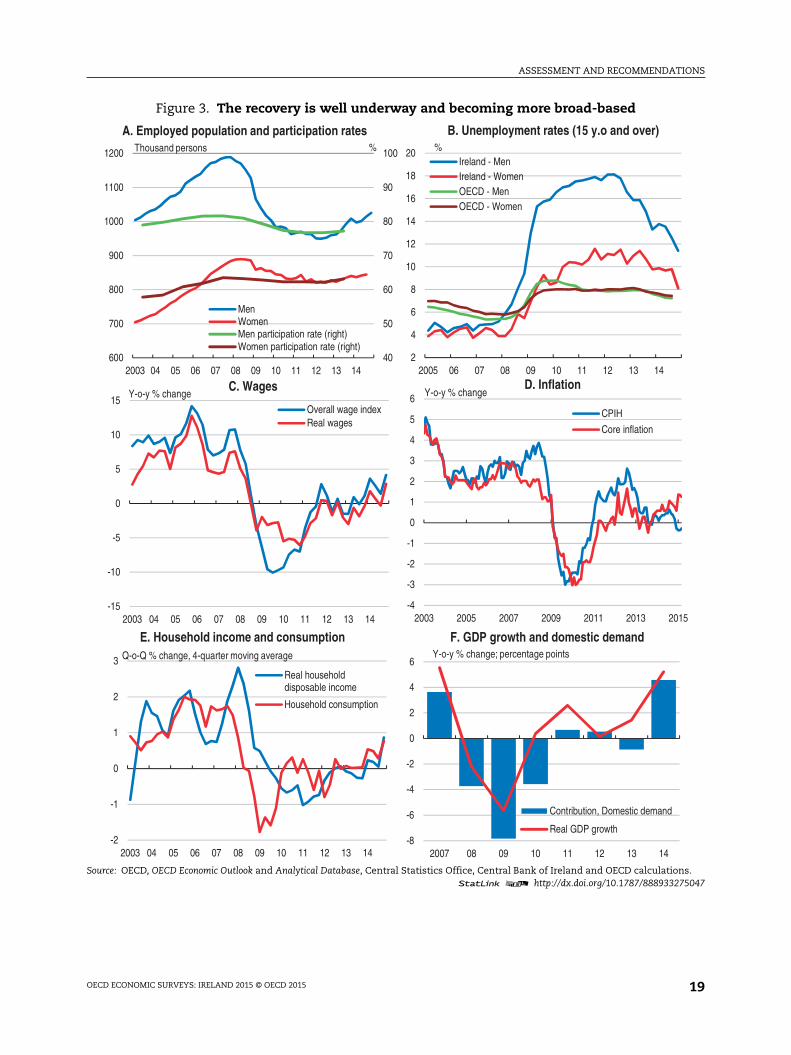
Employment has expanded steadily since 2012 (Figure 3) and unemployment has
declined substantially. As a consequence, wage growth has more recently regained some
strength. Together with lower inflation, this has led to the growth of household disposable
real income turning positive in 2014 for the first time in several years. However, the long-
term unemployed and those outside the labour market still account for a larger share of
the working-age population than before the crisis or in other OECD countries.
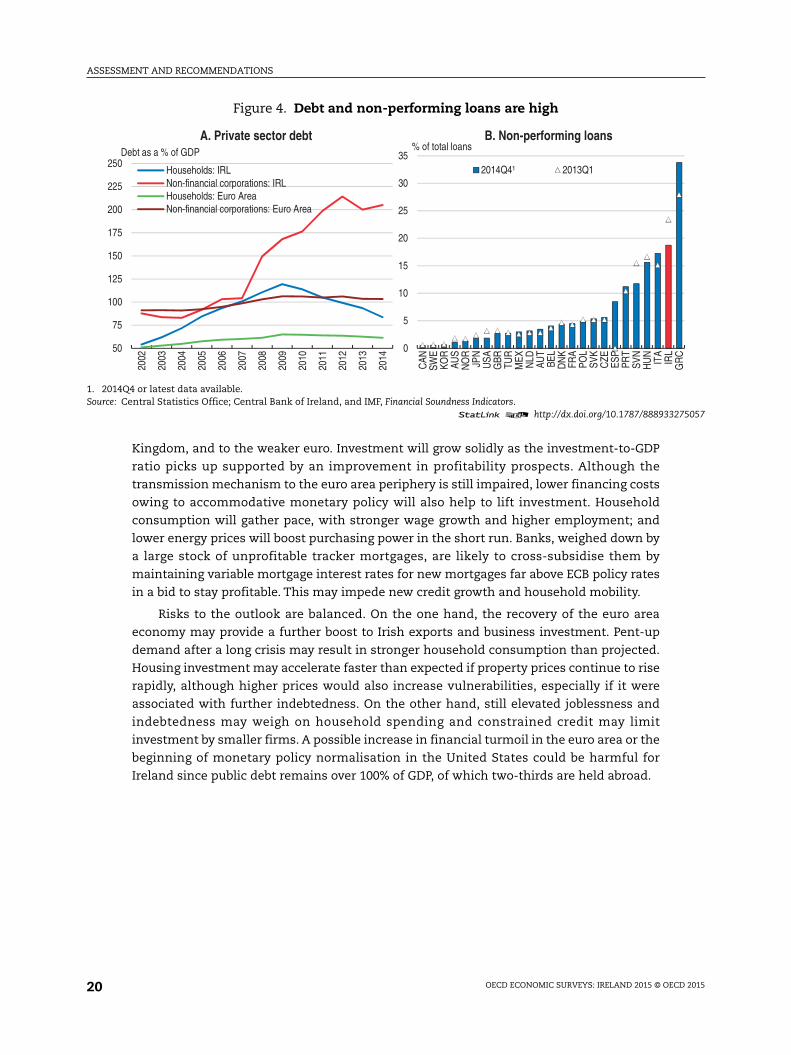
Balance-sheet repair in the banking sector has progressed in recent years and the
overall financial situation has improved. The banking sector returned to profitability in
2014, after making losses for several years, mainly due to a reduction in impairment
charges. Nevertheless, private-sector (households and non-financial corporations) debt is
still high at 290% of GDP, well above the euro area average of about 165% (Figure 4). In
addition, non-performing loans still account for just under a fifth of the value of
outstanding loans (Figure 4), although this includes some restructured loans. The value of
non-performing loans (NPL) peaked at just under EUR 100 billion in mid-2013 but the NPL
ratio continued to rise through to 2013Q4 due to the declining loan stock, peaking at 25.7%.
The share of very long-term mortgage arrears (720 days and over) in total arrears is still
increasing albeit at a much slower rate.
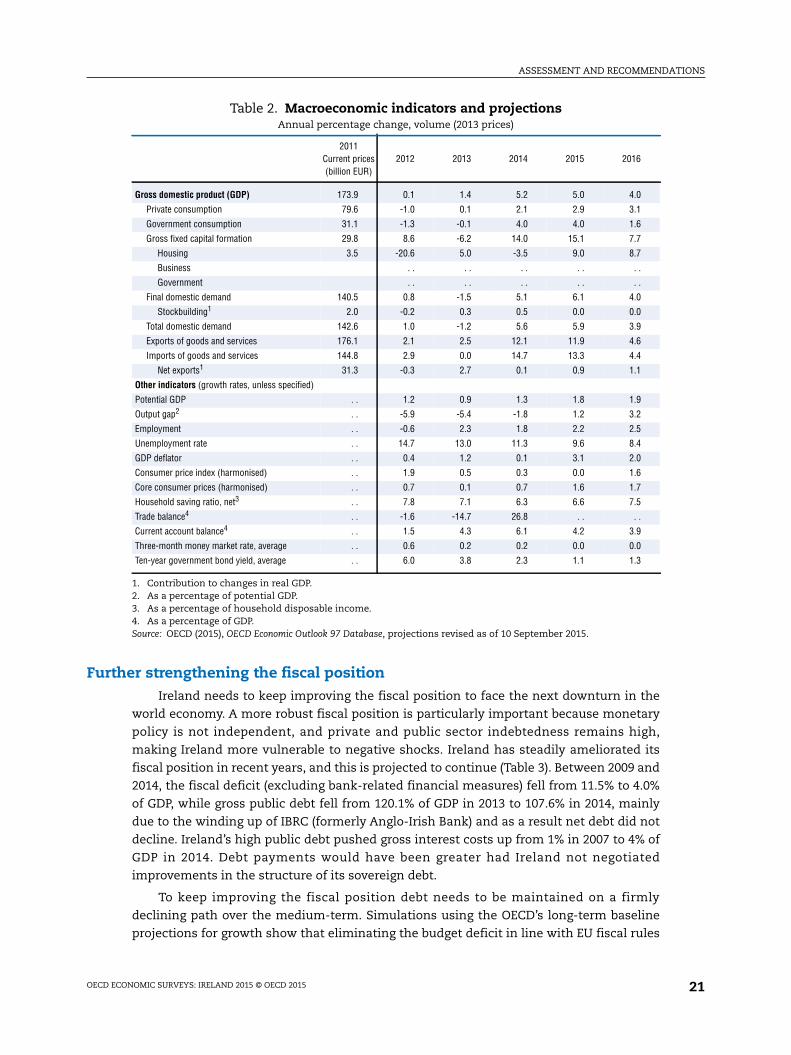
The economy is projected to grow by around 5% in 2015 and 4% in 2016. Growth is
projected to broaden with more balanced contributions from exports and domestic
demand (Table 2). Macroeconomic policy is becoming more stimulatory owing to less fiscal
consolidation and the ECB’s quantitative easing policy. Exports will continue to be strong
due to increasing demand in trading partners, notably the United States and the United
Figure 2. Regained competitiveness contributes to Irish exports
Source: OECD, OECD Economic Outlook Database.1 2 http://dx.doi.org/10.1787/888933
7
7
8
8
9
9
1
1
1
1
1
70
75
80
85
90
95
100
105
110
115
120
2000 2001 2002 2003 2004 2005 2006 2007 2008 2009 2010 2011 2012 2013 2014
Relative unit labour costs
Export market performance
Index 2010=100 Index 2010=100
OECD ECONOMIC SURVEYS: IRELAND 2015 © OECD 201518
ASSESSMENT AND RECOMMENDATIONS
ons.275047
015
Figure 3. The recovery is well underway and becoming more broad-based
Source: OECD, OECD Economic Outlook and Analytical Database, Central Statistics Office, Central Bank of Ireland and OECD calculati1 2 http://dx.doi.org/10.1787/888933
40
50
60
70
80
90
100
600
700
800
900
1000
1100
1200
2003 04 05 06 07 08 09 10 11 12 13 14
MenWomenMen participation rate (right)Women participation rate (right)
%Thousand persons
A. Employed population and participation rates
-15
-10
-5
0
5
10
15
2003 04 05 06 07 08 09 10 11 12 13 14
Overall wage indexReal wages
Y-o-y % change
-4
-3
-2
-1
0
1
2
3
4
5
6
2003 2005 2007 2009 2011 2013 2
CPIH
Core inflation
Y-o-y % changeD. Inflation
2
4
6
8
10
12
14
16
18
20
2005 06 07 08 09 10 11 12 13 14
Ireland - MenIreland - WomenOECD - MenOECD - Women
%
C. Wages
B. Unemployment rates (15 y.o and over)
-2
-1
0
1
2
3
2003 04 05 06 07 08 09 10 11 12 13 14
E. Household income and consumption
Real householddisposable income
Household consumption
Q-o-Q % change, 4-quarter moving average
-8
-6
-4
-2
0
2
4
6
2007 08 09 10 11 12 13 14
F. GDP growth and domestic demand
Contribution, Domestic demand
Real GDP growth
Y-o-y % change; percentage points
OECD ECONOMIC SURVEYS: IRELAND 2015 © OECD 2015 19
ASSESSMENT AND RECOMMENDATIONS
275057
IRL
GR
C
Kingdom, and to the weaker euro. Investment will grow solidly as the investment-to-GDP
ratio picks up supported by an improvement in profitability prospects. Although the
transmission mechanism to the euro area periphery is still impaired, lower financing costs
owing to accommodative monetary policy will also help to lift investment. Household
consumption will gather pace, with stronger wage growth and higher employment; and
lower energy prices will boost purchasing power in the short run. Banks, weighed down by
a large stock of unprofitable tracker mortgages, are likely to cross-subsidise them by
maintaining variable mortgage interest rates for new mortgages far above ECB policy rates
in a bid to stay profitable. This may impede new credit growth and household mobility.
Risks to the outlook are balanced. On the one hand, the recovery of the euro area
economy may provide a further boost to Irish exports and business investment. Pent-up
demand after a long crisis may result in stronger household consumption than projected.
Housing investment may accelerate faster than expected if property prices continue to rise
rapidly, although higher prices would also increase vulnerabilities, especially if it were
associated with further indebtedness. On the other hand, still elevated joblessness and
indebtedness may weigh on household spending and constrained credit may limit
investment by smaller firms. A possible increase in financial turmoil in the euro area or the
beginning of monetary policy normalisation in the United States could be harmful for
Ireland since public debt remains over 100% of GDP, of which two-thirds are held abroad.
Figure 4. Debt and non-performing loans are high
1. 2014Q4 or latest data available.Source: Central Statistics Office; Central Bank of Ireland, and IMF, Financial Soundness Indicators.
1 2 http://dx.doi.org/10.1787/888933
50
75
100
125
150
175
200
225
250
2002
2003
2004
2005
2006
2007
2008
2009
2010
2011
2012
2013
2014
Households: IRLNon-financial corporations: IRLHouseholds: Euro AreaNon-financial corporations: Euro Area
Debt as a % of GDP
A. Private sector debt
0
5
10
15
20
25
30
35
CAN
SWE
KOR
AUS
NO
RJP
NU
SAG
BR TUR
MEX NLD
AUT
BEL
DN
KFR
APO
LSV
KC
ZEES
PPR
TSV
NH
UN
ITA
2014Q4¹ 2013Q1
% of total loansB. Non-performing loans
OECD ECONOMIC SURVEYS: IRELAND 2015 © OECD 201520
ASSESSMENT AND RECOMMENDATIONS
Further strengthening the fiscal positionIreland needs to keep improving the fiscal position to face the next downturn in the
world economy. A more robust fiscal position is particularly important because monetary
policy is not independent, and private and public sector indebtedness remains high,
making Ireland more vulnerable to negative shocks. Ireland has steadily ameliorated its
fiscal position in recent years, and this is projected to continue (Table 3). Between 2009 and
2014, the fiscal deficit (excluding bank-related financial measures) fell from 11.5% to 4.0%
of GDP, while gross public debt fell from 120.1% of GDP in 2013 to 107.6% in 2014, mainly
due to the winding up of IBRC (formerly Anglo-Irish Bank) and as a result net debt did not
decline. Ireland’s high public debt pushed gross interest costs up from 1% in 2007 to 4% of
GDP in 2014. Debt payments would have been greater had Ireland not negotiated
improvements in the structure of its sovereign debt.
To keep improving the fiscal position debt needs to be maintained on a firmly
declining path over the medium-term. Simulations using the OECD’s long-term baseline
projections for growth show that eliminating the budget deficit in line with EU fiscal rules
Table 2. Macroeconomic indicators and projectionsAnnual percentage change, volume (2013 prices)
2011Current prices(billion EUR)
2012 2013 2014 2015 2016
Gross domestic product (GDP) 173.9 0.1 1.4 5.2 5.0 4.0
Private consumption 79.6 -1.0 0.1 2.1 2.9 3.1
Government consumption 31.1 -1.3 -0.1 4.0 4.0 1.6
Gross fixed capital formation 29.8 8.6 -6.2 14.0 15.1 7.7
Housing 3.5 -20.6 5.0 -3.5 9.0 8.7
Business . . . . . . . . . .
Government . . . . . . . . . .
Final domestic demand 140.5 0.8 -1.5 5.1 6.1 4.0
Stockbuilding1 2.0 -0.2 0.3 0.5 0.0 0.0
Total domestic demand 142.6 1.0 -1.2 5.6 5.9 3.9
Exports of goods and services 176.1 2.1 2.5 12.1 11.9 4.6
Imports of goods and services 144.8 2.9 0.0 14.7 13.3 4.4
Net exports1 31.3 -0.3 2.7 0.1 0.9 1.1
Other indicators (growth rates, unless specified)
Potential GDP . . 1.2 0.9 1.3 1.8 1.9
Output gap2 . . -5.9 -5.4 -1.8 1.2 3.2
Employment . . -0.6 2.3 1.8 2.2 2.5
Unemployment rate . . 14.7 13.0 11.3 9.6 8.4
GDP deflator . . 0.4 1.2 0.1 3.1 2.0
Consumer price index (harmonised) . . 1.9 0.5 0.3 0.0 1.6
Core consumer prices (harmonised) . . 0.7 0.1 0.7 1.6 1.7
Household saving ratio, net3 . . 7.8 7.1 6.3 6.6 7.5
Trade balance4 . . -1.6 -14.7 26.8 . . . .
Current account balance4 . . 1.5 4.3 6.1 4.2 3.9
Three-month money market rate, average . . 0.6 0.2 0.2 0.0 0.0
Ten-year government bond yield, average . . 6.0 3.8 2.3 1.1 1.3
1. Contribution to changes in real GDP.2. As a percentage of potential GDP.3. As a percentage of household disposable income.4. As a percentage of GDP.Source: OECD (2015), OECD Economic Outlook 97 Database, projections revised as of 10 September 2015.
OECD ECONOMIC SURVEYS: IRELAND 2015 © OECD 2015 21
ASSESSMENT AND RECOMMENDATIONS
enario,the noof GDPdeficit
275066
0
20
40
60
80
100
120
140
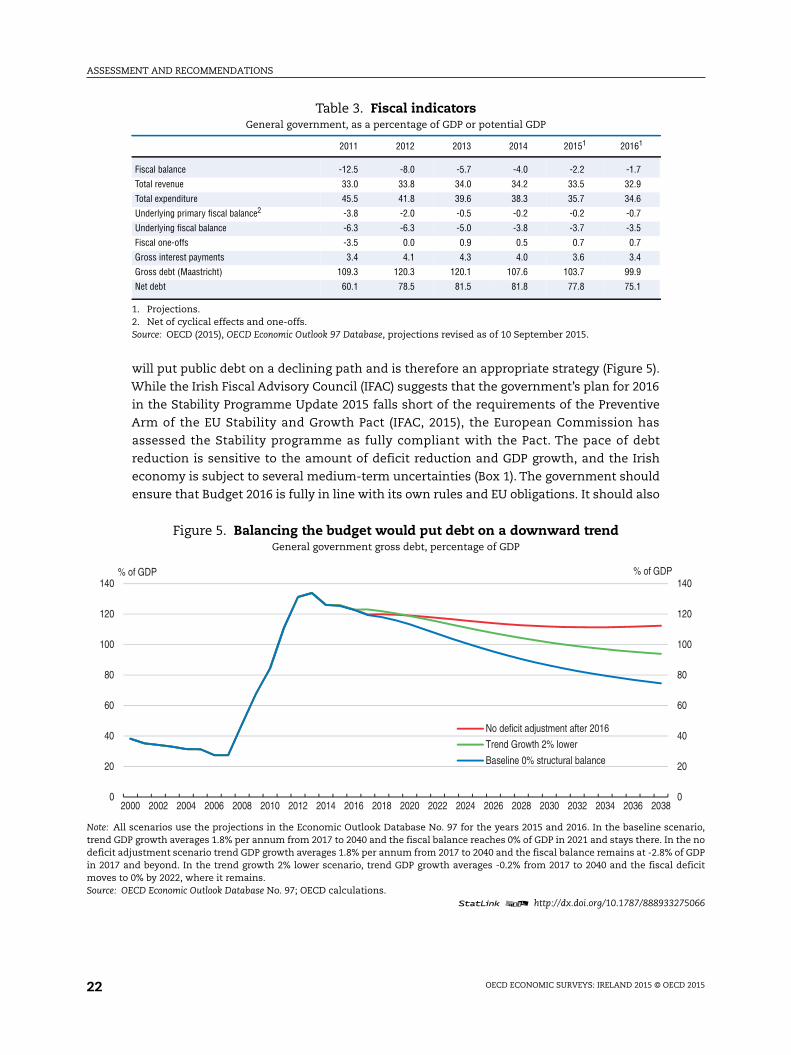
will put public debt on a declining path and is therefore an appropriate strategy (Figure 5).
While the Irish Fiscal Advisory Council (IFAC) suggests that the government’s plan for 2016
in the Stability Programme Update 2015 falls short of the requirements of the Preventive
Arm of the EU Stability and Growth Pact (IFAC, 2015), the European Commission has
assessed the Stability programme as fully compliant with the Pact. The pace of debt
reduction is sensitive to the amount of deficit reduction and GDP growth, and the Irish
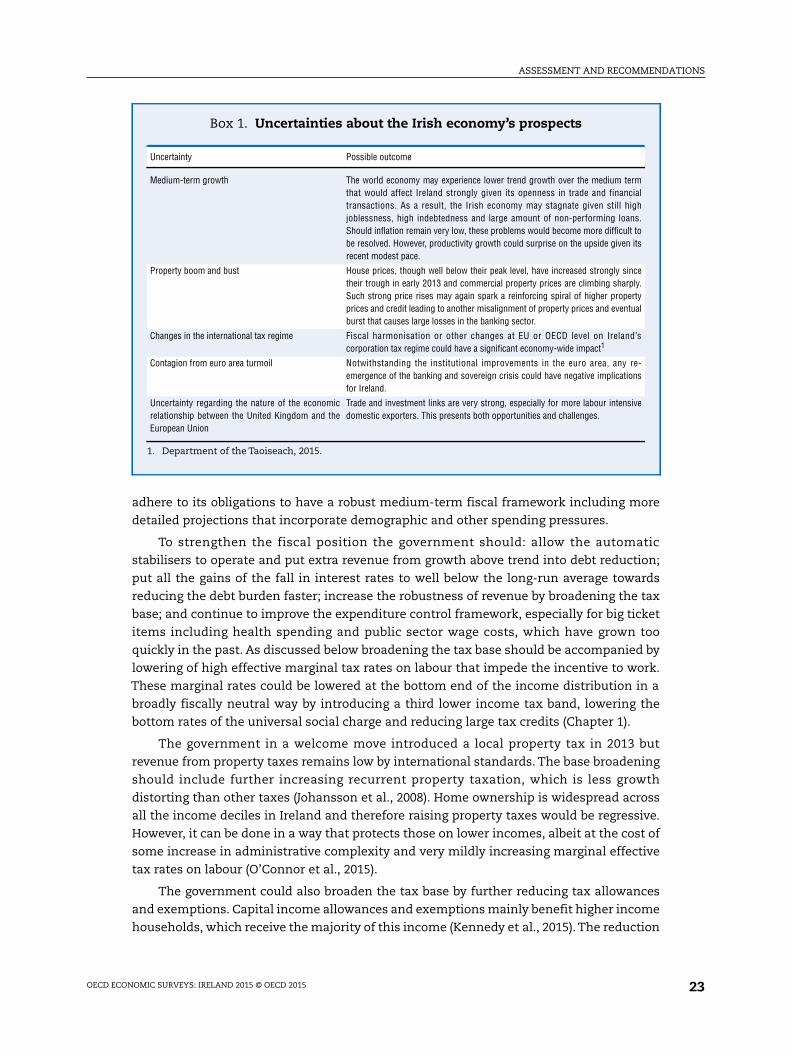
economy is subject to several medium-term uncertainties (Box 1). The government should
ensure that Budget 2016 is fully in line with its own rules and EU obligations. It should also
Table 3. Fiscal indicatorsGeneral government, as a percentage of GDP or potential GDP
2011 2012 2013 2014 20151 20161
Fiscal balance -12.5 -8.0 -5.7 -4.0 -2.2 -1.7
Total revenue 33.0 33.8 34.0 34.2 33.5 32.9
Total expenditure 45.5 41.8 39.6 38.3 35.7 34.6
Underlying primary fiscal balance2 -3.8 -2.0 -0.5 -0.2 -0.2 -0.7
Underlying fiscal balance -6.3 -6.3 -5.0 -3.8 -3.7 -3.5
Fiscal one-offs -3.5 0.0 0.9 0.5 0.7 0.7
Gross interest payments 3.4 4.1 4.3 4.0 3.6 3.4
Gross debt (Maastricht) 109.3 120.3 120.1 107.6 103.7 99.9
Net debt 60.1 78.5 81.5 81.8 77.8 75.1
1. Projections.2. Net of cyclical effects and one-offs.Source: OECD (2015), OECD Economic Outlook 97 Database, projections revised as of 10 September 2015.
Figure 5. Balancing the budget would put debt on a downward trendGeneral government gross debt, percentage of GDP
Note: All scenarios use the projections in the Economic Outlook Database No. 97 for the years 2015 and 2016. In the baseline sctrend GDP growth averages 1.8% per annum from 2017 to 2040 and the fiscal balance reaches 0% of GDP in 2021 and stays there. Indeficit adjustment scenario trend GDP growth averages 1.8% per annum from 2017 to 2040 and the fiscal balance remains at -2.8%in 2017 and beyond. In the trend growth 2% lower scenario, trend GDP growth averages -0.2% from 2017 to 2040 and the fiscalmoves to 0% by 2022, where it remains.Source: OECD Economic Outlook Database No. 97; OECD calculations.
1 2 http://dx.doi.org/10.1787/888933
0
20
40
60
80
100
120
140
2000 2002 2004 2006 2008 2010 2012 2014 2016 2018 2020 2022 2024 2026 2028 2030 2032 2034 2036 2038
No deficit adjustment after 2016
Trend Growth 2% lower
Baseline 0% structural balance
% of GDP % of GDP
OECD ECONOMIC SURVEYS: IRELAND 2015 © OECD 201522
ASSESSMENT AND RECOMMENDATIONS
adhere to its obligations to have a robust medium-term fiscal framework including more
detailed projections that incorporate demographic and other spending pressures.
To strengthen the fiscal position the government should: allow the automatic
stabilisers to operate and put extra revenue from growth above trend into debt reduction;
put all the gains of the fall in interest rates to well below the long-run average towards
reducing the debt burden faster; increase the robustness of revenue by broadening the tax
base; and continue to improve the expenditure control framework, especially for big ticket
items including health spending and public sector wage costs, which have grown too
quickly in the past. As discussed below broadening the tax base should be accompanied by
lowering of high effective marginal tax rates on labour that impede the incentive to work.
These marginal rates could be lowered at the bottom end of the income distribution in a
broadly fiscally neutral way by introducing a third lower income tax band, lowering the
bottom rates of the universal social charge and reducing large tax credits (Chapter 1).
The government in a welcome move introduced a local property tax in 2013 but
revenue from property taxes remains low by international standards. The base broadening
should include further increasing recurrent property taxation, which is less growth
distorting than other taxes (Johansson et al., 2008). Home ownership is widespread across
all the income deciles in Ireland and therefore raising property taxes would be regressive.
However, it can be done in a way that protects those on lower incomes, albeit at the cost of
some increase in administrative complexity and very mildly increasing marginal effective
tax rates on labour (O’Connor et al., 2015).
The government could also broaden the tax base by further reducing tax allowances
and exemptions. Capital income allowances and exemptions mainly benefit higher income
households, which receive the majority of this income (Kennedy et al., 2015). The reduction
Box 1. Uncertainties about the Irish economy’s prospects
Uncertainty Possible outcome
Medium-term growth The world economy may experience lower trend growth over the medium termthat would affect Ireland strongly given its openness in trade and financialtransactions. As a result, the Irish economy may stagnate given still highjoblessness, high indebtedness and large amount of non-performing loans.Should inflation remain very low, these problems would become more difficult tobe resolved. However, productivity growth could surprise on the upside given itsrecent modest pace.
Property boom and bust House prices, though well below their peak level, have increased strongly sincetheir trough in early 2013 and commercial property prices are climbing sharply.Such strong price rises may again spark a reinforcing spiral of higher propertyprices and credit leading to another misalignment of property prices and eventualburst that causes large losses in the banking sector.
Changes in the international tax regime Fiscal harmonisation or other changes at EU or OECD level on Ireland’scorporation tax regime could have a significant economy-wide impact1
Contagion from euro area turmoil Notwithstanding the institutional improvements in the euro area, any re-emergence of the banking and sovereign crisis could have negative implicationsfor Ireland.
Uncertainty regarding the nature of the economicrelationship between the United Kingdom and theEuropean Union
Trade and investment links are very strong, especially for more labour intensivedomestic exporters. This presents both opportunities and challenges.
1. Department of the Taoiseach, 2015.
OECD ECONOMIC SURVEYS: IRELAND 2015 © OECD 2015 23
ASSESSMENT AND RECOMMENDATIONS
of taxation related to superannuation is among the more expensive tax expenditures.
Reduced VAT rates are costly and inefficient way to address inequality challenges.
There has also been over reliance on bulk grants to cover hospital costs, resulting in
overruns in hospitals where activity levels rise and resources wasted in areas with
declining demand. In a welcome move, the government began to introduce activity-based
funding for the health sector (money follows the patient) in 2014. The moratorium on
hiring has now been appropriately replaced with a ceiling on personnel expenditure, which
allows hospitals greater flexibility to manage human resources. This should reduce the
practice of hiring expensive temps to get around headcount restrictions. To better assess
spending efficiency, the government should follow through on its plans to create, and
publish, data on the financial and operational performance of hospitals.
After extremely strong wage growth in the boom years, wages and pensions for public
servants were cut, and strong public sector wage control secured, under the Financial
Emergency Measures in the Public Interest Acts 2009-2013. These were underpinned by
industrial relations agreements with public service unions covering the years 2010-14
(Croke Park), 2013-16 (Haddington Road) and 2015-18 (Lansdowne Road) under which, in
exchange for public sector efficiency improvements, the government agreed with unions to
no further comprehensive wage cuts or compulsory redundancies. The government has
recently agreed to begin the process of gradually reducing the cuts applied during this
period from 2016. While the agreement is within budgetary parameters, the move raises a
concern that, in the absence of appropriate structures for wage determination that take
into account issues such as competitiveness, pressure for excessive public sector wage
increases could return.
Ensuring financial stabilityIn response to the 2008 banking crisis and the burst of the housing bubble, the
authorities consolidated financial regulation in the central bank, adopting more risk-based
and intrusive supervision, transferred large bad property loans to NAMA (a “bad bank”),
and undertook capital injections, liquidity support and government guarantees (see the
2011 OECD Economic Survey). In addition, Ireland introduced a special resolution regime for
banks, strengthened the deposit insurance scheme, issued a code of conduct to address
mortgage arrears, and reformed the personal bankruptcy regime (see the 2013 OECD
Economic Survey). Since November 2014, the EU Single Supervisor Mechanism (SSM) has had
the main responsibility for regulatory and supervision issues, but implementation remains
mostly in the hands of the national regulators.
Banks are now well capitalised by international standards and, at 14.5% in March 2015
the average core Tier 1 capital ratio of domestic banks is high. The European Central Bank’s
Comprehensive Assessment in late 2014 confirmed a small capital shortfall in only one
bank, which has since been addressed. The financial supervisor should continue to
monitor banks’ progress in meeting the forthcoming Capital Requirements Regulation
(CRR), which along with the Capital Requirements Directive (CRD) IV implements Basel III
rules in the EU, as some instruments now included in capital, such as deferred tax assets
and preference shares, will be excluded. A recent review found that excluding these
instruments would reduce the aggregate core Tier 1 capital ratio for domestic banks from
15.3% to 7.9% although all banks would remain above the 4.5% minimum requirements
under CRD IV (Central Bank of Ireland, 2015). Banks also returned to profitability in the first
OECD ECONOMIC SURVEYS: IRELAND 2015 © OECD 201524
ASSESSMENT AND RECOMMENDATIONS
half of 2014, mainly due to a reduction in the flow of new provisions. However, profitability
remains relatively low and low levels of new lending and limited scope to increase lending
margins will restrict the ability of banks to increase their income.
While market funding has improved, over half of the funding of the domestic banking
system has a maturity of less than one month. While the share of on-demand deposits of
non-financial corporations is just below the euro area average, it’s above the euro area
average for households and the central bank should encourage the banks to increase the
maturity of household deposits. Banks will have to improve their funding structure to meet
the forthcoming liquidity requirements of the CRR, which may present some challenges
(Central Bank of Ireland, 2014). In a welcome move, the authorities now report liquidity
positions of large individual banks in financial stability reports, as is the case in other
OECD countries, enhancing transparency.
Non-performing loans (NPLs) are high in an international context (18.7% of loans at
end-2014; Figure 4), although banks hold provisions against around 50% of them. In April
2015, the Central Bank introduced new requirements to conclude sustainable solutions for
a majority of distressed mortgages by the end of 2015. However, resolving some mortgages
in long-term arrears will require repossessions if they cannot be restructured in a way that
would be acceptable to both debtor and creditor. Repossession proceedings can take a
considerable amount of time mainly due to requests from parties for adjournments –
in 2015 to date the average time taken from the issue of proceedings to the granting of a
Possession Order is approximately 53 weeks. New Rules of Court (which are due to be put
in place shortly) are intended to improve case management and reduce the need for
adjournments in repossession cases. The authorities should continue to accelerate the
court process for repossessions, and if necessary take further action to reduce NPLs,
allocate losses and make progress to resolving the problem.
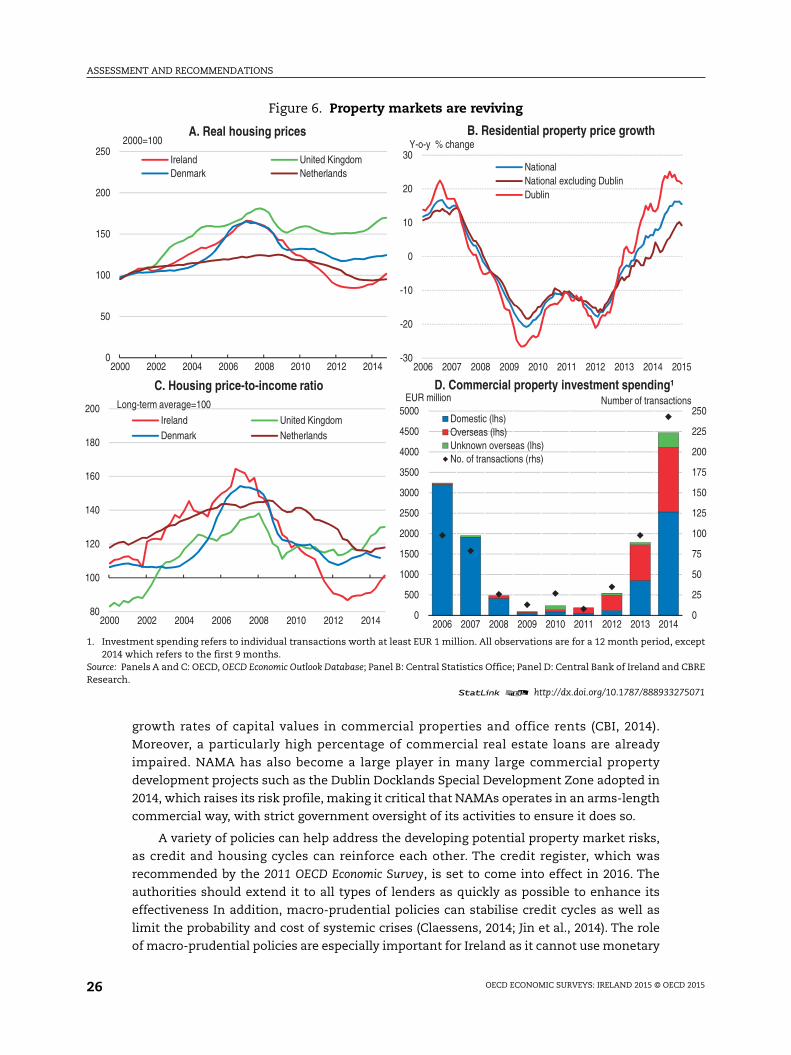
Although credit growth remains subdued, recent developments in residential and,
especially, commercial property markets may be creating risks of another damaging
property cycle. Property prices, especially in Dublin, have been rising rapidly albeit from
low levels (Figure 6, Panels A-C). In this context, the recent macro-prudential measures
(comprising caps on loan-to-value and loan-to-income ratios in residential property
market lending) to build resilience among banks and borrowers and to reduce the chance
of future credit and house price spirals, are welcome. It will be important that authorities
monitor these measures closely to ensure they are effective. Furthermore, developments in
the commercial property sector should be monitored on an ongoing basis and appropriate
action taken if needed.
Regarding the housing market, the government should avoid subsidies for first-time
home buyers, as these will be capitalised into prices, aggravating a potential price spiral
and making it even harder for those with lower incomes to purchase homes. A more
developed rental market would help moderate the property cycle, reduce household
exposure to house price fluctuations, especially poorer ones that will be hardest hit if
prices and rents continue to rise strongly. Construction 2020 initiatives, including
professionalised private rental markets, are thus welcome. Greater liberalisation of
planning requirements including on building heights in Dublin would make supply more
flexible to meet changing housing demand.
Easy monetary policy and search for yield by international investors has led to large
increases in commercial property investment spending (Figure 6, Panel D) and rapid
OECD ECONOMIC SURVEYS: IRELAND 2015 © OECD 2015 25
ASSESSMENT AND RECOMMENDATIONS
except
d CBRE
275071
0
25
50
75
100
125
150
175
200
225
250
4
2015
tions
growth rates of capital values in commercial properties and office rents (CBI, 2014).
Moreover, a particularly high percentage of commercial real estate loans are already
impaired. NAMA has also become a large player in many large commercial property
development projects such as the Dublin Docklands Special Development Zone adopted in
2014, which raises its risk profile, making it critical that NAMAs operates in an arms-length
commercial way, with strict government oversight of its activities to ensure it does so.
A variety of policies can help address the developing potential property market risks,
as credit and housing cycles can reinforce each other. The credit register, which was
recommended by the 2011 OECD Economic Survey, is set to come into effect in 2016. The
authorities should extend it to all types of lenders as quickly as possible to enhance its
effectiveness In addition, macro-prudential policies can stabilise credit cycles as well as
limit the probability and cost of systemic crises (Claessens, 2014; Jin et al., 2014). The role
of macro-prudential policies are especially important for Ireland as it cannot use monetary
Figure 6. Property markets are reviving
1. Investment spending refers to individual transactions worth at least EUR 1 million. All observations are for a 12 month period,2014 which refers to the first 9 months.
Source: Panels A and C: OECD, OECD Economic Outlook Database; Panel B: Central Statistics Office; Panel D: Central Bank of Ireland anResearch.
1 2 http://dx.doi.org/10.1787/888933
0
500
1000
1500
2000
2500
3000
3500
4000
4500
5000
2006 2007 2008 2009 2010 2011 2012 2013 201
Domestic (lhs)Overseas (lhs)Unknown overseas (lhs)No. of transactions (rhs)
EUR million
0
50
100
150
200
250
2000 2002 2004 2006 2008 2010 2012 2014
2000=100A. Real housing prices
Ireland United KingdomDenmark Netherlands
-30
-20
-10
0
10
20
30
2006 2007 2008 2009 2010 2011 2012 2013 2014
NationalNational excluding DublinDublin
80
100
120
140
160
180
200
2000 2002 2004 2006 2008 2010 2012 2014
C. Housing price-to-income ratio
Ireland United KingdomDenmark Netherlands
Y-o-y % change
Number of transacLong-term average=100
B. Residential property price growth
D. Commercial property investment spending¹
OECD ECONOMIC SURVEYS: IRELAND 2015 © OECD 201526
ASSESSMENT AND RECOMMENDATIONS
policy to address the business cycle and the counter-cyclicality of fiscal policy is
constrained by the need to reduce public debt. Furthermore, the post-crisis banking
system, which is highly concentrated and includes three partly publicly-owned banks,
creates the risk of “too big to fail” banks with potential fiscal implications.
The role of macro-prudential policies are especially important for Ireland as it cannot
use monetary policy to address the business cycle and the counter-cyclicality of fiscal
policy is constrained by high public debt. As recommended in the 2011 OECD Survey of
Ireland, loan-to-value (LTV) and loan-to-income ratios came into effect in February 2015.
The high levels of private debt (Figure 4; Table 3) and the recent history of the property
market bubble suggest Ireland should make full use of all available macro-prudential tools.
In this context, it is welcome that the authorities will operationalise counter-cyclical
capital buffers (CCB) framework in Ireland from January 2016, as is required by the Capital
Requirements Directive (CRD) IV. The central bank should also closely monitor the
composition of bank lending so as to avoid concentration risk in particular asset classes.
Enhanced supervision of traditional financial institutions and instruments might be
circumvented by new financial products resulting from technological changes as well as the
engineering of products that, in a low interest environment, respond to the appetite for high
yields by investors. In this environment, designing and implementing effective regulation,
which balances financial stability, investors’ protection and the opening of new financing
channels for SMEs, represents a challenge for regulatory authorities (OECD, 2015).
In order to address investment financing constraints new sources of funding,
including the Strategic Banking Corporation of Ireland (SBCI), (a wholesale lender to
frontline SME lenders) and the Ireland Strategic Investment Fund (ISIF) have been
established. By mid-2015, the SBCI had secured funding of EUR 800 million from the
European Investment Bank, Germany’s KfW and the National Pension Reserve Fund (now
the ISIF). The ISIF has EUR 7.4 billion or around 4% of GDP from the former National
Pension Reserve Fund with the dual mandate to invest on a commercial basis in a manner
that supports economic activity and employment in Ireland. Both the SBCI and the ISIF
should be monitored closely given the implied fiscal risks. The SBCI’s operating model is to
foster competition in the provision of credit rather than to compete directly with private
operators. It is important to ensure that the SBCI and the ISIF do not crowd out private
financing.
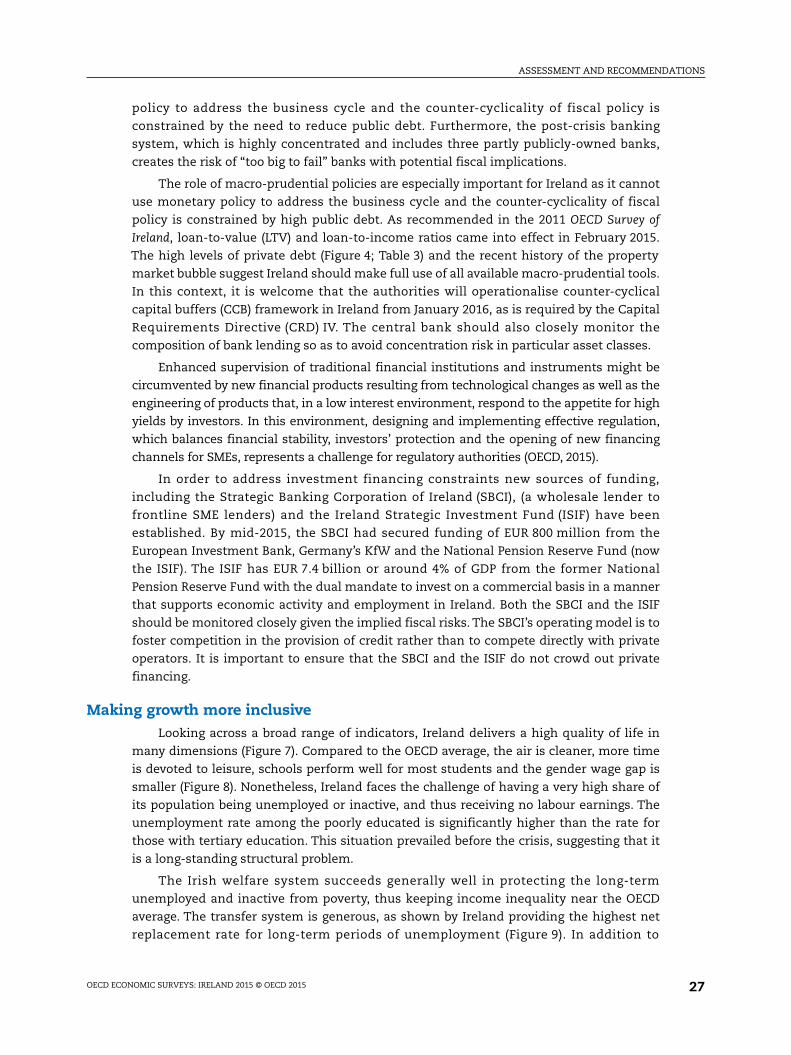
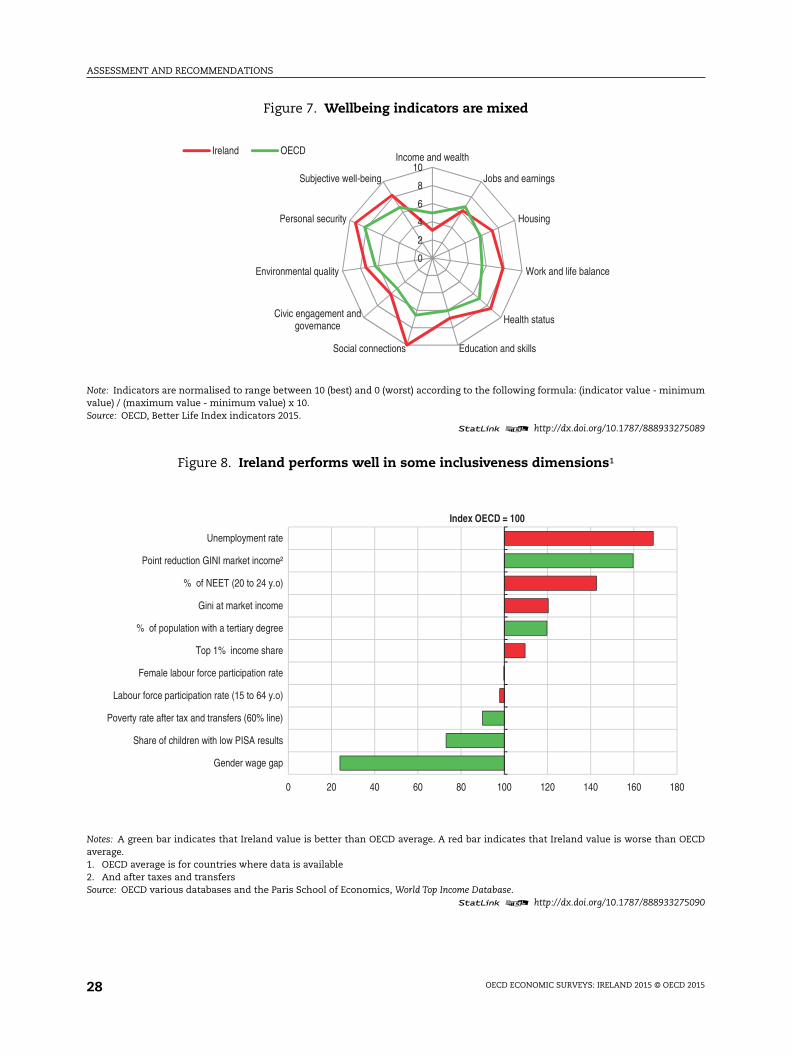
Making growth more inclusiveLooking across a broad range of indicators, Ireland delivers a high quality of life in
many dimensions (Figure 7). Compared to the OECD average, the air is cleaner, more time
is devoted to leisure, schools perform well for most students and the gender wage gap is
smaller (Figure 8). Nonetheless, Ireland faces the challenge of having a very high share of
its population being unemployed or inactive, and thus receiving no labour earnings. The
unemployment rate among the poorly educated is significantly higher than the rate for
those with tertiary education. This situation prevailed before the crisis, suggesting that it
is a long-standing structural problem.
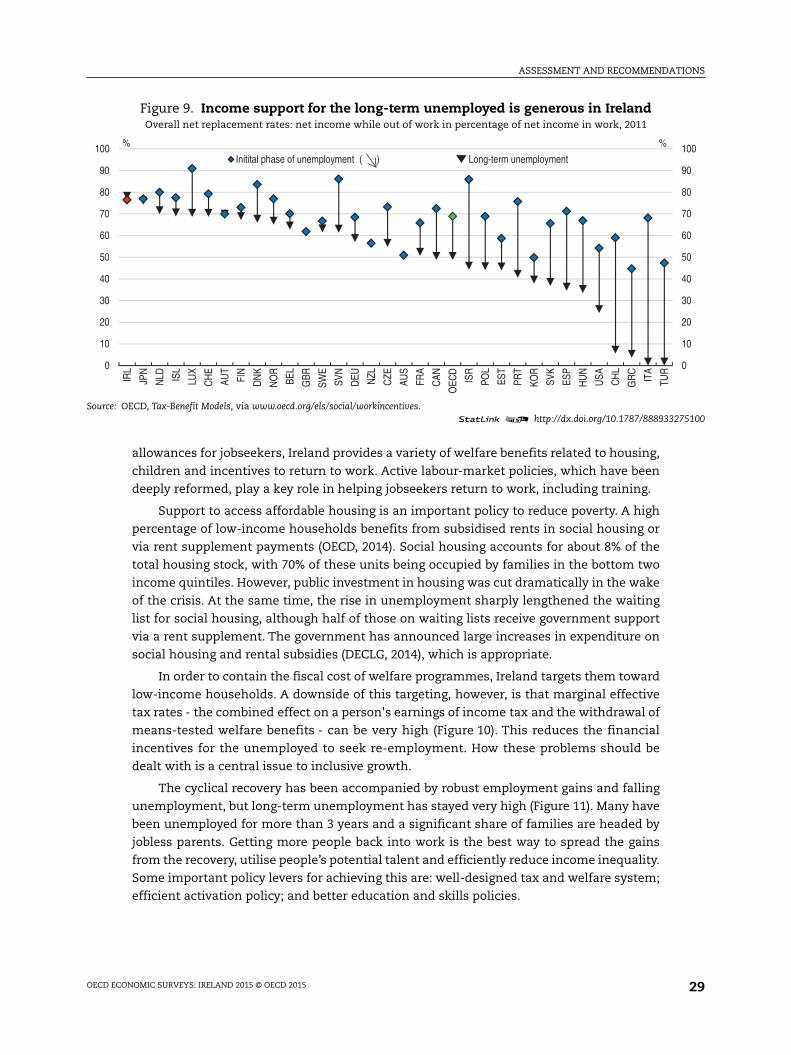
The Irish welfare system succeeds generally well in protecting the long-term
unemployed and inactive from poverty, thus keeping income inequality near the OECD
average. The transfer system is generous, as shown by Ireland providing the highest net
replacement rate for long-term periods of unemployment (Figure 9). In addition to
OECD ECONOMIC SURVEYS: IRELAND 2015 © OECD 2015 27
ASSESSMENT AND RECOMMENDATIONS
imum
275089
OECD
275090
80
Figure 7. Wellbeing indicators are mixed
Note: Indicators are normalised to range between 10 (best) and 0 (worst) according to the following formula: (indicator value - minvalue) / (maximum value - minimum value) x 10.Source: OECD, Better Life Index indicators 2015.
1 2 http://dx.doi.org/10.1787/888933
Figure 8. Ireland performs well in some inclusiveness dimensions¹
Notes: A green bar indicates that Ireland value is better than OECD average. A red bar indicates that Ireland value is worse thanaverage.1. OECD average is for countries where data is available2. And after taxes and transfersSource: OECD various databases and the Paris School of Economics, World Top Income Database.
1 2 http://dx.doi.org/10.1787/888933
0
2
4
6
8
10Income and wealth
Jobs and earnings
Housing
Work and life balance
Health status
Education and skillsSocial connections
Civic engagement andgovernance
Environmental quality
Personal security
Subjective well-being
Ireland OECD
0 20 40 60 80 100 120 140 160 1
Gender wage gap
Share of children with low PISA results
Poverty rate after tax and transfers (60% line)
Labour force participation rate (15 to 64 y.o)
Female labour force participation rate
Top 1% income share
% of population with a tertiary degree
Gini at market income
% of NEET (20 to 24 y.o)
Point reduction GINI market income²
Unemployment rate
Index OECD = 100
OECD ECONOMIC SURVEYS: IRELAND 2015 © OECD 201528
ASSESSMENT AND RECOMMENDATIONS
275100
0
10
20
30
40
50
60
70
80
90
100
allowances for jobseekers, Ireland provides a variety of welfare benefits related to housing,
children and incentives to return to work. Active labour-market policies, which have been
deeply reformed, play a key role in helping jobseekers return to work, including training.
Support to access affordable housing is an important policy to reduce poverty. A high
percentage of low-income households benefits from subsidised rents in social housing or
via rent supplement payments (OECD, 2014). Social housing accounts for about 8% of the
total housing stock, with 70% of these units being occupied by families in the bottom two
income quintiles. However, public investment in housing was cut dramatically in the wake
of the crisis. At the same time, the rise in unemployment sharply lengthened the waiting
list for social housing, although half of those on waiting lists receive government support
via a rent supplement. The government has announced large increases in expenditure on
social housing and rental subsidies (DECLG, 2014), which is appropriate.
In order to contain the fiscal cost of welfare programmes, Ireland targets them toward
low-income households. A downside of this targeting, however, is that marginal effective
tax rates - the combined effect on a person's earnings of income tax and the withdrawal of
means-tested welfare benefits - can be very high (Figure 10). This reduces the financial
incentives for the unemployed to seek re-employment. How these problems should be
dealt with is a central issue to inclusive growth.
The cyclical recovery has been accompanied by robust employment gains and falling
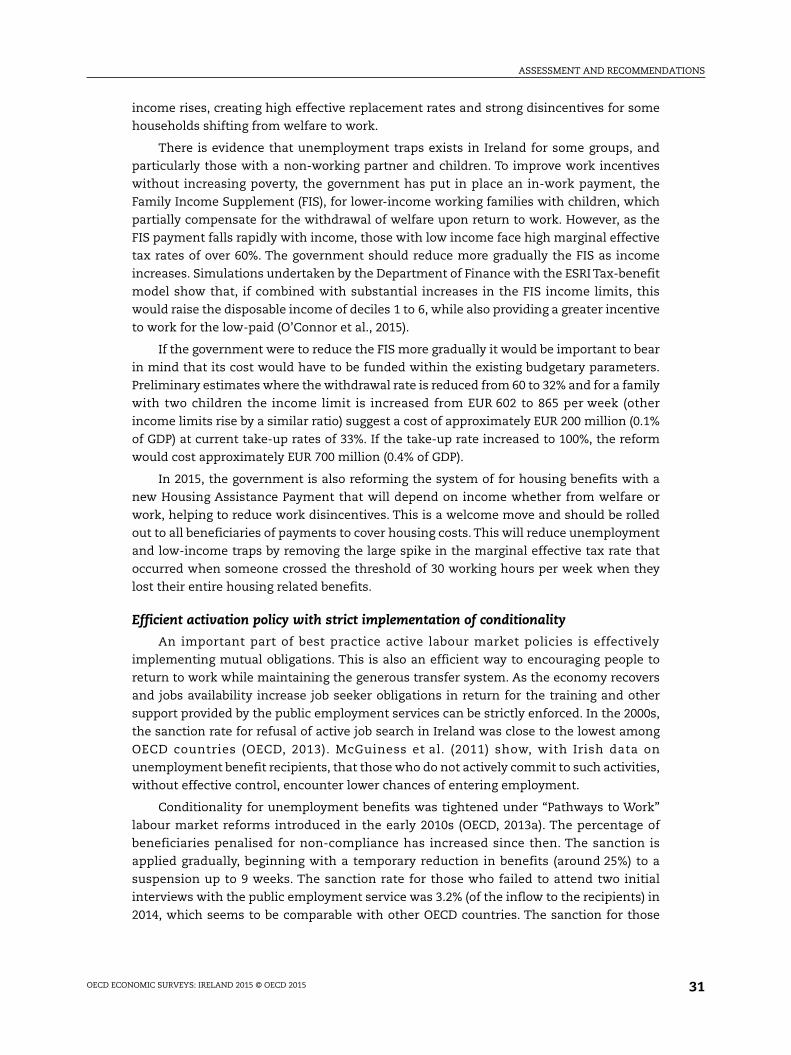
unemployment, but long-term unemployment has stayed very high (Figure 11). Many have
been unemployed for more than 3 years and a significant share of families are headed by
jobless parents. Getting more people back into work is the best way to spread the gains
from the recovery, utilise people’s potential talent and efficiently reduce income inequality.
Some important policy levers for achieving this are: well-designed tax and welfare system;
efficient activation policy; and better education and skills policies.
Figure 9. Income support for the long-term unemployed is generous in IrelandOverall net replacement rates: net income while out of work in percentage of net income in work, 2011
Source: OECD, Tax-Benefit Models, via www.oecd.org/els/social/workincentives.1 2 http://dx.doi.org/10.1787/888933
0
10
20
30
40
50
60
70
80
90
100
IRL
JPN
NLD IS
L
LUX
CH
E
AUT
FIN
DN
K
NO
R
BEL
GBR
SWE
SVN
DEU NZL
CZE
AUS
FRA
CAN
OEC
D
ISR
POL
EST
PRT
KOR
SVK
ESP
HU
N
USA CH
L
GR
C
ITA
TUR
Initital phase of unemployment Long-term unemployment
%%
( )
OECD ECONOMIC SURVEYS: IRELAND 2015 © OECD 2015 29
ASSESSMENT AND RECOMMENDATIONS
275119
OECD
s/emp/
275128
0
10
20
30
40
50
60
70
80
90
0
10
20
30
40
50
60
70
80
GR
C
%
Improving the tax and welfare system
Tax and welfare systems often create disincentives to work. High replacement rates
discourage the decision to work (unemployment traps) and/or high marginal effective tax
rates (METRs) discourage working more hours (low-income traps). Solving these problems
involves unavoidable trade-offs between fiscal costs, work disincentive effects and social
protection. As discussed above, Ireland combines high replacement rates for low-income
individuals with a sharp reduction of welfare or in-work benefits and higher taxes as
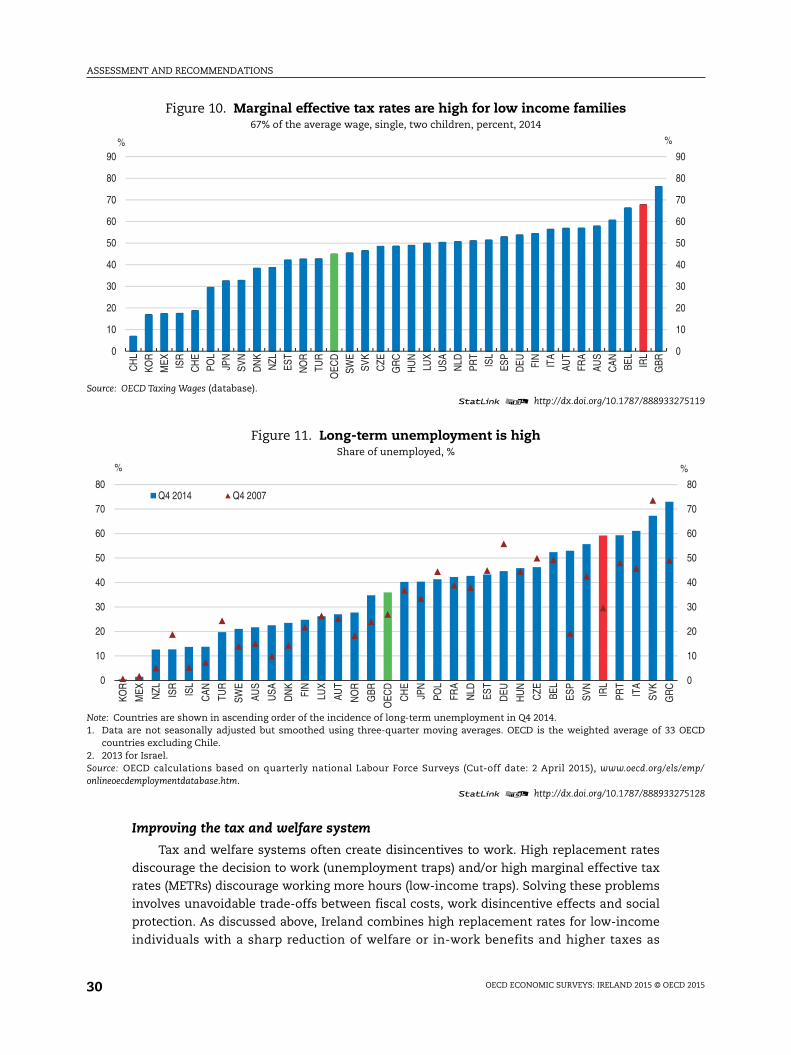
Figure 10. Marginal effective tax rates are high for low income families67% of the average wage, single, two children, percent, 2014
Source: OECD Taxing Wages (database).1 2 http://dx.doi.org/10.1787/888933
Figure 11. Long-term unemployment is highShare of unemployed, %
Note: Countries are shown in ascending order of the incidence of long-term unemployment in Q4 2014.1. Data are not seasonally adjusted but smoothed using three-quarter moving averages. OECD is the weighted average of 33
countries excluding Chile.2. 2013 for Israel.Source: OECD calculations based on quarterly national Labour Force Surveys (Cut-off date: 2 April 2015), www.oecd.org/elonlineoecdemploymentdatabase.htm.
1 2 http://dx.doi.org/10.1787/888933
0
10
20
30
40
50
60
70
80
90
CH
L
KOR
MEX IS
R
CH
E
POL
JPN
SVN
DN
KN
ZL
EST
NO
R
TUR
OEC
D
SWE
SVK
CZE
GR
C
HU
N
LUX
USA NLD
PRT
ISL
ESP
DEU FI
NIT
A
AUT
FRA
AUS
CAN BE
LIR
L
GBR
% %
0
10
20
30
40
50
60
70
80
KOR
MEX NZL ISR
ISL
CAN TU
R
SWE
AUS
USA
DN
K
FIN
LUX
AUT
NO
R
GBR
OEC
D
CH
E
JPN
POL
FRA
NLD ES
T
DEU
HU
N
CZE BE
L
ESP
SVN
IRL
PRT
ITA
SVK
Q4 2014 Q4 2007
%
OECD ECONOMIC SURVEYS: IRELAND 2015 © OECD 201530
ASSESSMENT AND RECOMMENDATIONS
income rises, creating high effective replacement rates and strong disincentives for some
households shifting from welfare to work.
There is evidence that unemployment traps exists in Ireland for some groups, and
particularly those with a non-working partner and children. To improve work incentives
without increasing poverty, the government has put in place an in-work payment, the
Family Income Supplement (FIS), for lower-income working families with children, which
partially compensate for the withdrawal of welfare upon return to work. However, as the
FIS payment falls rapidly with income, those with low income face high marginal effective
tax rates of over 60%. The government should reduce more gradually the FIS as income
increases. Simulations undertaken by the Department of Finance with the ESRI Tax-benefit
model show that, if combined with substantial increases in the FIS income limits, this
would raise the disposable income of deciles 1 to 6, while also providing a greater incentive
to work for the low-paid (O’Connor et al., 2015).
If the government were to reduce the FIS more gradually it would be important to bear
in mind that its cost would have to be funded within the existing budgetary parameters.
Preliminary estimates where the withdrawal rate is reduced from 60 to 32% and for a family
with two children the income limit is increased from EUR 602 to 865 per week (other
income limits rise by a similar ratio) suggest a cost of approximately EUR 200 million (0.1%
of GDP) at current take-up rates of 33%. If the take-up rate increased to 100%, the reform
would cost approximately EUR 700 million (0.4% of GDP).
In 2015, the government is also reforming the system of for housing benefits with a
new Housing Assistance Payment that will depend on income whether from welfare or
work, helping to reduce work disincentives. This is a welcome move and should be rolled
out to all beneficiaries of payments to cover housing costs. This will reduce unemployment
and low-income traps by removing the large spike in the marginal effective tax rate that
occurred when someone crossed the threshold of 30 working hours per week when they
lost their entire housing related benefits.
Efficient activation policy with strict implementation of conditionality
An important part of best practice active labour market policies is effectively
implementing mutual obligations. This is also an efficient way to encouraging people to
return to work while maintaining the generous transfer system. As the economy recovers
and jobs availability increase job seeker obligations in return for the training and other
support provided by the public employment services can be strictly enforced. In the 2000s,
the sanction rate for refusal of active job search in Ireland was close to the lowest among
OECD countries (OECD, 2013). McGuiness et al. (2011) show, with Irish data on
unemployment benefit recipients, that those who do not actively commit to such activities,
without effective control, encounter lower chances of entering employment.
Conditionality for unemployment benefits was tightened under “Pathways to Work”
labour market reforms introduced in the early 2010s (OECD, 2013a). The percentage of
beneficiaries penalised for non-compliance has increased since then. The sanction is
applied gradually, beginning with a temporary reduction in benefits (around 25%) to a
suspension up to 9 weeks. The sanction rate for those who failed to attend two initial
interviews with the public employment service was 3.2% (of the inflow to the recipients) in
2014, which seems to be comparable with other OECD countries. The sanction for those
OECD ECONOMIC SURVEYS: IRELAND 2015 © OECD 2015 31
ASSESSMENT AND RECOMMENDATIONS
who refuse to commit to active job search amounted to some 9200 cases, which is
estimated to be around 3% of those who are registered as unemployed.
The conditionality approach can be even more enhanced in setting some objective
criteria, as currently the sanction for non-compliance seems to be decided at the
caseworker’s discretion. For instance, the job seeker can be sanctioned when refusing a
suitable job offer, against such criteria as wages, working hours, contract types, location,
etc. However, it is not entirely clear how the job seeker is judged to have declined a
“suitable” job offer. Some objective criteria would help to motivate the job seeker/recipient
of benefits to accept a job, for example, defining the circumstances the job seeker has to
accept a temporary contract, or defining the maximum reduction in wage relative to the
previous job that can be considered as suitable.
The provision of social benefits (other than unemployment benefits) is currently not
subject to conditionality in Ireland, even though many of beneficiaries could be considered
fit for work. While such conditionality is not appropriate for all benefits, the authorities
should consider the extent to which it could be extended.
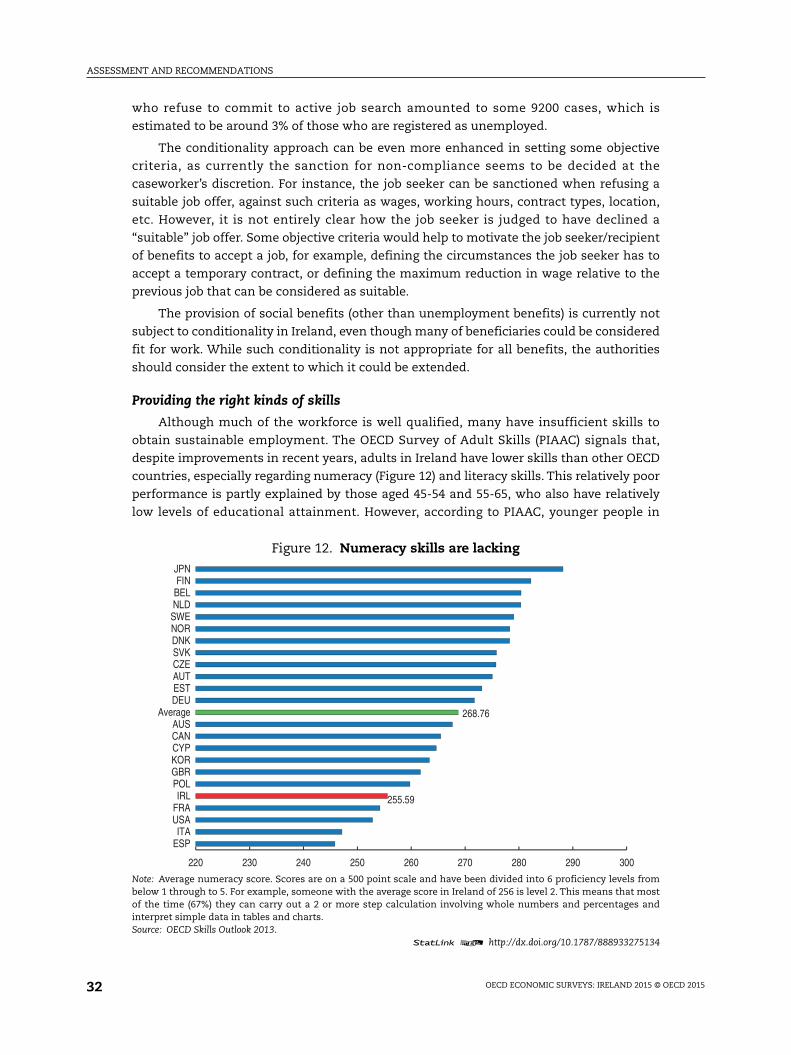
Providing the right kinds of skills
Although much of the workforce is well qualified, many have insufficient skills to
obtain sustainable employment. The OECD Survey of Adult Skills (PIAAC) signals that,
despite improvements in recent years, adults in Ireland have lower skills than other OECD
countries, especially regarding numeracy (Figure 12) and literacy skills. This relatively poor
performance is partly explained by those aged 45-54 and 55-65, who also have relatively
low levels of educational attainment. However, according to PIAAC, younger people in
Figure 12. Numeracy skills are lacking
Note: Average numeracy score. Scores are on a 500 point scale and have been divided into 6 proficiency levels frombelow 1 through to 5. For example, someone with the average score in Ireland of 256 is level 2. This means that mostof the time (67%) they can carry out a 2 or more step calculation involving whole numbers and percentages andinterpret simple data in tables and charts.Source: OECD Skills Outlook 2013.
1 2 http://dx.doi.org/10.1787/888933275134
220 230 240 250 260 270 280 290 300
ESPITA
USAFRAIRL
POLGBRKORCYPCANAUS
AverageDEUESTAUTCZESVKDNKNORSWENLDBELFINJPN
268.76
255.59
OECD ECONOMIC SURVEYS: IRELAND 2015 © OECD 201532
ASSESSMENT AND RECOMMENDATIONS
Ireland also compare unfavourably with their peers in other OECD countries. To address
these needs, SOLAS, the agency overseeing the delivery of training to the unemployed,
launched its Further Education and Training Strategy 2014-2019 to embed literacy
and numeracy within further education and training provision. The Strategy has a literacy
and numeracy plan for increasing participation of priority cohort groups such as older
adults in literacy and numeracy programmes offered through the Education and Training
Boards.
The situation for youth has improved but the unemployment rate and the rate of those
not in employment, education or training remain above OECD and EU averages.
Involuntary part-time employment is also high. The government informed by OECD advice
(OECD, 2014a) developed a youth guarantee plan to transpose the EU Youth Guarantee to
Ireland and implementing it should remain a priority.
There is also evidence of social inequalities in higher education participation. The
social mix of students in school has a strong effect on educational outcomes (McCoy et al.,
2014). The concentration of immigrant’s in certain primary schools is increasing, with
about 80% of children from immigrant backgrounds concentrated in 23% of schools.
Providing disadvantaged schools with additional support, for example by attracting better
teachers and providing additional tutoring, and avoiding excessive concentration of
immigrants in disadvantaged schools would make Irish educational system more socially
inclusive. Providing more information on educational options once they have left school,
including vocational and technical options, would facilitate transitions to work. The
government, in consultation with the youth work sector, should fine-tune the sector’s
learning programmes to further support youth transition through education and into work
for students from as wide a set of backgrounds as possible.
The education and training system is also being reformed, including with new
programmes aimed at providing skills relevant to the more knowledge-intensive economy
that Ireland is becoming (e.g. Momentum and Springboard). Three-quarters of those who
completed a Springboard course over the period 2011-2014 are no longer registered as
unemployed. The apprenticeship system, narrowly geared towards the construction sector
and hardly used at all by women, is also being reformed. Nevertheless, the pace of reform
is very slow.
A new apprenticeship system is being developed. The Apprenticeship Council,
established in November 2014, issued a call for new apprenticeship proposals, as
recommended in previous Economic Surveys (e.g. OECD, 2013a). More progress has been
made in the delivery of training to the unemployed. A Further Education and Training
Services Plan was prepared by SOLAS in 2014, taking into account identified skills needs of
employers. Some progress has been made in setting up the infrastructure to collect and
link information on participants and outcomes. This information should be used to
undertake timely statistical evaluation of training programmes. Based on that evaluation,
resources should be reallocated to those schemes and providers that are effective in
providing the skills needed to increase employability.
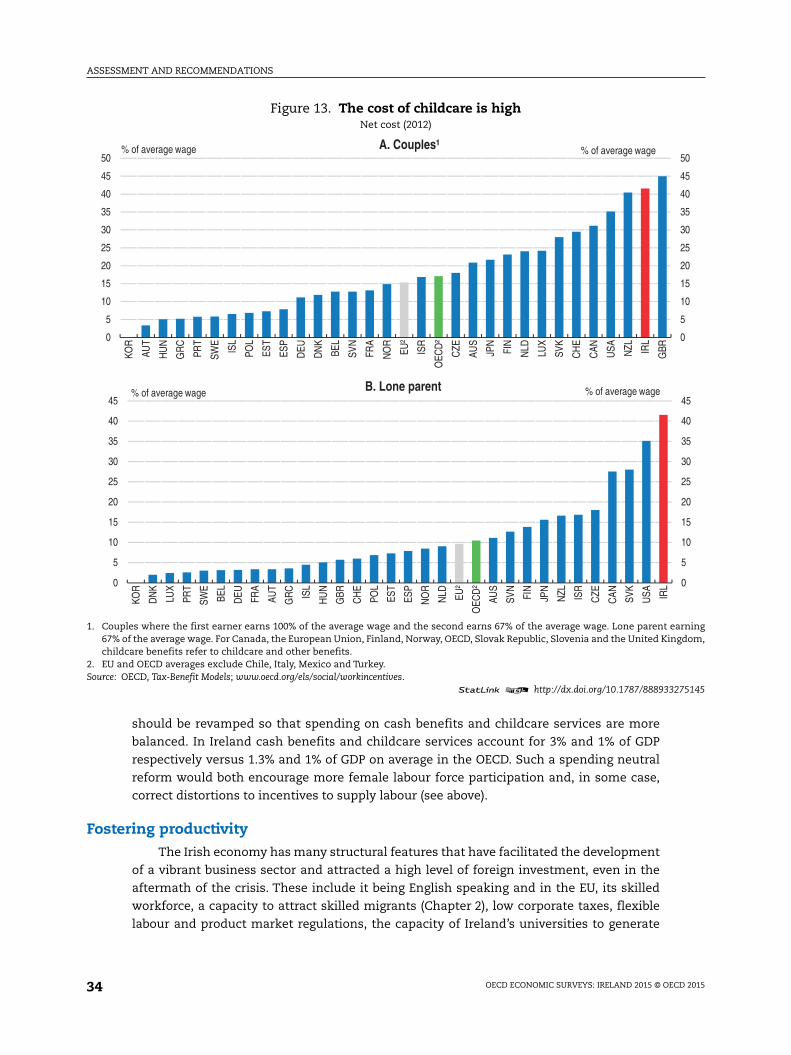
Better family policy: Encouraging voluntary participation of women
Low labour-market participation for women after the age of 30 and single parents can
be explained by the high cost (Figure 13) and variable quality (Start Strong, 2014 and
Hanafin, 2014) of childcare services. In the medium- to long- run, the family benefit system
OECD ECONOMIC SURVEYS: IRELAND 2015 © OECD 2015 33
ASSESSMENT AND RECOMMENDATIONS
arninggdom,
275145
0
5
10
15
20
25
30
35
40
45
50
0
5
10
15
20
25
30
35
40
45
should be revamped so that spending on cash benefits and childcare services are more
balanced. In Ireland cash benefits and childcare services account for 3% and 1% of GDP
respectively versus 1.3% and 1% of GDP on average in the OECD. Such a spending neutral
reform would both encourage more female labour force participation and, in some case,
correct distortions to incentives to supply labour (see above).
Fostering productivityThe Irish economy has many structural features that have facilitated the development
of a vibrant business sector and attracted a high level of foreign investment, even in the
aftermath of the crisis. These include it being English speaking and in the EU, its skilled
workforce, a capacity to attract skilled migrants (Chapter 2), low corporate taxes, flexible
labour and product market regulations, the capacity of Ireland’s universities to generate
Figure 13. The cost of childcare is highNet cost (2012)
1. Couples where the first earner earns 100% of the average wage and the second earns 67% of the average wage. Lone parent e67% of the average wage. For Canada, the European Union, Finland, Norway, OECD, Slovak Republic, Slovenia and the United Kinchildcare benefits refer to childcare and other benefits.
2. EU and OECD averages exclude Chile, Italy, Mexico and Turkey.Source: OECD, Tax-Benefit Models; www.oecd.org/els/social/workincentives.
1 2 http://dx.doi.org/10.1787/888933
0
5
10
15
20
25
30
35
40
45
50
KOR
AUT
HU
N
GR
C
PRT
SWE
ISL
POL
EST
ESP
DEU
DN
K
BEL
SVN
FRA
NO
R
EU²
ISR
OEC
D²
CZE
AUS
JPN
FIN
NLD LU
X
SVK
CH
E
CAN USA NZL IR
L
GBR
A. Couples¹% of average wage % of average wage
0
5
10
15
20
25
30
35
40
45
KOR
DN
K
LUX
PRT
SWE
BEL
DEU FR
A
AUT
GR
C
ISL
HU
N
GBR
CH
E
POL
EST
ESP
NO
R
NLD EU
²
OEC
D²
AUS
SVN
FIN
JPN
NZL ISR
CZE
CAN SV
K
USA IR
L
B. Lone parent% of average wage % of average wage
OECD ECONOMIC SURVEYS: IRELAND 2015 © OECD 201534
ASSESSMENT AND RECOMMENDATIONS
275152
275168
-2
-1
0
1
2
3
4
5
6
7
8
6
%
0
2
4
6
8
10
the talent firms need, a highly effective foreign investment support agency, and a
pragmatic and responsive public administration.
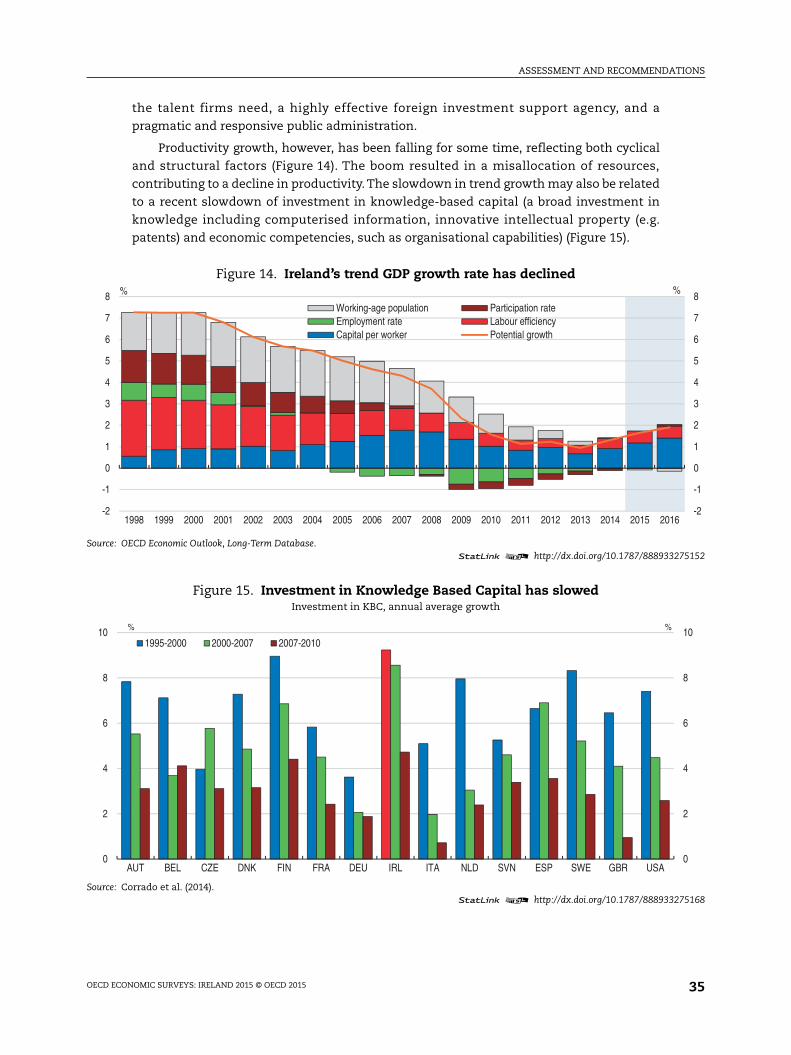
Productivity growth, however, has been falling for some time, reflecting both cyclical
and structural factors (Figure 14). The boom resulted in a misallocation of resources,
contributing to a decline in productivity. The slowdown in trend growth may also be related
to a recent slowdown of investment in knowledge-based capital (a broad investment in
knowledge including computerised information, innovative intellectual property (e.g.
patents) and economic competencies, such as organisational capabilities) (Figure 15).
Figure 14. Ireland’s trend GDP growth rate has declined
Source: OECD Economic Outlook, Long-Term Database.1 2 http://dx.doi.org/10.1787/888933
Figure 15. Investment in Knowledge Based Capital has slowedInvestment in KBC, annual average growth
Source: Corrado et al. (2014).1 2 http://dx.doi.org/10.1787/888933
-2
-1
0
1
2
3
4
5
6
7
8
1998 1999 2000 2001 2002 2003 2004 2005 2006 2007 2008 2009 2010 2011 2012 2013 2014 2015 201
Working-age population Participation rateEmployment rate Labour efficiencyCapital per worker Potential growth
%
0
2
4
6
8
10
AUT BEL CZE DNK FIN FRA DEU IRL ITA NLD SVN ESP SWE GBR USA
1995-2000 2000-2007 2007-2010
% %
OECD ECONOMIC SURVEYS: IRELAND 2015 © OECD 2015 35
ASSESSMENT AND RECOMMENDATIONS
Maintaining FDI attractiveness
Foreign investment has been the source of whole new sectors, such as medical
devices, and contributes significantly to jobs, innovation and exports. The foreign
investment support agency, IDA Ireland, should continue to target key foreign firms, as the
presence of one multinational tends to attract others (Barry, et al., 2003; Worrall, 2014). To
ensure better linkages of multinationals to the wider economy, the government should
continue to support business accelerators and incubators, which have a proven record of
fostering a company start-up environment in the IT sector (Connolly, 2014).
A low and stable corporate tax rate is also important for attracting investment.
Increasingly significant in the context of growing general concern about tax avoidance by
multinationals worldwide is the reputation of the Irish system as fair and transparent. The
move to abolish the so-called “double Irish” from 2020 is welcome- the legislative change
came into effect for new companies from 1 January 2015, while a transition period will
apply until 2020 for existing companies. Given the strong presence of intellectual property
intensive IT and pharmaceutical companies in Ireland, preventing artificial profit shifting
through the payment of non-market-priced royalties on intellectual property owned by
companies in zero or low tax rate jurisdictions is crucial. Ireland should continue to keep
its transfer pricing rules up to date with the OECD/G20’s Base Erosion and Profit Shifting
(BEPS) project. Although changes to tax rules elsewhere may have a significant economy
wide impact (Box 1), the closing of tax loopholes in other countries may also increase the
importance of the corporate tax rate as a determinant of investment. As Ireland is
relatively competitive in this domain this may help it to attract greater foreign investment.
Maintaining a favourable regulatory environment for business is also important to
help foster a return to higher productivity growth, especially amongst home-grown firms,
whose performance lags significantly behind the foreign owned sector (Haugh, 2013). For
this purpose, Ireland needs to maintain a strong focus on policies to raise productivity. One
option is an independent agency that would pull together on a whole-of-government basis
the many of strands of policy needed to raise productivity. For example, this could be
achieved by expanding the role of the National Competitiveness Council to deal with
productivity in the broad sense. The renewed Council should continue to maintain a
permanent research staff of sufficient size to fulfil a mandate of identifying obstacles to
productivity growth, advocating the necessary reforms, and engage in a dialogue with
stakeholders regarding the appropriate design of micro-economic and industry regulation
measures. The Australia Productivity Commission was a forerunner in this area, and has
compiled a proven track record of developing and advocating structural reforms to raise
productivity. More recently, other countries (such as Chile, Mexico, Norway and New
Zealand) have implemented similar bodies.
Tuning-up innovation support for new firms
Encouraging more innovation among new firms is a key lever for boosting productivity
growth and jobs (Lawless, 2013) In comparison with other countries, Ireland has fewer
young patenting firms, less public spending on R&D, and less industry financed public R&D
(OECD, 2014b). Policy is going in the right direction to address these weaknesses but there
is scope for improvement.
Ireland’s total public support to business R&D is not especially high in relation to its
GDP and is skewed towards R&D tax credits. R&D tax credits have the advantage that they
OECD ECONOMIC SURVEYS: IRELAND 2015 © OECD 201536
ASSESSMENT AND RECOMMENDATIONS
avoid the “picking winners” problem associated with direct grants. They also should
require fewer administrative resources to operate than direct grants. However, R&D tax
incentives can protect incumbents to the detriment of new entrants (Bravo-Biosca et al.,
2013). Direct support makes SMEs more likely to carry out R&D (Czarnitski and Ebersberger,
2010). Even if R&D tax incentives contain carry-over provisions and refunds as in Ireland,
young firms may not fully benefit from the schemes if they lack the upfront funds to start
an innovative project, and in these cases public funding may be more beneficial (Busom
et al., 2014).Given that both types of support have advantages, a more balanced mix should
be used and the mix of support should be shifted towards direct grants.
Young firms and SMEs would also benefit from research networks due to their limited
in-house R&D resources, but they engage in less collaboration because they lack absorptive
capacity. Research staff and student placements can play a role in lifting absorptive
capacity. The steady expansion of employment based research programme for graduate
students should continue. Increasing absorptive capacity also requires improving smaller
firm management knowledge of open innovation networks, which could be facilitated by
expanding Enterprise Ireland’s mentoring programmes to include a component on
innovation collaboration, intellectual property protection as well as international sales.
Effective collaboration also requires tuning public research institutes so they can
better meet smaller firm needs. Young firms and SMEs have fewer resources and therefore
need faster direct pay-offs from innovation (Mina et al., 2008) and projects that focus on
improving product quality and production processes (Novero, 2008). Enterprise Ireland
should ensure its new Technology Centres are demand driven, and that they encompass
consulting, research, technology advisory and testing (Mina et al., 2009). The total budget
of the 15 centres under development is only one third of that of the budget of Ireland’s
successful agri-food Research Technology Organisation, Teagasc (DJEI, 2014). The large
stock of foreign investment in Ireland could be further leveraged by introducing a
procurement database/market where large firms place orders for services or products that
smaller firms could bid to produce.
Constraints on finance can be a major obstacle for new, innovative firms. The
provision of venture capital in Ireland is above the EU average. The government has
introduced a variety of new tools to address financing needs of firms not suited for
traditional bank lending (OECD, 2013a). It will be important to maintain private sector
involvement in these arrangements and monitor the performance of the various venture
capital funds.
Getting more from competition
Increasing competition reduces monopoly rents, which are a source of income
inequality, inefficiency and less inclusive growth. In a welcome move, the government
overhauled the Competition Law Framework in 2014. The Competition Authority and the
National Consumer Agency were merged into the Competition and Consumer Protection
Commission (CCPC) and the CCPC has been given new powers.
There is room to intensify competition in Ireland in less trade exposed sectors. Ireland
is ranked worst in the OECD for restrictive regulation on forms of legal professional
cooperation in the OECD’s PMR Index. The Legal Services Bill 2011 meets many of the
CCPC’s recommendations to enhance competition in the legal sector. The government
OECD ECONOMIC SURVEYS: IRELAND 2015 © OECD 2015 37
ASSESSMENT AND RECOMMENDATIONS
should also introduce a separate conveyancing profession, which has lowered the cost of
these services in the United Kingdom (OECD, 2013a).
The Government partly implemented the CCPC’s recommendations to increase
competition in the port sector by issuing some new self-handling cargo licences. However,
general cargo handling licences have an automatic renewal clause, protecting incumbents.
The state-owned port companies should require a tender or other competitive process for
renewal of licences.
In the electricity sector, the transmission grid is independently operated by Eirgrid, but
is owned by the incumbent generator, the Electricity Supply Board (ESB). The government
should work towards the fuller separation of transmission and generation activities so as
enhance competition in the sector. In addition, generation remains concentrated and
competition should be further enhanced by the sale of some of ESB’s current capacity.
Migration contributes to reducing skill mismatches
Migration plays an important role in the Irish labour market. The economic crisis
triggered a rapid increase in emigration, in large part among highly-skilled and people in
employment. More recent data shows that while total emigration has started to decline,
emigration by individuals with tertiary education continues to increase. Despite the
general improvement in the Irish economy and its labour market, the outflow of university
graduates exceeds the inflow. Productivity prospects of domestic companies, whose ability
to hire workers abroad is limited, are more likely to be affected by this net outflow of
qualified workers than multinationals, which are more successful in international
recruitment. This risks that the already large productivity gap between domestic firms and
multinationals will widen further; it also highlights the need for Ireland to optimise
policies to retain and attract qualified workers, and to facilitate that all companies can take
full advantage of these policies.
A high proportion of immigrants are also highly-skilled. This pattern of “brains
exchange” reduces skill mismatches but also raises the challenge of integrating
immigrants. As the economy recovers, the gap between immigrants and Irish workers in
terms of employment probabilities is receding to pre-crisis levels (González Pandiella et al.,
2015). Ireland is also starting to experience challenges associated with the integration of
second generation immigrants. In that respect, providing students of foreign language
background English language training is crucial.
Ireland will continue to need skilled immigrants. That challenge will become more
acute, as wages in traditional source countries catch up (Westmore, 2014) and more
countries join the global competition for skills. Ireland has responded by more regular (bi-
annual) evidence-based reviews of occupations eligible for the Critical Skills Employment
Permit. Ireland has also made good progress in reducing processing times for employment
permits, from 36 days in January 2013 to 23 days in April 2015. This is among the lower
processing times in the OECD (OECD, 2014c). Given the importance of migration to Ireland
it should continue to optimise its migration selection system by making further use of IT in
employment permits processes.
Ireland has introduced self-declaration and the Trusted Partner Initiative, whereby the
submission of documentation is replaced by a declaration by the employer that the
requisites are met. The Initiative will reduce administration significantly. Ireland should
OECD ECONOMIC SURVEYS: IRELAND 2015 © OECD 201538
ASSESSMENT AND RECOMMENDATIONS
issions
issions
ions
bitiony (EPA),
encourage and fine tune such schemes and monitor the system to make sure it works for
SMEs.
Better use could be made of international students as a channel for high-skill
immigration. After graduation the job-search period allowed in Ireland ranges from six to
twelve months. Countries with a higher share of international students allow for longer
job-search periods, (OECD, 2014c). It can reach up to 30 months in Australia. Another
avenue to make Ireland more attractive is post-study employment permits. Exempting
international students from the employment permit fee in highly demanded areas where
there are significant skills shortages in Ireland (provided they meet the criteria for
obtaining the permit) would contribute to smoothing the transition to work.
Improving environmental sustainabilityEnsuring an environmental sustainable pattern of growth is also a critical part of
improving well-being in the medium-term. Clean water and air, less waste and its efficient
disposal and uncongested cities are key elements of high standards of living and better
quality of life. Fostering clean technologies, products and services by the business sector
can help make Ireland more resilient to volatility in the price of fossil fuels. Developing
green technologies, especially in areas of comparative advantage such as agriculture, can
contribute to higher productivity growth and employment opportunities at a variety of skill
levels in rural areas.
The Irish Environmental Protection Agency (EPA) estimates that without new
initiatives Ireland’s greenhouse gas emissions will exceed its EU mandated target for non-
ETS (Emission Trading System) emissions for the period 2013-2020 (Table 4; EPA, 2015). The
government is developing new energy and low-carbon initiative policies as part of the
development of a National Climate Change Mitigation Plan and the establishment of cross-
sectoral coordination processes and commitments through the soon-to-be-enacted
Climate Action and Low Carbon Development Bill 2015. Achieving sustainability goals will
Table 4. Climate change scorecardGreenhouse gas emissions, thousands tons of carbon dioxide (CO2) equivalent1
Year Actual Target
Total greenhouse gas emissions 1990 55 246 …
2000 68 216 …
2008-12 308 509 314 200
2020 .. Single EU-wide cap of 20% below 1990 em
Emissions Trading System (ETS) 2008-12
2013-20 … Single EU-wide cap of 21% below 2005 em
Non-ETS greenhouse gas emissions 2008-12 219 000
2020 … Reduce emissions 20% below 2005 emiss
Non-ETS EU annual emissions allocation (AEA) target 2020 37 500
Renewable electricity (% of total electricity generation) 1990
2002 7%
2013 21%
2020 …
Area with greatest potential to reduce emissions Agriculture, buildings and transport
1. Excluding land-use, land-use change and forestry (LULUCF).Source: OECD (2014), “Greenhouse gas emissions”, OECD Environment Statistics (database); EC (2014), Technical Paper: Kyoto AmMechanism Report, 30 April 2014 OECD (2015), OECD Electricity and Heat Generation (database); Irish Environmental Protection Agenc(2013) Ireland’s Greenhouse Gas Emission Projections 2012-2030.
OECD ECONOMIC SURVEYS: IRELAND 2015 © OECD 2015 39
ASSESSMENT AND RECOMMENDATIONS
necessarily involve public support, but it is important that realisation of these goals is
supported and promoted on the basis of least cost interventions, and market-based tools.
A promising low-cost route is to step up programmes to improve energy efficiency of
housing (Ameli et al., 2015), which can help not only reduce GHG emissions but also
improve health and equity outcomes.
Urban sprawl is a problem, especially in Dublin. It creates air pollution and congestion,
which are becoming apparent again with the return to robust economic growth.
Sustainable urban and housing planning, now focused on increasing density of the
metropolitan area, will help to increase the viability of public transport that can not only
help reduce emissions but also increase the welfare of all citizens, especially those on
lower-incomes. A return to healthier public finances should facilitate greater public
investment in public transport, infrastructure and services, which was heavily cut during
the crisis. However, projects should be evaluated on an ex-ante basis. The coverage of the
public transport network and the extent of bike lanes are below European city averages
(EIU, 2009). A priority for public capital spending, and complementary to the government’s
expansion of social housing policy, should be increasing urban public transport, especially
to more deprived parts of the metropolitan area. The Dublin bike scheme has been
significantly expanded since 2009 and cycling trips into Dublin City have doubled
since 2006. Further dedicated cycling lanes and expansion of the Dublin bike scheme
would also help to cheaply reduce carbon emissions as well as improve labour market
access and social inclusion of those on lower incomes.
Water stress is among the lowest in the OECD, but in some areas household water
quality is an issue due to under-investment (EPA, 2015a) and dairy sector expansion poses
new challenges. In a welcome move the government introduced household water charges,
which are still among the lowest in the OECD. This new funding mechanism has been
introduced in tandem with significant reforms of the water sector in Ireland, to improve
the overall governance from a Water Framework Directive implementation perspective,
and to bring a greater strategic approach and increased efficiency to investment through
the establishment of a national public water utility, Irish Water. The introduction of
household water charges should be accompanied by a well-communicated programme of
infrastructure renewal. This can help to improve public acceptance of the charges and Irish
Water’s programme to fix leaks is promising in this regard. The expansion of dairying
following the removal of EU quotas should be accompanied by more innovation to mitigate
negative air and water quality side-effects. Although slowly improving, the development of
environmental technologies appears to be modest by OECD standards. One avenue to boost
this quickly would be to target foreign investment by an “anchor” multinational leader in
dairy related environmental technologies, coupled with greater funding to the public
research organisation, Teagasc, from a levy on the dairy industry.
Household waste per capita has been one of the highest in the OECD but new policies
are now reducing it. Landfill levy charges have been increased significantly to discourage
landfill use, which is now declining: for the first time, the amount of waste recycled
nationally in 2014 exceeded the total waste landfilled. A new “3-bin” household waste
separation system is being progressively introduced and from July 2016 households will
pay by weight for waste, thereby incentivising further reduction in waste generation. In
addition, a new thermal waste treatment plant is due to come on stream in 2017. These
efforts could be complemented with greater incentives for firms via taxation and direct
OECD ECONOMIC SURVEYS: IRELAND 2015 © OECD 201540
ASSESSMENT AND RECOMMENDATIONS
support to innovate to reduce the amount of packaging material and increase the
recyclability of packaging material.
Bibliography
Ameli, N. and N. Brandt (2015), “What Impedes Household Investment in Energy Efficiency andRenewable Energy?”, OECD Economics Department Working Papers, No. 1222, OECD Publishing, Paris,http://dx.doi.org/10.1787/5js1j15g2f8n-en.
Barry, F., H. Goerg and E. Strobl (2003), “Foreign Direct Investment, Agglomerations and DemonstrationEffects: An Empirical Investigation”, Weltwirtschaftliches Archiv, Vol. 139, pp. 583-600.
Bravo Biosca, A., C. Criscuolo and C. Menon (2013),”What Drives the Dynamics of Business Growth?”,OECD Science, Technology and Industry Policy Papers, No. 1.
Busom, I., B. Corchuelo and E. Martínez-Ros (2014,) “Tax Incentives… or Subsidies for Business R&D?,Small Business Economics, Vol. 43, pp. 571-596.
Causa, O. and Å. Johansson (2010), “Intergenerational Social Mobility in OECD Countries”, OECD Journal:Economic Studies, Vol. 2010/1, http://dx.doi.org/10.1787/eco_studies-2010-5km33scz5rjj.
Central Bank of Ireland (2014), Macrofinancial Review, Volume 2, Dublin.
Central Bank of Ireland (2015), Macrofinancial Review, Volume 1, Dublin.
Claessens, S. (2014), “An Overview of Macroprudential Policy Tools”, IMF Working Papers, No. 214.
Connolly, P. (2014), “A Tech Ecosystem Develops in Silicon Docks: The Rise of Dublin as a Global techHub”, Pamela Newenham (ed.) Liberties Press, Dublin.
Corrado, C., J. Haskel, C. Jona-Lasinio and M. Iommi (2014), “Internationally comparable macro-estimates of investment in intangible assets at the industry level: INTAN – Invest” available atwww.INTAN-Invest.net.
Czarnitsk, D. and J. Macintosh (2006), “Crowding and Private Equity: Canadian Evidence”, Journal ofBusiness Venturing, Vol. 21 (5), pp569-609, September.
Department of Environment, Community and Local Government (DECLG) (2014), Support, Supply andReform, November 2014.
Department of Justice and Equality (2014), Report of the Expert Group on Repossessions, Dublin.
Department of Jobs, Enterprise and Innovation (DJEI) (2014), State Investment in Research and Development2013-2014.
Department of Taoiseach (2014), Draft National Risk Assessment.
Economist Intelligence Unit (EIU) (2009), European Green City Index, available at: www.siemens.com/press/pool/de/events/corporate/2009-12-Cop15/European_Green_City_Index.pdf.
Environment Protection Agency (EPA) (2015), Ireland’s Greenhouse Gas Emission Projections 2014-2035.
Environment Protection Agency (EPA) (2015a), Drinking Water Report 2013.
Fitzgerald, J. (2013), “The Effect of Redomiciled Plcs on GNP and the Irish Balance of Payments, ESRIQuarterly Economic Commentary, Spring 2013.
Hanafin, S. (2014), “Report on the Quality of Pre-school Services: Analysis of Pre-school InspectionReports”, Dublin: Tusla, Child and Family Agency.
Irish Fiscal Advisory Council (IFAC) (2015), Fiscal Assessment Report, June 2015.
Jin, Y., P. Lenain and P. O’Brien (2014), “Macroprudential Policy Tools in Norway: StrengtheningFinancial System Resilience”, OECD Economics Department Working Papers, No. 1126, OECDPublishing, http://dx.doi.org/10.1787/5jz2mm2vbhjk-en.
Johansson, Å. et al. (2008), “Taxation and Economic Growth”, OECD Economics Department WorkingPapers, No. 620, OECD Publishing, http://dx.doi.org/10.1787/241216205486.
Kelly, E., S. McGuinness, P. O’Connell, A. González Pandiella, and D. Haugh (2015), “How Well DoesIreland Integrate Migrants into its Labour Market?”, OECD Economics Department Working Papers,forthcoming.
OECD ECONOMIC SURVEYS: IRELAND 2015 © OECD 2015 41
ASSESSMENT AND RECOMMENDATIONS
Kennedy, S., Y. Jin and D. Haugh (2015), “Taxes, Income and Economic Mobility in Ireland: NewEvidence from Tax Records Data”, OECD Economics Department Working Papers, forthcoming.
Lawless, M. (2013), “Age or Size? Contribution to Job Creation”, Central Bank of Ireland Research TechnicalPaper, 2/RT/13.
McCoy, S., E. Smyth, D. Watson and M. Darmody (2014), “Leaving School in Ireland: A LongitudinalStudy of Post School Transitions”, ESRI Research Series, No. 36.
McGuiness. S, P.J O'Connell, E. Kelly (2011), “Carrots without Sticks: The Impact of Job SearchAssistance in a Regime with Minimal Monitoring and Sanctions”, WP 409, Economic and SocialResearch Institute (ESRI), Ireland.
Mina. A, D. Connell and A. Hughes, “Models of Technology Development in Intermediate ResearchOrganisations”, Centre for Business Research, University of Cambridge, Working paper No. 396.
Motohashi, K. (2008), “Growing R&D Collaboration of Japanese Firms and Policy Implications forReforming the National Innovation System”, Asia Pacific Business Review, 14:3, pp. 339-361.
Novero, S. (2008), “Public Interventions Supporting Innovation in Small and Medium-Size Firms.Successes or Failures? A Probit Analysis”, Ceris-CNr Working Paper, No. 11.
O’Brien, D. and J. Scally (2012), “Cost Competitiveness and Export Performance of the Irish Economy”,Quarterly Bulletin, Central Bank of Ireland, 3 July.
O’Connor, B., T. Hynes, D. Haugh and P. Lenain (2015), “The Distributional Consequences of Growth andEmployment Enhancing Tax and Welfare Changes in Ireland”, OECD Economics Department WorkingPapers, forthcoming.
OECD (2011), OECD Report on Experiences with Structural Separation, OECD Publishing, Paris
OECD, (2013), Employment Outlook, OECD Publishing, Paris.
OECD (2013a), OECD Economic Survey of Ireland, OECD Publishing, Paris, http://dx.doi.org/10.1787/eco_surveys-irl-2013-en.
OECD (2014), “Policies to Promote Access to Good-Quality Affordable Housing, Working Party on SocialPolicy”, DELSA/WP1(2014)1.
OECD (2014a), OECD Youth Action Plan: Options for an Irish Youth Guarantee, January 2014, OECDPublishing.
OECD (2014b), OECD Science, Technology and Industry Outlook 2014, OECD Publishing, Paris, http://dx.doi.org/10.1787/sti_outlook-2014-en.
OECD (2014c), International Migration Outlook 2014, OECD Publishing, http://dx.doi.org/10.1787/sti_outlook-2014-en.
OECD (2015), New Approaches to SME and Entrepreneurship Financing: Broadening the Range of Instruments,OECD Publishing.
O’Farrell, R. (2015), “Have Wage Developments Improved Ireland’s International Competitiveness since2008?”, The Economic and Social Review, Vol. 43, No. ??.
Start Strong (2014), “Childcare: Business or Profession?”, available at www.startstrong.ie/files/Childcare_Business_or_Profession_Full_Report_Web_Version.pdf.
Westmore, B. (2014), “International Migration: the Relationship with Economic and Policy Factors inthe Home and Destination country”, OECD Economics Department Papers, No. 1140, OECD Publishing,http://dx.doi.org/10.1787/5jz123h8nd7l-en.
Worrall, J.J., “Game Change: Google Moves to the Docks”, in Silicon Docks: The Rise of Dublin as a GlobalTech Hub, Pamela Newenham (ed.), Liberties Press, Dublin.
OECD ECONOMIC SURVEYS: IRELAND 2015 © OECD 201542
OECD Economic Surveys: Ireland
© OECD 2015
Annex
Structural reform
The objective of this Annex is to review action taken since the previous Survey(October 2013) on the main recommendations from previous Surveys, which are notreviewed and assessed in the current Survey.
43
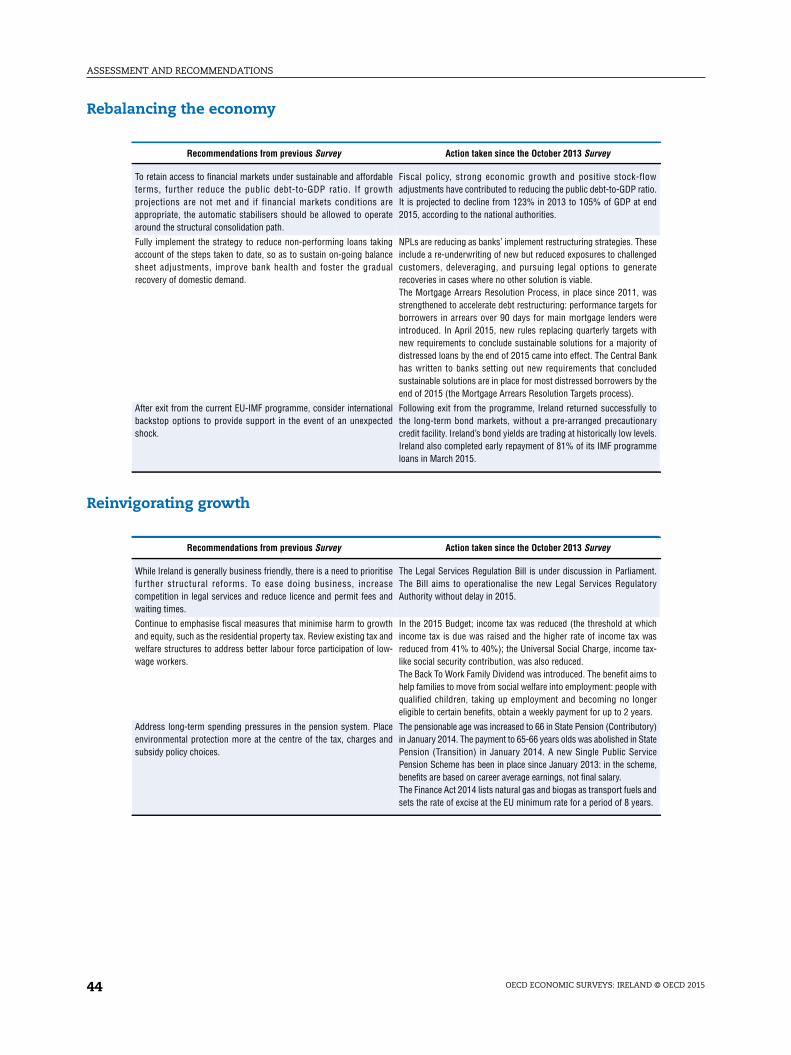
ASSESSMENT AND RECOMMENDATIONS
Rebalancing the economy
Reinvigorating growth
Recommendations from previous Survey Action taken since the October 2013 Survey
To retain access to financial markets under sustainable and affordableterms, further reduce the public debt-to-GDP ratio. If growthprojections are not met and if financial markets conditions areappropriate, the automatic stabilisers should be allowed to operatearound the structural consolidation path.
Fiscal policy, strong economic growth and positive stock-flowadjustments have contributed to reducing the public debt-to-GDP ratio.It is projected to decline from 123% in 2013 to 105% of GDP at end2015, according to the national authorities.
Fully implement the strategy to reduce non-performing loans takingaccount of the steps taken to date, so as to sustain on-going balancesheet adjustments, improve bank health and foster the gradualrecovery of domestic demand.
NPLs are reducing as banks’ implement restructuring strategies. Theseinclude a re-underwriting of new but reduced exposures to challengedcustomers, deleveraging, and pursuing legal options to generaterecoveries in cases where no other solution is viable.The Mortgage Arrears Resolution Process, in place since 2011, wasstrengthened to accelerate debt restructuring: performance targets forborrowers in arrears over 90 days for main mortgage lenders wereintroduced. In April 2015, new rules replacing quarterly targets withnew requirements to conclude sustainable solutions for a majority ofdistressed loans by the end of 2015 came into effect. The Central Bankhas written to banks setting out new requirements that concludedsustainable solutions are in place for most distressed borrowers by theend of 2015 (the Mortgage Arrears Resolution Targets process).
After exit from the current EU-IMF programme, consider internationalbackstop options to provide support in the event of an unexpectedshock.
Following exit from the programme, Ireland returned successfully tothe long-term bond markets, without a pre-arranged precautionarycredit facility. Ireland’s bond yields are trading at historically low levels.Ireland also completed early repayment of 81% of its IMF programmeloans in March 2015.
Recommendations from previous Survey Action taken since the October 2013 Survey
While Ireland is generally business friendly, there is a need to prioritisefurther structural reforms. To ease doing business, increasecompetition in legal services and reduce licence and permit fees andwaiting times.
The Legal Services Regulation Bill is under discussion in Parliament.The Bill aims to operationalise the new Legal Services RegulatoryAuthority without delay in 2015.
Continue to emphasise fiscal measures that minimise harm to growthand equity, such as the residential property tax. Review existing tax andwelfare structures to address better labour force participation of low-wage workers.
In the 2015 Budget; income tax was reduced (the threshold at whichincome tax is due was raised and the higher rate of income tax wasreduced from 41% to 40%); the Universal Social Charge, income tax-like social security contribution, was also reduced.The Back To Work Family Dividend was introduced. The benefit aims tohelp families to move from social welfare into employment: people withqualified children, taking up employment and becoming no longereligible to certain benefits, obtain a weekly payment for up to 2 years.
Address long-term spending pressures in the pension system. Placeenvironmental protection more at the centre of the tax, charges andsubsidy policy choices.
The pensionable age was increased to 66 in State Pension (Contributory)in January 2014. The payment to 65-66 years olds was abolished in StatePension (Transition) in January 2014. A new Single Public ServicePension Scheme has been in place since January 2013: in the scheme,benefits are based on career average earnings, not final salary.The Finance Act 2014 lists natural gas and biogas as transport fuels andsets the rate of excise at the EU minimum rate for a period of 8 years.
OECD ECONOMIC SURVEYS: IRELAND © OECD 201544
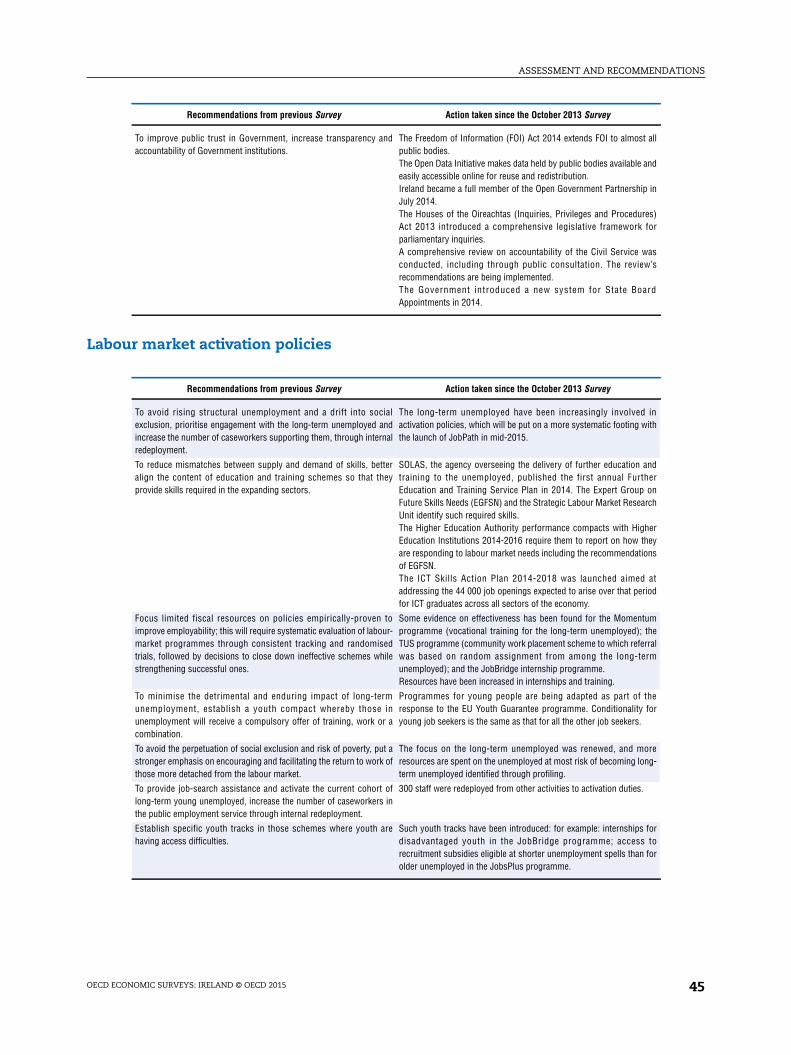
ASSESSMENT AND RECOMMENDATIONS
Labour market activation policies
To improve public trust in Government, increase transparency andaccountability of Government institutions.
The Freedom of Information (FOI) Act 2014 extends FOI to almost allpublic bodies.The Open Data Initiative makes data held by public bodies available andeasily accessible online for reuse and redistribution.Ireland became a full member of the Open Government Partnership inJuly 2014.The Houses of the Oireachtas (Inquiries, Privileges and Procedures)Act 2013 introduced a comprehensive legislative framework forparliamentary inquiries.A comprehensive review on accountability of the Civil Service wasconducted, including through public consultation. The review’srecommendations are being implemented.The Government introduced a new system for State BoardAppointments in 2014.
Recommendations from previous Survey Action taken since the October 2013 Survey
To avoid rising structural unemployment and a drift into socialexclusion, prioritise engagement with the long-term unemployed andincrease the number of caseworkers supporting them, through internalredeployment.
The long-term unemployed have been increasingly involved inactivation policies, which will be put on a more systematic footing withthe launch of JobPath in mid-2015.
To reduce mismatches between supply and demand of skills, betteralign the content of education and training schemes so that theyprovide skills required in the expanding sectors.
SOLAS, the agency overseeing the delivery of further education andtraining to the unemployed, published the first annual FurtherEducation and Training Service Plan in 2014. The Expert Group onFuture Skills Needs (EGFSN) and the Strategic Labour Market ResearchUnit identify such required skills.The Higher Education Authority performance compacts with HigherEducation Institutions 2014-2016 require them to report on how theyare responding to labour market needs including the recommendationsof EGFSN.The ICT Skills Action Plan 2014-2018 was launched aimed ataddressing the 44 000 job openings expected to arise over that periodfor ICT graduates across all sectors of the economy.
Focus limited fiscal resources on policies empirically-proven toimprove employability; this will require systematic evaluation of labour-market programmes through consistent tracking and randomisedtrials, followed by decisions to close down ineffective schemes whilestrengthening successful ones.
Some evidence on effectiveness has been found for the Momentumprogramme (vocational training for the long-term unemployed); theTUS programme (community work placement scheme to which referralwas based on random assignment from among the long-termunemployed); and the JobBridge internship programme.Resources have been increased in internships and training.
To minimise the detrimental and enduring impact of long-termunemployment, establish a youth compact whereby those inunemployment will receive a compulsory offer of training, work or acombination.
Programmes for young people are being adapted as part of theresponse to the EU Youth Guarantee programme. Conditionality foryoung job seekers is the same as that for all the other job seekers.
To avoid the perpetuation of social exclusion and risk of poverty, put astronger emphasis on encouraging and facilitating the return to work ofthose more detached from the labour market.
The focus on the long-term unemployed was renewed, and moreresources are spent on the unemployed at most risk of becoming long-term unemployed identified through profiling.
To provide job-search assistance and activate the current cohort oflong-term young unemployed, increase the number of caseworkers inthe public employment service through internal redeployment.
300 staff were redeployed from other activities to activation duties.
Establish specific youth tracks in those schemes where youth arehaving access difficulties.
Such youth tracks have been introduced: for example: internships fordisadvantaged youth in the JobBridge programme; access torecruitment subsidies eligible at shorter unemployment spells than forolder unemployed in the JobsPlus programme.
Recommendations from previous Survey Action taken since the October 2013 Survey
OECD ECONOMIC SURVEYS: IRELAND © OECD 2015 45
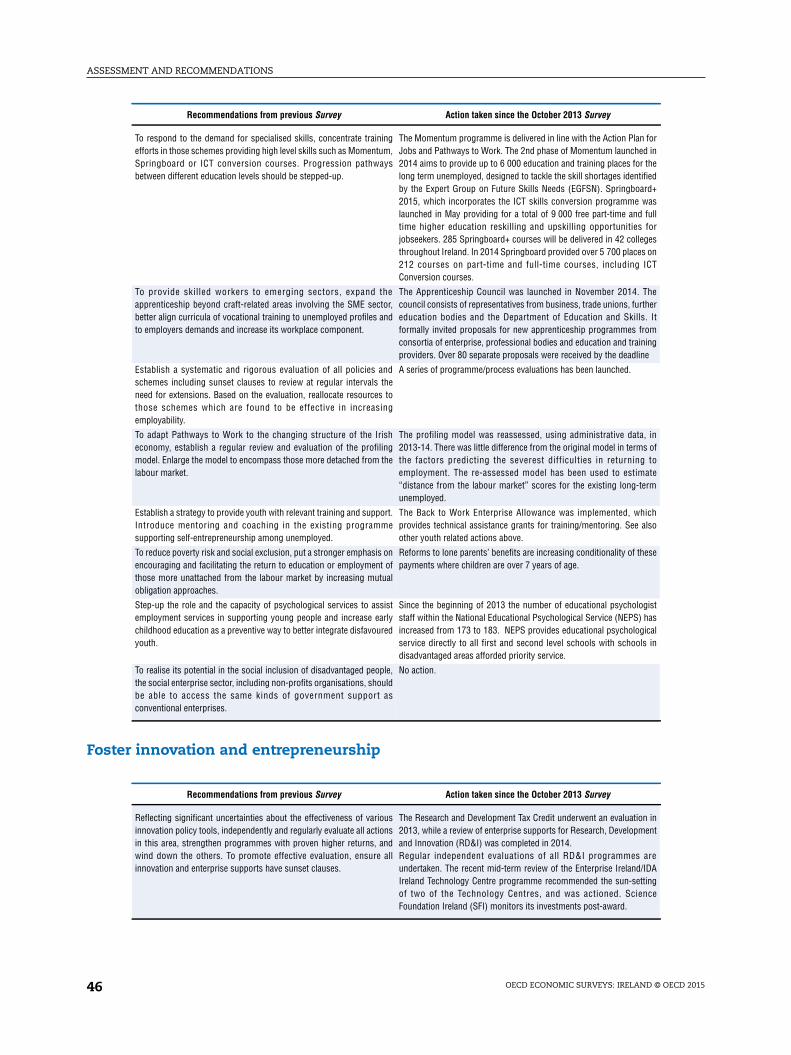
ASSESSMENT AND RECOMMENDATIONS
Foster innovation and entrepreneurship
To respond to the demand for specialised skills, concentrate trainingefforts in those schemes providing high level skills such as Momentum,Springboard or ICT conversion courses. Progression pathwaysbetween different education levels should be stepped-up.
The Momentum programme is delivered in line with the Action Plan forJobs and Pathways to Work. The 2nd phase of Momentum launched in2014 aims to provide up to 6 000 education and training places for thelong term unemployed, designed to tackle the skill shortages identifiedby the Expert Group on Future Skills Needs (EGFSN). Springboard+2015, which incorporates the ICT skills conversion programme waslaunched in May providing for a total of 9 000 free part-time and fulltime higher education reskilling and upskilling opportunities forjobseekers. 285 Springboard+ courses will be delivered in 42 collegesthroughout Ireland. In 2014 Springboard provided over 5 700 places on212 courses on part-time and full-time courses, including ICTConversion courses.
To provide skilled workers to emerging sectors, expand theapprenticeship beyond craft-related areas involving the SME sector,better align curricula of vocational training to unemployed profiles andto employers demands and increase its workplace component.
The Apprenticeship Council was launched in November 2014. Thecouncil consists of representatives from business, trade unions, furthereducation bodies and the Department of Education and Skills. Itformally invited proposals for new apprenticeship programmes fromconsortia of enterprise, professional bodies and education and trainingproviders. Over 80 separate proposals were received by the deadline
Establish a systematic and rigorous evaluation of all policies andschemes including sunset clauses to review at regular intervals theneed for extensions. Based on the evaluation, reallocate resources tothose schemes which are found to be effective in increasingemployability.
A series of programme/process evaluations has been launched.
To adapt Pathways to Work to the changing structure of the Irisheconomy, establish a regular review and evaluation of the profilingmodel. Enlarge the model to encompass those more detached from thelabour market.
The profiling model was reassessed, using administrative data, in2013-14. There was little difference from the original model in terms ofthe factors predicting the severest difficulties in returning toemployment. The re-assessed model has been used to estimate“distance from the labour market” scores for the existing long-termunemployed.
Establish a strategy to provide youth with relevant training and support.Introduce mentoring and coaching in the existing programmesupporting self-entrepreneurship among unemployed.
The Back to Work Enterprise Allowance was implemented, whichprovides technical assistance grants for training/mentoring. See alsoother youth related actions above.
To reduce poverty risk and social exclusion, put a stronger emphasis onencouraging and facilitating the return to education or employment ofthose more unattached from the labour market by increasing mutualobligation approaches.
Reforms to lone parents’ benefits are increasing conditionality of thesepayments where children are over 7 years of age.
Step-up the role and the capacity of psychological services to assistemployment services in supporting young people and increase earlychildhood education as a preventive way to better integrate disfavouredyouth.
Since the beginning of 2013 the number of educational psychologiststaff within the National Educational Psychological Service (NEPS) hasincreased from 173 to 183. NEPS provides educational psychologicalservice directly to all first and second level schools with schools indisadvantaged areas afforded priority service.
To realise its potential in the social inclusion of disadvantaged people,the social enterprise sector, including non-profits organisations, shouldbe able to access the same kinds of government support asconventional enterprises.
No action.
Recommendations from previous Survey Action taken since the October 2013 Survey
Reflecting significant uncertainties about the effectiveness of variousinnovation policy tools, independently and regularly evaluate all actionsin this area, strengthen programmes with proven higher returns, andwind down the others. To promote effective evaluation, ensure allinnovation and enterprise supports have sunset clauses.
The Research and Development Tax Credit underwent an evaluation in2013, while a review of enterprise supports for Research, Developmentand Innovation (RD&I) was completed in 2014.Regular independent evaluations of all RD&I programmes areundertaken. The recent mid-term review of the Enterprise Ireland/IDAIreland Technology Centre programme recommended the sun-settingof two of the Technology Centres, and was actioned. ScienceFoundation Ireland (SFI) monitors its investments post-award.
Recommendations from previous Survey Action taken since the October 2013 Survey
OECD ECONOMIC SURVEYS: IRELAND © OECD 201546
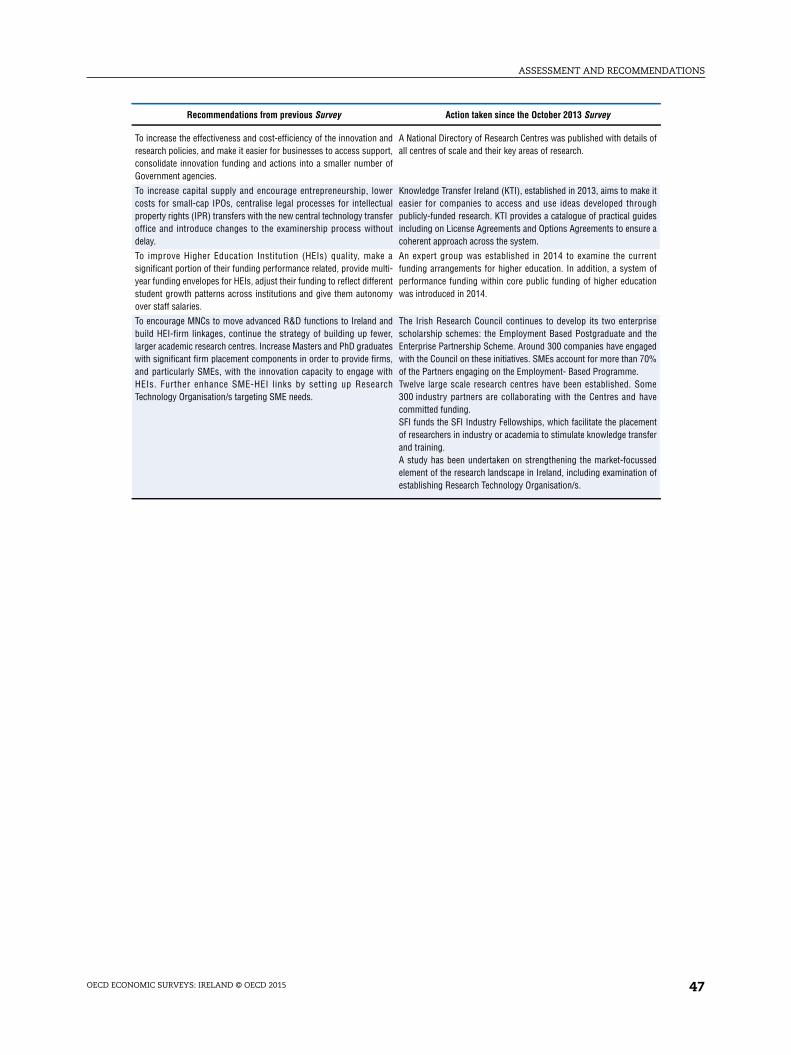
ASSESSMENT AND RECOMMENDATIONS
To increase the effectiveness and cost-efficiency of the innovation andresearch policies, and make it easier for businesses to access support,consolidate innovation funding and actions into a smaller number ofGovernment agencies.
A National Directory of Research Centres was published with details ofall centres of scale and their key areas of research.
To increase capital supply and encourage entrepreneurship, lowercosts for small-cap IPOs, centralise legal processes for intellectualproperty rights (IPR) transfers with the new central technology transferoffice and introduce changes to the examinership process withoutdelay.
Knowledge Transfer Ireland (KTI), established in 2013, aims to make iteasier for companies to access and use ideas developed throughpublicly-funded research. KTI provides a catalogue of practical guidesincluding on License Agreements and Options Agreements to ensure acoherent approach across the system.
To improve Higher Education Institution (HEIs) quality, make asignificant portion of their funding performance related, provide multi-year funding envelopes for HEIs, adjust their funding to reflect differentstudent growth patterns across institutions and give them autonomyover staff salaries.
An expert group was established in 2014 to examine the currentfunding arrangements for higher education. In addition, a system ofperformance funding within core public funding of higher educationwas introduced in 2014.
To encourage MNCs to move advanced R&D functions to Ireland andbuild HEI-firm linkages, continue the strategy of building up fewer,larger academic research centres. Increase Masters and PhD graduateswith significant firm placement components in order to provide firms,and particularly SMEs, with the innovation capacity to engage withHEIs. Further enhance SME-HEI links by setting up ResearchTechnology Organisation/s targeting SME needs.
The Irish Research Council continues to develop its two enterprisescholarship schemes: the Employment Based Postgraduate and theEnterprise Partnership Scheme. Around 300 companies have engagedwith the Council on these initiatives. SMEs account for more than 70%of the Partners engaging on the Employment- Based Programme.Twelve large scale research centres have been established. Some300 industry partners are collaborating with the Centres and havecommitted funding.SFI funds the SFI Industry Fellowships, which facilitate the placementof researchers in industry or academia to stimulate knowledge transferand training.A study has been undertaken on strengthening the market-focussedelement of the research landscape in Ireland, including examination ofestablishing Research Technology Organisation/s.
Recommendations from previous Survey Action taken since the October 2013 Survey
OECD ECONOMIC SURVEYS: IRELAND © OECD 2015 47
The Irish economy is growing strongly, but there is a risk many households will be left behind despite robust growth. High joblessness especially among the low-educated and skill-biased wage differentials have induced high market income inequality, among the highest in the OECD. Ireland’s comprehensive welfare system provides a broad range of social benefits, which keeps jobless households out of poverty, but this reduces the financial incentives to work, especially for families with children. Structural unemployment is also explained by the lack of skills required to find employment in the Irish labour market, where the presence of multinational enterprises increases the reward for high skills and the penalty for poor skills. With the unemployed pool lacking the right skills and financial incentives, employers tend to resort to foreign workers, a practice facilitated by the well-functioning migration system. Getting more people into work is important to share the benefits of the recovery as widely as possible. This requires building up work capacity, especially by improving jobseekers’ training, and ensuring welfare recipients honour their Job Path commitments in return. More needs to be done to increase incentive to work by reducing welfare and low-income traps. This should be done by shifting the tax burden from labour to indirect taxes in a progressive way that does not harm the lowest income groups.
The Irish labour market is exceptionally open to international migration flows, thus making labour supply highly responsive to changes in cyclical conditions. Immigration also provides the skills that the Irish economy needs.. Prior to the recession, it provided labour for the construction sector. The crisis triggered a sharp reversal in migration flows, with immigration suddenly halting and emigration increasing. A large proportion of emigration is highly qualified, as is a high proportion of immigration. This pattern of “brain exchange” can contribute to reducing skills mismatches, but also raises the challenge of remaining attractive for skilled workers. This chapter examines how the crisis has affected migration, how related policies have evolved and proposes avenues to spread the benefits of migration beyond the scope of multinational enterprises, in particular to Irish SMEs. The proportion of Irish-born population living abroad is very large and the chapter also analyses what role return migration could play, what policies are in place to maintain links with emigrant’s communities abroad and how they can be strengthened. Ireland has recently experienced, for the first time in its history, largescale immigration. As a result, it currently hosts a large and very heterogeneous immigrant community, with diverging challenges and needs. Getting integration policies right is therefore a complex, but crucial task. The chapter identifies what are the key challenges in this area and proposes some avenues to foster the labour market integration of immigrants. Ireland is also starting to experience challenges associated with the integration of second generation immigrants. To respond to those challenges, the chapter recommends early action in education and social domains.
D d
: