Embed Size (px)
Citation preview
OECD Environmental IndicatorsTOWARDS SUSTAINABLE DEVELOPMENT
ENVIRONMENT
OE
CD
En
viro
nm
en
tal In
dic
ato
rsT
OW
AR
DS
SU
STA
INA
BL
E D
EV
EL
OP
ME
NT
OECDEnvironmentalIndicatorsTOWARDS SUSTAINABLE DEVELOPMENT
«Interest in sustainable development and awareness of the international dimension of environmental problems, have stimulated governments to track and chart environmental progress and its links with economic conditions and trends.
This publication includes key environmental indicators endorsed by OECD EnvironmentMinisters and the broader OECD Core Set of environmental indicators. It contributes to measuring environmental performance and progress towards sustainable development.
Organised by issues such as climate change, air pollution, biodiversity, waste or waterresources, this book provides essential information for all those interested in the environment and in the sustainable development. ENVIRONMENT
www.oecd.org
-:HSTCQE=V]\V]Y:ISBN 92-64-18718-997 2001 09 1 P
All OECD books and periodicals are now available on line
www.SourceOECD.org
2001
2001 2001
ORGANISATION FOR ECONOMIC CO-OPERATION AND DEVELOPMENT
OECD Environmental Indicators
2001
TOWARDS SUSTAINABLEDEVELOPMENT
ORGANISATION FOR ECONOMIC CO-OPERATION AND DEVELOPMENT
Pursuant to Article 1 of the Convention signed in Paris on 14th December 1960, and which came intoforce on 30th September 1961, the Organisation for Economic Co-operation and Development (OECD)shall promote policies designed:
– to achieve the highest sustainable economic growth and employment and a rising standard ofliving in Member countries, while maintaining financial stability, and thus to contribute to thedevelopment of the world economy;
– to contribute to sound economic expansion in Member as well as non-member countries in theprocess of economic development; and
– to contribute to the expansion of world trade on a multilateral, non-discriminatory basis inaccordance with international obligations.
The original Member countries of the OECD are Austria, Belgium, Canada, Denmark, France,Germany, Greece, Iceland, Ireland, Italy, Luxembourg, the Netherlands, Norway, Portugal, Spain,Sweden, Switzerland, Turkey, the United Kingdom and the United States. The following countriesbecame Members subsequently through accession at the dates indicated hereafter: Japan(28th April 1964), Finland (28th January 1969), Australia (7th June 1971), New Zealand (29th May 1973),Mexico (18th May 1994), the Czech Republic (21st December 1995), Hungary (7th May 1996), Poland(22nd November 1996), Korea (12th December 1996) and the Slovak Republic (14th December 2000). TheCommission of the European Communities takes part in the work of the OECD (Article 13 of the OECDConvention).
Publié en français sous le titre :
INDICATEURS D’ENVIRONNEMENT DE L’OCDE2001
Vers un développement durable
© OECD 2001Permission to reproduce a portion of this work for non-commercial purposes or classroom use should be obtainedthrough the Centre français d’exploitation du droit de copie (CFC), 20, rue des Grands-Augustins, 75006 Paris,France, tel. (33-1) 44 07 47 70, fax (33-1) 46 34 67 19, for every country except the United States. In the United Statespermission should be obtained through the Copyright Clearance Center, Customer Service, (508)750-8400,222 Rosewood Drive, Danvers, MA 01923 USA, or CCC Online: www.copyright.com. All other applications forpermission to reproduce or translate all or part of this book should be made to OECD Publications, 2, rue André-Pascal,75775 Paris Cedex 16, France.
- 3 -
��������
Concerns about whether development is sustainable from an economic, environmental andsocial point of view have prompted a number of countries to further move towards policies focusing onpollution prevention, integration of environmental concerns in economic and sectoral decisions, andinternational co-operation. There is also increasing interest in evaluating how well governments areimplementing their policies and how well they are satisfying their domestic objectives and internationalcommitments. These demands have led to the development of environmental indicators as a tool fordecision making and for assessing countries’ environmental performance.
As part of their commitment to transparency and accountability, and to better information ofthe public, OECD Member countries have recently also expressed increasing interest in a reducednumber of environmental indicators selected from existing larger sets to draw public attention to keyenvironmental issues of concern and to inform about progress made.
The OECD work programme on environmental indicators has led to several sets of indicatorseach responding to a specific purpose: an OECD Core Set of environmental indicators to measureenvironmental progress, and various sets of indicators to integrate environmental concerns in sectoralpolicies (e.g. energy, transport, agriculture). Indicators are also derived from natural resource andenvironmental expenditure accounts.
The present report is one of the products of this OECD work programme on environmentalindicators. It is updated at regular intervals and includes environmental indicators from the OECDCore Set, as well as selected socio-economic and sectoral indicators having an environmentalsignificance. It further includes a selection of key environmental indicators, endorsed by OECDEnvironment Ministers at their meeting in May 2001. The report highlights the linkages betweenenvironmental indicators, environmental performance and sustainable development, and thus providesa building block for the environmental component of sustainable development indicators.
This report was prepared by the OECD Secretariat, but its successful completion dependedon personal or official contributions by many individuals in Member countries, and on the work andsupport of the OECD Working Group on Environmental Information and Outlooks. This report ispublished on the responsibility of the Secretary General of the OECD.
Joke Waller-HunterDirector, OECD Environment Directorate
- 4 -
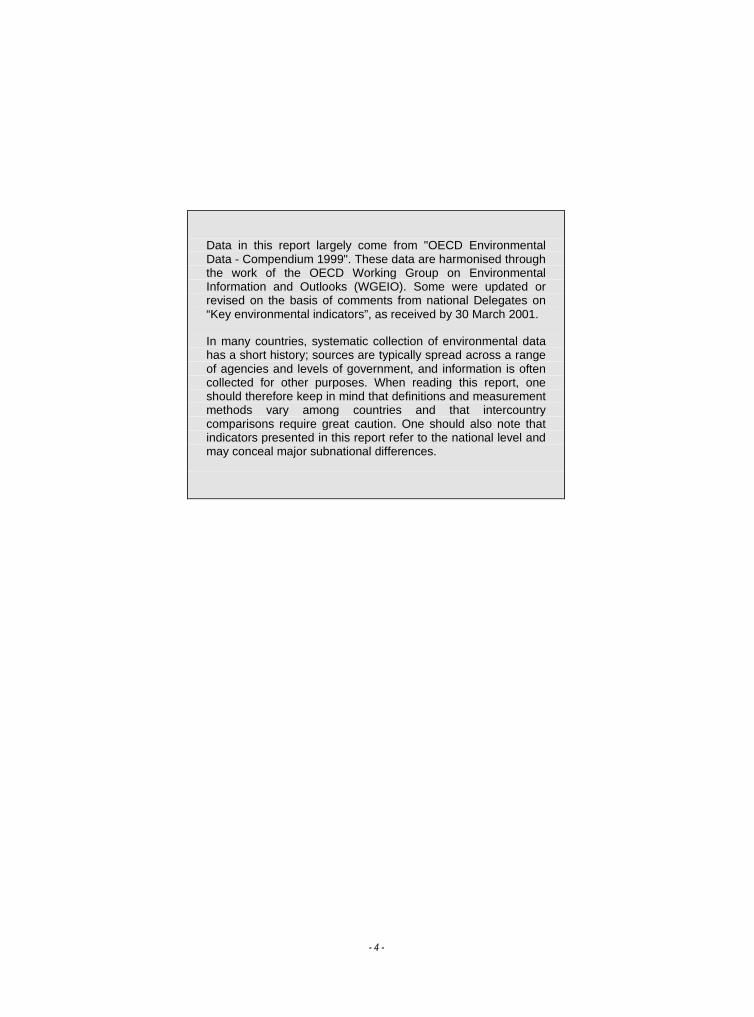
Data in this report largely come from "OECD EnvironmentalData - Compendium 1999". These data are harmonised throughthe work of the OECD Working Group on EnvironmentalInformation and Outlooks (WGEIO). Some were updated orrevised on the basis of comments from national Delegates on“Key environmental indicators”, as received by 30 March 2001.
In many countries, systematic collection of environmental datahas a short history; sources are typically spread across a rangeof agencies and levels of government, and information is oftencollected for other purposes. When reading this report, oneshould therefore keep in mind that definitions and measurementmethods vary among countries and that intercountrycomparisons require great caution. One should also note thatindicators presented in this report refer to the national level andmay conceal major subnational differences.
- 5 -
��������� �� ��
I. INTRODUCTION .................................................................................................................................... 7
II. ENVIRONMENTAL INDICATORS .......................................................................................................11
♦ CLIMATE CHANGE .................................................................................................................................. 131. CO2 emission intensities 152. greenhouse gas concentrations 18
♦ OZONE LAYER DEPLETION ................................................................................................................... 193. ozone depleting substances 214. stratospheric ozone 23
♦ AIR QUALITY............................................................................................................................................ 255. air emission intensities 276. urban air quality 32
♦ WASTE...................................................................................................................................................... 357. waste generation 378. waste recycling 40
♦ WATER QUALITY..................................................................................................................................... 419. river quality 4310. waste water treatment 45
♦ WATER RESOURCES ............................................................................................................................. 4711. intensity of use of water resources 4912. public water supply and price 51
♦ FOREST RESOURCES............................................................................................................................ 5313. intensity of use of forest resources 5514. forest and wooded land 56
♦ FISH RESOURCES .................................................................................................................................. 5715. fish catches and consumption: national 5916. fish catches and consumption: global and regional 60
♦ BIODIVERSITY ......................................................................................................................................... 6317. threatened species 6518. protected areas 66
III. SOCIO-ECONOMIC INDICATORS .....................................................................................................69
♦ GDP AND POPULATION.......................................................................................................................... 7119. gross domestic product 7320. population growth and density 74
♦ CONSUMPTION ....................................................................................................................................... 7521. private consumption 7722. government consumption 78
♦ ENERGY ................................................................................................................................................... 7923. energy intensities 8124. energy mix 8225. energy prices 83
♦ TRANSPORT ............................................................................................................................................ 8526. road traffic and vehicle intensities 8727. road infrastructure densities 8928. road fuel prices and taxes 91
♦ AGRICULTURE......................................................................................................................................... 9329. intensity of use of nitrogen and phosphate fertilisers 9530. nitrogen balances 9731. livestock densities 9832. intensity of use of pesticides 99
♦ EXPENDITURE....................................................................................................................................... 10133. pollution abatement and control expenditure 10334. official development assistance 105
IV. KEY ENVIRONMENTAL INDICATORS............................................................................................107
V. OECD FRAMEWORK FOR ENVIRONMENTAL INDICATORS ........................................................131
VI. TECHNICAL ANNEX ........................................................................................................................141


- 7 -
���� ���������
Introduction
OECD Environmental Indicators 2001 - 8 -
THE OECD WORK ON ENVIRONMENTAL INDICATORS
PURPOSES The OECD programme on environmental indicators has three major purposes:
♦ keeping track of environmental progress;♦ ensuring that environmental concerns are taken into account when policies are
formulated and implemented for various sectors, such as transport, energy andagriculture;
♦ ensuring similar integration of environmental concerns into economic policies, mainlythrough environmental accounting.
CONCRETERESULTS1
The work on indicators is carried out in close co-operation with OECD Member countries. Ithas led to:
♦ agreement by OECD countries to use the pressure-state-response (PSR) model as acommon harmonised framework;
♦ identification and definition of several sets of indicators based on their policy relevance,analytical soundness and measurability;
♦ measurement and publication of these indicators for a number of countries.
USES The OECD’s environmental indicators are regularly used in environmental performancereviews; they are a valuable way to monitor the integration of economic and environmentaldecision making, to analyse environmental policies and to gauge the results. Beyond theirapplication in OECD environmental performance reviews, these indicators also contribute tofollow-up work on the OECD environmental strategy and to the broader objective of reportingon sustainable development.
THE OECD SETS OF ENVIRONMENTAL INDICATORS
Work carried out to date includes three categories of indicators, each corresponding to a specific purpose andframework.
TRACKINGPROGRESS:
THE OECD CORESET OF
ENVIRONMENTALINDICATORS
The OECD Core Set is a set commonly agreed upon by OECD countries for OECD use. It ispublished regularly. The Core Set, of about 50 indicators, covers issues that reflect the mainenvironmental concerns in OECD countries. It incorporates major indicators derived fromsectoral sets as well as from environmental accounting. Indicators are classified following thePSR model:
♦ indicators of environmental pressures, both direct and indirect;♦ indicators of environmental conditions;♦ indicators of society’s responses.
PROMOTINGINTEGRATION:
OECD SECTORALINDICATORS
In addition, OECD sets of sectoral indicators focus on specific sectors. Indicators areclassified following an adjusted PSR model:
♦ sectoral trends of environmental significance,♦ their interactions with the environment (including positive and negative effects);♦ related economic and policy considerations.
PROMOTINGINTEGRATION:
ENVIRONMENTALACCOUNTING
Environmental indicators are also derived from the OECD work on environmental accountingfocusing on i) physical natural resource accounts, related to sustainable management ofnatural resources, and ii) environmental expenditure. Examples of these indicators are theintensity of natural resource use and the level and structure of pollution abatement andcontrol expenditure.
1. For further details on the OECD framework for environmental indicators, see page 131.
Introduction
- 9 - OECD Environmental Indicators 2001
���������
����������������������
� ���������������������
LINKS WITH NATIONAL AND OTHER INTERNATIONAL INITIATIVES
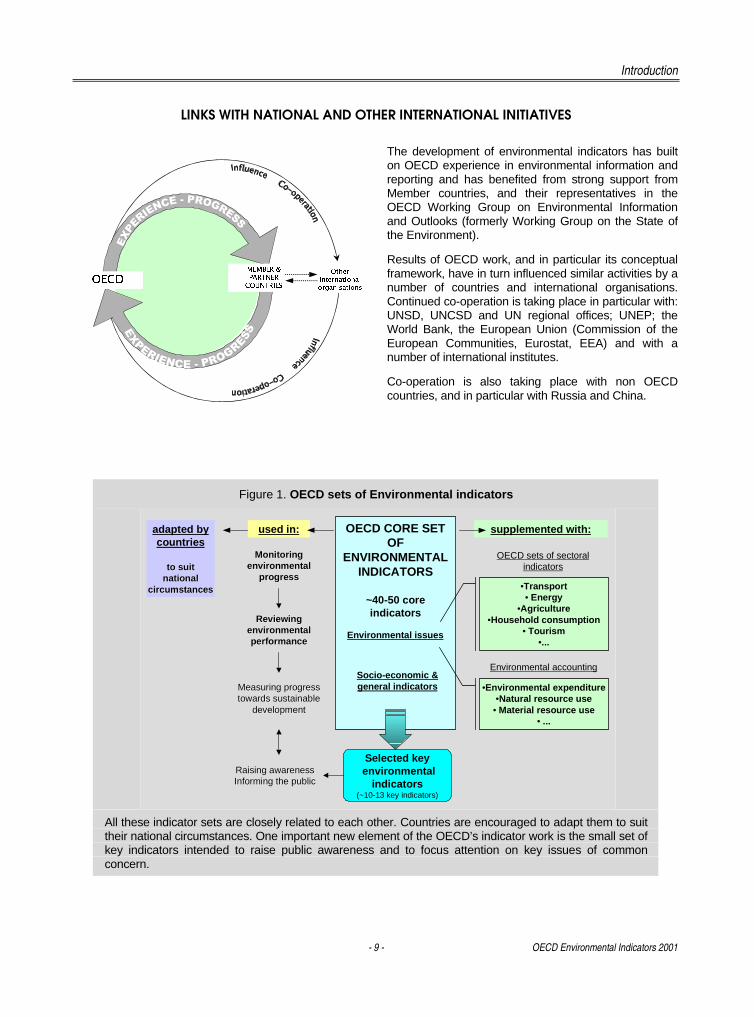
The development of environmental indicators has builton OECD experience in environmental information andreporting and has benefited from strong support fromMember countries, and their representatives in theOECD Working Group on Environmental Informationand Outlooks (formerly Working Group on the State ofthe Environment).
Results of OECD work, and in particular its conceptualframework, have in turn influenced similar activities by anumber of countries and international organisations.Continued co-operation is taking place in particular with:UNSD, UNCSD and UN regional offices; UNEP; theWorld Bank, the European Union (Commission of theEuropean Communities, Eurostat, EEA) and with anumber of international institutes.
Co-operation is also taking place with non OECDcountries, and in particular with Russia and China.
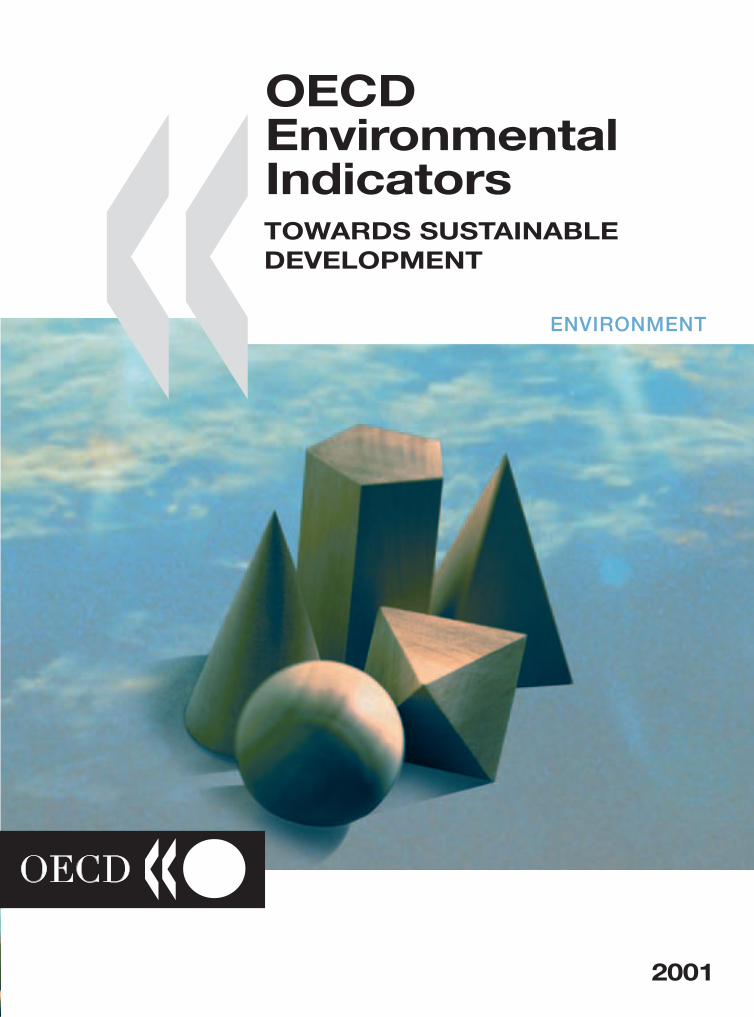
Figure 1. OECD sets of Environmental indicators
OECD CORE SETOF
ENVIRONMENTALINDICATORS
~40-50 coreindicators
Socio-economic &general indicators
Environmental issues
•Environmental expenditure•Natural resource use
• Material resource use• ...
Environmental accounting
OECD sets of sectoralindicators
•Transport• Energy
•Agriculture•Household consumption
• Tourism•...
MonitoringMonitoringenvironmentalenvironmental
progressprogress
ReviewingReviewingenvironmentalenvironmentalperformanceperformance
adapted bycountries
to suitto suitnationalnational
circumstancescircumstances
supplemented with:used in:
Selected key environmental
indicators(~10-13 key indicators)
Raising awarenessRaising awarenessInforming the publicInforming the public
Measuring progressMeasuring progresstowards sustainabletowards sustainable
developmentdevelopment
All these indicator sets are closely related to each other. Countries are encouraged to adapt them to suittheir national circumstances. One important new element of the OECD’s indicator work is the small set ofkey indicators intended to raise public awareness and to focus attention on key issues of commonconcern.
Introduction
OECD Environmental Indicators 2001 - 10 -
THE 2001 PUBLICATION
CONTENT The present publication is an update of the 1998 publication “Towards sustainabledevelopment – Environmental indicators”. It presents major indicators from the Core Set(Part II) as well as selected socio-economic and sectoral indicators with environmentalsignificance (Part III). It highlights links among environmental indicators, environmentalperformance and sustainable development.
Each section of indicators in Parts II and III includes:♦ a brief statement on the issue referred to and its importance for environmental
performance and sustainable development;♦ an overview of related OECD work and references, including a schematic description of
the conceptual framework in which the indicators are placed (i.e. the PSR model forOECD Core Set indicators and the adjusted PSR model for OECD sectoral indicators);
♦ a summary of major trends.
The publication further includes a small set of key environmental indicators published at theoccasion of the OECD meeting of Environment Ministers (Paris, 16 May 2001) and endorsedby Ministers as a tool for use in OECD work and for public information and communicationby OECD (Part IV).
INTERPRETATION The indicators in this publication are those that are regularly used in the OECD’s analyticalwork and for which data are available for a majority of OECD countries. They are of varyingrelevance for different countries and have to be interpreted in context.
DATA ANDINDICATORS
The data used to calculate the indicators are based on those published in "OECDEnvironmental Data – Compendium 1999". They come from the OECD SIREN database,which is regularly updated with information from Member countries (through biennial datacollection using the OECD/Eurostat questionnaires on the state of the environment and onpollution abatement and control expenditure), from internal OECD sources and from otherinternational sources. No unique choice has been made as to the normalisation of theindicators; different denominators are used in parallel (e.g. GDP, number of inhabitants) tobalance the message conveyed.
PROSPECTS AND FUTURE WORK
The OECD experience shows that environmental indicators are cost-effective and powerful tools for trackingenvironmental progress and measuring environmental performance. However, experience also shows significantlags between the demand for environmental indicators, the related conceptual work and the actual capacity formobilising and validating underlying data. In the field of environmental statistics, differences among countries maybe considerable and the establishment of reliable and internationally comparable data calls for continuousmonitoring, analysis, treatment and checking.
Following the conceptual work that laid down the common framework and basic principles for developing sets ofinternational environmental indicators in the OECD context, continued efforts are being done by the OECD to:
♦ Improve the quality and comparability of existing indicators.♦ Develop concepts and data for medium term indicators.♦ Link the indicators more closely to domestic goals and international commitments.♦ Expand the indicator sets to cover social-environmental aspects.♦ Further integrate environmental and sectoral indicator sets in the broader set of OECD sustainable
development indicators.
This necessitates greater policy relevance and increased quality and timeliness of basic data sets, as well as acloser link between environmental data and existing economic and social information systems. It also necessitatesmore work to complement the indicators with information reflecting sub-national differences.

- 11 -
������������������ ������

- 13 -
������������
Industrialisation has increased emissions of greenhouses gases (GHG) from human activities,disturbing the radiative energy balance of the earth-atmosphere system. These gasesexacerbate the natural greenhouse effect, leading to temperature changes and other potentialconsequences for the earth’s climate. Land use changes and forestry also contribute to thegreenhouse effect by altering carbon sinks. Climate change is of concern mainly as relates toits impact on ecosystems (biodiversity), human settlements and agriculture, and possibleconsequences for other socio-economic activities that could affect global economic output.
Climate change could have major or significant effects on sustainable development.Performance can be assessed against domestic objectives and international commitments.The main international agreement is the United Nations Framework Convention on ClimateChange (FCCC) (Rio de Janeiro, 1992). The FCCC has been ratified by 186 parties.Industrialised countries, including those in transition to market economies, committed to takingmeasures aimed at stabilising GHG emissions by 2000 at 1990 levels. Its 1997 Kyoto Protocolestablishes differentiated national or regional emission reduction or limitation targets forindustrialised countries for 2008-12 and for the base year 1990. The targets arecomprehensive, covering CO2, CH4, N2O, PFCs, HFCs and SF6. The main challenge is tostabilise GHG concentrations in the atmosphere at a level that would prevent dangerousanthropogenic interference with the climate system and to further de-couple GHG emissionsfrom economic growth.
Indicators presented here relate to:
♦ CO2 emissions from energy use, showing total emissions as well as emission intensitiesper unit of GDP and per capita, and related changes since 1980. CO2 from combustion offossil fuels and biomass is a major contributor to the greenhouse effect and a key factor incountries’ ability to deal with climate change. All emissions presented here are gross directemissions, excluding sinks and indirect effects. In the absence of national inventories thatprovide a complete and consistent picture of all GHG emissions, energy-related CO2
emissions are used to reflect overall trends in direct GHG emissions. Information on fossilfuel share and intensity is given to reflect, at least partly, changes in energy efficiency andenergy mix, which are key in efforts to reduce atmospheric CO2 emissions.
♦ atmospheric concentrations of the greenhouse gases covered by the FCCC (CO2, CH4,N2O) and of selected ozone depleting substances controlled by the Montreal Protocol(page 19) that also play a role in the greenhouse effect (CFC-11, CFC-12, total gaseouschlorine). Data are from various monitoring sites that provide an indication of globalconcentrations and trends.
These indicators should be read in conjunction with other indicators from the OECD Core Setand in particular with indicators on energy efficiency and on energy prices and taxes. Theirinterpretation should take into account the structure of countries' energy supply, the relativeimportance of fossil fuels and of renewable energy, as well as climatic factors.
Climate change
OECD Environmental Indicators 2001 - 14 -
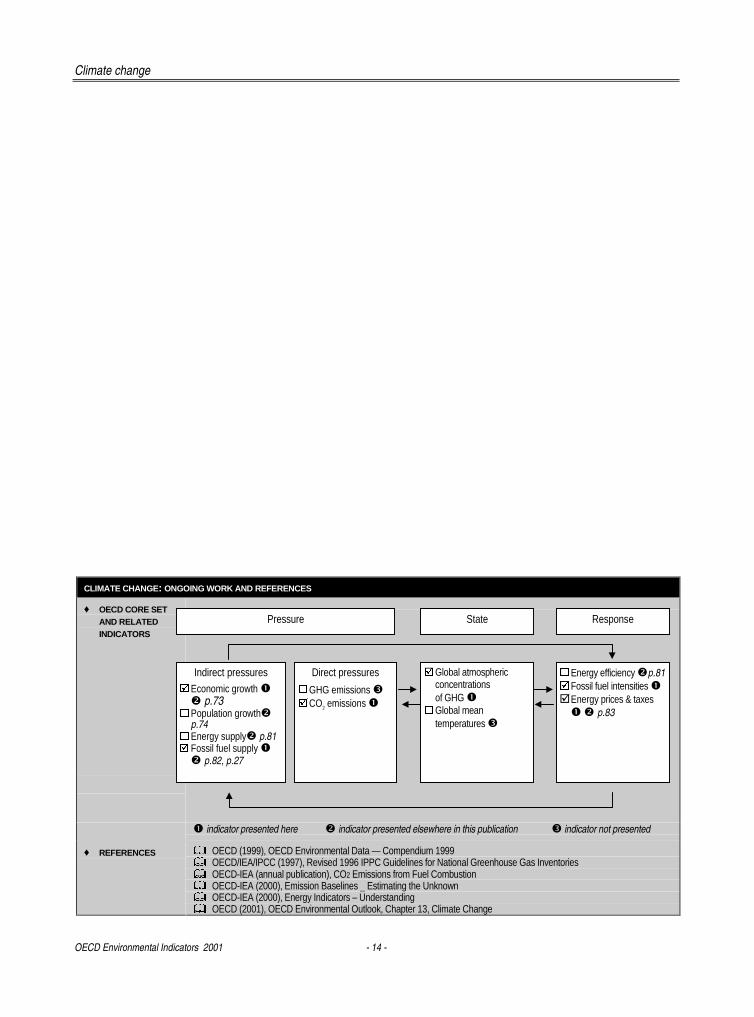
CLIMATE CHANGE: ONGOING WORK AND REFERENCES
♦ OECD CORE SETAND RELATEDINDICATORS
� indicator presented here � indicator presented elsewhere in this publication � indicator not presented
♦ REFERENCES � OECD (1999), OECD Environmental Data — Compendium 1999� OECD/IEA/IPCC (1997), Revised 1996 IPPC Guidelines for National Greenhouse Gas Inventories� OECD-IEA (annual publication), CO2 Emissions from Fuel Combustion� OECD-IEA (2000), Emission Baselines _ Estimating the Unknown� OECD-IEA (2000), Energy Indicators – Understanding� OECD (2001), OECD Environmental Outlook, Chapter 13, Climate Change
Pressure State Response
Indirect pressures� Economic growth �� p.73
� Population growth�p.74
� Energy supply� p.81� Fossil fuel supply �� p.82, p.27
� Global atmosphericconcentrationsof GHG �
� Global meantemperatures �
� Energy efficiency �p.81� Fossil fuel intensities �� Energy prices & taxes� � p.83
Direct pressures
� GHG emissions �� CO2 emissions �
Climate change
- 15 - OECD Environmental Indicators 2001
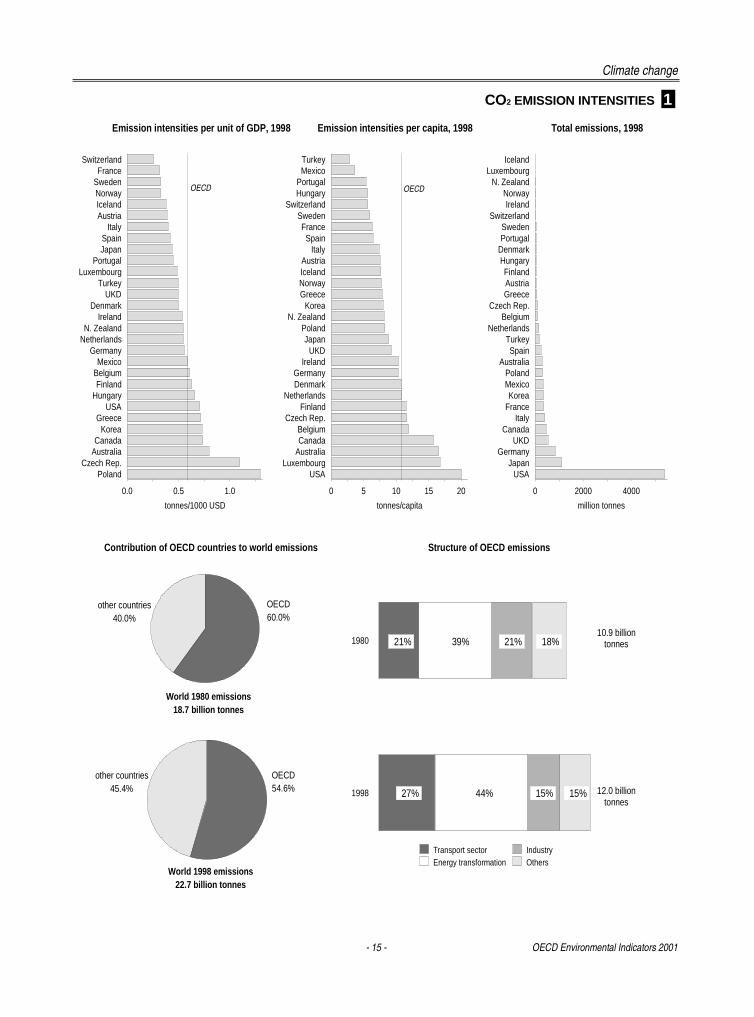
CO2 EMISSION INTENSITIES 1
TurkeyMexico
PortugalHungary
SwitzerlandSwedenFrance
SpainItaly
AustriaIcelandNorwayGreece
KoreaN. Zealand
PolandJapan
UKDIreland
GermanyDenmark
NetherlandsFinland
Czech Rep.BelgiumCanada
AustraliaLuxembourg
USA
0 5 10 15 20
tonnes/capita
IcelandLuxembourg
N. ZealandNorwayIreland
SwitzerlandSwedenPortugal
DenmarkHungaryFinlandAustriaGreece
Czech Rep.Belgium
NetherlandsTurkeySpain
AustraliaPolandMexicoKorea
FranceItaly
CanadaUKD
GermanyJapan
USA
0 2000 4000
million tonnes
SwitzerlandFrance
SwedenNorwayIcelandAustria
ItalySpainJapan
PortugalLuxembourg
TurkeyUKD
DenmarkIreland
N. ZealandNetherlands
GermanyMexico
BelgiumFinland
HungaryUSA
GreeceKorea
CanadaAustralia
Czech Rep.Poland
0.0 0.5 1.0
tonnes/1000 USD
OECDOECD
Emission intensities per unit of GDP, 1998 Emission intensities per capita, 1998 Total emissions, 1998
World 1980 emissions18.7 billion tonnes
other countries40.0%
OECD60.0%
World 1998 emissions22.7 billion tonnes
other countries45.4%
OECD54.6%
Contribution of OECD countries to world emissions Structure of OECD emissions
1980
1998
Transport sectorEnergy transformation
IndustryOthers
21% 39% 21% 18%
27% 44% 15% 15%
10.9 billion tonnes
12.0 billion tonnes
Climate change
OECD Environmental Indicators 2001 - 16 -
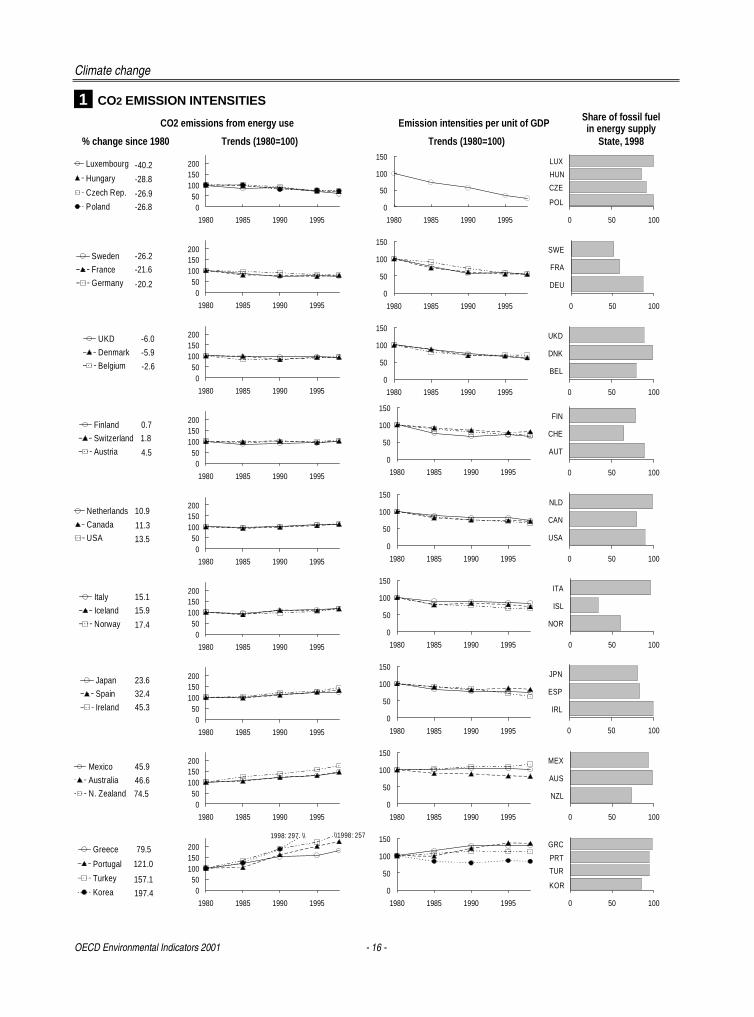
1 CO2 EMISSION INTENSITIES
CO2 emissions from energy use Emission intensities per unit of GDP Share of fossil fuelin energy supply
% change since 1980 Trends (1980=100) Trends (1980=100) State, 1998
050
100150200
1980 1985 1990 1995
0
50
100
150
1980 1985 1990 1995
-40.2
-28.8
-26.9
-26.8
Luxembourg
Hungary
Czech Rep.
Poland
050
100150200
1980 1985 1990 1995
050
100150200
1980 1985 1990 1995
050
100150200
1980 1985 1990 1995
050
100150200
1980 1985 1990 1995
050
100150200
1980 1985 1990 1995
050
100150200
1980 1985 1990 1995
\\1998: 2571998: 297 \\
050
100150200
1980 1985 1990 1995
0
50
100
150
1980 1985 1990 1995
0
50
100
150
1980 1985 1990 1995
0
50
100
150
1980 1985 1990 1995
0
50
100
150
1980 1985 1990 1995
0
50
100
150
1980 1985 1990 1995
0
50
100
150
1980 1985 1990 1995
0
50
100
150
1980 1985 1990 1995
0
50
100
150
1980 1985 1990 1995
HUN
POL
0 50 100
LUX
CZE
0 50 100
SWE
FRA
DEU
0 50 100
UKD
DNK
BEL
0 50 100
FIN
CHE
AUT
0 50 100
NLD
CAN
USA
0 50 100
ITA
ISL
NOR
0 50 100
JPN
ESP
IRL
0 50 100
MEX
AUS
NZL
PRT
KOR
0 50 100
GRC
TUR
-26.2
-21.6
-20.2
Sweden
France
Germany
-6.0
-5.9
-2.6
UKD
Denmark
Belgium
10.9
11.3
13.5
Netherlands
Canada
USA
15.1
15.9
17.4
Italy
Iceland
Norway
23.6
32.4
45.3
Japan
Spain
Ireland
79.5
121.0
157.1
197.4
Greece
Portugal
Turkey
Korea
0.7
1.8
4.5
Finland
Switzerland
Austria
45.9
46.6
74.5
Mexico
Australia
N. Zealand0
50100150200
1980 1985 1990 1995
Climate change
- 17 - OECD Environmental Indicators 2001
CO2 EMISSION INTENSITIES 1
CO2 emissions from energy use Fossil fuel supply Real end-use GDPTotal Emission intensities Share of Intensity energy prices
million per unit of GDP per capita total supply per unit of GDPtonnes % change % change t./1 000 USD % change tonnes/cap. % change % Toe/1 000 USD % change % change
1998 since 1980 since 1990 1998 since1980 1998 since1980 1998 1998 since 1980 since 1980
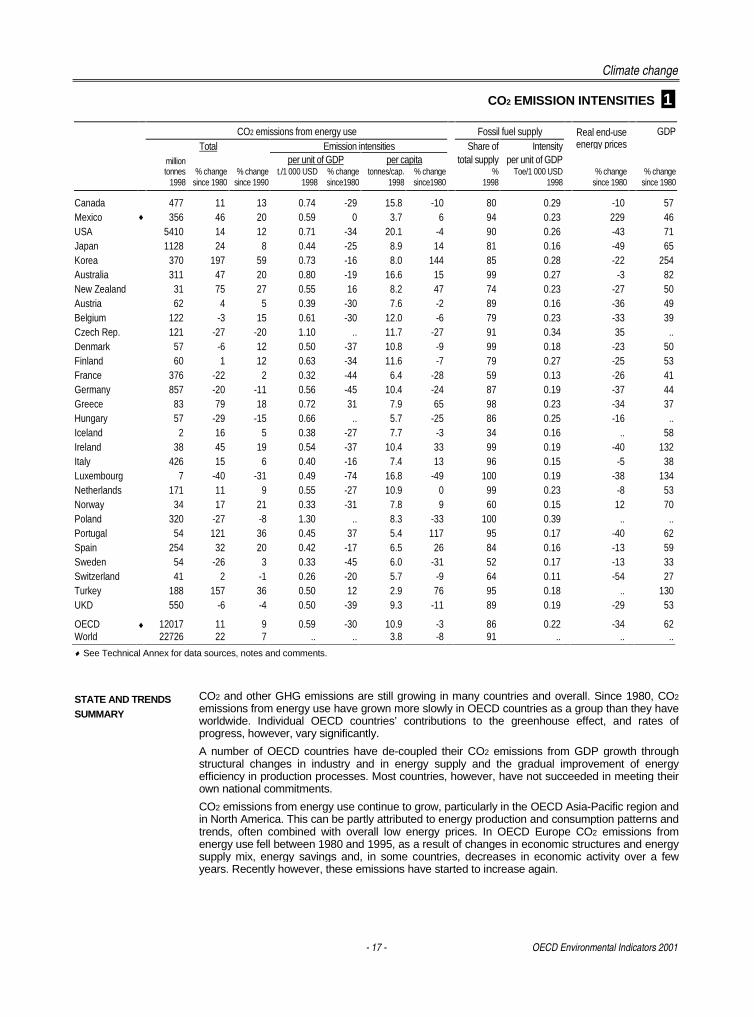
Canada 477 11 13 0.74 -29 15.8 -10 80 0.29 -10 57Mexico ♦ 356 46 20 0.59 0 3.7 6 94 0.23 229 46USA 5410 14 12 0.71 -34 20.1 -4 90 0.26 -43 71Japan 1128 24 8 0.44 -25 8.9 14 81 0.16 -49 65Korea 370 197 59 0.73 -16 8.0 144 85 0.28 -22 254Australia 311 47 20 0.80 -19 16.6 15 99 0.27 -3 82New Zealand 31 75 27 0.55 16 8.2 47 74 0.23 -27 50Austria 62 4 5 0.39 -30 7.6 -2 89 0.16 -36 49Belgium 122 -3 15 0.61 -30 12.0 -6 79 0.23 -33 39Czech Rep. 121 -27 -20 1.10 .. 11.7 -27 91 0.34 35 ..Denmark 57 -6 12 0.50 -37 10.8 -9 99 0.18 -23 50Finland 60 1 12 0.63 -34 11.6 -7 79 0.27 -25 53France 376 -22 2 0.32 -44 6.4 -28 59 0.13 -26 41Germany 857 -20 -11 0.56 -45 10.4 -24 87 0.19 -37 44Greece 83 79 18 0.72 31 7.9 65 98 0.23 -34 37Hungary 57 -29 -15 0.66 .. 5.7 -25 86 0.25 -16 ..Iceland 2 16 5 0.38 -27 7.7 -3 34 0.16 .. 58Ireland 38 45 19 0.54 -37 10.4 33 99 0.19 -40 132Italy 426 15 6 0.40 -16 7.4 13 96 0.15 -5 38Luxembourg 7 -40 -31 0.49 -74 16.8 -49 100 0.19 -38 134Netherlands 171 11 9 0.55 -27 10.9 0 99 0.23 -8 53Norway 34 17 21 0.33 -31 7.8 9 60 0.15 12 70Poland 320 -27 -8 1.30 .. 8.3 -33 100 0.39 .. ..Portugal 54 121 36 0.45 37 5.4 117 95 0.17 -40 62Spain 254 32 20 0.42 -17 6.5 26 84 0.16 -13 59Sweden 54 -26 3 0.33 -45 6.0 -31 52 0.17 -13 33Switzerland 41 2 -1 0.26 -20 5.7 -9 64 0.11 -54 27Turkey 188 157 36 0.50 12 2.9 76 95 0.18 .. 130UKD 550 -6 -4 0.50 -39 9.3 -11 89 0.19 -29 53
OECD ♦ 12017 11 9 0.59 -30 10.9 -3 86 0.22 -34 62World 22726 22 7 .. .. 3.8 -8 91 .. .. ..
♦ See Technical Annex for data sources, notes and comments.
STATE AND TRENDSSUMMARY
CO2 and other GHG emissions are still growing in many countries and overall. Since 1980, CO2
emissions from energy use have grown more slowly in OECD countries as a group than they haveworldwide. Individual OECD countries’ contributions to the greenhouse effect, and rates ofprogress, however, vary significantly.
A number of OECD countries have de-coupled their CO2 emissions from GDP growth throughstructural changes in industry and in energy supply and the gradual improvement of energyefficiency in production processes. Most countries, however, have not succeeded in meeting theirown national commitments.
CO2 emissions from energy use continue to grow, particularly in the OECD Asia-Pacific region andin North America. This can be partly attributed to energy production and consumption patterns andtrends, often combined with overall low energy prices. In OECD Europe CO2 emissions fromenergy use fell between 1980 and 1995, as a result of changes in economic structures and energysupply mix, energy savings and, in some countries, decreases in economic activity over a fewyears. Recently however, these emissions have started to increase again.
Climate change
OECD Environmental Indicators 2001 - 18 -
2 GREENHOUSE GAS CONCENTRATIONS
Gases controlled under the Framework Convention on Climate Change
Carbon dioxide (CO2)
280
300
320
340
360
1975 1980 1985 1990 1995 2000
(1 000) ppb Methane (CH4)
800
1000
1200
1400
1600
1975 1980 1985 1990 1995 2000
ppb Nitrous oxide (N2O)
280
290
300
310
1975 1980 1985 1990 1995 2000
ppb
Gases controlled under the Montreal Protocol (subst. depleting the ozone layer)
Total gaseous chlorine
0
500
1000
1500
2000
2500
1975 1980 1985 1990 1995 2000
ppt CFC-12CCI2F2
0
100
200
300
400
500
1975 1980 1985 1990 1995 2000
ppt CFC-11CCI3F
0
100
200
300
1975 1980 1985 1990 1995 2000
ppt
- Preindustrial level
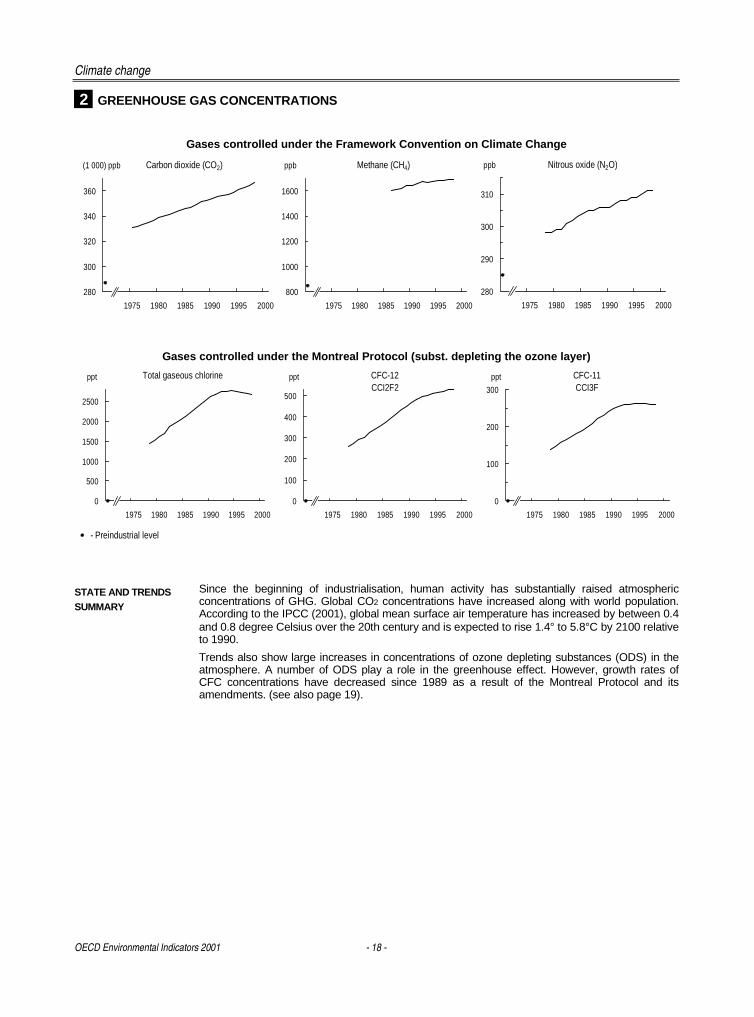
STATE AND TRENDSSUMMARY
Since the beginning of industrialisation, human activity has substantially raised atmosphericconcentrations of GHG. Global CO2 concentrations have increased along with world population.According to the IPCC (2001), global mean surface air temperature has increased by between 0.4and 0.8 degree Celsius over the 20th century and is expected to rise 1.4° to 5.8°C by 2100 relativeto 1990.
Trends also show large increases in concentrations of ozone depleting substances (ODS) in theatmosphere. A number of ODS play a role in the greenhouse effect. However, growth rates ofCFC concentrations have decreased since 1989 as a result of the Montreal Protocol and itsamendments. (see also page 19).
- 19 -
���������������� ��
The release into the atmosphere of certain man-made substances containing chlorine andbromine endangers the stratospheric ozone layer, which shields the earth’s surface fromultraviolet radiation. The main ozone depleting substances (ODS) are CFCs, halons, methylchloroform, carbon tetrachloride, HCFCs and methyl bromide. These are man-madechemicals which have been used in air conditioning and refrigeration equipment, aerosolsprays, foamed plastics, and fire extinguishers. They are also used as solvents andpesticides.
The depletion of the ozone layer could have major or significant effects on sustainabledevelopment. It remains a source of concern due to the impacts of increased UV-B radiationon human health, crop yields and the natural environment. Performance can be assessedagainst domestic objectives and international commitments. The major internationalagreements are the Convention for the Protection of the Ozone Layer (Vienna, 1985), theMontreal Protocol (1987) on substances that deplete the ozone layer and subsequent London(1990), Copenhagen (1992), Montreal (1997) and Beijing (1999) Amendments. The protocoland amendments set out timetables for phasing out ODS. The Montreal Protocol has beenratified by 175 parties, including all OECD countries. Countries are developing alternatives toor substitutes for ODS, recovering and recycling ODS and regulating the emissions of ODS.The main challenges are to phase out the supply of methyl bromide and HCFCs (by 2005 and2020 respectively) in industrialised countries, and to reduce international movements ofexisting CFCs.
Indicators presented here relate to:
♦ ozone depleting substances, i.e. the production and consumption of CFCs, halons andHCFCs, and the production of methyl bromide, as listed in the Montreal protocol. Basicdata are weighted with the ozone depleting potentials (ODP) of the individual substances.
♦ stratospheric ozone levels expressed as the values of total ozone in a vertical atmosphericcolumn over selected stations in OECD cities, presented with a zonal average (from 70Nto 70S) taken from satellite data to put trends from individual stations in a global context.
When interpreting these indicators it should be kept in mind that they do not reflect actualreleases to the atmosphere and that individual substances vary considerably in their ozone-depleting capacity. These indicators should be read in connection with other indicators of theOECD Core Set and in particular with indicators on ground-level UV-B radiation.
Ozone layer depletion
OECD Environmental Indicators 2001 - 20 -
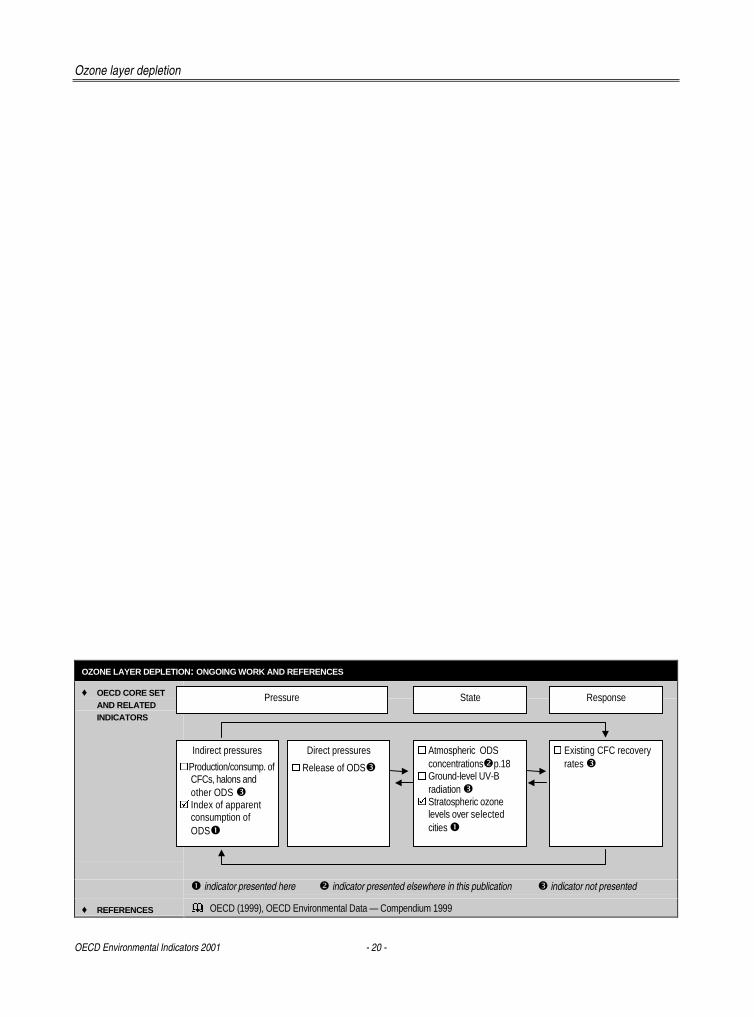
OZONE LAYER DEPLETION: ONGOING WORK AND REFERENCES
♦ OECD CORE SETAND RELATEDINDICATORS
� indicator presented here � indicator presented elsewhere in this publication � indicator not presented
♦ REFERENCES � OECD (1999), OECD Environmental Data — Compendium 1999
Pressure State Response
Indirect pressures
�Production/consump. ofCFCs, halons andother ODS �
� Index of apparentconsumption ofODS�
� Atmospheric ODSconcentrations�p.18
� Ground-level UV-Bradiation �
� Stratospheric ozonelevels over selectedcities �
� Existing CFC recoveryrates �
Direct pressures
� Release of ODS�
Ozone layer depletion
- 21 - OECD Environmental Indicators 2001
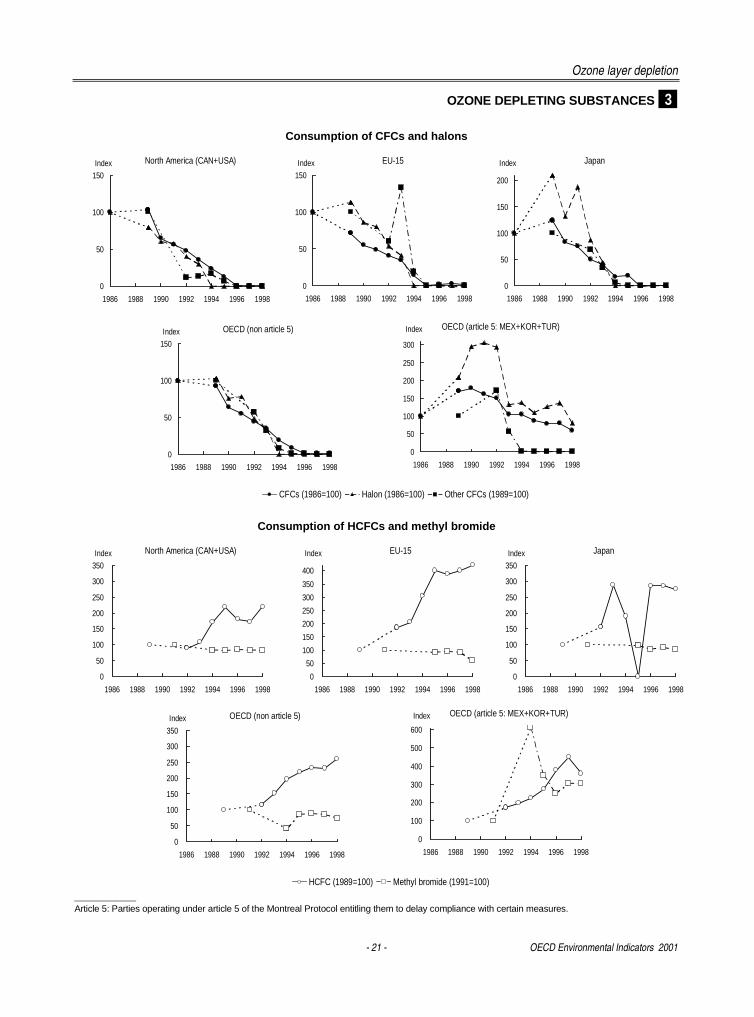
OZONE DEPLETING SUBSTANCES 3
Consumption of CFCs and halons
CFCs (1986=100) Halon (1986=100) Other CFCs (1989=100)
North America (CAN+USA)
0
50
100
150
1986 1988 1990 1992 1994 1996 1998
Index EU-15
0
50
100
150
1986 1988 1990 1992 1994 1996 1998
Index Japan
0
50
100
150
200
1986 1988 1990 1992 1994 1996 1998
Index
OECD (non article 5)
0
50
100
150
1986 1988 1990 1992 1994 1996 1998
Index OECD (article 5: MEX+KOR+TUR)
0
50
100
150
200
250
300
1986 1988 1990 1992 1994 1996 1998
Index
Consumption of HCFCs and methyl bromide
HCFC (1989=100) Methyl bromide (1991=100)
North America (CAN+USA)
0
50
100
150
200
250
300
350
1986 1988 1990 1992 1994 1996 1998
Index EU-15
0
50
100
150
200
250
300
350
400
1986 1988 1990 1992 1994 1996 1998
Index Japan
0
50
100
150
200
250
300
350
1986 1988 1990 1992 1994 1996 1998
Index
OECD (non article 5)
0
50
100
150
200
250
300
350
1986 1988 1990 1992 1994 1996 1998
Index OECD (article 5: MEX+KOR+TUR)
0
100
200
300
400
500
600
1986 1988 1990 1992 1994 1996 1998
Index
_______________Article 5: Parties operating under article 5 of the Montreal Protocol entitling them to delay compliance with certain measures.
Ozone layer depletion
OECD Environmental Indicators 2001 - 22 -
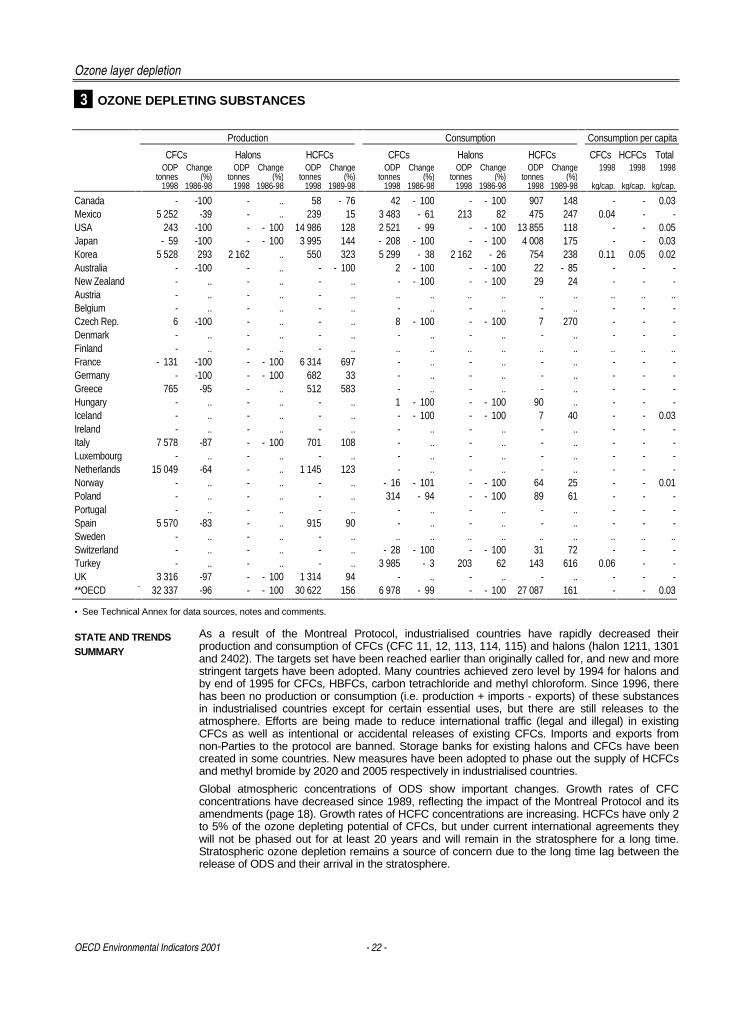
3 OZONE DEPLETING SUBSTANCES
Production Consumption Consumption per capita
CFCs Halons HCFCs CFCs Halons HCFCs CFCs HCFCs TotalODP
tonnesChange
(%)ODP
tonnesChange
(%)ODP
tonnesChange
(%)ODP
tonnesChange
(%)ODP
tonnesChange
(%)ODP
tonnesChange
(%)1998 1998 1998
1998 1986-98 1998 1986-98 1998 1989-98 1998 1986-98 1998 1986-98 1998 1989-98 kg/cap. kg/cap. kg/cap.
Canada - -100 - .. 58 - 76 42 - 100 - - 100 907 148 - - 0.03Mexico 5 252 -39 - .. 239 15 3 483 - 61 213 82 475 247 0.04 - -USA 243 -100 - - 100 14 986 128 2 521 - 99 - - 100 13 855 118 - - 0.05Japan - 59 -100 - - 100 3 995 144 - 208 - 100 - - 100 4 008 175 - - 0.03Korea 5 528 293 2 162 .. 550 323 5 299 - 38 2 162 - 26 754 238 0.11 0.05 0.02Australia - -100 - .. - - 100 2 - 100 - - 100 22 - 85 - - -New Zealand - .. - .. - .. - - 100 - - 100 29 24 - - -Austria - .. - .. - .. .. .. .. .. .. .. .. .. ..Belgium - .. - .. - .. - .. - .. - .. - - -Czech Rep. 6 -100 - .. - .. 8 - 100 - - 100 7 270 - - -Denmark - .. - .. - .. - .. - .. - .. - - -Finland - .. - .. - .. .. .. .. .. .. .. .. .. ..France - 131 -100 - - 100 6 314 697 - .. - .. - .. - - -Germany - -100 - - 100 682 33 - .. - .. - .. - - -Greece 765 -95 - .. 512 583 - .. - .. - .. - - -Hungary - .. - .. - .. 1 - 100 - - 100 90 .. - - -Iceland - .. - .. - .. - - 100 - - 100 7 40 - - 0.03Ireland - .. - .. - .. - .. - .. - .. - - -Italy 7 578 -87 - - 100 701 108 - .. - .. - .. - - -Luxembourg - .. - .. - .. - .. - .. - .. - - -Netherlands 15 049 -64 - .. 1 145 123 - .. - .. - .. - - -Norway - .. - .. - .. - 16 - 101 - - 100 64 25 - - 0.01Poland - .. - .. - .. 314 - 94 - - 100 89 61 - - -Portugal - .. - .. - .. - .. - .. - .. - - -Spain 5 570 -83 - .. 915 90 - .. - .. - .. - - -Sweden - .. - .. - .. .. .. .. .. .. .. .. .. ..Switzerland - .. - .. - .. - 28 - 100 - - 100 31 72 - - -Turkey - .. - .. - .. 3 985 - 3 203 62 143 616 0.06 - -UK 3 316 -97 - - 100 1 314 94 - .. - .. - .. - - -**OECD ¨ 32 337 -96 - - 100 30 622 156 6 978 - 99 - - 100 27 087 161 - - 0.03
• See Technical Annex for data sources, notes and comments.
STATE AND TRENDSSUMMARY
As a result of the Montreal Protocol, industrialised countries have rapidly decreased theirproduction and consumption of CFCs (CFC 11, 12, 113, 114, 115) and halons (halon 1211, 1301and 2402). The targets set have been reached earlier than originally called for, and new and morestringent targets have been adopted. Many countries achieved zero level by 1994 for halons andby end of 1995 for CFCs, HBFCs, carbon tetrachloride and methyl chloroform. Since 1996, therehas been no production or consumption (i.e. production + imports - exports) of these substancesin industrialised countries except for certain essential uses, but there are still releases to theatmosphere. Efforts are being made to reduce international traffic (legal and illegal) in existingCFCs as well as intentional or accidental releases of existing CFCs. Imports and exports fromnon-Parties to the protocol are banned. Storage banks for existing halons and CFCs have beencreated in some countries. New measures have been adopted to phase out the supply of HCFCsand methyl bromide by 2020 and 2005 respectively in industrialised countries.
Global atmospheric concentrations of ODS show important changes. Growth rates of CFCconcentrations have decreased since 1989, reflecting the impact of the Montreal Protocol and itsamendments (page 18). Growth rates of HCFC concentrations are increasing. HCFCs have only 2to 5% of the ozone depleting potential of CFCs, but under current international agreements theywill not be phased out for at least 20 years and will remain in the stratosphere for a long time.Stratospheric ozone depletion remains a source of concern due to the long time lag between therelease of ODS and their arrival in the stratosphere.
Ozone layer depletion
- 23 - OECD Environmental Indicators 2001
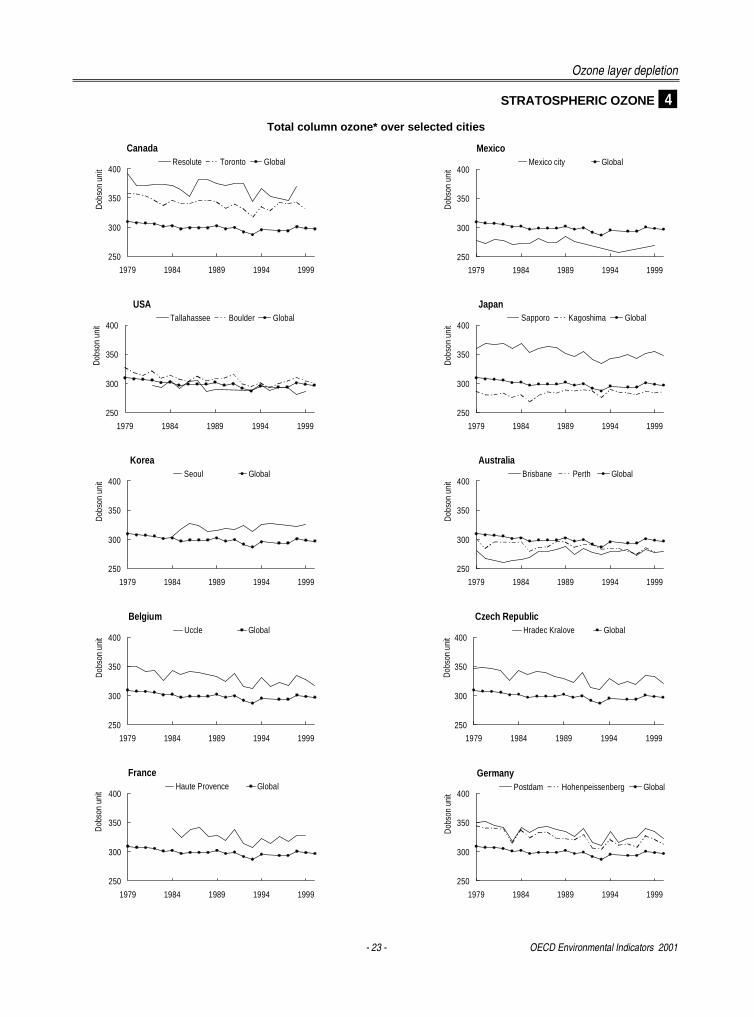
STRATOSPHERIC OZONE 4
Total column ozone* over selected cities
Canada
250
300
350
400
1979 1984 1989 1994 1999
Dob
son
unit
Resolute Toronto Global
Mexico
250
300
350
400
1979 1984 1989 1994 1999
Dob
son
unit
Mexico city Global
USA
250
300
350
400
1979 1984 1989 1994 1999
Dob
son
unit
Tallahassee Boulder Global
Japan
250
300
350
400
1979 1984 1989 1994 1999
Dob
son
unit
Sapporo Kagoshima Global
Korea
250
300
350
400
1979 1984 1989 1994 1999
Dob
son
unit
Seoul Global
Australia
250
300
350
400
1979 1984 1989 1994 1999
Dob
son
unit
Brisbane Perth Global
Czech Republic
250
300
350
400
1979 1984 1989 1994 1999
Dob
son
unit
Hradec Kralove Global
France
250
300
350
400
1979 1984 1989 1994 1999
Dob
son
unit
Haute Provence GlobalGermany
250
300
350
400
1979 1984 1989 1994 1999
Dob
son
unit
Postdam Hohenpeissenberg Global
Belgium
250
300
350
400
1979 1984 1989 1994 1999
Dob
son
unit
Uccle Global
Ozone layer depletion
OECD Environmental Indicators 2001 - 24 -
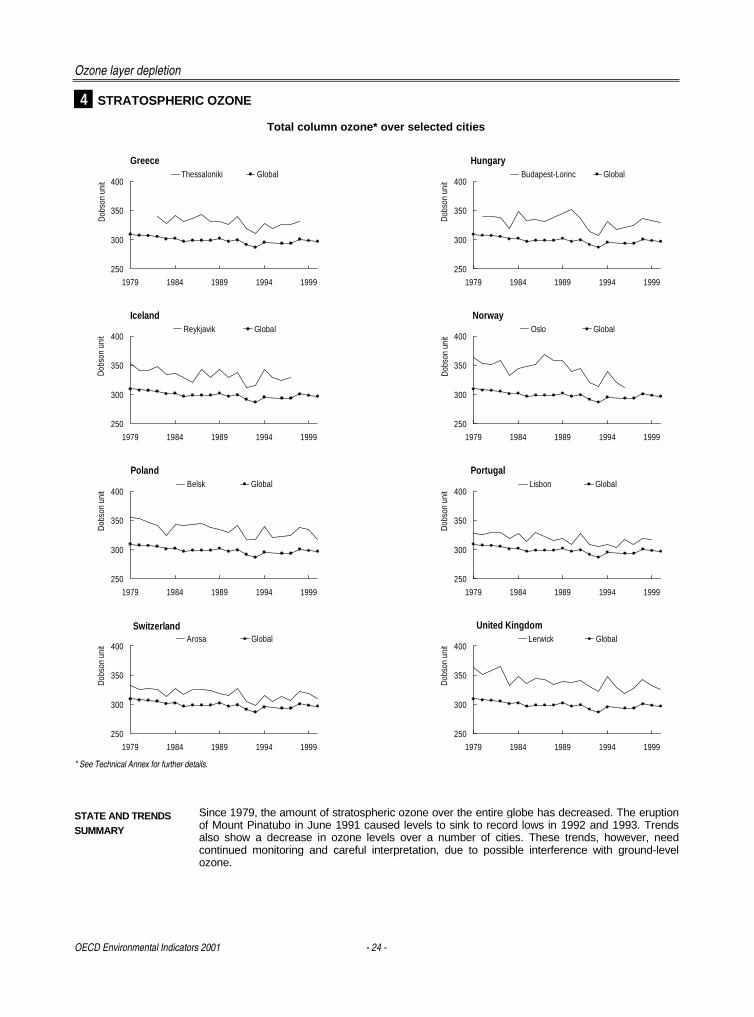
4 STRATOSPHERIC OZONE
Total column ozone* over selected cities
Greece
250
300
350
400
1979 1984 1989 1994 1999
Dob
son
unit
Thessaloniki Global
Hungary
250
300
350
400
1979 1984 1989 1994 1999
Dob
son
unit
Budapest-Lorinc Global
Iceland
250
300
350
400
1979 1984 1989 1994 1999
Dob
son
unit
Reykjavik Global
Norway
250
300
350
400
1979 1984 1989 1994 1999D
obso
n un
it
Oslo Global
Poland
250
300
350
400
1979 1984 1989 1994 1999
Dob
son
unit
Belsk Global
Portugal
250
300
350
400
1979 1984 1989 1994 1999
Dob
son
unit
Lisbon Global
Switzerland
250
300
350
400
1979 1984 1989 1994 1999
Dob
son
unit
Arosa Global
United Kingdom
250
300
350
400
1979 1984 1989 1994 1999
Dob
son
unit
Lerwick Global
* See Technical Annex for further details.
STATE AND TRENDSSUMMARY
Since 1979, the amount of stratospheric ozone over the entire globe has decreased. The eruptionof Mount Pinatubo in June 1991 caused levels to sink to record lows in 1992 and 1993. Trendsalso show a decrease in ozone levels over a number of cities. These trends, however, needcontinued monitoring and careful interpretation, due to possible interference with ground-levelozone.
- 25 -
����������
Atmospheric pollutants from energy transformation and energy consumption, but also fromindustrial processes, are the main contributors to regional and local air pollution. Majorconcerns relate to their effects on human health and ecosystems. Human exposure isparticularly high in urban areas where economic activities are concentrated. Causes ofgrowing concern are concentrations of fine particulates, NO2, toxic air pollutants, and acuteground-level ozone pollution episodes in both urban and rural areas. Air pollution may alsodamage ecosystems, buildings and monuments, for example through acid precipitation anddeposition.
Degraded air quality can result from and cause unsustainable development patterns. It canhave substantial economic and social consequences, from medical costs and buildingrestoration needs to reduced agricultural output, forest damage and a generally lower qualityof life. Performance can be assessed against domestic objectives and internationalcommitments. In Europe and North America, acidification has led to several internationalagreements. For example, under the Convention on Long-Range Transboundary Air Pollution(Geneva, 1979), protocols to reduce emissions of sulphur (Helsinki, 1985, Oslo, 1994,Gothenburg, 1999), nitrogen oxides (Sofia, 1988, Gothenburg, 1999) and VOCs (Geneva,1991, Gothenburg, 1999) have been adopted. Two other protocols are aimed at reducingemissions of heavy metals (Aarhus 1998) and persistent organic pollutants (Aarhus 1998).The main challenges are to further reduce emissions of NOx and other local and regional airpollutants in order to achieve a strong de-coupling of emissions from GDP and to limit theexposure of the population to air pollution.
Indicators presented here relate to:
♦ SOx and NOx emissions and changes in them over time, as well as emission intensitiesexpressed as quantities emitted per unit of GDP and per capita, presented with relatedchanges in economic growth and fossil fuel supply. These indicators should besupplemented with information on the acidity of rain and snow in selected regions, and theexceedance of critical loads in soils and waters which reflect the actual acidification of theenvironment.
♦ air quality expressed as trends in annual SO2 and NO2 concentrations for selected cities.In the longer term, indicators should focus on population exposure to air pollution. Theyshould be complemented with information on ground-level ozone and on other airpollutants.
Air quality
OECD Environmental Indicators 2001 - 26 -
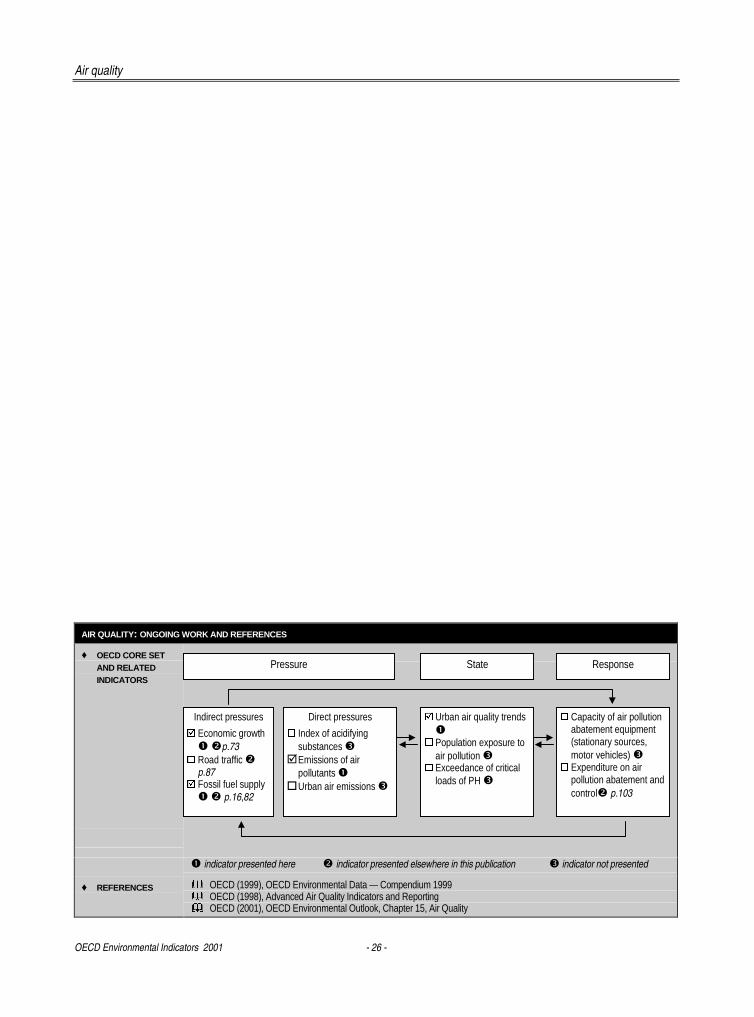
AIR QUALITY: ONGOING WORK AND REFERENCES
♦ OECD CORE SETAND RELATEDINDICATORS
� indicator presented here � indicator presented elsewhere in this publication � indicator not presented
♦ REFERENCES � OECD (1999), OECD Environmental Data — Compendium 1999 � OECD (1998), Advanced Air Quality Indicators and Reporting � OECD (2001), OECD Environmental Outlook, Chapter 15, Air Quality
Pressure State Response
Indirect pressures
� Economic growth� �p.73
� Road traffic �p.87
� Fossil fuel supply� � p.16,82
� Urban air quality trends�
� Population exposure toair pollution �
� Exceedance of criticalloads of PH �
� Capacity of air pollutionabatement equipment(stationary sources,motor vehicles) �
� Expenditure on airpollution abatement andcontrol� p.103
Direct pressures
� Index of acidifyingsubstances �
� Emissions of airpollutants �
� Urban air emissions �
Air quality
- 27 - OECD Environmental Indicators 2001
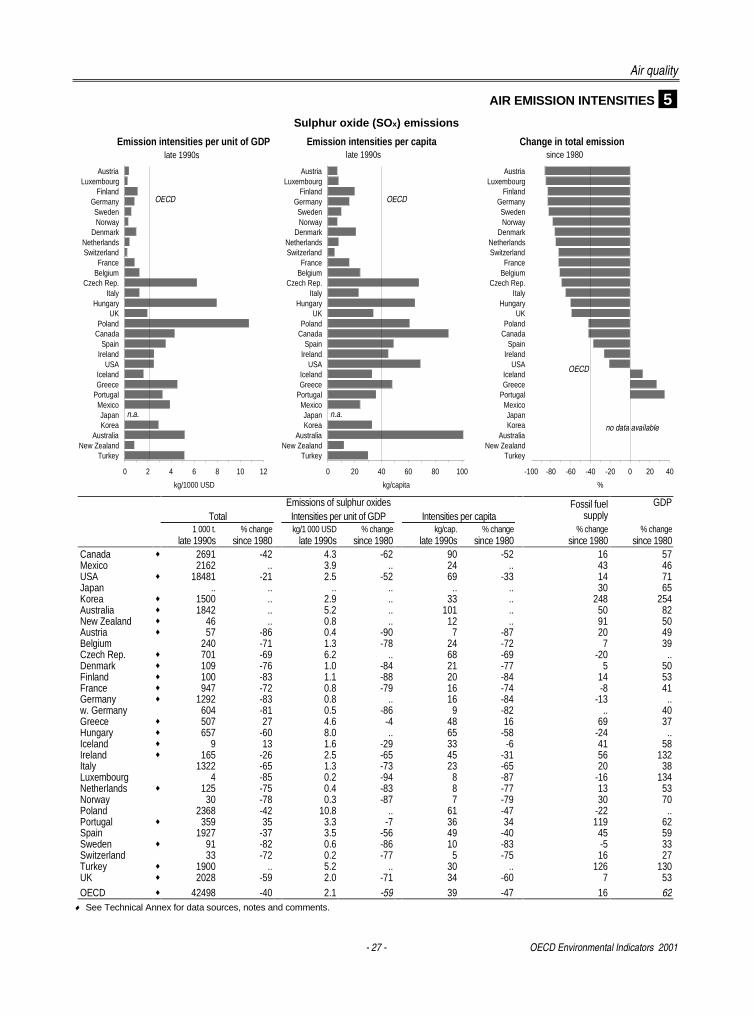
AIR EMISSION INTENSITIES 5
Sulphur oxide (SOx) emissions
Emissions of sulphur oxides Fossil fuel GDP Total Intensities per unit of GDP Intensities per capita supply 1 000 t. % change kg/1 000 USD % change kg/cap. % change % change % change late 1990s since 1980 late 1990s since 1980 late 1990s since 1980 since 1980 since 1980
Canada ♦ 2691 -42 4.3 -62 90 -52 16 57Mexico 2162 .. 3.9 .. 24 .. 43 46USA ♦ 18481 -21 2.5 -52 69 -33 14 71Japan .. .. .. .. .. .. 30 65Korea ♦ 1500 .. 2.9 .. 33 .. 248 254Australia ♦ 1842 .. 5.2 .. 101 .. 50 82New Zealand ♦ 46 .. 0.8 .. 12 .. 91 50Austria ♦ 57 -86 0.4 -90 7 -87 20 49Belgium 240 -71 1.3 -78 24 -72 7 39Czech Rep. ♦ 701 -69 6.2 .. 68 -69 -20 ..Denmark ♦ 109 -76 1.0 -84 21 -77 5 50Finland ♦ 100 -83 1.1 -88 20 -84 14 53France ♦ 947 -72 0.8 -79 16 -74 -8 41Germany ♦ 1292 -83 0.8 .. 16 -84 -13 ..w. Germany 604 -81 0.5 -86 9 -82 .. 40Greece ♦ 507 27 4.6 -4 48 16 69 37Hungary ♦ 657 -60 8.0 .. 65 -58 -24 ..Iceland ♦ 9 13 1.6 -29 33 -6 41 58Ireland ♦ 165 -26 2.5 -65 45 -31 56 132Italy 1322 -65 1.3 -73 23 -65 20 38Luxembourg 4 -85 0.2 -94 8 -87 -16 134Netherlands ♦ 125 -75 0.4 -83 8 -77 13 53Norway 30 -78 0.3 -87 7 -79 30 70Poland 2368 -42 10.8 .. 61 -47 -22 ..Portugal ♦ 359 35 3.3 -7 36 34 119 62Spain 1927 -37 3.5 -56 49 -40 45 59Sweden ♦ 91 -82 0.6 -86 10 -83 -5 33Switzerland 33 -72 0.2 -77 5 -75 16 27Turkey ♦ 1900 .. 5.2 .. 30 .. 126 130UK ♦ 2028 -59 2.0 -71 34 -60 7 53OECD ♦ 42498 -40 2.1 -59 39 -47 16 62
♦ See Technical Annex for data sources, notes and comments.
AustriaLuxembourg
FinlandGermanySwedenNorway
DenmarkNetherlandsSwitzerland
FranceBelgium
Czech Rep.Italy
HungaryUK
PolandCanada
SpainIreland
USAIcelandGreece
PortugalMexicoJapanKorea
AustraliaNew Zealand
Turkey
0 20 40 60 80 100
kg/capita
late 1990s late 1990s since 1980
AustriaLuxembourg
FinlandGermanySwedenNorway
DenmarkNetherlandsSwitzerland
FranceBelgium
Czech Rep.Italy
HungaryUK
PolandCanada
SpainIreland
USAIcelandGreece
PortugalMexicoJapanKorea
AustraliaNew Zealand
Turkey
-100 -80 -60 -40 -20 0 20 40
%
AustriaLuxembourg
FinlandGermanySwedenNorway
DenmarkNetherlandsSwitzerland
FranceBelgium
Czech Rep.Italy
HungaryUK
PolandCanada
SpainIreland
USAIcelandGreece
PortugalMexicoJapanKorea
AustraliaNew Zealand
Turkey
0 2 4 6 8 10 12
kg/1000 USD
n.a. n.a.
no data available
OECD
OECDOECD
Emission intensities per unit of GDP Emission intensities per capita Change in total emission

Air quality
OECD Environmental Indicators 2001 - 28 -
5 AIR EMISSION INTENSITIES
Trends in SOx emissions, Index 1980 = 100
SOx emissions Fossil fuel supply (FFS) GDP Helsinki protocol Oslo protocol National objectives Gothenburg protocol Oslo
Canada
0
50
100
150
200
1980 1985 1990 1995 2000 2005 2010
USA
0
50
100
150
200
1980 1985 1990 1995 2000 2005 2010
Japan
0
50
100
150
200
1980 1985 1990 1995 2000 2005 2010Austria
0
50
100
150
200
1980 1985 1990 1995 2000 2005 2010
Belgium
0
50
100
150
200
1980 1985 1990 1995 2000 2005 2010
Czech Republic
0
50
100
150
200
1980 1985 1990 1995 2000 2005 2010Denmark
0
50
100
150
200
1980 1985 1990 1995 2000 2005 2010
Finland
0
50
100
150
200
1980 1985 1990 1995 2000 2005 2010
France
0
50
100
150
200
1980 1985 1990 1995 2000 2005 2010Germany
0
50
100
150
200
1980 1985 1990 1995 2000 2005 2010
Greece
0
50
100
150
200
1980 1985 1990 1995 2000 2005 2010
Hungary
0
50
100
150
200
1980 1985 1990 1995 2000 2005 2010Iceland
0
50
100
150
200
1980 1985 1990 1995 2000 2005 2010
Ireland
0
50
100
150
200
1980 1985 1990 1995 2000 2005 2010
Italy
0
50
100
150
200
1980 1985 1990 1995 2000 2005 2010Luxembourg
0
50
100
150
200
1980 1985 1990 1995 2000 2005 2010
Netherlands
0
50
100
150
200
1980 1985 1990 1995 2000 2005 2010
Norway
0
50
100
150
200
1980 1985 1990 1995 2000 2005 2010Poland
0
50
100
150
200
1980 1985 1990 1995 2000 2005 2010
Portugal
0
50
100
150
200
1980 1985 1990 1995 2000 2005 2010
Spain
0
50
100
150
200
1980 1985 1990 1995 2000 2005 2010Sweden
0
50
100
150
200
1980 1985 1990 1995 2000 2005 2010
Switzerland
0
50
100
150
200
1980 1985 1990 1995 2000 2005 2010
United Kingdom
0
50
100
150
200
1980 1985 1990 1995 2000 2005 2010
Air quality
- 29 - OECD Environmental Indicators 2001
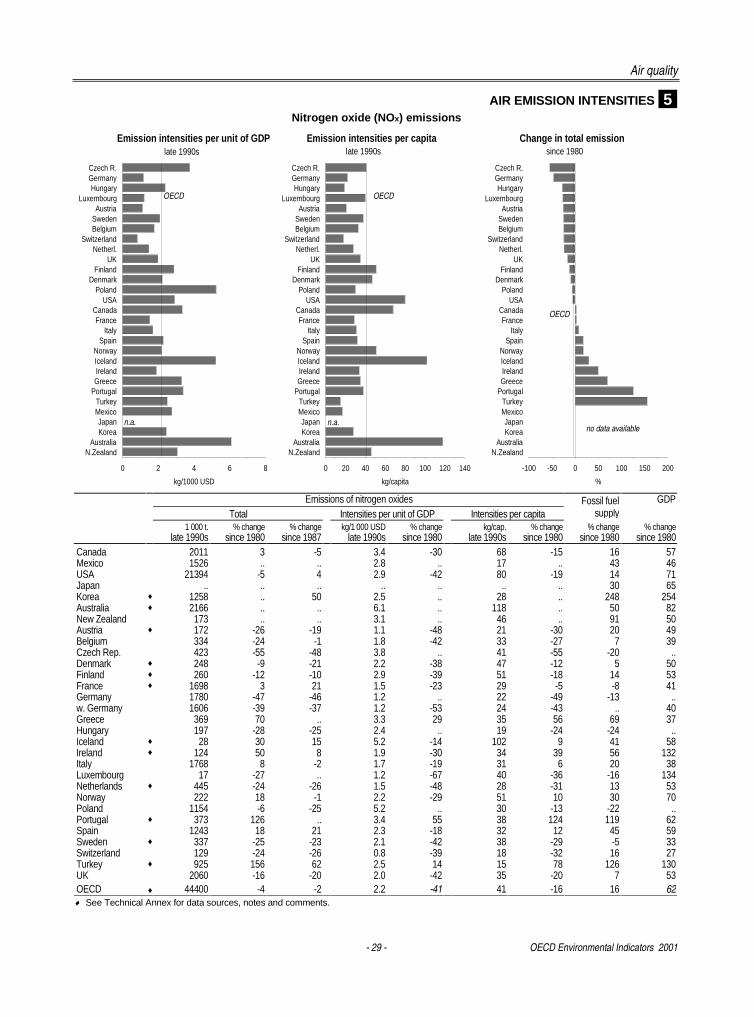
AIR EMISSION INTENSITIES 5 Nitrogen oxide (NOx) emissions
Emissions of nitrogen oxides Fossil fuel GDPTotal Intensities per unit of GDP Intensities per capita supply
1 000 t. % change % change kg/1 000 USD % change kg/cap. % change % change % changelate 1990s since 1980 since 1987 late 1990s since 1980 late 1990s since 1980 since 1980 since 1980
Canada 2011 3 -5 3.4 -30 68 -15 16 57Mexico 1526 .. .. 2.8 .. 17 .. 43 46USA 21394 -5 4 2.9 -42 80 -19 14 71Japan .. .. .. .. .. .. .. 30 65Korea ♦ 1258 .. 50 2.5 .. 28 .. 248 254Australia ♦ 2166 .. .. 6.1 .. 118 .. 50 82New Zealand 173 .. .. 3.1 .. 46 .. 91 50Austria ♦ 172 -26 -19 1.1 -48 21 -30 20 49Belgium 334 -24 -1 1.8 -42 33 -27 7 39Czech Rep. 423 -55 -48 3.8 .. 41 -55 -20 ..Denmark ♦ 248 -9 -21 2.2 -38 47 -12 5 50Finland ♦ 260 -12 -10 2.9 -39 51 -18 14 53France ♦ 1698 3 21 1.5 -23 29 -5 -8 41Germany 1780 -47 -46 1.2 .. 22 -49 -13 ..w. Germany 1606 -39 -37 1.2 -53 24 -43 .. 40Greece 369 70 .. 3.3 29 35 56 69 37Hungary 197 -28 -25 2.4 .. 19 -24 -24 ..Iceland ♦ 28 30 15 5.2 -14 102 9 41 58Ireland ♦ 124 50 8 1.9 -30 34 39 56 132Italy 1768 8 -2 1.7 -19 31 6 20 38Luxembourg 17 -27 .. 1.2 -67 40 -36 -16 134Netherlands ♦ 445 -24 -26 1.5 -48 28 -31 13 53Norway 222 18 -1 2.2 -29 51 10 30 70Poland 1154 -6 -25 5.2 .. 30 -13 -22 ..Portugal ♦ 373 126 .. 3.4 55 38 124 119 62Spain 1243 18 21 2.3 -18 32 12 45 59Sweden ♦ 337 -25 -23 2.1 -42 38 -29 -5 33Switzerland 129 -24 -26 0.8 -39 18 -32 16 27Turkey ♦ 925 156 62 2.5 14 15 78 126 130UK 2060 -16 -20 2.0 -42 35 -20 7 53OECD ♦ 44400 -4 -2 2.2 -41 41 -16 16 62♦ See Technical Annex for data sources, notes and comments.
Czech R.GermanyHungary
LuxembourgAustria
SwedenBelgium
SwitzerlandNetherl.
UKFinland
DenmarkPoland
USACanadaFrance
ItalySpain
NorwayIcelandIrelandGreece
PortugalTurkeyMexicoJapanKorea
AustraliaN.Zealand
0 20 40 60 80 100 120 140
kg/capita
late 1990s late 1990s since 1980
Czech R.GermanyHungary
LuxembourgAustria
SwedenBelgium
SwitzerlandNetherl.
UKFinland
DenmarkPoland
USACanadaFrance
ItalySpain
NorwayIcelandIrelandGreece
PortugalTurkeyMexicoJapanKorea
AustraliaN.Zealand
-100 -50 0 50 100 150 200
%
Czech R.GermanyHungary
LuxembourgAustria
SwedenBelgium
SwitzerlandNetherl.
UKFinland
DenmarkPoland
USACanadaFrance
ItalySpain
NorwayIcelandIrelandGreece
PortugalTurkeyMexicoJapanKorea
AustraliaN.Zealand
0 2 4 6 8
kg/1000 USD
n.a. n.a.no data available
OECD
OECDOECD
Emission intensities per unit of GDP Emission intensities per capita Change in total emission
Air quality
OECD Environmental Indicators 2001 - 30 -
5 AIR EMISSION INTENSITIES
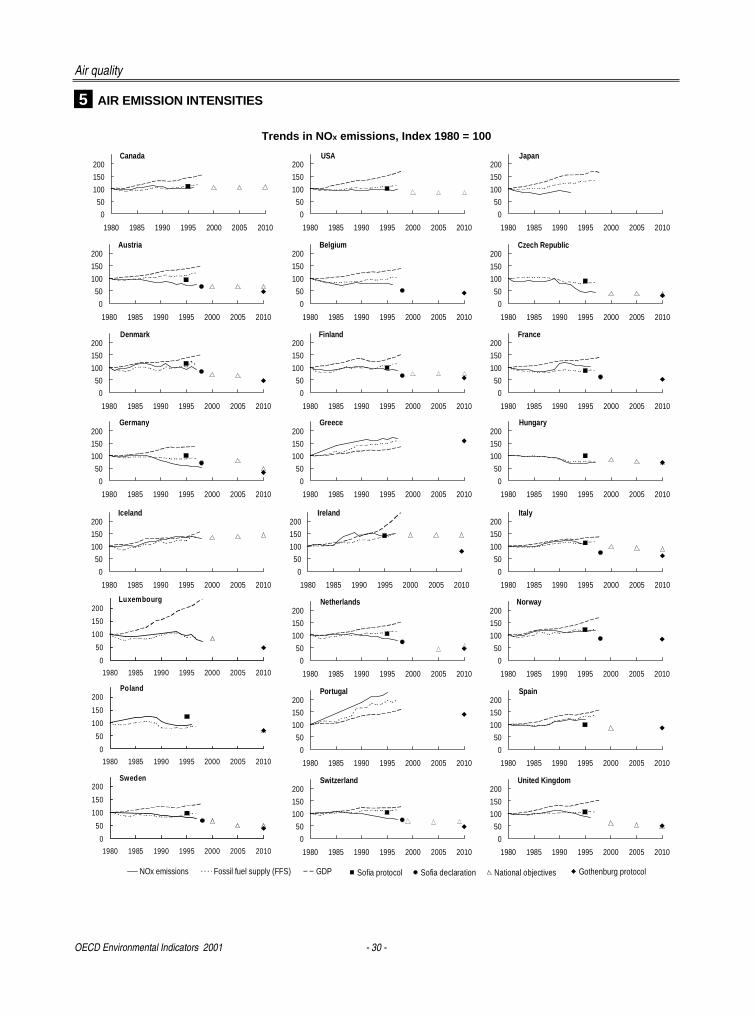
Trends in NOx emissions, Index 1980 = 100
NOx emissions Fossil fuel supply (FFS) GDP Sofia protocol Sofia declaration National objectives Gothenburg protocol Oslo
Canada
0
50
100
150
200
1980 1985 1990 1995 2000 2005 2010
USA
0
50
100
150
200
1980 1985 1990 1995 2000 2005 2010
Japan
0
50
100
150
200
1980 1985 1990 1995 2000 2005 2010
Austria
0
50
100
150
200
1980 1985 1990 1995 2000 2005 2010
Belgium
0
50
100
150
200
1980 1985 1990 1995 2000 2005 2010
Czech Republic
0
50
100
150
200
1980 1985 1990 1995 2000 2005 2010
Denmark
0
50
100
150
200
1980 1985 1990 1995 2000 2005 2010
Finland
0
50
100
150
200
1980 1985 1990 1995 2000 2005 2010
France
0
50
100
150
200
1980 1985 1990 1995 2000 2005 2010
Germany
0
50
100
150
200
1980 1985 1990 1995 2000 2005 2010
Greece
0
50
100
150
200
1980 1985 1990 1995 2000 2005 2010
Hungary
0
50
100
150
200
1980 1985 1990 1995 2000 2005 2010
Iceland
0
50
100
150
200
1980 1985 1990 1995 2000 2005 2010
Ireland
0
50
100
150
200
1980 1985 1990 1995 2000 2005 2010
Italy
0
50
100
150
200
1980 1985 1990 1995 2000 2005 2010
Luxembourg
0
50
100
150
200
1980 1985 1990 1995 2000 2005 2010
Netherlands
0
50
100
150
200
1980 1985 1990 1995 2000 2005 2010
Norway
0
50
100
150
200
1980 1985 1990 1995 2000 2005 2010
Poland
0
50
100
150
200
1980 1985 1990 1995 2000 2005 2010
Portugal
0
50
100
150
200
1980 1985 1990 1995 2000 2005 2010
Spain
0
50
100
150
200
1980 1985 1990 1995 2000 2005 2010
Sweden
0
50
100
150
200
1980 1985 1990 1995 2000 2005 2010
Switzerland
0
50
100
150
200
1980 1985 1990 1995 2000 2005 2010
United Kingdom
0
50
100
150
200
1980 1985 1990 1995 2000 2005 2010
Air quality
- 31 - OECD Environmental Indicators 2001
AIR EMISSION INTENSITIES 5
STATE AND TRENDSSUMMARY
SOX EMISSIONS
SOx emission intensities per capita and per unit of GDP show significant variations among OECDcountries. A strong de-coupling of emissions from GDP is seen in many countries. Europeancountries’ early commitments to reduce SOx emissions have been achieved, and new agreementshave been adopted in Europe and North America to reduce acid precipitation even further(Gothenburg Protocol).
Emissions have decreased significantly for the OECD as a whole, compared to 1980 levels, as acombined result of:♦ structural changes in the economy;♦ changes in energy demand through energy savings and fuel substitution;♦ pollution control policies and technical progress, including countries’ efforts to control large
stationary emission sources.
NOX EMISSIONS
NOx emissions have decreased in the OECD overall compared to 1980, but less than SOx
emissions. Major progress in the early 1990s, particularly in OECD Europe, reflects changes inenergy demand, pollution control policies and technical progress. However, these results have notcompensated in all countries for steady growth in road traffic, fossil fuel use and other activitiesgenerating NOx. In some European countries the commitment to stabilise NOx emissions by theend of 1994 to their 1987 levels (Sofia Protocol) has not been met.
Emission intensities per capita and per unit of GDP show significant variations among OECDcountries, and a weak de-coupling of emissions from GDP in a number of countries.
Air quality
OECD Environmental Indicators 2001 - 32 -
6 URBAN AIR QUALITY
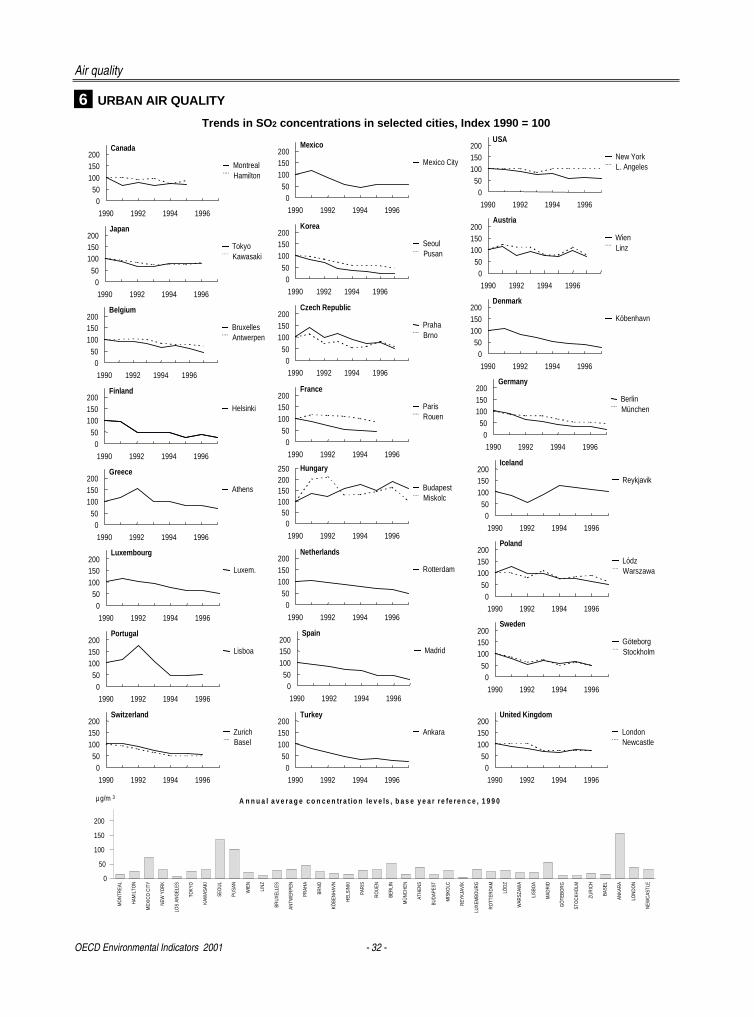
Trends in SO2 concentrations in selected cities, Index 1990 = 100M
ON
TREA
L
HAM
ILTO
N
MEX
ICO
CIT
Y
NEW
YO
RK
LOS
ANG
ELES
TOKY
O
KAW
ASAK
I
SEO
UL
PUSA
N
WIE
N
LIN
Z
BRU
XELL
ES
ANTW
ERPE
N
PRAH
A
BRN
O
KÖBE
NH
AVN
HEL
SIN
KI
PAR
IS
RO
UEN
BER
LIN
MÜ
NC
HEN
ATH
ENS
BUD
APES
T
MIS
KOLC
REY
KJAV
ÍK
LUXE
MBO
UR
G
RO
TTER
DAM
LÓD
Z
WAR
SZAW
A
LISB
OA
MAD
RID
GÖ
TEBO
RG
STO
CKH
OLM
ZUR
ICH
BASE
L
ANKA
RA
LON
DO
N
NEW
CAS
TLE
0
50
100
150
200
µ g/m 3A n n u a l a v e ra g e c o n c e n tr a t io n le v e ls , b a s e y e a r re fe re n c e , 1 9 9 0
050
100150200
1990 1992 1994 1996
Montreal Hamilton
Canada
050
100150200
1990 1992 1994 1996
Mexico City
Mexico
050
100150200
1990 1992 1994 1996
New York L. Angeles
USA
050
100150200
1990 1992 1994 1996
Tokyo Kawasaki
Japan
050
100150200
1990 1992 1994 1996
Seoul Pusan
Korea
050
100150200
1990 1992 1994 1996
Wien Linz
Austria
050
100150200
1990 1992 1994 1996
Bruxelles Antwerpen
Belgium
050
100150200
1990 1992 1994 1996
Praha Brno
Czech Republic
050
100150200
1990 1992 1994 1996
Köbenhavn
Denmark
050
100150200
1990 1992 1994 1996
Helsinki
Finland
050
100150200
1990 1992 1994 1996
Paris Rouen
France
050
100150200
1990 1992 1994 1996
Berlin München
Germany
050
100150200
1990 1992 1994 1996
Athens
Greece
050
100150200250
1990 1992 1994 1996
Budapest Miskolc
Hungary
050
100150200
1990 1992 1994 1996
Reykjavik
Iceland
050
100150200
1990 1992 1994 1996
Luxem.
Luxembourg
050
100150200
1990 1992 1994 1996
Rotterdam
Netherlands
050
100150200
1990 1992 1994 1996
Lódz Warszawa
Poland
050
100150200
1990 1992 1994 1996
Lisboa
Portugal
050
100150200
1990 1992 1994 1996
Madrid
Spain
050
100150200
1990 1992 1994 1996
Göteborg Stockholm
Sweden
050
100150200
1990 1992 1994 1996
Zurich Basel
Switzerland
050
100150200
1990 1992 1994 1996
Ankara
Turkey
050
100150200
1990 1992 1994 1996
London Newcastle
United Kingdom
Air quality
- 33 - OECD Environmental Indicators 2001
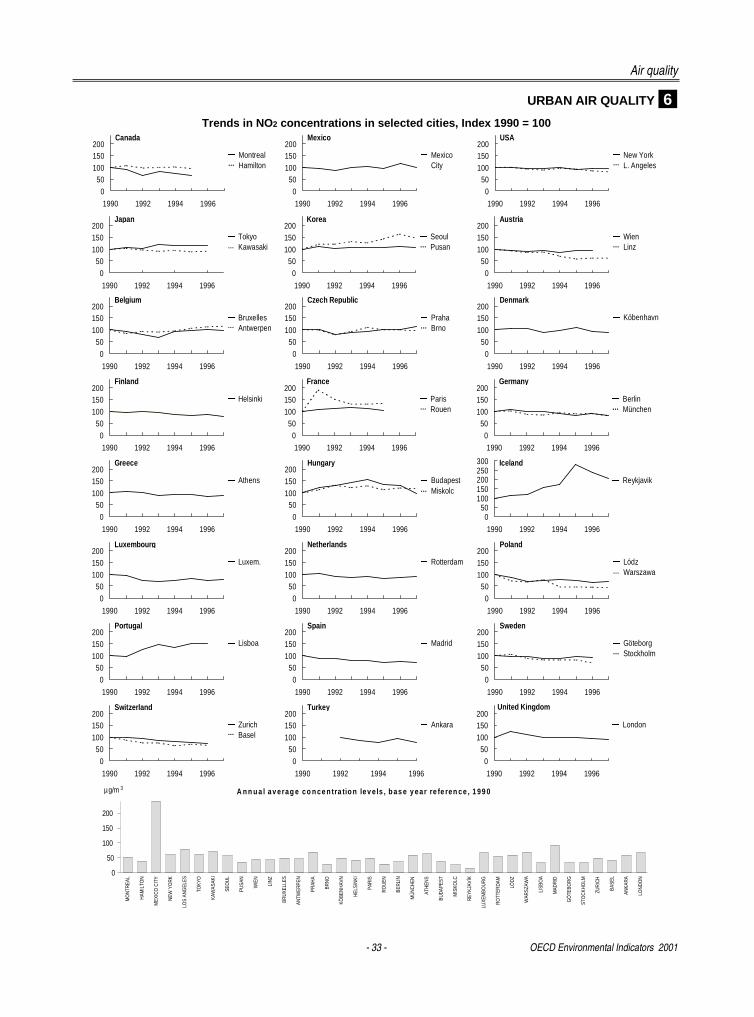
URBAN AIR QUALITY 6Trends in NO2 concentrations in selected cities, Index 1990 = 100
050
100150200
1990 1992 1994 1996
Montreal Hamilton
Canada
050
100150200
1990 1992 1994 1996
Tokyo Kawasaki
Japan
050
100150200
1990 1992 1994 1996
Bruxelles Antwerpen
Belgium
050
100150200
1990 1992 1994 1996
Helsinki
Finland
050
100150200
1990 1992 1994 1996
Athens
Greece
050
100150200
1990 1992 1994 1996
Luxem.
Luxembourg
050
100150200
1990 1992 1994 1996
Lisboa
Portugal
050
100150200
1990 1992 1994 1996
Zurich Basel
Switzerland
050
100150200
1990 1992 1994 1996
Mexico City
Mexico
050
100150200
1990 1992 1994 1996
Seoul Pusan
Korea
050
100150200
1990 1992 1994 1996
Praha Brno
Czech Republic
050
100150200
1990 1992 1994 1996
Paris Rouen
France
050
100150200
1990 1992 1994 1996
Budapest Miskolc
Hungary
050
100150200
1990 1992 1994 1996
Rotterdam
Netherlands
050
100150200
1990 1992 1994 1996
Madrid
Spain
050
100150200
1990 1992 1994 1996
Ankara
Turkey
050
100150200
1990 1992 1994 1996
New York L. Angeles
USA
050
100150200
1990 1992 1994 1996
Wien Linz
Austria
050
100150200
1990 1992 1994 1996
Köbenhavn
Denmark
050
100150200
1990 1992 1994 1996
Berlin München
Germany
050
100150200250300
1990 1992 1994 1996
Reykjavik
Iceland
050
100150200
1990 1992 1994 1996
Lódz Warszawa
Poland
050
100150200
1990 1992 1994 1996
Göteborg Stockholm
Sweden
050
100150200
1990 1992 1994 1996
London
United Kingdom
MO
NTR
EAL
HAM
ILTO
N
MEX
ICO
CIT
Y
NEW
YO
RK
LOS
ANG
ELES
TOKY
O
KAW
ASAK
I
SEO
UL
PUSA
N
WIE
N
LIN
Z
BRU
XELL
ES
ANTW
ERPE
N
PRAH
A
BRN
O
KÖBE
NH
AVN
HEL
SIN
KI
PAR
IS
RO
UEN
BER
LIN
MÜ
NC
HEN
ATH
ENS
BUD
APES
T
MIS
KOLC
REY
KJAV
ÍK
LUXE
MBO
UR
G
RO
TTER
DAM
LÓD
Z
WAR
SZAW
A
LISB
OA
MAD
RID
GÖ
TEBO
RG
STO
CKH
OLM
ZUR
ICH
BASE
L
ANKA
RA
LON
DO
N
0
50
100
150
200
µg/m A n n u a l av erag e co n ce n tra tio n lev e ls , b as e y ear re fe ren ce , 1 99 03
Air quality
OECD Environmental Indicators 2001 - 34 -
6 URBAN AIR QUALITY
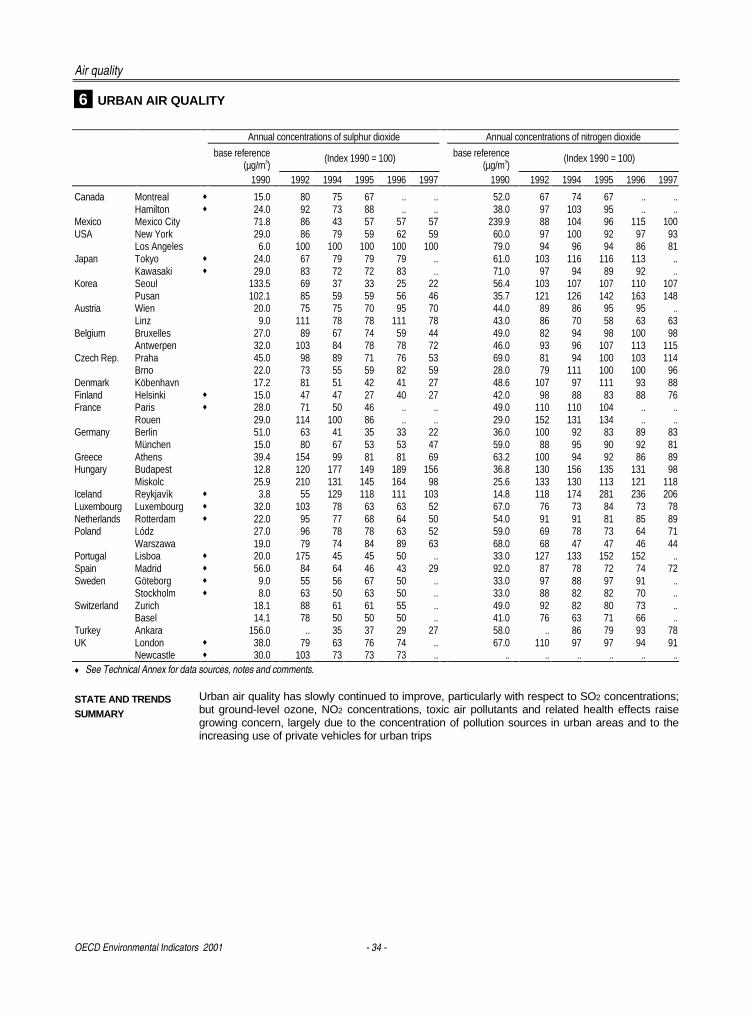
Annual concentrations of sulphur dioxide Annual concentrations of nitrogen dioxide
base reference(µg/m3)
(Index 1990 = 100) base reference(µg/m3)
(Index 1990 = 100)
1990 1992 1994 1995 1996 1997 1990 1992 1994 1995 1996 1997
Canada Montreal ♦ 15.0 80 75 67 .. .. 52.0 67 74 67 .. ..Hamilton ♦ 24.0 92 73 88 .. .. 38.0 97 103 95 .. ..
Mexico Mexico City 71.8 86 43 57 57 57 239.9 88 104 96 115 100USA New York 29.0 86 79 59 62 59 60.0 97 100 92 97 93
Los Angeles 6.0 100 100 100 100 100 79.0 94 96 94 86 81Japan Tokyo ♦ 24.0 67 79 79 79 .. 61.0 103 116 116 113 ..
Kawasaki ♦ 29.0 83 72 72 83 .. 71.0 97 94 89 92 ..Korea Seoul 133.5 69 37 33 25 22 56.4 103 107 107 110 107
Pusan 102.1 85 59 59 56 46 35.7 121 126 142 163 148Austria Wien 20.0 75 75 70 95 70 44.0 89 86 95 95 ..
Linz 9.0 111 78 78 111 78 43.0 86 70 58 63 63Belgium Bruxelles 27.0 89 67 74 59 44 49.0 82 94 98 100 98
Antwerpen 32.0 103 84 78 78 72 46.0 93 96 107 113 115Czech Rep. Praha 45.0 98 89 71 76 53 69.0 81 94 100 103 114
Brno 22.0 73 55 59 82 59 28.0 79 111 100 100 96Denmark Köbenhavn 17.2 81 51 42 41 27 48.6 107 97 111 93 88Finland Helsinki ♦ 15.0 47 47 27 40 27 42.0 98 88 83 88 76France Paris ♦ 28.0 71 50 46 .. .. 49.0 110 110 104 .. ..
Rouen 29.0 114 100 86 .. .. 29.0 152 131 134 .. ..Germany Berlin 51.0 63 41 35 33 22 36.0 100 92 83 89 83
München 15.0 80 67 53 53 47 59.0 88 95 90 92 81Greece Athens 39.4 154 99 81 81 69 63.2 100 94 92 86 89Hungary Budapest 12.8 120 177 149 189 156 36.8 130 156 135 131 98
Miskolc 25.9 210 131 145 164 98 25.6 133 130 113 121 118Iceland Reykjavík ♦ 3.8 55 129 118 111 103 14.8 118 174 281 236 206Luxembourg Luxembourg ♦ 32.0 103 78 63 63 52 67.0 76 73 84 73 78Netherlands Rotterdam ♦ 22.0 95 77 68 64 50 54.0 91 91 81 85 89Poland Lódz 27.0 96 78 78 63 52 59.0 69 78 73 64 71
Warszawa 19.0 79 74 84 89 63 68.0 68 47 47 46 44Portugal Lisboa ♦ 20.0 175 45 45 50 .. 33.0 127 133 152 152 ..Spain Madrid ♦ 56.0 84 64 46 43 29 92.0 87 78 72 74 72Sweden Göteborg ♦ 9.0 55 56 67 50 .. 33.0 97 88 97 91 ..
Stockholm ♦ 8.0 63 50 63 50 .. 33.0 88 82 82 70 ..Switzerland Zurich 18.1 88 61 61 55 .. 49.0 92 82 80 73 ..
Basel 14.1 78 50 50 50 .. 41.0 76 63 71 66 ..Turkey Ankara 156.0 .. 35 37 29 27 58.0 .. 86 79 93 78UK London ♦ 38.0 79 63 76 74 .. 67.0 110 97 97 94 91
Newcastle ♦ 30.0 103 73 73 73 .. .. .. .. .. .. ..♦ See Technical Annex for data sources, notes and comments.
STATE AND TRENDSSUMMARY
Urban air quality has slowly continued to improve, particularly with respect to SO2 concentrations;but ground-level ozone, NO2 concentrations, toxic air pollutants and related health effects raisegrowing concern, largely due to the concentration of pollution sources in urban areas and to theincreasing use of private vehicles for urban trips
- 35 -
�����
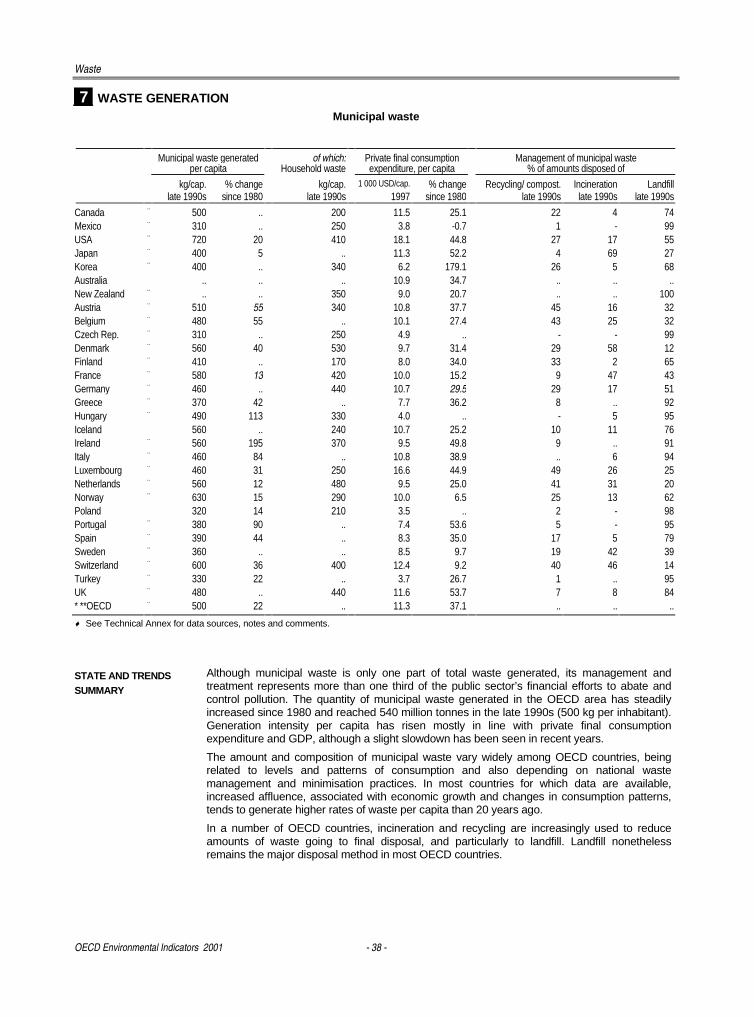
Waste is generated at all stages of human activities. Its composition and amounts dependlargely on consumption and production patterns. Main concerns relate to the potential impactfrom inappropriate waste management on human health and the environment (soil and watercontamination, air quality, land use and landscape). Despite achievements in waste recycling,amounts of solid waste going to final disposal are on the increase as are overall trends inwaste generation. This raises important questions as to the capacities of existing facilities forfinal treatment and disposal and as to the location and social acceptance of new facilities (e.g.NIMBY for controlled landfill and incineration plants). Hazardous waste, mainly from industry,is of particular concern since it entails serious environmental risks if badly managed. Also,long-term policies are needed for the disposal of high-level radioactive waste.
Waste management issues are at environmental centre stage in many countries. Responseshave been directed mainly towards collection, treatment and disposal. Increasingly, wasteminimisation is an aim of sustainable development strategies. This can be achieved throughwaste prevention, reuse, recycling and recovery. More broadly it is necessary to betterintegrate environmental concerns into consumption and production patterns. Performance canbe assessed against domestic objectives and international commitments. Agreements andregulations on waste in general and transfrontier movements of hazardous waste in particularinclude directives of the European Union, OECD Decisions and Recommendations, theLomé IV Convention and the 1989 Basel Convention. The main challenge is to strengthenmeasures for waste minimisation, especially for waste prevention and recycling, and to movefurther towards life cycle management of products and extended producer responsibility.
Indicators presented here relate to:
♦ waste generation, i.e.:
− total amounts of waste by principal source sector (municipal, industrial and nuclearwaste), as well as generation intensities expressed per capita and per unit of GDP.Treatment and disposal shares of municipal waste are shown as complementaryinformation;
− hazardous waste produced per unit of GDP (hazardous waste generation is largelydriven by production patterns). This indicator does not reflect toxicity levels or otherrisks posed by such waste, nor its real impact on the environment. Transfrontiermovements are shown as complementary information.
Indicators of waste generation intensity are first approximations of potentialenvironmental pressure; more information is needed to describe the actual pressure.
♦ waste recycling rates for paper and glass. They present total amounts recycled aspercentage of the apparent consumption of the respective material.
Waste
OECD Environmental Indicators 2001 - 36 -
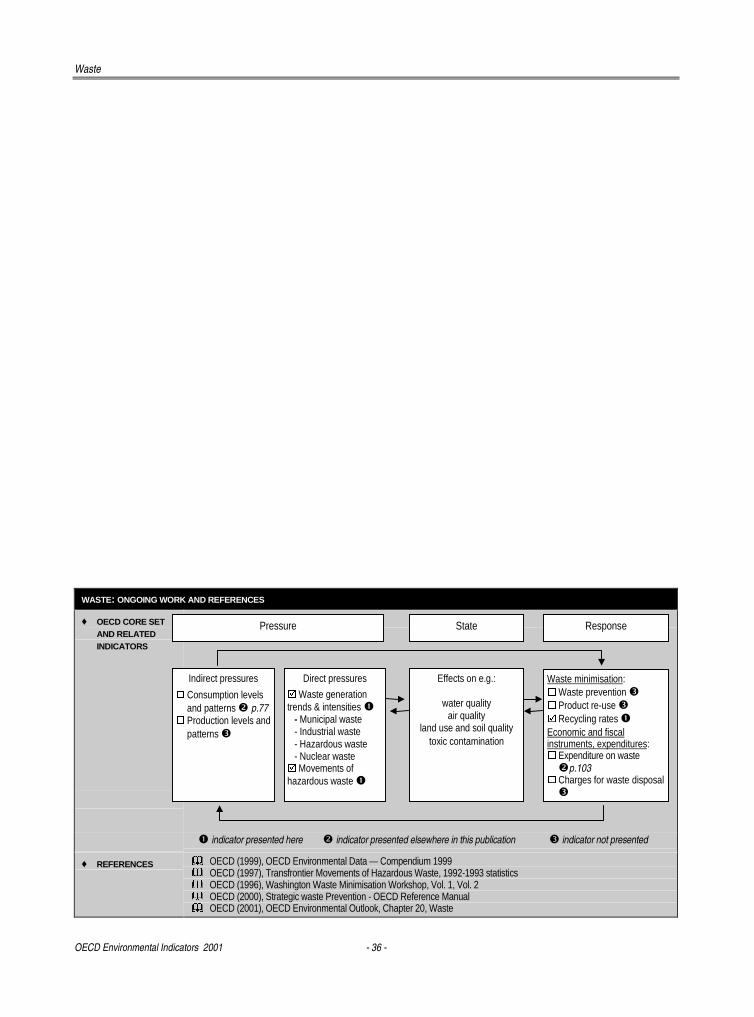
WASTE: ONGOING WORK AND REFERENCES
♦ OECD CORE SETAND RELATEDINDICATORS
� indicator presented here � indicator presented elsewhere in this publication � indicator not presented
♦ REFERENCES � OECD (1999), OECD Environmental Data — Compendium 1999� OECD (1997), Transfrontier Movements of Hazardous Waste, 1992-1993 statistics� OECD (1996), Washington Waste Minimisation Workshop, Vol. 1, Vol. 2� OECD (2000), Strategic waste Prevention - OECD Reference Manual� OECD (2001), OECD Environmental Outlook, Chapter 20, Waste
Pressure State Response
Indirect pressures
� Consumption levelsand patterns � p.77
� Production levels andpatterns �
Effects on e.g.:
water qualityair quality
land use and soil qualitytoxic contamination
Waste minimisation:� Waste prevention �� Product re-use �� Recycling rates �Economic and fiscalinstruments, expenditures:� Expenditure on waste�p.103
� Charges for waste disposal�
Direct pressures
� Waste generationtrends & intensities � - Municipal waste - Industrial waste - Hazardous waste - Nuclear waste� Movements ofhazardous waste �
Waste
- 37 - OECD Environmental Indicators 2001
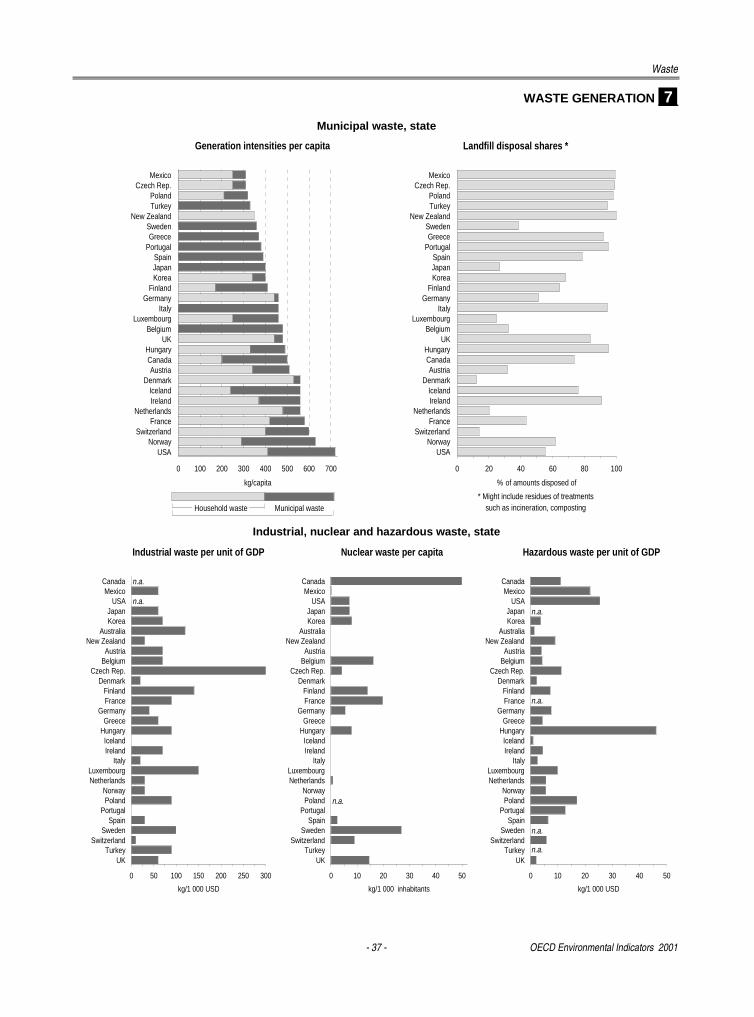
WASTE GENERATION 7
Municipal waste, state
MexicoCzech Rep.
PolandTurkey
New ZealandSwedenGreece
PortugalSpainJapanKorea
FinlandGermany
ItalyLuxembourg
BelgiumUK
HungaryCanadaAustria
DenmarkIcelandIreland
NetherlandsFrance
SwitzerlandNorway
USA
0 20 40 60 80 100
% of amounts disposed of
MexicoCzech Rep.
PolandTurkey
New ZealandSwedenGreece
PortugalSpainJapanKorea
FinlandGermany
ItalyLuxembourg
BelgiumUK
HungaryCanadaAustria
DenmarkIcelandIreland
NetherlandsFrance
SwitzerlandNorway
USA
0 100 200 300 400 500 600 700
kg/capita
Generation intensities per capita Landfill disposal shares *
Municipal waste Household waste * Might include residues of treatments
such as incineration, composting
Industrial, nuclear and hazardous waste, state
CanadaMexico
USAJapanKorea
AustraliaNew Zealand
AustriaBelgium
Czech Rep.Denmark
FinlandFrance
GermanyGreece
HungaryIcelandIreland
ItalyLuxembourgNetherlands
NorwayPoland
PortugalSpain
SwedenSwitzerland
TurkeyUK
0 10 20 30 40 50
kg/1 000 inhabitants
CanadaMexico
USAJapanKorea
AustraliaNew Zealand
AustriaBelgium
Czech Rep.Denmark
FinlandFrance
GermanyGreece
HungaryIcelandIreland
ItalyLuxembourgNetherlands
NorwayPoland
PortugalSpain
SwedenSwitzerland
TurkeyUK
0 10 20 30 40 50
kg/1 000 USD
CanadaMexico
USAJapanKorea
AustraliaNew Zealand
AustriaBelgium
Czech Rep.Denmark
FinlandFrance
GermanyGreece
HungaryIcelandIreland
ItalyLuxembourgNetherlands
NorwayPoland
PortugalSpain
SwedenSwitzerland
TurkeyUK
0 50 100 150 200 250 300
kg/1 000 USD
Industrial waste per unit of GDP Nuclear waste per capita Hazardous waste per unit of GDP
n.a.
n.a.
n.a.
n.a.
n.a.
n.a.
n.a.
Waste
OECD Environmental Indicators 2001 - 38 -
7 WASTE GENERATIONMunicipal waste
Municipal waste generatedper capita
of which:Household waste
Private final consumptionexpenditure, per capita
Management of municipal waste% of amounts disposed of
kg/cap. % change kg/cap. 1 000 USD/cap. % change Recycling/ compost. Incineration Landfilllate 1990s since 1980 late 1990s 1997 since 1980 late 1990s late 1990s late 1990s
Canada ¨ 500 .. 200 11.5 25.1 22 4 74Mexico ¨ 310 .. 250 3.8 -0.7 1 - 99USA ¨ 720 20 410 18.1 44.8 27 17 55Japan ¨ 400 5 .. 11.3 52.2 4 69 27Korea ¨ 400 .. 340 6.2 179.1 26 5 68Australia .. .. .. 10.9 34.7 .. .. ..New Zealand ¨ .. .. 350 9.0 20.7 .. .. 100Austria ¨ 510 55 340 10.8 37.7 45 16 32Belgium ¨ 480 55 .. 10.1 27.4 43 25 32Czech Rep. ¨ 310 .. 250 4.9 .. - - 99Denmark ¨ 560 40 530 9.7 31.4 29 58 12Finland ¨ 410 .. 170 8.0 34.0 33 2 65France ¨ 580 13 420 10.0 15.2 9 47 43Germany ¨ 460 .. 440 10.7 29.5 29 17 51Greece ¨ 370 42 .. 7.7 36.2 8 .. 92Hungary ¨ 490 113 330 4.0 .. - 5 95Iceland 560 .. 240 10.7 25.2 10 11 76Ireland ¨ 560 195 370 9.5 49.8 9 .. 91Italy ¨ 460 84 .. 10.8 38.9 .. 6 94Luxembourg ¨ 460 31 250 16.6 44.9 49 26 25Netherlands ¨ 560 12 480 9.5 25.0 41 31 20Norway ¨ 630 15 290 10.0 6.5 25 13 62Poland 320 14 210 3.5 .. 2 - 98Portugal ¨ 380 90 .. 7.4 53.6 5 - 95Spain ¨ 390 44 .. 8.3 35.0 17 5 79Sweden ¨ 360 .. .. 8.5 9.7 19 42 39Switzerland ¨ 600 36 400 12.4 9.2 40 46 14Turkey ¨ 330 22 .. 3.7 26.7 1 .. 95UK ¨ 480 .. 440 11.6 53.7 7 8 84* **OECD ¨ 500 22 .. 11.3 37.1 .. .. ..
♦ See Technical Annex for data sources, notes and comments.
STATE AND TRENDSSUMMARY
Although municipal waste is only one part of total waste generated, its management andtreatment represents more than one third of the public sector’s financial efforts to abate andcontrol pollution. The quantity of municipal waste generated in the OECD area has steadilyincreased since 1980 and reached 540 million tonnes in the late 1990s (500 kg per inhabitant).Generation intensity per capita has risen mostly in line with private final consumptionexpenditure and GDP, although a slight slowdown has been seen in recent years.
The amount and composition of municipal waste vary widely among OECD countries, beingrelated to levels and patterns of consumption and also depending on national wastemanagement and minimisation practices. In most countries for which data are available,increased affluence, associated with economic growth and changes in consumption patterns,tends to generate higher rates of waste per capita than 20 years ago.
In a number of OECD countries, incineration and recycling are increasingly used to reduceamounts of waste going to final disposal, and particularly to landfill. Landfill nonethelessremains the major disposal method in most OECD countries.
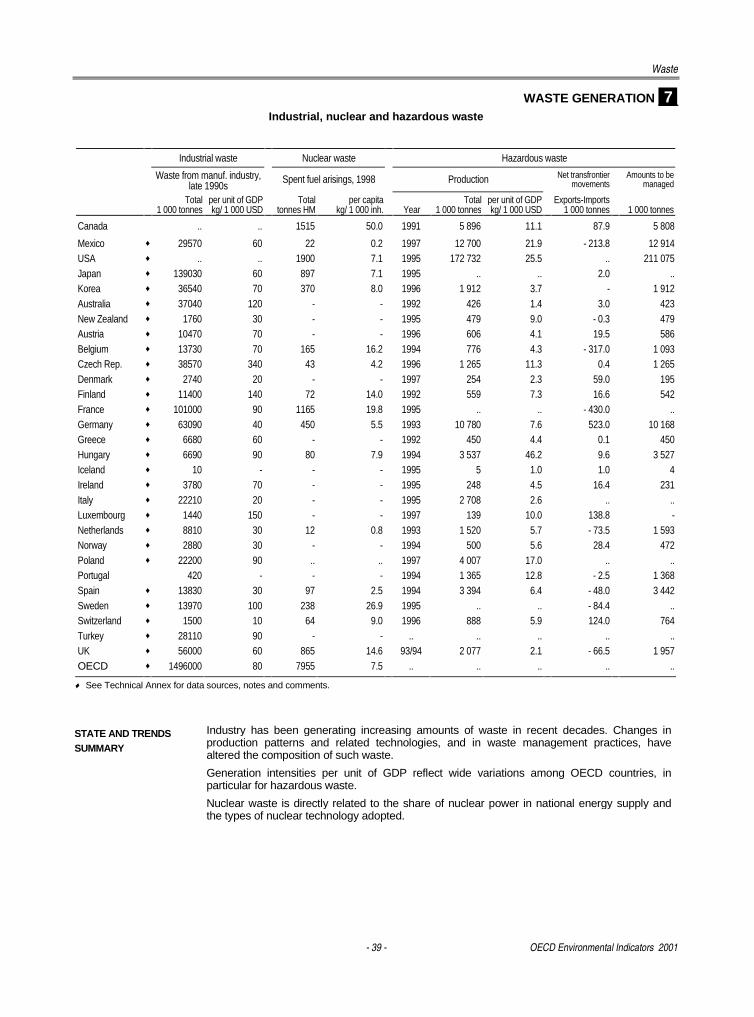
Waste
- 39 - OECD Environmental Indicators 2001
WASTE GENERATION 7Industrial, nuclear and hazardous waste
Industrial waste Nuclear waste Hazardous waste
Waste from manuf. industry,late 1990s
Spent fuel arisings, 1998 Production Net transfrontiermovements
Amounts to bemanaged
Total per unit of GDP Total per capita Total per unit of GDP Exports-Imports1 000 tonnes kg/ 1 000 USD tonnes HM kg/ 1 000 inh. Year 1 000 tonnes kg/ 1 000 USD 1 000 tonnes 1 000 tonnes
Canada .. .. 1515 50.0 1991 5 896 11.1 87.9 5 808
Mexico ♦ 29570 60 22 0.2 1997 12 700 21.9 - 213.8 12 914USA ♦ .. .. 1900 7.1 1995 172 732 25.5 .. 211 075Japan ♦ 139030 60 897 7.1 1995 .. .. 2.0 ..Korea ♦ 36540 70 370 8.0 1996 1 912 3.7 - 1 912Australia ♦ 37040 120 - - 1992 426 1.4 3.0 423New Zealand ♦ 1760 30 - - 1995 479 9.0 - 0.3 479Austria ♦ 10470 70 - - 1996 606 4.1 19.5 586Belgium ♦ 13730 70 165 16.2 1994 776 4.3 - 317.0 1 093Czech Rep. ♦ 38570 340 43 4.2 1996 1 265 11.3 0.4 1 265Denmark ♦ 2740 20 - - 1997 254 2.3 59.0 195Finland ♦ 11400 140 72 14.0 1992 559 7.3 16.6 542France ♦ 101000 90 1165 19.8 1995 .. .. - 430.0 ..Germany ♦ 63090 40 450 5.5 1993 10 780 7.6 523.0 10 168Greece ♦ 6680 60 - - 1992 450 4.4 0.1 450Hungary ♦ 6690 90 80 7.9 1994 3 537 46.2 9.6 3 527Iceland ♦ 10 - - - 1995 5 1.0 1.0 4Ireland ♦ 3780 70 - - 1995 248 4.5 16.4 231Italy ♦ 22210 20 - - 1995 2 708 2.6 .. ..Luxembourg ♦ 1440 150 - - 1997 139 10.0 138.8 -Netherlands ♦ 8810 30 12 0.8 1993 1 520 5.7 - 73.5 1 593Norway ♦ 2880 30 - - 1994 500 5.6 28.4 472Poland ♦ 22200 90 .. .. 1997 4 007 17.0 .. ..Portugal 420 - - - 1994 1 365 12.8 - 2.5 1 368Spain ♦ 13830 30 97 2.5 1994 3 394 6.4 - 48.0 3 442Sweden ♦ 13970 100 238 26.9 1995 .. .. - 84.4 ..Switzerland ♦ 1500 10 64 9.0 1996 888 5.9 124.0 764Turkey ♦ 28110 90 - - .. .. .. .. ..UK ♦ 56000 60 865 14.6 93/94 2 077 2.1 - 66.5 1 957OECD ♦ 1496000 80 7955 7.5 .. .. .. .. ..
♦ See Technical Annex for data sources, notes and comments.
STATE AND TRENDSSUMMARY
Industry has been generating increasing amounts of waste in recent decades. Changes inproduction patterns and related technologies, and in waste management practices, havealtered the composition of such waste.
Generation intensities per unit of GDP reflect wide variations among OECD countries, inparticular for hazardous waste.
Nuclear waste is directly related to the share of nuclear power in national energy supply andthe types of nuclear technology adopted.
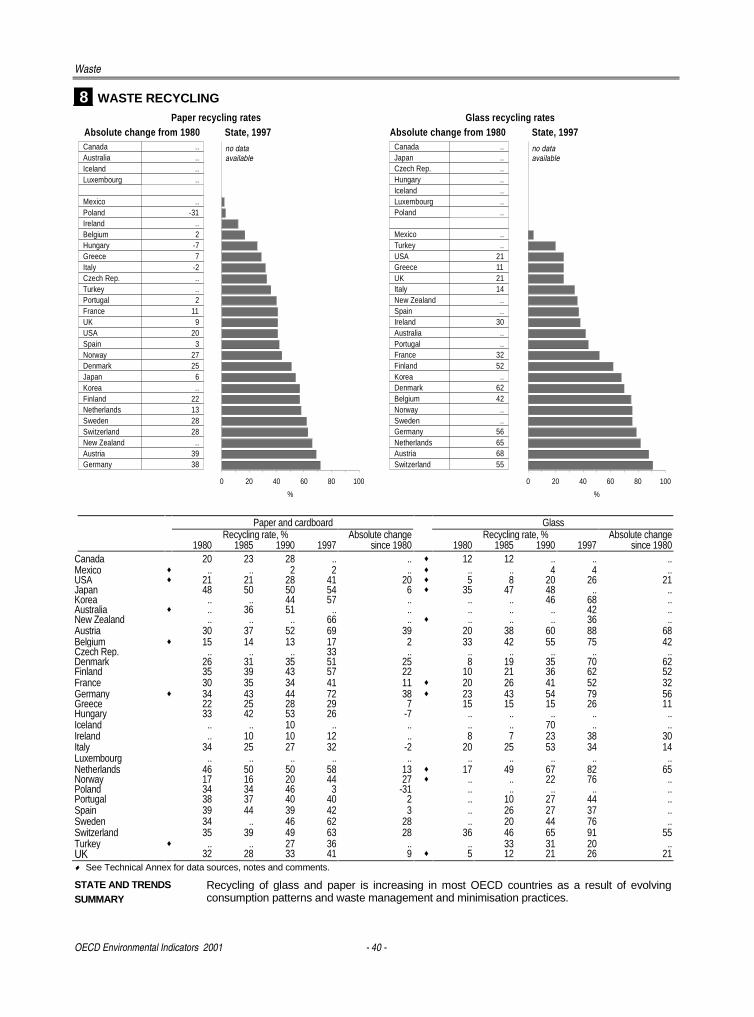
Waste
OECD Environmental Indicators 2001 - 40 -
8 WASTE RECYCLING
CanadaAustralia
IcelandLuxembourg
MexicoPolandIreland
BelgiumHungaryGreece
ItalyCzech Rep.
TurkeyPortugal
FranceUK
USASpain
NorwayDenmark
JapanKorea
FinlandNetherlands
SwedenSwitzerland
New ZealandAustria
Germany
0 20 40 60 80 100
%
Paper recycling rates Glass recycling rates
no dataavailable
CanadaJapan
Czech Rep.Hungary
IcelandLuxembourg
Poland
MexicoTurkey
USAGreece
UKItaly
New ZealandSpain
IrelandAustraliaPortugal
FranceFinland
KoreaDenmarkBelgiumNorwaySweden
GermanyNetherlands
AustriaSwitzerland
0 20 40 60 80 100
%
no dataavailable
Absolute change from 1980 Absolute change from 1980State, 1997 State, 1997Canada ..Australia ..Iceland ..Luxembourg ..
Mexico ..Poland -31Ireland ..Belgium 2Hungary -7Greece 7Italy -2Czech Rep. ..Turkey ..Portugal 2France 11UK 9USA 20Spain 3Norway 27Denmark 25Japan 6Korea ..Finland 22Netherlands 13Sweden 28Switzerland 28New Zealand ..Austria 39Germany 38
Canada ..Japan ..Czech Rep. ..Hungary ..Iceland ..Luxembourg ..Poland ..
Mexico ..Turkey ..USA 21Greece 11UK 21Italy 14New Zealand ..Spain ..Ireland 30Australia ..Portugal ..France 32Finland 52Korea ..Denmark 62Belgium 42Norway ..Sweden ..Germany 56Netherlands 65Austria 68Switzerland 55
Paper and cardboard GlassRecycling rate, % Absolute change Recycling rate, % Absolute change
1980 1985 1990 1997 since 1980 1980 1985 1990 1997 since 1980Canada 20 23 28 .. .. ♦ 12 12 .. .. ..Mexico ♦ .. .. 2 2 .. ♦ .. .. 4 4 ..USA ♦ 21 21 28 41 20 ♦ 5 8 20 26 21Japan 48 50 50 54 6 ♦ 35 47 48 .. ..Korea .. .. 44 57 .. .. .. 46 68 ..Australia ♦ .. 36 51 .. .. .. .. .. 42 ..New Zealand .. .. .. 66 .. ♦ .. .. .. 36 ..Austria 30 37 52 69 39 20 38 60 88 68Belgium ♦ 15 14 13 17 2 33 42 55 75 42Czech Rep. .. .. .. 33 .. .. .. .. .. ..Denmark 26 31 35 51 25 8 19 35 70 62Finland 35 39 43 57 22 10 21 36 62 52France 30 35 34 41 11 ♦ 20 26 41 52 32Germany ♦ 34 43 44 72 38 ♦ 23 43 54 79 56Greece 22 25 28 29 7 15 15 15 26 11Hungary 33 42 53 26 -7 .. .. .. .. ..Iceland .. .. 10 .. .. .. .. 70 .. ..Ireland .. 10 10 12 .. 8 7 23 38 30Italy 34 25 27 32 -2 20 25 53 34 14Luxembourg .. .. .. .. .. .. .. .. .. ..Netherlands 46 50 50 58 13 ♦ 17 49 67 82 65Norway 17 16 20 44 27 ♦ .. .. 22 76 ..Poland 34 34 46 3 -31 .. .. .. .. ..Portugal 38 37 40 40 2 .. 10 27 44 ..Spain 39 44 39 42 3 .. 26 27 37 ..Sweden 34 .. 46 62 28 .. 20 44 76 ..Switzerland 35 39 49 63 28 36 46 65 91 55Turkey ♦ .. .. 27 36 .. .. 33 31 20 ..UK 32 28 33 41 9 ♦ 5 12 21 26 21♦ See Technical Annex for data sources, notes and comments.
STATE AND TRENDSSUMMARY
Recycling of glass and paper is increasing in most OECD countries as a result of evolvingconsumption patterns and waste management and minimisation practices.
- 41 -
�����������
Water quality, closely linked to water quantity, is of economic, environmental and socialimportance. It has many aspects (physical, chemical, microbial, biological), and can bedefined in terms of a water body’s suitability for various uses, such as public water supply,swimming or protection of aquatic life. It is affected by water abstractions, by pollution loadsfrom human activities (agriculture, industry, households), and by climate and weather.Pollution loads from diffuse agricultural sources are an issue in many countries, as is thesupply of permanently safe drinking water to the entire population
If pressure from human activities becomes so intense that water quality is impaired to thepoint that drinking water requires ever more advanced and costly treatment or that aquaticplant and animal species in rivers and lakes are greatly reduced, then the sustainability ofwater resource use is in question. Performance can be assessed against domestic objectivesand international commitments. At national level, countries have set receiving waterstandards, effluent limits and pollution load reduction targets for a range of parameters (e.g.oxygen, nutrients, micropollutants). In many cases, they are also committed to internationalagreements such as the OSPAR Convention on the Protection of the North-East AtlanticMarine Environment, the International Joint Commission Agreement on Great Lakes WaterQuality in North America or the EU water directives. Protection of freshwater quality andsupply is an important part of Agenda 21, adopted at UNCED (Rio de Janeiro, 1992). Themain challenge is to protect and restore all bodies of surface and ground water to ensure theachievement of water quality objectives, and to apply an integrated management of waterresources based on the ecosystem approach.
Indicators presented here relate to:
♦ river water quality, presenting two parameters (oxygen and nitrate content) for selectedrivers. Data are shown for representative sites at the mouth or downstream frontier, givinga summary view of the pollution load and clean-up efforts on the upstream watershed.
♦ waste water treatment, particularly sewage treatment connection rates, i.e. the percentageof the national resident population actually connected to public waste water treatmentplants in the late 1990s. The extent of secondary and/or tertiary (chemical and/orbiological) sewage treatment provides an indication of efforts to reduce pollution loads. Itdoes not take into account private facilities, used where public systems are not economic.This indicator should be related to an optimal national connection rate taking into accountnational specificities such as population in remote areas. Sewerage connection rates andpublic expenditure on waste water treatment are given as supplementary information.
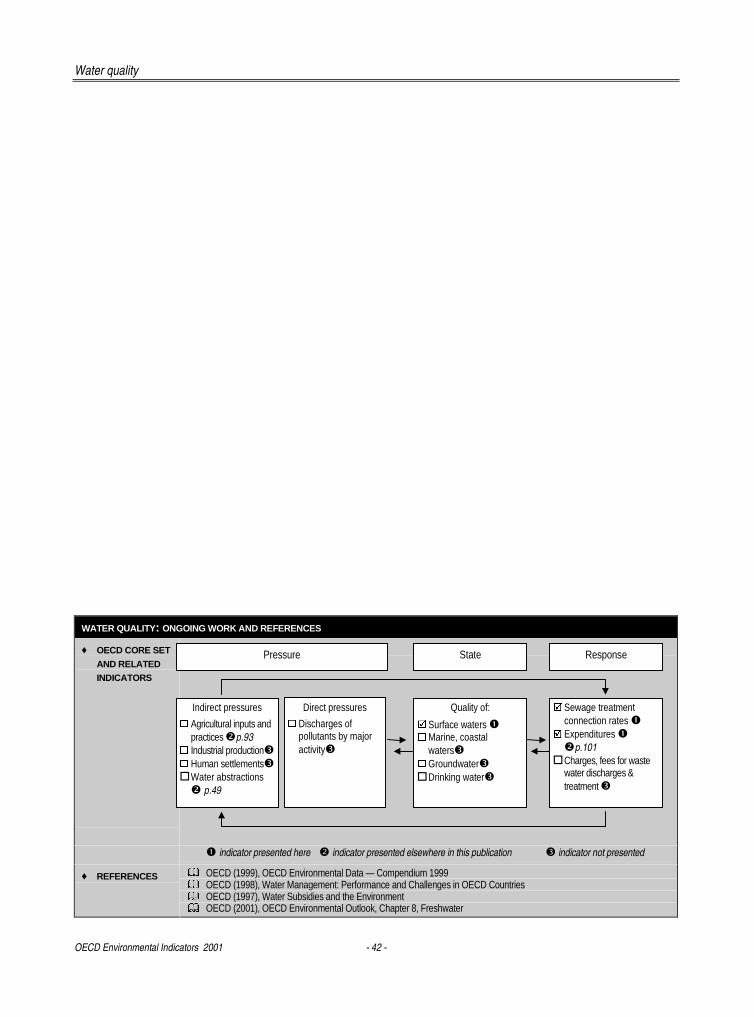
Water quality
OECD Environmental Indicators 2001 - 42 -
WATER QUALITY: ONGOING WORK AND REFERENCES
♦ OECD CORE SET
AND RELATEDINDICATORS
� indicator presented here � indicator presented elsewhere in this publication � indicator not presented
♦ REFERENCES � OECD (1999), OECD Environmental Data — Compendium 1999� OECD (1998), Water Management: Performance and Challenges in OECD Countries� OECD (1997), Water Subsidies and the Environment� OECD (2001), OECD Environmental Outlook, Chapter 8, Freshwater
Pressure State Response
Indirect pressures
� Agricultural inputs andpractices �p.93
� Industrial production�� Human settlements�� Water abstractions� p.49
Quality of:
� Surface waters �� Marine, coastal
waters�� Groundwater�� Drinking water�
� Sewage treatmentconnection rates �
� Expenditures ��p.101
� Charges, fees for wastewater discharges &treatment �
Direct pressures
� Discharges ofpollutants by majoractivity�
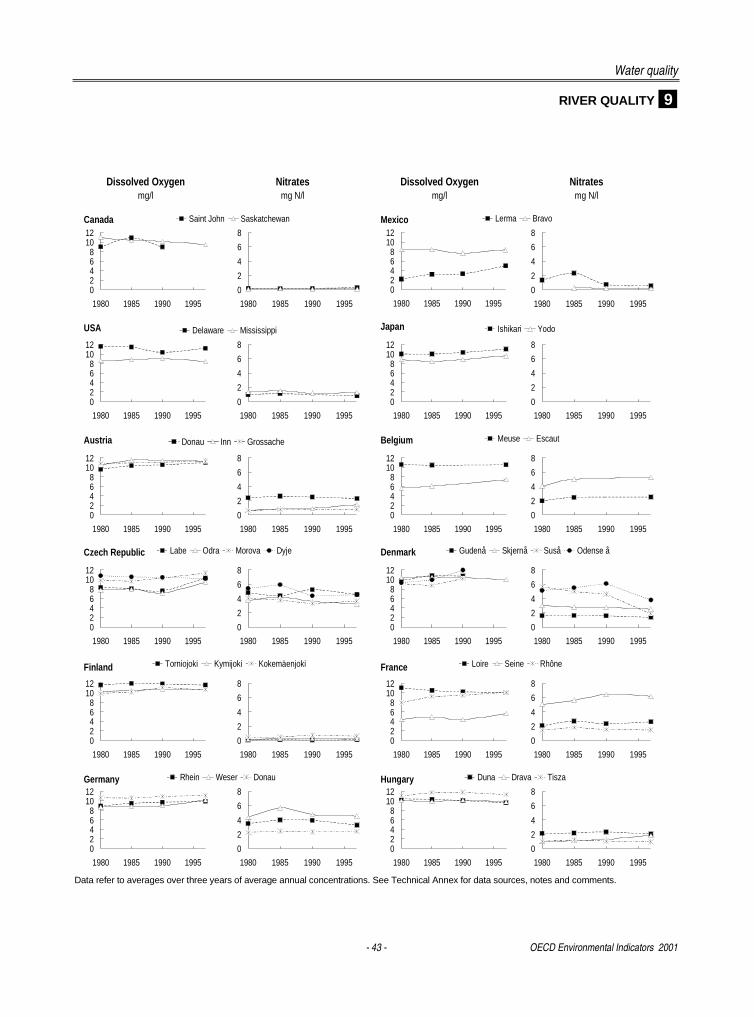
Water quality
- 43 - OECD Environmental Indicators 2001
RIVER QUALITY 9
Mexico
Dissolved Oxygenmg/l
Nitratesmg N/l
Dissolved Oxygenmg/l
Nitratesmg N/l
USA Japan
Austria Belgium
Finland France
Germany Hungary
Czech Republic
02468
1012
1980 1985 1990 1995
02468
1012
1980 1985 1990 1995
02468
1012
1980 1985 1990 1995
02468
1012
1980 1985 1990 1995
02468
1012
1980 1985 1990 1995
02468
1012
1980 1985 1990 1995
02468
1012
1980 1985 1990 1995
02468
1012
1980 1985 1990 1995
02468
1012
1980 1985 1990 1995
02468
1012
1980 1985 1990 1995
0
2
4
6
8
1980 1985 1990 1995
0
2
4
6
8
1980 1985 1990 1995
0
2
4
6
8
1980 1985 1990 1995
0
2
4
6
8
1980 1985 1990 1995
0
2
4
6
8
1980 1985 1990 1995
0
2
4
6
8
1980 1985 1990 1995
0
2
4
6
8
1980 1985 1990 1995
0
2
4
6
8
1980 1985 1990 1995
0
2
4
6
8
1980 1985 1990 1995
0
2
4
6
8
1980 1985 1990 1995
Lerma Bravo
Delaware Mississippi Ishikari Yodo
Donau Inn Grossache Meuse Escaut
Labe Odra Morova Dyje
Torniojoki Kymijoki Kokemäenjoki Loire Seine Rhône
Rhein Weser Donau Duna Drava Tisza
02468
1012
1980 1985 1990 1995
0
2
4
6
8
1980 1985 1990 1995
Canada Saint John Saskatchewan
02468
1012
1980 1985 1990 1995
0
2
4
6
8
1980 1985 1990 1995
Denmark Gudenå Skjernå Suså Odense å
Data refer to averages over three years of average annual concentrations. See Technical Annex for data sources, notes and comments.
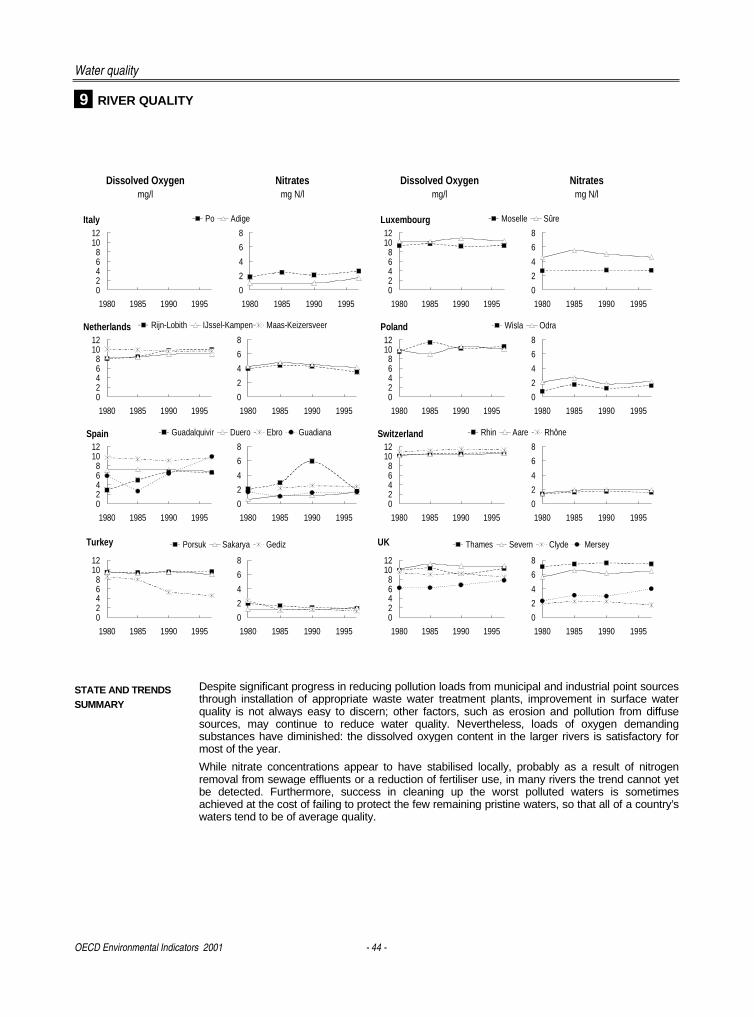
Water quality
OECD Environmental Indicators 2001 - 44 -
9 RIVER QUALITY
Dissolved Oxygenmg/l
Nitratesmg N/l
Dissolved Oxygenmg/l
Nitratesmg N/l
Italy
Netherlands
Spain
Turkey
Luxembourg
UK
Switzerland
Poland
02468
1012
1980 1985 1990 1995
02468
1012
1980 1985 1990 1995
02468
1012
1980 1985 1990 1995
02468
1012
1980 1985 1990 1995
02468
1012
1980 1985 1990 1995
02468
1012
1980 1985 1990 1995
02468
1012
1980 1985 1990 1995
02468
1012
1980 1985 1990 1995
0
2
4
6
8
1980 1985 1990 1995
0
2
4
6
8
1980 1985 1990 1995
0
2
4
6
8
1980 1985 1990 1995
0
2
4
6
8
1980 1985 1990 1995
0
2
4
6
8
1980 1985 1990 1995
0
2
4
6
8
1980 1985 1990 1995
0
2
4
6
8
1980 1985 1990 1995
0
2
4
6
8
1980 1985 1990 1995
Po Adige Moselle Sûre
Rijn-Lobith IJssel-Kampen Maas-Keizersveer Wisla Odra
Guadalquivir Duero Ebro Guadiana Rhin Aare Rhône
Porsuk Sakarya Gediz Thames Severn Clyde Mersey
STATE AND TRENDSSUMMARY
Despite significant progress in reducing pollution loads from municipal and industrial point sourcesthrough installation of appropriate waste water treatment plants, improvement in surface waterquality is not always easy to discern; other factors, such as erosion and pollution from diffusesources, may continue to reduce water quality. Nevertheless, loads of oxygen demandingsubstances have diminished: the dissolved oxygen content in the larger rivers is satisfactory formost of the year.
While nitrate concentrations appear to have stabilised locally, probably as a result of nitrogenremoval from sewage effluents or a reduction of fertiliser use, in many rivers the trend cannot yetbe detected. Furthermore, success in cleaning up the worst polluted waters is sometimesachieved at the cost of failing to protect the few remaining pristine waters, so that all of a country’swaters tend to be of average quality.
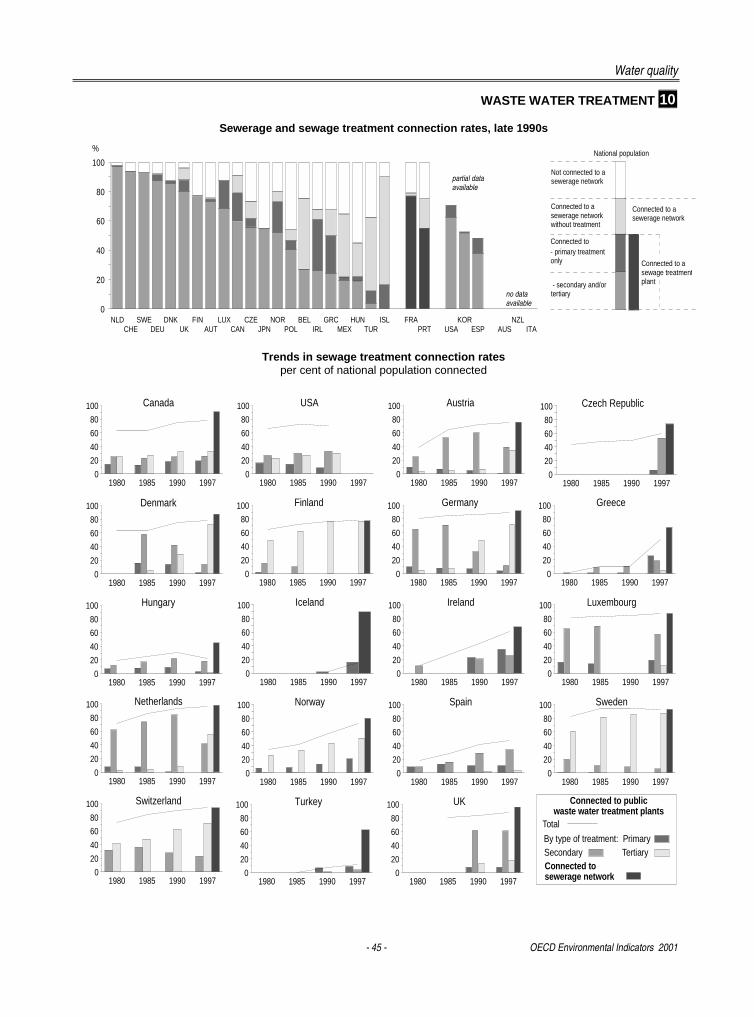
Water quality
- 45 - OECD Environmental Indicators 2001
WASTE WATER TREATMENT 10
Sewerage and sewage treatment connection rates, late 1990s
NLDCHE
SWEDEU
DNKUK
FINAUT
LUXCAN
CZEJPN
NORPOL
BELIRL
GRCMEX
HUNTUR
ISL
FRAPRT
USA
KORESP
AUS
NZLITA
0
20
40
60
80
100
% National population
no data available
Not connected to a sewerage network
Connected to a sewerage network without treatment
Connected to a sewerage network
Connected to- primary treatment only
- secondary and/or tertiary
Connected to a sewage treatmentplant
partial data available
Trends in sewage treatment connection ratesper cent of national population connected
1980 1985 1990 19970
20
40
60
80
100 Canada
1980 1985 1990 19970
20
40
60
80
100 Finland
1980 1985 1990 19970
20
40
60
80
100 Iceland
1980 1985 1990 19970
20
40
60
80
100 Norway
1980 1985 1990 19970
20
40
60
80
100 Turkey
1980 1985 1990 19970
20
40
60
80
100 USA
1980 1985 1990 19970
20
40
60
80
100 Germany
1980 1985 1990 19970
20
40
60
80
100 Ireland
1980 1985 1990 19970
20
40
60
80
100 Spain
1980 1985 1990 19970
20
40
60
80
100 UK
1980 1985 1990 19970
20
40
60
80
100 Austria
1980 1985 1990 19970
20
40
60
80
100 Greece
1980 1985 1990 19970
20
40
60
80
100 Luxembourg
1980 1985 1990 19970
20
40
60
80
100 Sweden
1980 1985 1990 19970
20
40
60
80
100 Czech Republic
1980 1985 1990 19970
20
40
60
80
100 Denmark
1980 1985 1990 19970
20
40
60
80
100 Hungary
1980 1985 1990 19970
20
40
60
80
100 Netherlands
1980 1985 1990 19970
20
40
60
80
100 Switzerland Connected to publicwaste water treatment plants
By type of treatment: PrimarySecondary Tertiary
Total
Connected tosewerage network
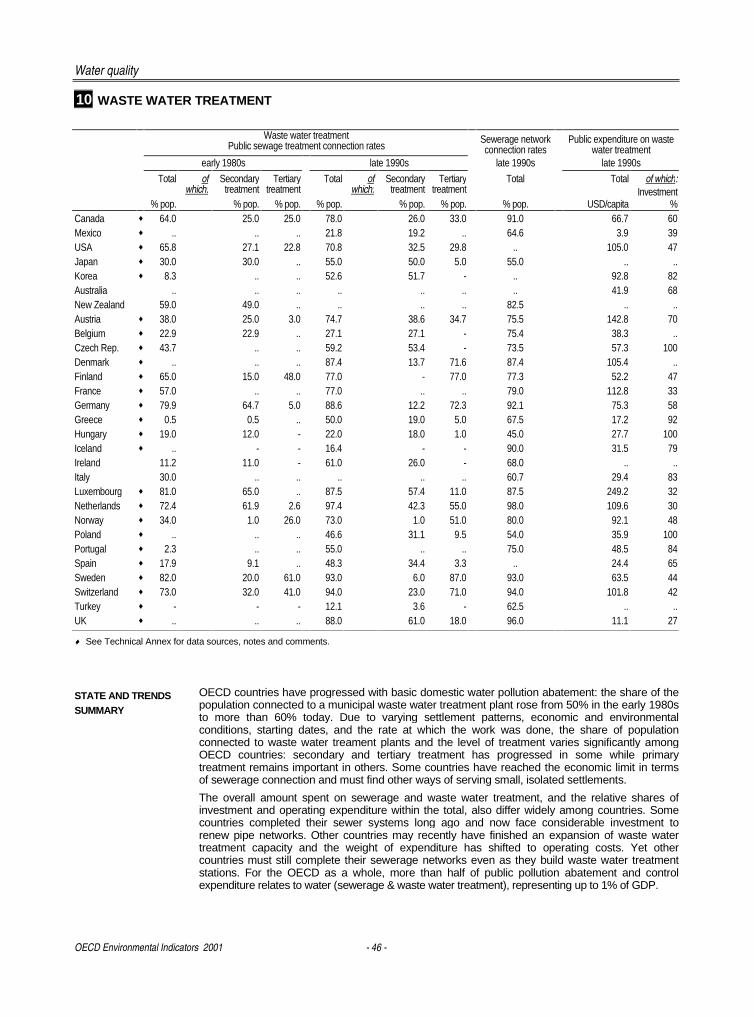
Water quality
OECD Environmental Indicators 2001 - 46 -
10 WASTE WATER TREATMENT
Waste water treatmentPublic sewage treatment connection rates
Sewerage networkconnection rates
Public expenditure on wastewater treatment
early 1980s late 1990s late 1990s late 1990s
Total ofwhich:
Secondarytreatment
Tertiarytreatment
Total ofwhich:
Secondarytreatment
Tertiarytreatment
Total Total of which:Investment
% pop. % pop. % pop. % pop. % pop. % pop. % pop. USD/capita %Canada ♦ 64.0 25.0 25.0 78.0 26.0 33.0 91.0 66.7 60Mexico ♦ .. .. .. 21.8 19.2 .. 64.6 3.9 39USA ♦ 65.8 27.1 22.8 70.8 32.5 29.8 .. 105.0 47Japan ♦ 30.0 30.0 .. 55.0 50.0 5.0 55.0 .. ..Korea ♦ 8.3 .. .. 52.6 51.7 - .. 92.8 82Australia .. .. .. .. .. .. .. 41.9 68New Zealand 59.0 49.0 .. .. .. .. 82.5 .. ..Austria ♦ 38.0 25.0 3.0 74.7 38.6 34.7 75.5 142.8 70Belgium ♦ 22.9 22.9 .. 27.1 27.1 - 75.4 38.3 ..Czech Rep. ♦ 43.7 .. .. 59.2 53.4 - 73.5 57.3 100Denmark ♦ .. .. .. 87.4 13.7 71.6 87.4 105.4 ..Finland ♦ 65.0 15.0 48.0 77.0 - 77.0 77.3 52.2 47France ♦ 57.0 .. .. 77.0 .. .. 79.0 112.8 33Germany ♦ 79.9 64.7 5.0 88.6 12.2 72.3 92.1 75.3 58Greece ♦ 0.5 0.5 .. 50.0 19.0 5.0 67.5 17.2 92Hungary ♦ 19.0 12.0 - 22.0 18.0 1.0 45.0 27.7 100Iceland ♦ .. - - 16.4 - - 90.0 31.5 79Ireland 11.2 11.0 - 61.0 26.0 - 68.0 .. ..Italy 30.0 .. .. .. .. .. 60.7 29.4 83Luxembourg ♦ 81.0 65.0 .. 87.5 57.4 11.0 87.5 249.2 32Netherlands ♦ 72.4 61.9 2.6 97.4 42.3 55.0 98.0 109.6 30Norway ♦ 34.0 1.0 26.0 73.0 1.0 51.0 80.0 92.1 48Poland ♦ .. .. .. 46.6 31.1 9.5 54.0 35.9 100Portugal ♦ 2.3 .. .. 55.0 .. .. 75.0 48.5 84Spain ♦ 17.9 9.1 .. 48.3 34.4 3.3 .. 24.4 65Sweden ♦ 82.0 20.0 61.0 93.0 6.0 87.0 93.0 63.5 44Switzerland ♦ 73.0 32.0 41.0 94.0 23.0 71.0 94.0 101.8 42Turkey ♦ - - - 12.1 3.6 - 62.5 .. ..UK ♦ .. .. .. 88.0 61.0 18.0 96.0 11.1 27
♦ See Technical Annex for data sources, notes and comments.
STATE AND TRENDSSUMMARY
OECD countries have progressed with basic domestic water pollution abatement: the share of thepopulation connected to a municipal waste water treatment plant rose from 50% in the early 1980sto more than 60% today. Due to varying settlement patterns, economic and environmentalconditions, starting dates, and the rate at which the work was done, the share of populationconnected to waste water treament plants and the level of treatment varies significantly amongOECD countries: secondary and tertiary treatment has progressed in some while primarytreatment remains important in others. Some countries have reached the economic limit in termsof sewerage connection and must find other ways of serving small, isolated settlements.
The overall amount spent on sewerage and waste water treatment, and the relative shares ofinvestment and operating expenditure within the total, also differ widely among countries. Somecountries completed their sewer systems long ago and now face considerable investment torenew pipe networks. Other countries may recently have finished an expansion of waste watertreatment capacity and the weight of expenditure has shifted to operating costs. Yet othercountries must still complete their sewerage networks even as they build waste water treatmentstations. For the OECD as a whole, more than half of public pollution abatement and controlexpenditure relates to water (sewerage & waste water treatment), representing up to 1% of GDP.
- 47 -
�������������
Freshwater resources are of major environmental and economic importance. Their distributionvaries widely among and within countries. When consumers do not pay the full cost of water,they tend to use it inefficiently. This can result in serious problems, such as low river flows,water shortages, salinisation of freshwater bodies in coastal areas, human health problems,loss of wetlands, desertification and reduced food production. Pressures on water resourcesare exerted by overexploitation as well as by degradation of environmental quality. Relatingresource abstraction to renewal of stocks is a central question concerning sustainable waterresource management. If a significant share of a country’s water comes from transboundaryrivers, tensions between countries can arise, especially if water availability in the upstreamcountry is less than in the downstream one.
Sustainable management of water resources has become a major concern in many countries:it can affect human health and the sustainability of agriculture. The efficiency of water use iskey in matching supply and demand. Reducing losses, using more efficient technologies andrecycling are all part of the solution, but applying the user pays principle to all types of userswill be an essential element of sustainable management. Another important element is theapplication of an integrated approach to the management of freshwater resources by riverbasin. Performance can be assessed against domestic objectives and internationalcommitments. Agenda 21, adopted at UNCED (Rio de Janeiro, 1992), explicitly considersitems such as the protection and preservation of freshwater resources. The main challenge isto ensure a sustainable management of water resources, avoiding overexploitation anddegradation, so as to maintain adequate supply of freshwater of suitable quality for humanuse and to support aquatic and other ecosystems.
Indicators presented here relate to:
♦ the intensity of use of water resources, expressed as gross abstractions as % of totalavailable renewable freshwater resources (including inflows from neighbouring countries)as % of internal resources (i.e. precipitations - evapotranspiration) and per capita. Wheninterpreting this indicator, it should be kept in mind that it gives insights into quantitativeaspects of water resources and that a national level indicator may hide territorialdifferences and should be complemented with information at sub-national level.
♦ prices for public water supply to households, expressed in US dollars per cubic metresupplied. Abstractions for public water supply per capita are shown as complementaryinformation.
These indicators should be read in connection with other indicators of the OECD Core Setand in particular with indicators on the quality of water resources.
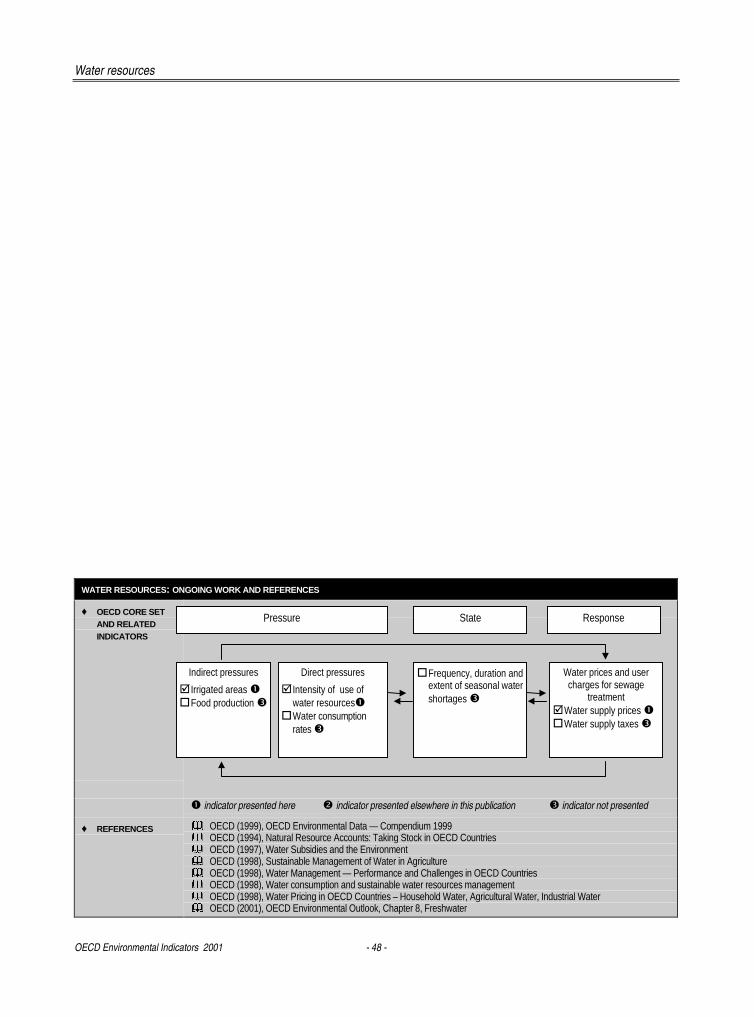
Water resources
OECD Environmental Indicators 2001 - 48 -
WATER RESOURCES: ONGOING WORK AND REFERENCES
♦ OECD CORE SETAND RELATEDINDICATORS
� indicator presented here � indicator presented elsewhere in this publication � indicator not presented
♦ REFERENCES � OECD (1999), OECD Environmental Data — Compendium 1999� OECD (1994), Natural Resource Accounts: Taking Stock in OECD Countries� OECD (1997), Water Subsidies and the Environment� OECD (1998), Sustainable Management of Water in Agriculture� OECD (1998), Water Management — Performance and Challenges in OECD Countries� OECD (1998), Water consumption and sustainable water resources management� OECD (1998), Water Pricing in OECD Countries – Household Water, Agricultural Water, Industrial Water� OECD (2001), OECD Environmental Outlook, Chapter 8, Freshwater
Pressure State Response
Indirect pressures
� Irrigated areas �� Food production �
� Frequency, duration andextent of seasonal watershortages �
Water prices and usercharges for sewage
treatment� Water supply prices �� Water supply taxes �
Direct pressures
� Intensity of use ofwater resources�
� Water consumptionrates �
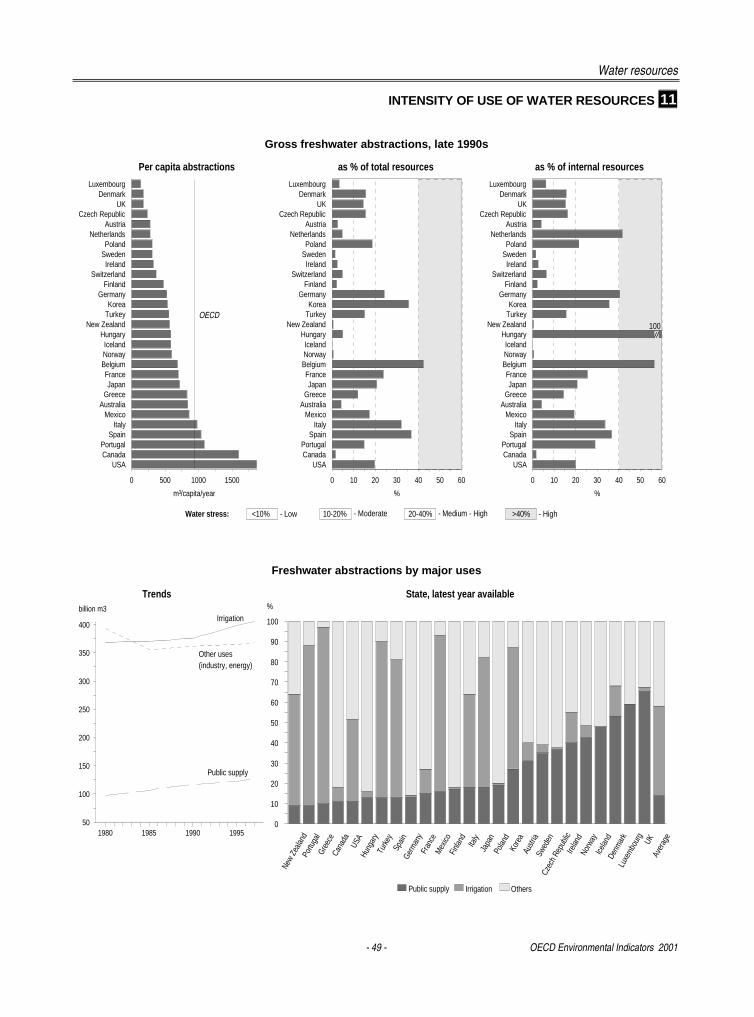
Water resources
- 49 - OECD Environmental Indicators 2001
INTENSITY OF USE OF WATER RESOURCES 11
Gross freshwater abstractions, late 1990s
Freshwater abstractions by major uses
New
Zeala
ndPo
rtuga
lGr
eece
Cana
daUS
AHu
ngar
yTu
rkey
Spain
Germ
any
Fran
ceM
exico
Finla
nd Italy
Japa
nPo
land
Kore
aAu
stria
Swed
enCz
ech
Repu
blic
Irelan
dNo
rway
Icelan
dDe
nmar
kLu
xem
bour
gUK
Aver
age
0
10
20
30
40
50
60
70
80
90
100
%
1980 1985 1990 199550
100
150
200
250
300
350
400
billion m3
Trends State, latest year available
OthersIrrigationPublic supply
Other uses(industry, energy)
Irrigation
Public supply
LuxembourgDenmark
UKCzech Republic
AustriaNetherlands
PolandSwedenIreland
SwitzerlandFinland
GermanyKorea
TurkeyNew Zealand
HungaryIcelandNorwayBelgiumFranceJapan
GreeceAustralia
MexicoItaly
SpainPortugalCanada
USA
0 500 1000 1500
m /capita/year
OECD
Per capita abstractions as % of total resources as % of internal resources
Water stress: >40% - High20-40% - Medium - High10-20% - Moderate<10% - Low
LuxembourgDenmark
UKCzech Republic
AustriaNetherlands
PolandSwedenIreland
SwitzerlandFinland
GermanyKorea
TurkeyNew Zealand
HungaryIcelandNorwayBelgiumFranceJapan
GreeceAustralia
MexicoItaly
SpainPortugalCanada
USA
0 10 20 30 40 50 60
%
LuxembourgDenmark
UKCzech Republic
AustriaNetherlands
PolandSwedenIreland
SwitzerlandFinland
GermanyKorea
TurkeyNew Zealand
HungaryIcelandNorwayBelgiumFranceJapan
GreeceAustralia
MexicoItaly
SpainPortugalCanada
USA
0 10 20 30 40 50 60
%
100
3
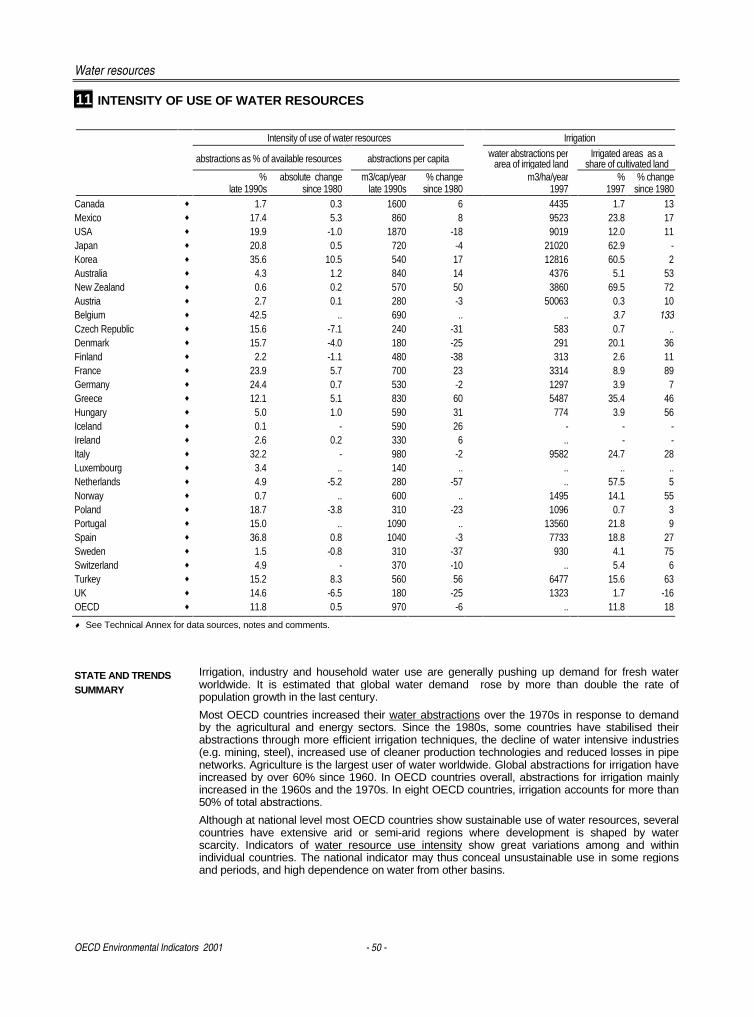
Water resources
OECD Environmental Indicators 2001 - 50 -
11 INTENSITY OF USE OF WATER RESOURCES
Intensity of use of water resources Irrigation
abstractions as % of available resources abstractions per capita water abstractions perarea of irrigated land
Irrigated areas as ashare of cultivated land
% absolute change m3/cap/year % change m3/ha/year % % changelate 1990s since 1980 late 1990s since 1980 1997 1997 since 1980
Canada ♦ 1.7 0.3 1600 6 4435 1.7 13Mexico ♦ 17.4 5.3 860 8 9523 23.8 17USA ♦ 19.9 -1.0 1870 -18 9019 12.0 11Japan ♦ 20.8 0.5 720 -4 21020 62.9 -Korea ♦ 35.6 10.5 540 17 12816 60.5 2Australia ♦ 4.3 1.2 840 14 4376 5.1 53New Zealand ♦ 0.6 0.2 570 50 3860 69.5 72Austria ♦ 2.7 0.1 280 -3 50063 0.3 10Belgium ♦ 42.5 .. 690 .. .. 3.7 133Czech Republic ♦ 15.6 -7.1 240 -31 583 0.7 ..Denmark ♦ 15.7 -4.0 180 -25 291 20.1 36Finland ♦ 2.2 -1.1 480 -38 313 2.6 11France ♦ 23.9 5.7 700 23 3314 8.9 89Germany ♦ 24.4 0.7 530 -2 1297 3.9 7Greece ♦ 12.1 5.1 830 60 5487 35.4 46Hungary ♦ 5.0 1.0 590 31 774 3.9 56Iceland ♦ 0.1 - 590 26 - - -Ireland ♦ 2.6 0.2 330 6 .. - -Italy ♦ 32.2 - 980 -2 9582 24.7 28Luxembourg ♦ 3.4 .. 140 .. .. .. ..Netherlands ♦ 4.9 -5.2 280 -57 .. 57.5 5Norway ♦ 0.7 .. 600 .. 1495 14.1 55Poland ♦ 18.7 -3.8 310 -23 1096 0.7 3Portugal ♦ 15.0 .. 1090 .. 13560 21.8 9Spain ♦ 36.8 0.8 1040 -3 7733 18.8 27Sweden ♦ 1.5 -0.8 310 -37 930 4.1 75Switzerland ♦ 4.9 - 370 -10 .. 5.4 6Turkey ♦ 15.2 8.3 560 56 6477 15.6 63UK ♦ 14.6 -6.5 180 -25 1323 1.7 -16OECD ♦ 11.8 0.5 970 -6 .. 11.8 18
♦ See Technical Annex for data sources, notes and comments.
STATE AND TRENDSSUMMARY
Irrigation, industry and household water use are generally pushing up demand for fresh waterworldwide. It is estimated that global water demand rose by more than double the rate ofpopulation growth in the last century.
Most OECD countries increased their water abstractions over the 1970s in response to demandby the agricultural and energy sectors. Since the 1980s, some countries have stabilised theirabstractions through more efficient irrigation techniques, the decline of water intensive industries(e.g. mining, steel), increased use of cleaner production technologies and reduced losses in pipenetworks. Agriculture is the largest user of water worldwide. Global abstractions for irrigation haveincreased by over 60% since 1960. In OECD countries overall, abstractions for irrigation mainlyincreased in the 1960s and the 1970s. In eight OECD countries, irrigation accounts for more than50% of total abstractions.
Although at national level most OECD countries show sustainable use of water resources, severalcountries have extensive arid or semi-arid regions where development is shaped by waterscarcity. Indicators of water resource use intensity show great variations among and withinindividual countries. The national indicator may thus conceal unsustainable use in some regionsand periods, and high dependence on water from other basins.
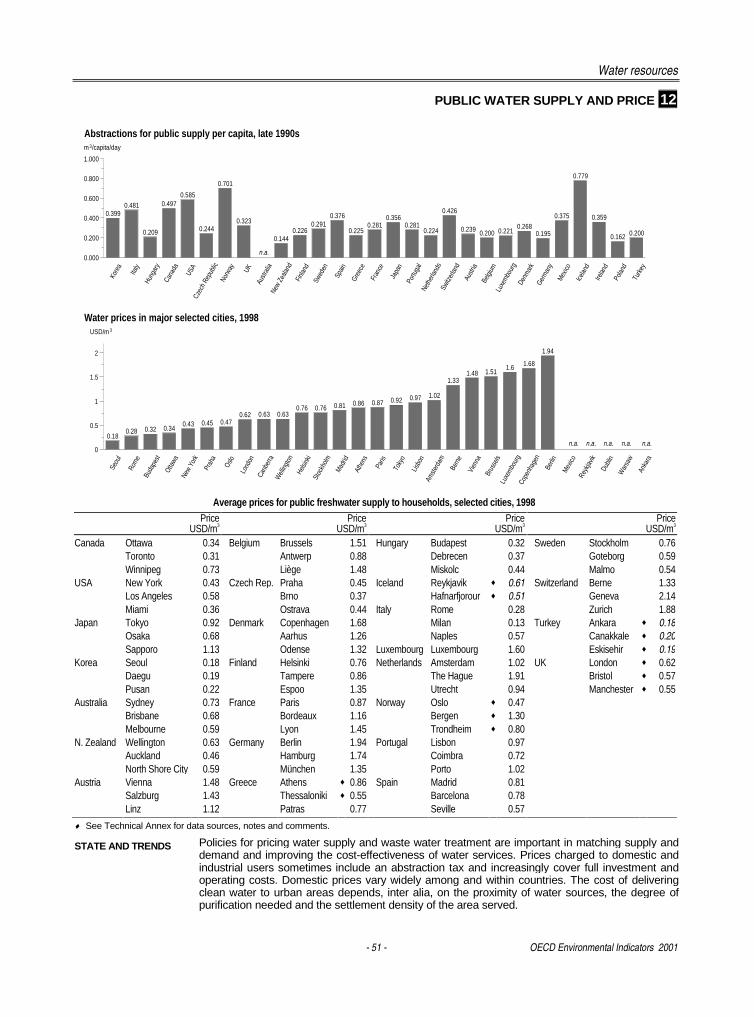
Water resources
- 51 - OECD Environmental Indicators 2001
PUBLIC WATER SUPPLY AND PRICE 12
Average prices for public freshwater supply to households, selected cities, 1998Price
USD/m3Price
USD/m3Price
USD/m3Price
USD/m3
Canada Ottawa 0.34 Belgium Brussels 1.51 Hungary Budapest 0.32 Sweden Stockholm 0.76Toronto 0.31 Antwerp 0.88 Debrecen 0.37 Goteborg 0.59Winnipeg 0.73 Liège 1.48 Miskolc 0.44 Malmo 0.54
USA New York 0.43 Czech Rep. Praha 0.45 Iceland Reykjavik ♦ 0.61 Switzerland Berne 1.33Los Angeles 0.58 Brno 0.37 Hafnarfjorour ♦ 0.51 Geneva 2.14Miami 0.36 Ostrava 0.44 Italy Rome 0.28 Zurich 1.88
Japan Tokyo 0.92 Denmark Copenhagen 1.68 Milan 0.13 Turkey Ankara ♦ 0.18Osaka 0.68 Aarhus 1.26 Naples 0.57 Canakkale ♦ 0.20Sapporo 1.13 Odense 1.32 Luxembourg Luxembourg 1.60 Eskisehir ♦ 0.19
Korea Seoul 0.18 Finland Helsinki 0.76 Netherlands Amsterdam 1.02 UK London ♦ 0.62Daegu 0.19 Tampere 0.86 The Hague 1.91 Bristol ♦ 0.57Pusan 0.22 Espoo 1.35 Utrecht 0.94 Manchester ♦ 0.55
Australia Sydney 0.73 France Paris 0.87 Norway Oslo ♦ 0.47Brisbane 0.68 Bordeaux 1.16 Bergen ♦ 1.30Melbourne 0.59 Lyon 1.45 Trondheim ♦ 0.80
N. Zealand Wellington 0.63 Germany Berlin 1.94 Portugal Lisbon 0.97Auckland 0.46 Hamburg 1.74 Coimbra 0.72North Shore City 0.59 München 1.35 Porto 1.02
Austria Vienna 1.48 Greece Athens ♦ 0.86 Spain Madrid 0.81Salzburg 1.43 Thessaloniki ♦ 0.55 Barcelona 0.78Linz 1.12 Patras 0.77 Seville 0.57
♦ See Technical Annex for data sources, notes and comments.
STATE AND TRENDS Policies for pricing water supply and waste water treatment are important in matching supply anddemand and improving the cost-effectiveness of water services. Prices charged to domestic andindustrial users sometimes include an abstraction tax and increasingly cover full investment andoperating costs. Domestic prices vary widely among and within countries. The cost of deliveringclean water to urban areas depends, inter alia, on the proximity of water sources, the degree ofpurification needed and the settlement density of the area served.
0.3990.481
0.209
0.4970.585
0.244
0.701
0.323
0.1440.226
0.2910.376
0.2250.281
0.3560.281
0.224
0.426
0.239 0.200 0.2210.268
0.195
0.375
0.779
0.359
0.162 0.200
Kore
a
Italy
Hung
ary
Cana
da
USA
Czec
h Re
publi
cNo
rway UK
Austr
alia
New
Zeala
ndFi
nland
Swed
en
Spain
Gree
ce
Fran
ce
Japa
nPo
rtuga
lNe
ther
lands
Switz
erlan
dAu
stria
Belgi
umLu
xem
bour
gDe
nmar
kGe
rman
yM
exico
Icelan
d
Irelan
d
Polan
d
Turk
ey
0.000
0.200
0.400
0.600
0.800
1.000
m /capita/day
0.180.28 0.32 0.34
0.43 0.45 0.470.62 0.63 0.63
0.76 0.76 0.81 0.86 0.87 0.92 0.97 1.02
1.331.48 1.51
1.6 1.68
1.94
Seou
l
Rom
eBu
dape
stOt
tawa
New
York
Prah
a
Oslo
Lond
onCa
nber
raW
elling
ton
Helsi
nki
Stoc
kholm
Mad
rid
Athe
ns
Paris
Toky
o
Lisbo
nAm
sterd
am
Bern
e
Vien
naBr
usse
lsLu
xem
bour
gCo
penh
agen
Berlin
Mex
icoRe
ykjav
ik
Dubli
nW
arsa
w
Anka
ra
0
0.5
1
1.5
2
USD/m
3
3
Abstractions for public supply per capita, late 1990s
Water prices in major selected cities, 1998
n.a.
n.a. n.a. n.a. n.a. n.a.
- 53 -
���������������
Forests are among the most diverse and widespread ecosystems on earth, and have manyfunctions: they provide timber and other products; deliver recreation benefits and ecosystemservices including regulation of soil, air and water; are reservoirs for biodiversity; andcommonly act as carbon sinks. The impact from human activities on forest health and onnatural forest growth and regeneration raises widespread concern. Many forest resources arethreatened by overexploitation, degradation of environmental quality and conversion to othertypes of land uses. The main pressures result from human activities: they include agricultureexpansion, transport infrastructure development, unsustainable forestry, air pollution andintentional burning of forests.
To be sustainable, forest management must strive to maintain timber value as well asenvironmental, social and aboriginal values. This includes optimal harvest rates, avoidingexcessive use of the resource, and at the same time not setting harvest rates too low(particularly where age classes are unbalanced), which can reduce productive capacity.Performance can be assessed against national objectives and international principles onsustainable forest management adopted at UNCED (Rio de Janeiro, 1992). Otherinternational initiatives are the Ministerial Conferences for the Protection of Forests in Europe(Strasbourg, 1990; Helsinki, 1993; Lisbon, 1998), which led to the Pan-European Criteria andIndicators for Sustainable Forest Management, the Montreal Process on SustainableDevelopment of Temperate and Boreal Forests; and the UN Forum on Forests. The mainchallenge is to ensure a sustainable management of forest resources, avoidingoverexploitation and degradation, so as to maintain adequate supply of wood for productionacitivities, and to ensure the provision of essential environmental services, includingbiodiversity and carbon sinks.
Indicators presented here relate to:
♦ the intensity of use of forest resources (timber), relating annual productive capacity toactual harvest. Annual productive capacity is either a calculated value, such as annualallowable cut, or an estimate of annual growth for existing stock. The choice depends onforest characteristics and availability of information. NB: a measure based on a nationalaverage can conceal variations among forests. Changes in annual harvest, annual growthand growing stock are given as complementary information.
♦ area of forest and wooded land, as a percentage of total land area and per capita, alongwith changes in the area of forest and wooded land since 1970.
These indicators give insights into quantitative aspects of forest resources. They presentnational averages that may conceal important variations among forests. They should berelated to information on forest quality (e.g. species diversity, forest degradation), on output ofand trade in forest products and be complemented with data on forest management practicesand protection measures.
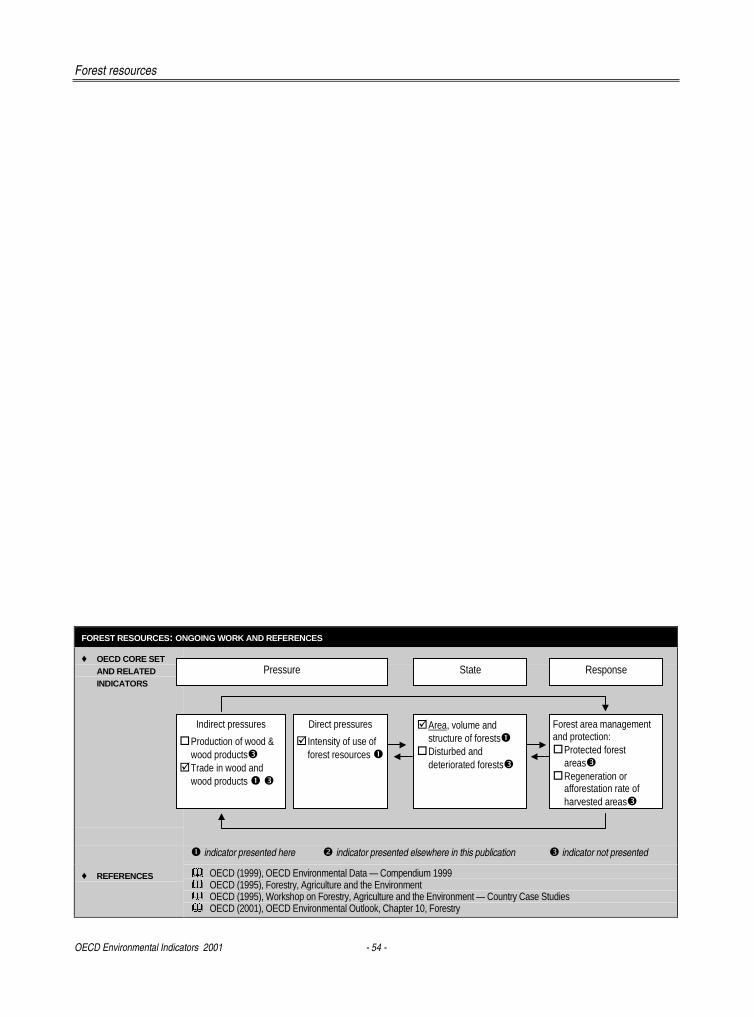
Forest resources
OECD Environmental Indicators 2001 - 54 -
FOREST RESOURCES: ONGOING WORK AND REFERENCES
♦ OECD CORE SETAND RELATEDINDICATORS
� indicator presented here � indicator presented elsewhere in this publication � indicator not presented
♦ REFERENCES � OECD (1999), OECD Environmental Data — Compendium 1999� OECD (1995), Forestry, Agriculture and the Environment� OECD (1995), Workshop on Forestry, Agriculture and the Environment — Country Case Studies� OECD (2001), OECD Environmental Outlook, Chapter 10, Forestry
Pressure State Response
Indirect pressures
� Production of wood &wood products�
� Trade in wood andwood products � �
� Area, volume andstructure of forests�
� Disturbed anddeteriorated forests�
Forest area managementand protection:� Protected forest
areas�� Regeneration or
afforestation rate ofharvested areas�
Direct pressures
� Intensity of use offorest resources �
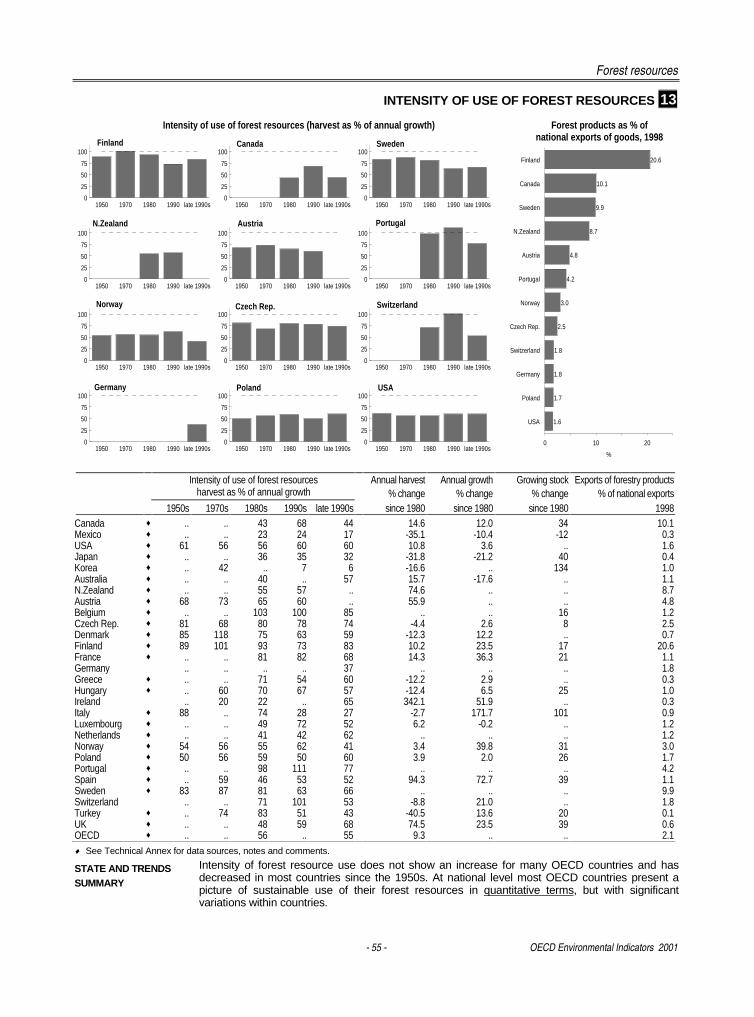
Forest resources
- 55 - OECD Environmental Indicators 2001
INTENSITY OF USE OF FOREST RESOURCES 13
20.6
10.1
9.9
8.7
4.8
4.2
3.0
2.5
1.8
1.8
1.7
1.6
Finland
Canada
Sweden
N.Zealand
Austria
Portugal
Norway
Czech Rep.
Switzerland
Germany
Poland
USA
0 10 20
%
Intensity of use of forest resources (harvest as % of annual growth) Forest products as % ofnational exports of goods, 1998
1950 1970 1980 1990 late 1990s0
25
50
75
100Finland
1950 1970 1980 1990 late 1990s0
25
50
75
100Canada
1950 1970 1980 1990 late 1990s0
25
50
75
100Sweden
1950 1970 1980 1990 late 1990s0
25
50
75
100N.Zealand
1950 1970 1980 1990 late 1990s0
25
50
75
100Austria
1950 1970 1980 1990 late 1990s0
25
50
75
100Portugal
1950 1970 1980 1990 late 1990s0
25
50
75
100Norway
1950 1970 1980 1990 late 1990s0
25
50
75
100Czech Rep.
1950 1970 1980 1990 late 1990s0
25
50
75
100Switzerland
1950 1970 1980 1990 late 1990s0
25
50
75
100Germany
1950 1970 1980 1990 late 1990s0
25
50
75
100Poland
1950 1970 1980 1990 late 1990s0
25
50
75
100USA
Intensity of use of forest resources Annual harvest Annual growth Growing stock Exports of forestry productsharvest as % of annual growth % change % change % change % of national exports
1950s 1970s 1980s 1990s late 1990s since 1980 since 1980 since 1980 1998Canada ♦ .. .. 43 68 44 14.6 12.0 34 10.1Mexico ♦ .. .. 23 24 17 -35.1 -10.4 -12 0.3USA ♦ 61 56 56 60 60 10.8 3.6 .. 1.6Japan ♦ .. .. 36 35 32 -31.8 -21.2 40 0.4Korea ♦ .. 42 .. 7 6 -16.6 .. 134 1.0Australia ♦ .. .. 40 .. 57 15.7 -17.6 .. 1.1N.Zealand ♦ .. .. 55 57 .. 74.6 .. .. 8.7Austria ♦ 68 73 65 60 .. 55.9 .. .. 4.8Belgium ♦ .. .. 103 100 85 .. .. 16 1.2Czech Rep. ♦ 81 68 80 78 74 -4.4 2.6 8 2.5Denmark ♦ 85 118 75 63 59 -12.3 12.2 .. 0.7Finland ♦ 89 101 93 73 83 10.2 23.5 17 20.6France ♦ .. .. 81 82 68 14.3 36.3 21 1.1Germany .. .. .. .. 37 .. .. .. 1.8Greece ♦ .. .. 71 54 60 -12.2 2.9 .. 0.3Hungary ♦ .. 60 70 67 57 -12.4 6.5 25 1.0Ireland .. 20 22 .. 65 342.1 51.9 .. 0.3Italy ♦ 88 .. 74 28 27 -2.7 171.7 101 0.9Luxembourg ♦ .. .. 49 72 52 6.2 -0.2 .. 1.2Netherlands ♦ .. .. 41 42 62 .. .. .. 1.2Norway ♦ 54 56 55 62 41 3.4 39.8 31 3.0Poland ♦ 50 56 59 50 60 3.9 2.0 26 1.7Portugal ♦ .. .. 98 111 77 .. .. .. 4.2Spain ♦ .. 59 46 53 52 94.3 72.7 39 1.1Sweden ♦ 83 87 81 63 66 .. .. .. 9.9Switzerland .. .. 71 101 53 -8.8 21.0 .. 1.8Turkey ♦ .. 74 83 51 43 -40.5 13.6 20 0.1UK ♦ .. .. 48 59 68 74.5 23.5 39 0.6OECD ♦ .. .. 56 .. 55 9.3 .. .. 2.1♦ See Technical Annex for data sources, notes and comments.
STATE AND TRENDSSUMMARY
Intensity of forest resource use does not show an increase for many OECD countries and hasdecreased in most countries since the 1950s. At national level most OECD countries present apicture of sustainable use of their forest resources in quantitative terms, but with significantvariations within countries.
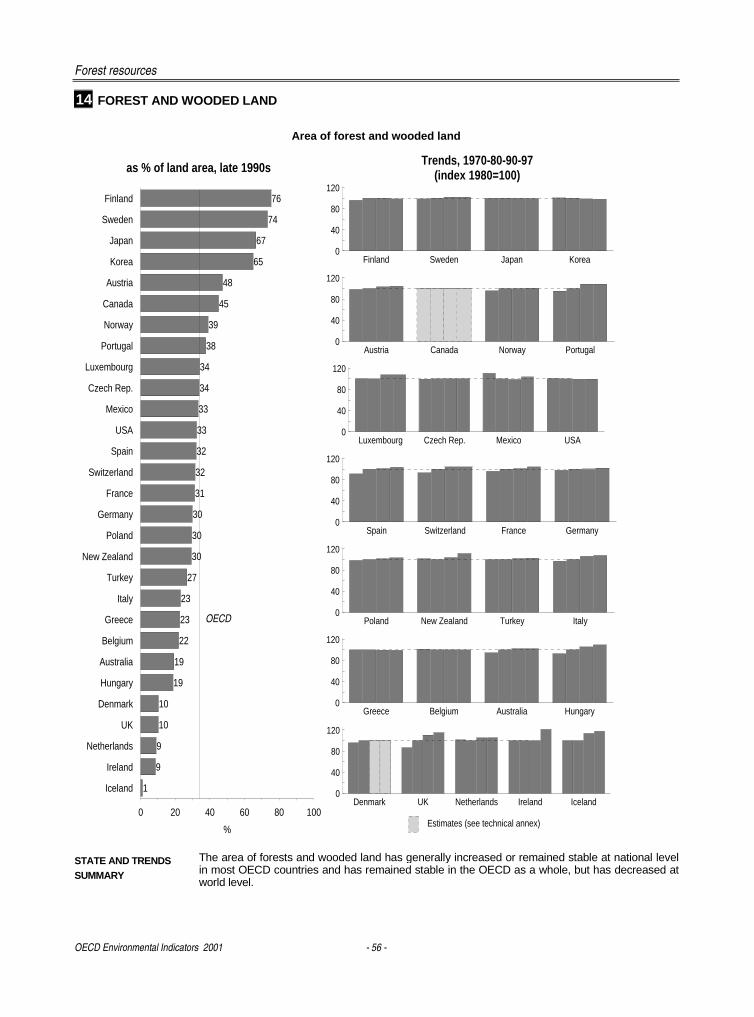
Forest resources
OECD Environmental Indicators 2001 - 56 -
14 FOREST AND WOODED LAND
Area of forest and wooded land
as % of land area, late 1990s
Estimates (see technical annex)
Trends, 1970-80-90-97(index 1980=100)
76
74
67
65
48
45
39
38
34
34
33
33
32
32
31
30
30
30
27
23
23
22
19
19
10
10
9
9
1
Finland
Sweden
Japan
Korea
Austria
Canada
Norway
Portugal
Luxembourg
Czech Rep.
Mexico
USA
Spain
Switzerland
France
Germany
Poland
New Zealand
Turkey
Italy
Greece
Belgium
Australia
Hungary
Denmark
UK
Netherlands
Ireland
Iceland
0 20 40 60 80 100
%
OECD
Finland Sweden Japan Korea0
40
80
120
Austria Canada Norway Portugal0
40
80
120
Luxembourg Czech Rep. Mexico USA0
40
80
120
Spain Switzerland France Germany0
40
80
120
Poland New Zealand Turkey Italy0
40
80
120
Greece Belgium Australia Hungary0
40
80
120
Denmark UK Netherlands Ireland Iceland0
40
80
120
STATE AND TRENDSSUMMARY
The area of forests and wooded land has generally increased or remained stable at national levelin most OECD countries and has remained stable in the OECD as a whole, but has decreased atworld level.
- 57 -
������������
Fish play key roles for human food supply and aquatic ecosystems. Main pressures includefisheries, coastal development and pollution loads from land-based sources, maritimetransport, and maritime dumping. This affects both freshwater and marine fish stocks andhabitats and has consequences for biodiversity and for the supply of fish for consumption andother uses. Aquaculture has been developed to an extent where its dependence on fishmealproducts puts it in competition with other commercial markets and could become a limitingfactor of aquaculture development.
The sustainable management of fish resources has become a major concern. With continualgrowth in fish catches, many of the more valuable stocks are overfished and new or lessvaluable species are being exploited as several fish stocks have collapsed. Unauthorisedfishing is widespread. Performance can be assessed against domestic objectives and bilateraland multilateral agreements such as those on conservation and use of fish resources (AtlanticOcean, Pacific Ocean, Baltic Sea, etc.), the Rome Consensus on world fisheries, the Code ofConduct for Responsible Fishing (FAO, November 1995), the UN Convention on the Law ofthe Sea and its implementation agreement on straddling and highly migratory fish stocks.Within the framework of the FAO Code of Conduct for Responsible Fishing, plans are beingmade to address the issue of illegal, unreported and unregulated (IUU) fishing. The mainchallenge is to ensure a sustainable management of catchment areas so that resourceabstraction does not exceed the renewal of the stocks over an extended period.
Indicators presented here relate to:
♦ national fish catches expressed as per cent of world captures and as amounts per capita,and related changes since 1980. National fish consumption (food supply from fish percapita) is given as additional information.
♦ global and regional fish catches and related changes since 1980. Changes in theproportion of fish resources under various phases of fishery development are given asadditional information.
These indicators give insights into quantitative aspects of fish resources; they should berelated to information on the status of fish stocks.
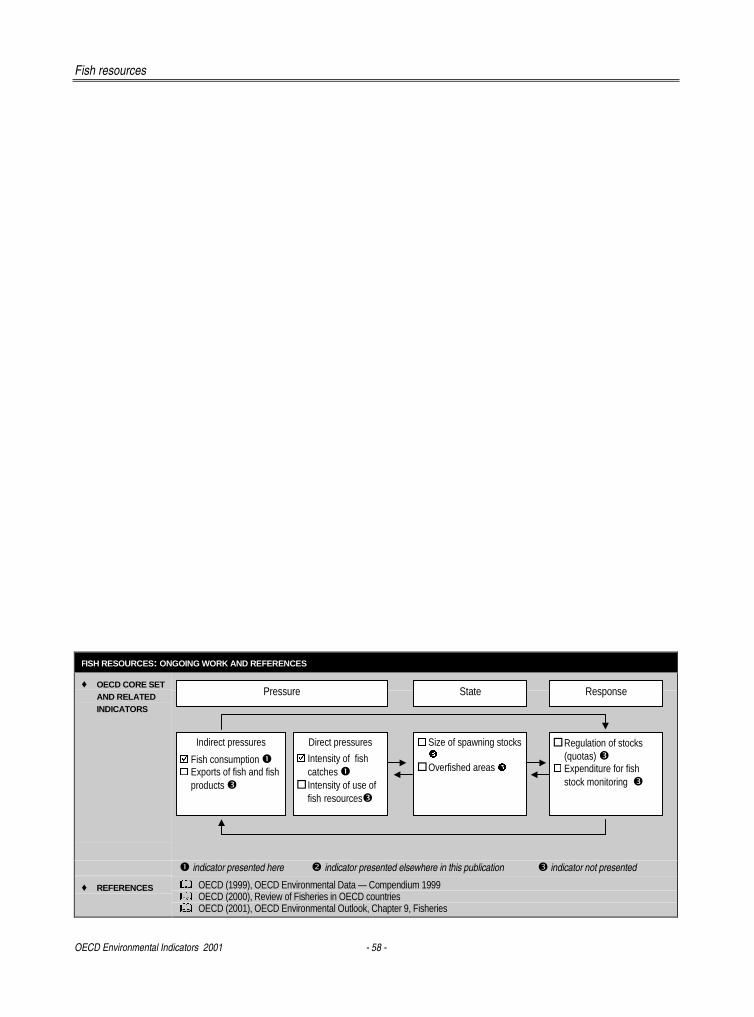
Fish resources
OECD Environmental Indicators 2001 - 58 -
FISH RESOURCES: ONGOING WORK AND REFERENCES
♦ OECD CORE SETAND RELATEDINDICATORS
� indicator presented here � indicator presented elsewhere in this publication � indicator not presented
♦ REFERENCES � OECD (1999), OECD Environmental Data — Compendium 1999� OECD (2000), Review of Fisheries in OECD countries� OECD (2001), OECD Environmental Outlook, Chapter 9, Fisheries
Pressure State Response
Indirect pressures
� Fish consumption �� Exports of fish and fish
products �
� Size of spawning stocks�
� Overfished areas �
� Regulation of stocks(quotas) �
� Expenditure for fishstock monitoring �
Direct pressures
� Intensity of fishcatches �
� Intensity of use offish resources�
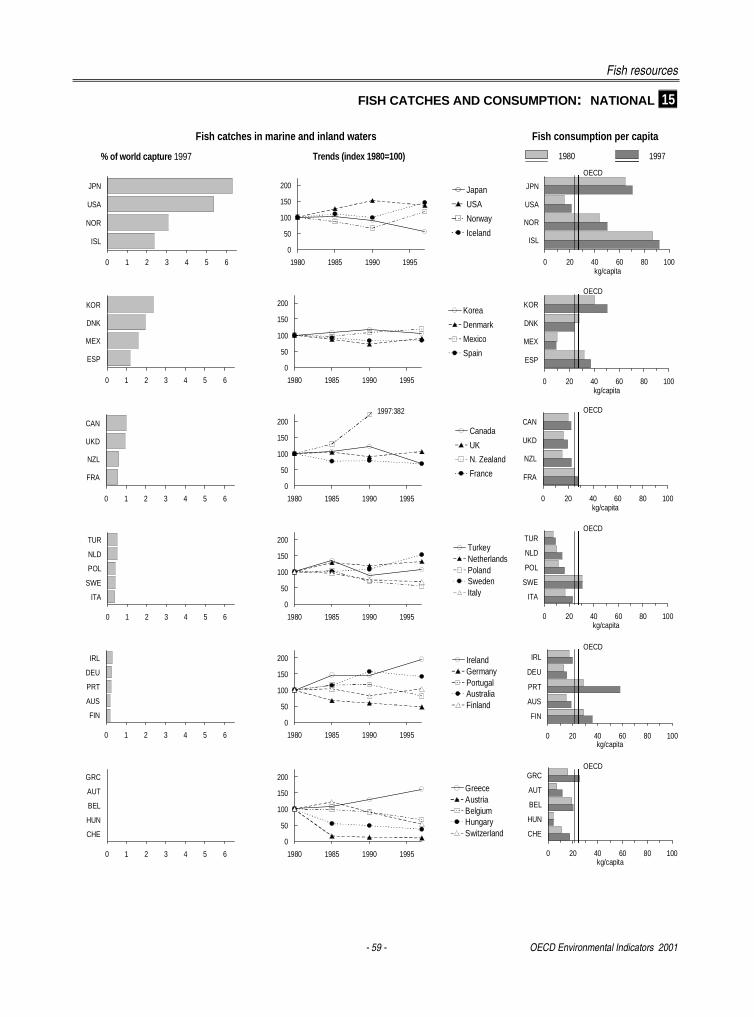
Fish resources
- 59 - OECD Environmental Indicators 2001
FISH CATCHES AND CONSUMPTION: NATIONAL 15
Fish catches in marine and inland waters Fish consumption per capita
% of world capture 1997 Trends (index 1980=100) 1980 1997
0 1 2 3 4 5 6
JPN
USA
NOR
ISL
Japan
USA
Norway
Iceland
0 20 40 60 80 100
JPN
USA
NOR
ISL
kg/capita
0 1 2 3 4 5 6
KOR
DNK
MEX
ESP
0 1 2 3 4 5 6
CAN
UKD
NZL
FRA
0 1 2 3 4 5 6
TUR
NLD
POL
SWE
ITA
0 1 2 3 4 5 6
IRL
DEU
PRT
AUS
FIN
0 1 2 3 4 5 6
GRC
AUT
BEL
HUN
CHE
0
50
100
150
200
1980 1985 1990 1995
0
50
100
150
200
1980 1985 1990 1995
1997:382
0
50
100
150
200
1980 1985 1990 1995
0
50
100
150
200
1980 1985 1990 1995
0
50
100
150
200
1980 1985 1990 1995
0
50
100
150
200
1980 1985 1990 1995
Korea
Denmark
Mexico
Spain
Canada
UK
N. Zealand
France
TurkeyNetherlandsPolandSwedenItaly
IrelandGermanyPortugalAustraliaFinland
GreeceAustriaBelgiumHungarySwitzerland
0 20 40 60 80 100
KOR
DNK
MEX
ESP
kg/capita
0 20 40 60 80 100
CAN
UKD
NZL
FRA
kg/capita
0 20 40 60 80 100
TUR
NLD
POL
SWE
ITA
kg/capita
0 20 40 60 80 100
IRL
DEU
PRT
AUS
FIN
kg/capita
0 20 40 60 80 100
GRC
AUT
BEL
HUN
CHE
kg/capita
OECD
OECD
OECD
OECD
OECD
OECD
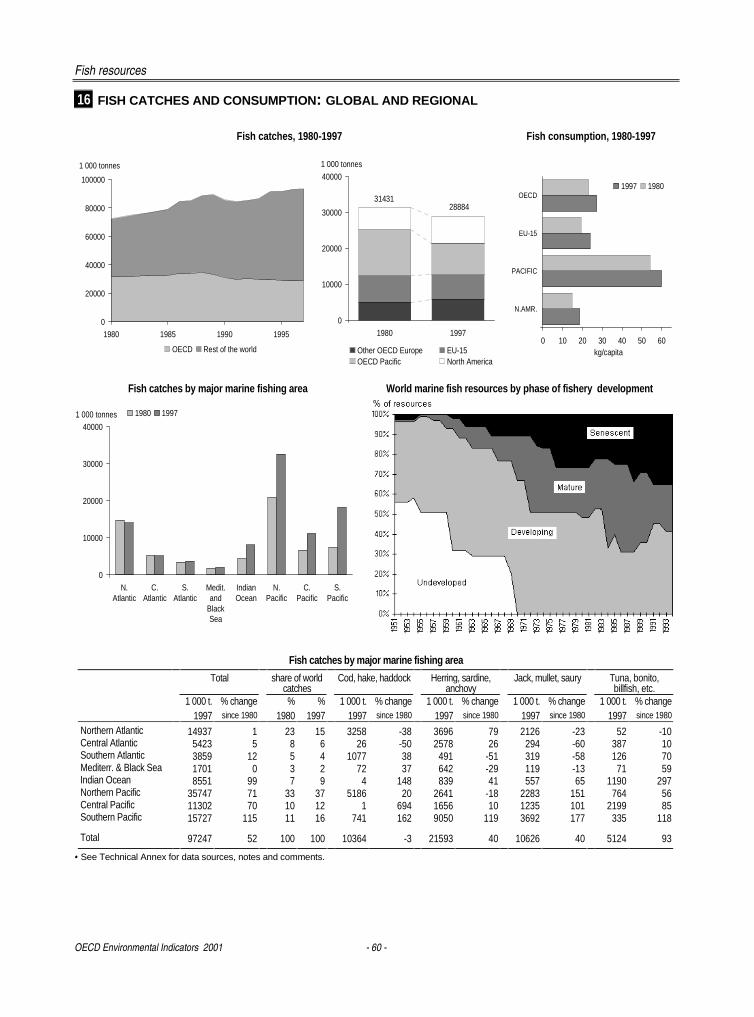
Fish resources
OECD Environmental Indicators 2001 - 60 -
16 FISH CATCHES AND CONSUMPTION: GLOBAL AND REGIONAL
Fish catches, 1980-1997 Fish consumption, 1980-1997
0
20000
40000
60000
80000
100000
1980 1985 1990 1995
1 000 tonnes
OECD Rest of the world
2888431431
0
10000
20000
30000
40000
1980 1997
1 000 tonnes
Other OECD Europe EU-15OECD Pacific North America
0 10 20 30 40 50 60
N.AMR.
PACIFIC
EU-15
OECD
kg/capita
1997 1980
Fish catches by major marine fishing area World marine fish resources by phase of fishery development
0
10000
20000
30000
40000
N.Atlantic
C.Atlantic
S.Atlantic
Medit.and
BlackSea
IndianOcean
N.Pacific
C.Pacific
S.Pacific
1 000 tonnes 1980 1997
Fish catches by major marine fishing area
Total share of worldcatches
Cod, hake, haddock Herring, sardine,anchovy
Jack, mullet, saury Tuna, bonito,billfish, etc.
1 000 t. % change % % 1 000 t. % change 1 000 t. % change 1 000 t. % change 1 000 t. % change1997 since 1980 1980 1997 1997 since 1980 1997 since 1980 1997 since 1980 1997 since 1980
Northern Atlantic 14937 1 23 15 3258 -38 3696 79 2126 -23 52 -10Central Atlantic 5423 5 8 6 26 -50 2578 26 294 -60 387 10Southern Atlantic 3859 12 5 4 1077 38 491 -51 319 -58 126 70Mediterr. & Black Sea 1701 0 3 2 72 37 642 -29 119 -13 71 59Indian Ocean 8551 99 7 9 4 148 839 41 557 65 1190 297Northern Pacific 35747 71 33 37 5186 20 2641 -18 2283 151 764 56Central Pacific 11302 70 10 12 1 694 1656 10 1235 101 2199 85Southern Pacific 15727 115 11 16 741 162 9050 119 3692 177 335 118
Total 97247 52 100 100 10364 -3 21593 40 10626 40 5124 93
• See Technical Annex for data sources, notes and comments.
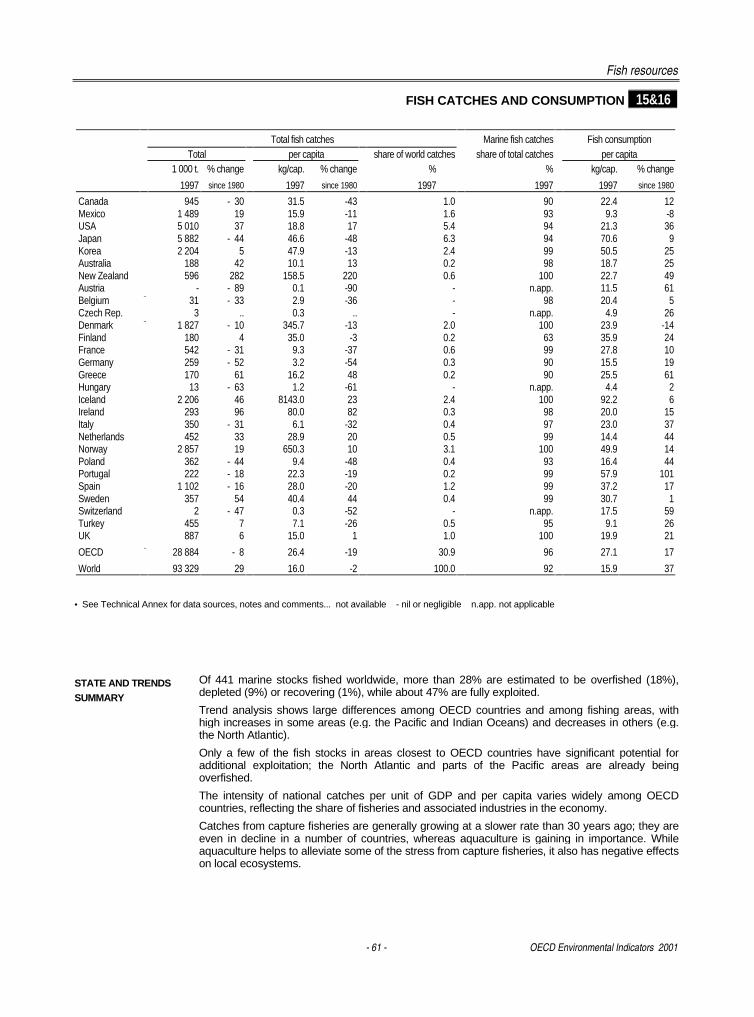
Fish resources
- 61 - OECD Environmental Indicators 2001
FISH CATCHES AND CONSUMPTION 15&16
Total fish catches Marine fish catches Fish consumptionTotal per capita share of world catches share of total catches per capita
1 000 t. % change kg/cap. % change % % kg/cap. % change
1997 since 1980 1997 since 1980 1997 1997 1997 since 1980
Canada 945 - 30 31.5 -43 1.0 90 22.4 12Mexico 1 489 19 15.9 -11 1.6 93 9.3 -8USA 5 010 37 18.8 17 5.4 94 21.3 36Japan 5 882 - 44 46.6 -48 6.3 94 70.6 9Korea 2 204 5 47.9 -13 2.4 99 50.5 25Australia 188 42 10.1 13 0.2 98 18.7 25New Zealand 596 282 158.5 220 0.6 100 22.7 49Austria - - 89 0.1 -90 - n.app. 11.5 61Belgium ¨ 31 - 33 2.9 -36 - 98 20.4 5Czech Rep. 3 .. 0.3 .. - n.app. 4.9 26Denmark ¨ 1 827 - 10 345.7 -13 2.0 100 23.9 -14Finland 180 4 35.0 -3 0.2 63 35.9 24France 542 - 31 9.3 -37 0.6 99 27.8 10Germany 259 - 52 3.2 -54 0.3 90 15.5 19Greece 170 61 16.2 48 0.2 90 25.5 61Hungary 13 - 63 1.2 -61 - n.app. 4.4 2Iceland 2 206 46 8143.0 23 2.4 100 92.2 6Ireland 293 96 80.0 82 0.3 98 20.0 15Italy 350 - 31 6.1 -32 0.4 97 23.0 37Netherlands 452 33 28.9 20 0.5 99 14.4 44Norway 2 857 19 650.3 10 3.1 100 49.9 14Poland 362 - 44 9.4 -48 0.4 93 16.4 44Portugal 222 - 18 22.3 -19 0.2 99 57.9 101Spain 1 102 - 16 28.0 -20 1.2 99 37.2 17Sweden 357 54 40.4 44 0.4 99 30.7 1Switzerland 2 - 47 0.3 -52 - n.app. 17.5 59Turkey 455 7 7.1 -26 0.5 95 9.1 26UK 887 6 15.0 1 1.0 100 19.9 21
OECD ¨ 28 884 - 8 26.4 -19 30.9 96 27.1 17
World 93 329 29 16.0 -2 100.0 92 15.9 37
• See Technical Annex for data sources, notes and comments... not available - nil or negligible n.app. not applicable
STATE AND TRENDSSUMMARY
Of 441 marine stocks fished worldwide, more than 28% are estimated to be overfished (18%),depleted (9%) or recovering (1%), while about 47% are fully exploited.
Trend analysis shows large differences among OECD countries and among fishing areas, withhigh increases in some areas (e.g. the Pacific and Indian Oceans) and decreases in others (e.g.the North Atlantic).
Only a few of the fish stocks in areas closest to OECD countries have significant potential foradditional exploitation; the North Atlantic and parts of the Pacific areas are already beingoverfished.
The intensity of national catches per unit of GDP and per capita varies widely among OECDcountries, reflecting the share of fisheries and associated industries in the economy.
Catches from capture fisheries are generally growing at a slower rate than 30 years ago; they areeven in decline in a number of countries, whereas aquaculture is gaining in importance. Whileaquaculture helps to alleviate some of the stress from capture fisheries, it also has negative effectson local ecosystems.
- 63 -
����������
Biodiversity can be defined as the variety of and variability among living organisms; it coversboth diversity at the ecosystem and species levels and genetic diversity within species.Conservation of biodiversity has become a key concern nationally and globally. Pressures onbiodiversity can be physical (e.g. habitat alteration and fragmentation through changes in landuse and land cover conversions), chemical (e.g. pollution from human activities) or biological(e.g. alteration of population dynamics and species structure through the release of exoticspecies or the commercial use of wildlife resources).
The conservation and sustainable use of biodiversity form an integral part of sustainabledevelopment, encompassing the integration of biodiversity concerns into economic policies aswell as measures to protect areas, habitats and species. Protection levels range from full topartial protection in actual protected areas to promotion of biodiversity conservation outsidesuch areas (e.g. on farms or in forests). Performance can be assessed against domesticobjectives and international agreements such as: the Convention on Biological Diversity (Riode Janeiro, 1992), the Convention on the Conservation of Migratory Species of Wild Animals(Bonn, 1979), the Convention on International Trade in Endangered Species of Wild Faunaand Flora (CITES, Washington, 1973), the Convention on Wetlands of InternationalImportance (Ramsar, 1971) and the Convention on the Conservation of European Wildlife andNatural Habitats (Bern, 1979). The main challenge is to maintain or restore the diversity andintegrity of ecosystems, species and genetic material and to ensure a sustainable use ofbiodiversity.
Indicators presented here relate to the conservation of biodiversity and concern:
♦ the number of threatened or extinct species compared to the number of known species."Threatened" refers to the "endangered" and "vulnerable" categories, i.e. species indanger of extinction and species soon likely to be in danger of extinction. Data covermammals, birds, fish, reptiles, amphibians and vascular plants. Other major groups (e.g.invertebrates, fungi) are not covered at the present time.
♦ protected areas, i.e. land areas under management categories I to VI of the WorldConservation Union (IUCN) classification, which refer to different levels of protection.Categories I and II (wilderness areas, strict nature reserves and national parks) reflect thehighest protection level. Protected areas are a form of defence against change in landuse and in other human activities, which, if unsustainable, can pose a threat toecosystems and landscapes, and lead to biodiversity changes including natural habitatloss.
These indicators need to be complemented with indicators on the sustainable use ofbiodiversity as a resource, and should be read in connection with information on the density ofpopulation and of human activities.
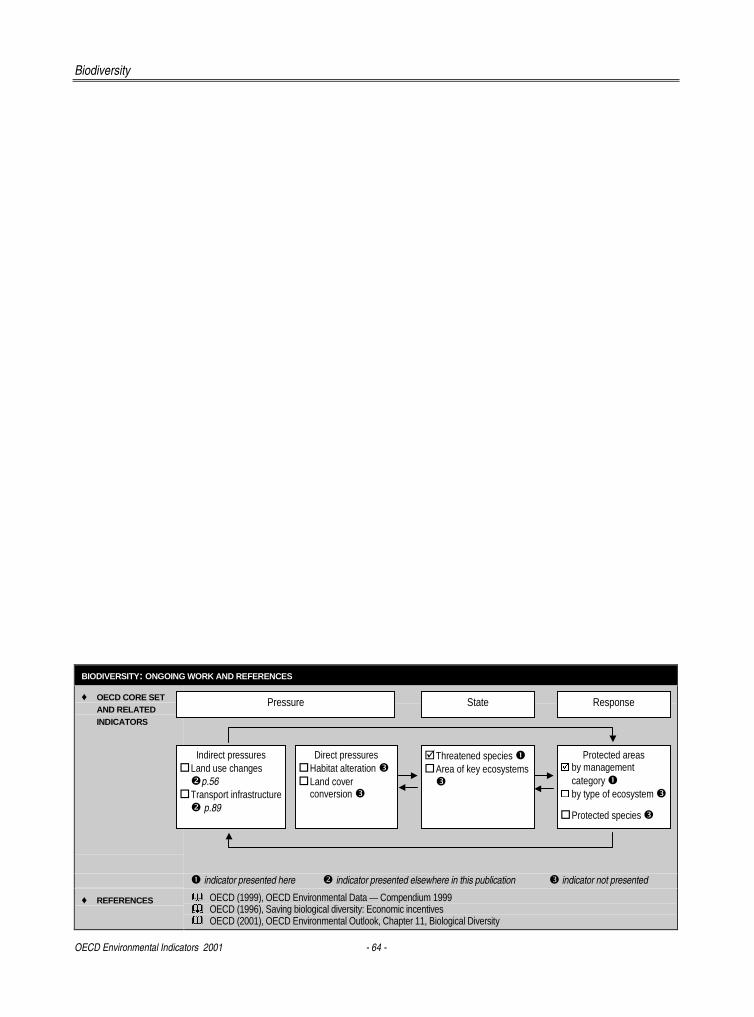
Biodiversity
OECD Environmental Indicators 2001 - 64 -
BIODIVERSITY: ONGOING WORK AND REFERENCES
♦ OECD CORE SETAND RELATEDINDICATORS
� indicator presented here � indicator presented elsewhere in this publication � indicator not presented
♦ REFERENCES � OECD (1999), OECD Environmental Data — Compendium 1999� OECD (1996), Saving biological diversity: Economic incentives� OECD (2001), OECD Environmental Outlook, Chapter 11, Biological Diversity
Pressure State Response
Indirect pressures� Land use changes�p.56
� Transport infrastructure� p.89
� Threatened species �� Area of key ecosystems�
Protected areas� by management
category �� by type of ecosystem �
� Protected species �
Direct pressures� Habitat alteration �� Land cover
conversion �
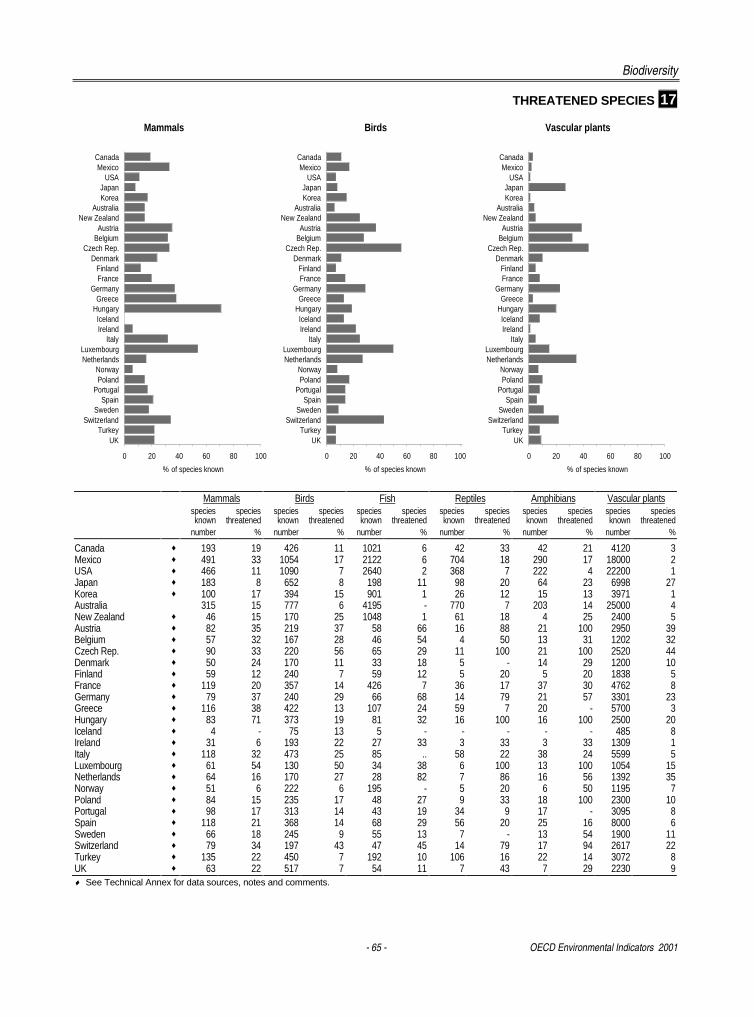
Biodiversity
- 65 - OECD Environmental Indicators 2001
THREATENED SPECIES 17
Mammals Birds Fish Reptiles Amphibians Vascular plantsspeciesknown
speciesthreatened
speciesknown
speciesthreatened
speciesknown
speciesthreatened
speciesknown
speciesthreatened
speciesknown
speciesthreatened
speciesknown
speciesthreatened
number % number % number % number % number % number %
Canada ♦ 193 19 426 11 1021 6 42 33 42 21 4120 3Mexico ♦ 491 33 1054 17 2122 6 704 18 290 17 18000 2USA ♦ 466 11 1090 7 2640 2 368 7 222 4 22200 1Japan ♦ 183 8 652 8 198 11 98 20 64 23 6998 27Korea ♦ 100 17 394 15 901 1 26 12 15 13 3971 1Australia 315 15 777 6 4195 - 770 7 203 14 25000 4New Zealand ♦ 46 15 170 25 1048 1 61 18 4 25 2400 5Austria ♦ 82 35 219 37 58 66 16 88 21 100 2950 39Belgium ♦ 57 32 167 28 46 54 4 50 13 31 1202 32Czech Rep. ♦ 90 33 220 56 65 29 11 100 21 100 2520 44Denmark ♦ 50 24 170 11 33 18 5 - 14 29 1200 10Finland ♦ 59 12 240 7 59 12 5 20 5 20 1838 5France ♦ 119 20 357 14 426 7 36 17 37 30 4762 8Germany ♦ 79 37 240 29 66 68 14 79 21 57 3301 23Greece ♦ 116 38 422 13 107 24 59 7 20 - 5700 3Hungary ♦ 83 71 373 19 81 32 16 100 16 100 2500 20Iceland ♦ 4 - 75 13 5 - - - - - 485 8Ireland ♦ 31 6 193 22 27 33 3 33 3 33 1309 1Italy ♦ 118 32 473 25 85 .. 58 22 38 24 5599 5Luxembourg ♦ 61 54 130 50 34 38 6 100 13 100 1054 15Netherlands ♦ 64 16 170 27 28 82 7 86 16 56 1392 35Norway ♦ 51 6 222 6 195 - 5 20 6 50 1195 7Poland ♦ 84 15 235 17 48 27 9 33 18 100 2300 10Portugal ♦ 98 17 313 14 43 19 34 9 17 - 3095 8Spain ♦ 118 21 368 14 68 29 56 20 25 16 8000 6Sweden ♦ 66 18 245 9 55 13 7 - 13 54 1900 11Switzerland ♦ 79 34 197 43 47 45 14 79 17 94 2617 22Turkey ♦ 135 22 450 7 192 10 106 16 22 14 3072 8UK ♦ 63 22 517 7 54 11 7 43 7 29 2230 9♦ See Technical Annex for data sources, notes and comments.
CanadaMexico
USAJapanKorea
AustraliaNew Zealand
AustriaBelgium
Czech Rep.Denmark
FinlandFrance
GermanyGreece
HungaryIcelandIreland
ItalyLuxembourgNetherlands
NorwayPoland
PortugalSpain
SwedenSwitzerland
TurkeyUK
0 20 40 60 80 100
% of species known
CanadaMexico
USAJapanKorea
AustraliaNew Zealand
AustriaBelgium
Czech Rep.Denmark
FinlandFrance
GermanyGreece
HungaryIcelandIreland
ItalyLuxembourgNetherlands
NorwayPoland
PortugalSpain
SwedenSwitzerland
TurkeyUK
0 20 40 60 80 100
% of species known
CanadaMexico
USAJapanKorea
AustraliaNew Zealand
AustriaBelgium
Czech Rep.Denmark
FinlandFrance
GermanyGreece
HungaryIcelandIreland
ItalyLuxembourgNetherlands
NorwayPoland
PortugalSpain
SwedenSwitzerland
TurkeyUK
0 20 40 60 80 100
% of species known
Mammals Birds Vascular plants
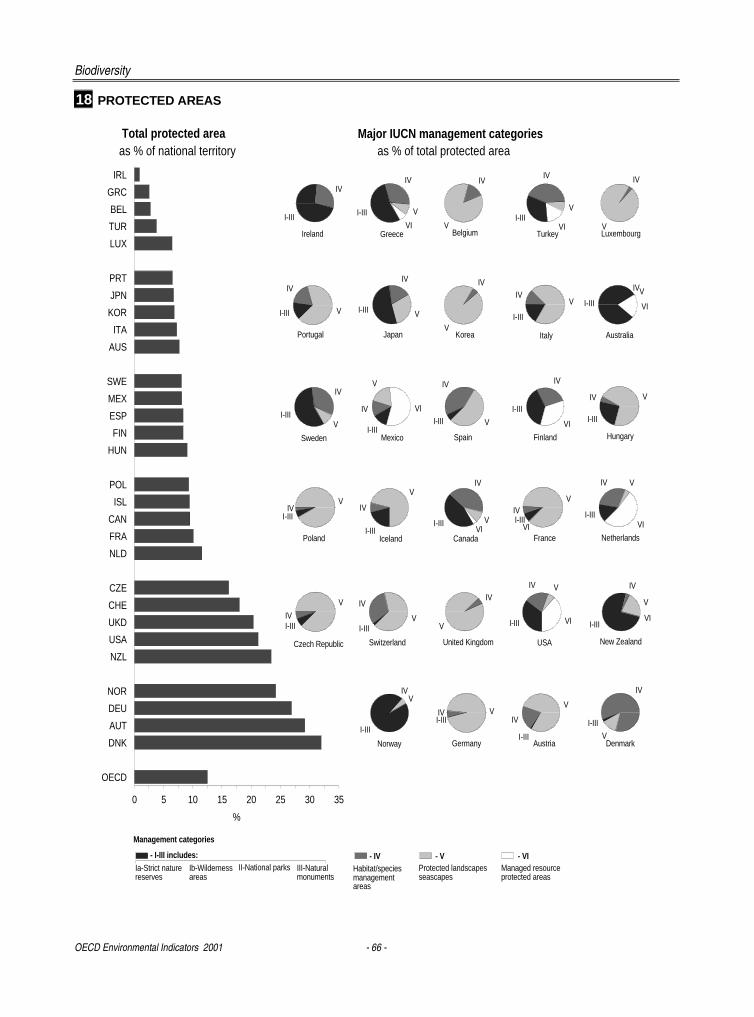
Biodiversity
OECD Environmental Indicators 2001 - 66 -
18 PROTECTED AREAS
IRL
GRC
BEL
TUR
LUX
PRT
JPN
KOR
ITA
AUS
SWE
MEX
ESP
FIN
HUN
POL
ISL
CAN
FRA
NLD
CZE
CHE
UKD
USA
NZL
NOR
DEU
AUT
DNK
OECD
0 5 10 15 20 25 30 35
%
Major IUCN management categoriesTotal protected areaas % of national territory as % of total protected area
IV
VLuxembourg
I-III
IV
V
VITurkey
IV
VBelgium
I-III
IV
Ireland
I-III
IV
V
VIGreece
I-III
IV
V
Japan
I-III
IV
V
Portugal
IV
VKorea
I-III
IVV
Italy
I-IIIV
VI
Australia
IV
I-III
IV
V
SwedenI-III
IV
V
VI
Mexico
I-III
IV
V
Spain
I-III
IV
VI
Finland
I-III
IV V
Hungary
I-III
IV
VVI
Canada
I-III
IV
VVI
I-IIIIV
V
Poland
I-IIIIV
V
I-III
IV
V
Iceland
I-IIIIV
V
VI France
I-IIIIV
V
VII-III
IV V
VI
Netherlands
I-IIIIV
V
Czech Republic
V
IVI-III I-III
IV
V
Switzerland
IV
V
United Kingdom
I-III
IV V
VI
USA
I-III
IV
V
VI
New Zealand
I-III
IV
VDenmark
I-III
IV
V
Austria
I-IIIIV V
Germany
VIVI-III
I-III
IVV
Norway
VIV
I-III
Management categories
Habitat/speciesmanagementareas
- IV - VProtected landscapesseascapes
- VIManaged resourceprotected areas
Ib-Wildernessareas
Ia-Strict naturereserves
II-National parks- I-III includes:
III-Naturalmonuments
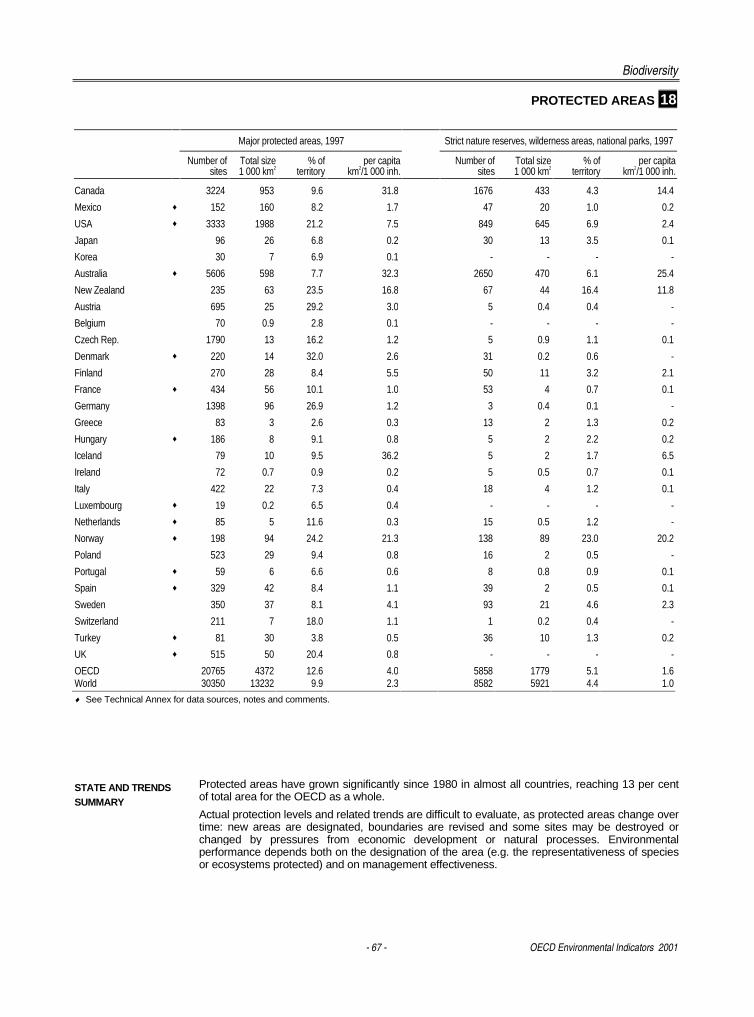
Biodiversity
- 67 - OECD Environmental Indicators 2001
PROTECTED AREAS 18
Major protected areas, 1997 Strict nature reserves, wilderness areas, national parks, 1997
Number ofsites
Total size1 000 km2
% ofterritory
per capitakm2/1 000 inh.
Number ofsites
Total size1 000 km2
% ofterritory
per capitakm2/1 000 inh.
Canada 3224 953 9.6 31.8 1676 433 4.3 14.4
Mexico ♦ 152 160 8.2 1.7 47 20 1.0 0.2
USA ♦ 3333 1988 21.2 7.5 849 645 6.9 2.4
Japan 96 26 6.8 0.2 30 13 3.5 0.1
Korea 30 7 6.9 0.1 - - - -
Australia ♦ 5606 598 7.7 32.3 2650 470 6.1 25.4
New Zealand 235 63 23.5 16.8 67 44 16.4 11.8
Austria 695 25 29.2 3.0 5 0.4 0.4 -
Belgium 70 0.9 2.8 0.1 - - - -
Czech Rep. 1790 13 16.2 1.2 5 0.9 1.1 0.1
Denmark ♦ 220 14 32.0 2.6 31 0.2 0.6 -
Finland 270 28 8.4 5.5 50 11 3.2 2.1
France ♦ 434 56 10.1 1.0 53 4 0.7 0.1
Germany 1398 96 26.9 1.2 3 0.4 0.1 -
Greece 83 3 2.6 0.3 13 2 1.3 0.2
Hungary ♦ 186 8 9.1 0.8 5 2 2.2 0.2
Iceland 79 10 9.5 36.2 5 2 1.7 6.5
Ireland 72 0.7 0.9 0.2 5 0.5 0.7 0.1
Italy 422 22 7.3 0.4 18 4 1.2 0.1
Luxembourg ♦ 19 0.2 6.5 0.4 - - - -
Netherlands ♦ 85 5 11.6 0.3 15 0.5 1.2 -
Norway ♦ 198 94 24.2 21.3 138 89 23.0 20.2
Poland 523 29 9.4 0.8 16 2 0.5 -
Portugal ♦ 59 6 6.6 0.6 8 0.8 0.9 0.1
Spain ♦ 329 42 8.4 1.1 39 2 0.5 0.1
Sweden 350 37 8.1 4.1 93 21 4.6 2.3
Switzerland 211 7 18.0 1.1 1 0.2 0.4 -
Turkey ♦ 81 30 3.8 0.5 36 10 1.3 0.2
UK ♦ 515 50 20.4 0.8 - - - -
OECD 20765 4372 12.6 4.0 5858 1779 5.1 1.6World 30350 13232 9.9 2.3 8582 5921 4.4 1.0
♦ See Technical Annex for data sources, notes and comments.
STATE AND TRENDSSUMMARY
Protected areas have grown significantly since 1980 in almost all countries, reaching 13 per centof total area for the OECD as a whole.
Actual protection levels and related trends are difficult to evaluate, as protected areas change overtime: new areas are designated, boundaries are revised and some sites may be destroyed orchanged by pressures from economic development or natural processes. Environmentalperformance depends both on the designation of the area (e.g. the representativeness of speciesor ecosystems protected) and on management effectiveness.
- 69 -
����������������������� ���

- 71 -
������������� ��
Economic activity is a key determinant of sustainable development and its economic, socialand environmental dimensions. Economic growth and production patterns have major effectson environmental issues and on environmental performance. They imply use of energy andother natural resource assets, as well as pollutant discharges and waste production. Thesustainability of development depends on the evolution of the stock and quality of naturalresources or "natural capital" and on pollution constraints. Economic growth also providesopportunities to finance public expenditure for environmental protection and to replace man-made capital, thus introducing cleaner, less resource-intensive technologies andenvironmentally friendly goods.
Population influences production and consumption patterns, and hence the sustainability ofdevelopment. It is an important determinant of environmental conditions and trends.Population density implies density of human activity. Overall population growth puts pressureon natural resources and adds to the challenge of providing sanitation and otherenvironmental infrastructure. Population also affects the environment in the ways that itsstructural elements (age classes, active population, size of households, etc.) influenceconsumption patterns and waste production.
Indicators presented here relate to:
♦ gross domestic product (GDP), in total and per capita, as well as the change in GDPcompared to the change in population over the same period.
♦ population growth and density, presenting changes in national resident population, as wellas population densities and an "ageing index" (the ratios between the population over 64and under 15).
GDP and population
OECD Environmental Indicators 2001 - 72 -
GDP AND POPULATION: REFERENCES
� OECD (1999), OECD Environmental Data — Compendium 1999� OECD (biannual publication), OECD Economic Outlook� OECD (annual publication), National Accounts of OECD Countries� OECD (annual publication), Labour Force Statistics� OECD (monthly publication), Main Economic Indicators� OECD (2001), OECD Environmental Outlook, Chapter 4, Economic Development
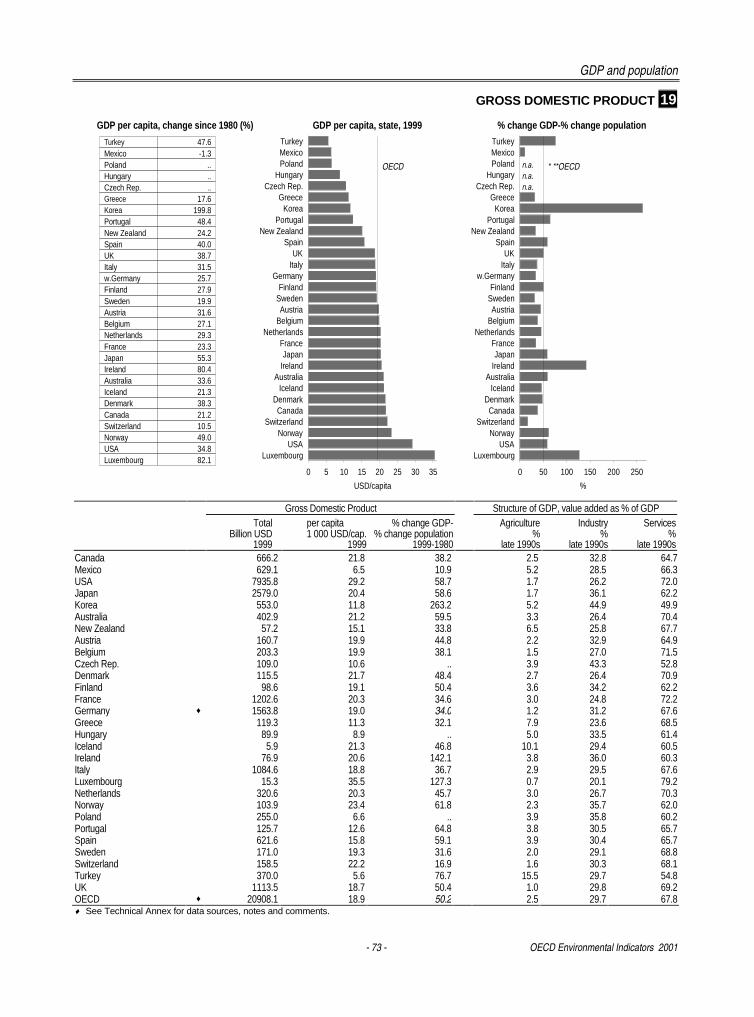
GDP and population
- 73 - OECD Environmental Indicators 2001
GROSS DOMESTIC PRODUCT 19
TurkeyMexicoPoland
HungaryCzech Rep.
GreeceKorea
PortugalNew Zealand
SpainUK
Italyw.Germany
FinlandSwedenAustria
BelgiumNetherlands
FranceJapan
IrelandAustralia
IcelandDenmark
CanadaSwitzerland
NorwayUSA
Luxembourg
0 50 100 150 200 250
%
TurkeyMexicoPoland
HungaryCzech Rep.
GreeceKorea
PortugalNew Zealand
SpainUK
ItalyGermany
FinlandSwedenAustria
BelgiumNetherlands
FranceJapan
IrelandAustralia
IcelandDenmarkCanada
SwitzerlandNorway
USALuxembourg
0 5 10 15 20 25 30 35
USD/capita
n.a.
GDP per capita, change since 1980 (%) % change GDP-% change population
Turkey 47.6Mexico -1.3Poland ..Hungary ..Czech Rep. ..Greece 17.6Korea 199.8Portugal 48.4New Zealand 24.2Spain 40.0UK 38.7Italy 31.5w.Germany 25.7Finland 27.9Sweden 19.9Austria 31.6Belgium 27.1Netherlands 29.3France 23.3Japan 55.3Ireland 80.4Australia 33.6Iceland 21.3Denmark 38.3Canada 21.2Switzerland 10.5Norway 49.0USA 34.8Luxembourg 82.1
n.a.n.a.
GDP per capita, state, 1999
OECD * **OECD
Gross Domestic Product Structure of GDP, value added as % of GDPTotal per capita % change GDP- Agriculture Industry Services
Billion USD 1 000 USD/cap. % change population % % %1999 1999 1999-1980 late 1990s late 1990s late 1990s
Canada 666.2 21.8 38.2 2.5 32.8 64.7Mexico 629.1 6.5 10.9 5.2 28.5 66.3USA 7935.8 29.2 58.7 1.7 26.2 72.0Japan 2579.0 20.4 58.6 1.7 36.1 62.2Korea 553.0 11.8 263.2 5.2 44.9 49.9Australia 402.9 21.2 59.5 3.3 26.4 70.4New Zealand 57.2 15.1 33.8 6.5 25.8 67.7Austria 160.7 19.9 44.8 2.2 32.9 64.9Belgium 203.3 19.9 38.1 1.5 27.0 71.5Czech Rep. 109.0 10.6 .. 3.9 43.3 52.8Denmark 115.5 21.7 48.4 2.7 26.4 70.9Finland 98.6 19.1 50.4 3.6 34.2 62.2France 1202.6 20.3 34.6 3.0 24.8 72.2Germany ♦ 1563.8 19.0 34.0 1.2 31.2 67.6Greece 119.3 11.3 32.1 7.9 23.6 68.5Hungary 89.9 8.9 .. 5.0 33.5 61.4Iceland 5.9 21.3 46.8 10.1 29.4 60.5Ireland 76.9 20.6 142.1 3.8 36.0 60.3Italy 1084.6 18.8 36.7 2.9 29.5 67.6Luxembourg 15.3 35.5 127.3 0.7 20.1 79.2Netherlands 320.6 20.3 45.7 3.0 26.7 70.3Norway 103.9 23.4 61.8 2.3 35.7 62.0Poland 255.0 6.6 .. 3.9 35.8 60.2Portugal 125.7 12.6 64.8 3.8 30.5 65.7Spain 621.6 15.8 59.1 3.9 30.4 65.7Sweden 171.0 19.3 31.6 2.0 29.1 68.8Switzerland 158.5 22.2 16.9 1.6 30.3 68.1Turkey 370.0 5.6 76.7 15.5 29.7 54.8UK 1113.5 18.7 50.4 1.0 29.8 69.2OECD ♦ 20908.1 18.9 50.2 2.5 29.7 67.8♦ See Technical Annex for data sources, notes and comments.
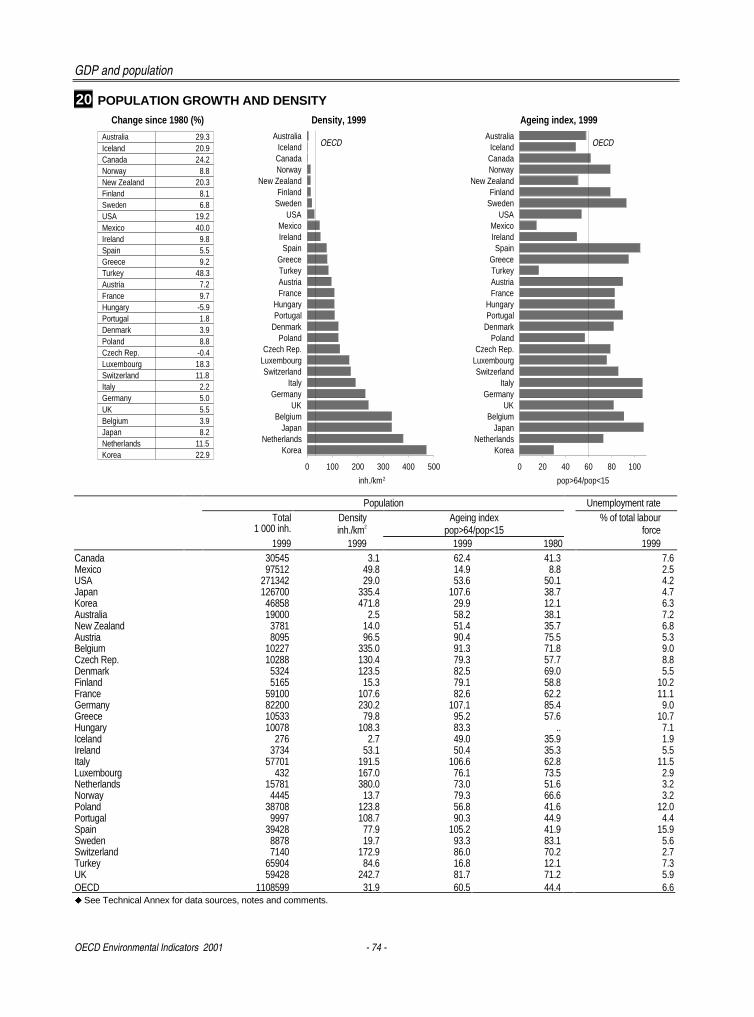
GDP and population
OECD Environmental Indicators 2001 - 74 -
20 POPULATION GROWTH AND DENSITY
AustraliaIceland
CanadaNorway
New ZealandFinland
SwedenUSA
MexicoIrelandSpain
GreeceTurkeyAustriaFrance
HungaryPortugal
DenmarkPoland
Czech Rep.LuxembourgSwitzerland
ItalyGermany
UKBelgium
JapanNetherlands
Korea
0 20 40 60 80 100
pop>64/pop<15
AustraliaIceland
CanadaNorway
New ZealandFinland
SwedenUSA
MexicoIrelandSpain
GreeceTurkeyAustriaFrance
HungaryPortugal
DenmarkPoland
Czech Rep.LuxembourgSwitzerland
ItalyGermany
UKBelgium
JapanNetherlands
Korea
0 100 200 300 400 500
inh./km
Change since 1980 (%) Ageing index, 1999
Australia 29.3Iceland 20.9Canada 24.2Norway 8.8New Zealand 20.3Finland 8.1Sweden 6.8USA 19.2Mexico 40.0Ireland 9.8Spain 5.5Greece 9.2Turkey 48.3Austria 7.2France 9.7Hungary -5.9Portugal 1.8Denmark 3.9Poland 8.8Czech Rep. -0.4Luxembourg 18.3Switzerland 11.8Italy 2.2Germany 5.0UK 5.5Belgium 3.9Japan 8.2Netherlands 11.5Korea 22.9
Density, 1999
OECD OECD
2
Population Unemployment rateTotal Density Ageing index % of total labour
1 000 inh. inh./km2 pop>64/pop<15 force1999 1999 1999 1980 1999
Canada 30545 3.1 62.4 41.3 7.6Mexico 97512 49.8 14.9 8.8 2.5USA 271342 29.0 53.6 50.1 4.2Japan 126700 335.4 107.6 38.7 4.7Korea 46858 471.8 29.9 12.1 6.3Australia 19000 2.5 58.2 38.1 7.2New Zealand 3781 14.0 51.4 35.7 6.8Austria 8095 96.5 90.4 75.5 5.3Belgium 10227 335.0 91.3 71.8 9.0Czech Rep. 10288 130.4 79.3 57.7 8.8Denmark 5324 123.5 82.5 69.0 5.5Finland 5165 15.3 79.1 58.8 10.2France 59100 107.6 82.6 62.2 11.1Germany 82200 230.2 107.1 85.4 9.0Greece 10533 79.8 95.2 57.6 10.7Hungary 10078 108.3 83.3 .. 7.1Iceland 276 2.7 49.0 35.9 1.9Ireland 3734 53.1 50.4 35.3 5.5Italy 57701 191.5 106.6 62.8 11.5Luxembourg 432 167.0 76.1 73.5 2.9Netherlands 15781 380.0 73.0 51.6 3.2Norway 4445 13.7 79.3 66.6 3.2Poland 38708 123.8 56.8 41.6 12.0Portugal 9997 108.7 90.3 44.9 4.4Spain 39428 77.9 105.2 41.9 15.9Sweden 8878 19.7 93.3 83.1 5.6Switzerland 7140 172.9 86.0 70.2 2.7Turkey 65904 84.6 16.8 12.1 7.3UK 59428 242.7 81.7 71.2 5.9OECD 1108599 31.9 60.5 44.4 6.6� See Technical Annex for data sources, notes and comments.
- 75 -
����������
Consumption by households and government is a determinant of sustainable developmentand its economic, environmental and social dimensions. It has important implications for thelevel and pattern of production and for related demands for natural resources. Growth ofprivate consumption has both positive and negative environmental effects, entailing increaseduse of private transport, more leisure and tourism, higher energy consumption, increased useof packaged goods and higher waste production, but also demand for environmentally friendlygoods.
Agenda 21, adopted at UNCED (Rio de Janeiro, 1992), stresses that changes in consumptionand production patterns are necessary to ensure more sustainable development. These can be promoted by increasing consumer awareness and expanding use of approaches such aslife cycle analysis of products and extended producer responsibility. Governments can showthe way by “greening” their own consumption and operations.
Indicators presented here relate to:
♦ private consumption, i.e. by households and private non-profit institutions serving households. They present private final consumption expenditure expressed as percentageof GDP and per capita, as well as the structure of private consumption.
♦ government consumption, presenting government final consumption expenditure expressed as percentage of GDP and per capita.
They should be read in conjunction with other indicators in this publication, notably thosedealing with energy, transport, waste and water, and should be complemented withinformation on production patterns and trends.
Consumption
OECD Environmental Indicators 2001 - 76 -
CONSUMPTION: ONGOING WORK AND REFERENCES
♦ OECD SECTORALINDICATORS
� indicator presented here � indicator presented elsewhere in this publication � indicator not presented
♦ REFERENCES � OECD (1999), OECD Environmental Data — Compendium 1999� OECD (1997), OECD Proceedings, Sustainable Consumption and Production: Clarifying the Concepts� OECD (1997), Sustainable Consumption and Production� OECD (1999), OECD Series on Environmental Indicators: Towards More Sustainable Household Consumption Patterns
– Indicators to Measure Progress� OECD (annual publication), National Accounts of OECD Countries� OECD (2001), OECD Environmental Outlook, Chapter 5, Consumption Patterns
Sectoral trends of environmentalsignificance
Interactions with theenvironment
Economic & policyaspects
� Private consumption�� Government consumption�� Socio-demographic trends� p.74� Transport trends � p.85� Consumer goods and food �� Recreation �
Resource use and pollutant discharges
� Energy use � p.81� Air emissions� p.27� Water use� p.49� Sewage discharges �
& treatment� p.45� Waste generation � p.37� Nature & wildlife �
� Regulatory instruments �� Economic instruments
(prices, taxes, subsidies,expenditure)�p.51,83,91 �
� Information & socialinstruments�
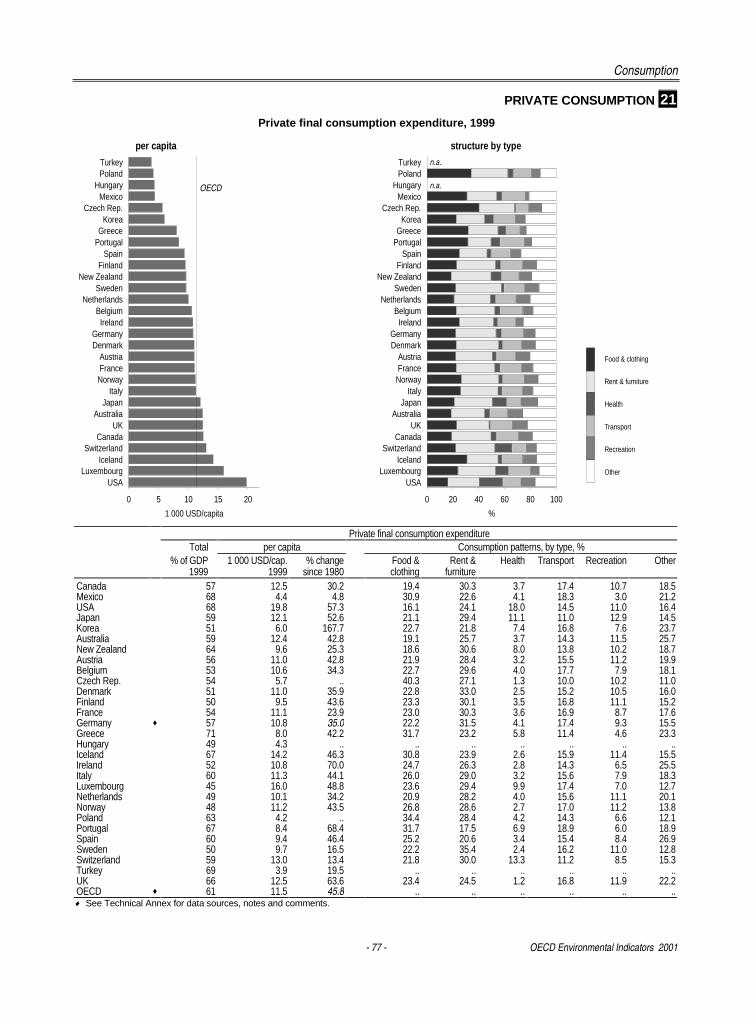
Consumption
- 77 - OECD Environmental Indicators 2001
PRIVATE CONSUMPTION 21
Private final consumption expenditure, 1999
Private final consumption expenditureTotal per capita Consumption patterns, by type, %
% of GDP 1 000 USD/cap. % change Food & Rent & Health Transport Recreation Other1999 1999 since 1980 clothing furniture
Canada 57 12.5 30.2 19.4 30.3 3.7 17.4 10.7 18.5Mexico 68 4.4 4.8 30.9 22.6 4.1 18.3 3.0 21.2USA 68 19.8 57.3 16.1 24.1 18.0 14.5 11.0 16.4Japan 59 12.1 52.6 21.1 29.4 11.1 11.0 12.9 14.5Korea 51 6.0 167.7 22.7 21.8 7.4 16.8 7.6 23.7Australia 59 12.4 42.8 19.1 25.7 3.7 14.3 11.5 25.7New Zealand 64 9.6 25.3 18.6 30.6 8.0 13.8 10.2 18.7Austria 56 11.0 42.8 21.9 28.4 3.2 15.5 11.2 19.9Belgium 53 10.6 34.3 22.7 29.6 4.0 17.7 7.9 18.1Czech Rep. 54 5.7 .. 40.3 27.1 1.3 10.0 10.2 11.0Denmark 51 11.0 35.9 22.8 33.0 2.5 15.2 10.5 16.0Finland 50 9.5 43.6 23.3 30.1 3.5 16.8 11.1 15.2France 54 11.1 23.9 23.0 30.3 3.6 16.9 8.7 17.6Germany ♦ 57 10.8 35.0 22.2 31.5 4.1 17.4 9.3 15.5Greece 71 8.0 42.2 31.7 23.2 5.8 11.4 4.6 23.3Hungary 49 4.3 .. .. .. .. .. .. ..Iceland 67 14.2 46.3 30.8 23.9 2.6 15.9 11.4 15.5Ireland 52 10.8 70.0 24.7 26.3 2.8 14.3 6.5 25.5Italy 60 11.3 44.1 26.0 29.0 3.2 15.6 7.9 18.3Luxembourg 45 16.0 48.8 23.6 29.4 9.9 17.4 7.0 12.7Netherlands 49 10.1 34.2 20.9 28.2 4.0 15.6 11.1 20.1Norway 48 11.2 43.5 26.8 28.6 2.7 17.0 11.2 13.8Poland 63 4.2 .. 34.4 28.4 4.2 14.3 6.6 12.1Portugal 67 8.4 68.4 31.7 17.5 6.9 18.9 6.0 18.9Spain 60 9.4 46.4 25.2 20.6 3.4 15.4 8.4 26.9Sweden 50 9.7 16.5 22.2 35.4 2.4 16.2 11.0 12.8Switzerland 59 13.0 13.4 21.8 30.0 13.3 11.2 8.5 15.3Turkey 69 3.9 19.5 .. .. .. .. .. ..UK 66 12.5 63.6 23.4 24.5 1.2 16.8 11.9 22.2OECD ♦ 61 11.5 45.8 .. .. .. .. .. ..♦ See Technical Annex for data sources, notes and comments.
TurkeyPoland
HungaryMexico
Czech Rep.Korea
GreecePortugal
SpainFinland
New ZealandSweden
NetherlandsBelgiumIreland
GermanyDenmark
AustriaFranceNorway
ItalyJapan
AustraliaUK
CanadaSwitzerland
IcelandLuxembourg
USA
0 5 10 15 20
1 000 USD/capita
OECD
TurkeyPoland
HungaryMexico
Czech Rep.Korea
GreecePortugal
SpainFinland
New ZealandSweden
NetherlandsBelgiumIreland
GermanyDenmark
AustriaFranceNorway
ItalyJapan
AustraliaUK
CanadaSwitzerland
IcelandLuxembourg
USA
0 20 40 60 80 100
%
n.a.
per capita structure by typen.a.
Food & clothing
Rent & furniture
Health
Transport
Recreation
Other
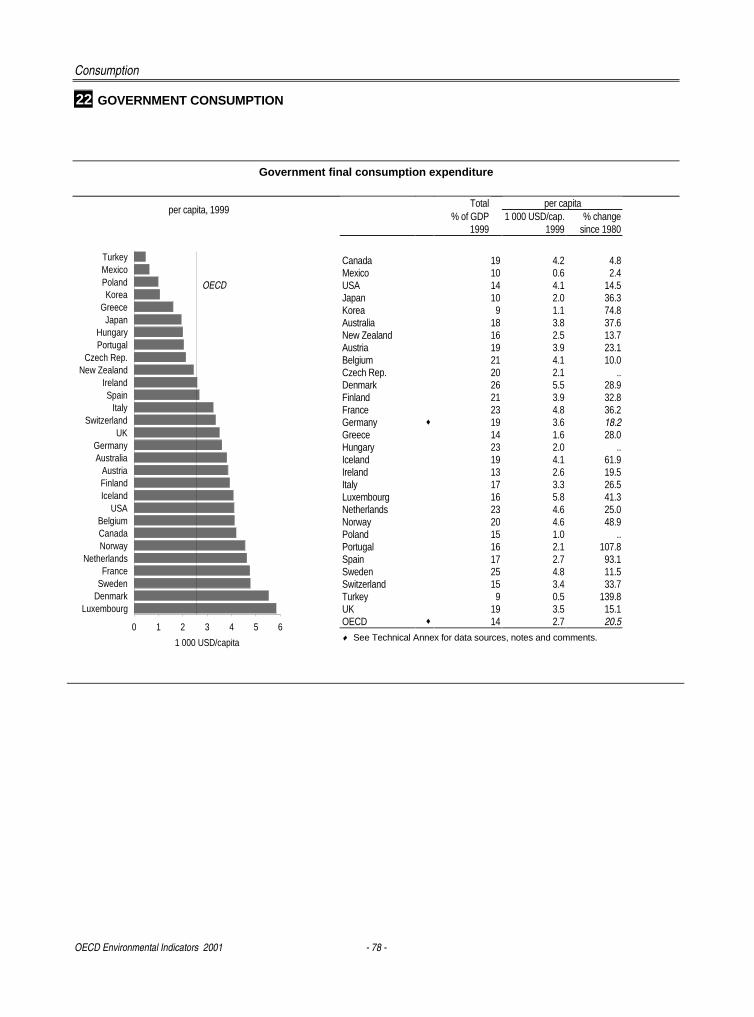
Consumption
OECD Environmental Indicators 2001 - 78 -
22 GOVERNMENT CONSUMPTION
Government final consumption expenditure
Total per capitaper capita, 1999
% of GDP 1 000 USD/cap. % change1999 1999 since 1980
Canada 19 4.2 4.8Mexico 10 0.6 2.4USA 14 4.1 14.5Japan 10 2.0 36.3Korea 9 1.1 74.8Australia 18 3.8 37.6New Zealand 16 2.5 13.7Austria 19 3.9 23.1Belgium 21 4.1 10.0Czech Rep. 20 2.1 ..Denmark 26 5.5 28.9Finland 21 3.9 32.8France 23 4.8 36.2Germany ♦ 19 3.6 18.2Greece 14 1.6 28.0Hungary 23 2.0 ..Iceland 19 4.1 61.9Ireland 13 2.6 19.5Italy 17 3.3 26.5Luxembourg 16 5.8 41.3Netherlands 23 4.6 25.0Norway 20 4.6 48.9Poland 15 1.0 ..Portugal 16 2.1 107.8Spain 17 2.7 93.1Sweden 25 4.8 11.5Switzerland 15 3.4 33.7Turkey 9 0.5 139.8UK 19 3.5 15.1OECD ♦ 14 2.7 20.5
♦ See Technical Annex for data sources, notes and comments.
TurkeyMexicoPolandKorea
GreeceJapan
HungaryPortugal
Czech Rep.New Zealand
IrelandSpain
ItalySwitzerland
UKGermanyAustralia
AustriaFinlandIceland
USABelgiumCanadaNorway
NetherlandsFrance
SwedenDenmark
Luxembourg
0 1 2 3 4 5 6
1 000 USD/capita
OECD
- 79 -
������
Energy is a major component of OECD economies, both as a sector in itself and as a factorinput to all other economic activities. Energy production and use have environmental effectsthat differ greatly by energy source. Fuel combustion is the main source of local and regionalair pollution and greenhouse gas emissions; other effects involve water quality, land use, risksrelated to the nuclear fuel cycle and risks related to the extraction, transport and use of fossilfuels.
The structure of a country’s energy supply and the intensity of its energy use, along withchanges over time, are key determinants of environmental performance and sustainability ofeconomic development. The supply structure varies considerably among countries. It isinfluenced by demand from industry, transport and households, by national energy policiesand by national and international energy prices. Environmental performance can be assessedagainst domestic objectives such as energy efficiency targets, and targets concerning theshare of renewable energy sources; and against international environmental commitmentsthat have direct implications for domestic energy policies and strategies (e.g. the UnitedNations Framework Convention on Climate Change (1992), Convention on Long-RangeTransboundary Air Pollution (1979)). The main challenge is to further de-couple energy useand related air emissions from economic growth, through improvements in energy efficiencyand through the development and use of cleaner fuels may be necessary.
Indicators presented here relate to:
♦ trends in energy intensities. Energy intensities, expressed as energy supply per unit ofGDP and per capita, reflect, at least partly, changes in energy efficiency and efforts toreduce atmospheric emissions. They also reflect structural and climatic factors.
♦ energy mix, i.e. the structure of and changes in energy supply, in terms of primary energysource as a percentage of total energy supply. This is closely related to consumption andproduction patterns and to environmental effects.
♦ energy prices for industry and households, with changes in real energy end-use prices.
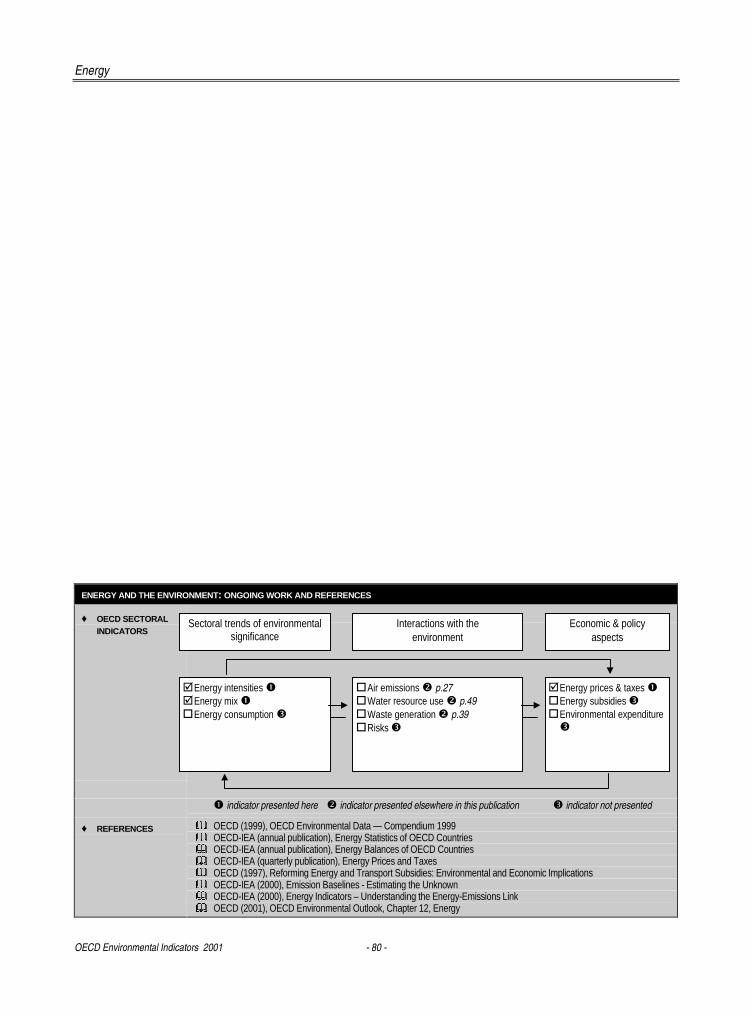
Energy
OECD Environmental Indicators 2001 - 80 -
ENERGY AND THE ENVIRONMENT: ONGOING WORK AND REFERENCES
♦ OECD SECTORALINDICATORS
� indicator presented here � indicator presented elsewhere in this publication � indicator not presented
♦ REFERENCES � OECD (1999), OECD Environmental Data — Compendium 1999� OECD-IEA (annual publication), Energy Statistics of OECD Countries� OECD-IEA (annual publication), Energy Balances of OECD Countries� OECD-IEA (quarterly publication), Energy Prices and Taxes� OECD (1997), Reforming Energy and Transport Subsidies: Environmental and Economic Implications� OECD-IEA (2000), Emission Baselines - Estimating the Unknown� OECD-IEA (2000), Energy Indicators – Understanding the Energy-Emissions Link� OECD (2001), OECD Environmental Outlook, Chapter 12, Energy
Sectoral trends of environmentalsignificance
Interactions with theenvironment
Economic & policyaspects
� Energy intensities �� Energy mix �� Energy consumption �
� Air emissions � p.27� Water resource use � p.49� Waste generation � p.39� Risks �
� Energy prices & taxes �� Energy subsidies �� Environmental expenditure�
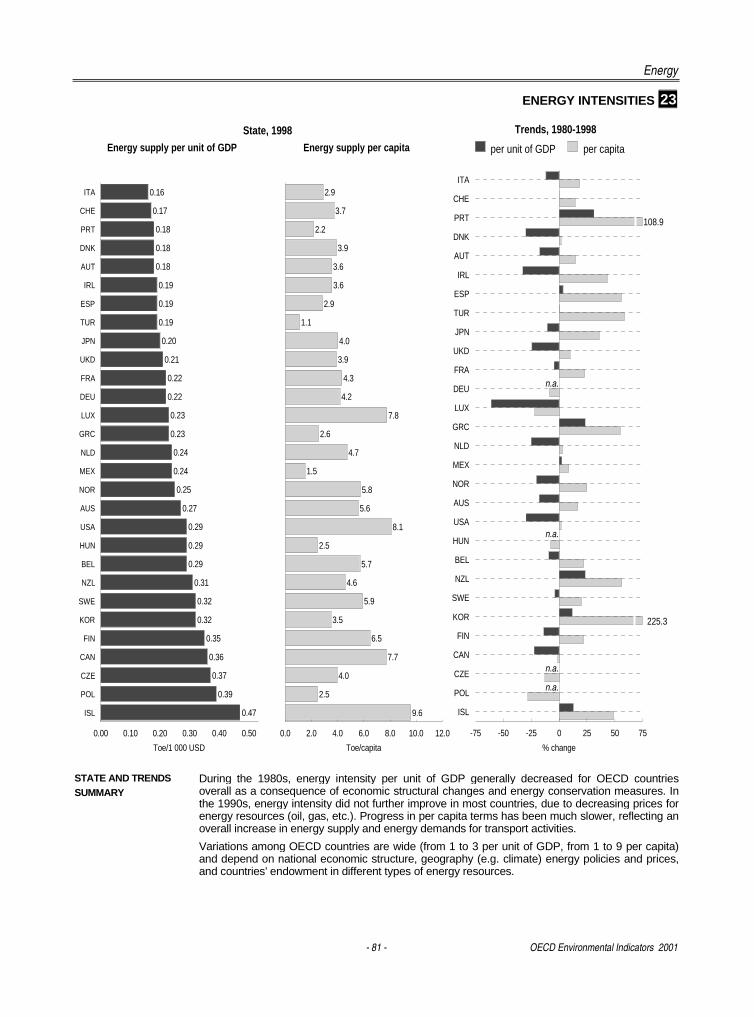
Energy
- 81 - OECD Environmental Indicators 2001
ENERGY INTENSITIES 23
STATE AND TRENDSSUMMARY
During the 1980s, energy intensity per unit of GDP generally decreased for OECD countriesoverall as a consequence of economic structural changes and energy conservation measures. Inthe 1990s, energy intensity did not further improve in most countries, due to decreasing prices forenergy resources (oil, gas, etc.). Progress in per capita terms has been much slower, reflecting anoverall increase in energy supply and energy demands for transport activities.
Variations among OECD countries are wide (from 1 to 3 per unit of GDP, from 1 to 9 per capita)and depend on national economic structure, geography (e.g. climate) energy policies and prices,and countries’ endowment in different types of energy resources.
ITA
CHE
PRT
DNK
AUT
IRL
ESP
TUR
JPN
UKD
FRA
DEU
LUX
GRC
NLD
MEX
NOR
AUS
USA
HUN
BEL
NZL
SWE
KOR
FIN
CAN
CZE
POL
ISL
-75 -50 -25 0 25 50 75
% change
2.9
3.7
2.2
3.9
3.6
3.6
2.9
1.1
4.0
3.9
4.3
4.2
7.8
2.6
4.7
1.5
5.8
5.6
8.1
2.5
5.7
4.6
5.9
3.5
6.5
7.7
4.0
2.5
9.6
ITA
CHE
PRT
DNK
AUT
IRL
ESP
TUR
JPN
UKD
FRA
DEU
LUX
GRC
NLD
MEX
NOR
AUS
USA
HUN
BEL
NZL
SWE
KOR
FIN
CAN
CZR
POL
ISL
0.0 2.0 4.0 6.0 8.0 10.0 12.0
Toe/capita
Energy supply per capita
State, 1998 Trends, 1980-1998
225.3
108.9
per unit of GDP per capita
0.16
0.17
0.18
0.18
0.18
0.19
0.19
0.19
0.20
0.21
0.22
0.22
0.23
0.23
0.24
0.24
0.25
0.27
0.29
0.29
0.29
0.31
0.32
0.32
0.35
0.36
0.37
0.39
0.47
ITA
CHE
PRT
DNK
AUT
IRL
ESP
TUR
JPN
UKD
FRA
DEU
LUX
GRC
NLD
MEX
NOR
AUS
USA
HUN
BEL
NZL
SWE
KOR
FIN
CAN
CZE
POL
ISL
0.00 0.10 0.20 0.30 0.40 0.50
Toe/1 000 USD
Energy supply per unit of GDP
n.a.
n.a.
n.a.
n.a.
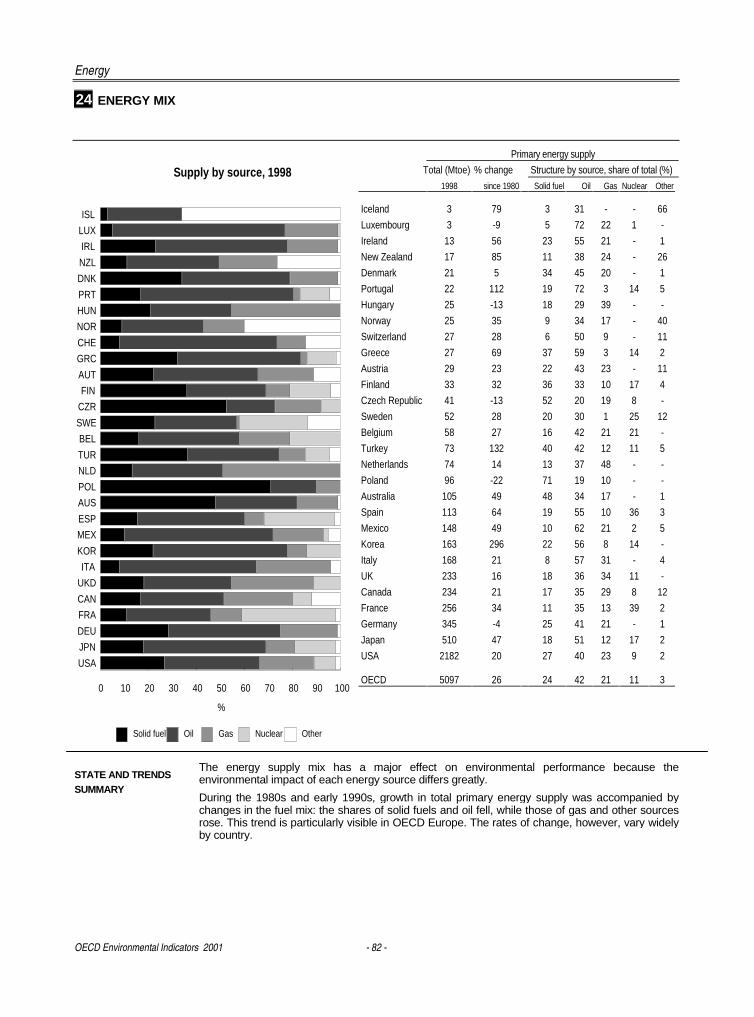
Energy
OECD Environmental Indicators 2001 - 82 -
24 ENERGY MIX
Primary energy supply
Total (Mtoe) % change Structure by source, share of total (%)
1998 since 1980 Solid fuel Oil Gas Nuclear Other
Iceland 3 79 3 31 - - 66
Luxembourg 3 -9 5 72 22 1 -
Ireland 13 56 23 55 21 - 1
New Zealand 17 85 11 38 24 - 26
Denmark 21 5 34 45 20 - 1
Portugal 22 112 19 72 3 14 5
Hungary 25 -13 18 29 39 - -
Norway 25 35 9 34 17 - 40
Switzerland 27 28 6 50 9 - 11
Greece 27 69 37 59 3 14 2
Austria 29 23 22 43 23 - 11
Finland 33 32 36 33 10 17 4
Czech Republic 41 -13 52 20 19 8 -
Sweden 52 28 20 30 1 25 12
Belgium 58 27 16 42 21 21 -
Turkey 73 132 40 42 12 11 5
Netherlands 74 14 13 37 48 - -
Poland 96 -22 71 19 10 - -
Australia 105 49 48 34 17 - 1
Spain 113 64 19 55 10 36 3
Mexico 148 49 10 62 21 2 5
Korea 163 296 22 56 8 14 -
Italy 168 21 8 57 31 - 4
UK 233 16 18 36 34 11 -
Canada 234 21 17 35 29 8 12
France 256 34 11 35 13 39 2
Germany 345 -4 25 41 21 - 1
Japan 510 47 18 51 12 17 2
USA 2182 20 27 40 23 9 2
OECD 5097 26 24 42 21 11 3
STATE AND TRENDSSUMMARY
The energy supply mix has a major effect on environmental performance because theenvironmental impact of each energy source differs greatly.
During the 1980s and early 1990s, growth in total primary energy supply was accompanied bychanges in the fuel mix: the shares of solid fuels and oil fell, while those of gas and other sourcesrose. This trend is particularly visible in OECD Europe. The rates of change, however, vary widelyby country.
ISL
LUX
IRL
NZL
DNK
PRT
HUN
NOR
CHE
GRC
AUT
FIN
CZR
SWE
BEL
TUR
NLD
POL
AUS
ESP
MEX
KOR
ITA
UKD
CAN
FRA
DEU
JPN
USA
0 10 20 30 40 50 60 70 80 90 100
%
Solid fuel Oil Gas Nuclear Other
Supply by source, 1998
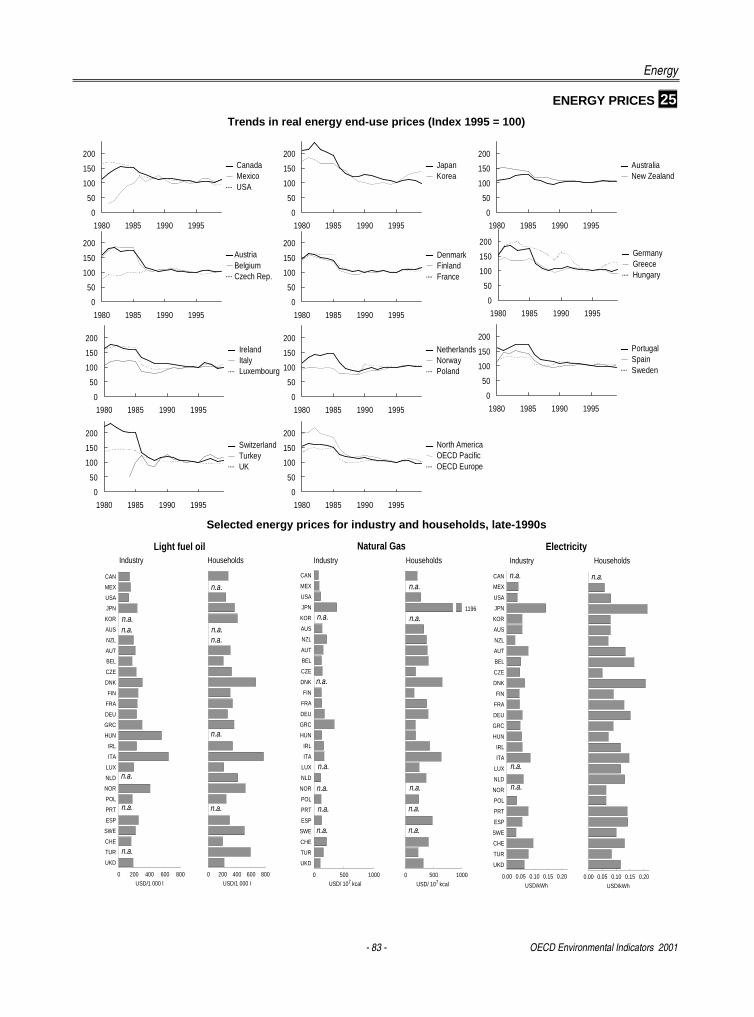
Energy
- 83 - OECD Environmental Indicators 2001
ENERGY PRICES 25Trends in real energy end-use prices (Index 1995 = 100)
0
50
100
150
200
1980 1985 1990 1995
Canada Mexico USA
0
50
100
150
200
1980 1985 1990 1995
Japan Korea
0
50
100
150
200
1980 1985 1990 1995
Australia New Zealand
0
50
100
150
200
1980 1985 1990 1995
Austria Belgium Czech Rep.
0
50
100
150
200
1980 1985 1990 1995
Denmark Finland France
0
50
100
150
200
1980 1985 1990 1995
Germany Greece Hungary
0
50
100
150
200
1980 1985 1990 1995
Ireland Italy Luxembourg
0
50
100
150
200
1980 1985 1990 1995
Netherlands Norway Poland
0
50
100
150
200
1980 1985 1990 1995
Portugal Spain Sweden
0
50
100
150
200
1980 1985 1990 1995
Switzerland Turkey UK
0
50
100
150
200
1980 1985 1990 1995
North America OECD Pacific OECD Europe
Selected energy prices for industry and households, late-1990s
CANMEXUSAJPNKORAUSNZLAUTBELCZEDNKFIN
FRADEUGRCHUN
IRLITA
LUXNLDNORPOLPRTESPSWECHETURUKD
0 500 1000 0.00 0.05 0.10 0.15 0.20
USD/kWh
CAN
MEX
USA
JPN
KOR
AUS
NZL
AUT
BEL
CZE
DNK
FIN
FRA
DEU
GRC
HUN
IRL
ITA
LUX
NLD
NOR
POL
PRT
ESP
SWE
CHE
TUR
UKD
0.00 0.05 0.10 0.15 0.20
USD/kWh
CAN
MEX
USA
JPN
KOR
AUS
NZL
AUT
BEL
CZE
DNK
FIN
FRA
DEU
GRC
HUN
IRL
ITA
LUX
NLD
NOR
POL
PRT
ESP
SWE
CHE
TUR
UKD
0 500 1000
CAN
MEX
USA
JPN
KOR
AUS
NZL
AUT
BEL
CZE
DNK
FIN
FRA
DEU
GRC
HUN
IRL
ITA
LUX
NLD
NOR
POL
PRT
ESP
SWE
CHE
TUR
UKD
0 200 400 600 800
USD/1 000 l
CANMEXUSAJPNKORAUSNZLAUTBELCZEDNKFIN
FRADEUGRCHUN
IRLITA
LUXNLDNORPOLPRTESPSWECHETURUKD
0 200 400 600 800
USD/1 000 l USD/ 107 kcal USD/ 107 kcal
1196
n.a.n.a.
n.a.
n.a.
n.a.
n.a.n.a.
n.a.
n.a.
n.a.
n.a.
n.a.
n.a.
n.a.
n.a.
n.a.
n.a.
n.a.
n.a.
n.a.
n.a.
n.a.
n.a.
n.a.
Industry Households
Light fuel oil Natural Gas ElectricityIndustry Households Industry Households
n.a.
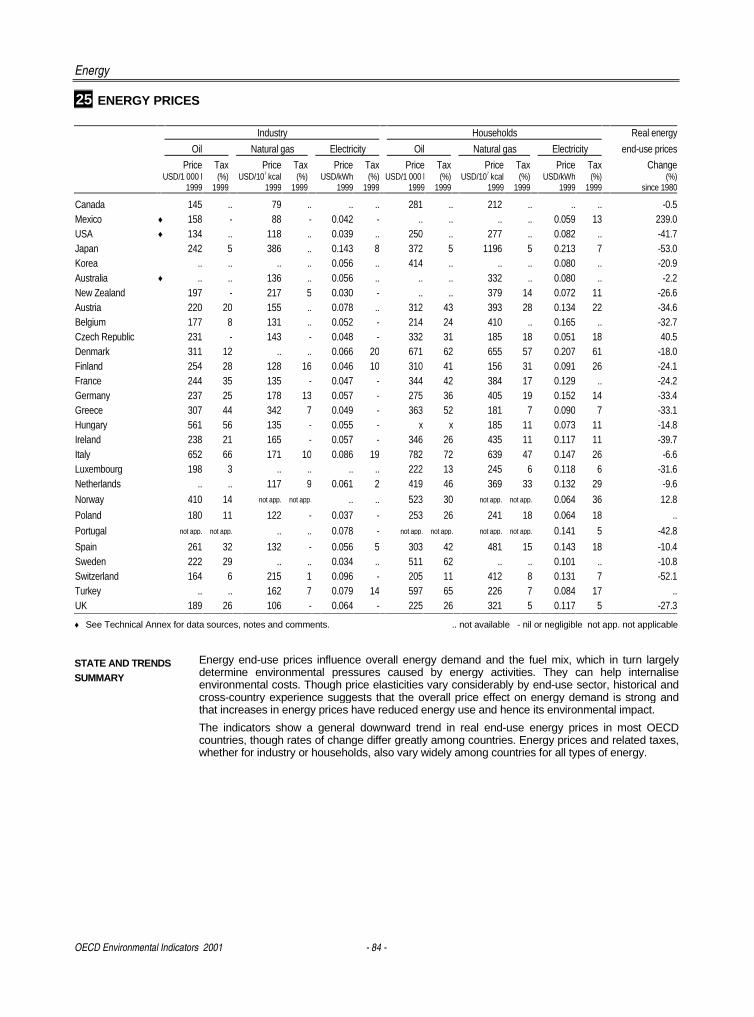
Energy
OECD Environmental Indicators 2001 - 84 -
25 ENERGY PRICES
Industry Households Real energy
Oil Natural gas Electricity Oil Natural gas Electricity end-use prices
Price Tax Price Tax Price Tax Price Tax Price Tax Price Tax ChangeUSD/1 000 l (%) USD/107 kcal (%) USD/kWh (%) USD/1 000 l (%) USD/107 kcal (%) USD/kWh (%) (%)
1999 1999 1999 1999 1999 1999 1999 1999 1999 1999 1999 1999 since 1980
Canada 145 .. 79 .. .. .. 281 .. 212 .. .. .. -0.5Mexico ♦ 158 - 88 - 0.042 - .. .. .. .. 0.059 13 239.0USA ♦ 134 .. 118 .. 0.039 .. 250 .. 277 .. 0.082 .. -41.7Japan 242 5 386 .. 0.143 8 372 5 1196 5 0.213 7 -53.0Korea .. .. .. .. 0.056 .. 414 .. .. .. 0.080 .. -20.9Australia ♦ .. .. 136 .. 0.056 .. .. .. 332 .. 0.080 .. -2.2New Zealand 197 - 217 5 0.030 - .. .. 379 14 0.072 11 -26.6Austria 220 20 155 .. 0.078 .. 312 43 393 28 0.134 22 -34.6Belgium 177 8 131 .. 0.052 - 214 24 410 .. 0.165 .. -32.7Czech Republic 231 - 143 - 0.048 - 332 31 185 18 0.051 18 40.5Denmark 311 12 .. .. 0.066 20 671 62 655 57 0.207 61 -18.0Finland 254 28 128 16 0.046 10 310 41 156 31 0.091 26 -24.1France 244 35 135 - 0.047 - 344 42 384 17 0.129 .. -24.2Germany 237 25 178 13 0.057 - 275 36 405 19 0.152 14 -33.4Greece 307 44 342 7 0.049 - 363 52 181 7 0.090 7 -33.1Hungary 561 56 135 - 0.055 - x x 185 11 0.073 11 -14.8Ireland 238 21 165 - 0.057 - 346 26 435 11 0.117 11 -39.7Italy 652 66 171 10 0.086 19 782 72 639 47 0.147 26 -6.6Luxembourg 198 3 .. .. .. .. 222 13 245 6 0.118 6 -31.6Netherlands .. .. 117 9 0.061 2 419 46 369 33 0.132 29 -9.6
Norway 410 14 not app. not app. .. .. 523 30 not app. not app. 0.064 36 12.8
Poland 180 11 122 - 0.037 - 253 26 241 18 0.064 18 ..
Portugal not app. not app. .. .. 0.078 - not app. not app. not app. not app. 0.141 5 -42.8
Spain 261 32 132 - 0.056 5 303 42 481 15 0.143 18 -10.4Sweden 222 29 .. .. 0.034 .. 511 62 .. .. 0.101 .. -10.8Switzerland 164 6 215 1 0.096 - 205 11 412 8 0.131 7 -52.1Turkey .. .. 162 7 0.079 14 597 65 226 7 0.084 17 ..UK 189 26 106 - 0.064 - 225 26 321 5 0.117 5 -27.3
♦ See Technical Annex for data sources, notes and comments. .. not available - nil or negligible not app. not applicable
STATE AND TRENDSSUMMARY
Energy end-use prices influence overall energy demand and the fuel mix, which in turn largelydetermine environmental pressures caused by energy activities. They can help internaliseenvironmental costs. Though price elasticities vary considerably by end-use sector, historical andcross-country experience suggests that the overall price effect on energy demand is strong andthat increases in energy prices have reduced energy use and hence its environmental impact.
The indicators show a general downward trend in real end-use energy prices in most OECDcountries, though rates of change differ greatly among countries. Energy prices and related taxes,whether for industry or households, also vary widely among countries for all types of energy.
- 85 -
���������
Transport is a major component of economic activity, both as a sector in itself and as a factorinput to most other economic activities. It has many effects on the environment: air pollutionraises concern mainly in urban areas where road traffic and congestion are concentrated,though road transport also contributes to regional and global pollution problems such asacidification and climate change; transport infrastructure leads to fragmentation of naturalhabitats; and vehicles entail waste management issues.
Road transport plays an important role in a country’s environmental performance and thesustainability of its development. The volume of traffic depends on the demand for transport(largely determined by economic activity and transport prices) and on transport supply (e.g.the development of road infrastructure). Road traffic, both freight and passenger, is expectedto increase further in a number of OECD countries. The main challenge is to reduce theenvironmental and health effects of transport, particularly regarding air pollution and climatechange, by ensuring that efficiency gains from technological developments and demand sidemanagement achieve lasting environmental quality improvements.
Indicators presented here relate to:
♦ road traffic and vehicle intensities, i.e. traffic volumes per unit of GDP and per kilometre ofroad, and vehicle numbers per capita and per kilometre of road;
♦ road infrastructure densities, i.e. the length of road and motorway networks per squarekilometre of land area;
♦ road fuel prices and taxes, notably the relative price and taxation levels of diesel fuel andleaded and unleaded gasoline.
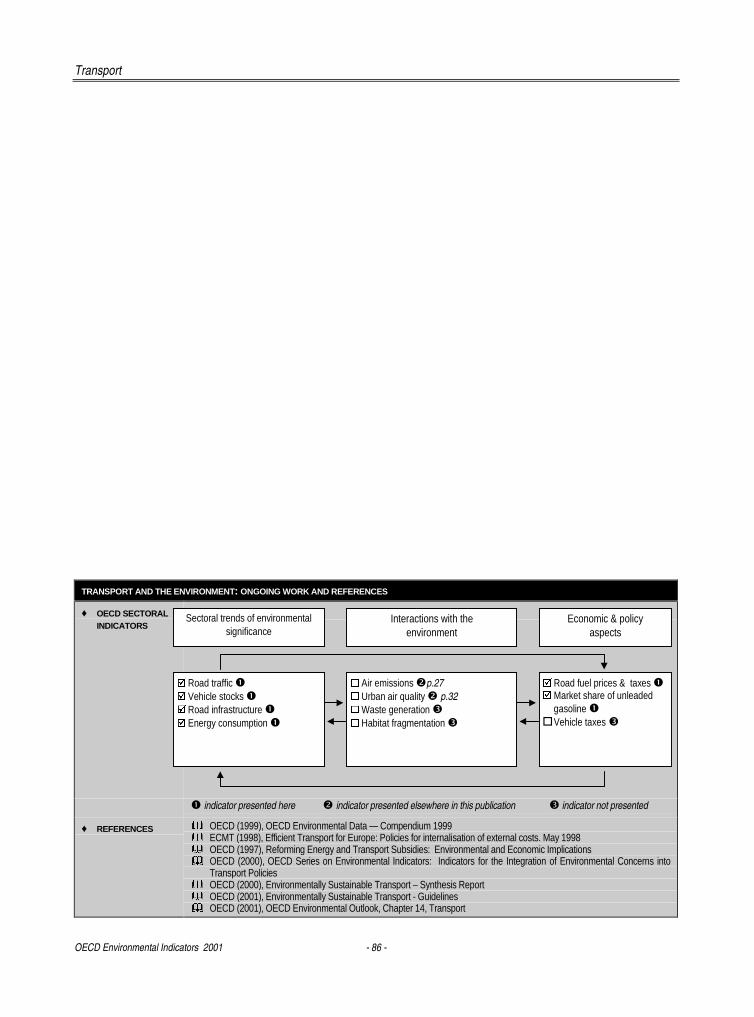
Transport
OECD Environmental Indicators 2001 - 86 -
TRANSPORT AND THE ENVIRONMENT: ONGOING WORK AND REFERENCES
♦ OECD SECTORALINDICATORS
� indicator presented here � indicator presented elsewhere in this publication � indicator not presented
♦ REFERENCES � OECD (1999), OECD Environmental Data — Compendium 1999� ECMT (1998), Efficient Transport for Europe: Policies for internalisation of external costs. May 1998� OECD (1997), Reforming Energy and Transport Subsidies: Environmental and Economic Implications� OECD (2000), OECD Series on Environmental Indicators: Indicators for the Integration of Environmental Concerns into
Transport Policies� OECD (2000), Environmentally Sustainable Transport – Synthesis Report� OECD (2001), Environmentally Sustainable Transport - Guidelines� OECD (2001), OECD Environmental Outlook, Chapter 14, Transport
Sectoral trends of environmentalsignificance
Interactions with theenvironment
Economic & policyaspects
� Road traffic �� Vehicle stocks �� Road infrastructure �� Energy consumption �
� Air emissions �p.27� Urban air quality � p.32� Waste generation �� Habitat fragmentation �
� Road fuel prices & taxes �� Market share of unleaded
gasoline �� Vehicle taxes �
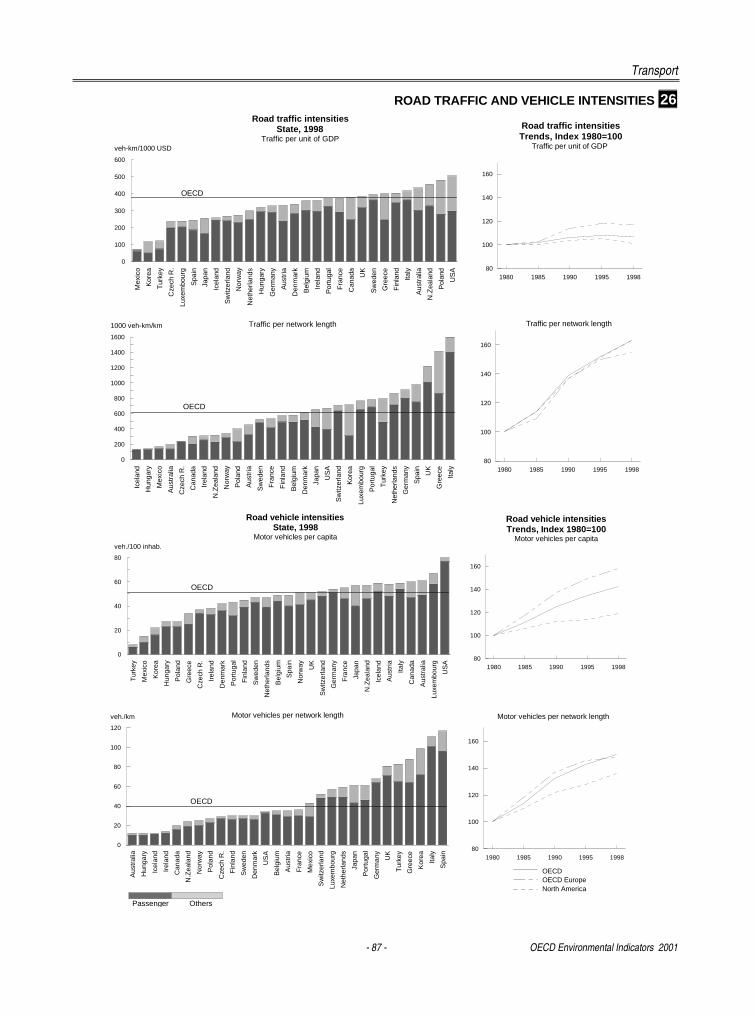
Transport
- 87 - OECD Environmental Indicators 2001
ROAD TRAFFIC AND VEHICLE INTENSITIES 26
Icel
and
Hun
gary
Mex
ico
Aus
tral
ia
Cze
ch R
.
Can
ada
Irel
and
N.Z
eala
nd
Nor
way
Pol
and
Aus
tria
Sw
eden
Fra
nce
Fin
land
Bel
gium
Den
mar
k
Japa
n
US
A
Sw
itzer
land
Kor
ea
Luxe
mbo
urg
Por
tuga
l
Tur
key
Net
herla
nds
Ger
man
y
Spa
in
UK
Gre
ece
Italy
0
200
400
600
800
1000
1200
1400
1600
1000 veh-km/km Traffic per network length
Mex
ico
Kor
ea
Tur
key
Cze
ch R
.
Luxe
mbo
urg
Spa
in
Japa
n
Icel
and
Sw
itzer
land
Nor
way
Net
herla
nds
Hun
gary
Ger
man
y
Aus
tria
Den
mar
k
Bel
gium
Irel
and
Por
tuga
l
Fra
nce
Can
ada
UK
Sw
eden
Gre
ece
Fin
land
Italy
Aus
tral
ia
N.Z
eala
nd
Pol
and
US
A
0
100
200
300
400
500
600
veh-km/1000 USD
Road traffic intensitiesState, 1998
Traffic per unit of GDP
OECD
1980 1985 1990 1995 199880
100
120
140
160
Traffic per network length
1980 1985 1990 1995 199880
100
120
140
160
Road traffic intensitiesTrends, Index 1980=100
Traffic per unit of GDP
OECD
Aus
tral
ia
Hun
gary
Icel
and
Irel
and
Can
ada
N.Z
eala
nd
Nor
way
Pol
and
Cze
ch R
.
Fin
land
Sw
eden
Den
mar
k
US
A
Bel
gium
Aus
tria
Fra
nce
Mex
ico
Sw
itzer
land
Luxe
mbo
urg
Net
herla
nds
Japa
n
Por
tuga
l
Ger
man
y
UK
Tur
key
Gre
ece
Kor
ea
Italy
Spa
in
0
20
40
60
80
100
120
veh./km Motor vehicles per network length
Tur
key
Mex
ico
Kor
ea
Hun
gary
Pol
and
Gre
ece
Cze
ch R
.
Irel
and
Den
mar
k
Por
tuga
l
Fin
land
Sw
eden
Net
herla
nds
Bel
gium
Spa
in
Nor
way UK
Sw
itzer
land
Ger
man
y
Fra
nce
Japa
n
N.Z
eala
nd
Icel
and
Aus
tria
Italy
Can
ada
Aus
tral
ia
Luxe
mbo
urg
US
A
0
20
40
60
80
veh./100 inhab.
Road vehicle intensitiesState, 1998
Motor vehicles per capita
Passenger Others
1980 1985 1990 1995 199880
100
120
140
160
Road vehicle intensitiesTrends, Index 1980=100
Motor vehicles per capita
1980 1985 1990 1995 199880
100
120
140
160
OECDOECD EuropeNorth America
Motor vehicles per network length
OECD
OECD
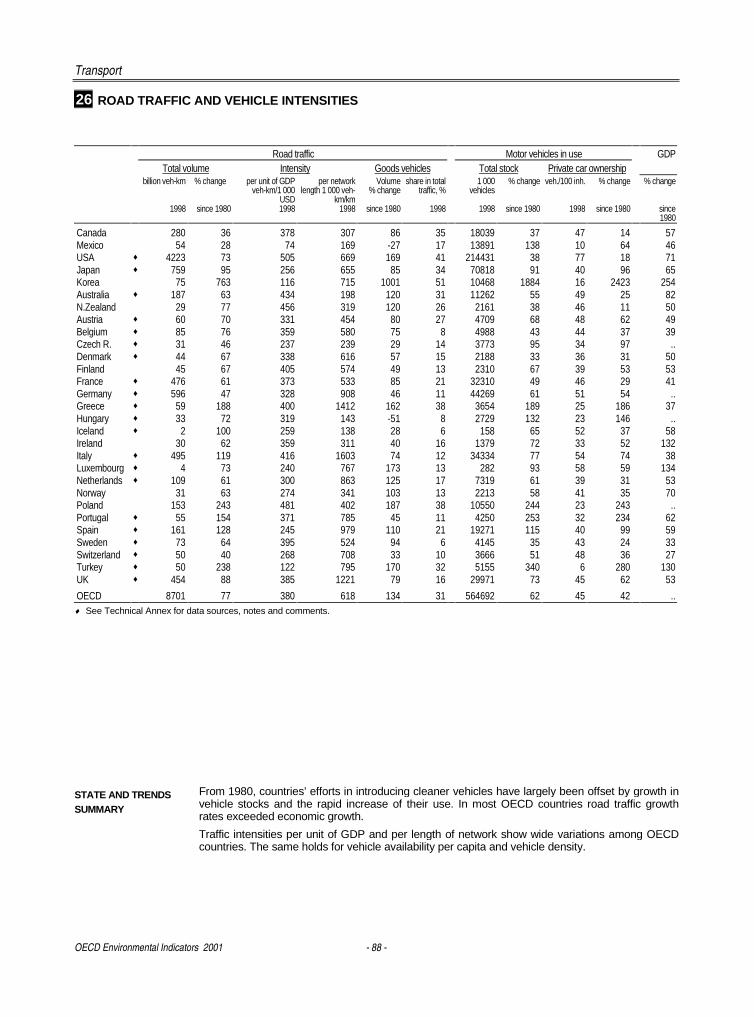
Transport
OECD Environmental Indicators 2001 - 88 -
26 ROAD TRAFFIC AND VEHICLE INTENSITIES
Road traffic Motor vehicles in use GDPTotal volume Intensity Goods vehicles Total stock Private car ownership
billion veh-km % change per unit of GDPveh-km/1 000
USD
per networklength 1 000 veh-
km/km
Volume% change
share in totaltraffic, %
1 000vehicles
% change veh./100 inh. % change % change
1998 since 1980 1998 1998 since 1980 1998 1998 since 1980 1998 since 1980 since1980
Canada 280 36 378 307 86 35 18039 37 47 14 57Mexico 54 28 74 169 -27 17 13891 138 10 64 46USA ♦ 4223 73 505 669 169 41 214431 38 77 18 71Japan ♦ 759 95 256 655 85 34 70818 91 40 96 65Korea 75 763 116 715 1001 51 10468 1884 16 2423 254Australia ♦ 187 63 434 198 120 31 11262 55 49 25 82N.Zealand 29 77 456 319 120 26 2161 38 46 11 50Austria ♦ 60 70 331 454 80 27 4709 68 48 62 49Belgium ♦ 85 76 359 580 75 8 4988 43 44 37 39Czech R. ♦ 31 46 237 239 29 14 3773 95 34 97 ..Denmark ♦ 44 67 338 616 57 15 2188 33 36 31 50Finland 45 67 405 574 49 13 2310 67 39 53 53France ♦ 476 61 373 533 85 21 32310 49 46 29 41Germany ♦ 596 47 328 908 46 11 44269 61 51 54 ..Greece ♦ 59 188 400 1412 162 38 3654 189 25 186 37Hungary ♦ 33 72 319 143 -51 8 2729 132 23 146 ..Iceland ♦ 2 100 259 138 28 6 158 65 52 37 58Ireland 30 62 359 311 40 16 1379 72 33 52 132Italy ♦ 495 119 416 1603 74 12 34334 77 54 74 38Luxembourg ♦ 4 73 240 767 173 13 282 93 58 59 134Netherlands ♦ 109 61 300 863 125 17 7319 61 39 31 53Norway 31 63 274 341 103 13 2213 58 41 35 70Poland 153 243 481 402 187 38 10550 244 23 243 ..Portugal ♦ 55 154 371 785 45 11 4250 253 32 234 62Spain ♦ 161 128 245 979 110 21 19271 115 40 99 59Sweden ♦ 73 64 395 524 94 6 4145 35 43 24 33Switzerland ♦ 50 40 268 708 33 10 3666 51 48 36 27Turkey ♦ 50 238 122 795 170 32 5155 340 6 280 130UK ♦ 454 88 385 1221 79 16 29971 73 45 62 53
OECD 8701 77 380 618 134 31 564692 62 45 42 ..♦ See Technical Annex for data sources, notes and comments.
STATE AND TRENDSSUMMARY
From 1980, countries’ efforts in introducing cleaner vehicles have largely been offset by growth invehicle stocks and the rapid increase of their use. In most OECD countries road traffic growthrates exceeded economic growth.
Traffic intensities per unit of GDP and per length of network show wide variations among OECDcountries. The same holds for vehicle availability per capita and vehicle density.
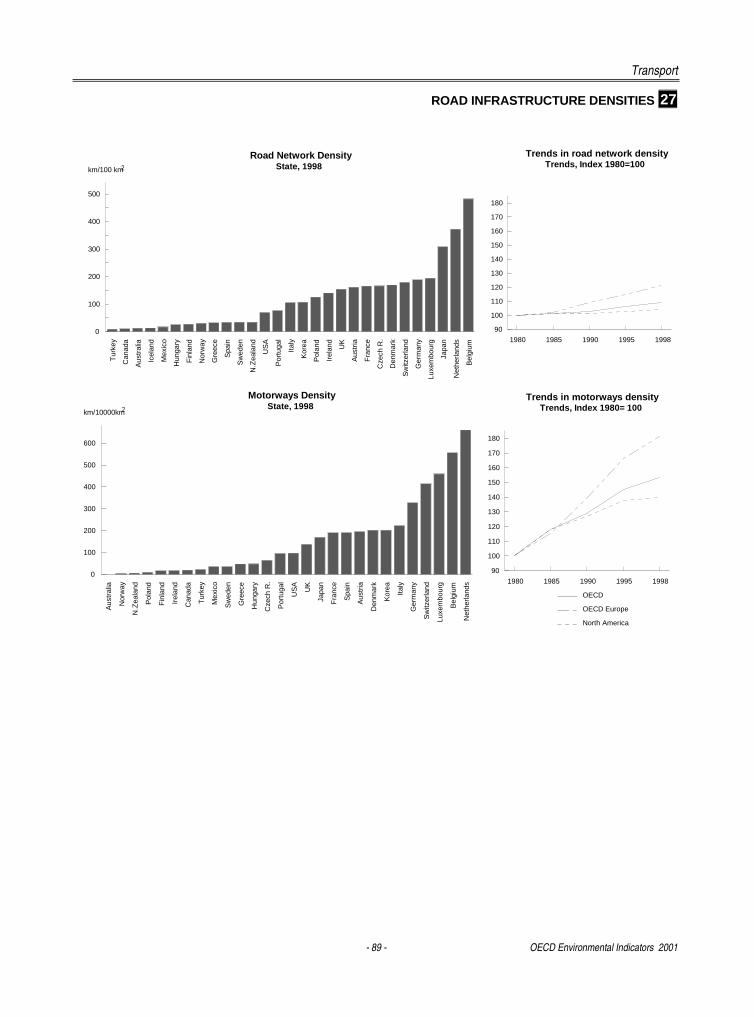
Transport
- 89 - OECD Environmental Indicators 2001
ROAD INFRASTRUCTURE DENSITIES 27T
urke
y
Can
ada
Aus
tral
ia
Icel
and
Mex
ico
Hun
gary
Fin
land
Nor
way
Gre
ece
Spa
in
Sw
eden
N.Z
eala
nd
US
A
Por
tuga
l
Italy
Kor
ea
Pol
and
Irel
and
UK
Aus
tria
Fra
nce
Cze
ch R
.
Den
mar
k
Sw
itzer
land
Ger
man
y
Luxe
mbo
urg
Japa
n
Net
herla
nds
Bel
gium
0
100
200
300
400
500
km/100 km
Road Network DensityState, 1998
Aus
tral
ia
Nor
way
N.Z
eala
nd
Pol
and
Fin
land
Irel
and
Can
ada
Tur
key
Mex
ico
Sw
eden
Gre
ece
Hun
gary
Cze
ch R
.
Por
tuga
l
US
A
UK
Japa
n
Fra
nce
Spa
in
Aus
tria
Den
mar
k
Kor
ea
Italy
Ger
man
y
Sw
itzer
land
Luxe
mbo
urg
Bel
gium
Net
herla
nds
0
100
200
300
400
500
600
km/10000km
Motorways DensityState, 1998
1980 1985 1990 1995 1998
90
100
110
120
130
140
150
160
170
180
Trends in road network densityTrends, Index 1980=100
1980 1985 1990 1995 1998
90
100
110
120
130
140
150
160
170
180
OECD
OECD Europe
North America
Trends in motorways densityTrends, Index 1980= 100
2
2
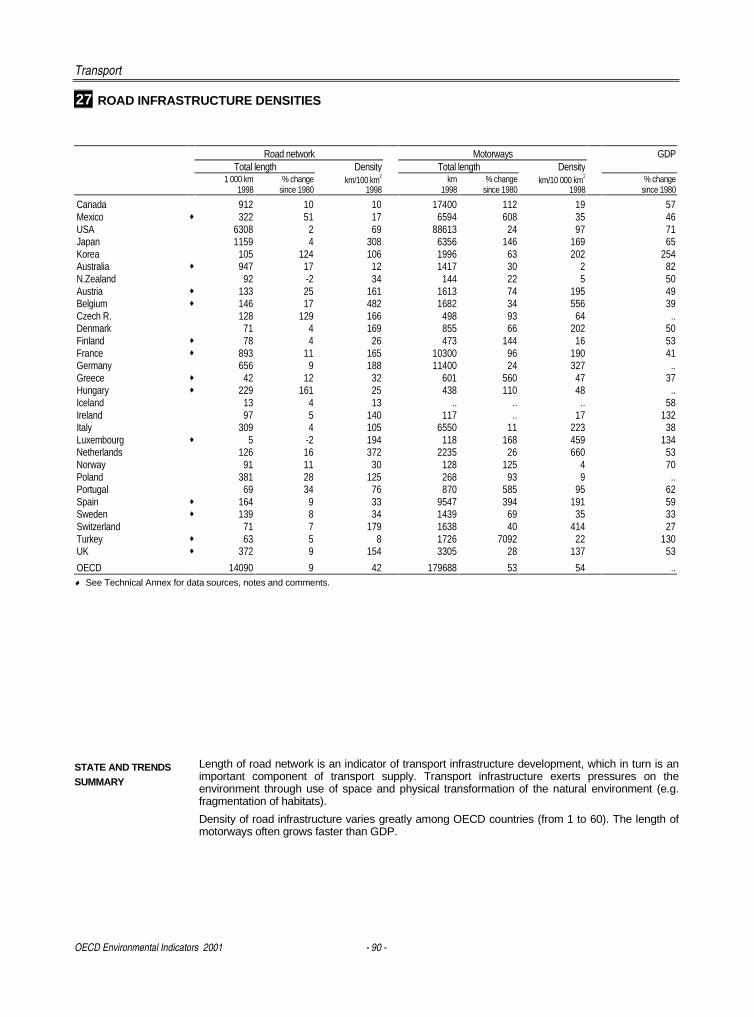
Transport
OECD Environmental Indicators 2001 - 90 -
27 ROAD INFRASTRUCTURE DENSITIES
Road network Motorways GDPTotal length Density Total length Density
1 000 km % change km/100 km2 km % change km/10 000 km2 % change1998 since 1980 1998 1998 since 1980 1998 since 1980
Canada 912 10 10 17400 112 19 57Mexico ♦ 322 51 17 6594 608 35 46USA 6308 2 69 88613 24 97 71Japan 1159 4 308 6356 146 169 65Korea 105 124 106 1996 63 202 254Australia ♦ 947 17 12 1417 30 2 82N.Zealand 92 -2 34 144 22 5 50Austria ♦ 133 25 161 1613 74 195 49Belgium ♦ 146 17 482 1682 34 556 39Czech R. 128 129 166 498 93 64 ..Denmark 71 4 169 855 66 202 50Finland ♦ 78 4 26 473 144 16 53France ♦ 893 11 165 10300 96 190 41Germany 656 9 188 11400 24 327 ..Greece ♦ 42 12 32 601 560 47 37Hungary ♦ 229 161 25 438 110 48 ..Iceland 13 4 13 .. .. .. 58Ireland 97 5 140 117 .. 17 132Italy 309 4 105 6550 11 223 38Luxembourg ♦ 5 -2 194 118 168 459 134Netherlands 126 16 372 2235 26 660 53Norway 91 11 30 128 125 4 70Poland 381 28 125 268 93 9 ..Portugal 69 34 76 870 585 95 62Spain ♦ 164 9 33 9547 394 191 59Sweden ♦ 139 8 34 1439 69 35 33Switzerland 71 7 179 1638 40 414 27Turkey ♦ 63 5 8 1726 7092 22 130UK ♦ 372 9 154 3305 28 137 53
OECD 14090 9 42 179688 53 54 ..♦ See Technical Annex for data sources, notes and comments.
STATE AND TRENDSSUMMARY
Length of road network is an indicator of transport infrastructure development, which in turn is animportant component of transport supply. Transport infrastructure exerts pressures on theenvironment through use of space and physical transformation of the natural environment (e.g.fragmentation of habitats).
Density of road infrastructure varies greatly among OECD countries (from 1 to 60). The length ofmotorways often grows faster than GDP.
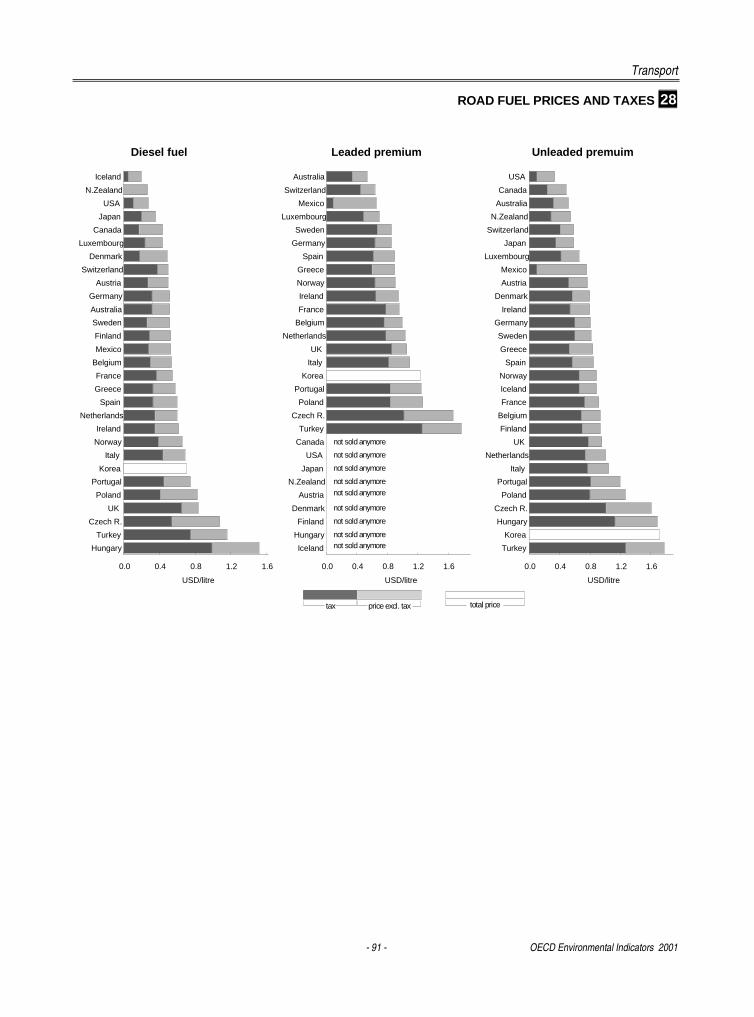
Transport
- 91 - OECD Environmental Indicators 2001
ROAD FUEL PRICES AND TAXES 28
Diesel fuel Leaded premium Unleaded premuim
Australia
Switzerland
Mexico
Luxembourg
Sweden
Germany
Spain
Greece
Norway
Ireland
France
Belgium
Netherlands
UK
Italy
Korea
Portugal
Poland
Czech R.
Turkey
Canada
USA
Japan
N.Zealand
Austria
Denmark
Finland
Hungary
Iceland
0.0 0.4 0.8 1.2 1.6
USD/litre
tax price excl. tax total price
USA
Canada
Australia
N.Zealand
Switzerland
Japan
Luxembourg
Mexico
Austria
Denmark
Ireland
Germany
Sweden
Greece
Spain
Norway
Iceland
France
Belgium
Finland
UK
Netherlands
Italy
Portugal
Poland
Czech R.
Hungary
Korea
Turkey
0.0 0.4 0.8 1.2 1.6
USD/litre
Iceland
N.Zealand
USA
Japan
Canada
Luxembourg
Denmark
Switzerland
Austria
Germany
Australia
Sweden
Finland
Mexico
Belgium
France
Greece
Spain
Netherlands
Ireland
Norway
Italy
Korea
Portugal
Poland
UK
Czech R.
Turkey
Hungary
0.0 0.4 0.8 1.2 1.6
USD/litre
not sold anymore
not sold anymore
not sold anymore
not sold anymore
not sold anymore
not sold anymore
not sold anymore
not sold anymore
not sold anymore
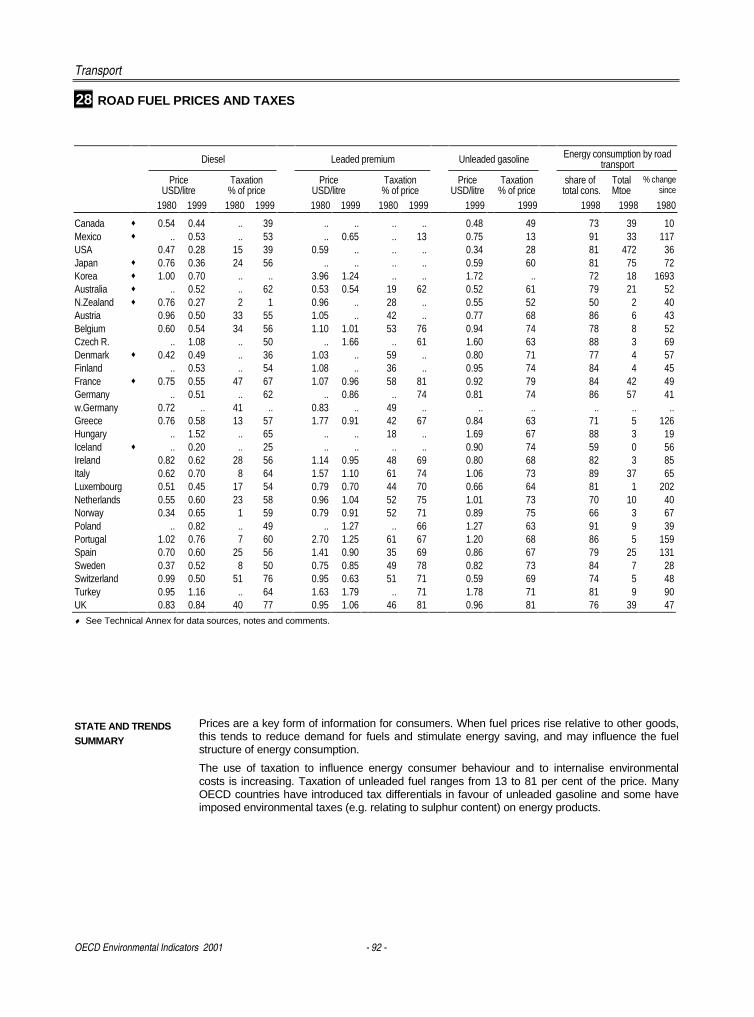
Transport
OECD Environmental Indicators 2001 - 92 -
28 ROAD FUEL PRICES AND TAXES
Diesel Leaded premium Unleaded gasoline Energy consumption by roadtransport
Price Taxation Price Taxation Price Taxation share of Total % changeUSD/litre % of price USD/litre % of price USD/litre % of price total cons. Mtoe since
1980 1999 1980 1999 1980 1999 1980 1999 1999 1999 1998 1998 1980
Canada ♦ 0.54 0.44 .. 39 .. .. .. .. 0.48 49 73 39 10Mexico ♦ .. 0.53 .. 53 .. 0.65 .. 13 0.75 13 91 33 117USA 0.47 0.28 15 39 0.59 .. .. .. 0.34 28 81 472 36Japan ♦ 0.76 0.36 24 56 .. .. .. .. 0.59 60 81 75 72Korea ♦ 1.00 0.70 .. .. 3.96 1.24 .. .. 1.72 .. 72 18 1693Australia ♦ .. 0.52 .. 62 0.53 0.54 19 62 0.52 61 79 21 52N.Zealand ♦ 0.76 0.27 2 1 0.96 .. 28 .. 0.55 52 50 2 40Austria 0.96 0.50 33 55 1.05 .. 42 .. 0.77 68 86 6 43Belgium 0.60 0.54 34 56 1.10 1.01 53 76 0.94 74 78 8 52Czech R. .. 1.08 .. 50 .. 1.66 .. 61 1.60 63 88 3 69Denmark ♦ 0.42 0.49 .. 36 1.03 .. 59 .. 0.80 71 77 4 57Finland .. 0.53 .. 54 1.08 .. 36 .. 0.95 74 84 4 45France ♦ 0.75 0.55 47 67 1.07 0.96 58 81 0.92 79 84 42 49Germany .. 0.51 .. 62 .. 0.86 .. 74 0.81 74 86 57 41w.Germany 0.72 .. 41 .. 0.83 .. 49 .. .. .. .. .. ..Greece 0.76 0.58 13 57 1.77 0.91 42 67 0.84 63 71 5 126Hungary .. 1.52 .. 65 .. .. 18 .. 1.69 67 88 3 19Iceland ♦ .. 0.20 .. 25 .. .. .. .. 0.90 74 59 0 56Ireland 0.82 0.62 28 56 1.14 0.95 48 69 0.80 68 82 3 85Italy 0.62 0.70 8 64 1.57 1.10 61 74 1.06 73 89 37 65Luxembourg 0.51 0.45 17 54 0.79 0.70 44 70 0.66 64 81 1 202Netherlands 0.55 0.60 23 58 0.96 1.04 52 75 1.01 73 70 10 40Norway 0.34 0.65 1 59 0.79 0.91 52 71 0.89 75 66 3 67Poland .. 0.82 .. 49 .. 1.27 .. 66 1.27 63 91 9 39Portugal 1.02 0.76 7 60 2.70 1.25 61 67 1.20 68 86 5 159Spain 0.70 0.60 25 56 1.41 0.90 35 69 0.86 67 79 25 131Sweden 0.37 0.52 8 50 0.75 0.85 49 78 0.82 73 84 7 28Switzerland 0.99 0.50 51 76 0.95 0.63 51 71 0.59 69 74 5 48Turkey 0.95 1.16 .. 64 1.63 1.79 .. 71 1.78 71 81 9 90UK 0.83 0.84 40 77 0.95 1.06 46 81 0.96 81 76 39 47♦ See Technical Annex for data sources, notes and comments.
STATE AND TRENDSSUMMARY
Prices are a key form of information for consumers. When fuel prices rise relative to other goods,this tends to reduce demand for fuels and stimulate energy saving, and may influence the fuelstructure of energy consumption.
The use of taxation to influence energy consumer behaviour and to internalise environmentalcosts is increasing. Taxation of unleaded fuel ranges from 13 to 81 per cent of the price. ManyOECD countries have introduced tax differentials in favour of unleaded gasoline and some haveimposed environmental taxes (e.g. relating to sulphur content) on energy products.
- 93 -
����������The economic and social significance of the agricultural sector has been declining in mostOECD countries for decades. Agriculture’s environmental effects can be negative or positive.They depend on the scale, type and intensity of farming as well as on agro-ecological andphysical factors and on climate and weather. Farming can lead to deterioration in soil, waterand air quality, and to loss of natural habitats and biodiversity. These environmental changescan have important implications for the level of agricultural production and food supply, andcan limit the sustainable development of agriculture. But farming can also provide sinks forgreenhouse gases, conserve biodiversity and landscapes and help prevent floods andlandslides.
The main environmental concerns related to agriculture include nitrogen and phosphorus run-off from excessive commercial fertiliser use, intensive livestock farming and pesticides.Nitrogen and phosphorus, while major plant nutrients, are responsible for water eutrophicationand related effects on aquatic life and water quality. Pesticide use adds persistent organicchemicals to ecosystems; these tend to accumulate in the soil and in biota, and residues mayleach into surface and groundwaters. The general population can be exposed to pesticidesthrough food. The main challenge is to progressively decrease the negative and increase thepositive environmental effects of agricultural production so that ecosystem functions can bemaintained and food security ensured for the world’s population.
Indicators presented here relate to:
♦ intensity of use of nitrogen and phosphate fertilisers in agriculture, reflected throughapparent consumption in tonnes of active ingredients (N and P per km2 of agriculturalland). This represents potential pressure on the environment in the absence of effectivepollution abatement.
♦ Nitrogen balances, measured by the soil surface balance, is the difference between thetotal quantity of nitrogen inputs entering, and the quantity of nitrogen outputs leaving thesoil over one year, per hectare of agricultural land.
♦ livestock densities, reflected through the number of head of cattle, pigs, sheep and goatsper km2 of agricultural land; the amount of N and P generated by livestock manure per km2
of agricultural land is provided to complete the picture.
♦ intensity of use of pesticides in agriculture, reflected through apparent consumption orsales expressed in tonnes of active ingredients per km2 of agricultural land. This indicatordoes not recognise differences among pesticides in levels of toxicity, persistence andmobility. It can be considered a first step towards a more comprehensive indicator basedon an internationally agreed list of substances with appropriate weighting factors. Usingkm2 of land where pesticides are actually applied as the denominator would provideimportant complementary information about intensity of pesticide use.
It should be noted that these indicators describe potential environmental pressures, and mayhide important sub-national variations. More information is needed to describe the actualpressure.
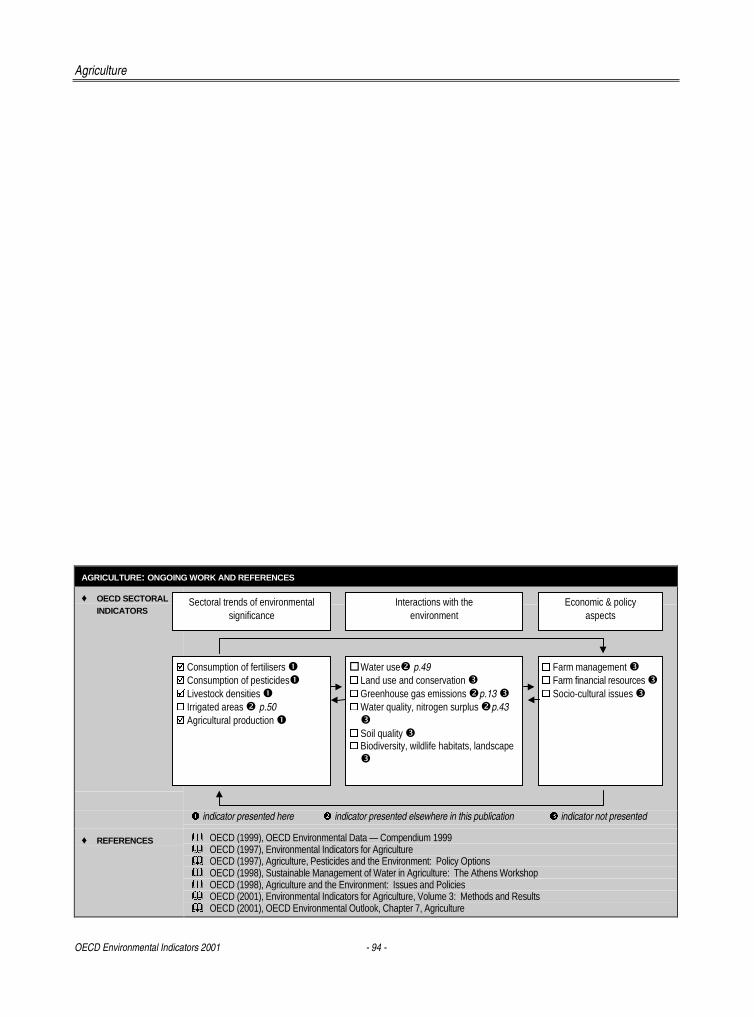
Agriculture
OECD Environmental Indicators 2001 - 94 -
AGRICULTURE: ONGOING WORK AND REFERENCES
♦ OECD SECTORALINDICATORS
� indicator presented here � indicator presented elsewhere in this publication � indicator not presented
♦ REFERENCES � OECD (1999), OECD Environmental Data — Compendium 1999� OECD (1997), Environmental Indicators for Agriculture� OECD (1997), Agriculture, Pesticides and the Environment: Policy Options� OECD (1998), Sustainable Management of Water in Agriculture: The Athens Workshop� OECD (1998), Agriculture and the Environment: Issues and Policies� OECD (2001), Environmental Indicators for Agriculture, Volume 3: Methods and Results� OECD (2001), OECD Environmental Outlook, Chapter 7, Agriculture
Sectoral trends of environmentalsignificance
Interactions with theenvironment
Economic & policyaspects
� Consumption of fertilisers �� Consumption of pesticides�� Livestock densities �� Irrigated areas � p.50� Agricultural production �
� Water use� p.49� Land use and conservation �� Greenhouse gas emissions �p.13 �� Water quality, nitrogen surplus �p.43�
� Soil quality �� Biodiversity, wildlife habitats, landscape�
� Farm management �� Farm financial resources �� Socio-cultural issues �
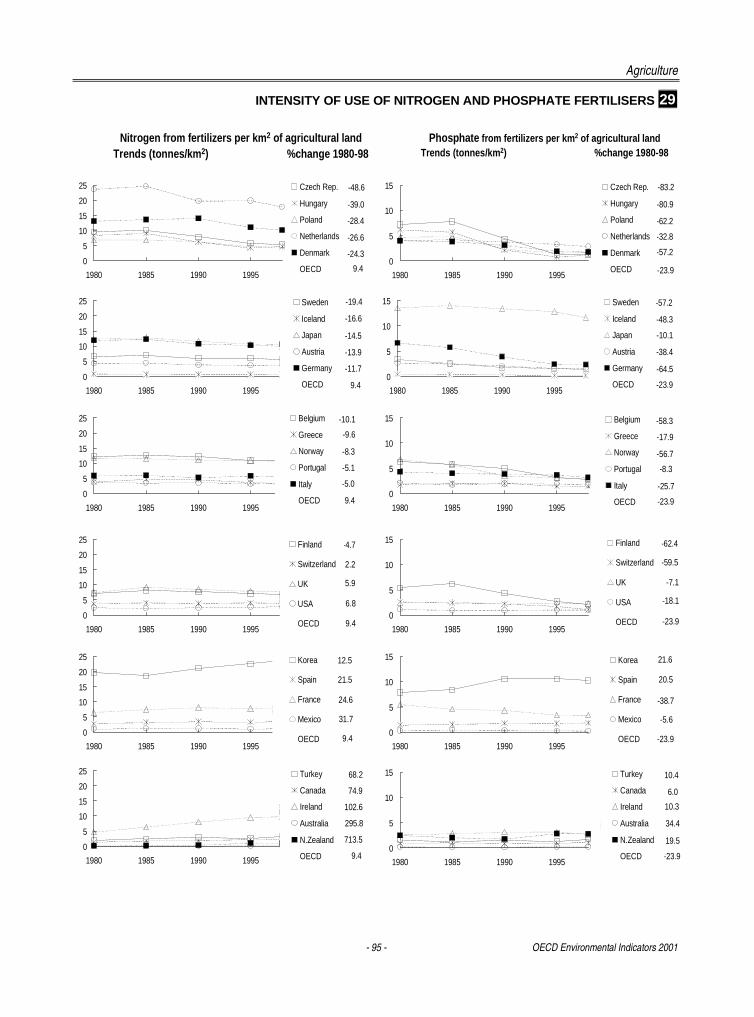
Agriculture
- 95 - OECD Environmental Indicators 2001
INTENSITY OF USE OF NITROGEN AND PHOSPHATE FERTILISERS 29
-48.6
-39.0
-28.4
-26.6
-24.3
9.4
Czech Rep.
Hungary
Poland
Netherlands
Denmark
OECD 0
5
10
15
20
25
1980 1985 1990 1995
Nitrogen from fertilizers per km2 of agricultural landTrends (tonnes/km2) %change 1980-98
Phosphate from fertilizers per km2 of agricultural landTrends (tonnes/km2) %change 1980-98
0
5
10
15
20
25
1980 1985 1990 1995
-19.4
-16.6
-14.5
-13.9
-11.7
9.4
Sweden
Iceland
Japan
Austria
Germany
OECD
0
5
10
15
20
25
1980 1985 1990 1995
-10.1
-9.6
-8.3
-5.1
-5.0
9.4
Belgium
Greece
Norway
Portugal
Italy
OECD
0
5
10
15
20
25
1980 1985 1990 1995
-4.7
2.2
5.9
6.8
9.4
Finland
Switzerland
UK
USA
OECD
0
5
10
15
20
25
1980 1985 1990 1995
12.5
21.5
24.6
31.7
9.4
Korea
Spain
France
Mexico
OECD
0
5
10
15
20
25
1980 1985 1990 1995
68.2
74.9
102.6
295.8
713.5
9.4
Turkey
Canada
Ireland
Australia
N.Zealand
OECD
0
5
10
15
1980 1985 1990 1995
-83.2
-80.9
-62.2
-32.8
-57.2
-23.9
Czech Rep.
Hungary
Poland
Netherlands
Denmark
OECD
0
5
10
15
1980 1985 1990 1995
-57.2
-48.3
-10.1
-38.4
-64.5
-23.9
Sweden
Iceland
Japan
Austria
Germany
OECD
0
5
10
15
1980 1985 1990 1995
-58.3
-17.9
-56.7
-8.3
-25.7
-23.9
Belgium
Greece
Norway
Portugal
Italy
OECD
0
5
10
15
1980 1985 1990 1995
-62.4
-59.5
-7.1
-18.1
-23.9
Finland
Switzerland
UK
USA
OECD
0
5
10
15
1980 1985 1990 1995
21.6
20.5
-38.7
-5.6
-23.9
Korea
Spain
France
Mexico
OECD
0
5
10
15
1980 1985 1990 1995
10.4
6.0
10.3
34.4
19.5
-23.9
Turkey
Canada
Ireland
Australia
N.Zealand
OECD
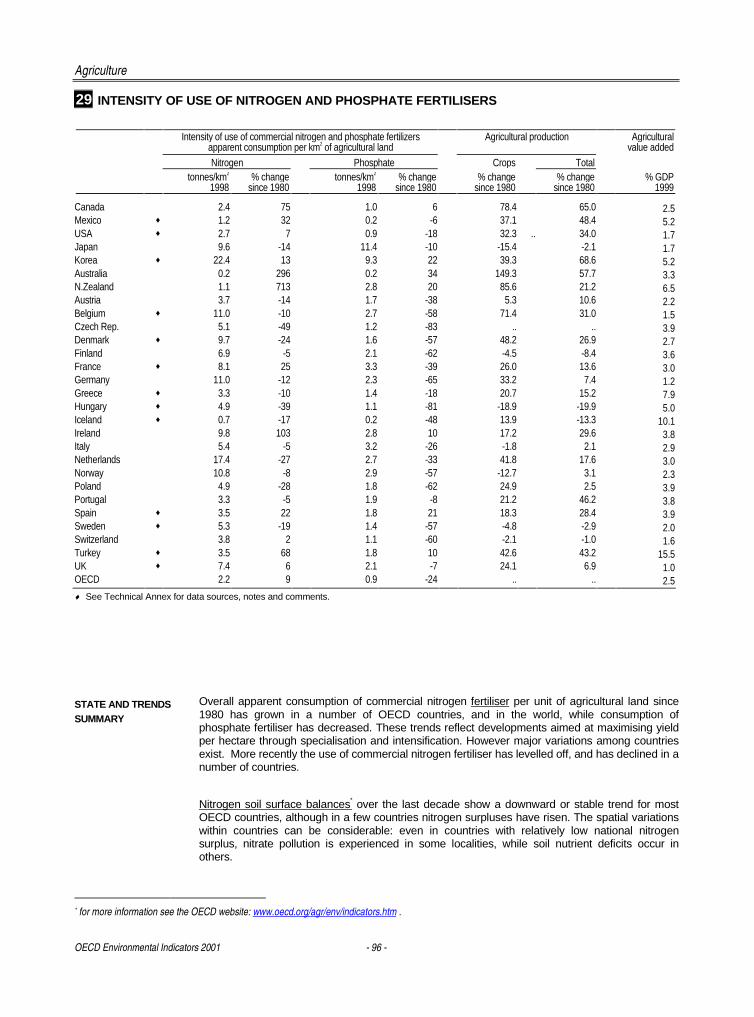
Agriculture
OECD Environmental Indicators 2001 - 96 -
29 INTENSITY OF USE OF NITROGEN AND PHOSPHATE FERTILISERS
Intensity of use of commercial nitrogen and phosphate fertilizersapparent consumption per km2 of agricultural land
Agricultural production Agriculturalvalue added
Nitrogen Phosphate Crops Totaltonnes/km2 % change tonnes/km2 % change % change % change % GDP
1998 since 1980 1998 since 1980 since 1980 since 1980 1999
Canada 2.4 75 1.0 6 78.4 65.0 2.5Mexico ♦ 1.2 32 0.2 -6 37.1 48.4 5.2USA ♦ 2.7 7 0.9 -18 32.3 .. 34.0 1.7Japan 9.6 -14 11.4 -10 -15.4 -2.1 1.7Korea ♦ 22.4 13 9.3 22 39.3 68.6 5.2Australia 0.2 296 0.2 34 149.3 57.7 3.3N.Zealand 1.1 713 2.8 20 85.6 21.2 6.5Austria 3.7 -14 1.7 -38 5.3 10.6 2.2Belgium ♦ 11.0 -10 2.7 -58 71.4 31.0 1.5Czech Rep. 5.1 -49 1.2 -83 .. .. 3.9Denmark ♦ 9.7 -24 1.6 -57 48.2 26.9 2.7Finland 6.9 -5 2.1 -62 -4.5 -8.4 3.6France ♦ 8.1 25 3.3 -39 26.0 13.6 3.0Germany 11.0 -12 2.3 -65 33.2 7.4 1.2Greece ♦ 3.3 -10 1.4 -18 20.7 15.2 7.9Hungary ♦ 4.9 -39 1.1 -81 -18.9 -19.9 5.0Iceland ♦ 0.7 -17 0.2 -48 13.9 -13.3 10.1Ireland 9.8 103 2.8 10 17.2 29.6 3.8Italy 5.4 -5 3.2 -26 -1.8 2.1 2.9Netherlands 17.4 -27 2.7 -33 41.8 17.6 3.0Norway 10.8 -8 2.9 -57 -12.7 3.1 2.3Poland 4.9 -28 1.8 -62 24.9 2.5 3.9Portugal 3.3 -5 1.9 -8 21.2 46.2 3.8Spain ♦ 3.5 22 1.8 21 18.3 28.4 3.9Sweden ♦ 5.3 -19 1.4 -57 -4.8 -2.9 2.0Switzerland 3.8 2 1.1 -60 -2.1 -1.0 1.6Turkey ♦ 3.5 68 1.8 10 42.6 43.2 15.5UK ♦ 7.4 6 2.1 -7 24.1 6.9 1.0OECD 2.2 9 0.9 -24 .. .. 2.5♦ See Technical Annex for data sources, notes and comments.
STATE AND TRENDSSUMMARY
Overall apparent consumption of commercial nitrogen fertiliser per unit of agricultural land since1980 has grown in a number of OECD countries, and in the world, while consumption ofphosphate fertiliser has decreased. These trends reflect developments aimed at maximising yieldper hectare through specialisation and intensification. However major variations among countriesexist. More recently the use of commercial nitrogen fertiliser has levelled off, and has declined in anumber of countries.
Nitrogen soil surface balances* over the last decade show a downward or stable trend for most OECD countries, although in a few countries nitrogen surpluses have risen. The spatial variationswithin countries can be considerable: even in countries with relatively low national nitrogensurplus, nitrate pollution is experienced in some localities, while soil nutrient deficits occur inothers.
* for more information see the OECD website: www.oecd.org/agr/env/indicators.htm .
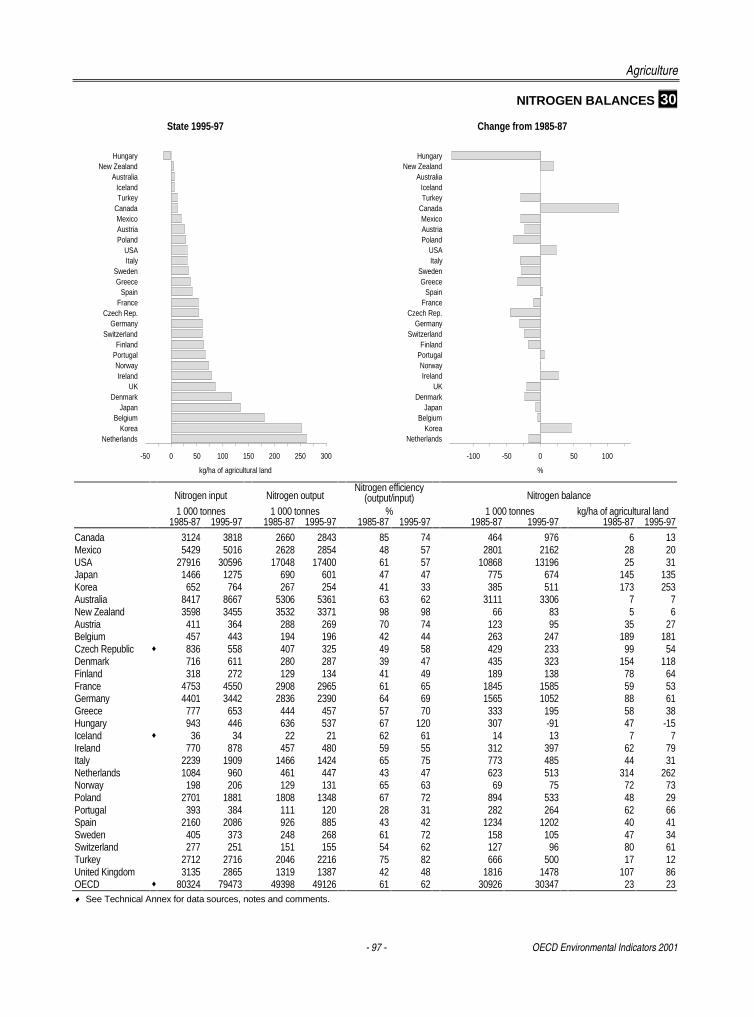
Agriculture
- 97 - OECD Environmental Indicators 2001
NITROGEN BALANCES 30
Nitrogen input Nitrogen outputNitrogen efficiency
(output/input) Nitrogen balance
1 000 tonnes 1 000 tonnes % 1 000 tonnes kg/ha of agricultural land1985-87 1995-97 1985-87 1995-97 1985-87 1995-97 1985-87 1995-97 1985-87 1995-97
Canada 3124 3818 2660 2843 85 74 464 976 6 13Mexico 5429 5016 2628 2854 48 57 2801 2162 28 20USA 27916 30596 17048 17400 61 57 10868 13196 25 31Japan 1466 1275 690 601 47 47 775 674 145 135Korea 652 764 267 254 41 33 385 511 173 253Australia 8417 8667 5306 5361 63 62 3111 3306 7 7New Zealand 3598 3455 3532 3371 98 98 66 83 5 6Austria 411 364 288 269 70 74 123 95 35 27Belgium 457 443 194 196 42 44 263 247 189 181Czech Republic ♦ 836 558 407 325 49 58 429 233 99 54Denmark 716 611 280 287 39 47 435 323 154 118Finland 318 272 129 134 41 49 189 138 78 64France 4753 4550 2908 2965 61 65 1845 1585 59 53Germany 4401 3442 2836 2390 64 69 1565 1052 88 61Greece 777 653 444 457 57 70 333 195 58 38Hungary 943 446 636 537 67 120 307 -91 47 -15Iceland ♦ 36 34 22 21 62 61 14 13 7 7Ireland 770 878 457 480 59 55 312 397 62 79Italy 2239 1909 1466 1424 65 75 773 485 44 31Netherlands 1084 960 461 447 43 47 623 513 314 262Norway 198 206 129 131 65 63 69 75 72 73Poland 2701 1881 1808 1348 67 72 894 533 48 29Portugal 393 384 111 120 28 31 282 264 62 66Spain 2160 2086 926 885 43 42 1234 1202 40 41Sweden 405 373 248 268 61 72 158 105 47 34Switzerland 277 251 151 155 54 62 127 96 80 61Turkey 2712 2716 2046 2216 75 82 666 500 17 12United Kingdom 3135 2865 1319 1387 42 48 1816 1478 107 86OECD ♦ 80324 79473 49398 49126 61 62 30926 30347 23 23♦ See Technical Annex for data sources, notes and comments.
State 1995-97 Change from 1985-87
HungaryNew Zealand
AustraliaIcelandTurkey
CanadaMexicoAustriaPoland
USAItaly
SwedenGreece
SpainFrance
Czech Rep.Germany
SwitzerlandFinland
PortugalNorwayIreland
UKDenmark
JapanBelgium
KoreaNetherlands
-100 -50 0 50 100
%
HungaryNew Zealand
AustraliaIcelandTurkey
CanadaMexicoAustriaPoland
USAItaly
SwedenGreece
SpainFrance
Czech Rep.Germany
SwitzerlandFinland
PortugalNorwayIreland
UKDenmark
JapanBelgium
KoreaNetherlands
-50 0 50 100 150 200 250 300
kg/ha of agricultural land
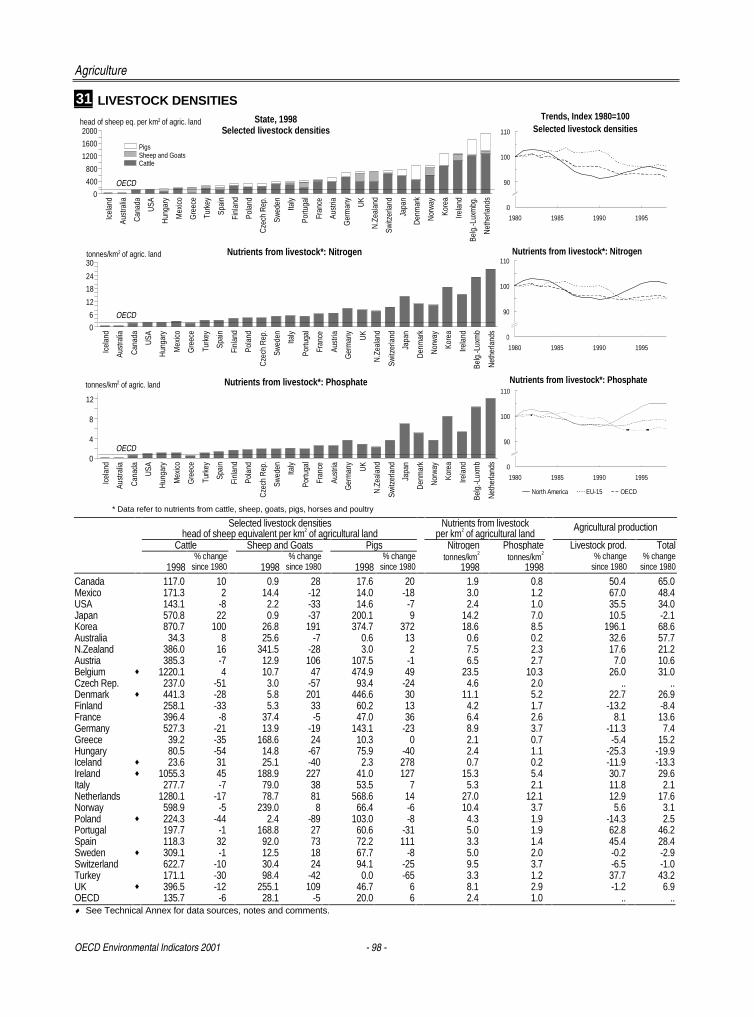
Agriculture
OECD Environmental Indicators 2001 - 98 -
31 LIVESTOCK DENSITIESTrends, Index 1980=100
Selected livestock densities
80
90
100
110
1980 1985 1990 1995
80
90
100
110
1980 1985 1990 1995
80
90
100
110
1980 1985 1990 1995
Nutrients from livestock*: Nitrogen
Nutrients from livestock*: Phosphate
North America EU-15 OECD
head of sheep eq. per km of agric. land
Icel
and
Aust
ralia
Can
ada
USA
Hun
gary
Mex
ico
Gre
ece
Turk
ey
Spai
n
Finl
and
Pola
nd
Cze
ch R
ep.
Swed
en
Italy
Portu
gal
Fran
ce
Aust
ria
Ger
man
y
UK
N.Z
eala
nd
Switz
erla
nd
Japa
n
Den
mar
k
Nor
way
Kore
a
Irela
nd
Belg
.-Lux
mbg
.
Net
herla
nds0
400
800
1200
1600
2000 State, 1998
Selected livestock densities
PigsSheep and GoatsCattle
OECD
tonnes/km of agric. land
Icel
and
Aust
ralia
Can
ada
USA
Hun
gary
Mex
ico
Gre
ece
Turk
ey
Spai
n
Finl
and
Pola
nd
Cze
ch R
ep.
Swed
en
Italy
Portu
gal
Fran
ce
Aust
ria
Ger
man
y
UK
N.Z
eala
nd
Switz
erla
nd
Japa
n
Den
mar
k
Nor
way
Kore
a
Irela
nd
Belg
.-Lux
mb
Net
herla
nds0
6
12
18
24
30 Nutrients from livestock*: Nitrogen
OECD
tonnes/km of agric. land
Icel
and
Aust
ralia
Can
ada
USA
Hun
gary
Mex
ico
Gre
ece
Turk
ey
Spai
n
Finl
and
Pola
nd
Cze
ch R
ep.
Swed
en
Italy
Portu
gal
Fran
ce
Aust
ria
Ger
man
y
UK
N.Z
eala
nd
Switz
erla
nd
Japa
n
Den
mar
k
Nor
way
Kore
a
Irela
nd
Belg
.-Lux
mb
Net
herla
nds0
4
8
12
Nutrients from livestock*: Phosphate
OECD
2
2
2
* Data refer to nutrients from cattle, sheep, goats, pigs, horses and poultry
Selected livestock densitieshead of sheep equivalent per km2 of agricultural land
Nutrients from livestockper km2 of agricultural land
Agricultural production
Cattle Sheep and Goats Pigs Nitrogen Phosphate Livestock prod. Total% change % change % change tonnes/km2 tonnes/km2 % change % change
1998 since 1980 1998 since 1980 1998 since 1980 1998 1998 since 1980 since 1980
Canada 117.0 10 0.9 28 17.6 20 1.9 0.8 50.4 65.0Mexico 171.3 2 14.4 -12 14.0 -18 3.0 1.2 67.0 48.4USA 143.1 -8 2.2 -33 14.6 -7 2.4 1.0 35.5 34.0Japan 570.8 22 0.9 -37 200.1 9 14.2 7.0 10.5 -2.1Korea 870.7 100 26.8 191 374.7 372 18.6 8.5 196.1 68.6Australia 34.3 8 25.6 -7 0.6 13 0.6 0.2 32.6 57.7N.Zealand 386.0 16 341.5 -28 3.0 2 7.5 2.3 17.6 21.2Austria 385.3 -7 12.9 106 107.5 -1 6.5 2.7 7.0 10.6Belgium ♦ 1220.1 4 10.7 47 474.9 49 23.5 10.3 26.0 31.0Czech Rep. 237.0 -51 3.0 -57 93.4 -24 4.6 2.0 .. ..Denmark ♦ 441.3 -28 5.8 201 446.6 30 11.1 5.2 22.7 26.9Finland 258.1 -33 5.3 33 60.2 13 4.2 1.7 -13.2 -8.4France 396.4 -8 37.4 -5 47.0 36 6.4 2.6 8.1 13.6Germany 527.3 -21 13.9 -19 143.1 -23 8.9 3.7 -11.3 7.4Greece 39.2 -35 168.6 24 10.3 0 2.1 0.7 -5.4 15.2Hungary 80.5 -54 14.8 -67 75.9 -40 2.4 1.1 -25.3 -19.9Iceland ♦ 23.6 31 25.1 -40 2.3 278 0.7 0.2 -11.9 -13.3Ireland ♦ 1055.3 45 188.9 227 41.0 127 15.3 5.4 30.7 29.6Italy 277.7 -7 79.0 38 53.5 7 5.3 2.1 11.8 2.1Netherlands 1280.1 -17 78.7 81 568.6 14 27.0 12.1 12.9 17.6Norway 598.9 -5 239.0 8 66.4 -6 10.4 3.7 5.6 3.1Poland ♦ 224.3 -44 2.4 -89 103.0 -8 4.3 1.9 -14.3 2.5Portugal 197.7 -1 168.8 27 60.6 -31 5.0 1.9 62.8 46.2Spain 118.3 32 92.0 73 72.2 111 3.3 1.4 45.4 28.4Sweden ♦ 309.1 -1 12.5 18 67.7 -8 5.0 2.0 -0.2 -2.9Switzerland 622.7 -10 30.4 24 94.1 -25 9.5 3.7 -6.5 -1.0Turkey 171.1 -30 98.4 -42 0.0 -65 3.3 1.2 37.7 43.2UK ♦ 396.5 -12 255.1 109 46.7 6 8.1 2.9 -1.2 6.9OECD 135.7 -6 28.1 -5 20.0 6 2.4 1.0 .. ..♦ See Technical Annex for data sources, notes and comments.
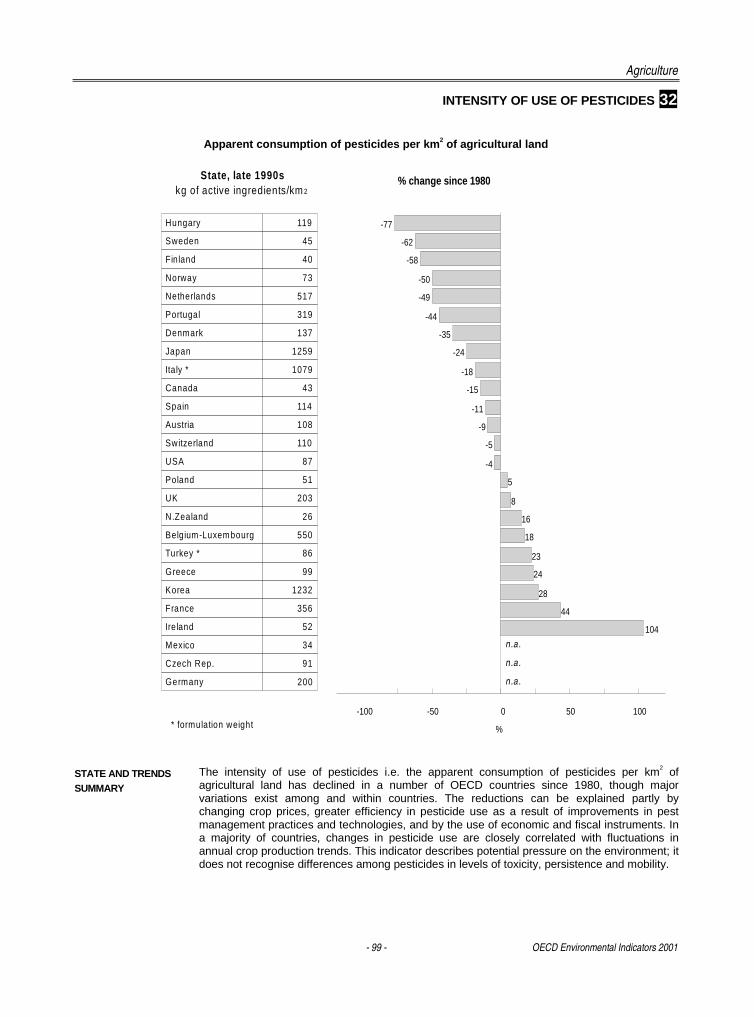
Agriculture
- 99 - OECD Environmental Indicators 2001
INTENSITY OF USE OF PESTICIDES 32
Apparent consumption of pesticides per km2 of agricultural land
-77
-62
-58
-50
-49
-44
-35
-24
-18
-15
-11
-9
-5
-4
5
8
16
18
23
24
28
44
104
HungarySwedenFinlandNorway
NetherlandsPortugal
DenmarkJapan
ItalyCanada
SpainAustria
SwitzerlandUSA
PolandUK
N.ZealandBelg.-Luxmbg
TurkeyGreece
KoreaFranceIrelandMexico
Czech Rep.Germany
-100 -50 0 50 100
%
% change since 1980
n.a.
Hungary 119
Sweden 45
Finland 40
Norway 73
Netherlands 517
Portugal 319
Denmark 137
Japan 1259
Italy * 1079
Canada 43
Spain 114
Austria 108
Switzerland 110
USA 87
Poland 51
UK 203
N.Zealand 26
Belgium-Luxembourg 550
Turkey * 86
Greece 99
Korea 1232
France 356
Ireland 52
Mexico 34
Czech Rep. 91
Germany 200
State, late 1990skg of active ingredients/km 2
* formulation weight
n.a.
n.a.
STATE AND TRENDSSUMMARY
The intensity of use of pesticides i.e. the apparent consumption of pesticides per km2 ofagricultural land has declined in a number of OECD countries since 1980, though majorvariations exist among and within countries. The reductions can be explained partly bychanging crop prices, greater efficiency in pesticide use as a result of improvements in pestmanagement practices and technologies, and by the use of economic and fiscal instruments. Ina majority of countries, changes in pesticide use are closely correlated with fluctuations inannual crop production trends. This indicator describes potential pressure on the environment; itdoes not recognise differences among pesticides in levels of toxicity, persistence and mobility.
- 101 -
����������
Efforts to reduce environmental pressures imply public and private expenditure, to: i) financepollution abatement and control at national level, and ii) provide financial and technicalsupport for environmental protection measures in developing countries.
Indicators presented here relate to:
♦ levels of pollution abatement and control (PAC) expenditure as a general indication of how much a country spends on controlling and reducing pressures from pollution. Thisexpenditure is disaggregated by medium (air, water, waste) and by the sector undertakingthe measures (public sector, businesses). Activities such as nature protection, naturalresource preservation and water supply are excluded, as is expenditure on workplaceprotection, energy saving or improvement of production processes for commercial ortechnical reasons, though these may have environmental benefits.
♦ levels of official development assistance (ODA), as part of ODA supports sustainable development and, in particular, environmental protection.
Expenditure
OECD Environmental Indicators 2001 - 102 -
EXPENDITURE: REFERENCES
� OECD (1999), OECD Environmental Data — Compendium 1999� OECD (1996), Pollution abatement and control expenditure in OECD countries� OECD (2001), Overview of environmental expenditure in NIS� OECD (2002), Pollution abatement and control expenditure in OECD countries, forthcoming
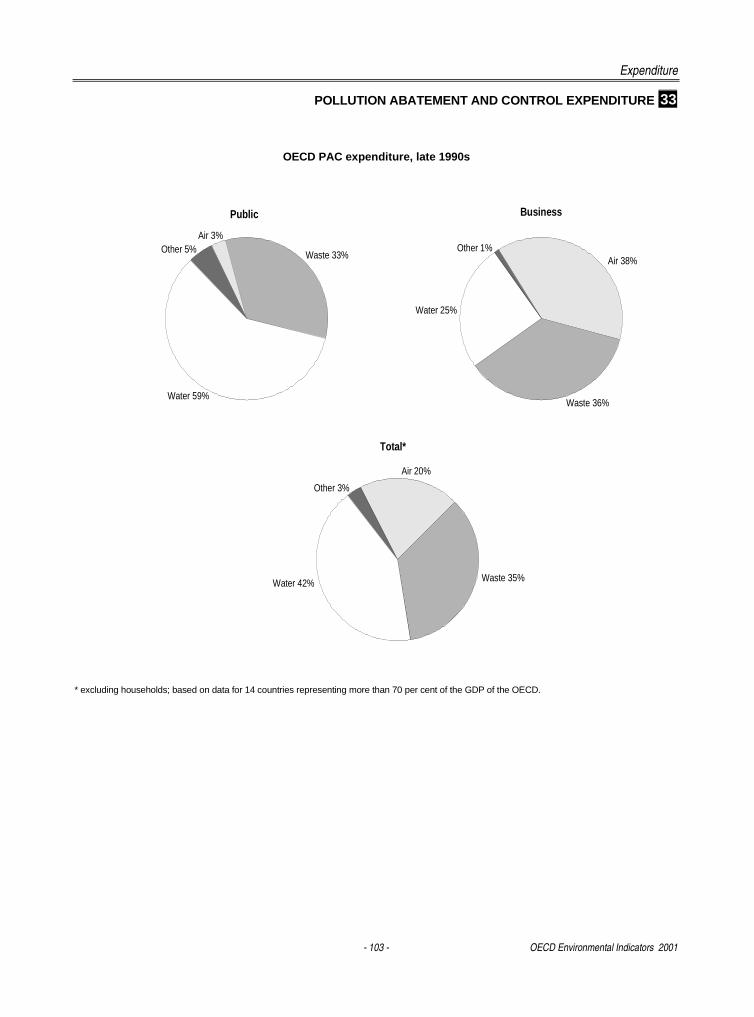
Expenditure
- 103 - OECD Environmental Indicators 2001
POLLUTION ABATEMENT AND CONTROL EXPENDITURE 33
OECD PAC expenditure, late 1990s
* excluding households; based on data for 14 countries representing more than 70 per cent of the GDP of the OECD.
Total*
Pie 1
Public Business
Air 3%
Water 59%
Waste 33%Other 5%
Pie 1
Air 38%
Water 25%
Waste 36%
Other 1%
Pie 1
Air 20%
Water 42% Waste 35%
Other 3%
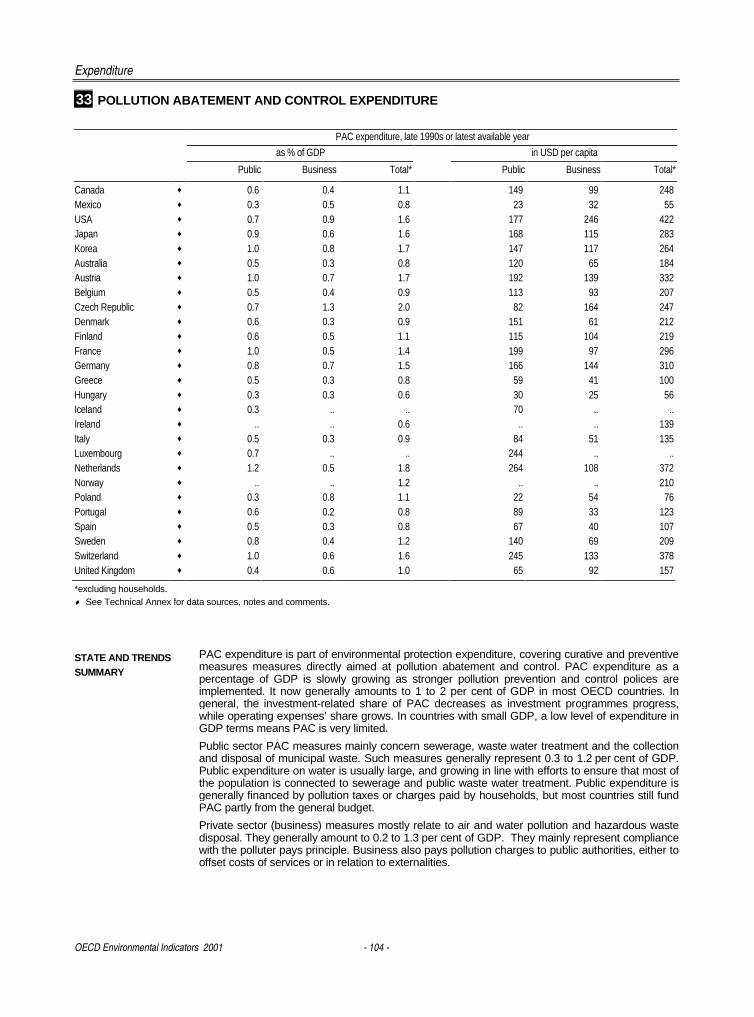
Expenditure
OECD Environmental Indicators 2001 - 104 -
33 POLLUTION ABATEMENT AND CONTROL EXPENDITURE
PAC expenditure, late 1990s or latest available year
as % of GDP in USD per capita
Public Business Total* Public Business Total*
Canada ♦ 0.6 0.4 1.1 149 99 248Mexico ♦ 0.3 0.5 0.8 23 32 55USA ♦ 0.7 0.9 1.6 177 246 422Japan ♦ 0.9 0.6 1.6 168 115 283Korea ♦ 1.0 0.8 1.7 147 117 264Australia ♦ 0.5 0.3 0.8 120 65 184Austria ♦ 1.0 0.7 1.7 192 139 332Belgium ♦ 0.5 0.4 0.9 113 93 207Czech Republic ♦ 0.7 1.3 2.0 82 164 247Denmark ♦ 0.6 0.3 0.9 151 61 212Finland ♦ 0.6 0.5 1.1 115 104 219France ♦ 1.0 0.5 1.4 199 97 296Germany ♦ 0.8 0.7 1.5 166 144 310Greece ♦ 0.5 0.3 0.8 59 41 100Hungary ♦ 0.3 0.3 0.6 30 25 56Iceland ♦ 0.3 .. .. 70 .. ..Ireland ♦ .. .. 0.6 .. .. 139Italy ♦ 0.5 0.3 0.9 84 51 135Luxembourg ♦ 0.7 .. .. 244 .. ..Netherlands ♦ 1.2 0.5 1.8 264 108 372Norway ♦ .. .. 1.2 .. .. 210Poland ♦ 0.3 0.8 1.1 22 54 76Portugal ♦ 0.6 0.2 0.8 89 33 123Spain ♦ 0.5 0.3 0.8 67 40 107Sweden ♦ 0.8 0.4 1.2 140 69 209Switzerland ♦ 1.0 0.6 1.6 245 133 378United Kingdom ♦ 0.4 0.6 1.0 65 92 157
*excluding households.♦ See Technical Annex for data sources, notes and comments.
STATE AND TRENDSSUMMARY
PAC expenditure is part of environmental protection expenditure, covering curative and preventivemeasures measures directly aimed at pollution abatement and control. PAC expenditure as apercentage of GDP is slowly growing as stronger pollution prevention and control polices areimplemented. It now generally amounts to 1 to 2 per cent of GDP in most OECD countries. Ingeneral, the investment-related share of PAC decreases as investment programmes progress,while operating expenses’ share grows. In countries with small GDP, a low level of expenditure inGDP terms means PAC is very limited.
Public sector PAC measures mainly concern sewerage, waste water treatment and the collectionand disposal of municipal waste. Such measures generally represent 0.3 to 1.2 per cent of GDP.Public expenditure on water is usually large, and growing in line with efforts to ensure that most ofthe population is connected to sewerage and public waste water treatment. Public expenditure isgenerally financed by pollution taxes or charges paid by households, but most countries still fundPAC partly from the general budget.
Private sector (business) measures mostly relate to air and water pollution and hazardous wastedisposal. They generally amount to 0.2 to 1.3 per cent of GDP. They mainly represent compliancewith the polluter pays principle. Business also pays pollution charges to public authorities, either tooffset costs of services or in relation to externalities.
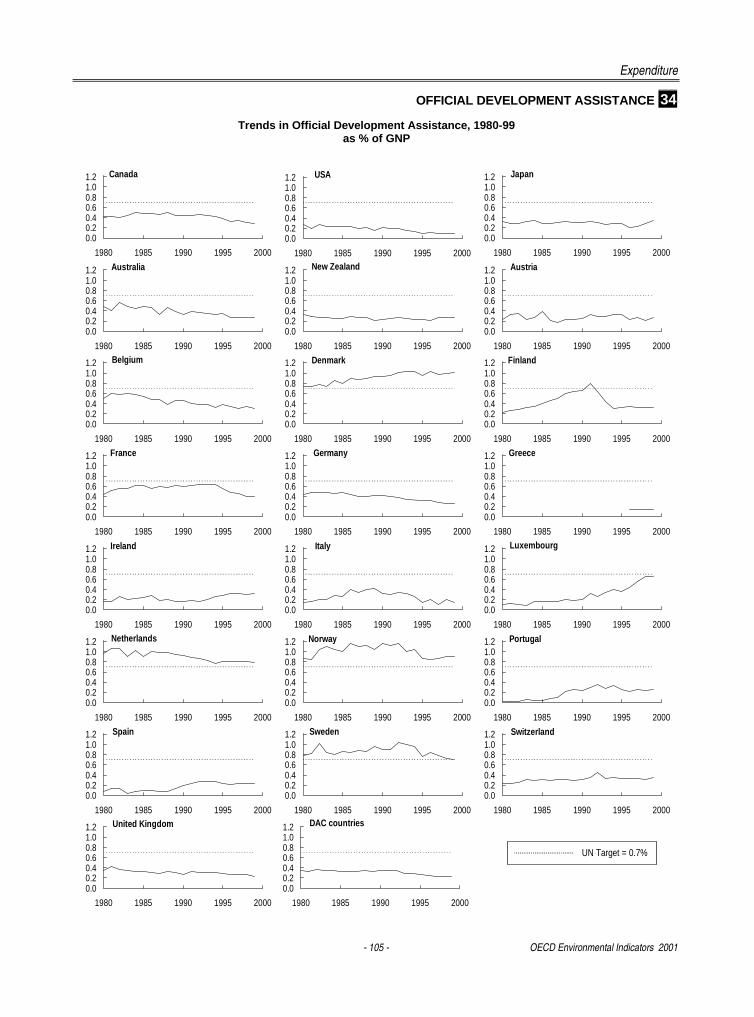
Expenditure
- 105 - OECD Environmental Indicators 2001
OFFICIAL DEVELOPMENT ASSISTANCE 34
Trends in Official Development Assistance, 1980-99as % of GNP
Australia
0.00.20.40.60.81.01.2
1980 1985 1990 1995 2000
New Zealand
0.00.20.40.60.81.01.2
1980 1985 1990 1995 2000
Austria
0.00.20.40.60.81.01.2
1980 1985 1990 1995 2000Belgium
0.00.20.40.60.81.01.2
1980 1985 1990 1995 2000
Denmark
0.00.20.40.60.81.01.2
1980 1985 1990 1995 2000
Finland
0.00.20.40.60.81.01.2
1980 1985 1990 1995 2000
Ireland
0.00.20.40.60.81.01.2
1980 1985 1990 1995 2000
Italy
0.00.20.40.60.81.01.2
1980 1985 1990 1995 2000
Luxembourg
0.00.20.40.60.81.01.2
1980 1985 1990 1995 2000
Netherlands
0.00.20.40.60.81.01.2
1980 1985 1990 1995 2000
Norway
0.00.20.40.60.81.01.2
1980 1985 1990 1995 2000
Portugal
0.00.20.40.60.81.01.2
1980 1985 1990 1995 2000
United Kingdom
0.00.20.40.60.81.01.2
1980 1985 1990 1995 2000
DAC countries
0.00.20.40.60.81.01.2
1980 1985 1990 1995 2000
USA
0.00.20.40.60.81.01.2
1980 1985 1990 1995 2000
Japan
0.00.20.40.60.81.01.2
1980 1985 1990 1995 2000
Canada
0.00.20.40.60.81.01.2
1980 1985 1990 1995 2000
France
0.00.20.40.60.81.01.2
1980 1985 1990 1995 2000
Greece
0.00.20.40.60.81.01.2
1980 1985 1990 1995 2000
Germany
0.00.20.40.60.81.01.2
1980 1985 1990 1995 2000
Spain
0.00.20.40.60.81.01.2
1980 1985 1990 1995 2000
Switzerland
0.00.20.40.60.81.01.2
1980 1985 1990 1995 2000
Sweden
0.00.20.40.60.81.01.2
1980 1985 1990 1995 2000
UN Target = 0.7%
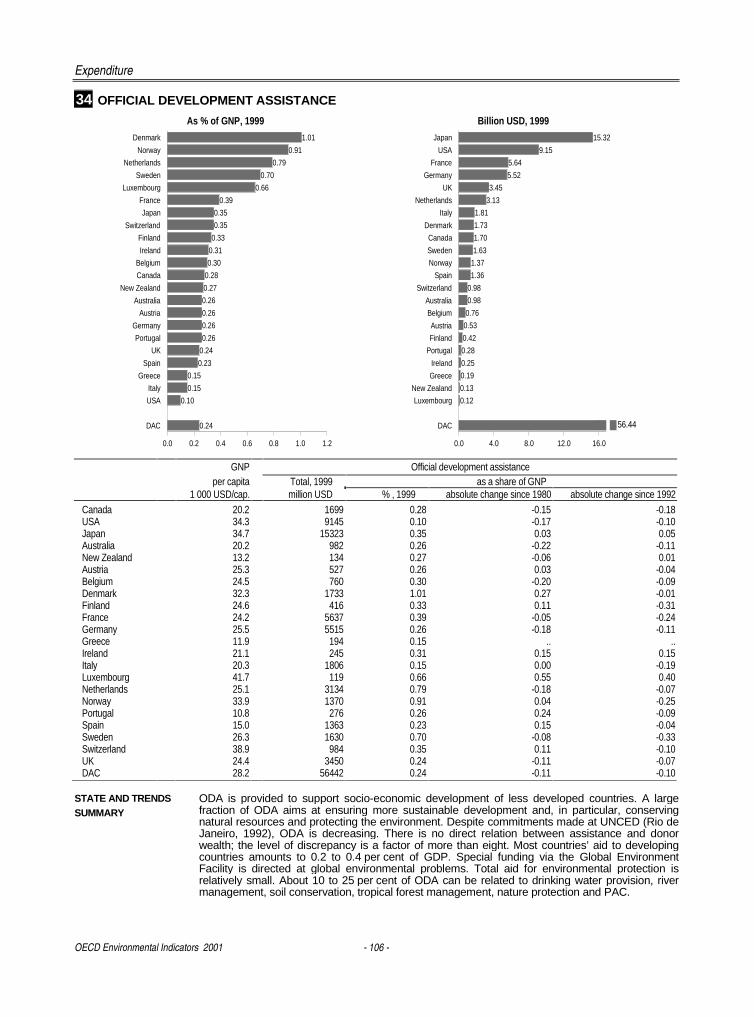
Expenditure
OECD Environmental Indicators 2001 - 106 -
34 OFFICIAL DEVELOPMENT ASSISTANCE
1.01
0.91
0.79
0.70
0.66
0.39
0.35
0.35
0.33
0.31
0.30
0.28
0.27
0.26
0.26
0.26
0.26
0.24
0.23
0.15
0.15
0.10
0.24
Denmark
Norway
Netherlands
Sweden
Luxembourg
France
Japan
Switzerland
Finland
Ireland
Belgium
Canada
New Zealand
Australia
Austria
Germany
Portugal
UK
Spain
Greece
Italy
USA
DAC
0.0 0.2 0.4 0.6 0.8 1.0 1.2
15.32
9.15
5.64
5.52
3.45
3.13
1.81
1.73
1.70
1.63
1.37
1.36
0.98
0.98
0.76
0.53
0.42
0.28
0.25
0.19
0.13
0.12
56.44
Japan
USA
France
Germany
UK
Netherlands
Italy
Denmark
Canada
Sweden
Norway
Spain
Switzerland
Australia
Belgium
Austria
Finland
Portugal
Ireland
Greece
New Zealand
Luxembourg
DAC
0.0 4.0 8.0 12.0 16.0
As % of GNP, 1999 Billion USD, 1999
56.44
GNP Official development assistanceper capita Total, 1999 as a share of GNP
1 000 USD/cap. million USD % , 1999 absolute change since 1980 absolute change since 1992Canada 20.2 1699 0.28 -0.15 -0.18USA 34.3 9145 0.10 -0.17 -0.10Japan 34.7 15323 0.35 0.03 0.05Australia 20.2 982 0.26 -0.22 -0.11New Zealand 13.2 134 0.27 -0.06 0.01Austria 25.3 527 0.26 0.03 -0.04Belgium 24.5 760 0.30 -0.20 -0.09Denmark 32.3 1733 1.01 0.27 -0.01Finland 24.6 416 0.33 0.11 -0.31France 24.2 5637 0.39 -0.05 -0.24Germany 25.5 5515 0.26 -0.18 -0.11Greece 11.9 194 0.15 .. ..Ireland 21.1 245 0.31 0.15 0.15Italy 20.3 1806 0.15 0.00 -0.19Luxembourg 41.7 119 0.66 0.55 0.40Netherlands 25.1 3134 0.79 -0.18 -0.07Norway 33.9 1370 0.91 0.04 -0.25Portugal 10.8 276 0.26 0.24 -0.09Spain 15.0 1363 0.23 0.15 -0.04Sweden 26.3 1630 0.70 -0.08 -0.33Switzerland 38.9 984 0.35 0.11 -0.10UK 24.4 3450 0.24 -0.11 -0.07DAC 28.2 56442 0.24 -0.11 -0.10
STATE AND TRENDSSUMMARY
ODA is provided to support socio-economic development of less developed countries. A largefraction of ODA aims at ensuring more sustainable development and, in particular, conservingnatural resources and protecting the environment. Despite commitments made at UNCED (Rio deJaneiro, 1992), ODA is decreasing. There is no direct relation between assistance and donorwealth; the level of discrepancy is a factor of more than eight. Most countries’ aid to developingcountries amounts to 0.2 to 0.4 per cent of GDP. Special funding via the Global EnvironmentFacility is directed at global environmental problems. Total aid for environmental protection isrelatively small. About 10 to 25 per cent of ODA can be related to drinking water provision, rivermanagement, soil conservation, tropical forest management, nature protection and PAC.
- 107 -
����������������� ������� ��
The present report is a new product of the OECD work programme on environmental indicators.It responds to the increasing interest by OECD Member countries in a reduced number ofenvironmental indicators selected from existing larger sets to draw public attention to keyenvironmental issues of concern and to inform about progress made. It includes a selection of10 key environmental indicators extracted from the OECD Core Set of environmental indicatorsand benefits from the experience gained in using environmental indicators in the OECD’s policyand evaluation work.
The key environmental indicators were published at the occasion of the OECD meeting ofEnvironment Ministers (Paris, 16 May 2001) and were endorsed by Ministers as a tool for use inOECD work and for public information and communication by OECD.
The key indicators are intended to give a broad overview of environmental issues in OECDcountries. They will be updated at regular intervals as a free supplement to the OECD Core Setof environmental indicators and to the OECD Compendium of environmental data. Togetherwith other indicators of the OECD Core Set, they will also contribute to follow-up work on theOECD environmental strategy.
INTRODUCTION ....................................................................................................................................108
KEY INDICATORS
1. CLIMATE CHANGE – CO2 emission intensities ........................................................................... 110
2. OZONE LAYER - ozone depleting substances ............................................................................. 112
3. AIR QUALITY – SOx and NOx emission intensities....................................................................... 114
4. WASTE GENERATION – municipal waste generation intensities ................................................ 116
5. FRESHWATER QUALITY – waste water treatment connection rates .......................................... 118
6. FRESHWATER RESOURCES – intensity of use of water resources........................................... 120
7. FOREST RESOURCES – intensity of use of forest resources ..................................................... 122
8. FISH RESOURCES – intensity of use of fish resources ............................................................... 124
9. ENERGY RESOURCES – intensity of energy use ....................................................................... 126
10. BIODIVERSITY – threatened species ........................................................................................... 128
Key Indicators - 108 - OECD Environmental Indicators 2001
BACKGROUND The OECD, with the support of its Member countries, has long been a pioneer in the field ofenvironmental indicators with the development and publication of the first international setsof environmental indicators and their regular use in country environmental performancereviews.
During the 1990s, environmental indicators gained significant importance and are nowwidely used in many OECD countries. They are used in reporting, planning, clarifying policyobjectives and priorities, budgeting, and assessing performance.
WHY KEYINDICATORS ?
While the indicator sets used to date have proven very useful in policy and reporting work,there is now increasing interest in a reduced number of indicators selected from these largersets to inform civil society and to support wider communication with the public.
To respond to this demand, the OECD has identified a shortlist of key environmentalindicators building on previous work and on consensus already achieved: they derive fromthe OECD Core Set of environmental indicators (publications 1991, 94, 98, 2001), and fromthe results of the OECD Rome Conference (December 1999) that discussed a first shortlistof indicators.
SELECTION CRITERIA The selection of these indicators takes into account:
♦ Their policy relevance with respect to major challenges for the next decade; in particularthey relate to both 1) pollution issues and 2) natural resources and assets; indicatorsdescribing sectoral trends are not considered.
♦ Their analytical soundness.
♦ Their measurability: necessary data sets are already available for a majority of OECDcountries; when improvements in data availability and developments in concepts anddefinitions are foreseen, medium term indicators are proposed.
INTERPRETATION INCONTEXT
The indicators selected correspond to varying degrees of policy relevance and policy priorityfor different countries. Like other indicators they have to be interpreted in context and becomplemented with country specific information to acquire their full meaning.
A DYNAMICPROCESS
The list of indicators presented here is neither final, nor exhaustive; it has to be seentogether with other indicators from the OECD Core Set, and will evolve as knowledge anddata availability improve.
Ultimately, the set is expected to also include key indicators for issues such as toxiccontamination, land and soil resources, and urban environmental quality.
LINK TO OTHEROECD ANDINTERNATIONALWORK
The set of key environmental indicators is closely linked to other environmental indicatorsets developed and used by the OECD, including indicators developed as part of theOECD-wide programme on sustainable development and sectoral sets of environmentalindicators (e.g. the OECD set of agri-environmental indicators).
It further benefits from continued co-ordination with the work carried out by otherinternational organisations (e.g. UNCSD, European Union).
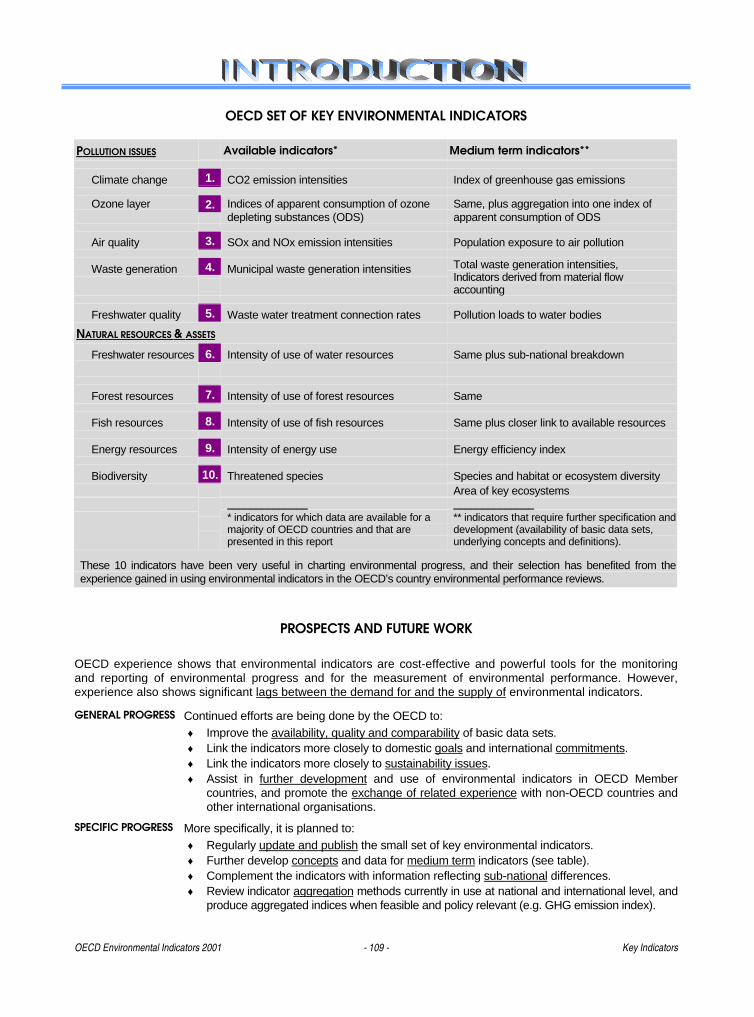
OECD Environmental Indicators 2001 - 109 - Key Indicators
OECD SET OF KEY ENVIRONMENTAL INDICATORS
POLLUTION ISSUES Available indicators* Medium term indicators**
Climate change 1. CO2 emission intensities Index of greenhouse gas emissions
2.Ozone layer Indices of apparent consumption of ozonedepleting substances (ODS)
Same, plus aggregation into one index ofapparent consumption of ODS
Air quality 3. SOx and NOx emission intensities Population exposure to air pollution
4.Waste generation Municipal waste generation intensities Total waste generation intensities,Indicators derived from material flowaccounting
Freshwater quality 5. Waste water treatment connection rates Pollution loads to water bodies
NATURAL RESOURCES & ASSETS
6.Freshwater resources Intensity of use of water resources Same plus sub-national breakdown
Forest resources 7. Intensity of use of forest resources Same
Fish resources 8. Intensity of use of fish resources Same plus closer link to available resources
Energy resources 9. Intensity of energy use Energy efficiency index
Biodiversity 10. Threatened species Species and habitat or ecosystem diversityArea of key ecosystems
______________* indicators for which data are available for amajority of OECD countries and that arepresented in this report
______________** indicators that require further specification anddevelopment (availability of basic data sets,underlying concepts and definitions).
These 10 indicators have been very useful in charting environmental progress, and their selection has benefited from theexperience gained in using environmental indicators in the OECD’s country environmental performance reviews.
PROSPECTS AND FUTURE WORK
OECD experience shows that environmental indicators are cost-effective and powerful tools for the monitoringand reporting of environmental progress and for the measurement of environmental performance. However,experience also shows significant lags between the demand for and the supply of environmental indicators.
GENERAL PROGRESS Continued efforts are being done by the OECD to:♦ Improve the availability, quality and comparability of basic data sets.♦ Link the indicators more closely to domestic goals and international commitments.♦ Link the indicators more closely to sustainability issues.♦ Assist in further development and use of environmental indicators in OECD Member
countries, and promote the exchange of related experience with non-OECD countries andother international organisations.
SPECIFIC PROGRESS More specifically, it is planned to:♦ Regularly update and publish the small set of key environmental indicators.♦ Further develop concepts and data for medium term indicators (see table).♦ Complement the indicators with information reflecting sub-national differences.♦ Review indicator aggregation methods currently in use at national and international level, and
produce aggregated indices when feasible and policy relevant (e.g. GHG emission index).
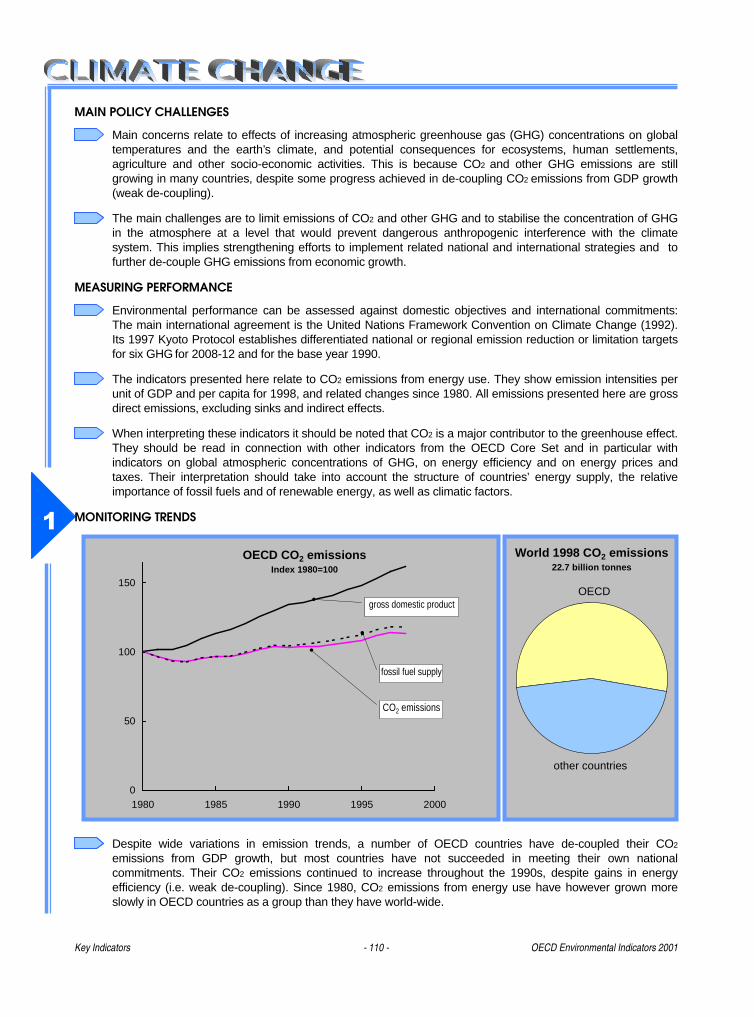
Key Indicators - 110 - OECD Environmental Indicators 2001
�
MAIN POLICY CHALLENGES
Main concerns relate to effects of increasing atmospheric greenhouse gas (GHG) concentrations on globaltemperatures and the earth’s climate, and potential consequences for ecosystems, human settlements,agriculture and other socio-economic activities. This is because CO2 and other GHG emissions are stillgrowing in many countries, despite some progress achieved in de-coupling CO2 emissions from GDP growth(weak de-coupling).
The main challenges are to limit emissions of CO2 and other GHG and to stabilise the concentration of GHGin the atmosphere at a level that would prevent dangerous anthropogenic interference with the climatesystem. This implies strengthening efforts to implement related national and international strategies and tofurther de-couple GHG emissions from economic growth.
MEASURING PERFORMANCE
Environmental performance can be assessed against domestic objectives and international commitments:The main international agreement is the United Nations Framework Convention on Climate Change (1992).Its 1997 Kyoto Protocol establishes differentiated national or regional emission reduction or limitation targetsfor six GHG for 2008-12 and for the base year 1990.
The indicators presented here relate to CO2 emissions from energy use. They show emission intensities perunit of GDP and per capita for 1998, and related changes since 1980. All emissions presented here are grossdirect emissions, excluding sinks and indirect effects.
When interpreting these indicators it should be noted that CO2 is a major contributor to the greenhouse effect.They should be read in connection with other indicators from the OECD Core Set and in particular withindicators on global atmospheric concentrations of GHG, on energy efficiency and on energy prices andtaxes. Their interpretation should take into account the structure of countries’ energy supply, the relativeimportance of fossil fuels and of renewable energy, as well as climatic factors.
MONITORING TRENDS
Despite wide variations in emission trends, a number of OECD countries have de-coupled their CO2
emissions from GDP growth, but most countries have not succeeded in meeting their own nationalcommitments. Their CO2 emissions continued to increase throughout the 1990s, despite gains in energyefficiency (i.e. weak de-coupling). Since 1980, CO2 emissions from energy use have however grown moreslowly in OECD countries as a group than they have world-wide.
Add %
OECD
other countries
World 1998 CO2 emissions22.7 billion tonnes
0
50
100
150
1980 1985 1990 1995 2000
fossil fuel supply
CO2 emissions
gross domestic product
OECD CO2 emissionsIndex 1980=100
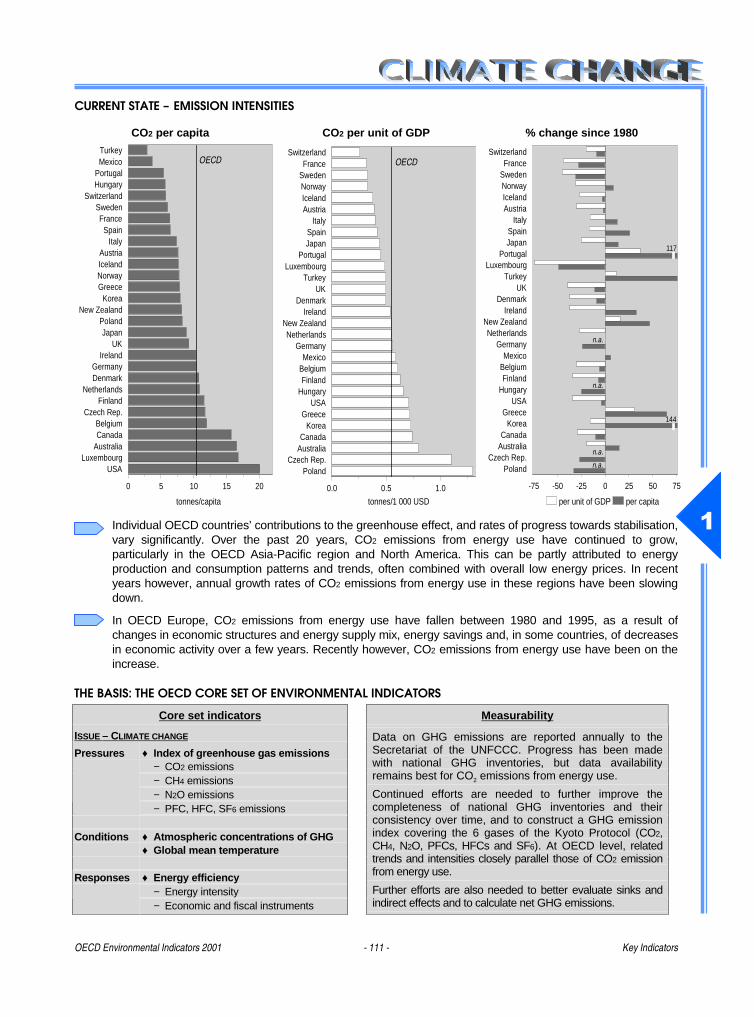
OECD Environmental Indicators 2001 - 111 - Key Indicators
�
CURRENT STATE – EMISSION INTENSITIES
CO2 per capita CO2 per unit of GDP % change since 1980
tonnes/capita tonnes/1 000 USD per unit of GDP per capita
Individual OECD countries’ contributions to the greenhouse effect, and rates of progress towards stabilisation,vary significantly. Over the past 20 years, CO2 emissions from energy use have continued to grow,particularly in the OECD Asia-Pacific region and North America. This can be partly attributed to energyproduction and consumption patterns and trends, often combined with overall low energy prices. In recentyears however, annual growth rates of CO2 emissions from energy use in these regions have been slowingdown.
In OECD Europe, CO2 emissions from energy use have fallen between 1980 and 1995, as a result ofchanges in economic structures and energy supply mix, energy savings and, in some countries, of decreasesin economic activity over a few years. Recently however, CO2 emissions from energy use have been on theincrease.
THE BASIS: THE OECD CORE SET OF ENVIRONMENTAL INDICATORS
Core set indicators Measurability
ISSUE – C LIMATE CHANGE
♦ Index of greenhouse gas emissions− CO2 emissions− CH4 emissions− N2O emissions
Pressures
− PFC, HFC, SF6 emissions
Conditions ♦ Atmospheric concentrations of GHG♦ Global mean temperature
♦ Energy efficiency− Energy intensity
Responses
− Economic and fiscal instruments
Data on GHG emissions are reported annually to theSecretariat of the UNFCCC. Progress has been madewith national GHG inventories, but data availabilityremains best for CO2 emissions from energy use.
Continued efforts are needed to further improve thecompleteness of national GHG inventories and theirconsistency over time, and to construct a GHG emissionindex covering the 6 gases of the Kyoto Protocol (CO2,CH4, N2O, PFCs, HFCs and SF6). At OECD level, relatedtrends and intensities closely parallel those of CO2 emissionfrom energy use.
Further efforts are also needed to better evaluate sinks andindirect effects and to calculate net GHG emissions.
TurkeyMexico
PortugalHungary
SwitzerlandSwedenFrance
SpainItaly
AustriaIcelandNorwayGreece
KoreaNew Zealand
PolandJapan
UKIreland
GermanyDenmark
NetherlandsFinland
Czech Rep.BelgiumCanada
AustraliaLuxembourg
USA
0 5 10 15 20
OECDSwitzerland
FranceSwedenNorwayIcelandAustria
ItalySpainJapan
PortugalLuxembourg
TurkeyUK
DenmarkIreland
New ZealandNetherlands
GermanyMexico
BelgiumFinland
HungaryUSA
GreeceKorea
CanadaAustralia
Czech Rep.Poland
-75 -50 -25 0 25 50 75
n.a.
n.a.
n.a.
144
117
n.a.
SwitzerlandFrance
SwedenNorwayIcelandAustria
ItalySpainJapan
PortugalLuxembourg
TurkeyUK
DenmarkIreland
New ZealandNetherlands
GermanyMexico
BelgiumFinland
HungaryUSA
GreeceKorea
CanadaAustralia
Czech Rep.Poland
0.0 0.5 1.0
OECD
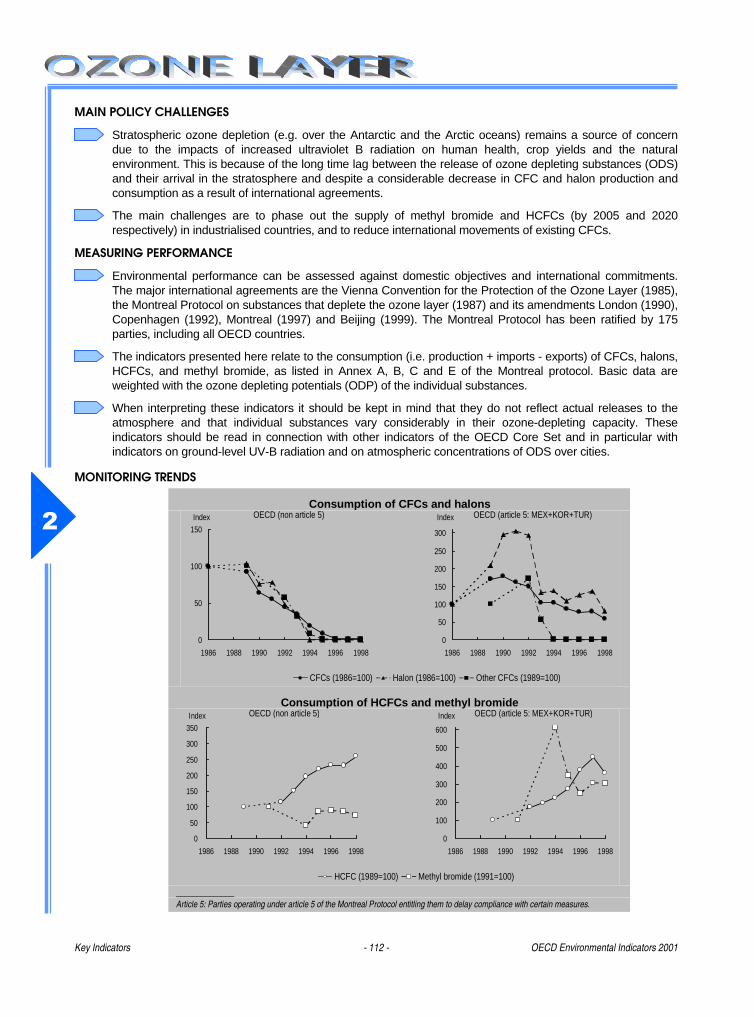
Key Indicators - 112 - OECD Environmental Indicators 2001
�
MAIN POLICY CHALLENGES
Stratospheric ozone depletion (e.g. over the Antarctic and the Arctic oceans) remains a source of concerndue to the impacts of increased ultraviolet B radiation on human health, crop yields and the naturalenvironment. This is because of the long time lag between the release of ozone depleting substances (ODS)and their arrival in the stratosphere and despite a considerable decrease in CFC and halon production andconsumption as a result of international agreements.
The main challenges are to phase out the supply of methyl bromide and HCFCs (by 2005 and 2020respectively) in industrialised countries, and to reduce international movements of existing CFCs.
MEASURING PERFORMANCE
Environmental performance can be assessed against domestic objectives and international commitments.The major international agreements are the Vienna Convention for the Protection of the Ozone Layer (1985),the Montreal Protocol on substances that deplete the ozone layer (1987) and its amendments London (1990),Copenhagen (1992), Montreal (1997) and Beijing (1999). The Montreal Protocol has been ratified by 175parties, including all OECD countries.
The indicators presented here relate to the consumption (i.e. production + imports - exports) of CFCs, halons,HCFCs, and methyl bromide, as listed in Annex A, B, C and E of the Montreal protocol. Basic data areweighted with the ozone depleting potentials (ODP) of the individual substances.
When interpreting these indicators it should be kept in mind that they do not reflect actual releases to theatmosphere and that individual substances vary considerably in their ozone-depleting capacity. Theseindicators should be read in connection with other indicators of the OECD Core Set and in particular withindicators on ground-level UV-B radiation and on atmospheric concentrations of ODS over cities.
MONITORING TRENDS
Consumption of CFCs and halons
CFCs (1986=100) Halon (1986=100) Other CFCs (1989=100)
OECD (non article 5)
0
50
100
150
1986 1988 1990 1992 1994 1996 1998
Index OECD (article 5: MEX+KOR+TUR)
0
50
100
150
200
250
300
1986 1988 1990 1992 1994 1996 1998
Index
Consumption of HCFCs and methyl bromide
HCFC (1989=100) Methyl bromide (1991=100)
OECD (non article 5)
0
50
100
150
200
250
300
350
1986 1988 1990 1992 1994 1996 1998
Index OECD (article 5: MEX+KOR+TUR)
0
100
200
300
400
500
600
1986 1988 1990 1992 1994 1996 1998
Index
______________Article 5: Parties operating under article 5 of the Montreal Protocol entitling them to delay compliance with certain measures.
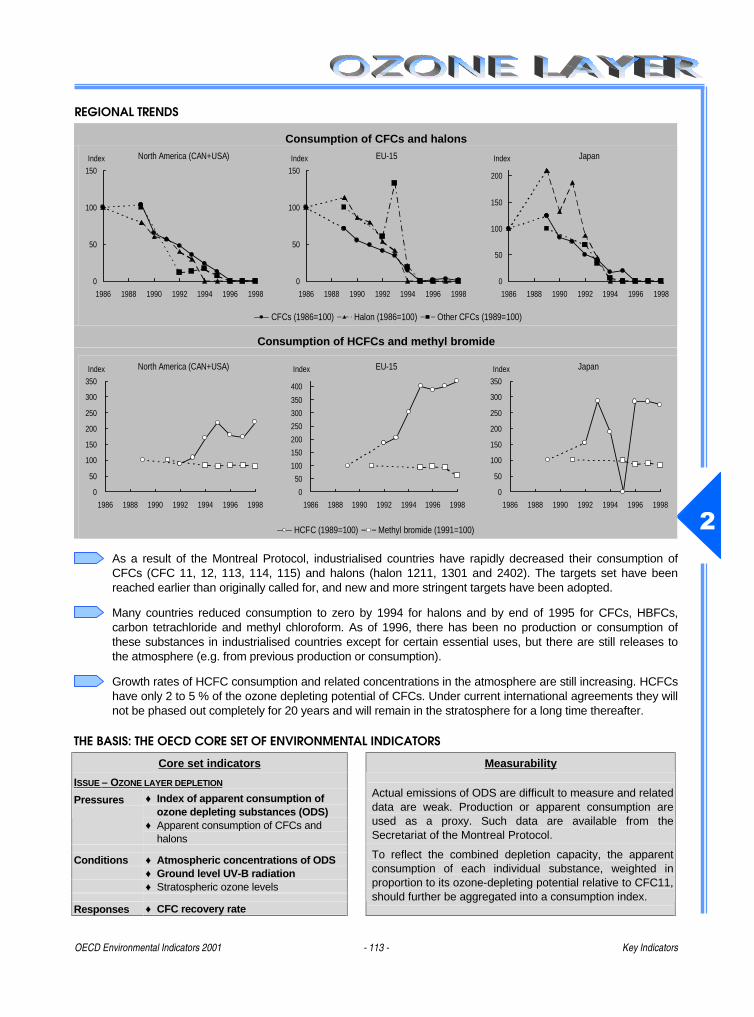
OECD Environmental Indicators 2001 - 113 - Key Indicators
�
REGIONAL TRENDS
Consumption of CFCs and halons
CFCs (1986=100) Halon (1986=100) Other CFCs (1989=100)
North America (CAN+USA)
0
50
100
150
1986 1988 1990 1992 1994 1996 1998
Index EU-15
0
50
100
150
1986 1988 1990 1992 1994 1996 1998
Index Japan
0
50
100
150
200
1986 1988 1990 1992 1994 1996 1998
Index
Consumption of HCFCs and methyl bromide
HCFC (1989=100) Methyl bromide (1991=100)
North America (CAN+USA)
0
50
100
150
200
250
300
350
1986 1988 1990 1992 1994 1996 1998
Index EU-15
0
50
100
150
200
250
300
350
400
1986 1988 1990 1992 1994 1996 1998
Index Japan
0
50
100
150
200
250
300
350
1986 1988 1990 1992 1994 1996 1998
Index
As a result of the Montreal Protocol, industrialised countries have rapidly decreased their consumption ofCFCs (CFC 11, 12, 113, 114, 115) and halons (halon 1211, 1301 and 2402). The targets set have beenreached earlier than originally called for, and new and more stringent targets have been adopted.
Many countries reduced consumption to zero by 1994 for halons and by end of 1995 for CFCs, HBFCs,carbon tetrachloride and methyl chloroform. As of 1996, there has been no production or consumption ofthese substances in industrialised countries except for certain essential uses, but there are still releases tothe atmosphere (e.g. from previous production or consumption).
Growth rates of HCFC consumption and related concentrations in the atmosphere are still increasing. HCFCshave only 2 to 5 % of the ozone depleting potential of CFCs. Under current international agreements they willnot be phased out completely for 20 years and will remain in the stratosphere for a long time thereafter.
THE BASIS: THE OECD CORE SET OF ENVIRONMENTAL INDICATORS
Core set indicators Measurability
ISSUE – O ZONE LAYER DEPLETION
♦ Index of apparent consumption ofozone depleting substances (ODS)
Pressures
♦ Apparent consumption of CFCs andhalons
Conditions ♦ Atmospheric concentrations of ODS♦ Ground level UV-B radiation♦ Stratospheric ozone levels
Responses ♦ CFC recovery rate
Actual emissions of ODS are difficult to measure and relateddata are weak. Production or apparent consumption areused as a proxy. Such data are available from theSecretariat of the Montreal Protocol.
To reflect the combined depletion capacity, the apparentconsumption of each individual substance, weighted inproportion to its ozone-depleting potential relative to CFC11,should further be aggregated into a consumption index.
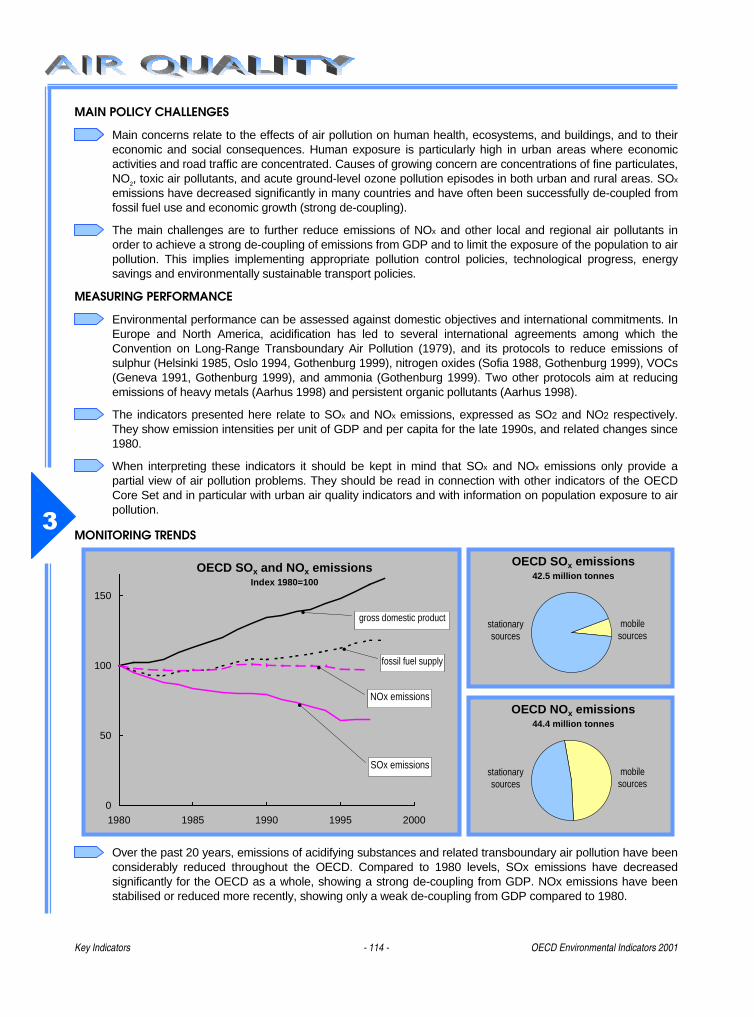
Key Indicators - 114 - OECD Environmental Indicators 2001
�
MAIN POLICY CHALLENGES
Main concerns relate to the effects of air pollution on human health, ecosystems, and buildings, and to theireconomic and social consequences. Human exposure is particularly high in urban areas where economicactivities and road traffic are concentrated. Causes of growing concern are concentrations of fine particulates,NO2, toxic air pollutants, and acute ground-level ozone pollution episodes in both urban and rural areas. SOx
emissions have decreased significantly in many countries and have often been successfully de-coupled fromfossil fuel use and economic growth (strong de-coupling).
The main challenges are to further reduce emissions of NOx and other local and regional air pollutants inorder to achieve a strong de-coupling of emissions from GDP and to limit the exposure of the population to airpollution. This implies implementing appropriate pollution control policies, technological progress, energysavings and environmentally sustainable transport policies.
MEASURING PERFORMANCE
Environmental performance can be assessed against domestic objectives and international commitments. InEurope and North America, acidification has led to several international agreements among which theConvention on Long-Range Transboundary Air Pollution (1979), and its protocols to reduce emissions ofsulphur (Helsinki 1985, Oslo 1994, Gothenburg 1999), nitrogen oxides (Sofia 1988, Gothenburg 1999), VOCs(Geneva 1991, Gothenburg 1999), and ammonia (Gothenburg 1999). Two other protocols aim at reducingemissions of heavy metals (Aarhus 1998) and persistent organic pollutants (Aarhus 1998).
The indicators presented here relate to SOx and NOx emissions, expressed as SO2 and NO2 respectively.They show emission intensities per unit of GDP and per capita for the late 1990s, and related changes since1980.
When interpreting these indicators it should be kept in mind that SOx and NOx emissions only provide apartial view of air pollution problems. They should be read in connection with other indicators of the OECDCore Set and in particular with urban air quality indicators and with information on population exposure to airpollution.
MONITORING TRENDS
Over the past 20 years, emissions of acidifying substances and related transboundary air pollution have beenconsiderably reduced throughout the OECD. Compared to 1980 levels, SOx emissions have decreasedsignificantly for the OECD as a whole, showing a strong de-coupling from GDP. NOx emissions have beenstabilised or reduced more recently, showing only a weak de-coupling from GDP compared to 1980.
0
50
100
150
1980 1985 1990 1995 2000
fossil fuel supply
SOx emissions
gross domestic product
OECD SOx and NOx emissionsIndex 1980=100
NOx emissions
OECD SOx emissions42.5 million tonnes
stationarysources
mobilesources
OECD NOx emissions44.4 million tonnes
stationarysources
mobilesources
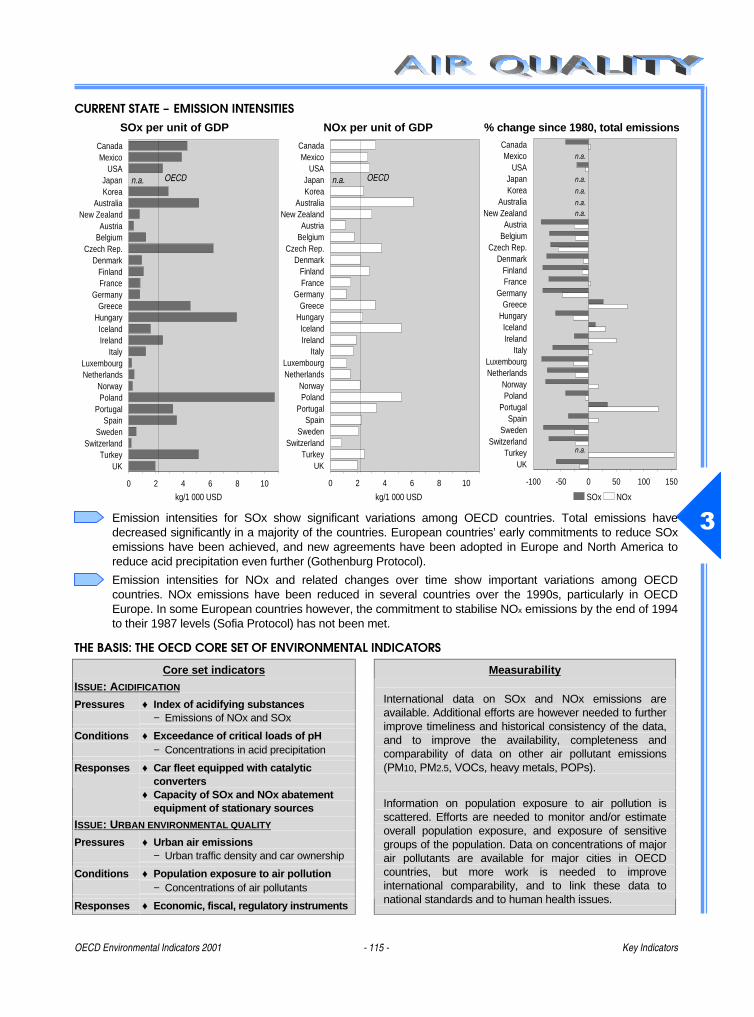
OECD Environmental Indicators 2001 - 115 - Key Indicators
�
CURRENT STATE – EMISSION INTENSITIESSOx per unit of GDP NOx per unit of GDP % change since 1980, total emissions
kg/1 000 USD kg/1 000 USD SOx NOx
Emission intensities for SOx show significant variations among OECD countries. Total emissions havedecreased significantly in a majority of the countries. European countries’ early commitments to reduce SOxemissions have been achieved, and new agreements have been adopted in Europe and North America toreduce acid precipitation even further (Gothenburg Protocol).
Emission intensities for NOx and related changes over time show important variations among OECDcountries. NOx emissions have been reduced in several countries over the 1990s, particularly in OECDEurope. In some European countries however, the commitment to stabilise NOx emissions by the end of 1994to their 1987 levels (Sofia Protocol) has not been met.
THE BASIS: THE OECD CORE SET OF ENVIRONMENTAL INDICATORS
Core set indicators MeasurabilityISSUE: A CIDIFICATION
♦ Index of acidifying substancesPressures− Emissions of NOx and SOx
♦ Exceedance of critical loads of pHConditions− Concentrations in acid precipitation
♦ Car fleet equipped with catalyticconverters
Responses
♦ Capacity of SOx and NOx abatementequipment of stationary sources
ISSUE: U RBAN ENVIRONMENTAL QUALITY
♦ Urban air emissionsPressures− Urban traffic density and car ownership
♦ Population exposure to air pollutionConditions− Concentrations of air pollutants
Responses ♦ Economic, fiscal, regulatory instruments
International data on SOx and NOx emissions areavailable. Additional efforts are however needed to furtherimprove timeliness and historical consistency of the data,and to improve the availability, completeness andcomparability of data on other air pollutant emissions(PM10, PM2.5, VOCs, heavy metals, POPs).
Information on population exposure to air pollution isscattered. Efforts are needed to monitor and/or estimateoverall population exposure, and exposure of sensitivegroups of the population. Data on concentrations of majorair pollutants are available for major cities in OECDcountries, but more work is needed to improveinternational comparability, and to link these data tonational standards and to human health issues.
CanadaMexico
USAJapanKorea
AustraliaNew Zealand
AustriaBelgium
Czech Rep.Denmark
FinlandFrance
GermanyGreece
HungaryIcelandIreland
ItalyLuxembourgNetherlands
NorwayPoland
PortugalSpain
SwedenSwitzerland
TurkeyUK
0 2 4 6 8 10
n.a. OECD
CanadaMexico
USAJapanKorea
AustraliaNew Zealand
AustriaBelgium
Czech Rep.Denmark
FinlandFrance
GermanyGreece
HungaryIcelandIreland
ItalyLuxembourgNetherlands
NorwayPoland
PortugalSpain
SwedenSwitzerland
TurkeyUK
0 2 4 6 8 10
OECDn.a.
CanadaMexico
USAJapanKorea
AustraliaNew Zealand
AustriaBelgium
Czech Rep.Denmark
FinlandFrance
GermanyGreece
HungaryIcelandIreland
ItalyLuxembourgNetherlands
NorwayPoland
PortugalSpain
SwedenSwitzerland
TurkeyUK
-100 -50 0 50 100 150
n.a.
n.a.
n.a.
n.a.n.a.
n.a.
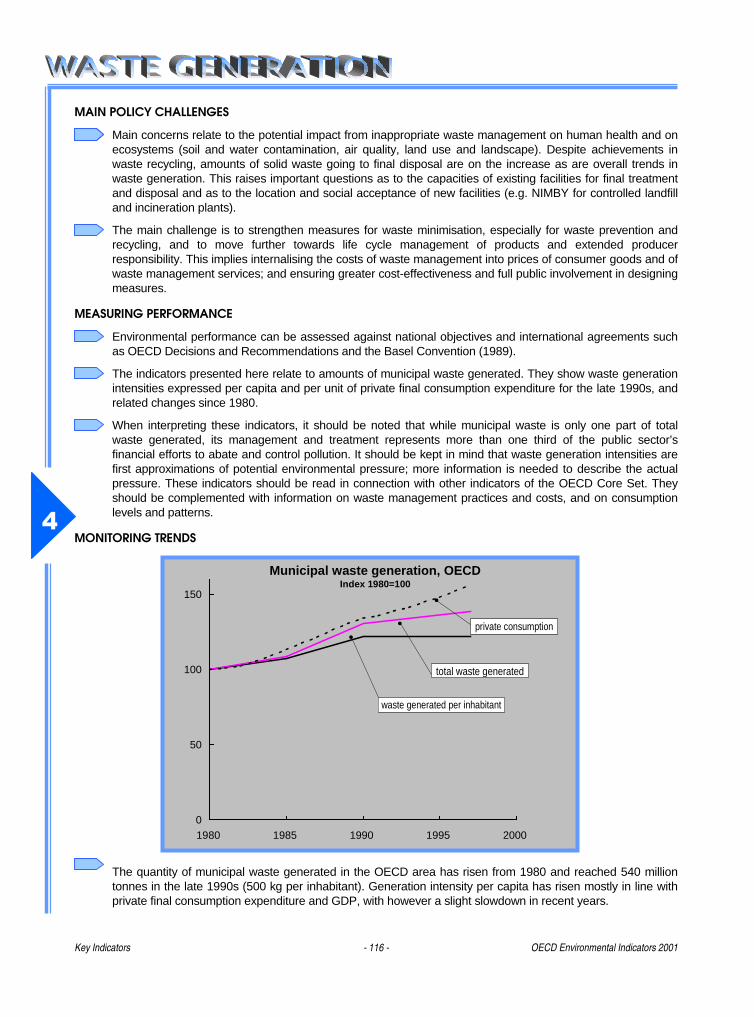
Key Indicators - 116 - OECD Environmental Indicators 2001
�
MAIN POLICY CHALLENGES
Main concerns relate to the potential impact from inappropriate waste management on human health and onecosystems (soil and water contamination, air quality, land use and landscape). Despite achievements inwaste recycling, amounts of solid waste going to final disposal are on the increase as are overall trends inwaste generation. This raises important questions as to the capacities of existing facilities for final treatmentand disposal and as to the location and social acceptance of new facilities (e.g. NIMBY for controlled landfilland incineration plants).
The main challenge is to strengthen measures for waste minimisation, especially for waste prevention andrecycling, and to move further towards life cycle management of products and extended producerresponsibility. This implies internalising the costs of waste management into prices of consumer goods and ofwaste management services; and ensuring greater cost-effectiveness and full public involvement in designingmeasures.
MEASURING PERFORMANCE
Environmental performance can be assessed against national objectives and international agreements suchas OECD Decisions and Recommendations and the Basel Convention (1989).
The indicators presented here relate to amounts of municipal waste generated. They show waste generationintensities expressed per capita and per unit of private final consumption expenditure for the late 1990s, andrelated changes since 1980.
When interpreting these indicators, it should be noted that while municipal waste is only one part of totalwaste generated, its management and treatment represents more than one third of the public sector’sfinancial efforts to abate and control pollution. It should be kept in mind that waste generation intensities arefirst approximations of potential environmental pressure; more information is needed to describe the actualpressure. These indicators should be read in connection with other indicators of the OECD Core Set. Theyshould be complemented with information on waste management practices and costs, and on consumptionlevels and patterns.
MONITORING TRENDS
The quantity of municipal waste generated in the OECD area has risen from 1980 and reached 540 milliontonnes in the late 1990s (500 kg per inhabitant). Generation intensity per capita has risen mostly in line withprivate final consumption expenditure and GDP, with however a slight slowdown in recent years.
0
50
100
150
1980 1985 1990 1995 2000
Municipal waste generation, OECDIndex 1980=100
private consumption
total waste generated
waste generated per inhabitant
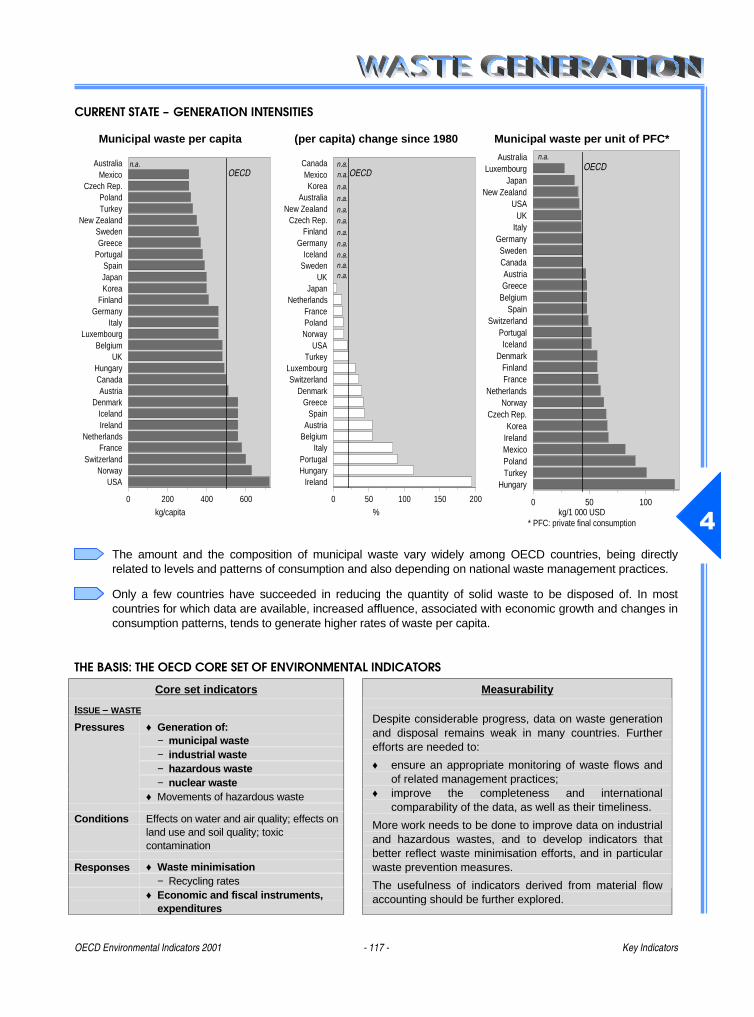
OECD Environmental Indicators 2001 - 117 - Key Indicators
�
CURRENT STATE – GENERATION INTENSITIES
Municipal waste per capita (per capita) change since 1980 Municipal waste per unit of PFC*
kg/capita % kg/1 000 USD* PFC: private final consumption
The amount and the composition of municipal waste vary widely among OECD countries, being directlyrelated to levels and patterns of consumption and also depending on national waste management practices.
Only a few countries have succeeded in reducing the quantity of solid waste to be disposed of. In mostcountries for which data are available, increased affluence, associated with economic growth and changes inconsumption patterns, tends to generate higher rates of waste per capita.
THE BASIS: THE OECD CORE SET OF ENVIRONMENTAL INDICATORS
Core set indicators Measurability
ISSUE – WASTE
♦ Generation of:− municipal waste− industrial waste− hazardous waste− nuclear waste
Pressures
♦ Movements of hazardous waste
Conditions Effects on water and air quality; effects onland use and soil quality; toxiccontamination
Responses ♦ Waste minimisation− Recycling rates
♦ Economic and fiscal instruments,expenditures
Despite considerable progress, data on waste generationand disposal remains weak in many countries. Furtherefforts are needed to:
♦ ensure an appropriate monitoring of waste flows andof related management practices;
♦ improve the completeness and internationalcomparability of the data, as well as their timeliness.
More work needs to be done to improve data on industrialand hazardous wastes, and to develop indicators thatbetter reflect waste minimisation efforts, and in particularwaste prevention measures.
The usefulness of indicators derived from material flowaccounting should be further explored.
AustraliaLuxembourg
JapanNew Zealand
USAUK
ItalyGermanySwedenCanadaAustriaGreece
BelgiumSpain
SwitzerlandPortugalIceland
DenmarkFinlandFrance
NetherlandsNorway
Czech Rep.Korea
IrelandMexicoPolandTurkey
Hungary
0 50 100
OECDn.a.
CanadaMexicoKorea
AustraliaNew Zealand
Czech Rep.Finland
GermanyIceland
SwedenUK
JapanNetherlands
FrancePolandNorway
USATurkey
LuxembourgSwitzerland
DenmarkGreece
SpainAustria
BelgiumItaly
PortugalHungary
Ireland
0 50 100 150 200
OECDn.a.n.a.
n.a.
n.a.
n.a.n.a.
n.a.
n.a.n.a.n.a.n.a.
AustraliaMexico
Czech Rep.PolandTurkey
New ZealandSwedenGreece
PortugalSpainJapanKorea
FinlandGermany
ItalyLuxembourg
BelgiumUK
HungaryCanadaAustria
DenmarkIcelandIreland
NetherlandsFrance
SwitzerlandNorway
USA
0 200 400 600
OECDn.a.
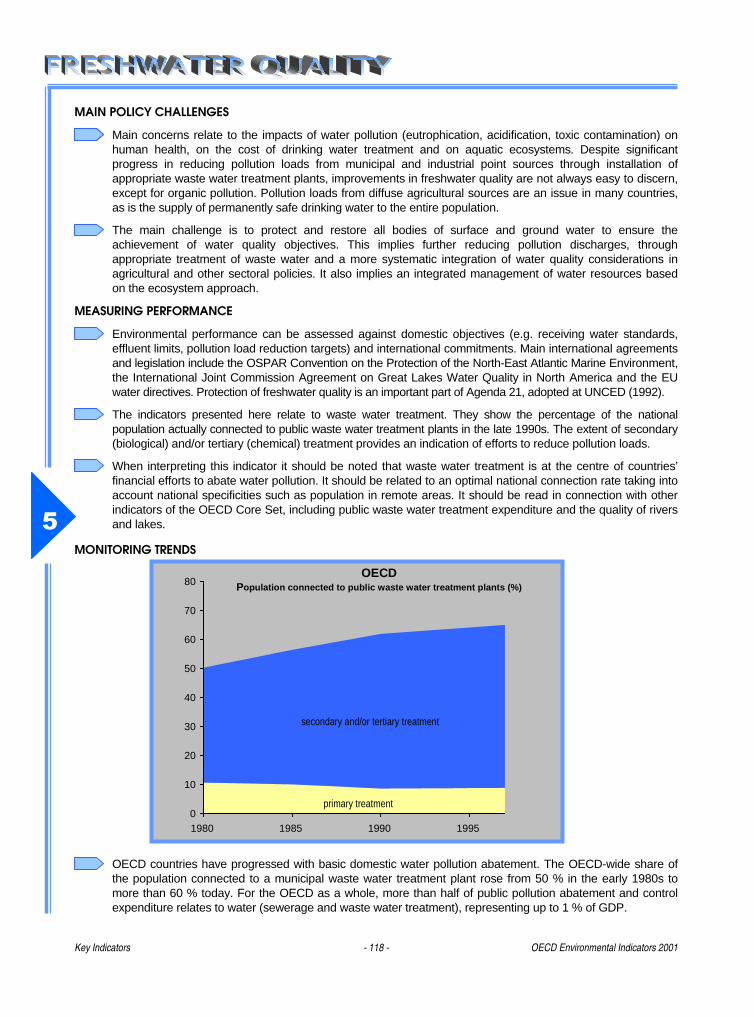
Key Indicators - 118 - OECD Environmental Indicators 2001
�
MAIN POLICY CHALLENGES
Main concerns relate to the impacts of water pollution (eutrophication, acidification, toxic contamination) onhuman health, on the cost of drinking water treatment and on aquatic ecosystems. Despite significantprogress in reducing pollution loads from municipal and industrial point sources through installation ofappropriate waste water treatment plants, improvements in freshwater quality are not always easy to discern,except for organic pollution. Pollution loads from diffuse agricultural sources are an issue in many countries,as is the supply of permanently safe drinking water to the entire population.
The main challenge is to protect and restore all bodies of surface and ground water to ensure theachievement of water quality objectives. This implies further reducing pollution discharges, throughappropriate treatment of waste water and a more systematic integration of water quality considerations inagricultural and other sectoral policies. It also implies an integrated management of water resources basedon the ecosystem approach.
MEASURING PERFORMANCE
Environmental performance can be assessed against domestic objectives (e.g. receiving water standards,effluent limits, pollution load reduction targets) and international commitments. Main international agreementsand legislation include the OSPAR Convention on the Protection of the North-East Atlantic Marine Environment,the International Joint Commission Agreement on Great Lakes Water Quality in North America and the EUwater directives. Protection of freshwater quality is an important part of Agenda 21, adopted at UNCED (1992).
The indicators presented here relate to waste water treatment. They show the percentage of the nationalpopulation actually connected to public waste water treatment plants in the late 1990s. The extent of secondary(biological) and/or tertiary (chemical) treatment provides an indication of efforts to reduce pollution loads.
When interpreting this indicator it should be noted that waste water treatment is at the centre of countries’financial efforts to abate water pollution. It should be related to an optimal national connection rate taking intoaccount national specificities such as population in remote areas. It should be read in connection with otherindicators of the OECD Core Set, including public waste water treatment expenditure and the quality of riversand lakes.
MONITORING TRENDS
OECD countries have progressed with basic domestic water pollution abatement. The OECD-wide share ofthe population connected to a municipal waste water treatment plant rose from 50 % in the early 1980s tomore than 60 % today. For the OECD as a whole, more than half of public pollution abatement and controlexpenditure relates to water (sewerage and waste water treatment), representing up to 1 % of GDP.
0
10
20
30
40
50
60
70
80
1980 1985 1990 1995
OECDPopulation connected to public waste water treatment plants (%)
primary treatment
secondary and/or tertiary treatment
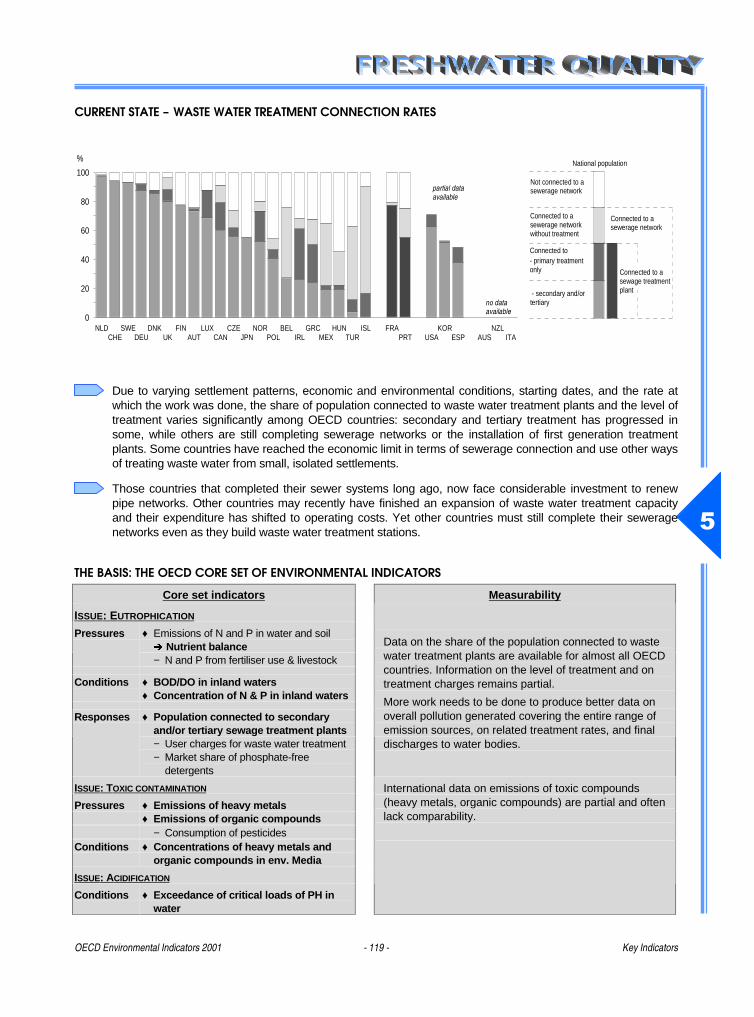
OECD Environmental Indicators 2001 - 119 - Key Indicators
�
CURRENT STATE – WASTE WATER TREATMENT CONNECTION RATES
NLDCHE
SWEDEU
DNKUK
FINAUT
LUXCAN
CZEJPN
NORPOL
BELIRL
GRCMEX
HUNTUR
ISL
FRAPRT
USA
KORESP
AUS
NZLITA
0
20
40
60
80
100
% National population
no data available
Not connected to a sewerage network
Connected to a sewerage network without treatment
Connected to a sewerage network
Connected to- primary treatment only
- secondary and/or tertiary
Connected to a sewage treatment plant
partial data available
Due to varying settlement patterns, economic and environmental conditions, starting dates, and the rate atwhich the work was done, the share of population connected to waste water treatment plants and the level oftreatment varies significantly among OECD countries: secondary and tertiary treatment has progressed insome, while others are still completing sewerage networks or the installation of first generation treatmentplants. Some countries have reached the economic limit in terms of sewerage connection and use other waysof treating waste water from small, isolated settlements.
Those countries that completed their sewer systems long ago, now face considerable investment to renewpipe networks. Other countries may recently have finished an expansion of waste water treatment capacityand their expenditure has shifted to operating costs. Yet other countries must still complete their seweragenetworks even as they build waste water treatment stations.
THE BASIS: THE OECD CORE SET OF ENVIRONMENTAL INDICATORS
Core set indicators Measurability
ISSUE: EUTROPHICATION
♦ Emissions of N and P in water and soil� Nutrient balance
Pressures
− N and P from fertiliser use & livestock
Conditions ♦ BOD/DO in inland waters♦ Concentration of N & P in inland waters
♦ Population connected to secondaryand/or tertiary sewage treatment plants
Responses
− User charges for waste water treatment− Market share of phosphate-free
detergents
Data on the share of the population connected to wastewater treatment plants are available for almost all OECDcountries. Information on the level of treatment and ontreatment charges remains partial.
More work needs to be done to produce better data onoverall pollution generated covering the entire range ofemission sources, on related treatment rates, and finaldischarges to water bodies.
ISSUE: T OXIC CONTAMINATION
Pressures ♦ Emissions of heavy metals♦ Emissions of organic compounds
− Consumption of pesticidesConditions ♦ Concentrations of heavy metals and
organic compounds in env. Media
ISSUE: A CIDIFICATION
Conditions ♦ Exceedance of critical loads of PH inwater
International data on emissions of toxic compounds(heavy metals, organic compounds) are partial and oftenlack comparability.
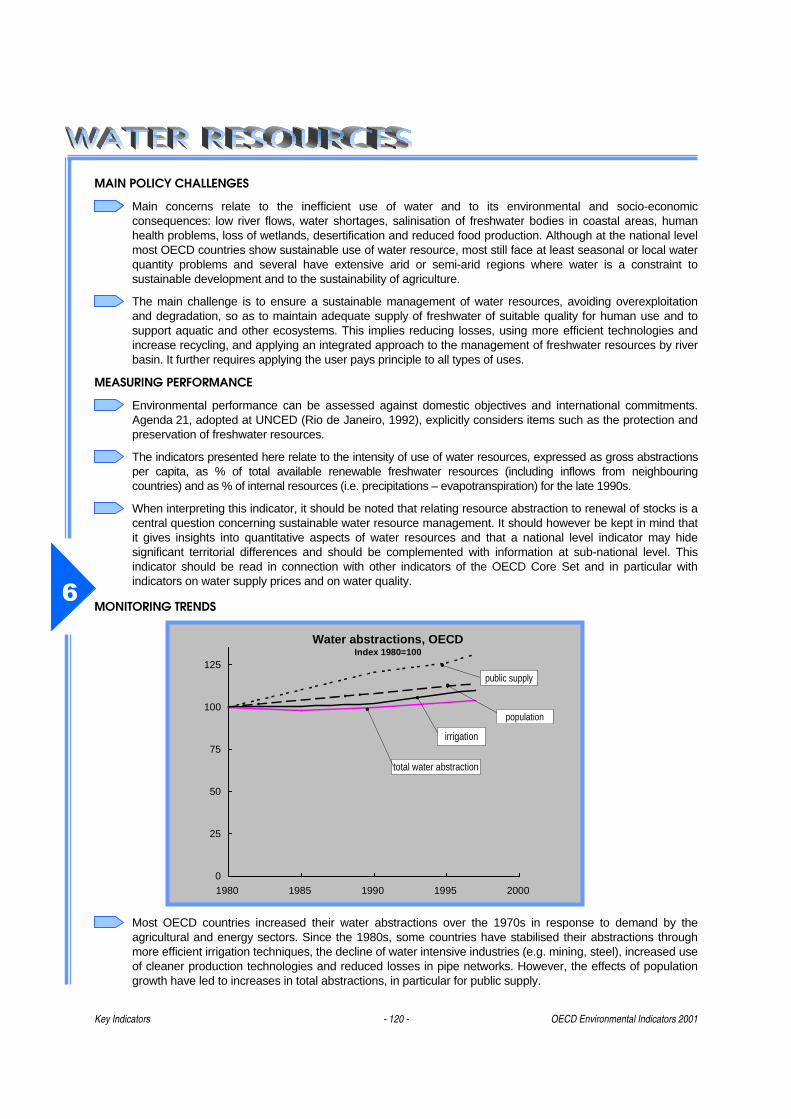
Key Indicators - 120 - OECD Environmental Indicators 2001
�
MAIN POLICY CHALLENGES
Main concerns relate to the inefficient use of water and to its environmental and socio-economicconsequences: low river flows, water shortages, salinisation of freshwater bodies in coastal areas, humanhealth problems, loss of wetlands, desertification and reduced food production. Although at the national levelmost OECD countries show sustainable use of water resource, most still face at least seasonal or local waterquantity problems and several have extensive arid or semi-arid regions where water is a constraint tosustainable development and to the sustainability of agriculture.
The main challenge is to ensure a sustainable management of water resources, avoiding overexploitationand degradation, so as to maintain adequate supply of freshwater of suitable quality for human use and tosupport aquatic and other ecosystems. This implies reducing losses, using more efficient technologies andincrease recycling, and applying an integrated approach to the management of freshwater resources by riverbasin. It further requires applying the user pays principle to all types of uses.
MEASURING PERFORMANCE
Environmental performance can be assessed against domestic objectives and international commitments.Agenda 21, adopted at UNCED (Rio de Janeiro, 1992), explicitly considers items such as the protection andpreservation of freshwater resources.
The indicators presented here relate to the intensity of use of water resources, expressed as gross abstractionsper capita, as % of total available renewable freshwater resources (including inflows from neighbouringcountries) and as % of internal resources (i.e. precipitations – evapotranspiration) for the late 1990s.
When interpreting this indicator, it should be noted that relating resource abstraction to renewal of stocks is acentral question concerning sustainable water resource management. It should however be kept in mind thatit gives insights into quantitative aspects of water resources and that a national level indicator may hidesignificant territorial differences and should be complemented with information at sub-national level. Thisindicator should be read in connection with other indicators of the OECD Core Set and in particular withindicators on water supply prices and on water quality.
MONITORING TRENDS
Most OECD countries increased their water abstractions over the 1970s in response to demand by theagricultural and energy sectors. Since the 1980s, some countries have stabilised their abstractions throughmore efficient irrigation techniques, the decline of water intensive industries (e.g. mining, steel), increased useof cleaner production technologies and reduced losses in pipe networks. However, the effects of populationgrowth have led to increases in total abstractions, in particular for public supply.
0
25
50
75
100
125
1980 1985 1990 1995 2000
Water abstractions, OECDIndex 1980=100
public supply
irrigation
total water abstraction
population
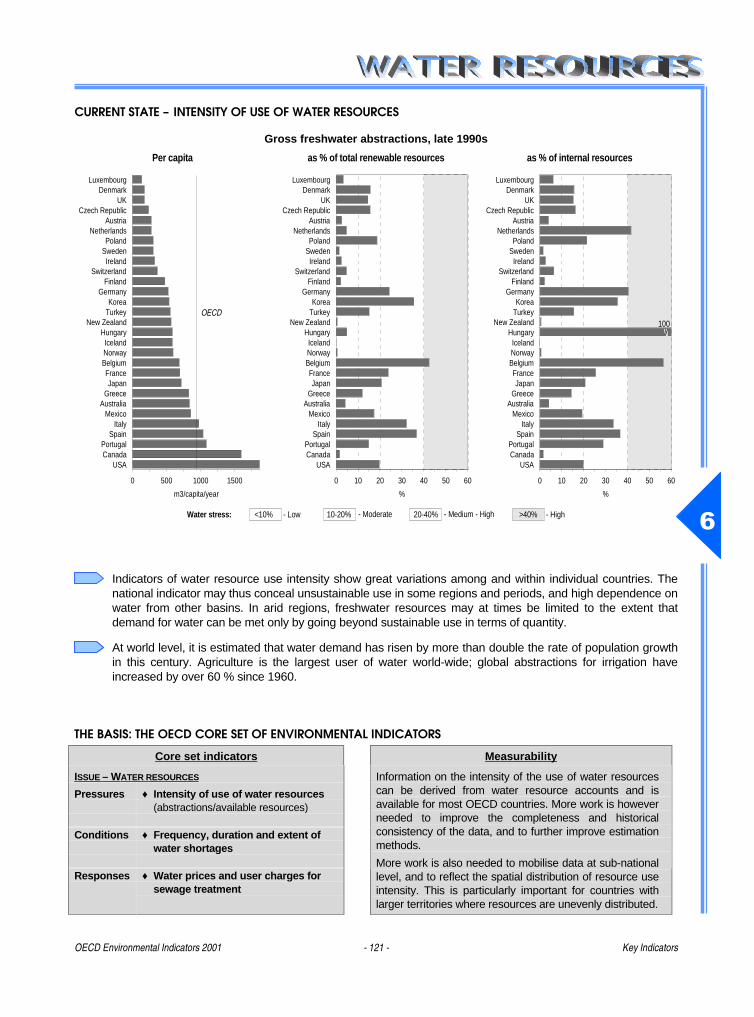
OECD Environmental Indicators 2001 - 121 - Key Indicators
�
CURRENT STATE – INTENSITY OF USE OF WATER RESOURCES
Gross freshwater abstractions, late 1990s
Per capita as % of total renewable resources as % of internal resources
Indicators of water resource use intensity show great variations among and within individual countries. Thenational indicator may thus conceal unsustainable use in some regions and periods, and high dependence onwater from other basins. In arid regions, freshwater resources may at times be limited to the extent thatdemand for water can be met only by going beyond sustainable use in terms of quantity.
At world level, it is estimated that water demand has risen by more than double the rate of population growthin this century. Agriculture is the largest user of water world-wide; global abstractions for irrigation haveincreased by over 60 % since 1960.
THE BASIS: THE OECD CORE SET OF ENVIRONMENTAL INDICATORS
Core set indicators Measurability
ISSUE – W ATER RESOURCES
Pressures ♦ Intensity of use of water resources(abstractions/available resources)
Conditions ♦ Frequency, duration and extent ofwater shortages
Responses ♦ Water prices and user charges forsewage treatment
Information on the intensity of the use of water resourcescan be derived from water resource accounts and isavailable for most OECD countries. More work is howeverneeded to improve the completeness and historicalconsistency of the data, and to further improve estimationmethods.
More work is also needed to mobilise data at sub-nationallevel, and to reflect the spatial distribution of resource useintensity. This is particularly important for countries withlarger territories where resources are unevenly distributed.
LuxembourgDenmark
UKCzech Republic
AustriaNetherlands
PolandSwedenIreland
SwitzerlandFinland
GermanyKorea
TurkeyNew Zealand
HungaryIcelandNorwayBelgiumFranceJapan
GreeceAustralia
MexicoItaly
SpainPortugalCanada
USA
0 500 1000 1500
m3/capita/year
OECD
Water stress: >40% - High20-40% - Medium - High10-20% - Moderate<10% - Low
LuxembourgDenmark
UKCzech Republic
AustriaNetherlands
PolandSwedenIreland
SwitzerlandFinland
GermanyKorea
TurkeyNew Zealand
HungaryIcelandNorwayBelgiumFranceJapan
GreeceAustralia
MexicoItaly
SpainPortugalCanada
USA
0 10 20 30 40 50 60
%
LuxembourgDenmark
UKCzech Republic
AustriaNetherlands
PolandSweden
IrelandSwitzerland
FinlandGermany
KoreaTurkey
New ZealandHungary
IcelandNorwayBelgiumFranceJapan
GreeceAustralia
MexicoItaly
SpainPortugalCanada
USA
0 10 20 30 40 50 60
%
100
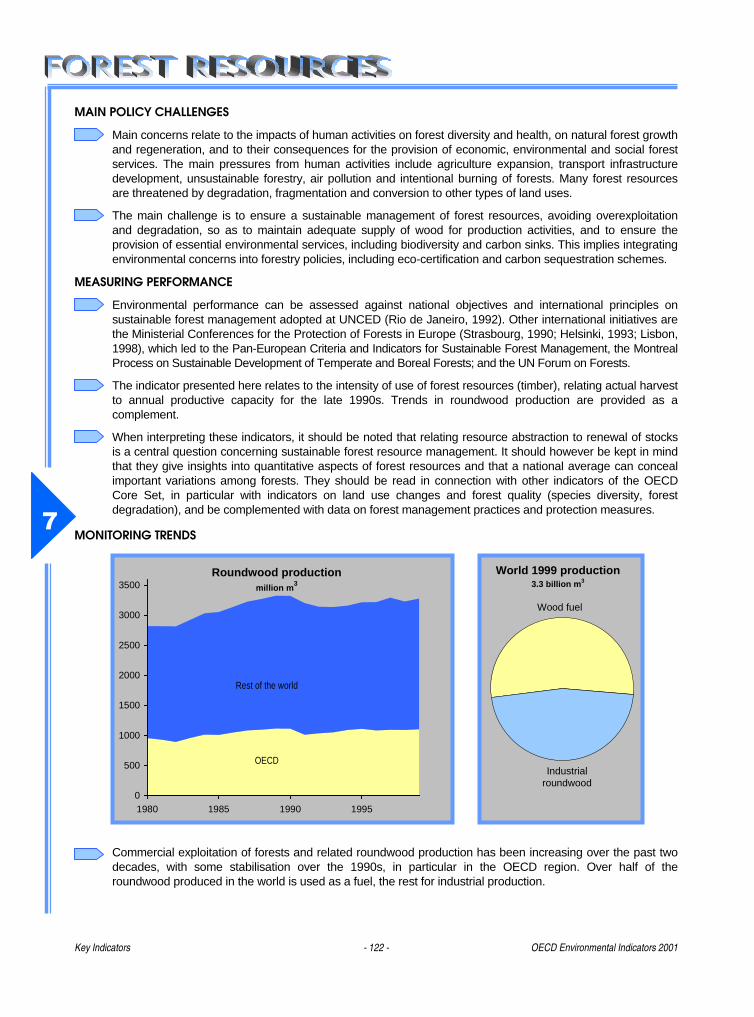
Key Indicators - 122 - OECD Environmental Indicators 2001
�
MAIN POLICY CHALLENGES
Main concerns relate to the impacts of human activities on forest diversity and health, on natural forest growthand regeneration, and to their consequences for the provision of economic, environmental and social forestservices. The main pressures from human activities include agriculture expansion, transport infrastructuredevelopment, unsustainable forestry, air pollution and intentional burning of forests. Many forest resourcesare threatened by degradation, fragmentation and conversion to other types of land uses.
The main challenge is to ensure a sustainable management of forest resources, avoiding overexploitationand degradation, so as to maintain adequate supply of wood for production activities, and to ensure theprovision of essential environmental services, including biodiversity and carbon sinks. This implies integratingenvironmental concerns into forestry policies, including eco-certification and carbon sequestration schemes.
MEASURING PERFORMANCE
Environmental performance can be assessed against national objectives and international principles onsustainable forest management adopted at UNCED (Rio de Janeiro, 1992). Other international initiatives arethe Ministerial Conferences for the Protection of Forests in Europe (Strasbourg, 1990; Helsinki, 1993; Lisbon,1998), which led to the Pan-European Criteria and Indicators for Sustainable Forest Management, the MontrealProcess on Sustainable Development of Temperate and Boreal Forests; and the UN Forum on Forests.
The indicator presented here relates to the intensity of use of forest resources (timber), relating actual harvestto annual productive capacity for the late 1990s. Trends in roundwood production are provided as acomplement.
When interpreting these indicators, it should be noted that relating resource abstraction to renewal of stocksis a central question concerning sustainable forest resource management. It should however be kept in mindthat they give insights into quantitative aspects of forest resources and that a national average can concealimportant variations among forests. They should be read in connection with other indicators of the OECDCore Set, in particular with indicators on land use changes and forest quality (species diversity, forestdegradation), and be complemented with data on forest management practices and protection measures.
MONITORING TRENDS
Commercial exploitation of forests and related roundwood production has been increasing over the past twodecades, with some stabilisation over the 1990s, in particular in the OECD region. Over half of theroundwood produced in the world is used as a fuel, the rest for industrial production.
Wood fuel
Industrial roundwood
World 1999 production3.3 billion m3
0
500
1000
1500
2000
2500
3000
3500
1980 1985 1990 1995
Roundwood productionmillion m3
OECD
Rest of the world
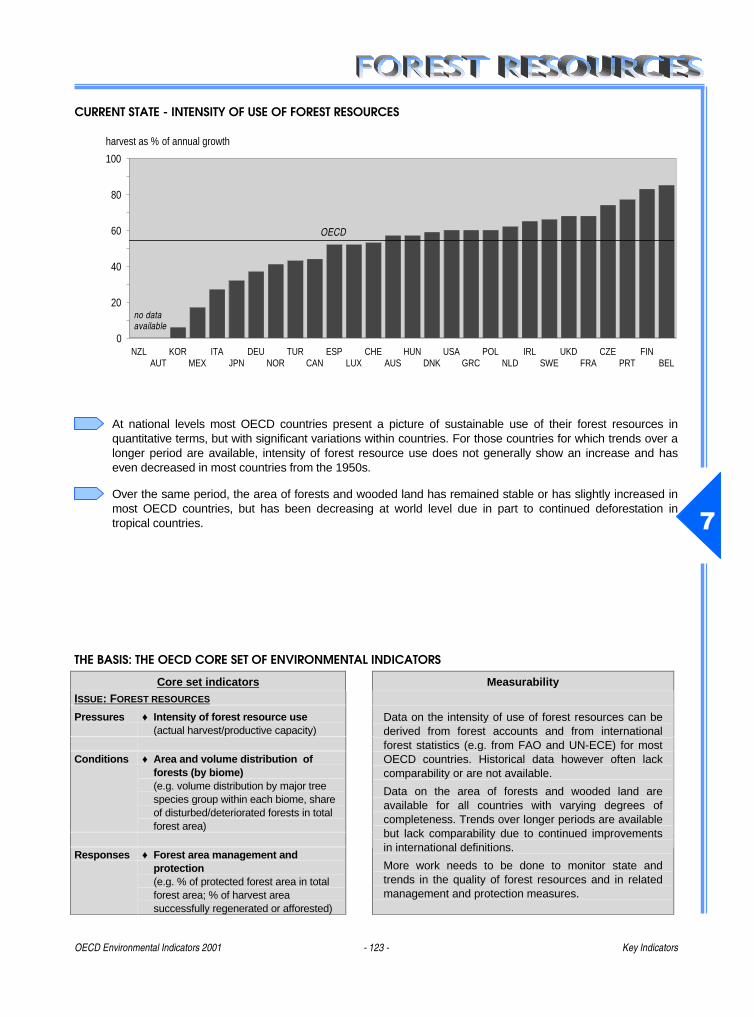
OECD Environmental Indicators 2001 - 123 - Key Indicators
�
CURRENT STATE - INTENSITY OF USE OF FOREST RESOURCES
At national levels most OECD countries present a picture of sustainable use of their forest resources inquantitative terms, but with significant variations within countries. For those countries for which trends over alonger period are available, intensity of forest resource use does not generally show an increase and haseven decreased in most countries from the 1950s.
Over the same period, the area of forests and wooded land has remained stable or has slightly increased inmost OECD countries, but has been decreasing at world level due in part to continued deforestation intropical countries.
THE BASIS: THE OECD CORE SET OF ENVIRONMENTAL INDICATORS
Core set indicators MeasurabilityISSUE: F OREST RESOURCES
Pressures ♦ Intensity of forest resource use(actual harvest/productive capacity)
Conditions ♦ Area and volume distribution offorests (by biome)(e.g. volume distribution by major treespecies group within each biome, shareof disturbed/deteriorated forests in totalforest area)
Responses ♦ Forest area management andprotection(e.g. % of protected forest area in totalforest area; % of harvest areasuccessfully regenerated or afforested)
Data on the intensity of use of forest resources can bederived from forest accounts and from internationalforest statistics (e.g. from FAO and UN-ECE) for mostOECD countries. Historical data however often lackcomparability or are not available.
Data on the area of forests and wooded land areavailable for all countries with varying degrees ofcompleteness. Trends over longer periods are availablebut lack comparability due to continued improvementsin international definitions.
More work needs to be done to monitor state andtrends in the quality of forest resources and in relatedmanagement and protection measures.
NZLAUT
KORMEX
ITAJPN
DEUNOR
TURCAN
ESPLUX
CHEAUS
HUNDNK
USAGRC
POLNLD
IRLSWE
UKDFRA
CZEPRT
FINBEL
0
20
40
60
80
100
harvest as % of annual growth
no data available
OECD
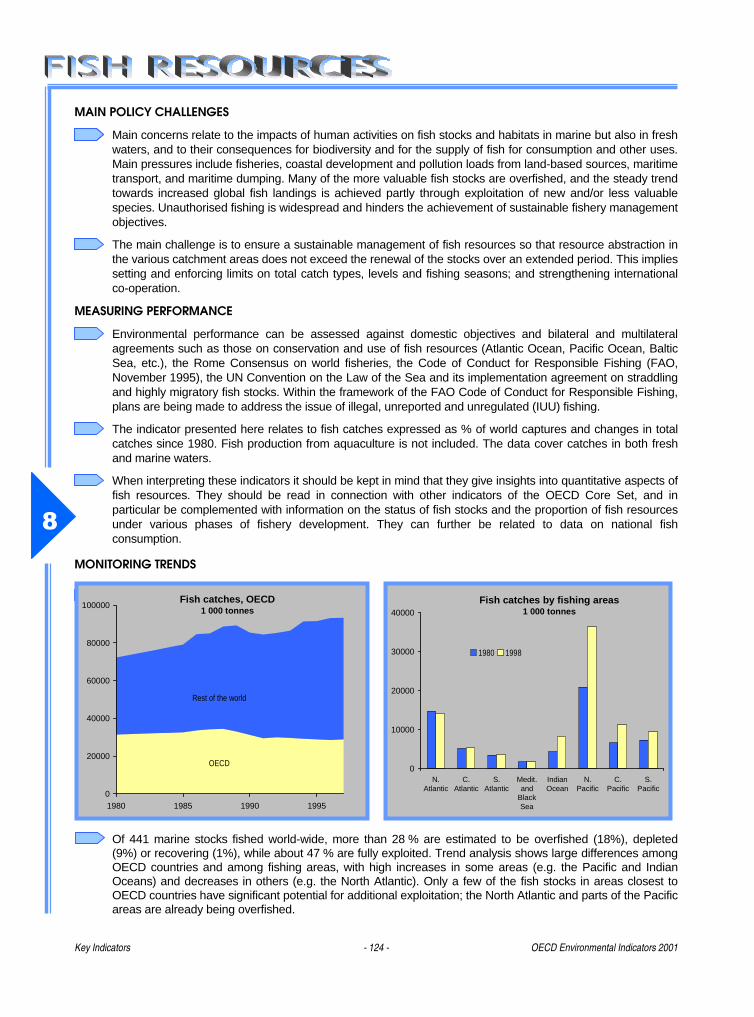
Key Indicators - 124 - OECD Environmental Indicators 2001
�
MAIN POLICY CHALLENGES
Main concerns relate to the impacts of human activities on fish stocks and habitats in marine but also in freshwaters, and to their consequences for biodiversity and for the supply of fish for consumption and other uses.Main pressures include fisheries, coastal development and pollution loads from land-based sources, maritimetransport, and maritime dumping. Many of the more valuable fish stocks are overfished, and the steady trendtowards increased global fish landings is achieved partly through exploitation of new and/or less valuablespecies. Unauthorised fishing is widespread and hinders the achievement of sustainable fishery managementobjectives.
The main challenge is to ensure a sustainable management of fish resources so that resource abstraction inthe various catchment areas does not exceed the renewal of the stocks over an extended period. This impliessetting and enforcing limits on total catch types, levels and fishing seasons; and strengthening internationalco-operation.
MEASURING PERFORMANCE
Environmental performance can be assessed against domestic objectives and bilateral and multilateralagreements such as those on conservation and use of fish resources (Atlantic Ocean, Pacific Ocean, BalticSea, etc.), the Rome Consensus on world fisheries, the Code of Conduct for Responsible Fishing (FAO,November 1995), the UN Convention on the Law of the Sea and its implementation agreement on straddlingand highly migratory fish stocks. Within the framework of the FAO Code of Conduct for Responsible Fishing,plans are being made to address the issue of illegal, unreported and unregulated (IUU) fishing.
The indicator presented here relates to fish catches expressed as % of world captures and changes in totalcatches since 1980. Fish production from aquaculture is not included. The data cover catches in both freshand marine waters.
When interpreting these indicators it should be kept in mind that they give insights into quantitative aspects offish resources. They should be read in connection with other indicators of the OECD Core Set, and inparticular be complemented with information on the status of fish stocks and the proportion of fish resourcesunder various phases of fishery development. They can further be related to data on national fishconsumption.
MONITORING TRENDS
Of 441 marine stocks fished world-wide, more than 28 % are estimated to be overfished (18%), depleted(9%) or recovering (1%), while about 47 % are fully exploited. Trend analysis shows large differences amongOECD countries and among fishing areas, with high increases in some areas (e.g. the Pacific and IndianOceans) and decreases in others (e.g. the North Atlantic). Only a few of the fish stocks in areas closest toOECD countries have significant potential for additional exploitation; the North Atlantic and parts of the Pacificareas are already being overfished.
0
20000
40000
60000
80000
100000
1980 1985 1990 1995
Fish catches, OECD1 000 tonnes
OECD
Rest of the world
0
10000
20000
30000
40000
N.Atlantic
C.Atlantic
S.Atlantic
Medit.and
BlackSea
IndianOcean
N.Pacific
C.Pacific
S.Pacific
1980 1998
Fish catches by fishing areas1 000 tonnes
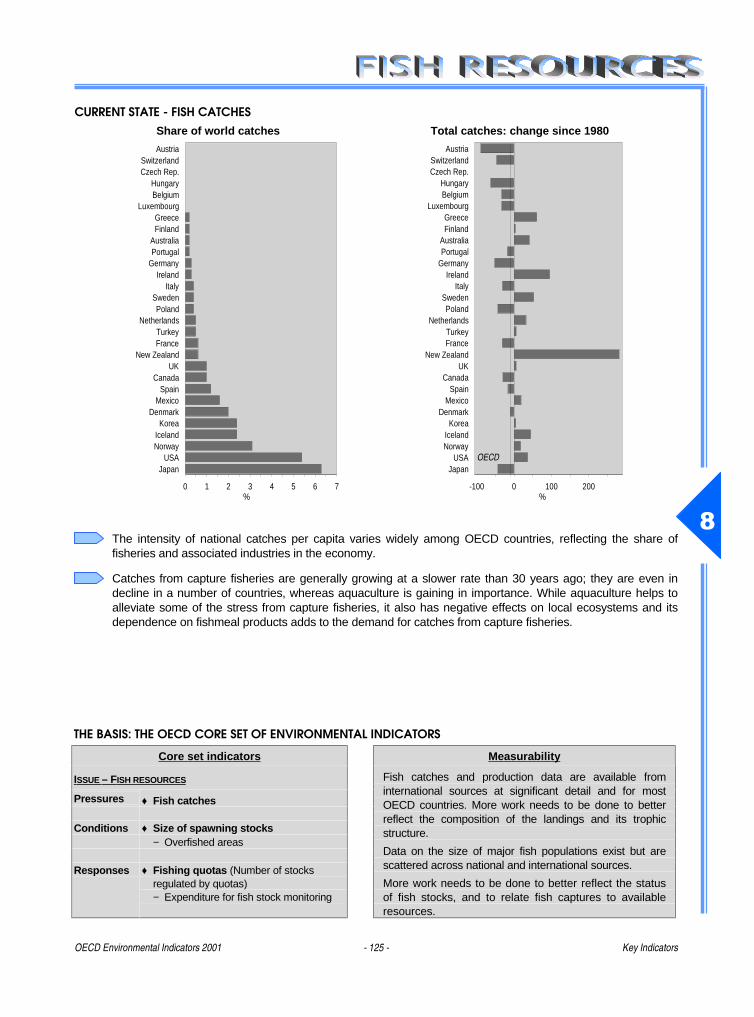
OECD Environmental Indicators 2001 - 125 - Key Indicators
�
CURRENT STATE - FISH CATCHESShare of world catches Total catches: change since 1980
% %
The intensity of national catches per capita varies widely among OECD countries, reflecting the share offisheries and associated industries in the economy.
Catches from capture fisheries are generally growing at a slower rate than 30 years ago; they are even indecline in a number of countries, whereas aquaculture is gaining in importance. While aquaculture helps toalleviate some of the stress from capture fisheries, it also has negative effects on local ecosystems and itsdependence on fishmeal products adds to the demand for catches from capture fisheries.
THE BASIS: THE OECD CORE SET OF ENVIRONMENTAL INDICATORS
Core set indicators Measurability
ISSUE – F ISH RESOURCES
Pressures ♦ Fish catches
Conditions ♦ Size of spawning stocks− Overfished areas
Responses ♦ Fishing quotas (Number of stocksregulated by quotas)− Expenditure for fish stock monitoring
Fish catches and production data are available frominternational sources at significant detail and for mostOECD countries. More work needs to be done to betterreflect the composition of the landings and its trophicstructure.
Data on the size of major fish populations exist but arescattered across national and international sources.
More work needs to be done to better reflect the statusof fish stocks, and to relate fish captures to availableresources.
AustriaSwitzerlandCzech Rep.
HungaryBelgium
LuxembourgGreeceFinland
AustraliaPortugal
GermanyIreland
ItalySwedenPoland
NetherlandsTurkeyFrance
New ZealandUK
CanadaSpain
MexicoDenmark
KoreaIcelandNorway
USAJapan
-100 0 100 200
OECD
AustriaSwitzerlandCzech Rep.
HungaryBelgium
LuxembourgGreeceFinland
AustraliaPortugal
GermanyIreland
ItalySwedenPoland
NetherlandsTurkeyFrance
New ZealandUK
CanadaSpain
MexicoDenmark
KoreaIcelandNorway
USAJapan
0 1 2 3 4 5 6 7
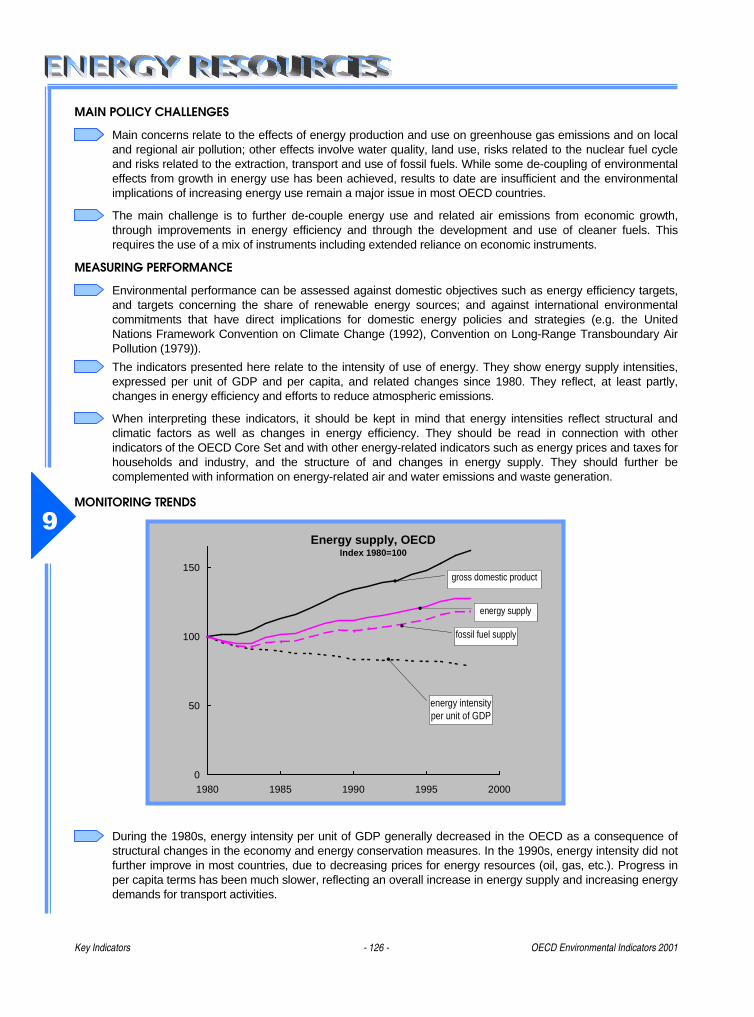
Key Indicators - 126 - OECD Environmental Indicators 2001
�
MAIN POLICY CHALLENGES
Main concerns relate to the effects of energy production and use on greenhouse gas emissions and on localand regional air pollution; other effects involve water quality, land use, risks related to the nuclear fuel cycleand risks related to the extraction, transport and use of fossil fuels. While some de-coupling of environmentaleffects from growth in energy use has been achieved, results to date are insufficient and the environmentalimplications of increasing energy use remain a major issue in most OECD countries.
The main challenge is to further de-couple energy use and related air emissions from economic growth,through improvements in energy efficiency and through the development and use of cleaner fuels. Thisrequires the use of a mix of instruments including extended reliance on economic instruments.
MEASURING PERFORMANCE
Environmental performance can be assessed against domestic objectives such as energy efficiency targets,and targets concerning the share of renewable energy sources; and against international environmentalcommitments that have direct implications for domestic energy policies and strategies (e.g. the UnitedNations Framework Convention on Climate Change (1992), Convention on Long-Range Transboundary AirPollution (1979)).
The indicators presented here relate to the intensity of use of energy. They show energy supply intensities,expressed per unit of GDP and per capita, and related changes since 1980. They reflect, at least partly,changes in energy efficiency and efforts to reduce atmospheric emissions.
When interpreting these indicators, it should be kept in mind that energy intensities reflect structural andclimatic factors as well as changes in energy efficiency. They should be read in connection with otherindicators of the OECD Core Set and with other energy-related indicators such as energy prices and taxes forhouseholds and industry, and the structure of and changes in energy supply. They should further becomplemented with information on energy-related air and water emissions and waste generation.
MONITORING TRENDS
During the 1980s, energy intensity per unit of GDP generally decreased in the OECD as a consequence ofstructural changes in the economy and energy conservation measures. In the 1990s, energy intensity did notfurther improve in most countries, due to decreasing prices for energy resources (oil, gas, etc.). Progress inper capita terms has been much slower, reflecting an overall increase in energy supply and increasing energydemands for transport activities.
0
50
100
150
1980 1985 1990 1995 2000
energy supply
energy intensity per unit of GDP
gross domestic product
Energy supply, OECDIndex 1980=100
fossil fuel supply
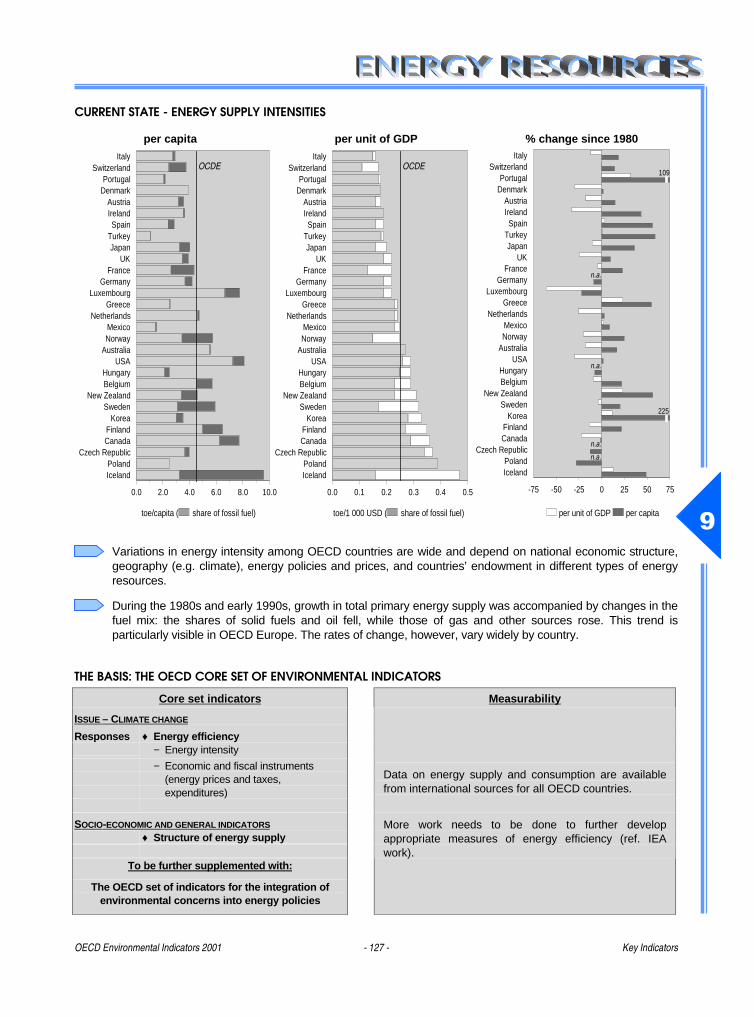
OECD Environmental Indicators 2001 - 127 - Key Indicators
�
CURRENT STATE - ENERGY SUPPLY INTENSITIES
per capita per unit of GDP % change since 1980
toe/capita ( share of fossil fuel) toe/1 000 USD ( share of fossil fuel) per unit of GDP per capita
Variations in energy intensity among OECD countries are wide and depend on national economic structure,geography (e.g. climate), energy policies and prices, and countries’ endowment in different types of energyresources.
During the 1980s and early 1990s, growth in total primary energy supply was accompanied by changes in thefuel mix: the shares of solid fuels and oil fell, while those of gas and other sources rose. This trend isparticularly visible in OECD Europe. The rates of change, however, vary widely by country.
THE BASIS: THE OECD CORE SET OF ENVIRONMENTAL INDICATORS
Core set indicators Measurability
ISSUE – C LIMATE CHANGE
Responses ♦ Energy efficiency− Energy intensity
− Economic and fiscal instruments(energy prices and taxes,expenditures)
SOCIO- ECONOMIC AND GENERAL INDICATORS ♦ Structure of energy supply
To be further supplemented with:
The OECD set of indicators for the integration ofenvironmental concerns into energy policies
Data on energy supply and consumption are availablefrom international sources for all OECD countries.
More work needs to be done to further developappropriate measures of energy efficiency (ref. IEAwork).
ItalySwitzerland
PortugalDenmark
AustriaIrelandSpain
TurkeyJapan
UKFrance
GermanyLuxembourg
GreeceNetherlands
MexicoNorway
AustraliaUSA
HungaryBelgium
New ZealandSweden
KoreaFinlandCanada
Czech RepublicPolandIceland
-75 -50 -25 0 25 50 75
n.a.
n.a.
n.a.
225
109
n.a.
ItalySwitzerland
PortugalDenmark
AustriaIrelandSpain
TurkeyJapan
UKFrance
GermanyLuxembourg
GreeceNetherlands
MexicoNorway
AustraliaUSA
HungaryBelgium
New ZealandSweden
KoreaFinlandCanada
Czech RepublicPolandIceland
0.0 0.1 0.2 0.3 0.4 0.5
OCDEItaly
SwitzerlandPortugal
DenmarkAustriaIrelandSpain
TurkeyJapan
UKFrance
GermanyLuxembourg
GreeceNetherlands
MexicoNorway
AustraliaUSA
HungaryBelgium
New ZealandSweden
KoreaFinlandCanada
Czech RepublicPolandIceland
0.0 2.0 4.0 6.0 8.0 10.0
OCDE
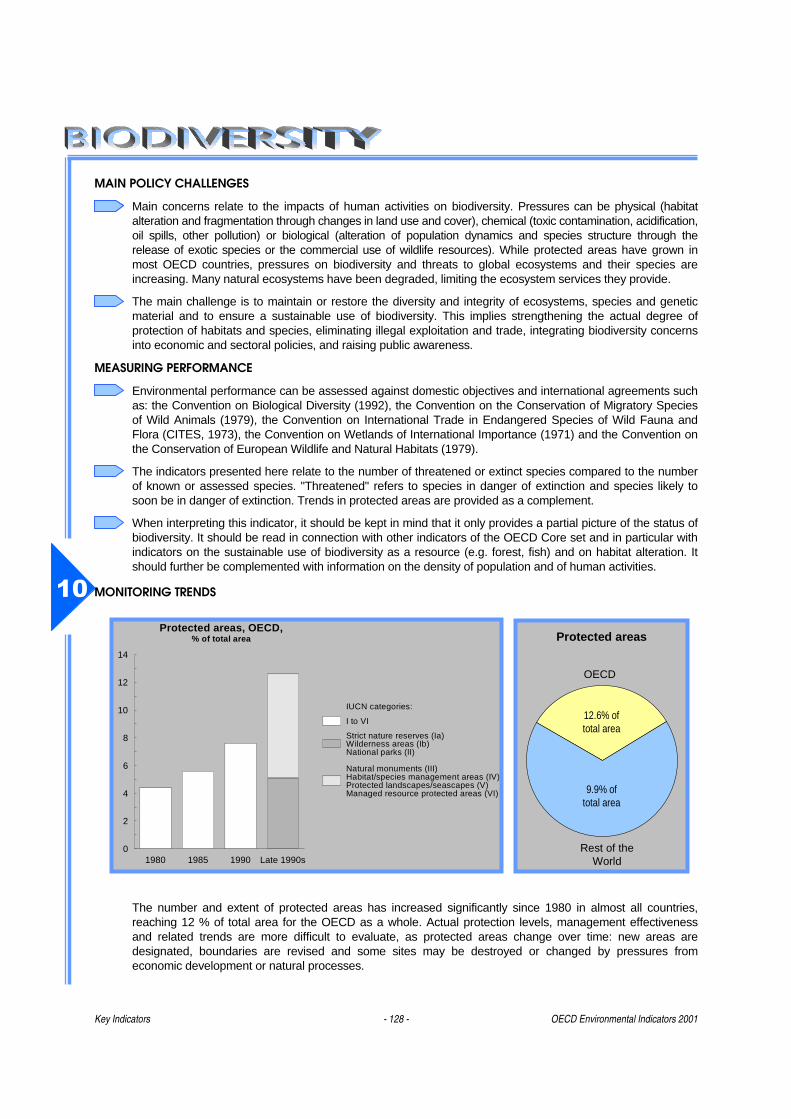
Key Indicators - 128 - OECD Environmental Indicators 2001
��
MAIN POLICY CHALLENGES
Main concerns relate to the impacts of human activities on biodiversity. Pressures can be physical (habitatalteration and fragmentation through changes in land use and cover), chemical (toxic contamination, acidification,oil spills, other pollution) or biological (alteration of population dynamics and species structure through therelease of exotic species or the commercial use of wildlife resources). While protected areas have grown inmost OECD countries, pressures on biodiversity and threats to global ecosystems and their species areincreasing. Many natural ecosystems have been degraded, limiting the ecosystem services they provide.
The main challenge is to maintain or restore the diversity and integrity of ecosystems, species and geneticmaterial and to ensure a sustainable use of biodiversity. This implies strengthening the actual degree ofprotection of habitats and species, eliminating illegal exploitation and trade, integrating biodiversity concernsinto economic and sectoral policies, and raising public awareness.
MEASURING PERFORMANCE
Environmental performance can be assessed against domestic objectives and international agreements suchas: the Convention on Biological Diversity (1992), the Convention on the Conservation of Migratory Speciesof Wild Animals (1979), the Convention on International Trade in Endangered Species of Wild Fauna andFlora (CITES, 1973), the Convention on Wetlands of International Importance (1971) and the Convention onthe Conservation of European Wildlife and Natural Habitats (1979).
The indicators presented here relate to the number of threatened or extinct species compared to the numberof known or assessed species. "Threatened" refers to species in danger of extinction and species likely tosoon be in danger of extinction. Trends in protected areas are provided as a complement.
When interpreting this indicator, it should be kept in mind that it only provides a partial picture of the status ofbiodiversity. It should be read in connection with other indicators of the OECD Core set and in particular withindicators on the sustainable use of biodiversity as a resource (e.g. forest, fish) and on habitat alteration. Itshould further be complemented with information on the density of population and of human activities.
MONITORING TRENDS
The number and extent of protected areas has increased significantly since 1980 in almost all countries,reaching 12 % of total area for the OECD as a whole. Actual protection levels, management effectivenessand related trends are more difficult to evaluate, as protected areas change over time: new areas aredesignated, boundaries are revised and some sites may be destroyed or changed by pressures fromeconomic development or natural processes.
Protected areas, OECD,% of total area
1980 1985 1990 Late 1990s0
2
4
6
8
10
12
14
Natural monuments (III)Habitat/species management areas (IV)Protected landscapes/seascapes (V)Managed resource protected areas (VI)
Strict nature reserves (Ia)Wilderness areas (Ib)National parks (II)
I to VI
IUCN categories:
OECD
Rest of the World
Protected areas
12.6% of total area
9.9% of total area
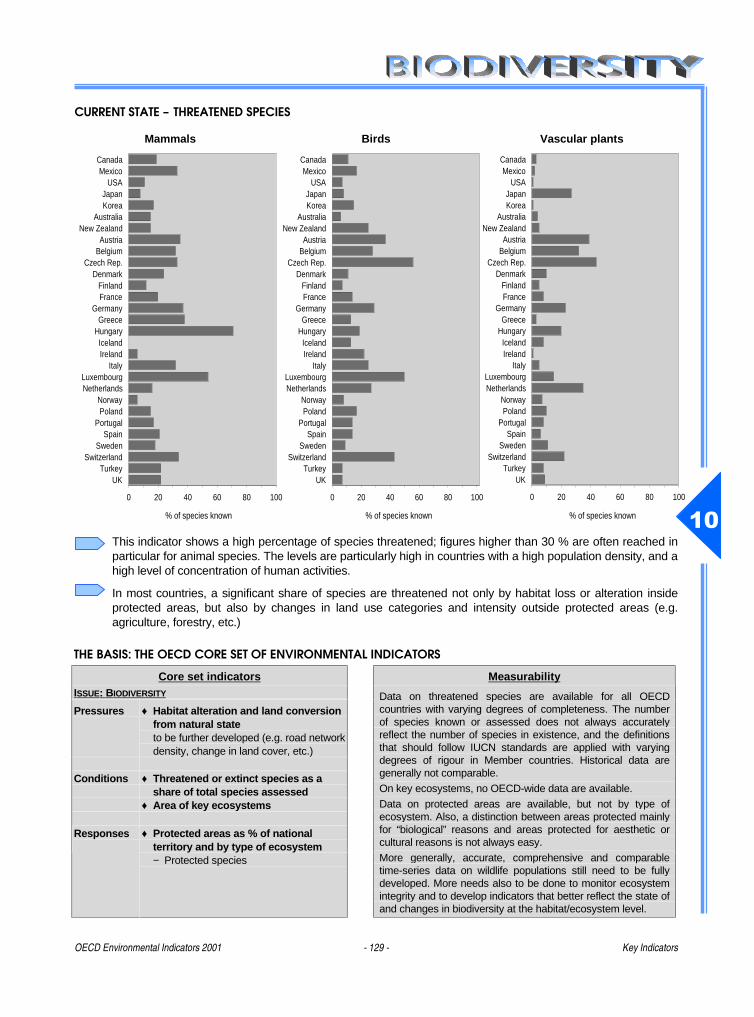
OECD Environmental Indicators 2001 - 129 - Key Indicators
��
CURRENT STATE – THREATENED SPECIES
Mammals Birds Vascular plants
% of species known % of species known % of species known
This indicator shows a high percentage of species threatened; figures higher than 30 % are often reached inparticular for animal species. The levels are particularly high in countries with a high population density, and ahigh level of concentration of human activities.
In most countries, a significant share of species are threatened not only by habitat loss or alteration insideprotected areas, but also by changes in land use categories and intensity outside protected areas (e.g.agriculture, forestry, etc.)
THE BASIS: THE OECD CORE SET OF ENVIRONMENTAL INDICATORS
Core set indicators MeasurabilityISSUE: BIODIVERSITY
Pressures ♦ Habitat alteration and land conversionfrom natural stateto be further developed (e.g. road networkdensity, change in land cover, etc.)
Conditions ♦ Threatened or extinct species as ashare of total species assessed
♦ Area of key ecosystems
♦ Protected areas as % of nationalterritory and by type of ecosystem
Responses
− Protected species
Data on threatened species are available for all OECDcountries with varying degrees of completeness. The numberof species known or assessed does not always accuratelyreflect the number of species in existence, and the definitionsthat should follow IUCN standards are applied with varyingdegrees of rigour in Member countries. Historical data aregenerally not comparable.
On key ecosystems, no OECD-wide data are available.
Data on protected areas are available, but not by type ofecosystem. Also, a distinction between areas protected mainlyfor “biological” reasons and areas protected for aesthetic orcultural reasons is not always easy.
More generally, accurate, comprehensive and comparabletime-series data on wildlife populations still need to be fullydeveloped. More needs also to be done to monitor ecosystemintegrity and to develop indicators that better reflect the state ofand changes in biodiversity at the habitat/ecosystem level.
CanadaMexico
USAJapanKorea
AustraliaNew Zealand
AustriaBelgium
Czech Rep.Denmark
FinlandFrance
GermanyGreece
HungaryIcelandIreland
ItalyLuxembourgNetherlands
NorwayPoland
PortugalSpain
SwedenSwitzerland
TurkeyUK
0 20 40 60 80 100
CanadaMexico
USAJapanKorea
AustraliaNew Zealand
AustriaBelgium
Czech Rep.Denmark
FinlandFrance
GermanyGreece
HungaryIcelandIreland
ItalyLuxembourgNetherlands
NorwayPoland
PortugalSpain
SwedenSwitzerland
TurkeyUK
0 20 40 60 80 100
CanadaMexico
USAJapanKorea
AustraliaNew Zealand
AustriaBelgium
Czech Rep.Denmark
FinlandFrance
GermanyGreece
HungaryIcelandIreland
ItalyLuxembourgNetherlands
NorwayPoland
PortugalSpain
SwedenSwitzerland
TurkeyUK
0 20 40 60 80 100
- 131 -
��� �������� ����
����������������������
OECD FRAMEWORK FOR ENVIRONMENTAL INDICATORS 132
APPROACH AND RESULTS .....................................................................................................132
SEVERAL TYPES OF INDICATORS............................................................................................132
THE OECD CORE SET OF ENVIRONMENTAL INDICATORS 135
PURPOSE AND CHARACTERISTICS .........................................................................................135
FRAMEWORK .......................................................................................................................135
KEY INDICATORS .................................................................................................................136
THE OECD SETS OF SECTORAL INDICATORS 137
PURPOSE AND CHARACTERISTICS .........................................................................................137
FRAMEWORK .......................................................................................................................137
OECD ENVIRONMENTAL ACCOUNTING 138
INDICATORS DERIVED FROM NATURAL RESOURCE ACCOUNTS..................................................138
INDICATORS DERIVED FROM ENVIRONMENTAL EXPENDITURE ACCOUNTS...................................138
USING ENVIRONMENTAL INDICATORS 139
GUIDING PRINCIPLES ............................................................................................................139
MEASURABILITY ...................................................................................................................139
ENVIRONMENTAL INDICATORS AND PERFORMANCE ANALYSIS...................................................140
INSETS:
INSET 1 DEFINITIONS AND FUNCTIONS OF ENVIRONMENTAL INDICATORS.................................133
INSET 2 CRITERIA FOR SELECTING ENVIRONMENTAL INDICATORS...........................................133
INSET 3 THE PRESSURE - STATE - RESPONSE (PSR) MODEL ...............................................134
INSET 4 STRUCTURE OF OECD INDICATORS CORE SET BY ENVIRONMENTAL ISSUE ................135
INSET 5 FRAMEWORK* OF OECD SETS OF SECTORAL INDICATORS........................................137
INSET 6 ENVIRONMENTAL ACCOUNTING: DEFINITIONS AND CONCEPTS ....................................138
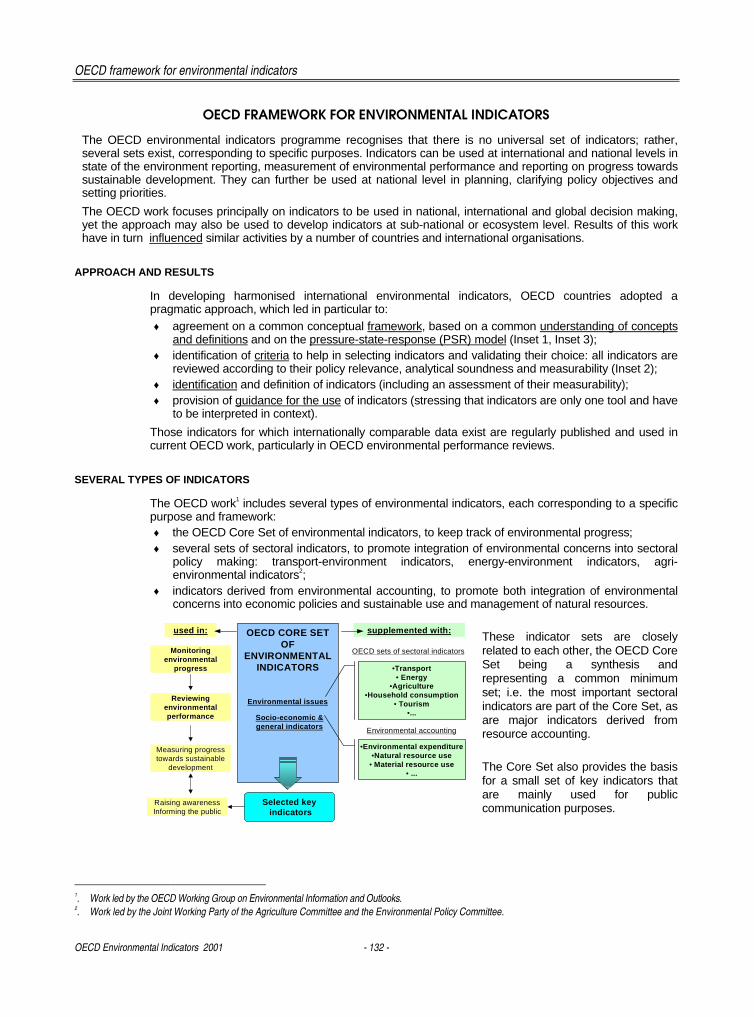
OECD framework for environmental indicators
OECD Environmental Indicators 2001 - 132 -
OECD FRAMEWORK FOR ENVIRONMENTAL INDICATORS
The OECD environmental indicators programme recognises that there is no universal set of indicators; rather,several sets exist, corresponding to specific purposes. Indicators can be used at international and national levels instate of the environment reporting, measurement of environmental performance and reporting on progress towardssustainable development. They can further be used at national level in planning, clarifying policy objectives andsetting priorities.
The OECD work focuses principally on indicators to be used in national, international and global decision making,yet the approach may also be used to develop indicators at sub-national or ecosystem level. Results of this workhave in turn influenced similar activities by a number of countries and international organisations.
APPROACH AND RESULTS
In developing harmonised international environmental indicators, OECD countries adopted apragmatic approach, which led in particular to:♦ agreement on a common conceptual framework, based on a common understanding of concepts
and definitions and on the pressure-state-response (PSR) model (Inset 1, Inset 3);♦ identification of criteria to help in selecting indicators and validating their choice: all indicators are
reviewed according to their policy relevance, analytical soundness and measurability (Inset 2);♦ identification and definition of indicators (including an assessment of their measurability);♦ provision of guidance for the use of indicators (stressing that indicators are only one tool and have
to be interpreted in context).
Those indicators for which internationally comparable data exist are regularly published and used incurrent OECD work, particularly in OECD environmental performance reviews.
SEVERAL TYPES OF INDICATORS
The OECD work1 includes several types of environmental indicators, each corresponding to a specificpurpose and framework:♦ the OECD Core Set of environmental indicators, to keep track of environmental progress;♦ several sets of sectoral indicators, to promote integration of environmental concerns into sectoral
policy making: transport-environment indicators, energy-environment indicators, agri-environmental indicators2;
♦ indicators derived from environmental accounting, to promote both integration of environmentalconcerns into economic policies and sustainable use and management of natural resources.
These indicator sets are closelyrelated to each other, the OECD CoreSet being a synthesis andrepresenting a common minimumset; i.e. the most important sectoralindicators are part of the Core Set, asare major indicators derived fromresource accounting.
The Core Set also provides the basisfor a small set of key indicators thatare mainly used for publiccommunication purposes.
1. Work led by the OECD Working Group on Environmental Information and Outlooks.2. Work led by the Joint Working Party of the Agriculture Committee and the Environmental Policy Committee.
OECD CORE SETOF
ENVIRONMENTALINDICATORS
Socio-economic &general indicators
Environmental issues
•Environmental expenditure•Natural resource use
• Material resource use• ...
Environmental accounting
OECD sets of sectoral indicators
•Transport• Energy
•Agriculture•Household consumption
• Tourism•...
MonitoringMonitoringenvironmentalenvironmental
progressprogress
ReviewingReviewingenvironmentalenvironmentalperformanceperformance
supplemented with:used in:
Selected key indicators
Raising awarenessRaising awarenessInforming the publicInforming the public
Measuring progressMeasuring progresstowards sustainabletowards sustainable
developmentdevelopment
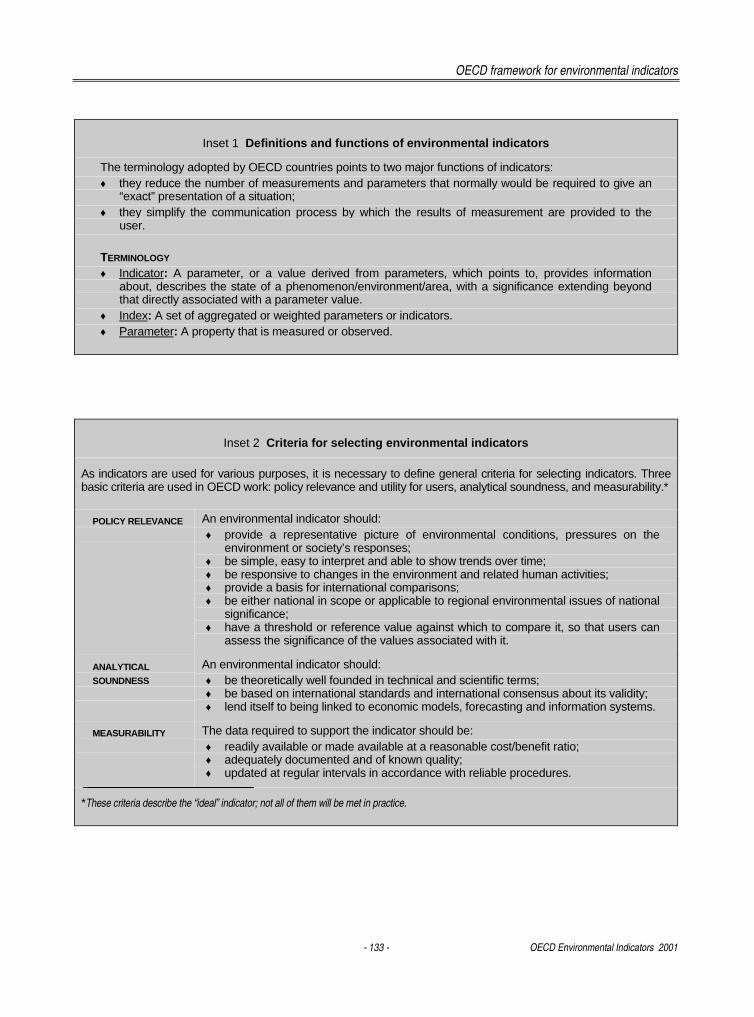
OECD framework for environmental indicators
- 133 - OECD Environmental Indicators 2001
Inset 1 Definitions and functions of environmental indicators
The terminology adopted by OECD countries points to two major functions of indicators:♦ they reduce the number of measurements and parameters that normally would be required to give an
“exact” presentation of a situation;♦ they simplify the communication process by which the results of measurement are provided to the
user.
TERMINOLOGY
♦ Indicator: A parameter, or a value derived from parameters, which points to, provides informationabout, describes the state of a phenomenon/environment/area, with a significance extending beyondthat directly associated with a parameter value.
♦ Index: A set of aggregated or weighted parameters or indicators.♦ Parameter: A property that is measured or observed.
Inset 2 Criteria for selecting environmental indicators
As indicators are used for various purposes, it is necessary to define general criteria for selecting indicators. Threebasic criteria are used in OECD work: policy relevance and utility for users, analytical soundness, and measurability.*
POLICY RELEVANCE An environmental indicator should:♦ provide a representative picture of environmental conditions, pressures on the
environment or society’s responses;♦ be simple, easy to interpret and able to show trends over time;♦ be responsive to changes in the environment and related human activities;♦ provide a basis for international comparisons;♦ be either national in scope or applicable to regional environmental issues of national
significance;♦ have a threshold or reference value against which to compare it, so that users can
assess the significance of the values associated with it.
ANALYTICAL
SOUNDNESS
An environmental indicator should:♦ be theoretically well founded in technical and scientific terms;♦ be based on international standards and international consensus about its validity;♦ lend itself to being linked to economic models, forecasting and information systems.
MEASURABILITY The data required to support the indicator should be:♦ readily available or made available at a reasonable cost/benefit ratio;♦ adequately documented and of known quality;♦ updated at regular intervals in accordance with reliable procedures.
*These criteria describe the “ideal” indicator; not all of them will be met in practice.
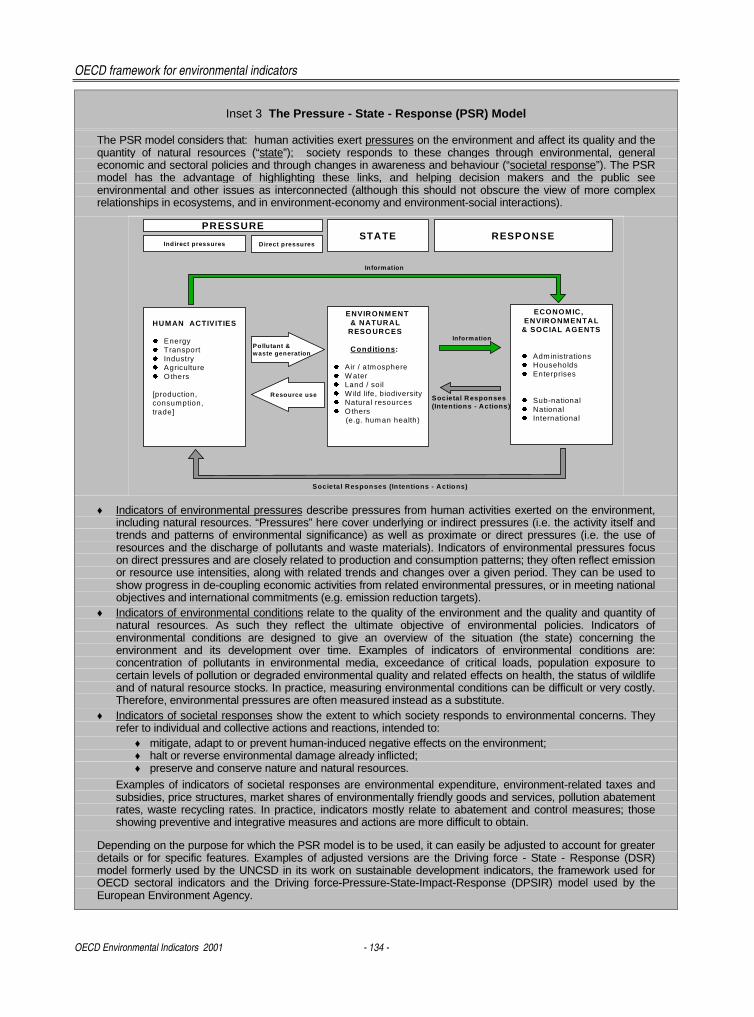
OECD framework for environmental indicators
OECD Environmental Indicators 2001 - 134 -
Inset 3 The Pressure - State - Response (PSR) Model
The PSR model considers that: human activities exert pressures on the environment and affect its quality and thequantity of natural resources (“state”); society responds to these changes through environmental, generaleconomic and sectoral policies and through changes in awareness and behaviour (“societal response”). The PSRmodel has the advantage of highlighting these links, and helping decision makers and the public seeenvironmental and other issues as interconnected (although this should not obscure the view of more complexrelationships in ecosystems, and in environment-economy and environment-social interactions).
Societal Responses (Intentions - Actions)
Inform ation
ENVIRONMENT & NATURAL RESO URCES
Conditions:
� Air / atmosphere� W ater� Land / soil� W ild life, biodiversity� Natural resources� O thers (e.g. human health)
HUMAN ACTIVITIES
� Energy� Transport� Industry� Agriculture� O thers
[production,consumption,trade]
Societal Responses(Intentions - Actions)
Information
ECONOMIC, ENVIRONMENTAL& SOCIAL AGENTS
� Adm inistrations� Households� Enterprises
� Sub-national� National � International
Direct pressuresRESPONSESTATE
PRESSURE
Indirect pressures
Resource use
Pollutant & waste generation
♦ Indicators of environmental pressures describe pressures from human activities exerted on the environment,including natural resources. “Pressures” here cover underlying or indirect pressures (i.e. the activity itself andtrends and patterns of environmental significance) as well as proximate or direct pressures (i.e. the use ofresources and the discharge of pollutants and waste materials). Indicators of environmental pressures focuson direct pressures and are closely related to production and consumption patterns; they often reflect emissionor resource use intensities, along with related trends and changes over a given period. They can be used toshow progress in de-coupling economic activities from related environmental pressures, or in meeting nationalobjectives and international commitments (e.g. emission reduction targets).
♦ Indicators of environmental conditions relate to the quality of the environment and the quality and quantity ofnatural resources. As such they reflect the ultimate objective of environmental policies. Indicators ofenvironmental conditions are designed to give an overview of the situation (the state) concerning theenvironment and its development over time. Examples of indicators of environmental conditions are:concentration of pollutants in environmental media, exceedance of critical loads, population exposure tocertain levels of pollution or degraded environmental quality and related effects on health, the status of wildlifeand of natural resource stocks. In practice, measuring environmental conditions can be difficult or very costly.Therefore, environmental pressures are often measured instead as a substitute.
♦ Indicators of societal responses show the extent to which society responds to environmental concerns. Theyrefer to individual and collective actions and reactions, intended to:
♦ mitigate, adapt to or prevent human-induced negative effects on the environment;♦ halt or reverse environmental damage already inflicted;♦ preserve and conserve nature and natural resources.
Examples of indicators of societal responses are environmental expenditure, environment-related taxes andsubsidies, price structures, market shares of environmentally friendly goods and services, pollution abatementrates, waste recycling rates. In practice, indicators mostly relate to abatement and control measures; thoseshowing preventive and integrative measures and actions are more difficult to obtain.
Depending on the purpose for which the PSR model is to be used, it can easily be adjusted to account for greaterdetails or for specific features. Examples of adjusted versions are the Driving force - State - Response (DSR)model formerly used by the UNCSD in its work on sustainable development indicators, the framework used forOECD sectoral indicators and the Driving force-Pressure-State-Impact-Response (DPSIR) model used by theEuropean Environment Agency.
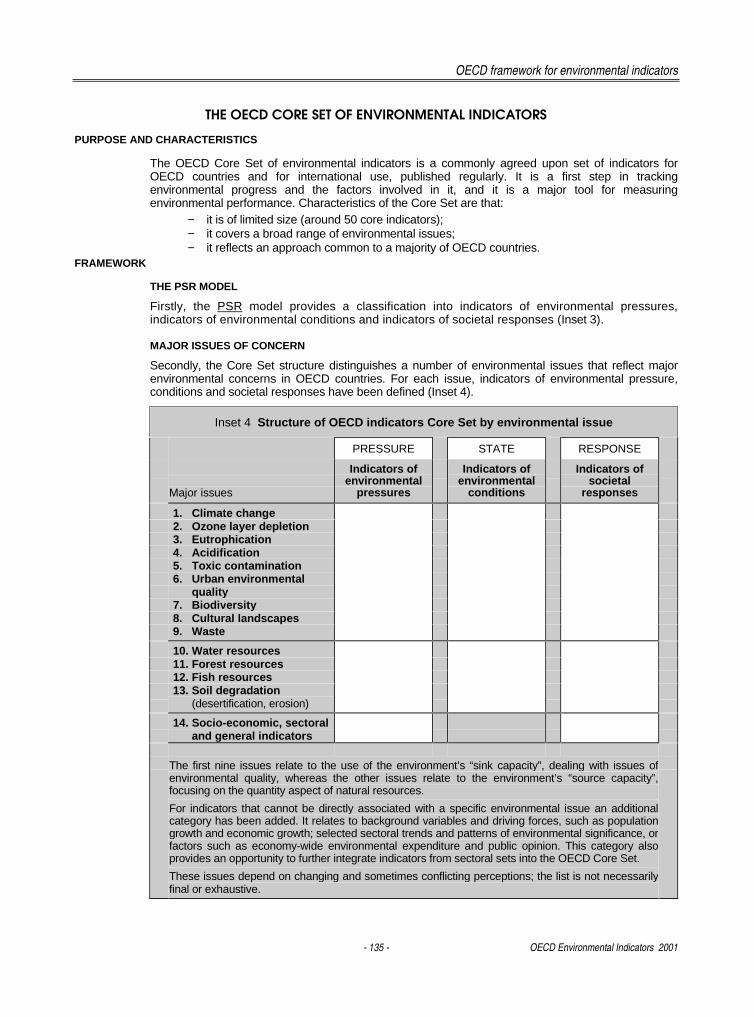
OECD framework for environmental indicators
- 135 - OECD Environmental Indicators 2001
THE OECD CORE SET OF ENVIRONMENTAL INDICATORS
PURPOSE AND CHARACTERISTICS
The OECD Core Set of environmental indicators is a commonly agreed upon set of indicators forOECD countries and for international use, published regularly. It is a first step in trackingenvironmental progress and the factors involved in it, and it is a major tool for measuringenvironmental performance. Characteristics of the Core Set are that:
− it is of limited size (around 50 core indicators);− it covers a broad range of environmental issues;− it reflects an approach common to a majority of OECD countries.
FRAMEWORK
THE PSR MODEL
Firstly, the PSR model provides a classification into indicators of environmental pressures,indicators of environmental conditions and indicators of societal responses (Inset 3).
MAJOR ISSUES OF CONCERN
Secondly, the Core Set structure distinguishes a number of environmental issues that reflect majorenvironmental concerns in OECD countries. For each issue, indicators of environmental pressure,conditions and societal responses have been defined (Inset 4).
Inset 4 Structure of OECD indicators Core Set by environmental issue
PRESSURE STATE RESPONSE
Major issues
Indicators ofenvironmental
pressures
Indicators ofenvironmental
conditions
Indicators ofsocietal
responses
1. Climate change2. Ozone layer depletion3. Eutrophication4. Acidification5. Toxic contamination6. Urban environmental
quality7. Biodiversity8. Cultural landscapes9. Waste
10. Water resources11. Forest resources12. Fish resources13. Soil degradation
(desertification, erosion)
14. Socio-economic, sectoraland general indicators
The first nine issues relate to the use of the environment’s “sink capacity”, dealing with issues ofenvironmental quality, whereas the other issues relate to the environment’s “source capacity”,focusing on the quantity aspect of natural resources.
For indicators that cannot be directly associated with a specific environmental issue an additionalcategory has been added. It relates to background variables and driving forces, such as populationgrowth and economic growth; selected sectoral trends and patterns of environmental significance, orfactors such as economy-wide environmental expenditure and public opinion. This category alsoprovides an opportunity to further integrate indicators from sectoral sets into the OECD Core Set.
These issues depend on changing and sometimes conflicting perceptions; the list is not necessarilyfinal or exhaustive.
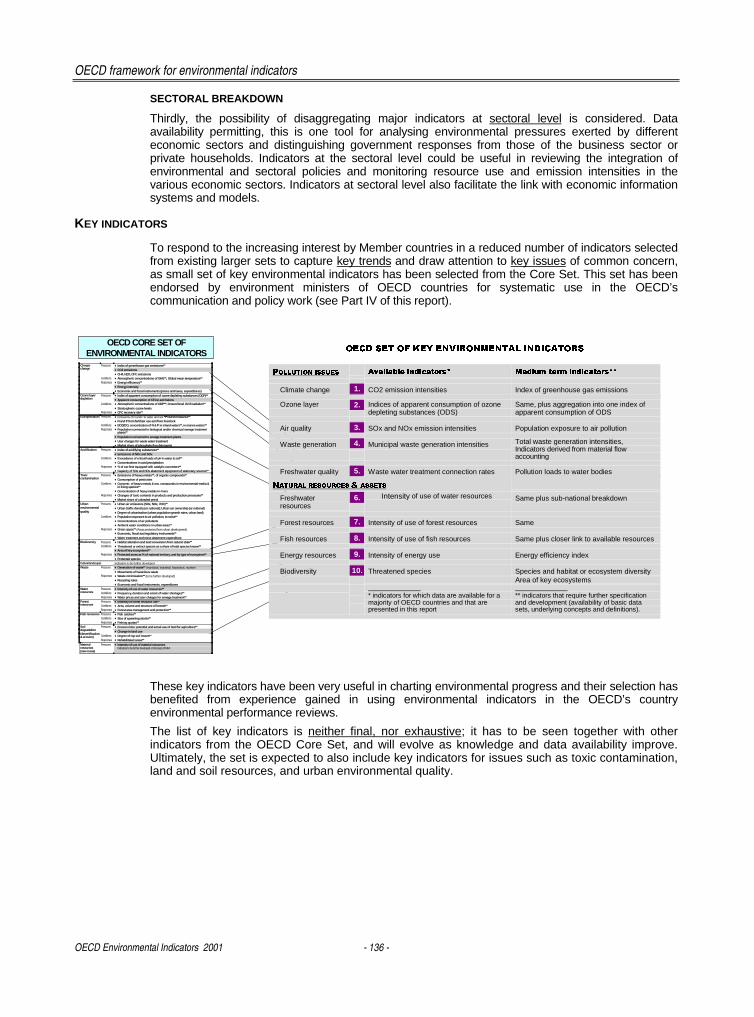
OECD framework for environmental indicators
OECD Environmental Indicators 2001 - 136 -
SECTORAL BREAKDOWN
Thirdly, the possibility of disaggregating major indicators at sectoral level is considered. Dataavailability permitting, this is one tool for analysing environmental pressures exerted by differenteconomic sectors and distinguishing government responses from those of the business sector orprivate households. Indicators at the sectoral level could be useful in reviewing the integration ofenvironmental and sectoral policies and monitoring resource use and emission intensities in thevarious economic sectors. Indicators at sectoral level also facilitate the link with economic informationsystems and models.
KEY INDICATORS
To respond to the increasing interest by Member countries in a reduced number of indicators selectedfrom existing larger sets to capture key trends and draw attention to key issues of common concern,as small set of key environmental indicators has been selected from the Core Set. This set has beenendorsed by environment ministers of OECD countries for systematic use in the OECD’scommunication and policy work (see Part IV of this report).
These key indicators have been very useful in charting environmental progress and their selection hasbenefited from experience gained in using environmental indicators in the OECD’s countryenvironmental performance reviews.
The list of key indicators is neither final, nor exhaustive; it has to be seen together with otherindicators from the OECD Core Set, and will evolve as knowledge and data availability improve.Ultimately, the set is expected to also include key indicators for issues such as toxic contamination,land and soil resources, and urban environmental quality.
OECD CORE SET OFENVIRONMENTAL INDICATORS
Pressures ♦ Index of greenhouse gas emissions**♦ CO2 emissions♦ CH4, N2O, CFC emissions
Conditions ♦ Atmospheric concentrations of GHG**; Global mean temperature**Responses ♦ Energy efficiency**
♦ Energy intensity
Climatechange
♦ Economic and fiscal instruments (prices and taxes, expenditures)Pressures ♦ Index of apparent consumption of ozone depleting substances (ODP)**
♦ Apparent consumption of CFCs/ and halonsConditions ♦ Atmospheric concentrations of ODP**; Ground level UV-B radiation**
♦ Stratospheric ozone levels
Ozone layerdepletion
Responses ♦ CFC recovery rate**Pressures ♦ Emissions of N and P in water and soil � Nutrient balance**
♦ N and P from fertilizer use and from livestockConditions ♦ BOD/DO, concentration of N & P in inland waters**, in marine waters**Responses ♦ Population connected to biological and/or chemical sewage treatment
plants**♦ Population connected to sewage treatment plants♦ User charges for waste water treatment
Eutrophication
♦ Market share of phosphate-free detergentsPressures ♦ Index of acidifying substances**
♦ Emissions of NOx and SOxConditions ♦ Exceedance of critical loads of pH in water & soil**
♦ Concentrations in acid precipitationResponses ♦ % of car fleet equipped with catalytic converters**
Acidification
♦ Capacity of SOx and NOx abatement equipment of stationary sources**Pressures ♦ Emissions of heavy metals**; of organic compounds**
♦ Consumption of pesticidesConditions ♦ Concentr. of heavy metals & org. compounds in environmental media &
in living species**♦ Concentration of heavy metals in rivers
Responses ♦ Changes of toxic contents in products and production processes**
Toxiccontamination
♦ Market share of unleaded petrolPressures ♦ Urban air emissions (SOx, NOx, VOC)**
♦ Urban traffic density (or national); Urban car ownership (or national)♦ Degree of urbanisation (urban population growth rates, urban land)
Conditions ♦ Population exposure to air pollution, to noise**♦ Concentrations of air pollutants♦ Ambient water conditions in urban areas**
Responses ♦ Green space** (Areas protected from urban development)♦ Economic, fiscal and regulatory instruments**
Urbanenvironmentalquality
♦ Water treatment and noise abatement expenditurePressures ♦ Habitat alteration and land conversion from natural state**Conditions ♦ Threatened or extinct species as a share of total species known**
♦ Area of key ecosystems**Responses ♦ Protected areas as % of national territory, and by type of ecosystem**
Biodiversity
♦ Protected speciesCultural landscapes Indicators to be further developed
Pressures ♦ Generation of waste** (municipal, industrial, hazardous, nuclear)♦ Movements of hazardous waste
Responses ♦ Waste minimisation** (to be further developed)♦ Recycling rates
Waste
♦ Economic and fiscal instruments, expendituresPressures ♦ Intensity of use of water resources**Conditions ♦ Frequency, duration and extent of water shortages**
Waterresources
Responses ♦ Water prices and user charges for sewage treatment**Pressures ♦ Intensity of forest resource use**Conditions ♦ Area, volume and structure of forests**
Forestresources
Responses ♦ Forest area management and protection**Pressures ♦ Fish catches**Conditions ♦ Size of spawning stocks**
Fish resources
Responses ♦ Fishing quotas**Pressures ♦ Erosion risks: potential and actual use of land for agriculture**
♦ Change in land useConditions ♦ Degree of top soil losses**
Soildegradation(desertification& erosion)
Responses ♦ Rehabilitated areas**Materialresources(new issue)
Pressures ♦ Intensity of use of material resourcesIndicators to be further developed on the basis of MFA
����������������� ���������� �� ������
��������������� ��������������� ��� ���������������� ����
Climate change 1. CO2 emission intensities Index of greenhouse gas emissions
2.Ozone layer Indices of apparent consumption of ozonedepleting substances (ODS)
Same, plus aggregation into one index ofapparent consumption of ODS
Air quality 3. SOx and NOx emission intensities Population exposure to air pollution
4.Waste generation Municipal waste generation intensities Total waste generation intensities,Indicators derived from material flowaccounting
Freshwater quality 5. Waste water treatment connection rates Pollution loads to water bodies
��������������������
6.Freshwaterresources
Intensity of use of water resources Same plus sub-national breakdown
Forest resources 7. Intensity of use of forest resources Same
Fish resources 8. Intensity of use of fish resources Same plus closer link to available resources
Energy resources 9. Intensity of energy use Energy efficiency index
Biodiversity 10. Threatened species Species and habitat or ecosystem diversityArea of key ecosystems
______________* indicators for which data are available for amajority of OECD countries and that arepresented in this report
______________** indicators that require further specificationand development (availability of basic datasets, underlying concepts and definitions).
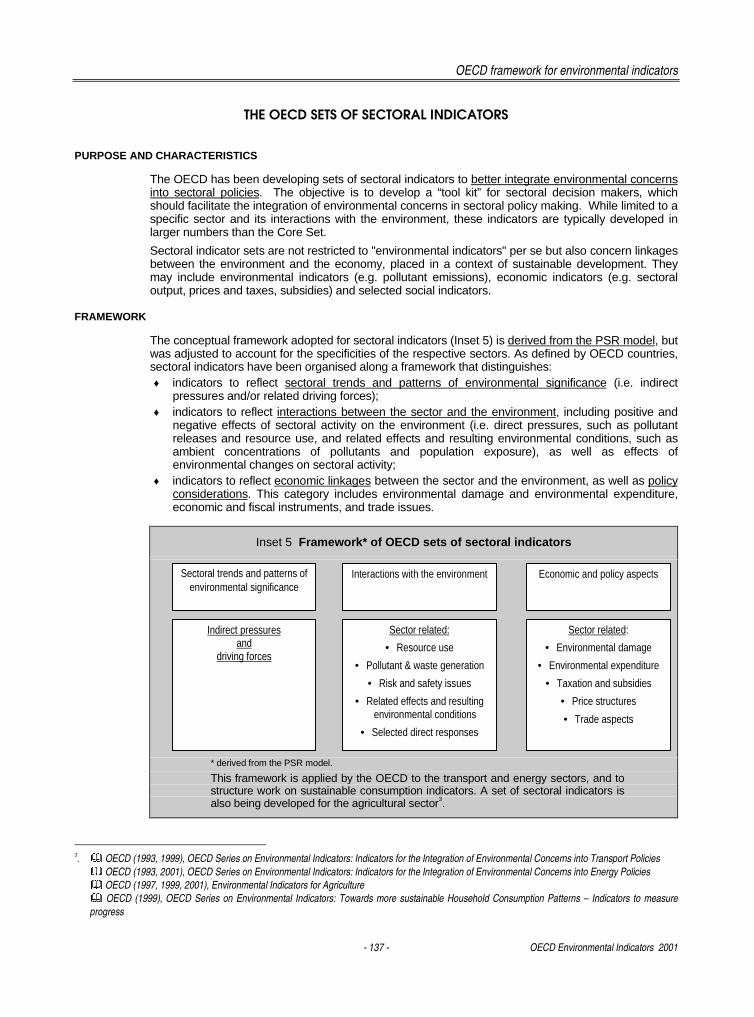
OECD framework for environmental indicators
- 137 - OECD Environmental Indicators 2001
THE OECD SETS OF SECTORAL INDICATORS
PURPOSE AND CHARACTERISTICS
The OECD has been developing sets of sectoral indicators to better integrate environmental concernsinto sectoral policies. The objective is to develop a “tool kit” for sectoral decision makers, whichshould facilitate the integration of environmental concerns in sectoral policy making. While limited to aspecific sector and its interactions with the environment, these indicators are typically developed inlarger numbers than the Core Set.
Sectoral indicator sets are not restricted to "environmental indicators" per se but also concern linkagesbetween the environment and the economy, placed in a context of sustainable development. Theymay include environmental indicators (e.g. pollutant emissions), economic indicators (e.g. sectoraloutput, prices and taxes, subsidies) and selected social indicators.
FRAMEWORK
The conceptual framework adopted for sectoral indicators (Inset 5) is derived from the PSR model, butwas adjusted to account for the specificities of the respective sectors. As defined by OECD countries,sectoral indicators have been organised along a framework that distinguishes:♦ indicators to reflect sectoral trends and patterns of environmental significance (i.e. indirect
pressures and/or related driving forces);♦ indicators to reflect interactions between the sector and the environment, including positive and
negative effects of sectoral activity on the environment (i.e. direct pressures, such as pollutantreleases and resource use, and related effects and resulting environmental conditions, such asambient concentrations of pollutants and population exposure), as well as effects ofenvironmental changes on sectoral activity;
♦ indicators to reflect economic linkages between the sector and the environment, as well as policyconsiderations. This category includes environmental damage and environmental expenditure,economic and fiscal instruments, and trade issues.
Inset 5 Framework* of OECD sets of sectoral indicators
* derived from the PSR model.
This framework is applied by the OECD to the transport and energy sectors, and tostructure work on sustainable consumption indicators. A set of sectoral indicators isalso being developed for the agricultural sector3.
3. � OECD (1993, 1999), OECD Series on Environmental Indicators: Indicators for the Integration of Environmental Concerns into Transport Policies� OECD (1993, 2001), OECD Series on Environmental Indicators: Indicators for the Integration of Environmental Concerns into Energy Policies� OECD (1997, 1999, 2001), Environmental Indicators for Agriculture� OECD (1999), OECD Series on Environmental Indicators: Towards more sustainable Household Consumption Patterns – Indicators to measureprogress
Economic and policy aspectsInteractions with the environmentSectoral trends and patterns ofenvironmental significance
Sector related:
• Environmental damage
• Environmental expenditure
• Taxation and subsidies
• Price structures
• Trade aspects
Sector related:
• Resource use
• Pollutant & waste generation
• Risk and safety issues
• Related effects and resultingenvironmental conditions
• Selected direct responses
Indirect pressuresand
driving forces
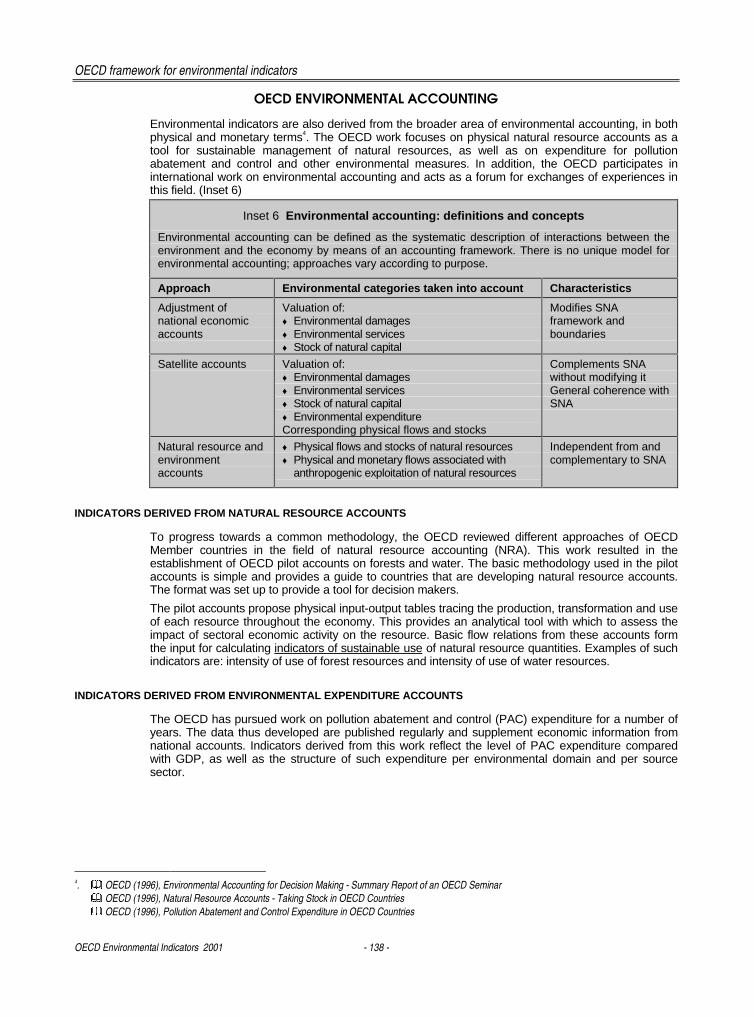
OECD framework for environmental indicators
OECD Environmental Indicators 2001 - 138 -
OECD ENVIRONMENTAL ACCOUNTING
Environmental indicators are also derived from the broader area of environmental accounting, in bothphysical and monetary terms4. The OECD work focuses on physical natural resource accounts as atool for sustainable management of natural resources, as well as on expenditure for pollutionabatement and control and other environmental measures. In addition, the OECD participates ininternational work on environmental accounting and acts as a forum for exchanges of experiences inthis field. (Inset 6)
Inset 6 Environmental accounting: definitions and concepts
Environmental accounting can be defined as the systematic description of interactions between theenvironment and the economy by means of an accounting framework. There is no unique model forenvironmental accounting; approaches vary according to purpose.
Approach Environmental categories taken into account Characteristics
Adjustment ofnational economicaccounts
Valuation of:♦ Environmental damages♦ Environmental services♦ Stock of natural capital
Modifies SNAframework andboundaries
Satellite accounts Valuation of:♦ Environmental damages♦ Environmental services♦ Stock of natural capital♦ Environmental expenditureCorresponding physical flows and stocks
Complements SNAwithout modifying itGeneral coherence withSNA
Natural resource andenvironmentaccounts
♦ Physical flows and stocks of natural resources♦ Physical and monetary flows associated with
anthropogenic exploitation of natural resources
Independent from andcomplementary to SNA
INDICATORS DERIVED FROM NATURAL RESOURCE ACCOUNTS
To progress towards a common methodology, the OECD reviewed different approaches of OECDMember countries in the field of natural resource accounting (NRA). This work resulted in theestablishment of OECD pilot accounts on forests and water. The basic methodology used in the pilotaccounts is simple and provides a guide to countries that are developing natural resource accounts.The format was set up to provide a tool for decision makers.
The pilot accounts propose physical input-output tables tracing the production, transformation and useof each resource throughout the economy. This provides an analytical tool with which to assess theimpact of sectoral economic activity on the resource. Basic flow relations from these accounts formthe input for calculating indicators of sustainable use of natural resource quantities. Examples of suchindicators are: intensity of use of forest resources and intensity of use of water resources.
INDICATORS DERIVED FROM ENVIRONMENTAL EXPENDITURE ACCOUNTS
The OECD has pursued work on pollution abatement and control (PAC) expenditure for a number ofyears. The data thus developed are published regularly and supplement economic information fromnational accounts. Indicators derived from this work reflect the level of PAC expenditure comparedwith GDP, as well as the structure of such expenditure per environmental domain and per sourcesector.
4. � OECD (1996), Environmental Accounting for Decision Making - Summary Report of an OECD Seminar� OECD (1996), Natural Resource Accounts - Taking Stock in OECD Countries� OECD (1996), Pollution Abatement and Control Expenditure in OECD Countries
OECD framework for environmental indicators
- 139 - OECD Environmental Indicators 2001
USING ENVIRONMENTAL INDICATORS
GUIDING PRINCIPLES
When using environmental indicators in analytical and evaluation work, the OECD applies thefollowing principles:
ONLY ONE TOOL
Indicators are only one tool for evaluation; scientific and policy-oriented interpretation is required forthem to acquire their full meaning. They often need to be supplemented by other qualitative andscientific information, particularly in explaining driving forces behind indicator changes which form thebasis for an assessment.
THE APPROPRIATE CONTEXT
Indicators’ relevance varies by country and by context. They must be reported and interpreted in theappropriate context, taking into account countries’ different ecological, geographical, social, economicand institutional features.
In the OECD environmental performance reviews, international indicators derived from the Core Setare generally used in combination with specific national indicators and data. These national indicatorsprovide a more detailed picture of the country’s situation through further sectoral and/or spatialbreakdown (e.g. sub-national data) and often point at particular issues of concern.
INTERCOUNTRY COMPARISON AND STANDARDISATION
OECD focuses on national indicators for use in international work. This implies not only nationallyaggregated indicators, but also an appropriate level of comparability among countries. Despite anumber of achievements in this area, further work is needed on internationally harmonised definitionsand concepts.
There is no single method of standardisation for the comparison of environmental indicators acrosscountries. The outcome of the assessment may depend on the chosen denominator (e.g. GDP,population, land area) as well as on national definitions and measurement methods. It is thereforeappropriate for different denominators to be used in parallel to balance the message conveyed. Insome cases absolute values may be the appropriate measure, for example when internationalcommitments are linked to absolute values.
MEASURABILITY
Measurability issues such as the quality of underlying data are important in the use of environmentalindicators, and must be taken into account to avoid misinterpretation.
Measurability still varies greatly among individual indicators. Some indicators are immediatelymeasurable, others need additional efforts before they can be published. For example, most indicatorsof societal responses have a shorter history than indicators of environmental pressures and manyindicators of environmental conditions, and are still in development both conceptually and in terms ofdata availability.
TIMELINESS
Another important criterion affecting the usefulness and relevance of an indicator is the timeliness ofthe underlying data. The interval between the period to which data refer and the date when data arereleased should be as short as is practicable. Current timeliness of environmental data remainsinsufficient and needs improvement as a matter of priority.
LEVEL OF AGGREGATION
Most OECD indicators focus on the national level and are designed to be used in an internationalcontext. Within a country a greater level of detail or breakdown may be needed, particularly whenindicators are to support sub-national or sectoral decision making or when national indicators hide majorregional differences. This is particularly important when dealing, for example, with river basin orecosystem management. The actual measurement of indicators at these levels is encouraged and lieswithin the responsibility of individual countries. At these levels, however, measurability andcomparability problems may be further exacerbated.
OECD framework for environmental indicators
OECD Environmental Indicators 2001 - 140 -
ENVIRONMENTAL INDICATORS AND PERFORMANCE ANALYSIS
In the OECD context, environmental indicators are used as a tool for evaluating environmentalperformance. They support the analysis made in OECD country environmental performance reviews5
and provide all reviews with a common denominator. This creates a synergy in which regularfeedback is provided on the indicators’ policy relevance and analytical soundness.
Using environmental indicators in environmental performance reviews implies linking these indicatorsto the measurement and analysis of achievements, as well as to underlying driving forces and to thecountry’s specific conditions. Indicators can be linked to:♦ explicit quantitative objectives (goals, targets, commitments);♦ broad qualitative objectives concerning, for example:
− efficiency of human activities (linked to the notions of decoupling, elasticities, integration);
− sustainability of natural resource use and development.
It is important to recognise, however, that indicators are not a mechanical measure of environmentalperformance. They need to be complemented with background information, analysis andinterpretation.
5. The OECD Environmental Performance Review Programme, assesses Member countries’ performance by comparing achievements or progress with
national objectives and international commitments. The reviews take into account each country’s absolute levels of environmental quality and thephysical, human and economic context.� OECD, Environmental Performance Reviews. 4 reviews published each year. First cycle reviews published: Australia, Austria, Belgium, Belarus,Bulgaria, Canada, Czech Republic, Denmark, Finland, France, Germany, Greece, Hungary, Iceland, Italy, Ireland, Japan, Korea, Luxembourg, Mexico,Netherlands, New Zealand, Norway, Poland, Portugal, Russian Federation, Spain, Sweden, Switzerland, Turkey, United Kingdom, United States.Second cycle reviews already published: Germany, Iceland.
- 141 -
���������������
Technical Annex
OECD Environmental Indicators 2001 - 142 -
GENERAL INFORMATIONCountry region codes used are as follows:
CAN: CanadaMEX: MexicoUSA: United StatesJPN: JapanKOR: KoreaAUS: AustraliaNZL: New ZealandAUT: AustriaBEL: BelgiumCZE: Czech RepublicDNK: Denmark
*: Data including western Germany only
FIN: FinlandFRA: FranceDEU: GermanywDEU: western GermanyGRC: GreeceHUN: HungaryISL: IcelandIRL: IrelandITA: ItalyLUX: LuxembourgNLD: Netherlands
NOR: NorwayPOL: PolandPRT: PortugalESP: SpainSWE: SwedenCHE: SwitzerlandTUR: TurkeyUKD: United KingdomDAC: OECD Development Assistance
Committee Member countries
� Country aggregates
OECD: All OECD Member countries, which include the OECD Europe — i.e. countries of the European Union (EU) plus Czech Republic, Hungary,Iceland, Norway, Poland, Switzerland and Turkey — plus Canada, Mexico, the United States, Japan, Korea, Australia and New Zealand.
OECD* All OECD Member countries except eastern Germany.OECD** Partial OECD total.
� Signs
..; n.a. not available- nil or negligible
. decimal pointn. app. not applicable
% percentageUSD US dollar
� Abbreviations
BOD - biochemical oxygen demandCap - capitaCFC - chlorofluorocarbonCO - carbon monoxideCO2 - carbon dioxideCH4 - methaneDAC - Development Assistance CommitteeGCV - gross calorific valueGDP - gross domestic productGNP - gross national productGHG - greenhouse gas
HCFC - hydrochlorofluorocarbonHM - heavy metalInh - inhabitantkcal - kilocaloriel - litreMtoe - million tonnes of oil equivalentN - nitrogenN2O - nitrous oxideNOx - nitrogen oxidesNMVOC - non-methane volatile organic
compounds
ODA - official development assistancePAC - pollution abatement & controlPCB - polychlorinated biphenylsPFC - private final consumptionPop - populationppb - parts per billionPPP - purchasing power paritiesppt - parts per trillionSOx - sulphur oxidest - tonneveh-km - vehicle-kilometre
� Units
cal - calorie (1 cal = 4.1868 joules)Dobson - see Ozone Layer Depletion notesg - gram (1 g = 0.0353 ounces)µg - microgram (1 µg = 10-6 g)mg - milligram (1 mg = 10-3 g)ha - hectare (1 ha = 0.01 km2)kg - kilogram
(1 kg = 1 000 g = 2.2046 pounds)
kWh - kilowatt hour(1 kWh = 103 Wh = 0.8598kilocalories)
litre - (1 l = 1 dm3 = 0.001 m3)km - kilometre
(1 km = 1 000 m. = 0.6214 miles)km2 - square kilometre
(1 km2 = 0.3861 square miles)
m3 - cubic metre (1 m3 = 1.3079 cubicyards)
Toe - tonne of oil equivalent(1 Toe = 107 kcal = 41.868*109 joules)
tonne - metric ton(1 t = 1 000 kg = 0.9842 long ton= 1.1023 short ton)
� Per capita values
All per capita information uses OECD and Food and Agriculture Organization (FAO) population data.
� Per unit of GDP values
All per unit of GDP information uses OECD GDP data at 1991 prices and purchasing power parties (PPPs). The use of PPPs appears preferableto the use of exchange rates in conjunction with environmental questions, as the objective of comparing measures of economic activity such asGDP is to reflect underlying volumes and physical processes as closely as possible.
PPPs are defined as the ratio between the amount of national currency and the amount of a reference currency needed to buy the same bundle ofconsumption goods in the two countries. In this publication, the reference currency is USD. Typically, PPPs differ from exchange rates as thelatter reflect not only relative prices of consumer goods but also a host of other factors, including international capital movements, interest ratedifferentials and government intervention. As a consequence, exchange rates exhibit much greater variations over time than PPPs.
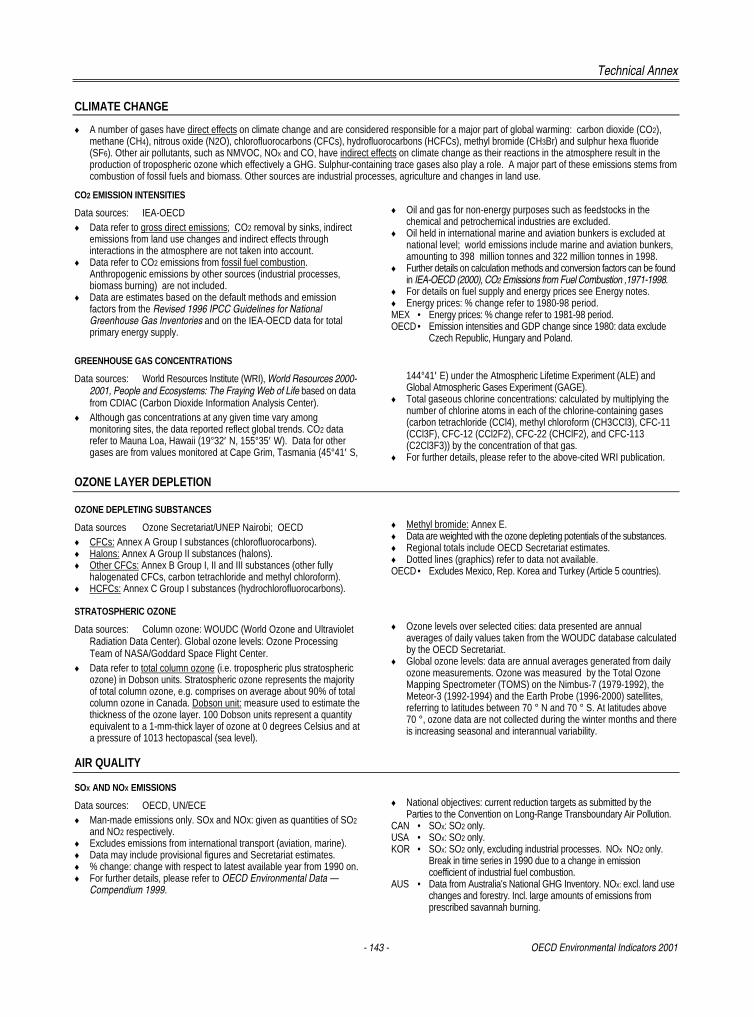
Technical Annex
- 143 - OECD Environmental Indicators 2001
CLIMATE CHANGE
♦ A number of gases have direct effects on climate change and are considered responsible for a major part of global warming: carbon dioxide (CO2),methane (CH4), nitrous oxide (N2O), chlorofluorocarbons (CFCs), hydrofluorocarbons (HCFCs), methyl bromide (CH3Br) and sulphur hexa fluoride(SF6). Other air pollutants, such as NMVOC, NOx and CO, have indirect effects on climate change as their reactions in the atmosphere result in theproduction of tropospheric ozone which effectively a GHG. Sulphur-containing trace gases also play a role. A major part of these emissions stems fromcombustion of fossil fuels and biomass. Other sources are industrial processes, agriculture and changes in land use.
CO2 EMISSION INTENSITIES
Data sources: IEA-OECD♦ Data refer to gross direct emissions; CO2 removal by sinks, indirect
emissions from land use changes and indirect effects throughinteractions in the atmosphere are not taken into account.
♦ Data refer to CO2 emissions from fossil fuel combustion.Anthropogenic emissions by other sources (industrial processes,biomass burning) are not included.
♦ Data are estimates based on the default methods and emissionfactors from the Revised 1996 IPCC Guidelines for NationalGreenhouse Gas Inventories and on the IEA-OECD data for totalprimary energy supply.
♦ Oil and gas for non-energy purposes such as feedstocks in thechemical and petrochemical industries are excluded.
♦ Oil held in international marine and aviation bunkers is excluded atnational level; world emissions include marine and aviation bunkers,amounting to 398 million tonnes and 322 million tonnes in 1998.
♦ Further details on calculation methods and conversion factors can be foundin IEA-OECD (2000), CO2 Emissions from Fuel Combustion ,1971-1998.
♦ For details on fuel supply and energy prices see Energy notes.♦ Energy prices: % change refer to 1980-98 period.MEX • Energy prices: % change refer to 1981-98 period.OECD • Emission intensities and GDP change since 1980: data exclude
Czech Republic, Hungary and Poland.
GREENHOUSE GAS CONCENTRATIONS
Data sources: World Resources Institute (WRI), World Resources 2000-2001, People and Ecosystems: The Fraying Web of Life based on datafrom CDIAC (Carbon Dioxide Information Analysis Center).
♦ Although gas concentrations at any given time vary amongmonitoring sites, the data reported reflect global trends. CO2 datarefer to Mauna Loa, Hawaii (19°32′ N, 155°35′ W). Data for othergases are from values monitored at Cape Grim, Tasmania (45°41′ S,
144°41′ E) under the Atmospheric Lifetime Experiment (ALE) andGlobal Atmospheric Gases Experiment (GAGE).
♦ Total gaseous chlorine concentrations: calculated by multiplying thenumber of chlorine atoms in each of the chlorine-containing gases(carbon tetrachloride (CCl4), methyl chloroform (CH3CCl3), CFC-11(CCl3F), CFC-12 (CCl2F2), CFC-22 (CHClF2), and CFC-113(C2Cl3F3)) by the concentration of that gas.
♦ For further details, please refer to the above-cited WRI publication.
OZONE LAYER DEPLETION
OZONE DEPLETING SUBSTANCES
Data sources Ozone Secretariat/UNEP Nairobi; OECD♦ CFCs: Annex A Group I substances (chlorofluorocarbons).♦ Halons: Annex A Group II substances (halons).♦ Other CFCs: Annex B Group I, II and III substances (other fully
halogenated CFCs, carbon tetrachloride and methyl chloroform).♦ HCFCs: Annex C Group I substances (hydrochlorofluorocarbons).
♦ Methyl bromide: Annex E.♦ Data are weighted with the ozone depleting potentials of the substances.♦ Regional totals include OECD Secretariat estimates.♦ Dotted lines (graphics) refer to data not available.OECD • Excludes Mexico, Rep. Korea and Turkey (Article 5 countries).
STRATOSPHERIC OZONE
Data sources: Column ozone: WOUDC (World Ozone and UltravioletRadiation Data Center). Global ozone levels: Ozone ProcessingTeam of NASA/Goddard Space Flight Center.
♦ Data refer to total column ozone (i.e. tropospheric plus stratosphericozone) in Dobson units. Stratospheric ozone represents the majorityof total column ozone, e.g. comprises on average about 90% of totalcolumn ozone in Canada. Dobson unit: measure used to estimate thethickness of the ozone layer. 100 Dobson units represent a quantityequivalent to a 1-mm-thick layer of ozone at 0 degrees Celsius and ata pressure of 1013 hectopascal (sea level).
♦ Ozone levels over selected cities: data presented are annualaverages of daily values taken from the WOUDC database calculatedby the OECD Secretariat.
♦ Global ozone levels: data are annual averages generated from dailyozone measurements. Ozone was measured by the Total OzoneMapping Spectrometer (TOMS) on the Nimbus-7 (1979-1992), theMeteor-3 (1992-1994) and the Earth Probe (1996-2000) satellites,referring to latitudes between 70 ° N and 70 ° S. At latitudes above70 °, ozone data are not collected during the winter months and thereis increasing seasonal and interannual variability.
AIR QUALITY
SOX AND NOX
EMISSIONS
Data sources: OECD, UN/ECE♦ Man-made emissions only. SOx and NOx: given as quantities of SO2
and NO2 respectively.♦ Excludes emissions from international transport (aviation, marine).♦ Data may include provisional figures and Secretariat estimates.♦ % change: change with respect to latest available year from 1990 on.♦ For further details, please refer to OECD Environmental Data —
Compendium 1999.
♦ National objectives: current reduction targets as submitted by theParties to the Convention on Long-Range Transboundary Air Pollution.
CAN • SOx: SO2 only.USA • SOx: SO2 only.KOR • SOx: SO2 only, excluding industrial processes. NOx NO2 only.
Break in time series in 1990 due to a change in emissioncoefficient of industrial fuel combustion.
AUS • Data from Australia's National GHG Inventory. NOx: excl. land usechanges and forestry. Incl. large amounts of emissions fromprescribed savannah burning.
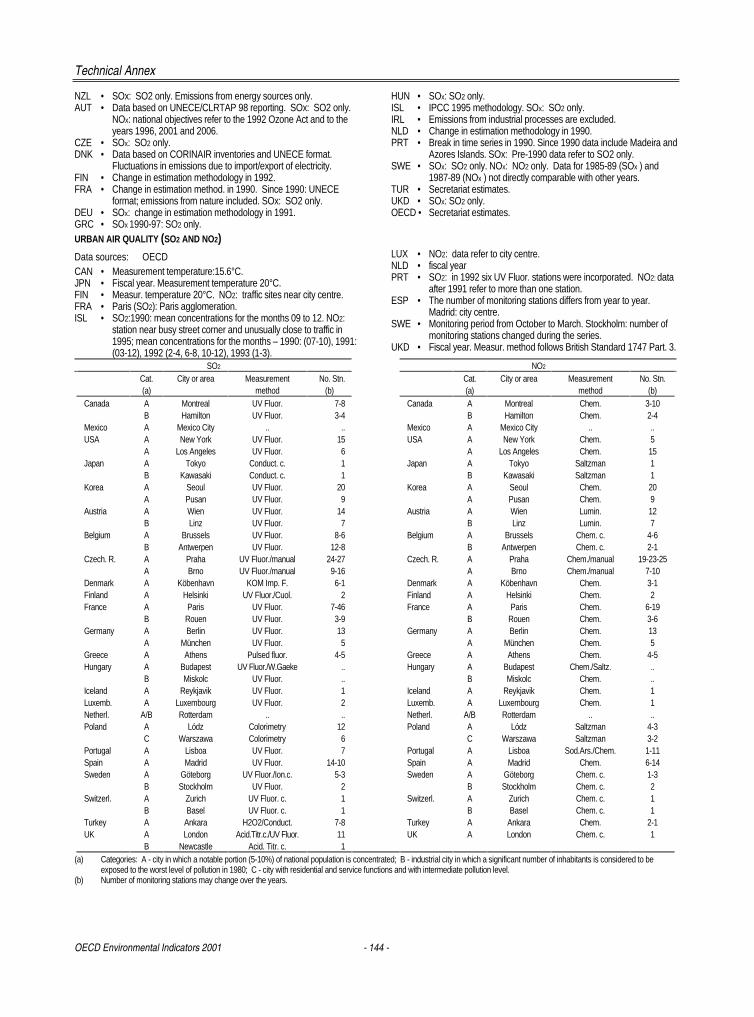
Technical Annex
OECD Environmental Indicators 2001 - 144 -
NZL • SOx: SO2 only. Emissions from energy sources only.AUT • Data based on UNECE/CLRTAP 98 reporting. SOx: SO2 only.
NOx: national objectives refer to the 1992 Ozone Act and to theyears 1996, 2001 and 2006.
CZE • SOx: SO2 only.DNK • Data based on CORINAIR inventories and UNECE format.
Fluctuations in emissions due to import/export of electricity.FIN • Change in estimation methodology in 1992.FRA • Change in estimation method. in 1990. Since 1990: UNECE
format; emissions from nature included. SOx: SO2 only.DEU • SOx: change in estimation methodology in 1991.GRC • SOx 1990-97: SO2 only.
HUN • SOx: SO2 only.ISL • IPCC 1995 methodology. SOx: SO2 only.IRL • Emissions from industrial processes are excluded.NLD • Change in estimation methodology in 1990.PRT • Break in time series in 1990. Since 1990 data include Madeira and
Azores Islands. SOx: Pre-1990 data refer to SO2 only.SWE • SOx: SO2 only. NOx: NO2 only. Data for 1985-89 (SOx ) and
1987-89 (NOx ) not directly comparable with other years.TUR • Secretariat estimates.UKD • SOx: SO2 only.OECD • Secretariat estimates.
URBAN AIR QUALITY (SO2 AND NO2)Data sources: OECDCAN • Measurement temperature:15.6°C.JPN • Fiscal year. Measurement temperature 20°C.FIN • Measur. temperature 20°C. NO2: traffic sites near city centre.FRA • Paris (SO2): Paris agglomeration.ISL • SO2:1990: mean concentrations for the months 09 to 12. NO2:
station near busy street corner and unusually close to traffic in1995; mean concentrations for the months – 1990: (07-10), 1991:(03-12), 1992 (2-4, 6-8, 10-12), 1993 (1-3).
LUX • NO2: data refer to city centre.NLD • fiscal yearPRT • SO2: in 1992 six UV Fluor. stations were incorporated. NO2: data
after 1991 refer to more than one station.ESP • The number of monitoring stations differs from year to year.
Madrid: city centre.SWE • Monitoring period from October to March. Stockholm: number of
monitoring stations changed during the series.UKD • Fiscal year. Measur. method follows British Standard 1747 Part. 3.
SO2 NO2
Cat.(a)
City or area Measurementmethod
No. Stn.(b)
Cat.(a)
City or area Measurementmethod
No. Stn.(b)
Canada A Montreal UV Fluor. 7-8 Canada A Montreal Chem. 3-10B Hamilton UV Fluor. 3-4 B Hamilton Chem. 2-4
Mexico A Mexico City .. .. Mexico A Mexico City .. ..USA A New York UV Fluor. 15 USA A New York Chem. 5
A Los Angeles UV Fluor. 6 A Los Angeles Chem. 15Japan A Tokyo Conduct. c. 1 Japan A Tokyo Saltzman 1
B Kawasaki Conduct. c. 1 B Kawasaki Saltzman 1Korea A Seoul UV Fluor. 20 Korea A Seoul Chem. 20
A Pusan UV Fluor. 9 A Pusan Chem. 9Austria A Wien UV Fluor. 14 Austria A Wien Lumin. 12
B Linz UV Fluor. 7 B Linz Lumin. 7Belgium A Brussels UV Fluor. 8-6 Belgium A Brussels Chem. c. 4-6
B Antwerpen UV Fluor. 12-8 B Antwerpen Chem. c. 2-1Czech. R. A Praha UV Fluor./manual 24-27 Czech. R. A Praha Chem./manual 19-23-25
A Brno UV Fluor./manual 9-16 A Brno Chem./manual 7-10Denmark A Köbenhavn KOM Imp. F. 6-1 Denmark A Köbenhavn Chem. 3-1Finland A Helsinki UV Fluor./Cuol. 2 Finland A Helsinki Chem. 2France A Paris UV Fluor. 7-46 France A Paris Chem. 6-19
B Rouen UV Fluor. 3-9 B Rouen Chem. 3-6Germany A Berlin UV Fluor. 13 Germany A Berlin Chem. 13
A München UV Fluor. 5 A München Chem. 5Greece A Athens Pulsed fluor. 4-5 Greece A Athens Chem. 4-5Hungary A Budapest UV Fluor./W.Gaeke .. Hungary A Budapest Chem./Saltz. ..
B Miskolc UV Fluor. .. B Miskolc Chem. ..Iceland A Reykjavik UV Fluor. 1 Iceland A Reykjavik Chem. 1Luxemb. A Luxembourg UV Fluor. 2 Luxemb. A Luxembourg Chem. 1Netherl. A/B Rotterdam .. .. Netherl. A/B Rotterdam .. ..Poland A Lódz Colorimetry 12 Poland A Lódz Saltzman 4-3
C Warszawa Colorimetry 6 C Warszawa Saltzman 3-2Portugal A Lisboa UV Fluor. 7 Portugal A Lisboa Sod.Ars./Chem. 1-11Spain A Madrid UV Fluor. 14-10 Spain A Madrid Chem. 6-14Sweden A Göteborg UV Fluor./Ion.c. 5-3 Sweden A Göteborg Chem. c. 1-3
B Stockholm UV Fluor. 2 B Stockholm Chem. c. 2Switzerl. A Zurich UV Fluor. c. 1 Switzerl. A Zurich Chem. c. 1
B Basel UV Fluor. c. 1 B Basel Chem. c. 1Turkey A Ankara H2O2/Conduct. 7-8 Turkey A Ankara Chem. 2-1UK A London Acid.Titr.c./UV Fluor. 11 UK A London Chem. c. 1
B Newcastle Acid. Titr. c. 1(a) Categories: A - city in which a notable portion (5-10%) of national population is concentrated; B - industrial city in which a significant number of inhabitants is considered to be
exposed to the worst level of pollution in 1980; C - city with residential and service functions and with intermediate pollution level.(b) Number of monitoring stations may change over the years.
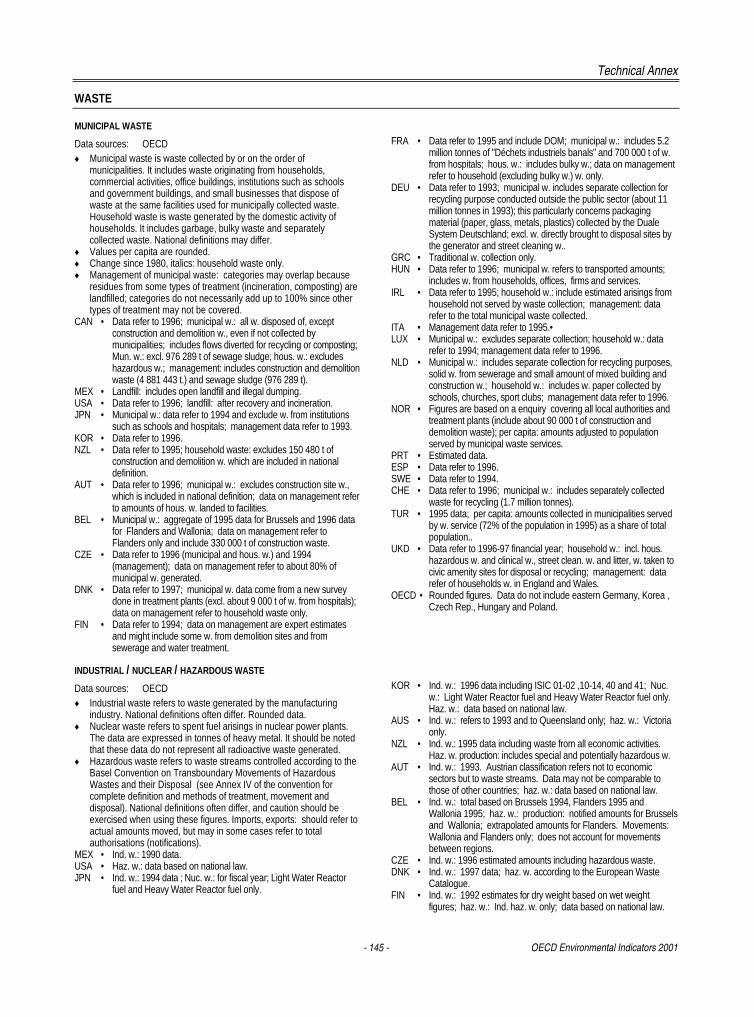
Technical Annex
- 145 - OECD Environmental Indicators 2001
WASTE
MUNICIPAL WASTE
Data sources: OECD♦ Municipal waste is waste collected by or on the order of
municipalities. It includes waste originating from households,commercial activities, office buildings, institutions such as schoolsand government buildings, and small businesses that dispose ofwaste at the same facilities used for municipally collected waste.Household waste is waste generated by the domestic activity ofhouseholds. It includes garbage, bulky waste and separatelycollected waste. National definitions may differ.
♦ Values per capita are rounded.♦ Change since 1980, italics: household waste only.♦ Management of municipal waste: categories may overlap because
residues from some types of treatment (incineration, composting) arelandfilled; categories do not necessarily add up to 100% since othertypes of treatment may not be covered.
CAN • Data refer to 1996; municipal w.: all w. disposed of, exceptconstruction and demolition w., even if not collected bymunicipalities; includes flows diverted for recycling or composting;Mun. w.: excl. 976 289 t of sewage sludge; hous. w.: excludeshazardous w.; management: includes construction and demolitionwaste (4 881 443 t.) and sewage sludge (976 289 t).
MEX • Landfill: includes open landfill and illegal dumping.USA • Data refer to 1996; landfill: after recovery and incineration.JPN • Municipal w.: data refer to 1994 and exclude w. from institutions
such as schools and hospitals; management data refer to 1993.KOR • Data refer to 1996.NZL • Data refer to 1995; household waste: excludes 150 480 t of
construction and demolition w. which are included in nationaldefinition.
AUT • Data refer to 1996; municipal w.: excludes construction site w.,which is included in national definition; data on management referto amounts of hous. w. landed to facilities.
BEL • Municipal w.: aggregate of 1995 data for Brussels and 1996 datafor Flanders and Wallonia; data on management refer toFlanders only and include 330 000 t of construction waste.
CZE • Data refer to 1996 (municipal and hous. w.) and 1994(management); data on management refer to about 80% ofmunicipal w. generated.
DNK • Data refer to 1997; municipal w. data come from a new surveydone in treatment plants (excl. about 9 000 t of w. from hospitals);data on management refer to household waste only.
FIN • Data refer to 1994; data on management are expert estimatesand might include some w. from demolition sites and fromsewerage and water treatment.
FRA • Data refer to 1995 and include DOM; municipal w.: includes 5.2million tonnes of "Déchets industriels banals" and 700 000 t of w.from hospitals; hous. w.: includes bulky w.; data on managementrefer to household (excluding bulky w.) w. only.
DEU • Data refer to 1993; municipal w. includes separate collection forrecycling purpose conducted outside the public sector (about 11million tonnes in 1993); this particularly concerns packagingmaterial (paper, glass, metals, plastics) collected by the DualeSystem Deutschland; excl. w. directly brought to disposal sites bythe generator and street cleaning w..
GRC • Traditional w. collection only.HUN • Data refer to 1996; municipal w. refers to transported amounts;
includes w. from households, offices, firms and services.IRL • Data refer to 1995; household w.: include estimated arisings from
household not served by waste collection; management: datarefer to the total municipal waste collected.
ITA • Management data refer to 1995.•LUX • Municipal w.: excludes separate collection; household w.: data
refer to 1994; management data refer to 1996.NLD • Municipal w.: includes separate collection for recycling purposes,
solid w. from sewerage and small amount of mixed building andconstruction w.; household w.: includes w. paper collected byschools, churches, sport clubs; management data refer to 1996.
NOR • Figures are based on a enquiry covering all local authorities andtreatment plants (include about 90 000 t of construction anddemolition waste); per capita: amounts adjusted to populationserved by municipal waste services.
PRT • Estimated data.ESP • Data refer to 1996.SWE • Data refer to 1994.CHE • Data refer to 1996; municipal w.: includes separately collected
waste for recycling (1.7 million tonnes).TUR • 1995 data; per capita: amounts collected in municipalities served
by w. service (72% of the population in 1995) as a share of totalpopulation..
UKD • Data refer to 1996-97 financial year; household w.: incl. hous.hazardous w. and clinical w., street clean. w. and litter, w. taken tocivic amenity sites for disposal or recycling; management: datarefer of households w. in England and Wales.
OECD • Rounded figures. Data do not include eastern Germany, Korea ,Czech Rep., Hungary and Poland.
INDUSTRIAL / NUCLEAR / HAZARDOUS WASTE
Data sources: OECD♦ Industrial waste refers to waste generated by the manufacturing
industry. National definitions often differ. Rounded data.♦ Nuclear waste refers to spent fuel arisings in nuclear power plants.
The data are expressed in tonnes of heavy metal. It should be notedthat these data do not represent all radioactive waste generated.
♦ Hazardous waste refers to waste streams controlled according to theBasel Convention on Transboundary Movements of HazardousWastes and their Disposal (see Annex IV of the convention forcomplete definition and methods of treatment, movement anddisposal). National definitions often differ, and caution should beexercised when using these figures. Imports, exports: should refer toactual amounts moved, but may in some cases refer to totalauthorisations (notifications).
MEX • Ind. w.: 1990 data.USA • Haz. w.: data based on national law.JPN • Ind. w.: 1994 data ; Nuc. w.: for fiscal year; Light Water Reactor
fuel and Heavy Water Reactor fuel only.
KOR • Ind. w.: 1996 data including ISIC 01-02 ,10-14, 40 and 41; Nuc.w.: Light Water Reactor fuel and Heavy Water Reactor fuel only.Haz. w.: data based on national law.
AUS • Ind. w.: refers to 1993 and to Queensland only; haz. w.: Victoriaonly.
NZL • Ind. w.: 1995 data including waste from all economic activities.Haz. w. production: includes special and potentially hazardous w.
AUT • Ind. w.: 1993. Austrian classification refers not to economicsectors but to waste streams. Data may not be comparable tothose of other countries; haz. w.: data based on national law.
BEL • Ind. w.: total based on Brussels 1994, Flanders 1995 andWallonia 1995; haz. w.: production: notified amounts for Brusselsand Wallonia; extrapolated amounts for Flanders. Movements:Wallonia and Flanders only; does not account for movementsbetween regions.
CZE • Ind. w.: 1996 estimated amounts including hazardous waste.DNK • Ind. w.: 1997 data; haz. w. according to the European Waste
Catalogue.FIN • Ind. w.: 1992 estimates for dry weight based on wet weight
figures; haz. w.: Ind. haz. w. only; data based on national law.
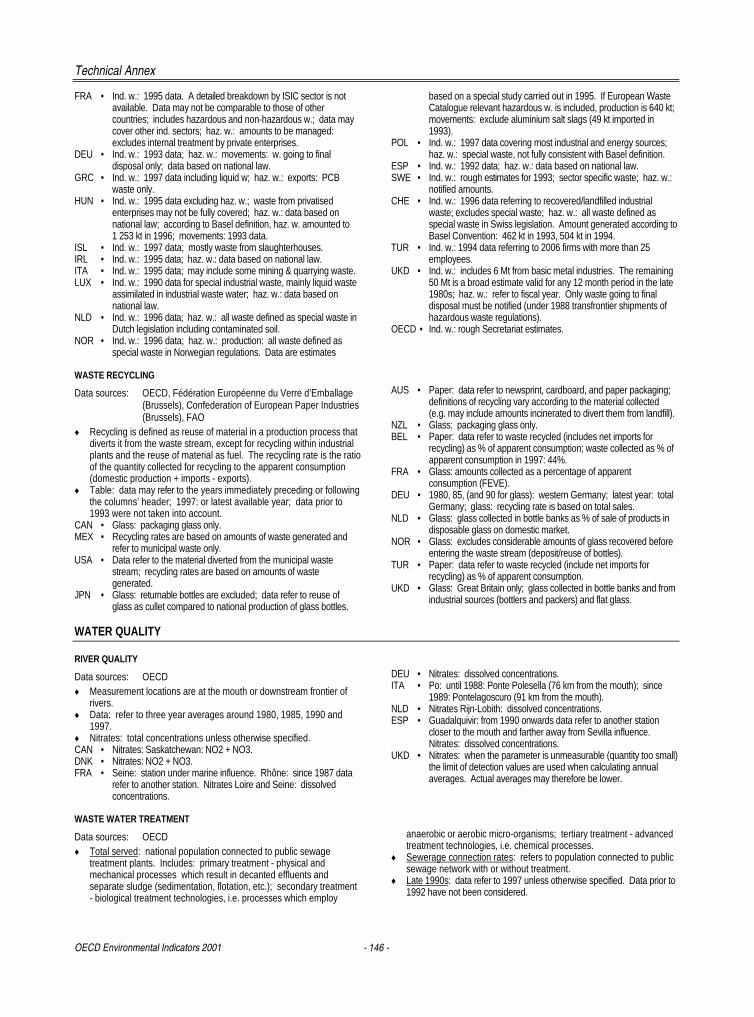
Technical Annex
OECD Environmental Indicators 2001 - 146 -
FRA • Ind. w.: 1995 data. A detailed breakdown by ISIC sector is notavailable. Data may not be comparable to those of othercountries; includes hazardous and non-hazardous w.; data maycover other ind. sectors; haz. w.: amounts to be managed:excludes internal treatment by private enterprises.
DEU • Ind. w.: 1993 data; haz. w.: movements: w. going to finaldisposal only; data based on national law.
GRC • Ind. w.: 1997 data including liquid w; haz. w.: exports: PCBwaste only.
HUN • Ind. w.: 1995 data excluding haz. w.; waste from privatisedenterprises may not be fully covered; haz. w.: data based onnational law; according to Basel definition, haz. w. amounted to1 253 kt in 1996; movements: 1993 data.
ISL • Ind. w.: 1997 data; mostly waste from slaughterhouses.IRL • Ind. w.: 1995 data; haz. w.: data based on national law.ITA • Ind. w.: 1995 data; may include some mining & quarrying waste.LUX • Ind. w.: 1990 data for special industrial waste, mainly liquid waste
assimilated in industrial waste water; haz. w.: data based onnational law.
NLD • Ind. w.: 1996 data; haz. w.: all waste defined as special waste inDutch legislation including contaminated soil.
NOR • Ind. w.: 1996 data; haz. w.: production: all waste defined asspecial waste in Norwegian regulations. Data are estimates
based on a special study carried out in 1995. If European WasteCatalogue relevant hazardous w. is included, production is 640 kt;movements: exclude aluminium salt slags (49 kt imported in1993).
POL • Ind. w.: 1997 data covering most industrial and energy sources;haz. w.: special waste, not fully consistent with Basel definition.
ESP • Ind. w.: 1992 data; haz. w.: data based on national law.SWE • Ind. w.: rough estimates for 1993; sector specific waste; haz. w.:
notified amounts.CHE • Ind. w.: 1996 data referring to recovered/landfilled industrial
waste; excludes special waste; haz. w.: all waste defined asspecial waste in Swiss legislation. Amount generated according toBasel Convention: 462 kt in 1993, 504 kt in 1994.
TUR • Ind. w.: 1994 data referring to 2006 firms with more than 25employees.
UKD • Ind. w.: includes 6 Mt from basic metal industries. The remaining50 Mt is a broad estimate valid for any 12 month period in the late1980s; haz. w.: refer to fiscal year. Only waste going to finaldisposal must be notified (under 1988 transfrontier shipments ofhazardous waste regulations).
OECD • Ind. w.: rough Secretariat estimates.
WASTE RECYCLING
Data sources: OECD, Fédération Européenne du Verre d’Emballage(Brussels), Confederation of European Paper Industries(Brussels), FAO
♦ Recycling is defined as reuse of material in a production process thatdiverts it from the waste stream, except for recycling within industrialplants and the reuse of material as fuel. The recycling rate is the ratioof the quantity collected for recycling to the apparent consumption(domestic production + imports - exports).
♦ Table: data may refer to the years immediately preceding or followingthe columns’ header; 1997: or latest available year; data prior to1993 were not taken into account.
CAN • Glass: packaging glass only.MEX • Recycling rates are based on amounts of waste generated and
refer to municipal waste only.USA • Data refer to the material diverted from the municipal waste
stream; recycling rates are based on amounts of wastegenerated.
JPN • Glass: returnable bottles are excluded; data refer to reuse ofglass as cullet compared to national production of glass bottles.
AUS • Paper: data refer to newsprint, cardboard, and paper packaging;definitions of recycling vary according to the material collected(e.g. may include amounts incinerated to divert them from landfill).
NZL • Glass: packaging glass only.BEL • Paper: data refer to waste recycled (includes net imports for
recycling) as % of apparent consumption; waste collected as % ofapparent consumption in 1997: 44%.
FRA • Glass: amounts collected as a percentage of apparentconsumption (FEVE).
DEU • 1980, 85, (and 90 for glass): western Germany; latest year: totalGermany; glass: recycling rate is based on total sales.
NLD • Glass: glass collected in bottle banks as % of sale of products indisposable glass on domestic market.
NOR • Glass: excludes considerable amounts of glass recovered beforeentering the waste stream (deposit/reuse of bottles).
TUR • Paper: data refer to waste recycled (include net imports forrecycling) as % of apparent consumption.
UKD • Glass: Great Britain only; glass collected in bottle banks and fromindustrial sources (bottlers and packers) and flat glass.
WATER QUALITY
RIVER QUALITY
Data sources: OECD♦ Measurement locations are at the mouth or downstream frontier of
rivers.♦ Data: refer to three year averages around 1980, 1985, 1990 and
1997.♦ Nitrates: total concentrations unless otherwise specified.CAN • Nitrates: Saskatchewan: NO2 + NO3.DNK • Nitrates: NO2 + NO3.FRA • Seine: station under marine influence. Rhône: since 1987 data
refer to another station. Nitrates Loire and Seine: dissolvedconcentrations.
DEU • Nitrates: dissolved concentrations.ITA • Po: until 1988: Ponte Polesella (76 km from the mouth); since
1989: Pontelagoscuro (91 km from the mouth).NLD • Nitrates Rijn-Lobith: dissolved concentrations.ESP • Guadalquivir: from 1990 onwards data refer to another station
closer to the mouth and farther away from Sevilla influence.Nitrates: dissolved concentrations.
UKD • Nitrates: when the parameter is unmeasurable (quantity too small)the limit of detection values are used when calculating annualaverages. Actual averages may therefore be lower.
WASTE WATER TREATMENT
Data sources: OECD♦ Total served: national population connected to public sewage
treatment plants. Includes: primary treatment - physical andmechanical processes which result in decanted effluents andseparate sludge (sedimentation, flotation, etc.); secondary treatment- biological treatment technologies, i.e. processes which employ
anaerobic or aerobic micro-organisms; tertiary treatment - advancedtreatment technologies, i.e. chemical processes.
♦ Sewerage connection rates: refers to population connected to publicsewage network with or without treatment.
♦ Late 1990s: data refer to 1997 unless otherwise specified. Data prior to1992 have not been considered.
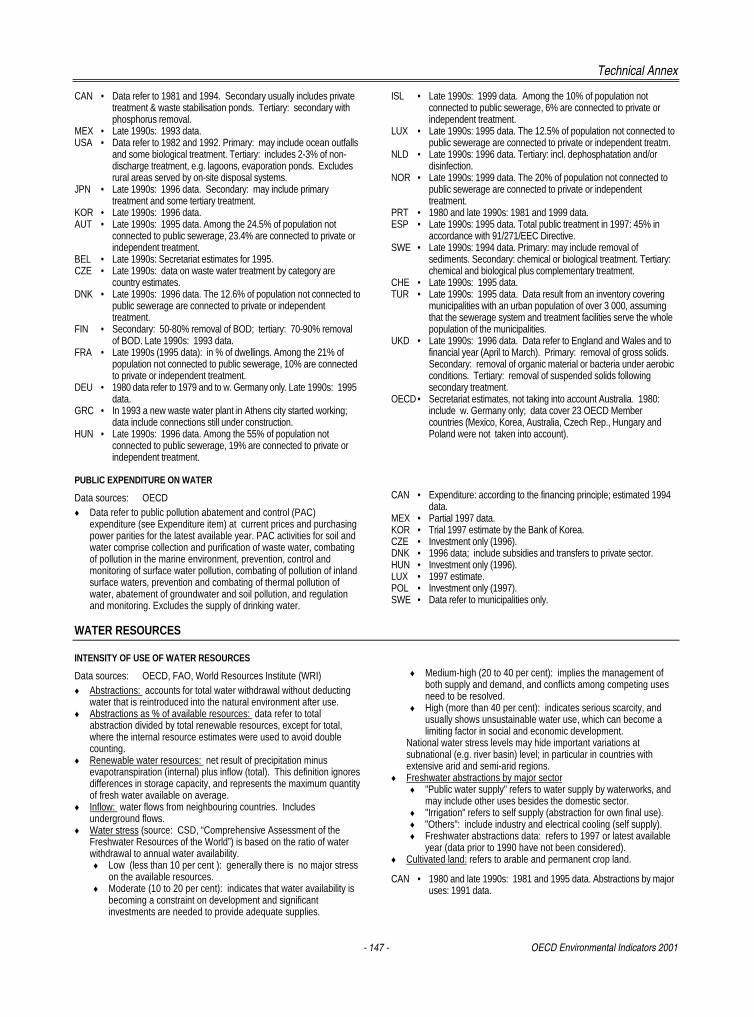
Technical Annex
- 147 - OECD Environmental Indicators 2001
CAN • Data refer to 1981 and 1994. Secondary usually includes privatetreatment & waste stabilisation ponds. Tertiary: secondary withphosphorus removal.
MEX • Late 1990s: 1993 data.USA • Data refer to 1982 and 1992. Primary: may include ocean outfalls
and some biological treatment. Tertiary: includes 2-3% of non-discharge treatment, e.g. lagoons, evaporation ponds. Excludesrural areas served by on-site disposal systems.
JPN • Late 1990s: 1996 data. Secondary: may include primarytreatment and some tertiary treatment.
KOR • Late 1990s: 1996 data.AUT • Late 1990s: 1995 data. Among the 24.5% of population not
connected to public sewerage, 23.4% are connected to private orindependent treatment.
BEL • Late 1990s: Secretariat estimates for 1995.CZE • Late 1990s: data on waste water treatment by category are
country estimates.DNK • Late 1990s: 1996 data. The 12.6% of population not connected to
public sewerage are connected to private or independenttreatment.
FIN • Secondary: 50-80% removal of BOD; tertiary: 70-90% removalof BOD. Late 1990s: 1993 data.
FRA • Late 1990s (1995 data): in % of dwellings. Among the 21% ofpopulation not connected to public sewerage, 10% are connectedto private or independent treatment.
DEU • 1980 data refer to 1979 and to w. Germany only. Late 1990s: 1995data.
GRC • In 1993 a new waste water plant in Athens city started working;data include connections still under construction.
HUN • Late 1990s: 1996 data. Among the 55% of population notconnected to public sewerage, 19% are connected to private orindependent treatment.
ISL • Late 1990s: 1999 data. Among the 10% of population notconnected to public sewerage, 6% are connected to private orindependent treatment.
LUX • Late 1990s: 1995 data. The 12.5% of population not connected topublic sewerage are connected to private or independent treatm.
NLD • Late 1990s: 1996 data. Tertiary: incl. dephosphatation and/ordisinfection.
NOR • Late 1990s: 1999 data. The 20% of population not connected topublic sewerage are connected to private or independenttreatment.
PRT • 1980 and late 1990s: 1981 and 1999 data.ESP • Late 1990s: 1995 data. Total public treatment in 1997: 45% in
accordance with 91/271/EEC Directive.SWE • Late 1990s: 1994 data. Primary: may include removal of
sediments. Secondary: chemical or biological treatment. Tertiary:chemical and biological plus complementary treatment.
CHE • Late 1990s: 1995 data.TUR • Late 1990s: 1995 data. Data result from an inventory covering
municipalities with an urban population of over 3 000, assumingthat the sewerage system and treatment facilities serve the wholepopulation of the municipalities.
UKD • Late 1990s: 1996 data. Data refer to England and Wales and tofinancial year (April to March). Primary: removal of gross solids.Secondary: removal of organic material or bacteria under aerobicconditions. Tertiary: removal of suspended solids followingsecondary treatment.
OECD • Secretariat estimates, not taking into account Australia. 1980:include w. Germany only; data cover 23 OECD Membercountries (Mexico, Korea, Australia, Czech Rep., Hungary andPoland were not taken into account).
PUBLIC EXPENDITURE ON WATER
Data sources: OECD♦ Data refer to public pollution abatement and control (PAC)
expenditure (see Expenditure item) at current prices and purchasingpower parities for the latest available year. PAC activities for soil andwater comprise collection and purification of waste water, combatingof pollution in the marine environment, prevention, control andmonitoring of surface water pollution, combating of pollution of inlandsurface waters, prevention and combating of thermal pollution ofwater, abatement of groundwater and soil pollution, and regulationand monitoring. Excludes the supply of drinking water.
CAN • Expenditure: according to the financing principle; estimated 1994data.
MEX • Partial 1997 data.KOR • Trial 1997 estimate by the Bank of Korea.CZE • Investment only (1996).DNK • 1996 data; include subsidies and transfers to private sector.HUN • Investment only (1996).LUX • 1997 estimate.POL • Investment only (1997).SWE • Data refer to municipalities only.
WATER RESOURCES
INTENSITY OF USE OF WATER RESOURCES
Data sources: OECD, FAO, World Resources Institute (WRI)♦ Abstractions: accounts for total water withdrawal without deducting
water that is reintroduced into the natural environment after use.♦ Abstractions as % of available resources: data refer to total
abstraction divided by total renewable resources, except for total,where the internal resource estimates were used to avoid doublecounting.
♦ Renewable water resources: net result of precipitation minusevapotranspiration (internal) plus inflow (total). This definition ignoresdifferences in storage capacity, and represents the maximum quantityof fresh water available on average.
♦ Inflow: water flows from neighbouring countries. Includesunderground flows.
♦ Water stress (source: CSD, “Comprehensive Assessment of theFreshwater Resources of the World”) is based on the ratio of waterwithdrawal to annual water availability.♦ Low (less than 10 per cent ): generally there is no major stress
on the available resources.♦ Moderate (10 to 20 per cent): indicates that water availability is
becoming a constraint on development and significantinvestments are needed to provide adequate supplies.
♦ Medium-high (20 to 40 per cent): implies the management ofboth supply and demand, and conflicts among competing usesneed to be resolved.
♦ High (more than 40 per cent): indicates serious scarcity, andusually shows unsustainable water use, which can become alimiting factor in social and economic development.
National water stress levels may hide important variations atsubnational (e.g. river basin) level; in particular in countries withextensive arid and semi-arid regions.
♦ Freshwater abstractions by major sector♦ "Public water supply" refers to water supply by waterworks, and
may include other uses besides the domestic sector.♦ "Irrigation" refers to self supply (abstraction for own final use).♦ "Others": include industry and electrical cooling (self supply).♦ Freshwater abstractions data: refers to 1997 or latest available
year (data prior to 1990 have not been considered).♦ Cultivated land: refers to arable and permanent crop land.
CAN • 1980 and late 1990s: 1981 and 1995 data. Abstractions by majoruses: 1991 data.
Technical Annex
OECD Environmental Indicators 2001 - 148 -
MEX • Data include Secretariat estimates for electrical cooling - 1980:based on electricity generation in power stations.
USA • Late 1990s: 1995 data. Abstractions by major uses: 1990 data.JPN • Mid-1990s: Secretariat estimates based on 1990 and 1994 data.KOR • Partial totals excluding electrical cooling. Abst. for public supply:
data refer to domestic supply.AUS • In Australia the intensity of use of water resources varies widely
among regions; one third of the country is arid, one third semi-aridand the high rainfall areas in the north are far from the densilypopulated areas in the south. 1980: 1977 data adjusted for anaverage climatic year. Late 1990s: estimated data.
NZL • Partial totals excl. industrial and electrical cooling. 1980: compositetotal based on data for various years. Late 1990s: 1993 estimates.
AUT • Partial totals. Irrigation and industry no cooling: groundwater only.Electrical cooling (includes all industrial cooling): surface wateronly. Late 1990s: 1993 data.
BEL • Data include Secretariat estimates. Late 1990s: 1994 data.CZE • Data refer to 1997.DNK • 1980: 1977 data. Late 1990s: 1996 data, groundwater only (major
part of total freshwater abstractions, e.g. 95-99% for 1995).FIN • Partial totals. Late 1990s: 1994 data excluding all agricultural
uses. Abst. by major uses: irrigation: 1992 data.FRA • 1980 and Late 1990s: 1981 and 1994 data.DEU • Excluding agricultural uses other than irrigation. Late 1990s: 1995
data which include national estimates. Change since 1980: ratiosfor total Germany compared to ratios for western Germany (1979).
GRC • Partial totals. Excluding agricultural uses besides irrigation.Includes data for public water supply which refer only to data from42 out of 75 great water distribution enterprises.
HUN • Late 1990s: 1996 data.ISL • Fish farming is a major user of abstracted water. Abst. for public
supply: includes the domestic use of geothermal water.IRL • Late 1990s: 1994 data; totals include 1980 data for electrical
cooling. Abstractions by major uses: irrigation includes otheragricultural abstractions.
ITA • Excluding agricultural uses besides irrigation. 1980: including1973 estimates for industrial cooling.
LUX • Late 1990s: annual average of the 1990-95 period.NLD • Partial totals excluding all agricultural uses. 1980 and Late 1990s:
1981 and 1996 data.
NOR • Late 1990s: estimates for 1994 including 1978 data for industry.POL • Totals include abstractions for agriculture, which include
aquaculture (areas over 10 ha) and irrigation (arable land andforest areas greater than 20 ha); animal production and domesticneeds of rural inhabitants are not covered.
PRT • Late 1990s: 1996 data (INAG estimates).ESP • Excluding agricultural uses other than irrigation. Groundwater:
excluding industry.SWE • 1980: include data from different years. Late 1990s: 1995 data.CHE • Partial totals excluding agricultural uses. Late 1990s: 1994 data.TUR • 1980: partial totals; excluding agricultural uses other than irrigation
and electrical cooling.UKD • Partial totals. England and Wales only. Data include
miscellaneous uses for power generation, but excludehydroelectric power water use.
OECD • Rounded figures, including Secretariat estimates. Abstractions as% of available resources: calculated using the estimated totals forinternal resources (not total resources as for countries), andconsidering England and Wales only. Abstractions by major uses,trends: estimates based on 19 countries representing about 85%of total OECD abstractions.
IRRIGATION
CAN • Abst. for irrigation: 1991 data.USA • Abst. for irrigation: 1990 data.JPN • Irrigated land: rice irrigation only.KOR • Abst. for irrigation includes other agricultural abstractions. Irrigated
land: rice irrigation only.AUT • Abst. for irrigation includes other agricultural abstractions.BEL • Data for Belgium include Luxembourg.DNK • Abst. for irrigation: 1995 data.FIN • Abst. for irrigation: 1992 data.FRA • Abst. for irrigation: Secretariat estimates; includes other
agricultural uses, but irrigation is the main use.HUN • Irrigated land: excl. complementary farm plots & individual farms.IRL • Abst. for irrigation: irrigated area is negligible.SWE • Abst. for irrigation: data are estimates for dry year.UKD • England and Wales only.OECD • Do not include the Czech Republic.
WATER PRICE
Data sources: IWSA (International Water Supply Association), 1999,International Statistics for Water Supply
♦ Prices calculated on the basis of a family of four (two adults and twochildren) living in a house with garden rather than an apartment.Where there are water meters, the price is based on annualconsumption of 200 m3. Where supply is normally unmeasured theaverage price has been used (Norway and UK). Prices at current
exchange rates. VAT is not included. 1996 data have not beenreported on the figure.
ISL • 1996 data.NOR • Unmeasured data: refer to the average price.TUR • 1996 data.UKD • Unmeasured data: refer to the average price.
FOREST RESOURCES
INTENSITY OF USE OF FOREST RESOURCES
Data sources: OECD, FAO, national statistical yearbooks♦ Annual growth: gross increment.♦ Late 1990s: 1997 or latest available year.♦ Data exclude Iceland as there is no traditional forestry in this country.CAN • Late 1990s: 1994 data.USA • 1980 and 90 are estimates. Late 1990s: 1992 data.JPN • 1980s: 1985 data. Growth: national forest; % change since
1985; 1995 data: Basic Plan for Forest Resources.AUS • 1980s: 1985 data. Harvest and growth: % change since 1985.
Late 1990s: TBFRA 2000 data (reference year: 1994).NZL • Data refer to planted production forests only. Growth of natural
forests is considered to be near zero with a growth rate equal tomortality. Harvest from natural forests is less than 3 % of harvest.1980s: 1985 data.
AUT • Growth: 1980 and 1990 data refer to 1971-80 and 1986-90.
BEL • 1980s: 1985 data. 1990: 1992 data, Wallonia only. Late 1990s:TBFRA 2000 data not comparable to previous years. Harvest:period 1986-95; estimations based in annual public forest harvestextrapolated to total forest. Annual growth: 1982-97, and netannual growth (natural losses excluded); estimations based ondata for Wallonia extrapolated to the rest of the country.
DNK • 1980 data are Secretariat estimates. Growth late 1990s (1996data): expected mean annual volume increment for 1990-2000.
FIN • Growth late 1990s: refer to 1981-96 data.GRC • 1990: 1992 data.ITA • 1990: 1991 data.LUX • 1980s: 1985 data. Growth % change since 1985; 1990: based on
1989 harvest. Harvest late 1990s: 1995 data. Growth late 1990s:1992.
NLD • Data refer to total exploitable forest. 1980s: 1985 data. Late1990s: break in time series (TBFRA 2000 data).
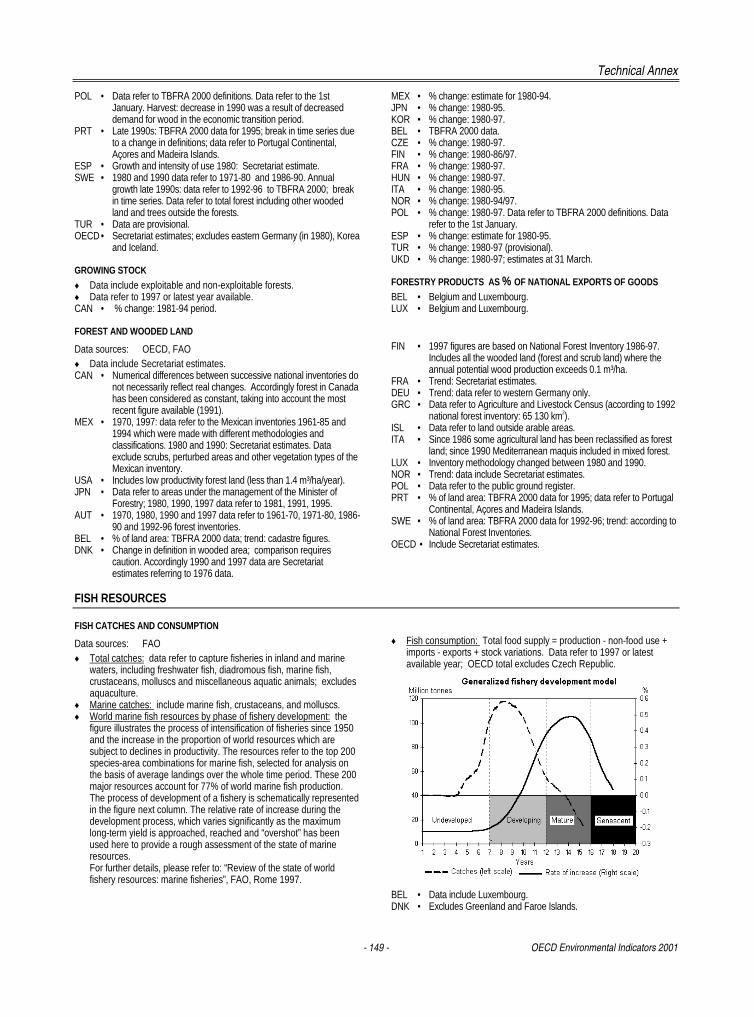
Technical Annex
- 149 - OECD Environmental Indicators 2001
POL • Data refer to TBFRA 2000 definitions. Data refer to the 1stJanuary. Harvest: decrease in 1990 was a result of decreaseddemand for wood in the economic transition period.
PRT • Late 1990s: TBFRA 2000 data for 1995; break in time series dueto a change in definitions; data refer to Portugal Continental,Açores and Madeira Islands.
ESP • Growth and intensity of use 1980: Secretariat estimate.SWE • 1980 and 1990 data refer to 1971-80 and 1986-90. Annual
growth late 1990s: data refer to 1992-96 to TBFRA 2000; breakin time series. Data refer to total forest including other woodedland and trees outside the forests.
TUR • Data are provisional.OECD • Secretariat estimates; excludes eastern Germany (in 1980), Korea
and Iceland.
GROWING STOCK
♦ Data include exploitable and non-exploitable forests.♦ Data refer to 1997 or latest year available.CAN • % change: 1981-94 period.
MEX • % change: estimate for 1980-94.JPN • % change: 1980-95.KOR • % change: 1980-97.BEL • TBFRA 2000 data.CZE • % change: 1980-97.FIN • % change: 1980-86/97.FRA • % change: 1980-97.HUN • % change: 1980-97.ITA • % change: 1980-95.NOR • % change: 1980-94/97.POL • % change: 1980-97. Data refer to TBFRA 2000 definitions. Data
refer to the 1st January.ESP • % change: estimate for 1980-95.TUR • % change: 1980-97 (provisional).UKD • % change: 1980-97; estimates at 31 March.
FORESTRY PRODUCTS AS % OF NATIONAL EXPORTS OF GOODS
BEL • Belgium and Luxembourg.LUX • Belgium and Luxembourg.
FOREST AND WOODED LAND
Data sources: OECD, FAO♦ Data include Secretariat estimates.CAN • Numerical differences between successive national inventories do
not necessarily reflect real changes. Accordingly forest in Canadahas been considered as constant, taking into account the mostrecent figure available (1991).
MEX • 1970, 1997: data refer to the Mexican inventories 1961-85 and1994 which were made with different methodologies andclassifications. 1980 and 1990: Secretariat estimates. Dataexclude scrubs, perturbed areas and other vegetation types of theMexican inventory.
USA • Includes low productivity forest land (less than 1.4 m³/ha/year).JPN • Data refer to areas under the management of the Minister of
Forestry; 1980, 1990, 1997 data refer to 1981, 1991, 1995.AUT • 1970, 1980, 1990 and 1997 data refer to 1961-70, 1971-80, 1986-
90 and 1992-96 forest inventories.BEL • % of land area: TBFRA 2000 data; trend: cadastre figures.DNK • Change in definition in wooded area; comparison requires
caution. Accordingly 1990 and 1997 data are Secretariatestimates referring to 1976 data.
FIN • 1997 figures are based on National Forest Inventory 1986-97.Includes all the wooded land (forest and scrub land) where theannual potential wood production exceeds 0.1 m³/ha.
FRA • Trend: Secretariat estimates.DEU • Trend: data refer to western Germany only.GRC • Data refer to Agriculture and Livestock Census (according to 1992
national forest inventory: 65 130 km2).ISL • Data refer to land outside arable areas.ITA • Since 1986 some agricultural land has been reclassified as forest
land; since 1990 Mediterranean maquis included in mixed forest.LUX • Inventory methodology changed between 1980 and 1990.NOR • Trend: data include Secretariat estimates.POL • Data refer to the public ground register.PRT • % of land area: TBFRA 2000 data for 1995; data refer to Portugal
Continental, Açores and Madeira Islands.SWE • % of land area: TBFRA 2000 data for 1992-96; trend: according to
National Forest Inventories.OECD • Include Secretariat estimates.
FISH RESOURCES
FISH CATCHES AND CONSUMPTION
Data sources: FAO♦ Total catches: data refer to capture fisheries in inland and marine
waters, including freshwater fish, diadromous fish, marine fish,crustaceans, molluscs and miscellaneous aquatic animals; excludesaquaculture.
♦ Marine catches: include marine fish, crustaceans, and molluscs.♦ World marine fish resources by phase of fishery development: the
figure illustrates the process of intensification of fisheries since 1950and the increase in the proportion of world resources which aresubject to declines in productivity. The resources refer to the top 200species-area combinations for marine fish, selected for analysis onthe basis of average landings over the whole time period. These 200major resources account for 77% of world marine fish production.
The process of development of a fishery is schematically representedin the figure next column. The relative rate of increase during thedevelopment process, which varies significantly as the maximumlong-term yield is approached, reached and “overshot” has beenused here to provide a rough assessment of the state of marineresources.
For further details, please refer to: “Review of the state of worldfishery resources: marine fisheries”, FAO, Rome 1997.
♦ Fish consumption: Total food supply = production - non-food use +imports - exports + stock variations. Data refer to 1997 or latestavailable year; OECD total excludes Czech Republic.
BEL • Data include Luxembourg.DNK • Excludes Greenland and Faroe Islands.
Technical Annex
OECD Environmental Indicators 2001 - 150 -
BIODIVERSITY
THREATENED SPECIES
Data sources: OECD♦ Threatened species: "Threatened" refers to the sum of species
"critically endangered", "endangered" and "vulnerable" (new IUCNcategories), or to the sum of species "endangered" and "vulnerable"(old IUCN categories).
♦ "Critically endangered": species is facing an extremely high risk ofextinction in the wild in the immediate future.
♦ "Endangered": species is not “critically endangered” but is facing avery high risk of extinction in the wild in the near future.
♦ "Vulnerable": species is not “critically endangered” or “endangered”but is facing a high risk of extinction in the wild in the medium-termfuture.
♦ When interpreting these tables, it should be borne in mind that thenumber of species known does not always accurately reflect thenumber of species in existence; and that the definitions are appliedwith varying degrees of rigour in countries, although internationalorganisations such as the IUCN and the OECD are promotingstandardisation.
CAN • 1997 data. Mammals: indigenous sp.; fish: of which 177 freshwater sp.; all reptile and amphibian species are decliningsomewhat due to urbanisation and agriculture.
MEX • Excludes extinct species; birds: resident and migratory species;fish: freshwater and marine species.
USA • Including Pacific and Caribbean islands.JPN • Mammals: of which 179 indigenous species; birds: includes
species that are occasionally present; fish: freshwater andbrackish water species; reptiles, amphibians: of which 97 and 61indigenous species.
KOR • Mammals, birds, fish: excludes extinct species.NZL • Indigenous species only; mammals: land-breeding and marine
mammals.AUT • Indigenous species only; threatened mammals: includes extinct
and/or vanished species; birds: breeding species on nationalterritory; fish: freshwater only.
BEL • Data refer to Flanders; extinct species are excluded.CZE • Data refer to indigenous species and include extinct species.DNK • Data exclude extinct species; fish: freshwater only; known species
of vascular plants: indigenous species only.FIN • Excludes extinct species; mammals: indigenous species only; fish:
excl. introduced species and occasionally present marine fish;vascular plants: resident wild sp., subspecies, varietis andindependent hybrids.
FRA • Metropolitan France; extinct species are excluded; mammals: ofwhich 112 indigenous species; birds: number of breeding pairs; fish:marine and freshwater species.
DEU • Mammals: indigenous species out of 87 known species; birds:number of breeding species out of 255 known species; fish:
freshwater only; reptiles and amphibians: indigenous species;vascular plants: indigenous species out of 3319 known species.
GRC • Fish: freshwater only; vascular plants, threatened: incl. eightextinct species.
HUN • Threatened: protected and highly protected species; fish:freshwater species, of which 2 indigenous species; "Threatened"fish: includes indeterminate species; vascular plants: of which 2 433indigenous species.
ISL • Birds: breeding species only; about 335 species have been recordedone or more times on national territory; fish: freshwater only.
IRL • Mammals: excluding marine mammals; because total of knownspecies includes some sp. for which status is not evaluated,threatened % is underestimated; birds: resident sp., regular visitorsand passage migrants.
ITA • Fish: freshwater only.LUX • Birds: breeding species only.NLD • Excl. extinct species; birds: breeding species only; fish: freshw. only.NOR • Excludes extinct species; mammals: indigenous terrestrial species;
the status of the 26 known species of marine mammals is uncertain;birds: breeding species on national territory; fish: 45 freshwater sp.(of which 9 introduced), 150 marine sp.; reptiles and amphibians:indigenous species; vascular plants: native species only; about2 800 species (incl. introduced ones) are known.
POL • Mammals: indigenous species only (out of 90 species); birds:breeding species only (total number of species recorded so far inPoland: 418); fish: freshwater indigenous species, excludinglampreys (out of 67 freshwater species); vascular plants: of which 1950 indigenous species.
PRT • Fish: freshwater species only.ESP • Threatened: endangered and vulnerable; fish: freshwater only.SWE • Mammals, birds: of which 60, 243 indigenous species; fish:
freshwater species only.CHE • Excludes extinct species; mammals: indigenous species; birds: all
breeding species on national territory; fish: indigenous species ofPisces and Cyclostomata; reptiles and amphibians: indigenousspecies.
TUR • Fish: freshwater sp. only; marine sp.: 400-450 (estimated number).UKD • Great Britain only; mammals: terrestrial and marine species,
excluding cetaceans; 41 of species known are native; "threatened"refers to national standard; birds: total number of native speciesrecorded in Britain and Ireland on the British Ornithologists' Union listA; "threatened": globally threatened and rapidly declining birds ofconservation concern; fish (of which 37 indigenous): freshwater fish,including those that leave the sea to breed in fresh water (e.g.salmon); reptiles and amphibians: indigenous species; vascularplants: approximate figures; species known: includes 800microspecies.
PROTECTED AREAS
Data sources: OECD, World Conservation Monitoring Centre, IUCN♦ Major protected areas: IUCN management categories I-VI:
♦ Ia: strict nature reserves, managed mainly for science;♦ Ib: wilderness areas, managed mainly for wilderness protection;♦ II: national parks, managed mainly for ecosystem protection and
recreation;♦ III: natural monuments, managed mainly for conservation of
specific natural features;♦ IV: habitat/species management areas, managed mainly for
habitat and species conservation through managementintervention;
♦ V: protected landscapes/seascapes, managed mainly forlandscape/seascape conservation and recreation;
♦ VI: managed resource protected areas, managed mainly for thesustainable use of natural ecosystems.
♦ For further details on management categories please refer to“Guidelines for Protected Area Management Categories”, IUCN,1994.
♦ See also the Recommendations established at the IVth WorldCongress on National Parks and Protected Areas.
♦ National classifications may differ.MEX • As of 1997 there were 107 national protected areas under the
National System of Natural Protected Areas (SINAP), with a totalsize of 117 340 km2.
USA • Includes Alaska. Excludes American Samoa, Guam, MinorOutlying Islands, Northern Mariana Islands, Puerto Rico and VirginIslands.
AUS • Excludes the Great Barrier Reef Marine Park totalling 344 800 km2
(cat. VI); national data.DNK • Excludes Greenland: one national park of 972 000 km2, one
national reserve of 10 500 km2.
Technical Annex
- 151 - OECD Environmental Indicators 2001
FRA • Excludes non-metropolitan France.HUN • Total size: 1999 national data; number of sites and breakdown by
categories: IUCN data.LUX • Total size: national data; number of sites and breakdown by
categories: IUCN data.NLD • Excludes the Netherlands Antilles.NOR • Includes Svalbard, Jan Mayen and Bouvet islands.
PRT • Includes Azores and Madeira.ESP • Includes Baleares and Canaries.TUR • Total size: 1998 national data; number of sites and breakdown by
categories: IUCN data.UKD • Excludes Bermuda, British Virgin Islands, Cayman Islands,
Falkland Islands, St. Helena and Dependencies, South Georgiaand the South Sandwich Islands, Turks and Caicos Islands.
GDP AND POPULATION
GROSS DOMESTIC PRODUCT
Data sources: OECD.♦ Gross Domestic Product: expressed at 1991 price levels and
purchasing power parities.♦ Value added: late-1990s: 2000 or latest available year; agriculture:
also includes hunting, forestry and fishing; industry: includes miningand quarrying, manufacturing, gas, electricity and water, and
construction; value added excludes financial intermediation servicesindirectly measured.
DEU • % change GDP - % change population: refer to western Germanyonly.
OECD • % change GDP - % change population: includes western Germanyonly; % change GDP - % change population: excludes CzechRepublic, Hungary and Poland.
POPULATION GROWTH AND DENSITY
Data sources: OECD♦ Population: all nationals present in or temporarily absent from a
country, and aliens permanently settled in the country.
♦ Unemployment rate: commonly used definitions.
CONSUMPTION
PRIVATE FINAL CONSUMPTION EXPENDITURE
Data sources: OECD♦ Private final consumption expenditure: the sum of (i) the outlays of
resident households on new durable and non-durable goods andservices less their net sales of second-hand goods, scraps andwastes; (ii) the value of goods and services produced by private non-profit institutions for own use on current account; expressed at 1991
price levels and purchasing power parities. Consumption patterns:data refer to 1999 or latest data available.
DEU • Change since 1980 refer to western Germany only.OECD • Change since 1980: includes western Germany only and excludes
Czech Republic, Hungary and Poland.
GOVERNMENT FINAL CONSUMPTION EXPENDITURE
Data sources: OECD
♦ Government final consumption expenditure: the value of goods andservices produced by governments for their own use on currentaccount; expressed at 1991 price levels and purchasing powerparities.
DEU • Change since 1980 refers to western Germany only.OECD • Change since 1980: includes western Germany only and excludes
Czech Republic, Hungary and Poland.
ENERGY
ENERGY SUPPLY
Data sources: IEA-OECD
♦ see IEA (1997-98) Energy Balances of OECD Countries forconversion factors from original units to Toe for the various energysources.
♦ Total primary energy supply: indigenous production + imports -exports - international marine bunkers and ± stock changes.Primary energy comprises hard coal, lignite and other solid fuels,crude oil and natural gas liquids, natural gas, and nuclear, hydro,geothermal and solar electricity. Electricity trade is also included.
♦ Solid fuels: coal, combustible renewables and waste.
ENERGY PRICES AND TAXES
Data sources: IEA-OECD
♦ see IEA (2001), Energy prices and taxes, first quarter, 2001♦ Oil: light fuel oil only.♦ Oil and electricity: USD using current exchange rates.♦ Natural gas: USD per 107 kcal (GCV basis) using current exchange
rates.
♦ Real energy end-use prices: refers to real energy end-use prices forindustry and households. % change refer to 1980-99 period.
MEX • Energy prices: % change refers to 1981-99 period.USA • Electricity prices: exclude taxes.AUS • Electricity prices: exclude taxes.
Technical Annex
OECD Environmental Indicators 2001 - 152 -
TRANSPORT
ROAD TRAFFIC
Data sources: OECD, International Road Federation (IRF), nationalyearbooks
♦ Traffic volumes are expressed in billions of kilometres travelled by roadvehicle; they are usually estimates and represent the average annualdistance covered by vehicles, in kilometres, multiplied by the number ofvehicles in operation. In principle, the data refer to the whole distancetravelled on the whole network inside the national boundaries bynational vehicles, with exception of two- and three-wheeled vehicles,caravans, and trailers.
♦ Data include Secretariat estimates.USA•• Traffic by local and urban buses is excluded.JPN • Traffic by light vehicles is excluded.BEL • Including motor vehicles with 2 or 3 wheels (about 1%)
CZE • Excludes buses.DEU • Except for military vehicles, traffic by special vehicles is included.GRC • Data refer to inter-city traffic only.ISL • Traffic by local and urban buses is excluded.ITA • Traffic by three-wheeled goods vehicles is included.NLD • Traffic by trams and subways is included.ESP • Data refer only to traffic on motorways and national roads.SWE • Data include traffic by Swedish passenger cars abroad. Traffic by
goods vehicles with a load capacity under 2 tonnes is excluded.Up to 1988, only the public network is included; after 1989, thetotal network is taken into account.
TUR • Data refer only to traffic on motorways and national roads.UKD • Data refer to Great Britain only.
MOTOR VEHICLES
Data sources: OECD, European Conference of Ministers of Transport(ECMT), IRF, American Automobile Manufacturers’Association, national yearbooks
♦ Total stock includes passenger cars, goods vehicles, buses andcoaches. Data refer to autonomous road vehicles with four or morewheels, excluding caravans and trailers, military vehicles, specialvehicles (for emergency services, construction machinery, etc.) andagricultural tractors.
♦ Private car ownership is expressed as passenger cars per capita.Data refer to passenger cars seating not more than nine persons(including the driver), including rental cars, taxis, jeeps, estatecars/station wagons and similar light, dual-purpose vehicles.
♦ Data describe the situation as of 31 December of the year.USA • Passenger cars includes other 2-Axle 4-Tire vehicles.
JPN • Total stocks include three-wheeled vehicles.AUS • Private car ownership includes utility vehicles.AUT • Includes Kombi.BEL • Data are reported on 1 August of the reference year.CZE • Includes delivery vans.DNK • Passenger cars includes vans under 2 tonnes.FRA • Data are reported on 1 January.DEU • Passenger cars includes motor vehicles for mixed use.HUN • Change in methodology in 1996.LUX • Data are reported on 1 January of the reference year.NLD • Data are reported on 31 July of the reference year.PRT • The definition of commercial vehicles changed in 1990.CHE • Data are reported on 30 September of the reference year.UKD • Total stocks include special purpose vehicles.
ROAD INFRASTRUCTURE
Data sources: OECD, ECMT, IRF, national yearbooks♦ Roads refer to motorways, main or national highways, secondary or
regional roads, and others. In principle, the data refer to all publicroads, streets and paths in urban and rural areas, but not privateroads.
♦ Motorways refer to a class of roads differing from main or national,secondary or regional, and other roads.
♦ Data describe the situation as of 31 December of the year.♦ Data include Secretariat estimates.MEX • Road network: break of time series in 1994. Motorways refer to toll
roads.AUS • Road network: roads types taken into account changed after
1980.AUT • Road network: about 100 000 km of private roads are excluded.BEL • Including not paved municipal roads.
FIN • Road network: urban streets are excluded.FRA • Road network: excludes certain rural roads. Motorways include
about 1 200 km of urban motorways.GRC • Road network: excl. other roads (estim. at 75 600 km in 1995).HUN • Change in methodology in 1997.LUX • Change in methodology in 1996.ESP • Road network: motorways, national and secondary roads only.
Excludes other roads estimated at 175 000 km in 1995.Motorways: certain two-lane roads are included.
SWE • Road network: private roads are excluded. Motorways: excludesaccess and exit ramps.
TUR • Road network: national and provincial roads only. Village roadsare excluded (320 055 km in 1995).
UKD • Data refer to Great Britain only. Motorways: excl. slip roads.
ROAD FUEL PRICES AND TAXES
Data sources: IEA-OECD♦ see IEA (2001), Energy Prices and Taxes, First Quarter 2001♦ Taxes: includes taxes that have to be paid by the consumer as part
of the transaction and are not refundable.♦ Diesel fuel: diesel for commercial use.♦ Leaded premium: 1999 or latest available year. Data prior to 1996
have not been considered.♦ Unleaded gasoline: unleaded premium (95 RON) except as noted.♦ Prices: expressed in USD at 1995 prices and PPPs.♦ Total energy consumption by road traffic: all fuels used in road
vehicles (including military) as well as agricultural and industrialhighway use; excludes gasoline used in stationary engines, anddiesel oil in tractors that are not for highway use.
CAN • Diesel: 1980 data refer to 1981. Unleaded gasoline: unleadedregular (92 RON).
MEX • Unleaded gasoline: unleaded regular (92 RON).JPN • Unleaded gasoline: unleaded regular (91 RON).KOR • 1980 data refer to 1981.AUS • Unleaded gasoline: unleaded regular (91 RON).NZL • Unleaded gasoline: unleaded regular (91 RON).DNK • Unleaded gasoline: unleaded premium (98 RON).FRA • Up to February 1985 prices were kept within a set range. Figures
before 1985 refer to maximum price for Paris. Figures after 1985refer to average price for all of France.
ISL • Data from Statistics Iceland.
Technical Annex
- 153 - OECD Environmental Indicators 2001
AGRICULTURE
INTENSITY OF USE FROM NITROGEN AND PHOSPHATE FERTILISERS
Data sources: OECD, FAO, International Fertilizer IndustryAssociation, national statistical yearbooks, UN/ECE,UNEP
♦ Use of nitrogen and phosphate fertilisers: data refer to the nitrogen(N) and phosphoric acid (P2O5) content of commercial fertilisers,and relate to apparent consumption during the fertiliser year(generally 1 July to 30 June) per unit of agricultural land.
♦ Agricultural land: refers to arable and permanent crop land andpermanent grassland. “Arable l.” refers to all land generally underrotation, whether for temporary crops or meadows, or left fallow.“Permanent crops l.” comprises those lands occupied for a longperiod that do not have to be planted for several years after eachharvest. “Permanent grassland” includes land used for five years ormore for herbaceous forage, either cultivated or growing wild.
♦ Data includes estimates.♦ Phosphate fert.: includes ground rock phosphates.MEX • Fertiliser year: calendar year.USA • Includes data for Puerto Rico.KOR • Fertiliser year: calendar year.BEL • Data for Belgium include Luxembourg.
Phosphate fert.: excludes other citrate soluble phosphates.DNK • Fertiliser year: August-July.FRA • Phosphate fert.: fertiliser year: May-April.GRC • Fertiliser year: calendar year.HUN • Fertiliser year: calendar year.
ISL • Fertiliser year: calendar year.ESP • Fertiliser year: calendar year.SWE • Fertiliser year: June-May. Nitrogen fert.: data include forest
fertilisation.TUR • Fertiliser year: calendar year.UKD • Fertiliser year: June-May.
AGRICULTURAL PRODUCTION
Data sources: OECD, FAO♦ Data refer to indices of agricultural production based on price-
weighted quantities of agricultural commodities produced for any useexcept as seed and feed. The commodities covered are all crops andlivestock products originating in each country.
♦ Data may differ from national data due to differences in concepts ofproduction, coverage, weights, time reference and methods ofcalculation.
BEL • Data for Belgium include Luxembourg.
AGRICULTURAL VALUE ADDED
Data sources: OECD♦ Data also includes hunting, forestry and fishing.♦ Data refer to 1999 or latest year available.
NITROGEN BALANCES
Data sources: OECD♦ Nitrogen balance: the annual total quantity of inputs includes mainly
livestock manure and chemical fertilisers. The annual total quantityof outputs includes mainly crops and forage. The indicator providesinformation on the potential loss of nitrogen to the soil, the air, andto surface or groundwater. However, nitrogen loss through thevolatilisation of ammonia to the atmosphere from livestock housingand stored manure is excluded from the calculation.
♦ Nitrogen efficiency: in agriculture, measures the physical nitrogeninput/output ratio.
CZE • Data for the period 1985-92 refer to the Czech part of the formerCzechoslovakia.
ISL • The 1995-97 average refer to 1995.OECD • Excluding Luxembourg.
LIVESTOCK DENSITIES
Data sources: OECD, FAO, UN/ECE♦ head of sheep equivalent: based on equivalent coefficients in terms of manure: 1 cattle= 6 sheep; 1 sheep=1 goat=1 pig.
Coefficients used to estimate nitrogen from livestock Coefficients used to estimate phosphate from livestockkg of dry matter
per yearCoefficients for N
content in excrementkg of dry matter
per yearCoefficients for P2O5content in excrement
(% of dry matter) (% of dry matter)Cattle 1 500 5.0 Cattle 1 500 1.8
Horses 1 200 4.4 Horses 1 200 1.4Sheep and goats 250 3.0 Sheep and goats 250 0.6
Pigs 250 4.4 Pigs 250 2.5Poultry (hens) 15 5.3 Poultry (hens) 15 3.5
Source: IEDS-UN/ECE Source: IEDS-UN/ECEBEL • Data for Belgium include Luxembourg.DNK • Sheep and goats: sheep only.ISL • 1997 national data (goats: 1996 data).IRL • Sheep and goats: sheep only.
POL • Sheep and goats: sheep only.SWE • Sheep and goats: sheep only.UKD • Sheep and goats: sheep only.
INTENSITY OF USE OF PESTICIDES
Data sources: OECD, FAO, national statistical yearbooks, EuropeanCrop Protection Association
♦ Unless otherwise specified, data refer to active ingredients.♦ Unless otherwise specified, data refer to total consumption of
pesticides, which include: insecticides (acaricides, molluscicides,nematocides and mineral oils), fungicides (bactericides and seed
treatments), herbicides (defoliants and desiccants), and otherpesticides (plant growth regulators and rodenticides).
CAN • Survey coverage has varied greatly (different active ingredients,registrants and products); survey trends may therefore not reflectactual trends but simply changes in the survey coverage. 1994:refer to agriculture uses only (non-agricultural uses excluded). %change since 1980: base year refer to 1984.
USA • Data refer to agricultural pesticides only.
Technical Annex
OECD Environmental Indicators 2001 - 154 -
JPN • Data refer to national production of pesticides.KOR • % change since 1980: base year refer to 1986.NZL • % change since 1980: base year refer to 1985.BEL • Data include Luxembourg.CZE • Data refer to agricultural pesticides and sales of chemical
pesticides. Include: animal repellents, additives, adhesives andother pesticides.
DNK • Sales for use in plant production in open agriculture. % changesince 1980: base year refer to 1981.
FIN • Data include forest pesticides and refer to sales.FRA • Data refer to quantities sold to agriculture.DEU • Data refer to sales.GRC • Data refer to sales. % change since 1980: base year refer to 1986.ITA • Data refer to formulation weight.
NLD • Data refer to sales of chemical pesticides. Data include soildisinfectants, which correspond to about the half of the totalconsumption. % change since 1980: base year refer to 1984.
NOR • Data refer to sales.POL • Data include animal repellents and other pesticides.PRT • Data refer to sales.ESP • Data refer to sales. % change since 1980: base y. refer to 1986.SWE • A special sales tax has been applied to pesticides since 1987.
Another tax was applied in 1995. Data refer to sales.CHE • Data refer to sales and have been estimated to represent 95 per
cent of the total market volume; Liechtenstein included.TUR • Formulation weight. Powdered sulphur and copper sulphate
excluded.UKD • Great Britain only. Data include sulphuric acid, which represents
approx. 40% (1995) of the total.
EXPENDITURE
POLLUTION ABATEMENT AND CONTROL EXPENDITURE
Data source: OECD♦ Pollution abatement and control (PAC) expenditure according to the
abater principle. PAC activities are defined as purposeful activitiesaimed directly at the prevention, reduction and elimination of pollutionor nuisances arising as a residual of production processes or theconsumption of goods and services. Excludes expenditure on naturalresource management and activities such as the protection ofendangered species, the establishment of natural parks and greenbelts and activities to exploit natural resources (such as the supply ofdrinking water).
♦ Total expenditure: the sum of public and business expenditure(excluding households); values in USD per capita: at current pricesand purchasing power parities.
CAN • 1995 data; public: includes subsidies to private sector; in principle,does not include fees from the private sector; data includeestimates.
MEX • Total: Secretariat estimate for 1995; public: partial figure.USA • 1994 data.JPN • 1990 data; total includes Secretariat estimate.KOR • Trial estimate by the bank of Korea for 1997.AUS • 1996 data.AUT • 1994 data. Excludes expenditure concerning protection of nature
and landscape and R&D; estimates were made in such a way asto eliminate double counting of fees for waste water and waste.
BEL • Total: Secretariat estimate for 1996.
CZE • Total: Secretariat estimate for mid-1990s; public and business:based on shares in investment.
DNK • Total: Secretariat estimate for 1996: public: includes subsidiesand transfers to private sector.
FIN • 1997 data; business: ISIC 10 to 40 only.FRA • 1996 data.DEU • 1995 data.GRC • 1995 data.HUN • 1996 data referring to investment only.ISL • Public sector: 1998 expenditure on waste, waste water and
general environmental monitoring only.IRL • Total: Secretariat estimate for 1998.ITA • 1989 data including Secretariat estimate.LUX • 1997 data.NLD • 1995 data.NOR • Secretariat estimate for 1990.POL • 1995 data referring to investment only.PRT • 1998 data including receipts from by-products; excluding this
amounts, expenditure for public and business sectors would reach0.9% of GDP.
ESP • Total: Secretariat estimate for 1991.SWE • 1991 data.CHE • Public: 1992 data; business and total: 1993 data.UKD • 1990 data.
OFFICIAL DEVELOPMENT ASSISTANCE
Data source: OECD-DAC♦ Data refer to loans (except military loans), grants and technical co-
operation by the public sector to developing countries. Data cover
OECD Development Assistance Committee (DAC) Membercountries. The new System of National Accounts (SNA) tends todepress donors’ ODA/GNP ratios in the mid-1990s.
- 155 - OECD Environmental Indicators 2001
MEMBERS OF THE WORKING GROUP ON ENVIRONMENTAL INFORMATION AND OUTLOOKS*
1999/2000
Chair: Ms. Anne Teller
♦ AUSTRALIA Mr. A. Haines (Vice-Chair) ♦ KOREA Mr. J. ChoiMr. B. Harrison Ms. Y.S. Kim
♦ AUSTRIA Ms. E. Milota ♦ LUXEMBOURG Mr. J.P. FeltgenMr. W. Schober
♦ MEXICO Mr. R. Lopez-Perez♦ BELGIUM Ms. A. Teller (Chair) Mr. A. Yanez
♦ CANADA Mr. M. Lemire ♦ NETHERLANDS Mr. P. KleinMr. D. O’Farrell Mr. C. Vijverberg
♦ CZECH REPUBLIC Mr. E. Lippert (Vice-chair) ♦ NEW ZEALAND Mr. D. Brash
♦ DENMARK Mr. P. Etwil ♦ NORWAY Mr. O. NesjeMs. A. Ladefoged Mr. F. Brunvoll
♦ FINLAND Mr. L. Kolttola ♦ POLAND Ms. L. Dygas-CiolkowskaMr. J. Muurman Ms. D. Dziel
♦ FRANCE Mr. T. Lavoux (Vice-chair) ♦ PORTUGAL Mr. G. Espada
♦ GERMANY Ms. J. Burkhardt ♦ SPAIN Mr. F. CadarsoMr. O. Angermann
♦ SWEDEN Ms. E. Hoglund-Davila♦ GREECE Ms. M. Peppa Ms. M. Notter
♦ HUNGARY Mr. E. Szabo ♦ SWITZERLAND Mr. P. GlauserMr. T. Klingl
♦ ICELAND Ms. E. Hermannsdottir♦ TURKEY Mr. M. Gürcü
♦ IRELAND Mr. L. Stapleton (Vice-Chair) Ms. A. Tokel
♦ ITALY Ms. R. Calicchia ♦ UNITED KINGDOM Mr. J. CustanceMr. P. Soprano
♦ UNITED STATES Mr. P. Ross (Vice-Chair)♦ JAPAN Mr. Y. Moriguchi (Vice-Chair)
♦ CEC Mr. U. WielandMr. P. Bosch
OECD SECRETARIAT
Ms. M. LINSTERMs M. BAGHERZADEH, Ms. F. ZEGEL
Consultants: Ms. M.J. SANTOS
* former Working Group on the State of the Environment.
OECD PUBLICATIONS, 2, rue André-Pascal, 75775 PARIS CEDEX 16
PRINTED IN FRANCE
(97 2001 09 1 P) ISBN 92-64-18718-9 – No. 52079 2001


![Oecd 2012_education at a Glance, Oecd Indicators [Germany]](https://img.pdfslide.net/doc/110x75/577ce4b41a28abf1038ef751/oecd-2012education-at-a-glance-oecd-indicators-germany.jpg)