Embed Size (px)
DESCRIPTION
Spain has made impressive progress in many aspects of environmental performance. As one of the world’s biodiversity hotspots, with stunning coastal and terrestrial landscapes, Spain has relied on rich natural endowments to support the economy, including a strong tourism sector. The carbon, energy and resource intensity of the economy has declined and protected natural areas have expanded significantly. Yet, environmental challenges remain. These are driven, in part, by land conversion during the construction boom of the early 2000s and population growth, especially in coastal areas. Pressures on the environment are likely to increase as the economy recovers.
Citation preview

SpainHIGHLIGHTS
2015

What are EPRs?
The OECD conducts in-depth assessments of
the environmental policies and programmes of
OECD member and key partner countries. These
Environmental Performance Reviews (EPRs) identify
good practice and make recommendations to
strengthen countries’ policies and instruments for
green growth. They are conducted through a peer
review process, which involves countries assessing
each other as equals.
The EPRs are based on national and international
data and make wide use of economic analysis. Since
work began in 1992, over 70 EPRs of OECD member
and partner countries have been conducted.
WHY AN EPR OF SPAIN?
This is the third OECD review of Spain’s
environmental performance: the first was published
in 1997, the second in 2004. It provides Spain’s
policy makers with a wide-ranging assessment of
environmental progress and policies. The Review
aims to identify where new or reinforced efforts
might be needed to enhance the coherence and
cost-effectiveness of policies. The process involved
a mutually beneficial policy dialogue between Spain
and the countries participating in the OECD Working
Party on Environmental Performance.
The Review presents 28 recommendations. These
Highlights summarise the main findings, with a
special emphasis on:
z Green growth
z Conservation and sustainable use of the marine and terrestrial environment
z Environmental performance of the industrial sector
“Spain’s economic recovery is an opportunity to both strengthen and simplify environmental regulation so as to achieve growth that is robust, inclusive and green.”Angel Gurría, OECD Secretary-General

3
HIG
HLIG
HTS
Spai
n Overview
From 2000, the Spanish economy was one of the most dynamic in the
OECD, until the global economic crisis hit the country hard. Following
the implementation of a recovery programme, growth resumed in
2013, and economic performance has shown signs of stabilisation.
Nevertheless, unemployment, inequality and poverty rates remain high
compared to other OECD member countries.
Spain has made impressive progress in many aspects of environmental
performance. As one of the world’s biodiversity hotspots, with stunning
coastal and terrestrial landscapes, Spain has relied on rich natural
endowments to support the economy, including a strong tourism
sector. The carbon, energy and resource intensity of the economy has
declined and protected natural areas have expanded significantly.
Yet, environmental challenges remain. These are driven, in part, by
land conversion during the construction boom of the early 2000s
and population growth, especially in coastal areas. Pressures on the
environment are likely to increase as the economy recovers.
OPPORTUNITIES
z A biodiversity hotspot, with 30% of all endemic European species, protected by ambitious laws.
z Progress in reducing the carbon, energy and resource intensity of the economy and municipal waste generation per capita.
z Significant improvements in the energy efficiency of buildings and the transport sector, along with a competitive renewable energy sector.
z The shares of protected areas are among the highest in the OECD.
z A rapidly growing organic farming sector.
SPAIN 2013
Population 46 million
GDP/capita(current prices and
purchasing power parity) USD 33 112 (OECD average is 37 875)
Total area 505 600 km²
Population density91.3 inhabitants/km² (OECD Europe average is 109)
CurrencyUSD 1.00 = EUR 0.753
CHALLENGES
z Land conversion for construction, transportation and tourism infrastructure has contributed to threatening biodiversity.
z Medium to high water stress.
z Lack of coherence in a decentralised environmental management system, with implementation impeded by steep budget cuts.
z Low and declining levels of environmentally related taxes, while taxes on labour have increased.
z Transposition of European directives related to the environment has often been late.

4
The OECD has developed a set of green growth indicators which are used to evaluate countries as part of their Environmental Performance Review. They cover (1) the environmental and resource productivity of the economy; (2) the natural asset base; and (3) the environmental dimension of quality of life.
CARBON, ENERGY AND RESOURCE EFFICIENCYOF THE ECONOMY
z Spain generates 20% less CO2 per unit of GDP than
in 2000, due to an increasing share of renewables in
electricity generation, more stringent energy efficiency
measures, as well as the impact of the global economic
downturn.
z Greenhouse gas emissions decreased since 2000
(Figure 1), but not enough to reach Spain’s Kyoto
Protocol reduction targets. However, Spain fulfilled
its commitment to these targets by using flexibility
mechanisms to reduce emissions in other countries.
z Energy consumption followed the “boom and bust”
cycle of the economy: it increased sharply until 2007
and then decreased. In 2012, it was 1% lower than in
2000. In contrast, electricity use has continued to rise,
particularly in the domestic and commercial sectors,
and was 27% higher in 2013 than in 2000.
z The energy mix used for electricity generation has
significantly changed since 2000, when coal and
nuclear accounted for 65% of the total. In 2013,
renewable sources generated 39% of electricity, gas
and nuclear power each contributed 20%, and coal only
15% (Figure 5). Overall, renewable energy supply has
increased by a remarkable 147% since 2000.
z The population generates less waste per capita today
than in 2000. Municipal waste per capita decreased by
23% in 2000-12. Material recycling tripled since 2000,
but it still covers only 17% of municipal waste.
Two-thirds of waste is still landfilled.
z Spain’s material productivity improved due to the
decline in the use of materials in the construction
sector as well as an increase in recycling.
z While agricultural production has remained stable
since 2000, phosphorous and nitrogen balances
dropped significantly, due to a decrease in the
intensity of use of nitrogen and phosphorous fertilisers
(12% and 36% respectively between 2002-11) spurred
in part by the growth in organic farming. This helped
improve water quality.
NATURAL ASSETS
z Spain is home to 30% of all endemic European species.
Although, this rich biodiversity has come under threat:
almost 40% of habitats and species have a relatively
Green growth indicators | Spain
Figure 1: Decoupling emissions from economic growth, 1990=100
GHG emissions exclude emissions/removals from land use, land-use change and forestry. Source: IEA (2014), IEA CO2 Emissions from Fuel Combustion Statistics (database); IEA (2014), IEA World Energy Statistics and Balances (database); OECD (2014), OECD Economic Outlook No. 95 (database); UNFCCC (2014), GHG Data Interface (database).
OECD ENVIRONMENTAL PERFORMANCE REVIEW OF SPAIN

unfavourable conservation status. About 29% of the
Spanish land area and 8.4% of the territorial waters are
under some form of nature protection (see page 12).
z Forest covers one-third of the country. Forest area grew
by 8% over 2000-11, but the growing stock is among the
lowest in the OECD. Tree fellings increased by almost
20% between 2000-11, partly due to preventative
measures and damage from water shortages.
z Only 2% of total land is covered by artificial surfaces,
well below the EU average of 4.6%. Artificial areas
increased, in particular between 2009-12 (by 12%),
mostly due to the expansion of transport infrastructure
and construction sites. In the first part of the 2000s,
Spain had the highest annual rate of urban land take
among OECD member countries.
z Spain is considered a medium-high water-stressed
country: 30% of the total available renewable
resources are abstracted, mostly for irrigation. The
majority of bathing waters, an important asset for the
tourism sector, are of excellent quality.
ENVIRONMENTAL QUALITY OF LIFE
z Overall, the Spanish people report being satisfied with
their country’s environmental quality. They consider
air pollution and climate change as the environmental
issues that affect them and their families most. The
burden of disease attributable to environmental factors
is among the lowest in Europe.
z Emissions of air pollutants have decreased since 2000,
due to changes in the energy mix, better quality fuel,
and measures to reduce pollution from industry and the
power sector. Exposure to most air pollutants has been
reduced, although exposure to ozone and particulates in
Madrid and Barcelona exceeds recommended levels on a
number of days per year.
5
HIG
HLIG
HTS
Country
020406080100Water resources
0 500 1000Water abstraction
Iceland
New Zealand
Canada
Norway
Chile
Finland
Sweden
Australia
Slovenia
Slovak Republic
Hungary
Ireland
Austria
Estonia
United States
Portugal
Switzerland
Greece
Netherlands
Mexico
Japan
Turkey
Luxembourg
France
Denmark
Italy
Spain
Germany
Belgium
Poland
Czech Republic
Korea
United Kingdom
530.1
Spain is a water-stressed country. Country (group) 1
Spain
Other
Measure NamesTotal renewable water resources per capita (1000m3/hab)
Total renewable water resources per capita (1000m3/hab) and sum of Total freshwater abstraction per ca-pita (m3/hab) for each Country. For pane Sum of Total freshwater abstraction per capita (m3/hab): Colorshows details about Country (group) 1. For pane Sum of Total renewable water resources per capita(1000m3/hab): Color shows details about Total renewable water resources per capita (1000m3/hab). Thedata is filtered on Action (Country), which keeps 33 members. The view is filtered on sum of Total freshwa-ter abstraction per capita (m3/hab), which keeps all values.
Left panel: renewable water resources in 1000 m3 per inhabitant. Long-term annual averages. Right panel: Freshwater abstraction in m3 per inhabitant. 2012 or latest available year. Source: OECD (2014), OECD Environment Statistics (database).
Figure 2: A water - stressed country
2410 m3/hab 730 m3/hab
Figure 3: What is water used for in Spain?
Gross freshwater abstraction by major sector, 2010. Source: FAO (2014), FAOSTAT (database); OECD (2014), OECD Environment Statistics (database)

6
Spain’s dynamic economy was hit hard by the global economic and financial crisis, resulting in a significant contraction of activity, stringent budget cuts and high unemployment. To boost the recovery, the government implemented a wide range of measures to consolidate its fiscal position, stimulate economic growth, and diversify its economy beyond construction and tourism.
Policies for green growth
OECD ENVIRONMENTAL PERFORMANCE REVIEW OF SPAIN
A MORE RESILIENT ECONOMY
The National Reform and Stability programmes elaborated
under the European Semester process and the 2011
Sustainable Economy Law recognise that building a more
resilient economy requires putting a greater emphasis on
environment and energy issues. The programmes included
provisions for better mainstreaming of environmental issues
in economic policy. However, this objective needs to be more
specifically defined and monitored in order to be effective.
GREEN FISCAL REFORM
The 2014 “Lagares” report on fiscal reform provides a
good basis for developing a green tax reform agenda. As in
most countries, the tax burden on energy is lower than the
tax burden on labour. Environmentally related taxes have
fallen since 2007, and are among the lowest of the OECD,
while taxes on labour have increased (Figure 4). The Lagares
report proposed to simplify, consolidate and reform existing
environmental taxes to better capture environmental
externalities. This includes putting an end to the many tax
exemptions on diesel fuel and reducing taxes on labour.
Subsidies for renewable energy were the second highest
in Europe, reaching EUR 9.1 billion in 2013. This support
significantly increased the share of renewables in energy
supply (Figure 5) and stimulated the development of a
Figure 4: Environment and labour taxes in 2012
Source: OECD (2013), “Green Growth Indicators”, OECD Environment Statistics (database). http://dx.doi.org/10.1787/data-00665-en
competitive renewable energy sector. However, this policy
imposed a heavy financial burden, leading to a large funding
deficit in Spain’s electricity system. The government is
currently reforming the electricity system with the aim
of better balancing revenues and costs, while ensuring a
reasonable return for investors.
The Efficient Vehicle Incentives Programme replaced
previous schemes in 2012, with an aim to stimulate the
automotive industry and replace old vehicles with newer,
less polluting ones. This new scheme imposes CO2 limits
on vehicles purchased, but does not consider other air
emissions. Studies have found that the economic and
environmental benefits of these car-scrapping schemes are
limited at best.
EFFICIENT INVESTMENTS
As EU funding available for environmental infrastructure
in Spain declines, water, waste and sanitation tariffs will
need to provide a greater share of finance. Currently, these
tariffs are too low and they should be established in a
more transparent manner. In the 2014-20 financing period,
EU support will focus more on support for energy efficiency
and developing alternative sources of energy.
Energy Efficiency Action Plans for 2004-12 targeted
investments in the building and transport sectors, key
obstacles to achieving greenhouse gas reduction targets
5101520E nvironmentally related taxes (% G DP )
5 10 15 20Labour taxes (% G DP )
Environment and labour taxes in 2012
1,6% 11,5%

z Integrate green growth objectives and indicators into
Spain’s Stability and National Reform Programmes and
monitor progress.
z Extend and refine the use of environmentally related
taxes, including taxes on fuel, resource use, and pollution.
z Strengthen co-ordination of environmentally related
taxes between Autonomous Communities and the
central government.
z Remove fiscal measures and subsidies that are
environmentally harmful and economically inefficient.
z Strengthen procedures on disbursement of EU funding
for environment related investments to improve
transparency, by linking disbursement to preliminary
conditions and the achievement of measurable targets.
z Better target public support for eco-innovation to facilitate
its commercial application and strengthen demand.
z Promote green goods and services by increasing
consumer awareness and improving information.
z Focus Spain’s official development assistance on
fewer countries and themes, where Spain has a
comparative advantage.
for 2020. Yet, the investments could have been more
cost effective had stricter building codes and energy
performance certificates been introduced during the
construction boom, not after.
A high share of public R&D was invested in the energy
and environment sectors, which obtained more patents
than in any other sector. R&D support measures and
increased national and international demand for renewable
technologies stimulated patent applications. Public R&D was
significantly cut in 2010-11, but it increased again in 2014.
7
PHASING OUT SUBSIDIES TO COAL
Spain is currently phasing out subsidies to national coal
production. Operating cost support for hard coal production has
declined by approximately 90% since 2005. A EUR 400-450 million
subsidy to the generation of electricity from domestic coal, with a
priority dispatch into the electricity grid, is set to expire at the end
of 2014. Subsidies to coal mining companies will be terminated by
2018, in line with EU rules.
To mitigate the social cost of the closure of uncompetitive mines,
the Spanish government grants aid to compensate workers for early
retirement or job losses. While subsidies to production have declined,
aid for transition increased to total EUR 452 million in 2013.
HIG
HLIG
HTS
Next steps | towards green growth
Figure 5: Electricity generation : the growth of renewables
Source: IEA (2014), IEA World Energy Statistics and Balances (database).
0 10 20 30 40 50 60 70 80 90 100 110 120 130 140 150 160 170 180 190 200 210 220 230 240 250 260 270 280 290 300 310
T w H
2000
2006
2013
34,5 22,6 62,2 20,2 80,9
52,1 23,8 60,1 90,6 68,0
13,9 56,7 57,1 41,6
Renewable energy, including: Wind Solar Hydro Biofuels and waste Oil Nuclear Natural Gas Coal
55,8 13,1 36,8 5,3
111,0

8
Case studies
REDUCING EMISSIONSSpanish industry has become a leader in the adoption of environmental management systems and corporate social responsibility reporting. After Italy, Spain has the most Eco-Management and Audit Scheme-certified organisations (1 080) and sites (1 282). Industrial enterprises account for around half of this number. In 2008, one of the major aluminium producers signed an agreement with the Ministry of Agriculture, Food and the Environment and regional governments of Asturias and Galicia. It focused on reducing emissions of fluorinated gases in aluminium electrolytic production.
GREEN JOB OPPORTUNITIES
The region of Extremadura introduced a skills training programme for solar energy installations, targeting workers in the construction sector.
This type of regional programme is one of the efforts under the federal initiative Empleaverde, a programme funded mainly by the European Social Fund and operated by the Biodiversity Foundation. As of 2013, Empleaverde had supported the creation of 23 000 business lines or businesses and nearly 550 new direct jobs. In addition, 55 000 workers have been trained in reducing the environmental impacts of activities in their sector.
OECD ENVIRONMENTAL PERFORMANCE REVIEW OF SPAIN
EXTENSIVE FISH FARMING
Veta la Palma is a polyculture fish farming operation near Sevilla. The firm re-flooded damaged wetlands and restored original drainage channels to breed a large variety of fish in interconnected ponds, with a relatively low density.
The fish feed on microalgae and shrimp, not on external sources of fish feed. As birds are allowed to feed from the ponds, total fish production is slightly lower than in other fish farms, but the number of bird species in the area increased five-fold. The business provides income to about 100 farm workers from the nearby town. As a result of its pioneering efforts, Veta la Palma has been recognised as an exemplar case of sustainable and holistic agricultural development.
GALICIA
ASTURIAS
EXTREMADURA
Veta la Palma
Bay of Algeciras

9
CASE STUDIESTREES AGAINST EROSION
Andalusia, Catalonia, Cantabria and Asturias are the regions most affected by high degrees of soil erosion. Desertification and soil erosion are related to climate change, but also to urbanisation and changes in agriculture and land management.
To address these challenges, the Forest Law of 2006 and a 2008 National Action Programme were put into place. These efforts were supplemented by plans to plant 45 million trees, actions for climate change mitigation and rural development, as well as emergency hydrological restoration of burned forest areas.
FIGHTING FUEL POLLUTION The area around the Bay of Algeciras is heavily industrialised and more than 100 000 ships cross the Strait of Gibraltar in the bay every year. The area suffers from pollution, as a result of regular release of ballast waters, ship-to-ship bunkering or tank cleaning operations. In 2007, a particularly serious sulphur release incident took place. Responding to public protests, the environmental authorities of the autonomous community of Andalusia ordered an independent audit. In 2009, environmental organisations formed the Tripartite Forum to protect the bay.
HIG
HLIG
HTS
A MASTER PLAN FOR ALBUFERA NATIONAL PARKThe Albufera freshwater lagoon, separated from the Mediterranean Sea by sand dunes, creates a particular type of paddy landscape with a unique ecosystem.
Beyond its international ecological significance, it hosts various sustainable agricultural activities and nature based recreation close to the city of Valencia. The reserve became a National Park in 1986. As it was under threat of becoming a victim of its own success, a Master Plan for its use and management was implemented in 2004.
Albufera
Barcelona ASSESSING MOBILITY PLANS IN BARCELONA
Spain was an early adopter of strategic environmental assessments, in particular for municipal land-use plans. Most of them are qualitative, which compare environmental impacts of planned activities. However, some quantitative approaches have also emerged, such as the approach used to assess the Barcelona Metropolitan Area Mobility Director Plan. The evaluation allowed for the modelling of detailed environmental impacts of different transport modes.This plan also included a thorough public consultation.

10
EUROPEAN ACQUIS
Spain made progress in harmonising its laws with the
European Union (EU) acquis communautaire, but the
transposition of directives has often been late. Even when
laws were adopted, they were often not supported by
implementing regulations. Environmental infringements
were above the European average between 2007-13, and the
highest among EU members in 2012 and 2013.
DECENTRALISATION
The 17 Autonomous Communities (ACs) now have
strong regional and political identities and are effectively
autonomous in their areas of acquired competence. This
decentralisation gives the ACs broad scope to tailor their
policies to local needs. The challenge is then to establish
a coherent environmental framework across the country
and to implement it consistently. Initiatives for water and
biodiversity, for example, often need to be managed across
administrative boundaries.
Several institutions have been created to improve co-
ordination between the national authorities and ACs,
such as the Sectoral Conference on the Environment,
the Environment Advisory Council and the National
Council on Water. However, participation is voluntary
Spain’s environmental governance, like the rest of the country, is highly decentralised. New initiatives have helped to improve co-ordination of environmental policies in its 17 Autonomous Communities. These mechanisms could still be reinforced. Driven by European Union requirements, the many laws and regulations enacted during the last decade have increased the complexity of the environmental regulatory framework. Spain is now working on streamlining regulations and reducing the regulatory burden on firms. Further streamining efforts are needed, without compromising environmental ambitions.
OECD ENVIRONMENTAL PERFORMANCE REVIEW OF SPAIN
In-depth | environmental governance
FIGHTING ENVIRONMENTAL CRIME
The Nature Protection Service (Servicio de Protección de la Naturaleza, SEPRONA) was created
in 1988 as part of the Civil Guard. With its 1 700 officers, it addresses 115 000 to 160 000 cases
related to environmental crimes every year, including illegal trade of protected species, releases
of pollution to waterways and soil, illegal logging and arson, poaching and animal welfare. The
SEPRONA is also involved in investigating illegal handling, treatment and disposal of dangerous
substances and waste.
The largest proportion of complaints relate to infringements of wildlife legislation and
inadequate waste management. About half of criminal offences related to arson. Between 300
and 1 000 people are arrested every year for criminal offences against environment regulations.
Citizens play an important role in detection of environmental infringements by reporting
offences through calls and emails.
and jurisdictional disputes limit their effectiveness. The
Environmental Inspection Network provides a useful forum
for regional authorities and has improved the consistency
of enforcement of envionrmental legislation. Sufficient
financing and dedicated long-term staff would make it
more effective in the long-term.
There are more than 8 000 municipalities in Spain, 84%
of them with less than 5 000 inhabitants. While most
are responsible for the provision of water and waste
management services, the larger municipalities also have
environmental regulatory functions, such as permitting.
Uncertainties about the roles of municipal, provincial and
regional levels of government, as well as capacity and
resource constraints, have impeded attempts to improve
environmental conditions in some urban areas, particularly
air and water quality.
BURDENS AND REFORMS
The Commission to Reform Public Administrations was
created in 2013, leading to reforms of environmental
impact assessment, environmental liability and coastal
zone management. In 2014, the provisions of the
liability law were simplified, which reduced the burden
on many small and medium enterprises. However, it is

z Promote a debate with all stakeholders to develop
clear national strategies on issues such as water, waste,
environmental information that require a consistent approach.
z Conduct an independent assessment of existing
co-ordination mechanisms and find out how they could
be improved.
z Reinforce support for the Network on Environmental
Enforcement and provide a platform for sharing good
practices and benchmarking.
z Further reduce potential risks from air pollutants by
strengthening policies to reduce emissions.
Next steps | governance
important that streamlining regulations does not weaken
environmental objectives.
Administrative burden. A recent OECD study suggested that
Spain is the member country where environmental policies
cause the highest burden to the economy in influencing
market entry and competition (Figure 6). The government
recently took measures to reduce the administrative burden
on firms, for instance through the 2012 Law on Urgent
Environmental measures, that significantly reformed
permitting, licensing and planning requirements.
ENVIRONMENTAL INFORMATION
Spain made impressive efforts in recent years to improve the
collection and dissemination of environmental information
at both national and AC level with topic-focused databases,
registries and inventories. The National Statistics Institute
consolidated its system in line with EU requirements.
Progress has been made in harmonising biodiversity-related
data. The main challenge now is to make environmental
information more consistent across regions.
11
HIG
HLIG
HTS
Figure 6: Stringency and burdens of environmental policies
Mor
e st
ringe
nt e
nviro
nmen
tal p
olic
ies
Policies more burdensome to entry and competition
Source: http://dx.doi.org/10.1787/5jxrjnc45gvg-en. More information on http://www.oecd.org/environment/do-environmental-policies-matter-for-productivity-growth.htmMany burdensFew burdens
JAPPOL
CANEnvi
ronm
enta
l pol
icie
sM
ore
strin
gent
Less
str
inge
nt
Few Burdens on the economy More
Some countries manage to have more stringent environmental policies (where polluting costs more to firms) without creating extra burdens on their economy. A recent OECD indicator shows that Spain is in the upper OECD average for stringency; but it is also the country where economic policies create the most barriers to entry and competition.Source: http://dx.doi.org/10.1787/5jxrjnc45gvg-en. More information on http://www.oecd.org/environment/do-environmental-policies-matter-for-productivity-growth.htm
Burdens on the economy due to environmental policies
z Support groups of municipalities to deliver water, waste
and other services more efficiently and effectively, including
with financial incentives,
z Conduct more economic analysis, before and after the
implementation of environmental policies, develop closer
links with the research community, and assess and improve
the environmental impact of major policy initiatives.
z Improve public access to environmental information, in
accordance with the Aarhus Convention, by reinforcing
efforts to respond to citizens’ requests, strengthening access
to consultation processes and to justice.
12
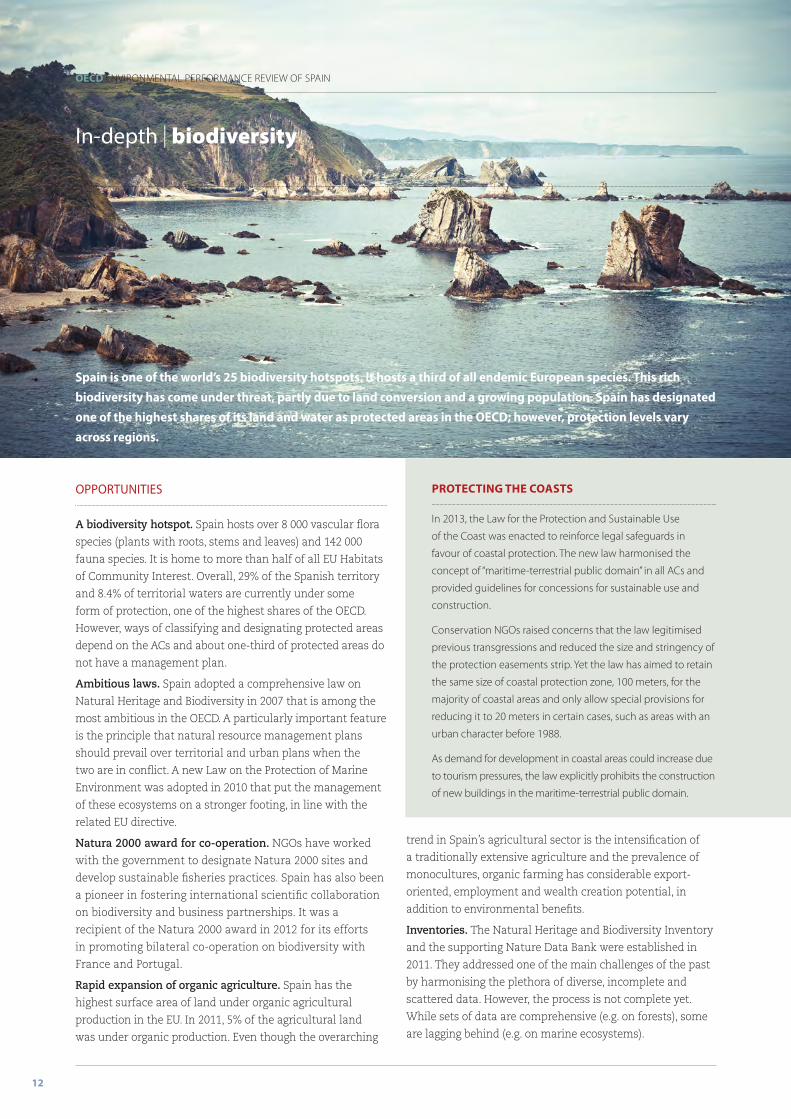
Spain is one of the world’s 25 biodiversity hotspots. It hosts a third of all endemic European species. This rich biodiversity has come under threat, partly due to land conversion and a growing population. Spain has designated one of the highest shares of its land and water as protected areas in the OECD; however, protection levels vary across regions.
OPPORTUNITIES
A biodiversity hotspot. Spain hosts over 8 000 vascular flora
species (plants with roots, stems and leaves) and 142 000
fauna species. It is home to more than half of all EU Habitats
of Community Interest. Overall, 29% of the Spanish territory
and 8.4% of territorial waters are currently under some
form of protection, one of the highest shares of the OECD.
However, ways of classifying and designating protected areas
depend on the ACs and about one-third of protected areas do
not have a management plan.
Ambitious laws. Spain adopted a comprehensive law on
Natural Heritage and Biodiversity in 2007 that is among the
most ambitious in the OECD. A particularly important feature
is the principle that natural resource management plans
should prevail over territorial and urban plans when the
two are in conflict. A new Law on the Protection of Marine
Environment was adopted in 2010 that put the management
of these ecosystems on a stronger footing, in line with the
related EU directive.
Natura 2000 award for co-operation. NGOs have worked
with the government to designate Natura 2000 sites and
develop sustainable fisheries practices. Spain has also been
a pioneer in fostering international scientific collaboration
on biodiversity and business partnerships. It was a
recipient of the Natura 2000 award in 2012 for its efforts
in promoting bilateral co-operation on biodiversity with
France and Portugal.
Rapid expansion of organic agriculture. Spain has the
highest surface area of land under organic agricultural
production in the EU. In 2011, 5% of the agricultural land
was under organic production. Even though the overarching
In-depth | biodiversity
OECD ENVIRONMENTAL PERFORMANCE REVIEW OF SPAIN
PROTECTING THE COASTS
In 2013, the Law for the Protection and Sustainable Use
of the Coast was enacted to reinforce legal safeguards in
favour of coastal protection. The new law harmonised the
concept of “maritime-terrestrial public domain” in all ACs and
provided guidelines for concessions for sustainable use and
construction.
Conservation NGOs raised concerns that the law legitimised
previous transgressions and reduced the size and stringency of
the protection easements strip. Yet the law has aimed to retain
the same size of coastal protection zone, 100 meters, for the
majority of coastal areas and only allow special provisions for
reducing it to 20 meters in certain cases, such as areas with an
urban character before 1988.
As demand for development in coastal areas could increase due
to tourism pressures, the law explicitly prohibits the construction
of new buildings in the maritime-terrestrial public domain.
trend in Spain’s agricultural sector is the intensification of
a traditionally extensive agriculture and the prevalence of
monocultures, organic farming has considerable export-
oriented, employment and wealth creation potential, in
addition to environmental benefits.
Inventories. The Natural Heritage and Biodiversity Inventory
and the supporting Nature Data Bank were established in
2011. They addressed one of the main challenges of the past
by harmonising the plethora of diverse, incomplete and
scattered data. However, the process is not complete yet.
While sets of data are comprehensive (e.g. on forests), some
are lagging behind (e.g. on marine ecosystems).

13
HIG
HLIG
HTS
z Continue to fill gaps in data and improving its consistency
in order to improve national assessments of biodiversity and
ecosystems.
z Strengthen the role of economic analysis in the assessment
of ecosystems and the evaluation of policies and targets.
z Consider reforming current institutional arrangements
to make better use of resources, improve inter-regional
co-operation and dialogue, and develop long-term work
programmes.
Next steps | biodiversity
BIODIVERSITY
CHALLENGES
Land conversion. About one-third of Spain’s terrestrial
species and just over half of its freshwater species are
threatened. 45% of ecosystem services are considered to
be degraded or used unsustainably. Among key factors
underlying these trends has been land conversion for
agriculture, tourism, manufacturing, as well as construction
and transport infrastructure, particularly in coastal areas.
Invasive alien species and climate change reinforce these
pressures.
Valuing ecosystem services. Initiatives such as the
Valuation of Natural Assets of Spain and the Spanish
national Millennium Ecosystem Assessment have developed
insights into how changes in ecosystems are affecting
human welfare. Economic assessments in other countries
have helped to demonstrate that the benefits of expanding
Natura 2000 sites far outweigh the costs. In Spain, only the
costs have been examined thus far.
z Assess the impact of declining budgets on biodiversity
challenges and consider alternative sources of financing, such
as payment for ecosystem services and biodiversity offsets.
z Reduce pressures on biodiversity from key sectors such as
agriculture, transport, construction and tourism and promote
markets for biodiversity-friendly products and services.
z Step up co-operation with environmental NGOs, business
and the academic community.
Decentralisation. ACs are in charge of implementing most
biodiversity policies, with the State Commission on Natural
Heritage and Biodiversity providing co-ordination at the
national level. There is still a gap between the national
authorities’ focus on transposing EU Directives, and the
Autonomous Communities’ focus on implementation.
Staffing and financing issues can cause difficulties in
managing some national parks.
Adressing the financing gap. The reductions in public
budgets are clearly impacting the ability of public authorities
to maintain existing natural parks and species protection
programmes and to address new and emerging problems,
such as habitat fragmentation. Monitoring and research also
come at a cost. Part of this could be addressed by a more
effective use of existing resources. Alternative economic
instruments could also provide revenues, as well as incentives
for conservation and sustainable use of biodiversity.
31%of terrestrial vertebrates
are threatened
25% of birdsBalearic shearwater
32% of reptilesHermann’s tortoise
34% of amphibiansMallorcan midwife toad
20% of land mammalsIberian lynx
54% of freshwater fishSpanish toothcarp
(Magrama, 2013)

14
The environmental performance of Spain’s industrial sector has steadily improved since the turn of the century. The sector’s footprint is smaller than in many other European countries, due to the implementation of mandatory requirements, investments in new technologies as well as the impact of the global economic downturn.
Quick focus | industrial sector
OECD ENVIRONMENTAL PERFORMANCE REVIEW OF SPAIN
Regulatory compliance and cost savings are the most important drivers of environmental
improvements in the industrial sector, according to a recent OECD survey of firms. Faster
implementation of the EU environmental acquis would further improve performance.
The environmental goods and services sector expanded since the early 2000s, supported by
dynamic research and development activities (see p. 6) and the 2008 Green Procurement Plan.
Its output reached 2% of GDP (agriculture is 2.4%) and employment increased while employment
in other industrial sectors decreased sharply.
Environmental management systems. Spain is among the top three countries in terms of
number of certifications under the Eco-management and Audit Scheme or ISO 14000. These high
rates of adoption are linked to requirements in supply chains and the benefits of regulatory relief
that come with certification. However, it is not clear if these certifications result in improved
environmental outcomes. Spain is also very active in eco-labelling and a leader in corporate
social responsibility reporting.
Pollution from industrial sources remains. It imposes significant costs on human health and the
environment in a few hotspots, such as the Bay of Algeciras (see p. 8), the chemical industry in
Flix or the Huelva industrial-chemical complex, one of the most contaminated zones in the EU.
As the economy begins to recover, some air emissions and waste generation have increased.
Tax breaks. Financial incentives or tax breaks are frequently used to promote more
environmentally-friendly practices of firms, although these are generally less effective than
environmental taxes and other policy instruments. Payments from the manufacturing industry
represent only 7.9% of environmentally related taxes.
14
z Reinforce dialogue between ministries
responsible for industrial development and the
environment, at regional and national level, with
a view to better integrating these policies.
z Further streamline environmental
requirements, particularly for small and medium-
sized enterprises, without compromising
environmental objectives.
z Develop a coherent national environmental
inspection and compliance assurance strategy
with a risk-based approach involving national
and regional authorities.
Next steps | industrial sector
z Reinforce the Network of Environmental
Enforcement Agencies and make requirements
more coherent and consistent.
z Strengthen the capacity of Autonomous
Communities to apply the environmental liability
law and the judiciary to adjudicate litigation.
z Reduce the potential risks to health and the
environment in industrial pollution hotspots
with a clear strategy.
z Co-ordinate better industrial, innovation
and eco-innovation policies between the
national and regional governments, academic
institutions and business sectors.

Useful resources
PUBLICATIONS
OECD Environmental Performance Reviews: Spain 2015
OECD Publishing, http://dx.doi.org/10.1787/9789264226883-en
Towards Green Growth
OECD Publishing, http://dx.doi.org/10.1787/9789264111318-en
www.oecd.org/greengrowth/towardsgreengrowth.htm
MORE INFORMATION
EPR programme
www.oecd.org/environment/country-reviews/
Country profiles
www.oecd.org/site/envind
Contact
Photo & icon creditsCover: Igor Plotnikov/Shutterstock; pedrosala/Shutterstock. p.2-3: Roberto
A Sanchez/iStock. p. 4-5: mercedes rancaño/iStock; Eloi_Omella/iStock. Icons from Thenounproject.com (CC): Carlos Valerio; Sandor Szabo; Shrihari
Sankaran; Laurent Patain. p.6-7: mercedes rancaño/iStock; afj1977/iStock; Icons from Thenounproject.com (CC): David Chapman; Mark Caron; Anthony
Lui; Marli du Plessis; Iconathon; Rothith MS; deadtype; Waleed Al-Alami. p.8-9: GabrielGomezGodoy (Flickr/CC); typo-graphics/iStock; Santi Gonzalez
(Flickr/CC); ShailaGF/iStock; ahau1969/iStock; IgorSPb/iStock; monica-photo/iStock. p.10-11: Elentir (Flickr/Creative Commons); CopsAdmirer (Flickr/CC);
SelenaRus/iStock. p.12-13: Peeter Viisimaa/iStock; Programa de Conservacion ex-situ del Lince Ibérico (Creative Commons); Jordi Roy Gabarra (Flickr/
Creative Commons); Tuurio and Wallie (Creative Commons); Muchaxo (Flickr/Creative Commons); s-eyerkaufer/iStock. p.14-15: iFelino/iStock.