Embed Size (px)
Citation preview
1/14
2016-03_VERJ2019_Suzaku_JPS.ppt
T. Mizuno et al.
「すざく」による広がったTeVガンマ線放射VER J2019+368のX線観測(2)
Suzaku Observation of the extended TeVgamma-ray source VER J2019+368(2)
September 25, 2015@JPS meetingTsunefumi Mizuno (Hiroshima Univ.)
N. Tanaka, H. Takahashi, J. Katsuta (Hiroshima Univ.), K. Hayashi (ISAS/JAXA), R. Yamazaki (AGU)
2/14
2016-03_VERJ2019_Suzaku_JPS.ppt
T. Mizuno et al.
Contents
• Introduction– Past obs. in TeV -rays and X-rays
• Observations by Suzaku• Data Analysis and Results• Discussion• Summary
3/14
2016-03_VERJ2019_Suzaku_JPS.ppt
T. Mizuno et al.
Past Obs. by Milagro & VERITAS
Aliu+14, ApJ 788, 78
Aliu+14, ApJ 788, 78
E>1TeVE=0.6-1TeV
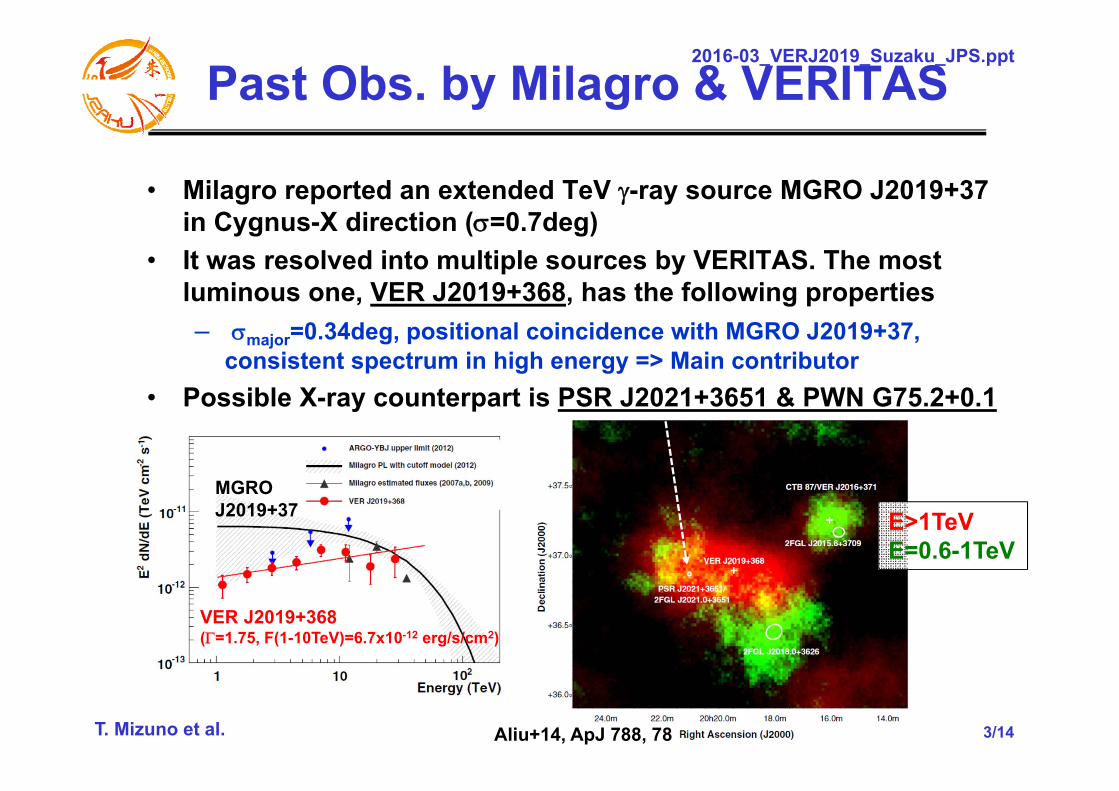
MGRO J2019+37
VER J2019+368(=1.75, F(1-10TeV)=6.7x10⁻¹² erg/s/cm2)
• Milagro reported an extended TeV -ray source MGRO J2019+37 in Cygnus-X direction (=0.7deg)
• It was resolved into multiple sources by VERITAS. The most luminous one, VER J2019+368, has the following properties– major=0.34deg, positional coincidence with MGRO J2019+37,
consistent spectrum in high energy => Main contributor• Possible X-ray counterpart is PSR J2021+3651 & PWN G75.2+0.1
4/14
2016-03_VERJ2019_Suzaku_JPS.ppt
T. Mizuno et al.
Past Obs. in X-Rays
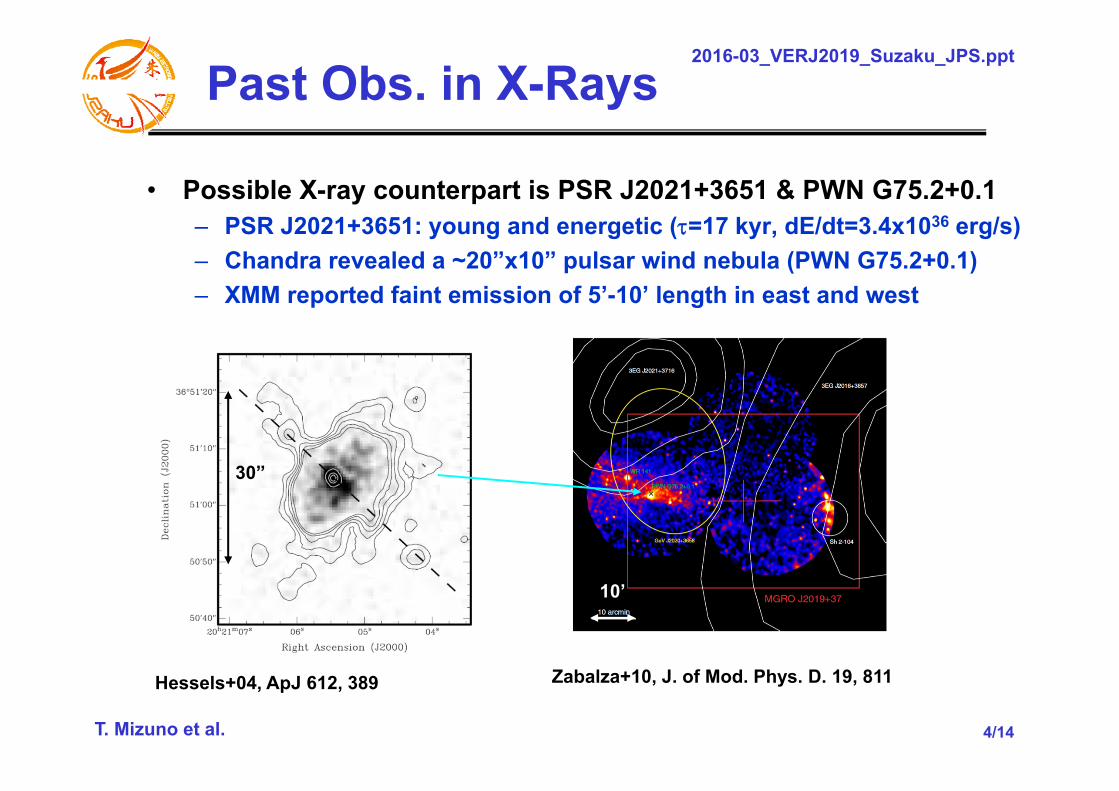
• Possible X-ray counterpart is PSR J2021+3651 & PWN G75.2+0.1– PSR J2021+3651: young and energetic (=17 kyr, dE/dt=3.4x1036 erg/s)– Chandra revealed a ~20”x10” pulsar wind nebula (PWN G75.2+0.1)– XMM reported faint emission of 5’-10’ length in east and west
Hessels+04, ApJ 612, 389 Zabalza+10, J. of Mod. Phys. D. 19, 811
30”
10’
5/14
2016-03_VERJ2019_Suzaku_JPS.ppt
T. Mizuno et al.
Problems of the PSR/PWN Scenario
• Possible X-ray counterpart is PSR J2021+3651 & PWN G75.2+0.1– PSR J2021+3651: =17 kyr, dErot/dt=3.4x1036 erg/s– PWN G75.2+0.1: revealed by Chandra and found to extend out 5’-10’
in length in east and west by XMM• Several issues of the PSR/PWN scenario have been pointed out
(e.g., Abdo+09, ApJ 799, 1059; Parades+09, A&A507, 241)– Large dispersion measure (370 pc/cm3) and rotation measure (524
rad/m2) indicate large distance to the source (d>10 kpc). • -ray luminosity of PSR too high compared to dErot/dt• Source size (~90 pc for 0.5 deg at 10 kpc) too large for high-
energy electrons to fill before cooling– X-rays from only small portion of TeV emission
• Detailed study of the PWN properties (spectrum, morphology) and search for unknown extended emission by Suzaku-XIS
6/14
2016-03_VERJ2019_Suzaku_JPS.ppt
T. Mizuno et al.
Suzaku Obs. of VER J2019+368
P2 P3
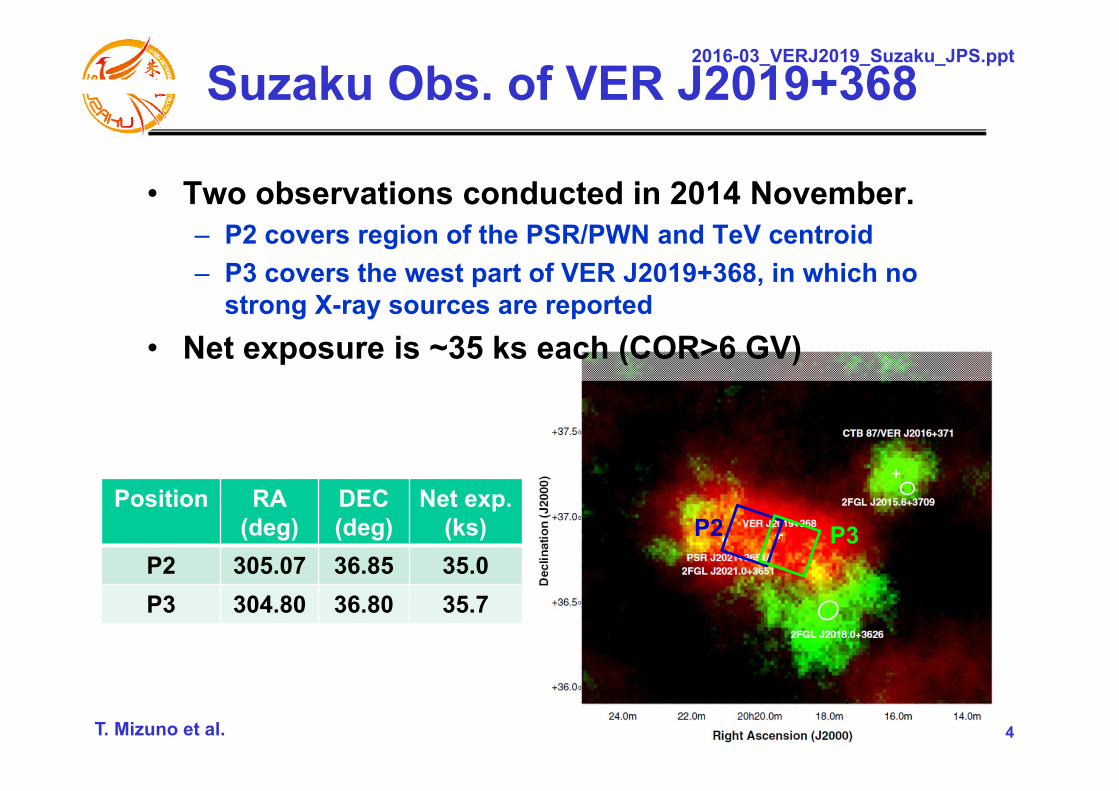
• Two observations conducted in 2014 November. – P2 covers region of the PSR/PWN and TeV centroid– P3 covers the west part of VER J2019+368, in which no
strong X-ray sources are reported• Net exposure is ~35 ks each (COR>6 GV)
Position RA(deg)
DEC(deg)
Net exp.(ks)
P2 305.07 36.85 35.0P3 304.80 36.80 35.7
7/14
2016-03_VERJ2019_Suzaku_JPS.ppt
T. Mizuno et al.
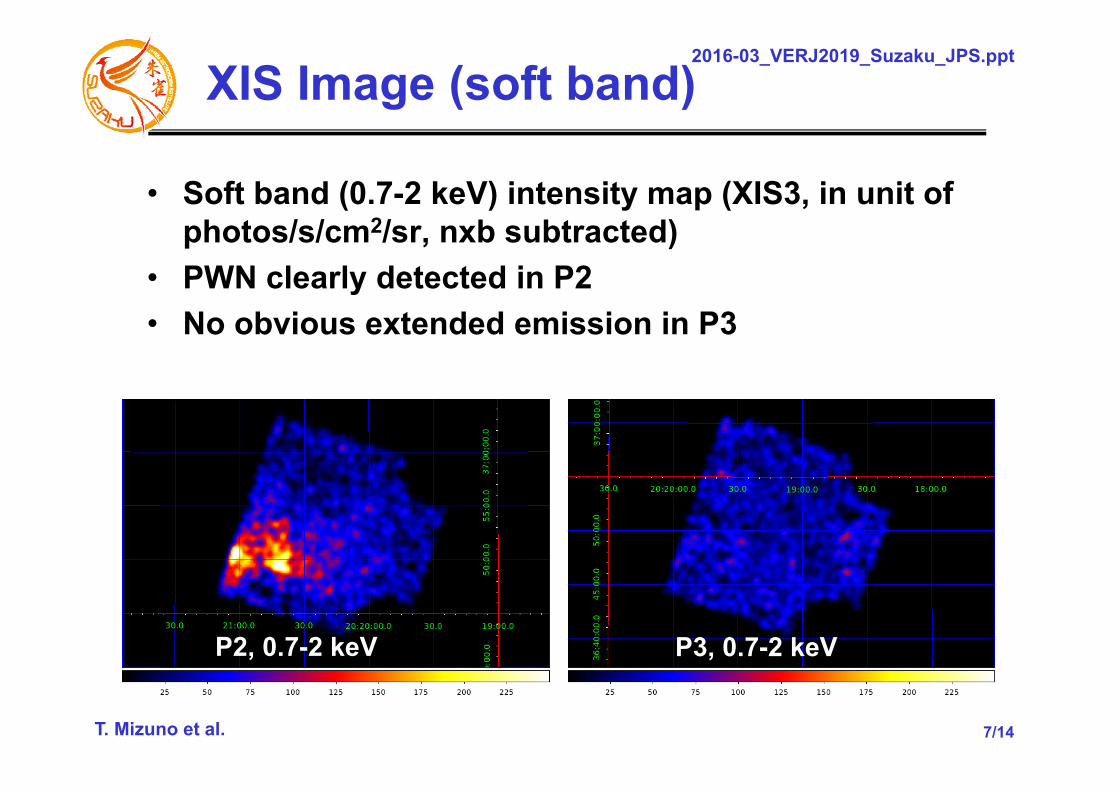
XIS Image (soft band)
• Soft band (0.7-2 keV) intensity map (XIS3, in unit of photos/s/cm2/sr, nxb subtracted)
• PWN clearly detected in P2• No obvious extended emission in P3
P2, 0.7-2 keV P3, 0.7-2 keV
8/14
2016-03_VERJ2019_Suzaku_JPS.ppt
T. Mizuno et al.
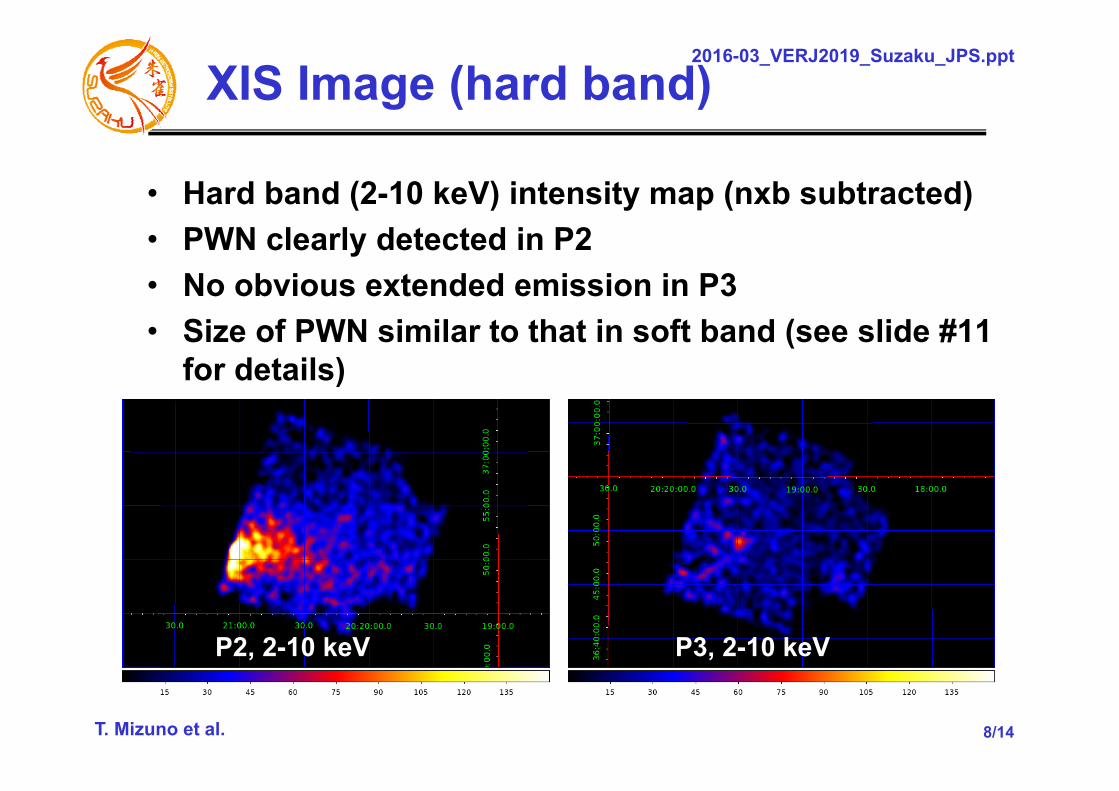
XIS Image (hard band)
• Hard band (2-10 keV) intensity map (nxb subtracted)• PWN clearly detected in P2• No obvious extended emission in P3• Size of PWN similar to that in soft band (see slide #11
for details)
P2, 2-10 keV P3, 2-10 keV
9/14
2016-03_VERJ2019_Suzaku_JPS.ppt
T. Mizuno et al.
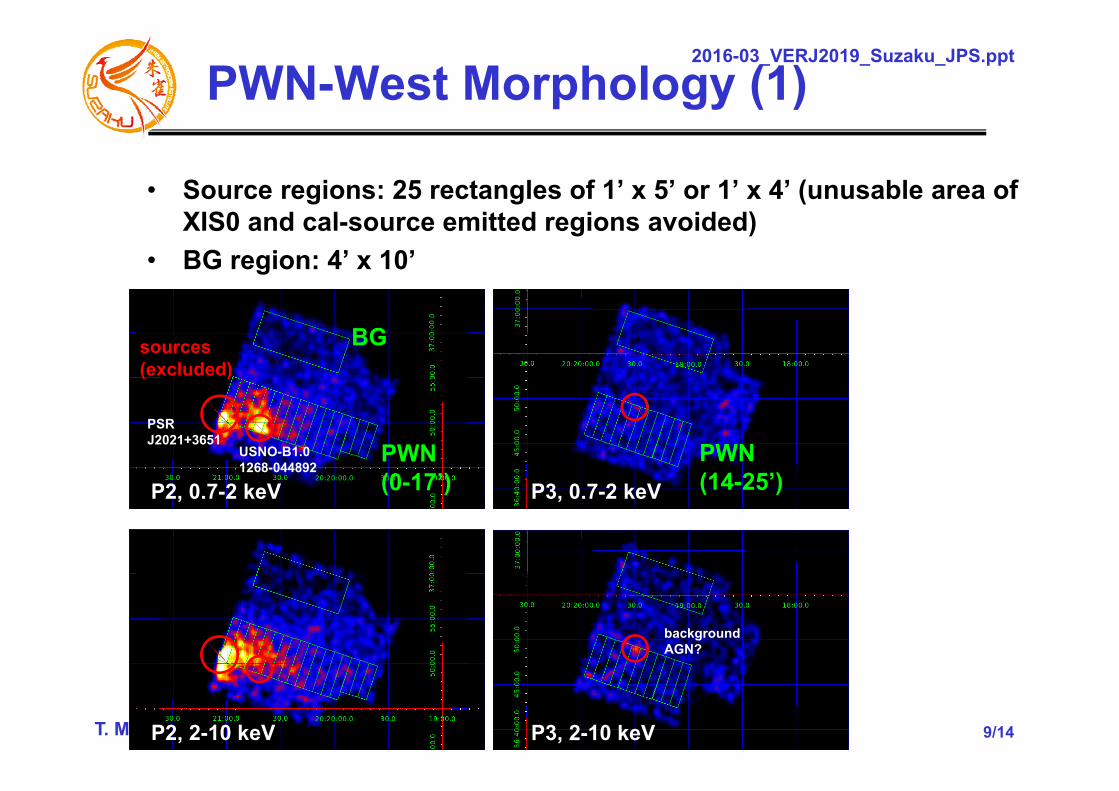
PWN-West Morphology (1)
• Source regions: 25 rectangles of 1’ x 5’ or 1’ x 4’ (unusable area of XIS0 and cal-source emitted regions avoided)
• BG region: 4’ x 10’
sources(excluded)
PWN(0-17’)
BG
P2, 0.7-2 keV
P2, 2-10 keV
P3, 0.7-2 keV
P3, 2-10 keV
PWN(14-25’)
PSR J2021+3651
USNO-B1.01268-044892
background AGN?
10/14
2016-03_VERJ2019_Suzaku_JPS.ppt
T. Mizuno et al.
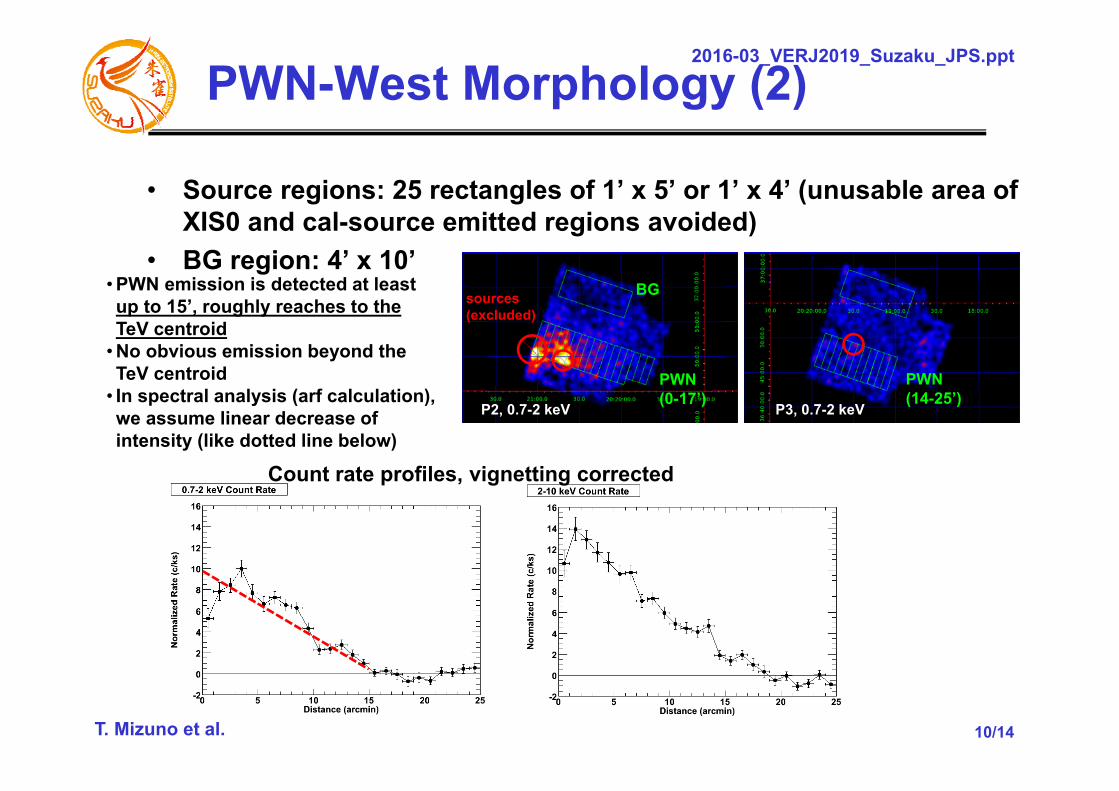
PWN-West Morphology (2)
• Source regions: 25 rectangles of 1’ x 5’ or 1’ x 4’ (unusable area of XIS0 and cal-source emitted regions avoided)
• BG region: 4’ x 10’• PWN emission is detected at least up to 15’, roughly reaches to the TeV centroid
• No obvious emission beyond the TeV centroid
• In spectral analysis (arf calculation), we assume linear decrease of intensity (like dotted line below)
Count rate profiles, vignetting corrected
sources(excluded)
PWN(0-17’)
BG
P2, 0.7-2 keV P3, 0.7-2 keV
PWN(14-25’)
11/14
2016-03_VERJ2019_Suzaku_JPS.ppt
T. Mizuno et al.
XIS0XIS1XIS3
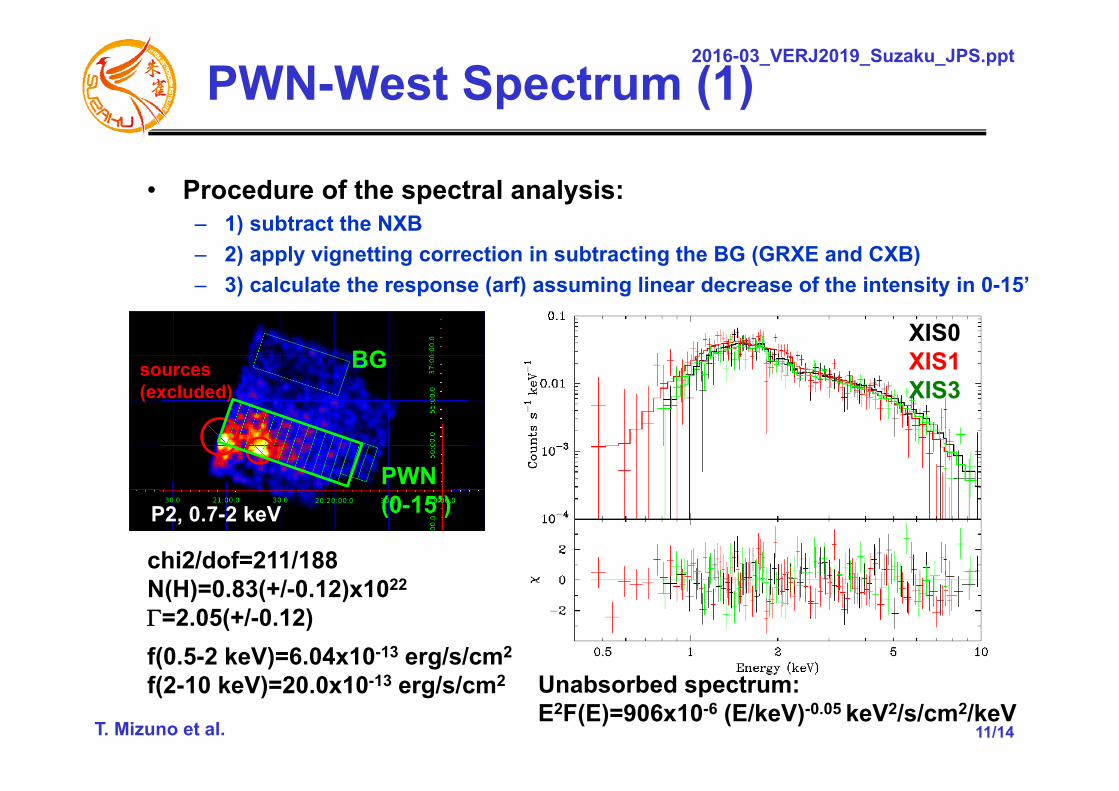
PWN-West Spectrum (1)
• Procedure of the spectral analysis:– 1) subtract the NXB– 2) apply vignetting correction in subtracting the BG (GRXE and CXB)– 3) calculate the response (arf) assuming linear decrease of the intensity in 0-15’
chi2/dof=211/188N(H)=0.83(+/-0.12)x1022
=2.05(+/-0.12)
Unabsorbed spectrum:E2F(E)=906x10-6 (E/keV)-0.05 keV2/s/cm2/keV
f(0.5-2 keV)=6.04x10⁻¹³ erg/s/cm2
f(2-10 keV)=20.0x10⁻¹³ erg/s/cm2
sources(excluded)
PWN(0-15’)
BG
P2, 0.7-2 keV
12/14
2016-03_VERJ2019_Suzaku_JPS.ppt
T. Mizuno et al.
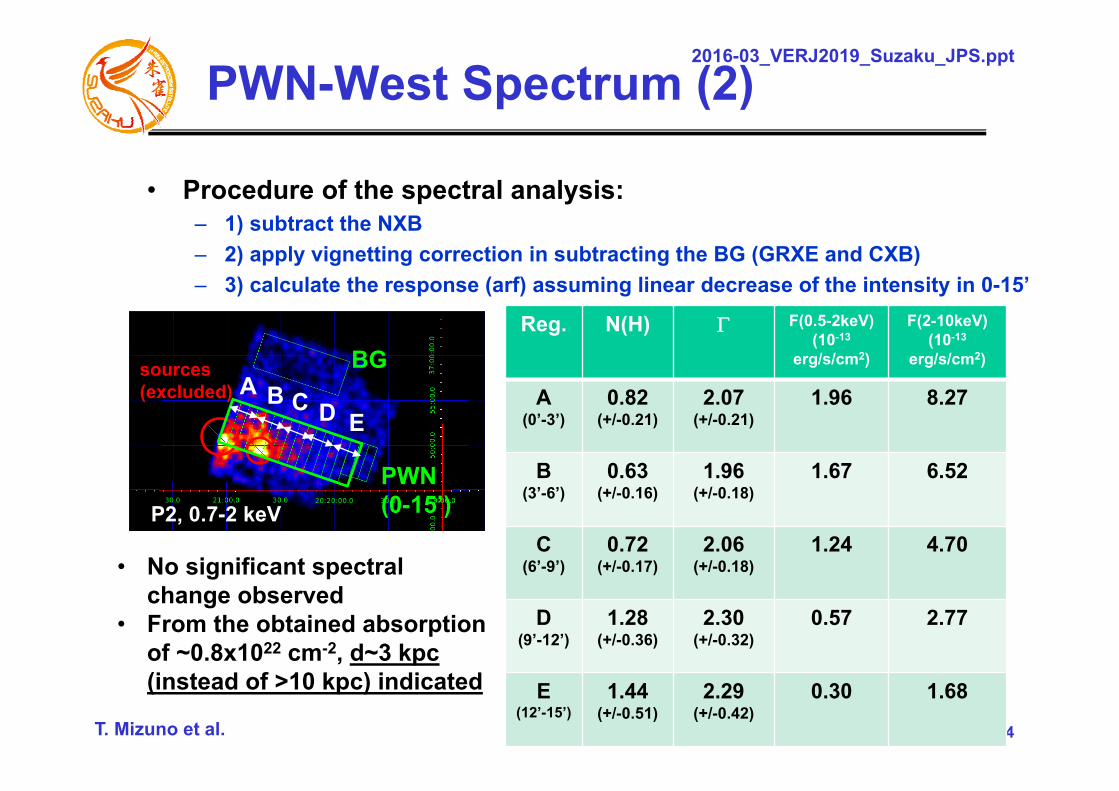
PWN-West Spectrum (2)
• Procedure of the spectral analysis:– 1) subtract the NXB– 2) apply vignetting correction in subtracting the BG (GRXE and CXB)– 3) calculate the response (arf) assuming linear decrease of the intensity in 0-15’
sources(excluded)
PWN(0-15’)
BG
P2, 0.7-2 keV
A B C D E
Reg. N(H) F(0.5-2keV)(10-13
erg/s/cm2)
F(2-10keV)(10-13
erg/s/cm2)
A(0’-3’)
0.82(+/-0.21)
2.07(+/-0.21)
1.96 8.27
B(3’-6’)
0.63(+/-0.16)
1.96(+/-0.18)
1.67 6.52
C(6’-9’)
0.72(+/-0.17)
2.06(+/-0.18)
1.24 4.70
D(9’-12’)
1.28(+/-0.36)
2.30(+/-0.32)
0.57 2.77
E(12’-15’)
1.44(+/-0.51)
2.29(+/-0.42)
0.30 1.68
• No significant spectral change observed
• From the obtained absorption of ~0.8x1022 cm-2, d~3 kpc(instead of >10 kpc) indicated
13/14
2016-03_VERJ2019_Suzaku_JPS.ppt
T. Mizuno et al.
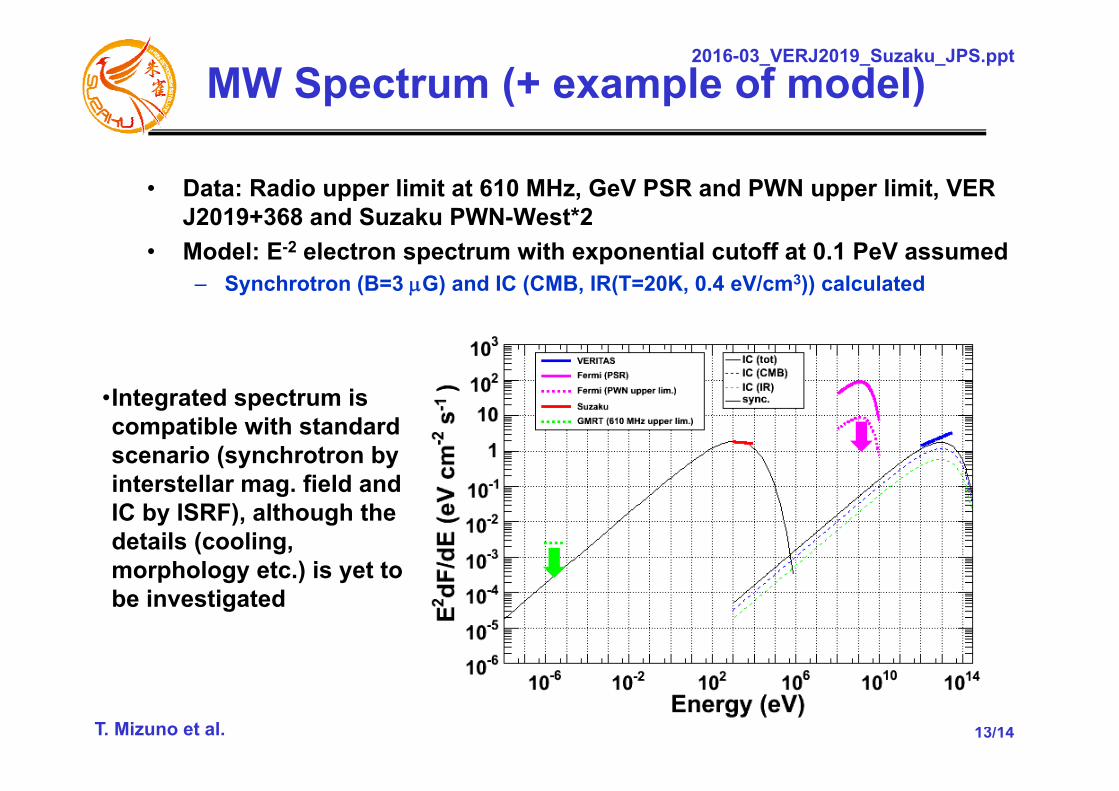
MW Spectrum (+ example of model)
• Data: Radio upper limit at 610 MHz, GeV PSR and PWN upper limit, VER J2019+368 and Suzaku PWN-West*2
• Model: E-2 electron spectrum with exponential cutoff at 0.1 PeV assumed– Synchrotron (B=3 G) and IC (CMB, IR(T=20K, 0.4 eV/cm3)) calculated
•Integrated spectrum is compatible with standard scenario (synchrotron by interstellar mag. field and IC by ISRF), although the details (cooling, morphology etc.) is yet to be investigated
14/14
2016-03_VERJ2019_Suzaku_JPS.ppt
T. Mizuno et al.
Summary & Future Plan
• VER J2019+368 is an extended (major=0.34deg) and hard (=1.75) TeV -ray source in Cyg-X direction
• PSR J2021+3651/PWN G75.2+0.1 is a possible counterpart, but several issues are pointed out (distance, morphology)
• We analyzed Suzaku-XIS data in detail– PWN detected up to 15’ to the west (N(H)=8.2x10²¹
cm-2, =2.05, f(2-10 keV)=2.0x10⁻¹² erg/s/cm2)– No significant spectral change found
• Next Step: Discuss the scenario to explain X-rays and TeV -rays
Thank you for your Attention
15/14
2016-03_VERJ2019_Suzaku_JPS.ppt
T. Mizuno et al.
Reference
• Abdo+12, ApJ 753, 159• Aliu+14, ApJ 788, 78• Hessels+04, ApJ 612, 389• Zabalza+10, J. of Mod. Phys. D. 19, 811• Parades+09, A&A 507, 241• Yoshida+11, PASJ 63, S717• Mizuno+15, ApJ 803, 74• Abdo+09, ApJ 700, 1059• Etten+08, ApJ 680, 1417• Watters+09, ApJ 695, 1289
16/14
2016-03_VERJ2019_Suzaku_JPS.ppt
T. Mizuno et al.
Appendix
17/14
2016-03_VERJ2019_Suzaku_JPS.ppt
T. Mizuno et al.
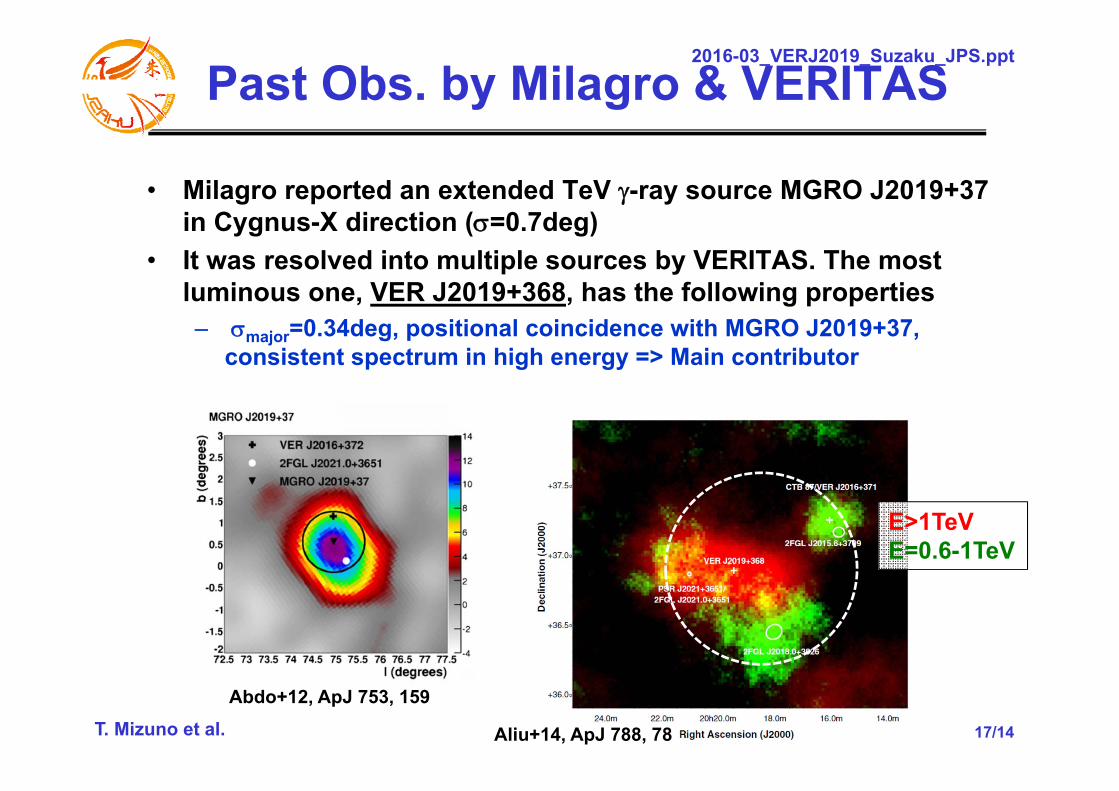
Past Obs. by Milagro & VERITAS
• Milagro reported an extended TeV -ray source MGRO J2019+37 in Cygnus-X direction (=0.7deg)
• It was resolved into multiple sources by VERITAS. The most luminous one, VER J2019+368, has the following properties– major=0.34deg, positional coincidence with MGRO J2019+37,
consistent spectrum in high energy => Main contributor
Abdo+12, ApJ 753, 159 Aliu+14, ApJ 788, 78
Aliu+14, ApJ 788, 78
E>1TeVE=0.6-1TeV
18/14
2016-03_VERJ2019_Suzaku_JPS.ppt
T. Mizuno et al.
Properties and Implications
• N(H) of the PWN ~0.8x1022 cm-2, similar to that of the PSR (Hessels+04)– Sources in Cygnus-X (d~1.4 kpc) shows absorption of (0.2-0.6)x1022 cm-2
(Yoshida+11), whereas Galactic total absorption is estimated to be (2-3)x1022
cm-2 (Mizuno+15). => d~3 kpc is indicated. Then the -ray luminosity of the PSR ~ 4.6x1035 erg/s < dErot/dt=3.4x1036 erg/s.
• F(2-10 keV)~2.0x10⁻¹² erg/s/cm2 for the west part of the PWN– F(1-10 TeV)/F(2-10 keV) ~3. It will be further reduced if we include the whole
emission of the PWN • PWN extends up to 15’ to the west, roughly reaches to the TeV centroid• No significant spectral change observed. No significant diffuse emission
in P3 (beyond TeV centroid) found
• If all these properties can be explained simultaneously or not (=PWN scenario) in under investigation
19/14
2016-03_VERJ2019_Suzaku_JPS.ppt
T. Mizuno et al.
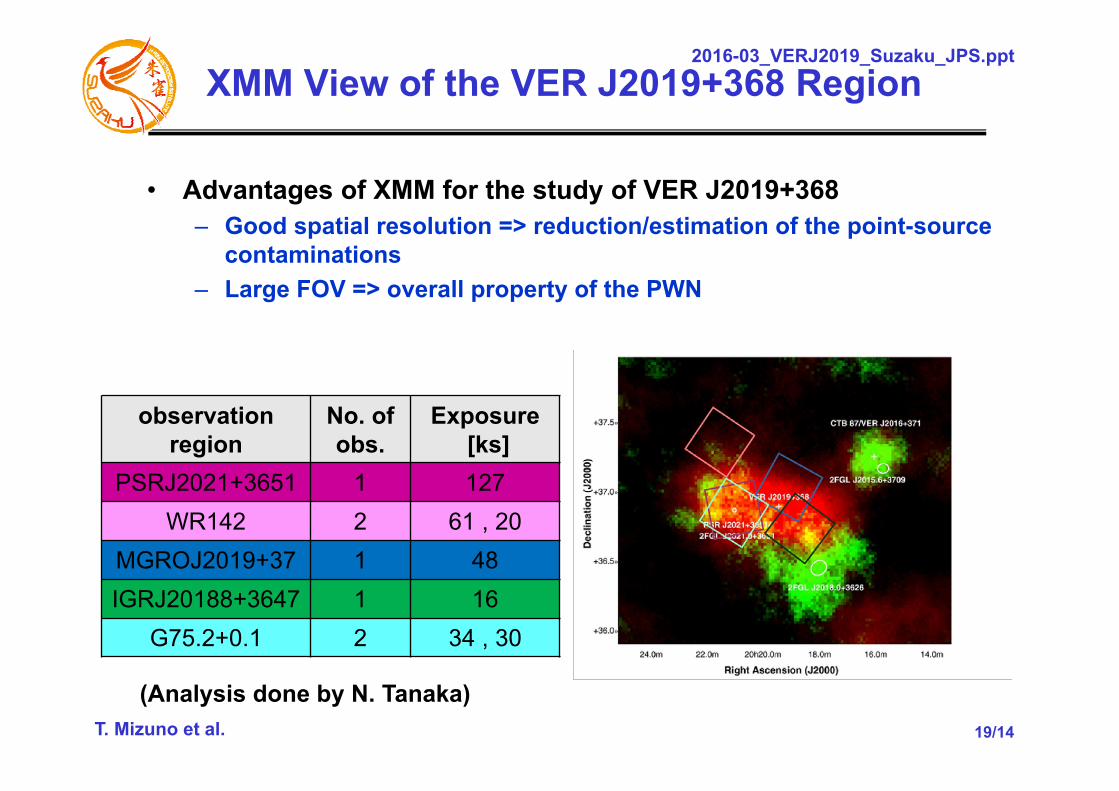
XMM View of the VER J2019+368 Region
• Advantages of XMM for the study of VER J2019+368– Good spatial resolution => reduction/estimation of the point-source
contaminations– Large FOV => overall property of the PWN
observationregion
No. ofobs.
Exposure[ks]
PSRJ2021+3651 1 127WR142 2 61 , 20
MGROJ2019+37 1 48IGRJ20188+3647 1 16
G75.2+0.1 2 34 , 30
(Analysis done by N. Tanaka)
20/14
2016-03_VERJ2019_Suzaku_JPS.ppt
T. Mizuno et al.
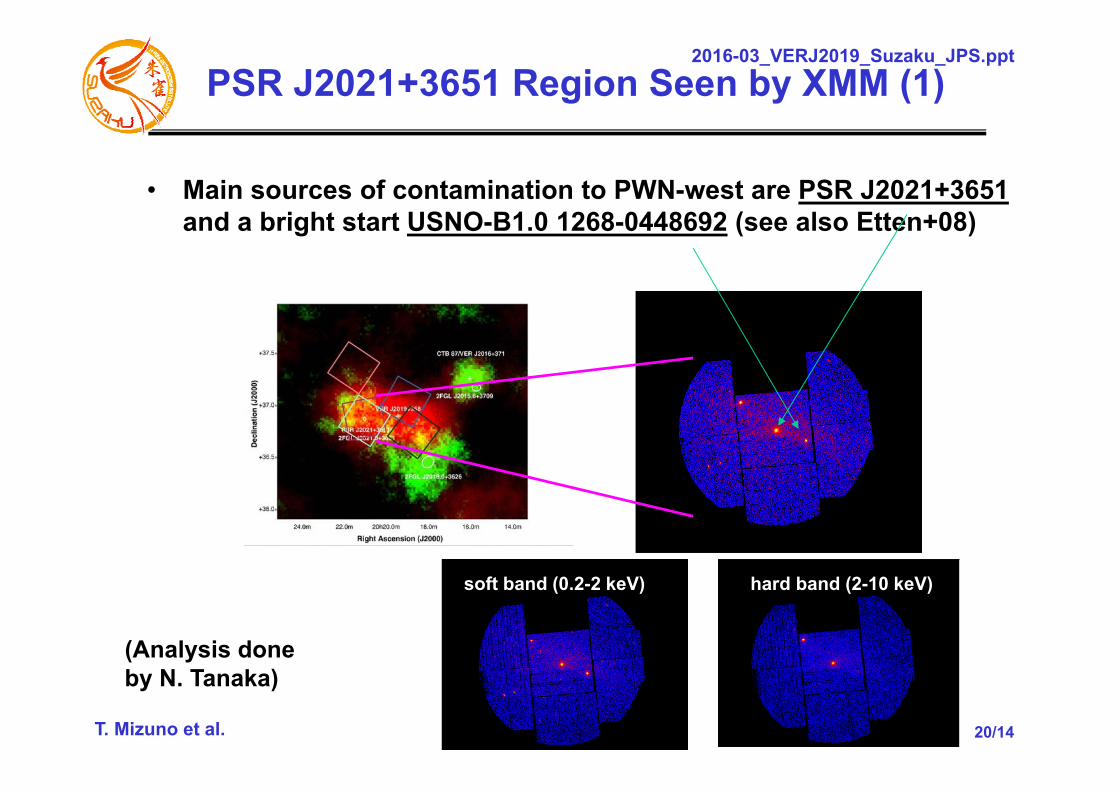
PSR J2021+3651 Region Seen by XMM (1)
• Main sources of contamination to PWN-west are PSR J2021+3651 and a bright start USNO-B1.0 1268-0448692 (see also Etten+08)
(Analysis done by N. Tanaka)
soft band (0.2-2 keV) hard band (2-10 keV)
21/14
2016-03_VERJ2019_Suzaku_JPS.ppt
T. Mizuno et al.
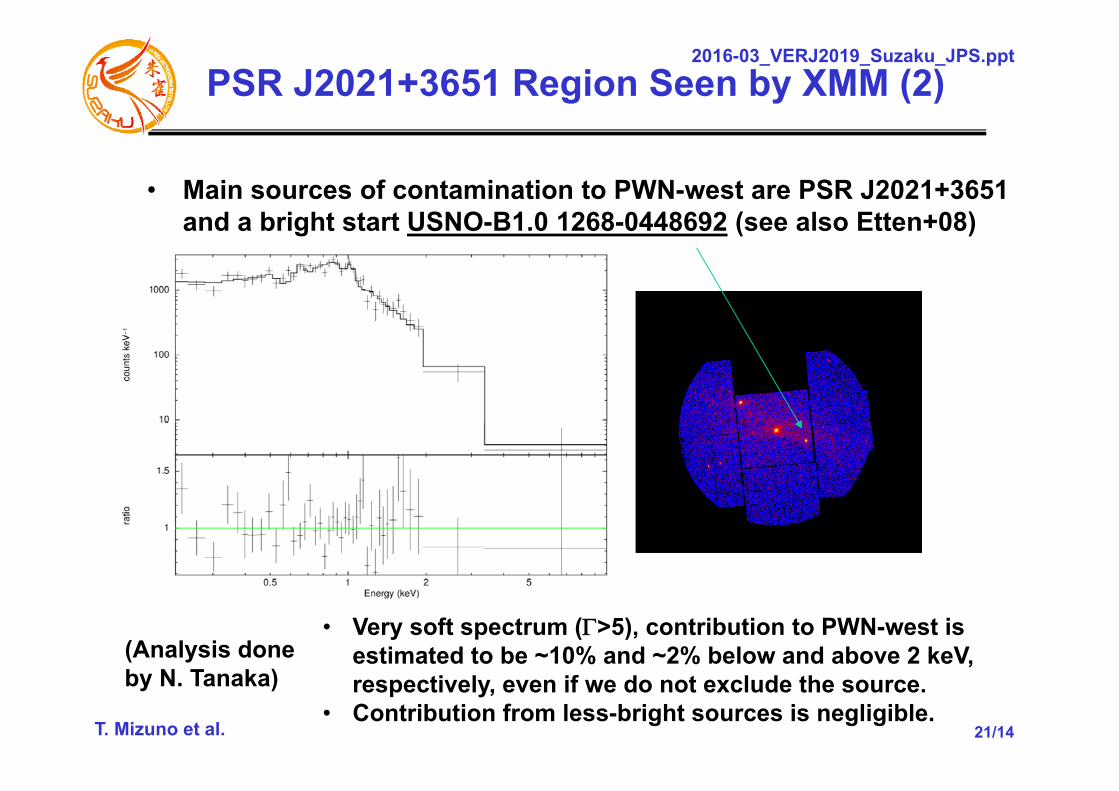
PSR J2021+3651 Region Seen by XMM (2)
• Main sources of contamination to PWN-west are PSR J2021+3651 and a bright start USNO-B1.0 1268-0448692 (see also Etten+08)
(Analysis done by N. Tanaka)
• Very soft spectrum (>5), contribution to PWN-west is estimated to be ~10% and ~2% below and above 2 keV, respectively, even if we do not exclude the source.
• Contribution from less-bright sources is negligible.