Embed Size (px)
Citation preview

DIVISION OF ADMINISTRATIONUTILITIES & ENERGY MANAGEMENT
Energy Cost, Consumption and Energy Use/Cost Index (EUI/ECI) by Building for the previous 12 months ending November 28,
2012
# Electricity
(kwH)
CHW
(mmBtu)
HHW
(mmBtu)
Total CostEUI
(mBtu/GSF)
ECI
(Cost/GSF)
Natural Gas
(mmBtu)
GSFClassificationBuilding
Buildings >= 2,000 gsf
1559 1,541,457 2,174,116 1,962 217
225,178 196,698 25,115 3,365
west campus parking
garage
supporting
facilities
0
0
6 0
$$ $ $ $
0468 712,093 9,521,950 57,556 20,345
1,912,479 861,319 735,587 315,573
evans library general
academic
0
0
155 3
$$ $ $ $
0378 628,040 898,860 0 0
81,309 81,309 0 0
south side parking
garage
supporting
facilities
0
0
5 0
$$ $ $ $
0388 621,774 909,542 0 0
82,266 82,266 0 0
northside parking
garage
supporting
facilities
0
0
5 0
$$ $ $ $
0379 487,664 677,203 0 0
61,272 61,272 0 0
university center
parking garage
supporting
facilities
0
0
5 0
$$ $ $ $
0454 419,775 550,204 1,631 364
79,455 50,619 21,428 5,442
memorial student
center
public
circulation
301
1,967
10 0
$$ $ $ $
0367 403,515 5,088,489 25,903 17,183
1,058,705 460,828 331,391 266,163
kyle field special use
facilities
17
322
150 3
$$ $ $ $
0454 368,935 3,631,932 19,403 10,237
738,446 328,058 247,128 159,831
memorial student
center
public
circulation
614
3,429
116 2
$$ $ $ $
1560 334,642 7,651,943 40,593 7,978
1,397,525 691,999 518,983 123,601
student recreation
center
special use
facilities
15,088
62,942
268 4
$$ $ $ $
0518 324,400 4,516,841 19,743 2,013
692,638 408,673 252,648 31,079
zachry engineering
center
general
academic
0
238
115 2
$$ $ $ $
0270 305,316 3,379,745 31,426 10,853
876,951 305,702 401,475 168,256
emerging technology
building
other 170
1,518
177 3
$$ $ $ $
0446 302,240 3,537,666 31,246 14,634
946,925 319,998 399,552 226,485
rudder tower public
circulation
126
891
192 3
$$ $ $ $
1510 259,681 5,621,655 25,492 4,793
909,068 508,642 326,115 74,311
wehner building office 0
0
190 4
$$ $ $ $
0524 257,953 3,297,863 24,792 2,634
657,359 298,373 318,140 40,846
blocker building office 0
0
150 3
$$ $ $ $
0469 251,304 592,396 551 0
60,705 53,592 7,048 65
central campus
parking garage
supporting
facilities
0
0
10 0
$$ $ $ $
1554 230,000 2,351,862 19,869 16,300
719,785 212,828 254,350 252,393
reed arena special use
facilities
1
214
192 3
$$ $ $ $
1530 218,540 5,249,574 40,643 11,094
1,219,406 475,807 520,615 170,869
interdisciplinary life
sciences building
laboratory 9,354
52,115
362 6
$$ $ $ $
1530 218,538 1,377,361 6,951 3,784
286,093 123,963 88,147 59,139
interdisciplinary life
sciences building
laboratory 2,926
14,844
84 1
$$ $ $ $
Page 1 of 51Generated on: 1/29/2013 3:13:40PM

DIVISION OF ADMINISTRATIONUTILITIES & ENERGY MANAGEMENT
Energy Cost, Consumption and Energy Use/Cost Index (EUI/ECI) by Building for the previous 12 months ending November 28,
2012
# Electricity
(kwH)
CHW
(mmBtu)
HHW
(mmBtu)
Total CostEUI
(mBtu/GSF)
ECI
(Cost/GSF)
Natural Gas
(mmBtu)
GSFClassificationBuilding
0453 206,711 1,101,283 12,381 4,839
333,549 99,639 158,341 74,997
g. rollie white
coliseum
special use
facilities
23
571
102 2
$$ $ $ $
0484 205,393 5,490,067 25,826 9,999
981,754 496,771 330,282 154,210
chemistry building laboratory 38
490
266 5
$$ $ $ $
0386 205,000 7,357,965 50,769 10,174
1,472,756 665,517 648,983 157,995
jack e. brown
chemical engineering
laboratory 4
260
420 7
$$ $ $ $
1800 203,369 2,879,087 12,534 702
431,525 260,429 160,199 10,897
general services
complex
office 0
0
113 2
$$ $ $ $
0443 180,316 3,354,546 14,272 6,507
586,737 303,434 182,351 100,738
oceanography &
meteorology building
office 3
214
179 3
$$ $ $ $
0682 177,704 2,446,516 16,063 5,924
519,005 221,517 205,431 91,894
wisenbaker
engineering research
office 0
163
171 3
$$ $ $ $
0682 177,703 376,152 1,037 1,134
64,786 33,859 13,160 17,736
wisenbaker
engineering research
office 0
31
19 0
$$ $ $ $
0391 173,481 2,116,715 16,659 5,058
483,069 191,471 212,974 78,478
james j. cain '51
building
laboratory 0
146
167 3
$$ $ $ $
1504 169,859 3,142,881 19,796 4,395
615,011 284,288 253,070 68,065
reynolds medical
sciences building
laboratory 1,734
9,589
216 4
$$ $ $ $
1535 168,362 140,688 315 109
18,352 12,662 3,994 1,697
agriculture and life
sciences building
0 0
0
5 0
$$ $ $ $
1535 168,354 282,585 817 165
38,371 25,433 10,357 2,581
agriculture and life
sciences building
0 0
0
12 0
$$ $ $ $
1535 168,353 1,259,593 6,928 918
216,991 114,067 88,611 14,313
agriculture and life
sciences building
0 0
0
72 1
$$ $ $ $
1507 166,079 4,598,408 32,453 10,819
1,044,897 415,940 414,703 168,164
biochemistry/biophysi
cs buildng
laboratory 6,766
46,090
396 6
$$ $ $ $
1501 165,031 3,703,292 21,847 10,167
771,916 335,055 278,786 157,477
kleberg center laboratory 46
599
271 5
$$ $ $ $
1502 158,979 3,442,234 21,083 3,418
634,375 311,446 269,731 52,890
heep center general
academic
13
308
228 4
$$ $ $ $
0385 157,844 2,644,906 12,786 2,647
444,687 239,378 163,555 40,965
ce/tti office & lab
building
general
academic
125
789
156 3
$$ $ $ $
0433 155,430 1,544,410 20,064 9,526
543,879 139,782 256,626 147,472
mosher residence hall residence 0
0
224 3
$$ $ $ $
0369 153,886 2,686,961 19,785 8,817
632,448 243,029 252,911 136,508
read building special use
facilities
0
0
245 4
$$ $ $ $
Page 2 of 51Generated on: 1/29/2013 3:13:40PM

DIVISION OF ADMINISTRATIONUTILITIES & ENERGY MANAGEMENT
Energy Cost, Consumption and Energy Use/Cost Index (EUI/ECI) by Building for the previous 12 months ending November 28,
2012
# Electricity
(kwH)
CHW
(mmBtu)
HHW
(mmBtu)
Total CostEUI
(mBtu/GSF)
ECI
(Cost/GSF)
Natural Gas
(mmBtu)
GSFClassificationBuilding
3400 153,000 3,424,080 0 0
335,484 335,484 0 0
university services
bldg
laboratory 0
0
76 2
$$ $ $ $
0353 148,837 2,450,203 25,832 2,734
594,786 221,598 330,623 42,565
bright building general
academic
0
0
248 4
$$ $ $ $
1548 145,530 1,035,768 0 0
94,956 93,603 0 0
mcferrin athletic
center-indoor track
special use
facilities
192
1,354
26 1
$$ $ $ $
0297 144,661 2,155,576 8,258 2,218
334,901 194,973 105,499 34,332
mitchell physics
building
laboratory 0
98
123 2
$$ $ $ $
1194 140,865 2,650,024 29,920 12,697
818,795 239,750 382,800 196,245
veterinary large
animal hospital
health care
facilities
0
0
367 6
$$ $ $ $
1607 133,327 1,456,497 7,460 1,149
245,003 131,794 95,384 17,825
allen building
(academic west)
office 0
0
102 2
$$ $ $ $
0435 130,844 1,279,537 9,025 4,127
295,114 115,778 115,430 63,905
harrington education
center office tower
office 0
0
134 2
$$ $ $ $
3205 130,478 241,040 0 0
26,341 26,341 0 0
a&m system building office 0
0
6 0
$$ $ $ $
3205 129,360 3,344,160 0 0
349,700 349,700 0 0
a&m system building office 0
0
88 3
$$ $ $ $
0450 128,482 1,619,446 8,424 1,297
287,821 146,605 107,717 20,084
duncan dining hall dining
services
2,417
13,416
137 2
$$ $ $ $
0361 124,971 1,406,283 7,885 971
247,788 127,250 100,908 15,019
bright football
complex
office 744
4,611
115 2
$$ $ $ $
3200 123,961 2,294,180 0 0
235,070 224,742 0 0
connally building office 1,836
10,328
78 2
$$ $ $ $
1606 121,678 1,779,503 21,654 12,863
636,930 160,957 276,807 199,165
bush library: museum
& archive
public
circulation
0
0
334 5
$$ $ $ $
0490 120,874 2,394,157 17,833 7,196
555,991 216,563 227,926 111,302
halbouty geosciences
building
laboratory 2
200
275 5
$$ $ $ $
1910 120,692 778,741 6,749 3,641
212,589 70,087 85,586 56,916
national center for
therapuetics
0 0
0
108 2
$$ $ $ $
1506 118,648 2,248,880 9,017 1,434
350,804 203,460 115,347 22,206
horticulture/forest
science building
laboratory 1,748
9,792
167 3
$$ $ $ $
10226 117,618 550,202 9,933 2,933
221,327 49,518 125,965 45,844
nctm manufacturing
bldg
other 0
0
125 2
$$ $ $ $
0398 116,619 1,483,243 9,029 1,532
273,334 134,228 115,424 23,682
langford architecture
center building a
general
academic
0
0
134 2
$$ $ $ $
Page 3 of 51Generated on: 1/29/2013 3:13:40PM

DIVISION OF ADMINISTRATIONUTILITIES & ENERGY MANAGEMENT
Energy Cost, Consumption and Energy Use/Cost Index (EUI/ECI) by Building for the previous 12 months ending November 28,
2012
# Electricity
(kwH)
CHW
(mmBtu)
HHW
(mmBtu)
Total CostEUI
(mBtu/GSF)
ECI
(Cost/GSF)
Natural Gas
(mmBtu)
GSFClassificationBuilding
0376 115,797 4,191,618 36,638 15,174
1,083,032 379,147 468,439 235,445
chemistry building
addition
laboratory 0
0
571 9
$$ $ $ $
1197 114,666 1,501,161 31,555 9,004
711,771 135,762 403,216 139,547
veterinary research
building
laboratory 4,607
33,245
439 6
$$ $ $ $
0387 113,700 1,873,304 12,478 3,094
377,232 169,515 159,583 47,957
joe c. richardson
petroleum engineering
laboratory 0
177
193 3
$$ $ $ $
1904 113,559 2,739,250 23,401 8,184
691,735 247,778 299,118 126,716
texas a&m institute
for preclinical studies
laboratory 3,150
18,123
388 6
$$ $ $ $
10226 113,397 594,865 6,395 3,260
187,511 54,728 84,006 48,777
nctm manufacturing
bldg
other 0
0
103 2
$$ $ $ $
0447 113,388 1,126,666 13,360 5,600
359,536 101,972 170,740 86,824
aston residence hall residence 0
0
201 3
$$ $ $ $
0442 112,133 1,065,517 11,175 4,701
312,209 96,420 142,889 72,900
dunn residence hall residence 0
0
174 3
$$ $ $ $
0441 112,133 1,065,517 10,780 4,017
296,495 96,420 137,937 62,138
krueger residence hall residence 0
0
164 3
$$ $ $ $
0383 110,272 2,139,383 9,780 2,298
354,154 193,523 124,957 35,673
koldus building office 0
0
176 3
$$ $ $ $
0275 107,500 199,006 2,218 689
57,612 18,265 29,018 10,329
liberal arts and arts &
humanities building
other 0
0
33 1
$$ $ $ $
0521 104,949 1,585,680 13,644 3,054
365,955 143,627 174,868 47,179
heldenfels hall laboratory 12
281
211 3
$$ $ $ $
1085 103,440 3,262,636 24,389 6,595
716,072 295,177 311,816 102,168
veterinary small
animal hospital
health care
facilities
1,243
6,912
419 7
$$ $ $ $
1156 101,704 2,064,663 3,042 1,809
256,282 187,273 39,023 27,530
physical plant
administration &
supporting
facilities
397
2,457
121 3
$$ $ $ $
3100 100,020 1,677,611 0 0
151,693 151,693 0 0
hagler center supporting
facilities
0
0
57 2
$$ $ $ $
1558 98,185 599,286 3,796 1,390
124,401 54,374 48,600 21,427
cox-mcferrin center
for aggie basketball
special use
facilities
0
0
74 1
$$ $ $ $
0508 96,416 1,230,997 23,833 13,407
631,183 111,415 304,641 207,865
veterinary teaching
hospital
laboratory 1,298
7,261
443 7
$$ $ $ $
0449 96,038 2,719,185 15,669 2,603
486,948 245,919 200,229 40,463
biological sciences
bldg. west
laboratory 11
338
287 5
$$ $ $ $
0454 95,533 2,181,823 15,657 1,024
418,031 197,476 200,260 15,819
memorial student
center
public
circulation
799
4,476
261 4
$$ $ $ $
Page 4 of 51Generated on: 1/29/2013 3:13:40PM

DIVISION OF ADMINISTRATIONUTILITIES & ENERGY MANAGEMENT
Energy Cost, Consumption and Energy Use/Cost Index (EUI/ECI) by Building for the previous 12 months ending November 28,
2012
# Electricity
(kwH)
CHW
(mmBtu)
HHW
(mmBtu)
Total CostEUI
(mBtu/GSF)
ECI
(Cost/GSF)
Natural Gas
(mmBtu)
GSFClassificationBuilding
1026 94,680 1,812,252 14,552 7,857
471,681 163,937 186,072 121,673
veterinary medicine
administration
laboratory 0
0
302 5
$$ $ $ $
0495 94,233 2,437,277 12,876 2,761
437,645 220,572 164,753 42,845
sbisa dining hall dining
services
1,704
9,475
272 5
$$ $ $ $
0439 92,812 1,225,955 13,179 7,351
393,192 110,873 168,481 113,838
cain hall office 0
0
266 4
$$ $ $ $
3200 87,461 399,061 0 0
39,456 38,022 0 0
connally building office 297
1,435
19 0
$$ $ $ $
1601 86,576 1,836,203 3,569 0
223,162 166,119 45,622 0
integrated ocean
drilling building
laboratory 1,978
11,421
136 3
$$ $ $ $
0444 84,831 2,105,891 14,997 4,600
453,865 190,483 191,696 71,325
peterson building laboratory 7
361
316 5
$$ $ $ $
0440 84,500 1,001,356 14,206 3,971
337,153 90,184 181,050 60,990
commons public
circulation
859
4,929
266 4
$$ $ $ $
1509 84,183 1,330,241 8,432 1,894
257,488 120,334 107,814 29,340
medical sciences
library
general
academic
0
0
177 3
$$ $ $ $
0293 82,767 792,278 16,874 10,742
453,805 71,704 215,870 166,230
appelt residence hall residence 0
0
366 5
$$ $ $ $
0462 82,555 837,607 8,702 3,763
245,285 75,774 111,240 58,272
academic building office 0
0
186 3
$$ $ $ $
0957 82,512 51,326 0 0
18,832 4,643 0 0
purchasing & stores public
circulation
2,471
14,189
32 0
$$ $ $ $
0394 81,730 642,557 15,409 11,804
438,009 58,165 197,175 182,669
underwood residence
hall
residence 0
0
360 5
$$ $ $ $
0483 81,404 1,055,784 6,672 2,769
223,973 95,525 85,334 42,785
thompson hall laboratory 4
329
160 3
$$ $ $ $
1536 80,907 1,216,367 4,136 1,155
180,570 109,773 52,772 18,025
agrilife services
building
0 0
0
117 2
$$ $ $ $
0434 80,464 12,334,076 19,819 2,395
1,407,609 1,116,603 253,287 37,316
luedecke building
(cyclotron)
laboratory 53
404
800 17
$$ $ $ $
0436 77,435 1,322,088 16,481 1,864
359,144 119,577 210,666 28,831
reed-mcdonald
building
laboratory 0
70
295 5
$$ $ $ $
1547 76,460 881,391 0 0
80,458 79,837 0 0
mcferrin athletic
center-indoor football
special use
facilities
76
621
40 1
$$ $ $ $
1599 75,325 1,186,712 0 0
106,804 106,804 0 0
2 research park office 0
0
54 1
$$ $ $ $
Page 5 of 51Generated on: 1/29/2013 3:13:40PM

DIVISION OF ADMINISTRATIONUTILITIES & ENERGY MANAGEMENT
Energy Cost, Consumption and Energy Use/Cost Index (EUI/ECI) by Building for the previous 12 months ending November 28,
2012
# Electricity
(kwH)
CHW
(mmBtu)
HHW
(mmBtu)
Total CostEUI
(mBtu/GSF)
ECI
(Cost/GSF)
Natural Gas
(mmBtu)
GSFClassificationBuilding
0432 73,020 1,037,495 8,681 2,894
249,579 93,865 110,872 44,842
architecture building c general
academic
0
0
207 3
$$ $ $ $
1599 70,000 377,779 0 0
34,756 34,756 0 0
2 research park office 0
0
18 0
$$ $ $ $
0473 69,898 622,303 5,225 2,500
163,105 56,299 66,849 38,672
jack k. williams
administration
office 158
1,285
143 2
$$ $ $ $
0549 69,668 583,293 9,056 6,061
262,366 52,780 115,826 93,760
haas residence hall residence 0
0
246 4
$$ $ $ $
0652 69,668 589,269 7,806 4,937
229,635 53,321 99,871 76,442
neeley residence hall residence 0
0
212 3
$$ $ $ $
1609 69,666 812,178 5,198 1,383
161,312 73,450 66,378 21,484
tti state headquarters
& research building
office 0
0
134 2
$$ $ $ $
0507 69,367 1,223,344 15,041 6,444
402,727 110,663 192,349 99,715
veterinary medical
sciences building
laboratory 0
0
370 6
$$ $ $ $
1518 69,079 1,141,725 8,933 1,844
246,138 103,285 114,207 28,646
school of rural public
health - a
office 0
0
212 4
$$ $ $ $
1513 68,739 3,924,994 10,630 6,429
622,688 355,072 135,958 99,097
borlaug center for
southern crop
laboratory 4,441
32,561
508 9
$$ $ $ $
10226 68,281 193,394 2,805 1,102
70,212 17,405 35,575 17,232
nctm manufacturing
bldg
other 0
0
67 1
$$ $ $ $
1511 68,125 1,442,492 8,290 673
246,933 130,451 106,025 10,457
west campus library
facility
general
academic
0
0
204 4
$$ $ $ $
1900 67,629 1,174,401 14,506 3,873
386,914 106,228 185,499 59,943
texas a&m institute
for genomic medicine
special use
facilities
6,517
35,244
427 6
$$ $ $ $
0292 67,283 588,658 9,495 6,801
280,012 53,289 121,355 105,368
eppright residence
hall
residence 0
0
272 4
$$ $ $ $
0291 67,283 589,151 8,239 4,908
234,747 53,318 105,501 75,929
rudder residence hall residence 0
0
225 3
$$ $ $ $
0290 67,283 652,446 9,601 7,943
304,756 59,050 122,724 122,982
wells residence hall residence 0
0
294 5
$$ $ $ $
1600 67,143 754,442 4,116 836
133,797 68,232 52,573 12,993
gilchrist building (t.t.i.) office 0
0
112 2
$$ $ $ $
1605 66,968 457,116 0 0
42,055 42,055 0 0
centeq building office 0
0
23 1
$$ $ $ $
1608 65,736 70,845 482 318
17,610 6,518 6,336 4,757
annenberg
presidential
public
circulation
0
0
16 0
$$ $ $ $
Page 6 of 51Generated on: 1/29/2013 3:13:40PM

DIVISION OF ADMINISTRATIONUTILITIES & ENERGY MANAGEMENT
Energy Cost, Consumption and Energy Use/Cost Index (EUI/ECI) by Building for the previous 12 months ending November 28,
2012
# Electricity
(kwH)
CHW
(mmBtu)
HHW
(mmBtu)
Total CostEUI
(mBtu/GSF)
ECI
(Cost/GSF)
Natural Gas
(mmBtu)
GSFClassificationBuilding
1608 65,688 916,746 8,768 3,699
252,165 82,814 111,940 57,411
annenberg
presidential
public
circulation
0
0
237 4
$$ $ $ $
1605 65,234 2,430,842 0 0
218,776 218,776 0 0
centeq building office 0
0
127 3
$$ $ $ $
1605 65,215 227,925 0 0
20,969 20,969 0 0
centeq building office 0
0
12 0
$$ $ $ $
0375 64,790 2,034,598 0 0
192,241 184,011 0 0
williams alumni center office 1,397
8,229
129 3
$$ $ $ $
0445 63,515 1,462,790 10,083 4,618
333,250 132,205 129,193 71,591
teague research
center
office 3
261
310 5
$$ $ $ $
0520 63,318 900,651 7,157 2,790
216,440 81,480 91,479 43,215
beutel health center health care
facilities
4
266
206 3
$$ $ $ $
0467 62,273 2,004,536 8,825 2,146
327,488 181,324 112,858 33,240
biological sciences
bldg. east
laboratory 0
65
286 5
$$ $ $ $
0971 62,268 496,752 0 0
51,163 44,941 0 0
food services
commissary
dining
services
1,177
6,222
46 1
$$ $ $ $
0478 62,228 901,652 5,661 707
164,917 81,561 72,396 10,960
scoates hall office 0
0
152 3
$$ $ $ $
0548 62,156 541,487 10,220 6,149
274,926 49,027 130,725 95,174
clements residence
hall
residence 0
0
293 4
$$ $ $ $
0653 62,156 546,190 9,421 5,651
257,415 49,435 120,481 87,500
hobby residence hall residence 0
0
272 4
$$ $ $ $
0550 62,156 626,913 13,728 7,804
353,100 56,742 175,651 120,706
mcfadden residence
hall
residence 0
0
381 6
$$ $ $ $
0438 61,860 820,992 4,654 1,572
158,408 74,303 59,714 24,391
harrington education
center classroom
general
academic
0
0
146 3
$$ $ $ $
1550 60,537 664,986 0 0
60,490 60,490 0 0
olsen baseball field special use
facilities
0
0
37 1
$$ $ $ $
0294 59,541 615,129 8,225 6,578
262,661 55,670 105,196 101,795
lechner residence hall residence 0
0
284 4
$$ $ $ $
0463 58,679 650,819 5,815 753
144,924 58,871 74,224 11,764
psychology building general
academic
0
65
150 2
$$ $ $ $
0427 57,696 494,439 5,462 2,541
153,970 44,780 69,879 39,311
fowler residence hall residence 0
0
168 3
$$ $ $ $
0428 57,696 494,439 5,462 2,541
153,970 44,780 69,879 39,311
keathley residence
hall
residence 0
0
168 3
$$ $ $ $
Page 7 of 51Generated on: 1/29/2013 3:13:40PM

DIVISION OF ADMINISTRATIONUTILITIES & ENERGY MANAGEMENT
Energy Cost, Consumption and Energy Use/Cost Index (EUI/ECI) by Building for the previous 12 months ending November 28,
2012
# Electricity
(kwH)
CHW
(mmBtu)
HHW
(mmBtu)
Total CostEUI
(mBtu/GSF)
ECI
(Cost/GSF)
Natural Gas
(mmBtu)
GSFClassificationBuilding
0492 56,537 878,247 4,514 1,836
166,027 79,462 57,751 28,507
civil engineering
building
general
academic
12
308
166 3
$$ $ $ $
0448 55,248 856,468 4,718 1,886
170,612 77,481 60,311 29,250
adams band hall supporting
facilities
605
3,570
183 3
$$ $ $ $
1041 55,169 2,222,978 22,734 3,973
562,963 201,105 290,650 61,642
texas vet med
diagnostic lab
laboratory 1,737
9,567
653 10
$$ $ $ $
1157 54,076 194,755 0 0
18,034 17,616 0 0
warehouse supporting
facilities
39
418
13 0
$$ $ $ $
1811 52,993 2,082,377 13,442 5,620
447,230 188,419 171,692 87,119
vet med research bldg
addition
laboratory 0
0
494 8
$$ $ $ $
0972 52,178 1,955,105 17,455 5,285
545,903 177,151 223,387 81,437
laboratory animal care
building
special use
facilities
9,999
63,928
755 10
$$ $ $ $
0493 51,802 998,902 0 911
104,529 90,339 0 14,190
bell building office 0
0
83 2
$$ $ $ $
0477 51,592 484,954 5,467 595
123,307 43,856 69,989 9,299
anthropology building general
academic
4
163
150 2
$$ $ $ $
0422 51,494 950,860 0 1,097
103,068 86,017 0 17,051
walton residence hall residence 0
0
84 2
$$ $ $ $
0417 50,416 831,799 0 1,545
99,224 75,295 0 23,929
hart residence hall residence 0
0
87 2
$$ $ $ $
1598 50,149 600,864 0 0
54,908 54,278 0 0
1313 research
parkway (lynntech
supporting
facilities
77
630
42 1
$$ $ $ $
1811 48,700 171,958 665 510
31,883 15,476 8,429 7,978
vet med research bldg
addition
laboratory 0
0
36 1
$$ $ $ $
0420 48,268 542,590 4,270 965
118,670 49,084 54,663 14,923
milner hall office 0
0
147 2
$$ $ $ $
1512 48,154 877,218 0 0
92,386 79,334 0 0
southern crop
improvement
special use
facilities
2,286
13,052
110 2
$$ $ $ $
0972 46,972 544,693 2,203 2,351
132,549 49,022 27,943 36,739
laboratory animal care
building
special use
facilities
3,009
18,845
201 3
$$ $ $ $
0392 46,953 572,893 4,508 1,369
130,693 51,822 57,631 21,240
mechanical
engineering office
office 0
0
167 3
$$ $ $ $
0496 46,110 802,395 3,143 1,102
129,797 72,589 40,014 17,195
laundry supporting
facilities
0
0
151 3
$$ $ $ $
0419 45,134 348,977 3,402 1,670
100,978 31,587 43,516 25,874
legett residence hall residence 0
0
139 2
$$ $ $ $
Page 8 of 51Generated on: 1/29/2013 3:13:40PM

DIVISION OF ADMINISTRATIONUTILITIES & ENERGY MANAGEMENT
Energy Cost, Consumption and Energy Use/Cost Index (EUI/ECI) by Building for the previous 12 months ending November 28,
2012
# Electricity
(kwH)
CHW
(mmBtu)
HHW
(mmBtu)
Total CostEUI
(mBtu/GSF)
ECI
(Cost/GSF)
Natural Gas
(mmBtu)
GSFClassificationBuilding
0296 44,956 669,884 2,566 689
104,078 60,591 32,786 10,669
mitchell inst. for
fundamental phys.
office 0
33
123 2
$$ $ $ $
0472 44,856 554,697 5,968 2,263
161,863 50,188 76,229 35,046
animal industries
building
general
academic
28
400
226 4
$$ $ $ $
0456 43,808 742,034 7,401 2,640
202,533 67,114 94,561 40,858
military sciences
building
office 0
0
287 5
$$ $ $ $
7090 43,721 594,417 0 0
63,389 53,730 0 0
tti safety division
hangar
laboratory 1,566
9,659
82 1
$$ $ $ $
1525 43,327 909,449 11,189 6,469
325,868 82,282 143,065 100,258
nuclear magnetic
resonance facility
laboratory 2
263
479 8
$$ $ $ $
0513 42,336 732,929 9,991 4,912
270,822 66,321 127,713 76,141
doherty building laboratory 24
647
412 6
$$ $ $ $
1153 42,080 885 0 0
113 113 0 0
freeman arena under
investigation
0
0
0 0
$$ $ $ $
0415 40,828 404,371 6,757 3,149
171,814 36,595 86,432 48,787
davis-gary residence
hall
residence 0
0
276 4
$$ $ $ $
0412 40,828 450,877 5,066 2,472
143,883 40,802 64,766 38,315
moses residence hall residence 0
0
222 4
$$ $ $ $
0511 40,476 954,936 3,413 1,702
156,723 86,371 43,632 26,441
heep laboratory
building
laboratory 2
278
207 4
$$ $ $ $
0471 40,062 605,537 2,339 346
90,101 54,794 29,911 5,396
pavilion office 0
0
119 2
$$ $ $ $
1604 40,014 1,749,715 0 0
164,018 158,329 0 0
offshore technology
research center
laboratory 999
5,689
174 4
$$ $ $ $
1602 39,956 1,446,213 0 0
130,783 130,783 0 0
1111 research
parkway bldg
office 0
0
123 3
$$ $ $ $
0470 39,887 273,816 2,993 711
74,062 24,769 38,225 11,068
melbern g. glasscock
building
office 0
0
116 2
$$ $ $ $
1160 39,777 644,160 0 0
58,269 58,269 0 0
pearce animal pavilion public
circulation
0
0
55 1
$$ $ $ $
7751 39,760 627,760 0 0
65,594 56,799 0 0
teex - ps&s office
bldg
office 1,424
8,795
90 2
$$ $ $ $
0480 39,686 506,337 3,307 1,221
107,015 45,815 42,276 18,925
bolton hall office 0
0
158 3
$$ $ $ $
0426 38,957 333,851 3,688 1,715
103,962 30,236 47,183 26,543
hughes residence hall residence 0
0
168 3
$$ $ $ $
Page 9 of 51Generated on: 1/29/2013 3:13:40PM

DIVISION OF ADMINISTRATIONUTILITIES & ENERGY MANAGEMENT
Energy Cost, Consumption and Energy Use/Cost Index (EUI/ECI) by Building for the previous 12 months ending November 28,
2012
# Electricity
(kwH)
CHW
(mmBtu)
HHW
(mmBtu)
Total CostEUI
(mBtu/GSF)
ECI
(Cost/GSF)
Natural Gas
(mmBtu)
GSFClassificationBuilding
0430 38,957 408,598 3,263 1,342
99,504 36,979 41,754 20,771
schuhmacher
residence hall
residence 0
0
154 3
$$ $ $ $
0980 38,760 24,111 0 0
2,181 2,181 0 0
murray case sells
storage bldg
supporting
facilities
0
0
2 0
$$ $ $ $
0407 36,943 105,666 1,671 336
36,547 9,666 21,828 5,053
harrell hall - dorm 8 residence 0
0
64 1
$$ $ $ $
0411 36,943 345,023 2,753 756
78,098 31,218 35,201 11,680
utay hall - dorm 12 residence 0
0
127 2
$$ $ $ $
0403 36,893 339,642 4,324 1,523
109,619 30,734 55,324 23,561
fountain hall - dorm 4 residence 0
0
190 3
$$ $ $ $
0410 36,893 244,746 4,124 1,703
101,248 22,145 52,758 26,345
harrington hall - dorm
11
residence 0
0
181 3
$$ $ $ $
0406 36,893 422,728 5,189 2,091
137,015 38,244 66,364 32,407
leonard hall - dorm 7 residence 0
0
236 4
$$ $ $ $
0409 36,893 343,898 3,800 1,247
99,092 31,119 48,618 19,355
white hall - dorm 10 residence 0
0
169 3
$$ $ $ $
0408 36,893 341,417 3,548 1,888
105,542 30,890 45,318 29,335
whitely hall - dorm 9 residence 0
0
179 3
$$ $ $ $
0405 36,867 168,054 1,577 836
48,194 15,125 20,003 13,067
lacy hall - dorm 6 residence 0
0
81 1
$$ $ $ $
0476 36,850 99,302 1,229 2,094
57,189 8,984 15,759 32,446
francis hall office 0
0
99 2
$$ $ $ $
1910 36,527 168,046 1,721 519
45,832 15,460 22,610 7,762
national center for
therapuetics
0 0
0
77 1
$$ $ $ $
0474 36,035 328,415 1,981 268
59,186 29,709 25,298 4,179
ymca building under
investigation
0
0
94 2
$$ $ $ $
0401 35,967 417,502 4,199 1,156
109,430 37,766 53,707 17,957
kiest hall - dorm 2 residence 0
0
188 3
$$ $ $ $
1229 34,929 53,649 0 0
4,842 4,842 0 0
schubot aviary br
facility
special use
facilities
0
0
5 0
$$ $ $ $
1299 34,929 964,092 0 0
105,007 87,273 0 0
turbomachinery
laboratory
laboratory 3,204
17,734
186 3
$$ $ $ $
0416 34,004 397,351 0 645
45,983 35,943 0 10,040
bizzell hall office 0
0
59 1
$$ $ $ $
0404 33,904 380,471 4,087 1,129
104,248 34,426 52,256 17,566
gainer hall - dorm 5 residence 0
0
192 3
$$ $ $ $
Page 10 of 51Generated on: 1/29/2013 3:13:40PM

DIVISION OF ADMINISTRATIONUTILITIES & ENERGY MANAGEMENT
Energy Cost, Consumption and Energy Use/Cost Index (EUI/ECI) by Building for the previous 12 months ending November 28,
2012
# Electricity
(kwH)
CHW
(mmBtu)
HHW
(mmBtu)
Total CostEUI
(mBtu/GSF)
ECI
(Cost/GSF)
Natural Gas
(mmBtu)
GSFClassificationBuilding
0756 33,696 135,200 0 0
13,110 12,224 0 0
easterwood airport
hangar
special use
facilities
53
886
15 0
$$ $ $ $
1454 33,535 240,960 0 0
21,799 21,799 0 0
the gardens f residence 0
0
25 1
$$ $ $ $
1455 33,535 222,324 0 0
20,109 20,109 0 0
the gardens g residence 0
0
23 1
$$ $ $ $
1456 33,535 233,498 0 0
21,122 21,122 0 0
the gardens h residence 0
0
24 1
$$ $ $ $
1451 33,535 318,292 0 0
28,758 28,758 0 0
the gardens j residence 0
0
32 1
$$ $ $ $
1452 33,535 202,964 0 0
18,354 18,354 0 0
the gardens k residence 0
0
21 1
$$ $ $ $
1453 33,535 221,516 0 0
20,040 20,040 0 0
the gardens l residence 0
0
23 1
$$ $ $ $
1457 33,535 78,164 0 0
7,191 7,191 0 0
the gardens m 0 0
0
8 0
$$ $ $ $
1458 33,535 77,622 0 0
7,141 7,141 0 0
the gardens n 0 0
0
8 0
$$ $ $ $
1459 33,535 91,612 0 0
8,428 8,428 0 0
the gardens p 0 0
0
9 0
$$ $ $ $
1460 33,535 75,776 0 0
6,971 6,971 0 0
the gardens q 0 0
0
8 0
$$ $ $ $
0506 32,306 209,048 3,083 238
62,033 18,906 39,411 3,715
nagle hall office 0
0
125 2
$$ $ $ $
1910 32,306 171,443 2,432 226
49,803 15,430 30,841 3,532
national center for
therapuetics
0 0
0
100 2
$$ $ $ $
1262 32,188 1,279,153 0 0
125,328 115,656 0 0
mckenzie terminal
building
public
circulation
1,724
9,672
189 4
$$ $ $ $
0402 32,139 384,371 3,627 1,093
98,091 34,786 46,343 16,962
briggs hall - dorm 3 residence 0
0
188 3
$$ $ $ $
0400 31,952 413,023 3,957 1,220
106,885 37,374 50,562 18,949
spence hall - dorm 1 residence 0
0
206 3
$$ $ $ $
1370 31,356 780,503 0 0
70,567 70,567 0 0
nerrtc emergency
operations trng center
laboratory 0
0
85 2
$$ $ $ $
1505 30,889 1,814,707 2,993 499
220,050 164,174 38,260 7,744
rosenthal meat
science & technology
laboratory 1,070
9,872
348 7
$$ $ $ $
Page 11 of 51Generated on: 1/29/2013 3:13:40PM

DIVISION OF ADMINISTRATIONUTILITIES & ENERGY MANAGEMENT
Energy Cost, Consumption and Energy Use/Cost Index (EUI/ECI) by Building for the previous 12 months ending November 28,
2012
# Electricity
(kwH)
CHW
(mmBtu)
HHW
(mmBtu)
Total CostEUI
(mBtu/GSF)
ECI
(Cost/GSF)
Natural Gas
(mmBtu)
GSFClassificationBuilding
8031 30,389 2,080 0 0
7,758 187 0 0
iodp/oceanography
bldg
supporting
facilities
1,236
7,570
41 0
$$ $ $ $
4430 30,331 68,040 0 0
10,256 6,149 0 0
ag comm print ctr &
storage bld
office 680
4,107
30 0
$$ $ $ $
0516 30,014 6,465,329 14,947 0
776,061 584,706 191,350 5
computing services
center
supporting
facilities
0
0
1,233 26
$$ $ $ $
4430 30,000 134,733 0 0
14,923 12,240 0 0
ag comm print ctr &
storage bld
office 419
2,684
29 0
$$ $ $ $
4431 30,000 166,703 0 0
22,021 15,093 0 0
extension center
office building
office 1,119
6,929
56 1
$$ $ $ $
7092 29,737 66,240 0 0
12,885 5,992 0 0
mechanical tech lab laboratory 1,101
6,893
45 0
$$ $ $ $
0465 29,699 442,144 3,417 1,492
106,908 40,008 43,730 23,090
butler hall laboratory 1
80
216 4
$$ $ $ $
0424 28,837 197,728 2,506 1,088
66,794 17,891 32,086 16,817
hotard hall office 0
0
148 2
$$ $ $ $
0359 28,545 195,837 0 0
17,720 17,720 0 0
architecture building b general
academic
0
0
23 1
$$ $ $ $
6502 28,152 183,840 0 0
21,317 16,618 0 0
energy systems lab laboratory 747
4,699
49 1
$$ $ $ $
1503 27,958 835,006 4,648 0
141,182 75,548 59,438 0
cater-mattil hall laboratory 1,119
6,196
308 5
$$ $ $ $
1508 27,666 372,623 2,320 112
65,962 33,698 29,667 1,724
price hobgood ag.
engineering research
laboratory 139
873
139 2
$$ $ $ $
0502 27,150 221,469 0 0
21,337 20,077 0 0
hydromechanics
laboratory
laboratory 200
1,261
35 1
$$ $ $ $
0499 27,147 11,332 158 157
5,509 1,043 2,081 2,349
graphic services office 0
36
13 0
$$ $ $ $
0499 26,865 199,231 2,011 1,414
66,069 17,965 25,681 22,001
graphic services office 5
422
153 2
$$ $ $ $
0958 26,563 447,790 0 0
43,831 40,503 0 0
fleet services supporting
facilities
550
3,327
78 2
$$ $ $ $
0360 26,250 761,629 0 0
78,273 68,910 0 0
steed research &
conditioning lab
special use
facilities
1,652
9,363
162 3
$$ $ $ $
0517 26,220 1,207,656 8,704 4,427
288,892 109,145 111,242 68,505
dpc annex office 0
0
658 11
$$ $ $ $
Page 12 of 51Generated on: 1/29/2013 3:13:40PM
DIVISION OF ADMINISTRATIONUTILITIES & ENERGY MANAGEMENT
Energy Cost, Consumption and Energy Use/Cost Index (EUI/ECI) by Building for the previous 12 months ending November 28,
2012
# Electricity
(kwH)
CHW
(mmBtu)
HHW
(mmBtu)
Total CostEUI
(mBtu/GSF)
ECI
(Cost/GSF)
Natural Gas
(mmBtu)
GSFClassificationBuilding
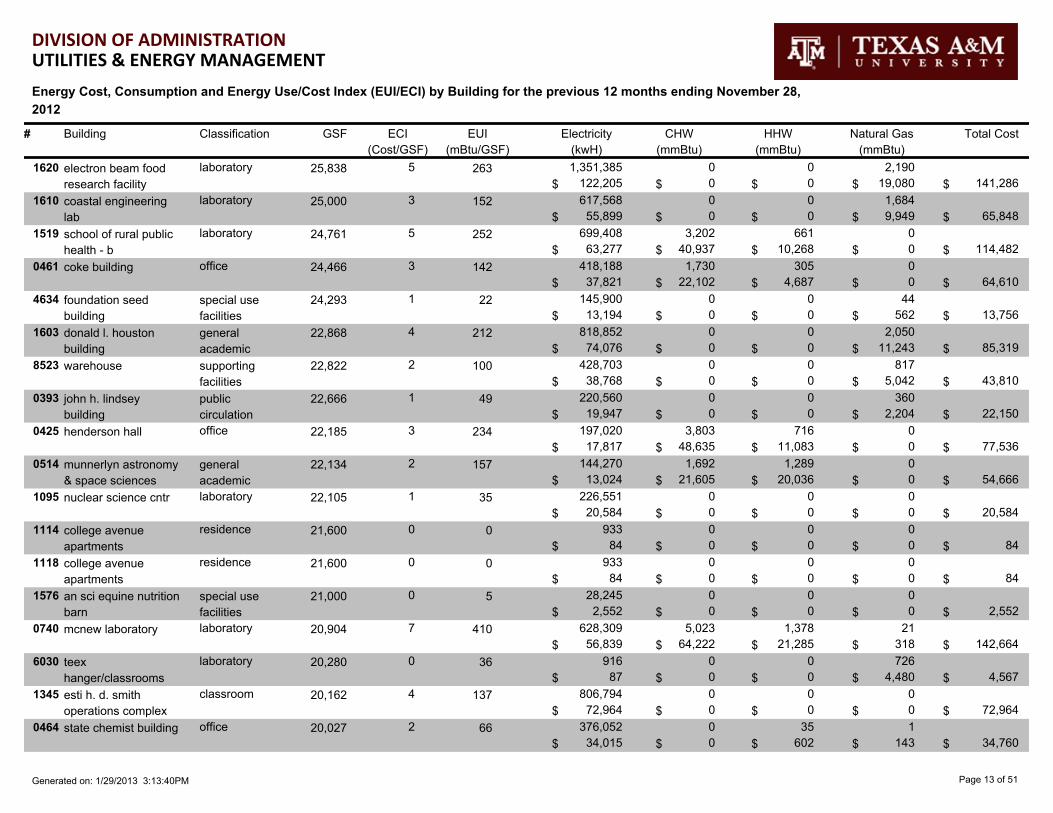
1620 25,838 1,351,385 0 0
141,286 122,205 0 0
electron beam food
research facility
laboratory 2,190
19,080
263 5
$$ $ $ $
1610 25,000 617,568 0 0
65,848 55,899 0 0
coastal engineering
lab
laboratory 1,684
9,949
152 3
$$ $ $ $
1519 24,761 699,408 3,202 661
114,482 63,277 40,937 10,268
school of rural public
health - b
laboratory 0
0
252 5
$$ $ $ $
0461 24,466 418,188 1,730 305
64,610 37,821 22,102 4,687
coke building office 0
0
142 3
$$ $ $ $
4634 24,293 145,900 0 0
13,756 13,194 0 0
foundation seed
building
special use
facilities
44
562
22 1
$$ $ $ $
1603 22,868 818,852 0 0
85,319 74,076 0 0
donald l. houston
building
general
academic
2,050
11,243
212 4
$$ $ $ $
8523 22,822 428,703 0 0
43,810 38,768 0 0
warehouse supporting
facilities
817
5,042
100 2
$$ $ $ $
0393 22,666 220,560 0 0
22,150 19,947 0 0
john h. lindsey
building
public
circulation
360
2,204
49 1
$$ $ $ $
0425 22,185 197,020 3,803 716
77,536 17,817 48,635 11,083
henderson hall office 0
0
234 3
$$ $ $ $
0514 22,134 144,270 1,692 1,289
54,666 13,024 21,605 20,036
munnerlyn astronomy
& space sciences
general
academic
0
0
157 2
$$ $ $ $
1095 22,105 226,551 0 0
20,584 20,584 0 0
nuclear science cntr laboratory 0
0
35 1
$$ $ $ $
1114 21,600 933 0 0
84 84 0 0
college avenue
apartments
residence 0
0
0 0
$$ $ $ $
1118 21,600 933 0 0
84 84 0 0
college avenue
apartments
residence 0
0
0 0
$$ $ $ $
1576 21,000 28,245 0 0
2,552 2,552 0 0
an sci equine nutrition
barn
special use
facilities
0
0
5 0
$$ $ $ $
0740 20,904 628,309 5,023 1,378
142,664 56,839 64,222 21,285
mcnew laboratory laboratory 21
318
410 7
$$ $ $ $
6030 20,280 916 0 0
4,567 87 0 0
teex
hanger/classrooms
laboratory 726
4,480
36 0
$$ $ $ $
1345 20,162 806,794 0 0
72,964 72,964 0 0
esti h. d. smith
operations complex
classroom 0
0
137 4
$$ $ $ $
0464 20,027 376,052 0 35
34,760 34,015 0 602
state chemist building office 1
143
66 2
$$ $ $ $
Page 13 of 51Generated on: 1/29/2013 3:13:40PM

DIVISION OF ADMINISTRATIONUTILITIES & ENERGY MANAGEMENT
Energy Cost, Consumption and Energy Use/Cost Index (EUI/ECI) by Building for the previous 12 months ending November 28,
2012
# Electricity
(kwH)
CHW
(mmBtu)
HHW
(mmBtu)
Total CostEUI
(mBtu/GSF)
ECI
(Cost/GSF)
Natural Gas
(mmBtu)
GSFClassificationBuilding
0358 20,026 32,246 108 16
4,628 2,967 1,424 237
davis football player
development center
other 0
0
12 0
$$ $ $ $
0358 19,784 61,981 452 8
11,757 5,702 5,935 121
davis football player
development center
other 0
0
34 1
$$ $ $ $
6502 19,629 30,840 0 0
3,841 2,781 0 0
energy systems lab laboratory 182
1,060
15 0
$$ $ $ $
4010 19,614 540,366 0 0
38,725 38,725 0 0
nutrition/physiology
center
special use
facilities
0
0
94 2
$$ $ $ $
1232 19,468 206,880 0 0
18,711 18,711 0 0
theriogenology
facility, equine
health care
facilities
0
0
36 1
$$ $ $ $
0384 19,363 380,902 3,037 1,383
94,717 34,461 38,846 21,409
sam houston sanders
corps of cadets
public
circulation
0
0
295 5
$$ $ $ $
8236 19,231 93,360 0 0
12,759 8,448 0 0
instructional materials
serv
public
circulation
700
4,311
53 1
$$ $ $ $
1810 19,132 700,941 5,742 1,612
161,725 63,405 73,311 25,009
office of the state
chemist building
laboratory 0
0
509 8
$$ $ $ $
0482 19,074 360,496 3,970 2,224
117,842 32,610 50,757 34,475
fermier hall office 0
0
389 6
$$ $ $ $
4002 18,723 515,819 0 0
36,966 36,966 0 0
beef cattle center
headquarters
public
circulation
0
0
94 2
$$ $ $ $
1034 18,269 65,796 0 0
6,527 5,951 0 0
ag engineering power
& machinery building
special use
facilities
92
576
17 0
$$ $ $ $
8522 18,201 4,254 0 0
4,406 385 0 0
warehouse supporting
facilities
652
4,021
37 0
$$ $ $ $
0519 17,861 771,920 0 0
79,729 69,801 0 0
moore
communications
general
academic
1,740
9,928
245 4
$$ $ $ $
0815 17,618 425,062 1,835 0
70,234 38,467 23,436 0
entomology research
lab
laboratory 1,440
8,330
268 4
$$ $ $ $
8524 17,614 330,873 0 0
29,921 29,921 0 0
warehouse supporting
facilities
0
0
64 2
$$ $ $ $
3198 17,384 467,400 0 0
44,140 42,257 0 0
university apartments
community center
public
circulation
223
1,883
105 3
$$ $ $ $
3099 17,368 322,229 0 0
35,291 35,291 0 0
business
management services
office 0
0
63 2
$$ $ $ $
1184 17,223 702,170 6,141 2,873
218,285 63,504 78,525 44,511
veterinary anatomic
pathology
laboratory 4,343
31,744
915 13
$$ $ $ $
Page 14 of 51Generated on: 1/29/2013 3:13:40PM

DIVISION OF ADMINISTRATIONUTILITIES & ENERGY MANAGEMENT
Energy Cost, Consumption and Energy Use/Cost Index (EUI/ECI) by Building for the previous 12 months ending November 28,
2012
# Electricity
(kwH)
CHW
(mmBtu)
HHW
(mmBtu)
Total CostEUI
(mBtu/GSF)
ECI
(Cost/GSF)
Natural Gas
(mmBtu)
GSFClassificationBuilding
7240 16,732 236,720 0 0
25,108 21,411 0 0
teex copy center supporting
facilities
599
3,696
84 2
$$ $ $ $
1109 16,410 708 0 0
64 64 0 0
college avenue
apartments
residence 0
0
0 0
$$ $ $ $
0457 16,364 147,370 414 222
22,100 13,332 5,291 3,477
taes annex building office 0
0
70 1
$$ $ $ $
8521 16,197 330,393 0 0
29,867 29,867 0 0
warehouse supporting
facilities
0
0
70 2
$$ $ $ $
1565 15,275 473,631 0 0
48,364 42,861 0 0
training/track building special use
facilities
929
5,504
167 3
$$ $ $ $
1550 15,230 615,144 0 0
55,394 55,394 0 0
olsen baseball field special use
facilities
0
0
138 4
$$ $ $ $
1115 14,400 622 0 0
56 56 0 0
college avenue
apartments
residence 0
0
0 0
$$ $ $ $
1117 14,400 622 0 0
56 56 0 0
college avenue
apartments
residence 0
0
0 0
$$ $ $ $
1121 14,400 622 0 0
56 56 0 0
college avenue
apartments
residence 0
0
0 0
$$ $ $ $
1122 14,400 622 0 0
56 56 0 0
college avenue
apartments
residence 0
0
0 0
$$ $ $ $
3197 13,806 89,999 0 0
8,133 8,133 0 0
university apts.
community
supporting
facilities
0
0
22 1
$$ $ $ $
0350 13,800 38,570 0 0
3,484 3,484 0 0
albritton bell tower supporting
facilities
0
0
10 0
$$ $ $ $
7900 13,772 321,040 0 0
32,087 29,044 0 0
teex itsi offices office 493
3,043
115 2
$$ $ $ $
0344 13,687 194,628 0 0
17,593 17,593 0 0
esti recruit classroom
/ fire station
supporting
facilities
0
0
49 1
$$ $ $ $
0481 13,640 229,440 3,344 2,270
98,585 20,749 42,842 34,993
heaton hall office 0
0
469 7
$$ $ $ $
1146 13,492 391,032 1,727 576
66,820 35,366 22,095 8,925
biological control
facility
laboratory 33
433
272 5
$$ $ $ $
1520 13,264 1,212,987 1,715 354
137,163 109,734 21,929 5,500
school of rural public
health - c
classroom 0
0
468 10
$$ $ $ $
0954 13,118 227,280 0 0
21,524 20,546 0 0
agronomy field lab laboratory 127
978
69 2
$$ $ $ $
Page 15 of 51Generated on: 1/29/2013 3:13:40PM

DIVISION OF ADMINISTRATIONUTILITIES & ENERGY MANAGEMENT
Energy Cost, Consumption and Energy Use/Cost Index (EUI/ECI) by Building for the previous 12 months ending November 28,
2012
# Electricity
(kwH)
CHW
(mmBtu)
HHW
(mmBtu)
Total CostEUI
(mBtu/GSF)
ECI
(Cost/GSF)
Natural Gas
(mmBtu)
GSFClassificationBuilding
1112 13,090 565 0 0
51 51 0 0
college avenue
apartments
residence 0
0
0 0
$$ $ $ $
1116 13,090 565 0 0
51 51 0 0
college avenue
apartments
residence 0
0
0 0
$$ $ $ $
1119 13,090 565 0 0
51 51 0 0
college avenue
apartments
residence 0
0
0 0
$$ $ $ $
8081 12,945 243,167 0 0
24,851 21,991 0 0
teex - itsi tech bldg supporting
facilities
464
2,860
100 2
$$ $ $ $
1100 12,930 84,288 0 0
9,017 7,617 0 0
college view apts residence 166
1,401
35 1
$$ $ $ $
1101 12,930 84,288 0 0
9,017 7,617 0 0
college view apts residence 166
1,401
35 1
$$ $ $ $
1102 12,930 84,288 0 0
9,017 7,617 0 0
college view apts residence 166
1,401
35 1
$$ $ $ $
1103 12,930 84,288 0 0
9,017 7,617 0 0
college view apts residence 166
1,401
35 1
$$ $ $ $
1104 12,930 84,288 0 0
9,017 7,617 0 0
college view apts residence 166
1,401
35 1
$$ $ $ $
1105 12,930 84,288 0 0
9,017 7,617 0 0
college view apts residence 166
1,401
35 1
$$ $ $ $
1106 12,930 84,288 0 0
9,017 7,617 0 0
college view apts residence 166
1,401
35 1
$$ $ $ $
1538 12,929 137,309 1,327 217
32,671 12,418 16,910 3,344
agriculture program
visitors center
0 0
0
156 3
$$ $ $ $
1538 12,923 18,727 165 31
4,254 1,685 2,089 480
agriculture program
visitors center
0 0
0
20 0
$$ $ $ $
8517 12,864 8,519 0 0
770 770 0 0
warehouse supporting
facilities
0
0
2 0
$$ $ $ $
8516 12,587 236,442 0 0
21,382 21,382 0 0
warehouse supporting
facilities
0
0
64 2
$$ $ $ $
1092 12,330 57,600 0 0
5,207 5,207 0 0
easterwood hangar
1092
special use
facilities
0
0
16 0
$$ $ $ $
1020 12,234 294,491 2,791 1,156
80,246 26,632 35,678 17,936
vivarium iii laboratory 0
0
405 7
$$ $ $ $
0460 12,047 48,944 0 0
4,606 4,424 0 0
forest genetics -
greenhouse
laboratory 1
182
14 0
$$ $ $ $
Page 16 of 51Generated on: 1/29/2013 3:13:40PM

DIVISION OF ADMINISTRATIONUTILITIES & ENERGY MANAGEMENT
Energy Cost, Consumption and Energy Use/Cost Index (EUI/ECI) by Building for the previous 12 months ending November 28,
2012
# Electricity
(kwH)
CHW
(mmBtu)
HHW
(mmBtu)
Total CostEUI
(mBtu/GSF)
ECI
(Cost/GSF)
Natural Gas
(mmBtu)
GSFClassificationBuilding
8007 12,000 37,980 0 0
6,087 3,436 0 0
administrative bldg supporting
facilities
430
2,651
47 1
$$ $ $ $
7046 12,000 44,720 0 0
6,889 4,094 0 0
aerospace hangar supporting
facilities
454
2,795
51 1
$$ $ $ $
7093 11,640 170,407 0 0
18,392 15,442 0 0
tti machining facility supporting
facilities
482
2,949
91 2
$$ $ $ $
8511 11,560 217,151 0 0
22,191 19,637 0 0
warehouse supporting
facilities
414
2,554
100 2
$$ $ $ $
0458 11,456 132,377 0 0
21,983 11,970 0 0
floriculture
greenhouse
special use
facilities
1,714
10,013
189 2
$$ $ $ $
0956 11,010 3,349 0 0
927 310 0 0
plant pat phy field lab special use
facilities
74
617
8 0
$$ $ $ $
0970 11,000 39,616 0 0
5,003 3,583 0 0
phy plant-grounds
maintenance
supporting
facilities
211
1,420
31 0
$$ $ $ $
1201 10,970 169,401 0 0
19,774 15,331 0 0
poultry science
headquarters
laboratory 801
4,443
126 2
$$ $ $ $
7180 10,933 12,370 0 0
3,549 1,134 0 0
processing lab laboratory 392
2,415
40 0
$$ $ $ $
7007 10,892 106,140 0 0
9,590 9,590 0 0
architecture ranch laboratory 0
0
33 1
$$ $ $ $
1091 10,628 49,332 0 0
4,461 4,461 0 0
easterwood hangar
1091
laboratory 0
0
16 0
$$ $ $ $
8525 10,493 197,107 0 0
20,144 17,826 0 0
good lab practices laboratory 376
2,318
100 2
$$ $ $ $
7535 10,450 196,300 0 0
20,060 17,752 0 0
am vi office and shops supporting
facilities
374
2,309
100 2
$$ $ $ $
3199 10,300 277,680 0 0
25,673 25,095 0 0
children's center public
circulation
67
579
98 2
$$ $ $ $
1187 10,228 226,877 0 0
22,437 20,515 0 0
w.p. luse foundation
building
special use
facilities
319
1,923
107 2
$$ $ $ $
0968 10,200 131,808 0 0
16,465 11,896 0 0
horticulture veg
breeding greenhouse
special use
facilities
809
4,569
123 2
$$ $ $ $
0969 10,096 190,447 0 0
21,866 17,226 0 0
transit services supporting
facilities
795
4,640
143 2
$$ $ $ $
8513 10,055 188,880 0 0
17,081 17,081 0 0
warehouse supporting
facilities
0
0
64 2
$$ $ $ $
Page 17 of 51Generated on: 1/29/2013 3:13:40PM

DIVISION OF ADMINISTRATIONUTILITIES & ENERGY MANAGEMENT
Energy Cost, Consumption and Energy Use/Cost Index (EUI/ECI) by Building for the previous 12 months ending November 28,
2012
# Electricity
(kwH)
CHW
(mmBtu)
HHW
(mmBtu)
Total CostEUI
(mBtu/GSF)
ECI
(Cost/GSF)
Natural Gas
(mmBtu)
GSFClassificationBuilding
0806 10,031 237,621 0 0
21,504 21,504 0 0
soil testing lab laboratory 0
0
81 2
$$ $ $ $
1161 9,888 145,720 0 0
13,166 13,166 0 0
reed house residence 0
0
50 1
$$ $ $ $
8518 9,867 185,348 0 0
19,109 16,761 0 0
warehouse supporting
facilities
381
2,348
103 2
$$ $ $ $
8519 9,857 0 0 0
20 20 0 0
warehouse supporting
facilities
0
0
0 0
$$ $ $ $
8512 9,838 20,640 0 0
4,223 1,861 0 0
warehouse supporting
facilities
382
2,362
46 0
$$ $ $ $
1277 9,767 159,600 0 0
16,816 14,431 0 0
easterwood rescue
and fire facility
special use
facilities
379
2,385
95 2
$$ $ $ $
3051 9,654 0 0 0
616 0 0 0
gerg east lab & office
building
supporting
facilities
70
616
7 0
$$ $ $ $
1042 9,632 399,525 0 0
40,891 36,175 0 0
forest science
laboratory building
laboratory 804
4,716
225 4
$$ $ $ $
0501 9,600 100,686 0 0
9,588 9,110 0 0
concrete materials
laboratory
laboratory 48
478
41 1
$$ $ $ $
8510 9,600 23,266 0 0
4,270 2,100 0 0
tti pavements
research facility
laboratory 352
2,170
45 0
$$ $ $ $
1043 9,131 306,923 0 0
28,193 27,755 0 0
mosquito research lab supporting
facilities
53
438
120 3
$$ $ $ $
0538 9,125 59,484 0 0
6,364 5,375 0 0
hensel apts bldg x-1 residence 117
989
35 1
$$ $ $ $
0539 9,125 59,484 0 0
6,364 5,375 0 0
hensel apts bldg x-2 residence 117
989
35 1
$$ $ $ $
0540 9,125 59,484 0 0
6,364 5,375 0 0
hensel apts bldg x-3 residence 117
989
35 1
$$ $ $ $
0541 9,125 59,484 0 0
6,364 5,375 0 0
hensel apts bldg x-4 residence 117
989
35 1
$$ $ $ $
0542 9,125 59,484 0 0
6,364 5,375 0 0
hensel apts bldg y-1 residence 117
989
35 1
$$ $ $ $
0543 9,125 59,484 0 0
6,364 5,375 0 0
hensel apts bldg y-2 residence 117
989
35 1
$$ $ $ $
0544 9,125 59,484 0 0
6,364 5,375 0 0
hensel apts bldg y-3 residence 117
989
35 1
$$ $ $ $
Page 18 of 51Generated on: 1/29/2013 3:13:40PM
DIVISION OF ADMINISTRATIONUTILITIES & ENERGY MANAGEMENT
Energy Cost, Consumption and Energy Use/Cost Index (EUI/ECI) by Building for the previous 12 months ending November 28,
2012
# Electricity
(kwH)
CHW
(mmBtu)
HHW
(mmBtu)
Total CostEUI
(mBtu/GSF)
ECI
(Cost/GSF)
Natural Gas
(mmBtu)
GSFClassificationBuilding
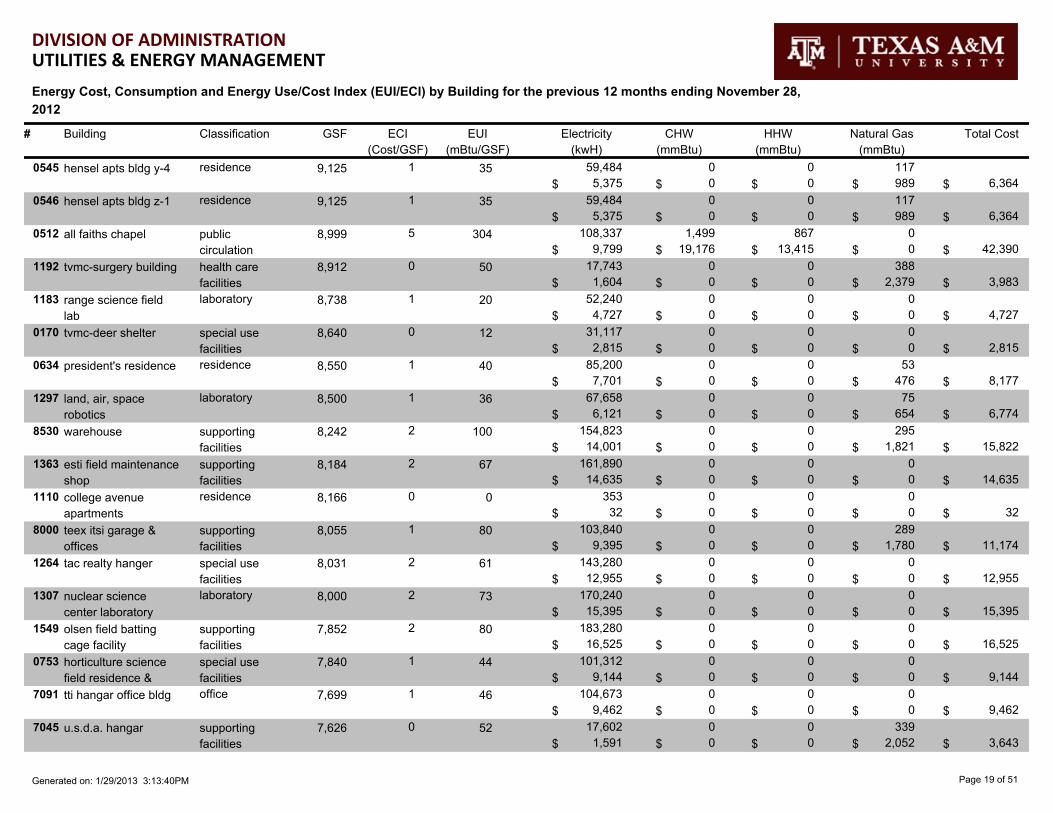
0545 9,125 59,484 0 0
6,364 5,375 0 0
hensel apts bldg y-4 residence 117
989
35 1
$$ $ $ $
0546 9,125 59,484 0 0
6,364 5,375 0 0
hensel apts bldg z-1 residence 117
989
35 1
$$ $ $ $
0512 8,999 108,337 1,499 867
42,390 9,799 19,176 13,415
all faiths chapel public
circulation
0
0
304 5
$$ $ $ $
1192 8,912 17,743 0 0
3,983 1,604 0 0
tvmc-surgery building health care
facilities
388
2,379
50 0
$$ $ $ $
1183 8,738 52,240 0 0
4,727 4,727 0 0
range science field
lab
laboratory 0
0
20 1
$$ $ $ $
0170 8,640 31,117 0 0
2,815 2,815 0 0
tvmc-deer shelter special use
facilities
0
0
12 0
$$ $ $ $
0634 8,550 85,200 0 0
8,177 7,701 0 0
president's residence residence 53
476
40 1
$$ $ $ $
1297 8,500 67,658 0 0
6,774 6,121 0 0
land, air, space
robotics
laboratory 75
654
36 1
$$ $ $ $
8530 8,242 154,823 0 0
15,822 14,001 0 0
warehouse supporting
facilities
295
1,821
100 2
$$ $ $ $
1363 8,184 161,890 0 0
14,635 14,635 0 0
esti field maintenance
shop
supporting
facilities
0
0
67 2
$$ $ $ $
1110 8,166 353 0 0
32 32 0 0
college avenue
apartments
residence 0
0
0 0
$$ $ $ $
8000 8,055 103,840 0 0
11,174 9,395 0 0
teex itsi garage &
offices
supporting
facilities
289
1,780
80 1
$$ $ $ $
1264 8,031 143,280 0 0
12,955 12,955 0 0
tac realty hanger special use
facilities
0
0
61 2
$$ $ $ $
1307 8,000 170,240 0 0
15,395 15,395 0 0
nuclear science
center laboratory
laboratory 0
0
73 2
$$ $ $ $
1549 7,852 183,280 0 0
16,525 16,525 0 0
olsen field batting
cage facility
supporting
facilities
0
0
80 2
$$ $ $ $
0753 7,840 101,312 0 0
9,144 9,144 0 0
horticulture science
field residence &
special use
facilities
0
0
44 1
$$ $ $ $
7091 7,699 104,673 0 0
9,462 9,462 0 0
tti hangar office bldg office 0
0
46 1
$$ $ $ $
7045 7,626 17,602 0 0
3,643 1,591 0 0
u.s.d.a. hangar supporting
facilities
339
2,052
52 0
$$ $ $ $
Page 19 of 51Generated on: 1/29/2013 3:13:40PM

DIVISION OF ADMINISTRATIONUTILITIES & ENERGY MANAGEMENT
Energy Cost, Consumption and Energy Use/Cost Index (EUI/ECI) by Building for the previous 12 months ending November 28,
2012
# Electricity
(kwH)
CHW
(mmBtu)
HHW
(mmBtu)
Total CostEUI
(mBtu/GSF)
ECI
(Cost/GSF)
Natural Gas
(mmBtu)
GSFClassificationBuilding
0459 7,612 95,760 0 0
8,672 8,672 0 0
horticulture
greenhouse
special use
facilities
0
0
43 1
$$ $ $ $
1051 7,564 164,760 0 0
17,611 14,899 0 0
center for urban and
structural entomology
supporting
facilities
435
2,713
132 2
$$ $ $ $
7061 7,560 33,434 0 0
4,692 3,022 0 0
tti research laboratory 271
1,670
51 1
$$ $ $ $
7096 7,500 62,880 0 0
5,679 5,679 0 0
tti environmental &
emissions research
0 0
0
29 1
$$ $ $ $
1260 7,462 19,576 0 0
1,770 1,770 0 0
airport hangar special use
facilities
0
0
9 0
$$ $ $ $
1064 7,280 26,219 0 0
8,750 2,372 0 0
greenhouse special use
facilities
1,105
6,378
164 1
$$ $ $ $
1750 7,268 181,798 0 0
14,241 14,241 0 0
reproductive sciences
bldg. a
supporting
facilities
0
0
85 2
$$ $ $ $
1120 7,200 311 0 0
28 28 0 0
college avenue
apartments
residence 0
0
0 0
$$ $ $ $
1030 7,136 27,440 0 0
2,710 2,485 0 0
ag engr res lab &
shop
special use
facilities
36
225
18 0
$$ $ $ $
0853 7,000 9,415 0 0
851 851 0 0
horse center special use
facilities
0
0
5 0
$$ $ $ $
1066 6,945 233,445 0 0
21,594 21,110 0 0
cotton ginning lab laboratory 51
484
122 3
$$ $ $ $
1140 6,797 129,667 0 0
11,723 11,723 0 0
esti extinguisher refill
building
supporting
facilities
0
0
65 2
$$ $ $ $
1561 6,677 292,013 0 0
26,391 26,391 0 0
george p. mitchell '40
outdoor tennis center
special use
facilities
0
0
149 4
$$ $ $ $
1142 6,667 98,604 0 0
8,916 8,916 0 0
esti marine
classroom/first aid
supporting
facilities
0
0
50 1
$$ $ $ $
1149 6,625 27,279 0 0
3,277 3,277 0 0
billy bryant barn special use
facilities
0
0
14 0
$$ $ $ $
1108 6,525 282 0 0
25 25 0 0
college avenue
apartments
residence 0
0
0 0
$$ $ $ $
1259 6,515 2,849 0 0
258 258 0 0
airport-aircraft hanger
j
supporting
facilities
0
0
1 0
$$ $ $ $
6884 6,500 20,900 0 0
1,890 1,890 0 0
honey bee/apiary
services building
special use
facilities
0
0
11 0
$$ $ $ $
Page 20 of 51Generated on: 1/29/2013 3:13:40PM

DIVISION OF ADMINISTRATIONUTILITIES & ENERGY MANAGEMENT
Energy Cost, Consumption and Energy Use/Cost Index (EUI/ECI) by Building for the previous 12 months ending November 28,
2012
# Electricity
(kwH)
CHW
(mmBtu)
HHW
(mmBtu)
Total CostEUI
(mBtu/GSF)
ECI
(Cost/GSF)
Natural Gas
(mmBtu)
GSFClassificationBuilding
0884 6,193 200 0 0
66 66 0 0
entomology apiary
bldg
supporting
facilities
0
0
0 0
$$ $ $ $
4021 6,160 16,691 0 0
1,375 1,375 0 0
livestock housing special use
facilities
0
0
9 0
$$ $ $ $
1001 6,100 2,212 0 0
221 221 0 0
farm service
implement #1
special use
facilities
0
0
1 0
$$ $ $ $
1002 6,100 10,340 0 0
932 932 0 0
farm service
implement #2
special use
facilities
0
0
6 0
$$ $ $ $
0965 6,060 149,520 0 0
19,967 13,529 0 0
beasley laboratory laboratory 1,149
6,439
274 3
$$ $ $ $
0955 6,004 21,623 0 0
3,124 1,956 0 0
soil/crop cotton
genetic greenhouse
special use
facilities
170
1,168
41 1
$$ $ $ $
1209 6,000 92,653 0 0
10,815 8,385 0 0
poultry sci integrated
repro
special use
facilities
438
2,430
126 2
$$ $ $ $
1203 6,000 92,653 0 0
10,815 8,385 0 0
poultry sci nutrition &
phys
laboratory 438
2,430
126 2
$$ $ $ $
0829 5,976 15,397 0 0
4,404 1,392 0 0
grounds maintenance
office shop/stor
supporting
facilities
530
3,012
98 1
$$ $ $ $
0828 5,976 15,397 0 0
1,392 1,392 0 0
grounds shop
warehouse
supporting
facilities
0
0
9 0
$$ $ $ $
0759 5,773 298,789 0 0
26,982 26,982 0 0
nicks low speed wind
tunnel
laboratory 0
0
177 5
$$ $ $ $
0979 5,739 27,360 0 0
2,474 2,474 0 0
turfgrass field lab laboratory 0
0
16 0
$$ $ $ $
0431 5,703 99,242 0 593
18,187 8,978 0 9,209
maintenance shop at
central utility plant
supporting
facilities
0
0
163 3
$$ $ $ $
0510 5,696 20,514 0 0
2,362 1,856 0 0
adriance lab supporting
facilities
56
506
22 0
$$ $ $ $
1123 5,688 37,079 0 0
3,351 3,351 0 0
avenue a apt#1 residence 0
0
22 1
$$ $ $ $
1128 5,688 37,079 0 0
3,351 3,351 0 0
avenue a apt#10 residence 0
0
22 1
$$ $ $ $
1127 5,688 37,079 0 0
3,351 3,351 0 0
avenue a apt#11 residence 0
0
22 1
$$ $ $ $
1124 5,688 37,079 0 0
3,351 3,351 0 0
avenue a apt#2 residence 0
0
22 1
$$ $ $ $
Page 21 of 51Generated on: 1/29/2013 3:13:40PM

DIVISION OF ADMINISTRATIONUTILITIES & ENERGY MANAGEMENT
Energy Cost, Consumption and Energy Use/Cost Index (EUI/ECI) by Building for the previous 12 months ending November 28,
2012
# Electricity
(kwH)
CHW
(mmBtu)
HHW
(mmBtu)
Total CostEUI
(mBtu/GSF)
ECI
(Cost/GSF)
Natural Gas
(mmBtu)
GSFClassificationBuilding
1125 5,688 37,079 0 0
3,351 3,351 0 0
avenue a apt#3 residence 0
0
22 1
$$ $ $ $
1126 5,688 37,079 0 0
3,351 3,351 0 0
avenue a apt#4 residence 0
0
22 1
$$ $ $ $
1134 5,688 37,079 0 0
3,351 3,351 0 0
avenue a apt#5 residence 0
0
22 1
$$ $ $ $
1135 5,688 37,079 0 0
3,351 3,351 0 0
avenue a apt#6 residence 0
0
22 1
$$ $ $ $
1136 5,688 37,079 0 0
3,351 3,351 0 0
avenue a apt#7 residence 0
0
22 1
$$ $ $ $
1138 5,688 37,079 0 0
3,351 3,351 0 0
avenue a apt#8 residence 0
0
22 1
$$ $ $ $
1137 5,688 37,079 0 0
3,351 3,351 0 0
avenue a apt#9 residence 0
0
22 1
$$ $ $ $
4025 5,663 15,345 0 0
1,264 1,264 0 0
thomsen animal
euthenics center
special use
facilities
0
0
9 0
$$ $ $ $
0806 5,544 19,491 0 0
1,754 1,754 0 0
soil testing lab laboratory 0
0
12 0
$$ $ $ $
1191 5,515 7,030 0 0
657 657 0 0
floriculture growing
facility
special use
facilities
0
0
4 0
$$ $ $ $
0630 5,502 69,840 0 0
6,676 6,313 0 0
vice president's
residence
residence 21
364
47 1
$$ $ $ $
1067 5,488 66,757 0 0
6,746 6,028 0 0
agronomy field crop
laboratory
special use
facilities
68
718
54 1
$$ $ $ $
0755 5,484 141,680 0 0
13,722 12,815 0 0
easterwood general
aviation terminal
public
circulation
132
907
112 3
$$ $ $ $
1111 5,453 235 0 0
21 21 0 0
college avenue
apartments
residence 0
0
0 0
$$ $ $ $
1050 5,412 181,915 0 0
16,711 16,450 0 0
cuse-research labs laboratory 31
260
120 3
$$ $ $ $
1204 5,400 83,388 0 0
9,734 7,547 0 0
poultry sci
environmental res
laboratory 394
2,187
126 2
$$ $ $ $
1029 5,280 19,016 0 0
4,551 1,720 0 0
agronomy implement
storage
special use
facilities
483
2,830
104 1
$$ $ $ $
1186 5,177 174,016 0 0
15,736 15,736 0 0
tvmc-isolation
laboratory
health care
facilities
0
0
115 3
$$ $ $ $
Page 22 of 51Generated on: 1/29/2013 3:13:40PM

DIVISION OF ADMINISTRATIONUTILITIES & ENERGY MANAGEMENT
Energy Cost, Consumption and Energy Use/Cost Index (EUI/ECI) by Building for the previous 12 months ending November 28,
2012
# Electricity
(kwH)
CHW
(mmBtu)
HHW
(mmBtu)
Total CostEUI
(mBtu/GSF)
ECI
(Cost/GSF)
Natural Gas
(mmBtu)
GSFClassificationBuilding
9351 5,160 8,279 660 0
9,188 749 8,439 0
water tower under
investigation
0
0
133 2
$$ $ $ $
1406 5,143 57,715 580 175
15,352 5,222 7,416 2,714
corps lounge - c public
circulation
0
0
185 3
$$ $ $ $
1410 5,047 33,482 485 258
13,242 3,029 6,199 4,013
corps lounge - e public
circulation
0
0
170 3
$$ $ $ $
1401 5,031 58,399 587 162
15,313 5,283 7,512 2,518
corps lounge - b office 0
0
188 3
$$ $ $ $
8004 5,031 190,400 0 0
18,340 17,229 0 0
teex itsi offices -
water lab
laboratory 180
1,111
165 4
$$ $ $ $
8561 5,000 93,923 0 0
9,598 8,494 0 0
truck maintenance
shop
supporting
facilities
179
1,105
100 2
$$ $ $ $
0347 4,960 70,531 0 0
6,375 6,375 0 0
esti municipal
classroom
classroom 0
0
49 1
$$ $ $ $
1566 4,907 152,151 0 0
13,769 13,769 0 0
soccer building special use
facilities
0
0
106 3
$$ $ $ $
1208 4,896 75,605 0 0
8,825 6,842 0 0
poultry sci
comparative rearing
special use
facilities
358
1,983
126 2
$$ $ $ $
0989 4,876 17,561 0 0
1,653 1,588 0 0
tvmc-caged animals laboratory 0
65
12 0
$$ $ $ $
1556 4,822 153,662 0 0
13,902 13,902 0 0
penberthy intramural
sports center
supporting
facilities
0
0
109 3
$$ $ $ $
0747 4,800 12,367 0 0
2,194 1,118 0 0
grounds maintenance
supply bldg
office 145
1,076
39 0
$$ $ $ $
1213 4,800 74,122 0 0
8,652 6,708 0 0
poultry science caged
layer #1
special use
facilities
351
1,944
126 2
$$ $ $ $
1214 4,800 74,122 0 0
8,652 6,708 0 0
poultry science caged
layer #2
special use
facilities
351
1,944
126 2
$$ $ $ $
0672 4,751 224,080 0 0
20,858 20,244 0 0
golf course clubhouse public
circulation
67
614
175 4
$$ $ $ $
3196 4,720 1,536,853 0 0
139,040 139,040 0 0
hensel park telecom
building
0 0
0
1,111 29
$$ $ $ $
1229 4,632 4,186 0 0
385 385 0 0
schubot aviary br
facility
special use
facilities
0
0
3 0
$$ $ $ $
8901 4,519 144,007 0 0
13,029 13,029 0 0
student media
temporary building
office 0
0
109 3
$$ $ $ $
Page 23 of 51Generated on: 1/29/2013 3:13:40PM

DIVISION OF ADMINISTRATIONUTILITIES & ENERGY MANAGEMENT
Energy Cost, Consumption and Energy Use/Cost Index (EUI/ECI) by Building for the previous 12 months ending November 28,
2012
# Electricity
(kwH)
CHW
(mmBtu)
HHW
(mmBtu)
Total CostEUI
(mBtu/GSF)
ECI
(Cost/GSF)
Natural Gas
(mmBtu)
GSFClassificationBuilding
0862 4,518 37,750 0 0
3,407 3,407 0 0
butler building special use
facilities
0
0
29 1
$$ $ $ $
1207 4,500 69,490 0 0
8,112 6,289 0 0
poultry sci repro &
embryology
laboratory 329
1,823
126 2
$$ $ $ $
0685 4,400 11,336 0 0
1,025 1,025 0 0
grounds maintenance
- tractor shed
supporting
facilities
0
0
9 0
$$ $ $ $
1083 4,394 15,825 0 0
1,431 1,431 0 0
research park
maintenance bldg
supporting
facilities
0
0
12 0
$$ $ $ $
1147 4,358 146,487 0 0
13,522 13,247 0 0
reproductive sciences
lab
laboratory 9
275
117 3
$$ $ $ $
0039 4,333 124,720 0 0
10,368 10,368 0 0
aquaculture research
teaching facility
laboratory 0
0
98 2
$$ $ $ $
0717 4,304 144,672 0 0
13,082 13,082 0 0
storage and lab-
-cyclotron
laboratory 0
0
115 3
$$ $ $ $
0991 4,264 27,400 0 0
4,114 2,475 0 0
vmp shop supporting
facilities
258
1,639
82 1
$$ $ $ $
0990 4,252 27,840 0 0
3,422 2,518 0 0
poultry health
research lab
laboratory 97
904
45 1
$$ $ $ $
7056 4,220 2,520 0 0
1,176 231 0 0
elen storage supporting
facilities
151
945
38 0
$$ $ $ $
0732 4,162 10,723 0 0
3,065 970 0 0
grounds maintenance
greenhouse
special use
facilities
369
2,096
98 1
$$ $ $ $
0733 4,162 10,723 0 0
3,065 970 0 0
grounds maintenance
greenhouse
special use
facilities
369
2,096
98 1
$$ $ $ $
1040 4,141 139,193 0 0
12,775 12,587 0 0
cardiovascular
pathology laboratory
laboratory 13
188
118 3
$$ $ $ $
1027 4,040 5,149 0 0
484 484 0 0
nursery floral field
laboratory
special use
facilities
0
0
4 0
$$ $ $ $
4003 4,033 111,109 0 0
7,963 7,963 0 0
beef cattle center feed
mill
special use
facilities
0
0
94 2
$$ $ $ $
4011 4,030 111,027 0 0
7,957 7,957 0 0
equipment
storage/diet prep
special use
facilities
0
0
94 2
$$ $ $ $
0522 4,010 14,442 0 0
1,306 1,306 0 0
tvmc-lab animal
shelter
health care
facilities
0
0
12 0
$$ $ $ $
7063 4,007 126,686 0 0
12,322 11,436 0 0
conservation research
lab
laboratory 144
885
144 3
$$ $ $ $
Page 24 of 51Generated on: 1/29/2013 3:13:40PM

DIVISION OF ADMINISTRATIONUTILITIES & ENERGY MANAGEMENT
Energy Cost, Consumption and Energy Use/Cost Index (EUI/ECI) by Building for the previous 12 months ending November 28,
2012
# Electricity
(kwH)
CHW
(mmBtu)
HHW
(mmBtu)
Total CostEUI
(mBtu/GSF)
ECI
(Cost/GSF)
Natural Gas
(mmBtu)
GSFClassificationBuilding
1003 4,000 4,720 0 0
1,260 487 0 0
farm service shop special use
facilities
98
773
29 0
$$ $ $ $
1246 4,000 14,406 0 0
1,303 1,303 0 0
generator storage
building
supporting
facilities
0
0
12 0
$$ $ $ $
0655 4,000 94,299 0 0
8,538 8,538 0 0
golf course
maintenance shop
supporting
facilities
0
0
80 2
$$ $ $ $
1244 4,000 0 0 0
908 0 0 0
utilities inventory
warehouse building 1
supporting
facilities
118
908
30 0
$$ $ $ $
1567 3,964 122,912 0 0
11,123 11,123 0 0
softball building special use
facilities
0
0
106 3
$$ $ $ $
1287 3,942 77,978 0 0
7,049 7,049 0 0
esti ems
shop/storage building
supporting
facilities
0
0
67 2
$$ $ $ $
1094 3,872 130,151 0 0
11,958 11,769 0 0
tvmc-poultry disease
research
special use
facilities
12
189
118 3
$$ $ $ $
1575 3,850 13,866 0 0
1,254 1,254 0 0
animal science
stallion barn
special use
facilities
0
0
12 0
$$ $ $ $
1216 3,840 129,075 0 0
13,227 11,672 0 0
ps gamebird repro &
management
special use
facilities
280
1,555
188 3
$$ $ $ $
1239 3,814 22,240 0 0
2,008 2,008 0 0
physics teaching
observatory
laboratory 0
0
20 1
$$ $ $ $
7003 3,746 2,700 0 0
1,097 244 0 0
office bldg supporting
facilities
134
853
38 0
$$ $ $ $
7042 3,731 0 0 0
33 33 0 0
u.s.d.a. hangar no. 1 supporting
facilities
0
0
0 0
$$ $ $ $
4022 3,720 10,080 0 0
831 831 0 0
isolation barn special use
facilities
0
0
9 0
$$ $ $ $
1400 3,714 48,009 460 142
12,424 4,344 5,877 2,202
corps lounge - a office 0
0
206 3
$$ $ $ $
0960 3,650 9,770 0 0
4,760 882 0 0
scs forage
greenhouse
special use
facilities
692
3,878
199 1
$$ $ $ $
7064 3,625 36,319 0 0
4,084 3,283 0 0
conservation projects laboratory 130
801
70 1
$$ $ $ $
1211 3,618 55,870 0 0
6,522 5,056 0 0
poultry science broiler
#1
special use
facilities
264
1,465
126 2
$$ $ $ $
1212 3,618 55,870 0 0
6,522 5,056 0 0
poultry science broiler
#2
special use
facilities
264
1,465
126 2
$$ $ $ $
Page 25 of 51Generated on: 1/29/2013 3:13:40PM

DIVISION OF ADMINISTRATIONUTILITIES & ENERGY MANAGEMENT
Energy Cost, Consumption and Energy Use/Cost Index (EUI/ECI) by Building for the previous 12 months ending November 28,
2012
# Electricity
(kwH)
CHW
(mmBtu)
HHW
(mmBtu)
Total CostEUI
(mBtu/GSF)
ECI
(Cost/GSF)
Natural Gas
(mmBtu)
GSFClassificationBuilding
1193 3,600 121,008 0 0
10,943 10,943 0 0
wildlife & exotic
animal ctr
special use
facilities
0
0
115 3
$$ $ $ $
1165 3,579 12,890 0 0
1,166 1,166 0 0
hazardous waste
storage bldg
supporting
facilities
0
0
12 0
$$ $ $ $
0966 3,570 12,857 0 0
1,163 1,163 0 0
purchasing & stores -
general storage
supporting
facilities
0
0
12 0
$$ $ $ $
1098 3,540 41,591 0 0
3,827 3,827 0 0
n.s.c. hyperbaric lab laboratory 0
0
40 1
$$ $ $ $
1190 3,509 14,912 0 0
4,487 1,347 0 0
floriculture research
greenhse
special use
facilities
521
3,140
163 1
$$ $ $ $
0348 3,500 38,120 0 0
3,446 3,446 0 0
esti pump / vehicle
maintenance
supporting
facilities
0
0
37 1
$$ $ $ $
1497 3,480 71,051 433 64
12,967 6,426 5,541 1,000
utilities business
office
office 0
0
212 4
$$ $ $ $
1065 3,470 110,578 0 0
10,004 10,004 0 0
soil & crop sci dry
processing
laboratory 0
0
109 3
$$ $ $ $
1411 3,456 32,277 356 117
9,288 2,920 4,554 1,813
corps lounge - f office 0
0
169 3
$$ $ $ $
1581 3,437 4,040 0 0
366 366 0 0
penberthy recsports
maintenance bldg
other 0
0
4 0
$$ $ $ $
0943 3,400 12,245 0 0
1,108 1,108 0 0
tvmc-barn no 2 special use
facilities
0
0
12 0
$$ $ $ $
0831 3,392 8,739 0 0
2,498 790 0 0
grounds maintenance
greenhouse
supporting
facilities
301
1,708
98 1
$$ $ $ $
1215 3,360 56,470 0 0
6,467 5,107 0 0
ps environmental
biotechnology
special use
facilities
245
1,361
130 2
$$ $ $ $
0742 3,350 8,631 0 0
1,896 780 0 0
grounds maintenance
storage
supporting
facilities
157
1,115
56 1
$$ $ $ $
8687 3,300 1,970 0 0
182 182 0 0
teex shoot house special use
facilities
0
0
2 0
$$ $ $ $
0880 3,260 78,420 409 2
12,434 7,093 5,251 89
tvmc-small animal
building
office 0
0
208 4
$$ $ $ $
0992 3,256 11,726 0 0
1,061 1,061 0 0
tvmc-experimental
animal bldg
special use
facilities
0
0
12 0
$$ $ $ $
1271 3,250 217,950 0 0
19,703 19,703 0 0
storage/wind tunnel
support building
supporting
facilities
0
0
229 6
$$ $ $ $
Page 26 of 51Generated on: 1/29/2013 3:13:40PM

DIVISION OF ADMINISTRATIONUTILITIES & ENERGY MANAGEMENT
Energy Cost, Consumption and Energy Use/Cost Index (EUI/ECI) by Building for the previous 12 months ending November 28,
2012
# Electricity
(kwH)
CHW
(mmBtu)
HHW
(mmBtu)
Total CostEUI
(mBtu/GSF)
ECI
(Cost/GSF)
Natural Gas
(mmBtu)
GSFClassificationBuilding
0047 3,240 85,048 0 0
6,699 6,699 0 0
aquatic research
center
laboratory 0
0
90 2
$$ $ $ $
0057 3,200 17,921 0 0
1,626 1,626 0 0
hatchery bldg supporting
facilities
0
0
19 1
$$ $ $ $
1205 3,160 48,797 0 0
5,696 4,416 0 0
poultry science feed
mixing
laboratory 231
1,280
126 2
$$ $ $ $
7044 3,131 7,227 0 0
653 653 0 0
u.s.d.a. hangar no.4 supporting
facilities
0
0
8 0
$$ $ $ $
1427 3,128 26,806 296 138
8,347 2,428 3,788 2,131
civilian lounge - a1 office 0
0
168 3
$$ $ $ $
7177 3,119 1,330 0 0
909 160 0 0
nautical archeology
storage
laboratory 122
750
41 0
$$ $ $ $
7178 3,119 41 0 0
66 66 0 0
teex storage supporting
facilities
0
0
0 0
$$ $ $ $
7043 3,107 0 0 0
879 33 0 0
u.s.d.a. hangar no. 3 supporting
facilities
138
846
44 0
$$ $ $ $
7041 3,107 7,171 0 0
648 648 0 0
u.s.d.a. hangar no.2 supporting
facilities
0
0
8 0
$$ $ $ $
7080 3,101 58,251 0 0
6,058 5,268 0 0
biology storage supporting
facilities
128
790
106 2
$$ $ $ $
7095 3,100 7,333 0 0
665 665 0 0
tti storage supporting
facilities
0
0
8 0
$$ $ $ $
7006 3,092 38,370 0 0
4,243 3,466 0 0
chapel & assembly
hall
supporting
facilities
126
776
83 1
$$ $ $ $
7079 3,069 1,460 0 0
815 137 0 0
turbo lab storage supporting
facilities
110
678
37 0
$$ $ $ $
8483 3,058 4,730 0 0
1,105 430 0 0
archaeological
projects bldg
laboratory 110
675
41 0
$$ $ $ $
1578 3,057 787,373 0 0
71,470 71,470 0 0
penberthy recsports
pavillion
other 0
0
879 23
$$ $ $ $
0728 3,055 7,871 0 0
712 712 0 0
grounds maintenance
greenhouse 5
special use
facilities
0
0
9 0
$$ $ $ $
0726 3,046 7,848 0 0
2,243 710 0 0
grounds maintenance
greenhouse 4
special use
facilities
270
1,534
98 1
$$ $ $ $
7057 3,025 300 0 0
733 65 0 0
tees records archive supporting
facilities
108
668
36 0
$$ $ $ $
Page 27 of 51Generated on: 1/29/2013 3:13:40PM

DIVISION OF ADMINISTRATIONUTILITIES & ENERGY MANAGEMENT
Energy Cost, Consumption and Energy Use/Cost Index (EUI/ECI) by Building for the previous 12 months ending November 28,
2012
# Electricity
(kwH)
CHW
(mmBtu)
HHW
(mmBtu)
Total CostEUI
(mBtu/GSF)
ECI
(Cost/GSF)
Natural Gas
(mmBtu)
GSFClassificationBuilding
1179 3,000 10,804 0 0
2,562 977 0 0
forest science
greenhouse
special use
facilities
283
1,585
107 1
$$ $ $ $
1176 3,000 10,804 0 0
2,562 977 0 0
hort/fs greenhouse special use
facilities
283
1,585
107 1
$$ $ $ $
1177 3,000 10,804 0 0
2,562 977 0 0
hort/fs greenhouse special use
facilities
283
1,585
107 1
$$ $ $ $
1178 3,000 10,805 0 0
2,562 977 0 0
hort/fs greenhouse special use
facilities
283
1,585
107 1
$$ $ $ $
1077 3,000 10,804 0 0
1,752 977 0 0
scsc small grain
greenhouse
special use
facilities
132
775
56 1
$$ $ $ $
1173 3,000 988 0 0
872 98 0 0
soil & crop
greenhouse
special use
facilities
132
775
45 0
$$ $ $ $
1078 2,970 10,696 0 0
1,734 968 0 0
soil & crop peanut
greenhouse
special use
facilities
131
767
56 1
$$ $ $ $
7182 2,963 3,352 0 0
307 307 0 0
extraction building laboratory 0
0
4 0
$$ $ $ $
1570 2,962 172,960 0 0
15,663 15,663 0 0
omar smith
instructional tennis
office 0
0
199 5
$$ $ $ $
1089 2,937 55,074 0 0
4,982 4,982 0 0
utilities energy office
annex
office 0
0
64 2
$$ $ $ $
1045 2,887 8,050 0 0
2,755 728 0 0
usda greenhouse 1 special use
facilities
303
2,028
115 1
$$ $ $ $
0984 2,882 5,190 0 0
925 469 0 0
horticulture vegetable
greenhouse
special use
facilities
72
455
31 0
$$ $ $ $
0985 2,882 5,190 0 0
925 469 0 0
horticulture vegetable
greenhouse
special use
facilities
72
455
31 0
$$ $ $ $
0986 2,882 5,190 0 0
925 469 0 0
horticulture vegetable
greenhouse
special use
facilities
72
455
31 0
$$ $ $ $
1579 2,880 96,806 0 0
8,754 8,754 0 0
small upland fowl res.
lab.
special use
facilities
0
0
115 3
$$ $ $ $
1049 2,866 5,946 0 0
3,101 536 0 0
usda greenhouse 2 special use
facilities
416
2,565
152 1
$$ $ $ $
8529 2,863 53,780 0 0
5,496 4,863 0 0
warehouse supporting
facilities
103
633
100 2
$$ $ $ $
0688 2,849 56,357 0 0
5,095 5,095 0 0
esti industrial
technician office/shop
supporting
facilities
0
0
67 2
$$ $ $ $
Page 28 of 51Generated on: 1/29/2013 3:13:40PM

DIVISION OF ADMINISTRATIONUTILITIES & ENERGY MANAGEMENT
Energy Cost, Consumption and Energy Use/Cost Index (EUI/ECI) by Building for the previous 12 months ending November 28,
2012
# Electricity
(kwH)
CHW
(mmBtu)
HHW
(mmBtu)
Total CostEUI
(mBtu/GSF)
ECI
(Cost/GSF)
Natural Gas
(mmBtu)
GSFClassificationBuilding
6881 2,840 53,348 0 0
4,824 4,824 0 0
bath house laboratory 0
0
64 2
$$ $ $ $
0689 2,819 55,764 0 0
5,041 5,041 0 0
esti warehouse
building
supporting
facilities
0
0
67 2
$$ $ $ $
1516 2,800 47,059 0 0
5,734 4,255 0 0
horticulture field
laboratory
special use
facilities
264
1,479
152 2
$$ $ $ $
3172 2,716 6,985 0 0
631 631 0 0
horticulture
classroom
classroom 0
0
9 0
$$ $ $ $
3171 2,716 8,313 0 0
750 750 0 0
horticulture office special use
facilities
0
0
10 0
$$ $ $ $
1210 2,700 45,378 0 0
5,197 4,103 0 0
ps intensive mgt &
rearing
special use
facilities
197
1,093
130 2
$$ $ $ $
1143 2,635 45,289 0 0
4,090 4,090 0 0
esti fixed system
classroom
classroom 0
0
59 2
$$ $ $ $
1144 2,612 57,619 0 0
5,212 5,212 0 0
esti industrial
classroom
classroom 0
0
75 2
$$ $ $ $
1247 2,600 22,753 0 0
2,056 2,056 0 0
hazardous waste
office & support bldg
supporting
facilities
0
0
30 1
$$ $ $ $
1217 2,592 87,126 0 0
7,879 7,879 0 0
ps gamebird rearing &
flt pen
special use
facilities
0
0
115 3
$$ $ $ $
1060 2,542 9,155 0 0
1,664 828 0 0
greenhouse-small
grains
special use
facilities
145
836
69 1
$$ $ $ $
4020 2,539 6,880 0 0
567 567 0 0
sheep & goat center special use
facilities
0
0
9 0
$$ $ $ $
1008 2,504 0 0 0
65 0 0 0
tvmc-barn no. 3 laboratory 0
65
0 0
$$ $ $ $
1010 2,500 84,033 0 0
22,325 7,599 0 0
tvmc-small animal
research bldg
laboratory 2,702
14,726
1,196 9
$$ $ $ $
0993 2,474 8,910 0 0
806 806 0 0
tvmc-barn special use
facilities
0
0
12 0
$$ $ $ $
0994 2,474 8,910 0 0
806 806 0 0
tvmc-reproduction
barn
special use
facilities
0
0
12 0
$$ $ $ $
1141 2,404 45,861 0 0
4,146 4,146 0 0
esti rescue classroom classroom 0
0
65 2
$$ $ $ $
1245 2,400 8,644 0 0
782 782 0 0
cable wire storage supporting
facilities
0
0
12 0
$$ $ $ $
Page 29 of 51Generated on: 1/29/2013 3:13:40PM

DIVISION OF ADMINISTRATIONUTILITIES & ENERGY MANAGEMENT
Energy Cost, Consumption and Energy Use/Cost Index (EUI/ECI) by Building for the previous 12 months ending November 28,
2012
# Electricity
(kwH)
CHW
(mmBtu)
HHW
(mmBtu)
Total CostEUI
(mBtu/GSF)
ECI
(Cost/GSF)
Natural Gas
(mmBtu)
GSFClassificationBuilding
4004 2,388 65,789 0 0
4,715 4,715 0 0
beef cattle center
equip storag
special use
facilities
0
0
94 2
$$ $ $ $
1171 2,325 8,373 0 0
757 757 0 0
radioactive waste
building
supporting
facilities
0
0
12 0
$$ $ $ $
0307 2,310 34,007 0 0
3,074 3,074 0 0
esti drill tower under
investigation
0
0
50 1
$$ $ $ $
5200 2,304 0 0 0
117 117 0 0
metal building special use
facilities
0
0
0 0
$$ $ $ $
1063 2,300 8,283 0 0
1,506 749 0 0
greenhouse-cotton
taxonomy
special use
facilities
131
757
69 1
$$ $ $ $
0973 2,277 20,165 0 0
1,829 1,829 0 0
cmp-animal housing
unit
special use
facilities
0
0
30 1
$$ $ $ $
0974 2,277 46,715 0 0
4,244 4,244 0 0
cmp-animal housing
unit
special use
facilities
0
0
70 2
$$ $ $ $
0975 2,277 46,715 0 0
4,244 4,244 0 0
cmp-animal housing
unit
special use
facilities
0
0
70 2
$$ $ $ $
0976 2,277 20,165 0 0
1,829 1,829 0 0
cmp-animal housing
unit
special use
facilities
0
0
30 1
$$ $ $ $
0040 2,275 84,840 0 0
7,143 7,143 0 0
field lab and office
bldg
office 0
0
127 3
$$ $ $ $
1129 2,270 2,889 0 0
303 303 0 0
floriculture
greenhouse
supporting
facilities
0
0
4 0
$$ $ $ $
1206 2,250 34,745 0 0
4,056 3,144 0 0
poultry sci equipment
storage
supporting
facilities
164
911
126 2
$$ $ $ $
8532 2,240 42,078 0 0
4,317 3,805 0 0
fire station supporting
facilities
83
512
101 2
$$ $ $ $
1196 2,211 3,547 283 230
7,507 321 3,616 3,570
animal housing unit special use
facilities
0
0
237 3
$$ $ $ $
7801 2,200 590 0 0
91 91 0 0
teex - ps&s prop
house #1
special use
facilities
0
0
1 0
$$ $ $ $
7802 2,200 530 0 0
85 85 0 0
teex - ps&s prop
house #2
special use
facilities
0
0
1 0
$$ $ $ $
7904 2,194 18,347 0 0
1,658 1,658 0 0
esti haz mat
classroom
classroom 0
0
29 1
$$ $ $ $
1087 2,168 10,368 0 0
937 937 0 0
cmp-quarantine unit special use
facilities
0
0
16 0
$$ $ $ $
Page 30 of 51Generated on: 1/29/2013 3:13:40PM

DIVISION OF ADMINISTRATIONUTILITIES & ENERGY MANAGEMENT
Energy Cost, Consumption and Energy Use/Cost Index (EUI/ECI) by Building for the previous 12 months ending November 28,
2012
# Electricity
(kwH)
CHW
(mmBtu)
HHW
(mmBtu)
Total CostEUI
(mBtu/GSF)
ECI
(Cost/GSF)
Natural Gas
(mmBtu)
GSFClassificationBuilding
0997 2,125 22,480 0 0
2,029 2,029 0 0
tick research facility laboratory 0
0
36 1
$$ $ $ $
1236 2,100 7,563 0 0
684 684 0 0
small horse barn special use
facilities
0
0
12 0
$$ $ $ $
0963 2,042 27,587 0 0
4,664 2,494 0 0
hort & plant sci
greenhouse
special use
facilities
387
2,169
236 2
$$ $ $ $
0962 2,042 27,587 0 0
4,664 2,494 0 0
plant science grain
sorghum greenhouse
special use
facilities
387
2,170
236 2
$$ $ $ $
7030 2,039 825 0 0
538 88 0 0
tti erosion and
sediment control
laboratory 73
450
37 0
$$ $ $ $
0961 2,023 5,415 0 0
2,638 489 0 0
cotton greenhouse special use
facilities
384
2,149
199 1
$$ $ $ $
1079 2,020 7,275 0 0
1,182 658 0 0
scsc-weed sci
greenhouse
special use
facilities
89
524
56 1
$$ $ $ $
0754 2,012 24,197 0 0
2,544 2,189 0 0
easterwood shops supporting
facilities
48
355
65 1
$$ $ $ $
0354 2,001 38,460 0 0
3,479 3,479 0 0
esti hazardous matrl
classroom
classroom 0
0
66 2
$$ $ $ $
6242 2,000 37,569 0 0
3,397 3,397 0 0
aquaculture lab supporting
facilities
0
0
64 2
$$ $ $ $
1415 2,000 19,809 248 121
6,843 1,793 3,173 1,877
civilian lounge - a3 supporting
facilities
0
0
218 3
$$ $ $ $
1430 2,000 20,977 168 69
5,109 1,898 2,144 1,066
civilian lounge - c1 public
circulation
0
0
154 3
$$ $ $ $
8488 2,000 5,830 0 0
805 536 0 0
nautical archaeology supporting
facilities
34
270
27 0
$$ $ $ $
1202 2,000 30,884 0 0
3,605 2,795 0 0
poultry sci handling &
judging
laboratory 146
810
126 2
$$ $ $ $
2135 2,000 13,132 0 0
1,625 1,186 0 0
tvmc-wildlife & exotic
animals
public
circulation
53
439
49 1
$$ $ $ $
0498 74,772 10,639 698 629
19,555 979 9,164 9,413
central utility plant mechanical
room
0
0
18 0
$$ $ $ $
0498 71,164 104,048 10,625 6,804
250,936 9,395 135,588 105,953
central utility plant mechanical
room
0
0
250 4
$$ $ $ $
1498 33,660 1,750,228 4,306 1,581
237,526 157,981 55,051 24,495
satellite utility plant
no. 1
mechanical
room
0
0
352 7
$$ $ $ $
Page 31 of 51Generated on: 1/29/2013 3:13:40PM

DIVISION OF ADMINISTRATIONUTILITIES & ENERGY MANAGEMENT
Energy Cost, Consumption and Energy Use/Cost Index (EUI/ECI) by Building for the previous 12 months ending November 28,
2012
# Electricity
(kwH)
CHW
(mmBtu)
HHW
(mmBtu)
Total CostEUI
(mBtu/GSF)
ECI
(Cost/GSF)
Natural Gas
(mmBtu)
GSFClassificationBuilding
1499 29,701 47,651 3,800 1,395
74,499 4,310 48,576 21,614
satellite utility plant
no. 2
mechanical
room
0
0
180 3
$$ $ $ $
0377 12,338 19,795 1,957 1,283
46,732 1,790 25,019 19,922
satellite utility plant
no. 3
mechanical
room
0
0
268 4
$$ $ $ $
5499 3,920 73,636 0 0
6,659 6,659 0 0
animal shelter mechanical
room
0
0
64 2
$$ $ $ $
1084 3,880 2,208 0 0
203 203 0 0
west campus
switching station
mechanical
room
0
0
2 0
$$ $ $ $
1698 2,235 8,049 0 0
728 728 0 0
research park
switching station
mechanical
room
0
0
12 0
$$ $ $ $
0816 2,226 1,382,010 0 0
125,066 125,066 0 0
water distribution
pump station no. 1
mechanical
room
0
0
2,118 56
$$ $ $ $
Page 32 of 51Generated on: 1/29/2013 3:13:40PM

DIVISION OF ADMINISTRATIONUTILITIES & ENERGY MANAGEMENT
Energy Cost, Consumption and Energy Use/Cost Index (EUI/ECI) by Building for the previous 12 months ending November 28,
2012
# Electricity
(kwH)
CHW
(mmBtu)
HHW
(mmBtu)
Total CostEUI
(mBtu/GSF)
ECI
(Cost/GSF)
Natural Gas
(mmBtu)
GSFClassificationBuilding
Buildings < 2,000 gsf
1412 1,970 21,755 186 87
5,697 1,969 2,386 1,342
civilian lounge - a2 public
circulation
0
0
176 3
$$ $ $ $
0964 1,968 26,587 0 0
4,495 2,404 0 0
agronomy greenhouse special use
facilities
373
2,091
236 2
$$ $ $ $
1011 1,968 2,255 0 0
1,189 205 0 0
horticulture shop and
garage
special use
facilities
100
985
55 1
$$ $ $ $
4001 1,950 5,284 0 0
435 435 0 0
white (g.r.) conference
ctr
office 0
0
9 0
$$ $ $ $
1047 1,932 64,941 0 0
6,266 5,873 0 0
virus-vector research
lab
laboratory 27
394
129 3
$$ $ $ $
1555 1,924 57,606 0 0
5,208 5,208 0 0
track & field support
center
public
circulation
0
0
102 3
$$ $ $ $
0308 1,907 28,074 0 0
2,538 2,538 0 0
esti breathing
apparatus maze
laboratory 0
0
50 1
$$ $ $ $
1075 1,903 6,854 0 0
620 620 0 0
ecology & natural
resources teaching
special use
facilities
0
0
12 0
$$ $ $ $
0940 1,868 62,790 0 0
5,868 5,678 0 0
photosensitivization
lab
special use
facilities
5
190
117 3
$$ $ $ $
0547 1,846 6,648 0 0
601 601 0 0
break room at central
utility plant
public
circulation
0
0
12 0
$$ $ $ $
0978 1,834 6,605 0 0
597 597 0 0
cmp-quarantine unit special use
facilities
0
0
12 0
$$ $ $ $
4016 1,826 50,306 0 0
3,605 3,605 0 0
farrowing/nursery special use
facilities
0
0
94 2
$$ $ $ $
1759 1,826 45,675 0 0
3,580 3,580 0 0
reproductive sciences
bldg. j
supporting
facilities
0
0
85 2
$$ $ $ $
1269 1,819 171,920 0 0
15,580 15,580 0 0
low speed wind tunnel
shop
laboratory 0
0
322 9
$$ $ $ $
1086 1,817 37,278 0 0
3,387 3,387 0 0
cmp-housing unit special use
facilities
0
0
70 2
$$ $ $ $
1296 1,800 2,360 0 0
213 213 0 0
easterwood
maintenance support
special use
facilities
0
0
4 0
$$ $ $ $
8900 1,800 117,375 0 0
10,623 10,623 0 0
grove temporary
building
supporting
facilities
0
0
222 6
$$ $ $ $
1268 1,791 6,450 0 0
583 583 0 0
wind tunnel storage
building
laboratory 0
0
12 0
$$ $ $ $
Page 33 of 51Generated on: 1/29/2013 3:13:40PM

DIVISION OF ADMINISTRATIONUTILITIES & ENERGY MANAGEMENT
Energy Cost, Consumption and Energy Use/Cost Index (EUI/ECI) by Building for the previous 12 months ending November 28,
2012
# Electricity
(kwH)
CHW
(mmBtu)
HHW
(mmBtu)
Total CostEUI
(mBtu/GSF)
ECI
(Cost/GSF)
Natural Gas
(mmBtu)
GSFClassificationBuilding
8541 1,705 32,028 0 0
3,273 2,896 0 0
paint booth supporting
facilities
61
377
100 2
$$ $ $ $
0372 1,700 2,137 0 0
195 195 0 0
hensel park picnic
shelter #2
under
investigation
0
0
4 0
$$ $ $ $
7184 1,680 152,280 0 0
13,777 13,777 0 0
fats & oils processing
bldg
laboratory 0
0
309 8
$$ $ $ $
0687 1,627 35,890 0 0
3,246 3,246 0 0
esti industrial
classroom
classroom 0
0
75 2
$$ $ $ $
0276 1,595 5,744 0 0
520 520 0 0
tx forest service
greenhouse
laboratory 0
0
12 0
$$ $ $ $
7181 1,536 1,738 0 0
159 159 0 0
solvent extraction
building
laboratory 0
0
4 0
$$ $ $ $
7901 1,521 28,571 0 0
2,921 2,585 0 0
teex - itsi supporting
facilities
54
336
100 2
$$ $ $ $
6882 1,520 3,822 0 0
352 352 0 0
rest rooms public
circulation
0
0
9 0
$$ $ $ $
1000 1,518 4,997 0 0
460 460 0 0
farm service office under
investigation
0
0
11 0
$$ $ $ $
6775 1,516 13,437 0 0
1,553 1,216 0 0
sae bldg. supporting
facilities
54
337
66 1
$$ $ $ $
0959 1,515 4,055 0 0
1,975 366 0 0
plant science
greenhouse
special use
facilities
287
1,610
199 1
$$ $ $ $
1572 1,503 9,264 0 0
842 842 0 0
soccer/intramural
restroom
0 0
0
21 1
$$ $ $ $
0987 1,500 5,402 0 0
489 489 0 0
tvmc-pole building special use
facilities
0
0
12 0
$$ $ $ $
0116 1,500 5,402 0 0
489 489 0 0
tvmc-wildlife & exotic
animals
laboratory 0
0
12 0
$$ $ $ $
1348 1,500 18,079 0 0
1,633 1,633 0 0
usar disaster city
classroom
laboratory 0
0
41 1
$$ $ $ $
1349 1,500 22,527 0 0
2,036 2,036 0 0
usar disaster city
office
office 0
0
51 1
$$ $ $ $
1113 1,475 64 0 0
6 6 0 0
college avenue
apartments
residence 0
0
0 0
$$ $ $ $
0798 1,470 2,647 0 0
239 239 0 0
horticulture implement
shed - b
special use
facilities
0
0
6 0
$$ $ $ $
Page 34 of 51Generated on: 1/29/2013 3:13:40PM

DIVISION OF ADMINISTRATIONUTILITIES & ENERGY MANAGEMENT
Energy Cost, Consumption and Energy Use/Cost Index (EUI/ECI) by Building for the previous 12 months ending November 28,
2012
# Electricity
(kwH)
CHW
(mmBtu)
HHW
(mmBtu)
Total CostEUI
(mBtu/GSF)
ECI
(Cost/GSF)
Natural Gas
(mmBtu)
GSFClassificationBuilding
1284 1,448 21,317 0 0
1,927 1,927 0 0
esti breathing
apparatus repair
supporting
facilities
0
0
50 1
$$ $ $ $
1368 1,440 15,684 0 0
1,418 1,418 0 0
esti annual
school/vendor store
office 0
0
37 1
$$ $ $ $
1358 1,440 23,154 0 0
2,094 2,094 0 0
esti business office office 0
0
55 1
$$ $ $ $
1386 1,440 23,154 0 0
2,094 2,094 0 0
esti curriculum office office 0
0
55 1
$$ $ $ $
1364 1,440 1,325 0 0
130 130 0 0
esti dod office/ems
classroom
office 0
0
3 0
$$ $ $ $
1365 1,440 1,325 0 0
130 130 0 0
esti ems classroom classroom 0
0
3 0
$$ $ $ $
1367 1,440 1,325 0 0
130 130 0 0
esti ems office office 0
0
3 0
$$ $ $ $
1359 1,440 1,325 0 0
130 130 0 0
esti hazardous
materials classroom
classroom 0
0
3 0
$$ $ $ $
1366 1,440 15,684 0 0
1,418 1,418 0 0
esti industrial
classroom a&b
classroom 0
0
37 1
$$ $ $ $
1353 1,440 15,684 0 0
1,418 1,418 0 0
esti industrial
classrooms a&b
classroom 0
0
37 1
$$ $ $ $
1355 1,440 31,765 0 0
2,873 2,873 0 0
esti industrial
classrooms a&b
classroom 0
0
75 2
$$ $ $ $
1357 1,440 31,765 0 0
2,873 2,873 0 0
esti industrial
classrooms a&b
classroom 0
0
75 2
$$ $ $ $
1354 1,440 31,765 0 0
2,873 2,873 0 0
esti industrial office office 0
0
75 2
$$ $ $ $
1356 1,440 31,765 0 0
2,873 2,873 0 0
esti industrial office office 0
0
75 2
$$ $ $ $
1387 1,440 23,154 0 0
2,094 2,094 0 0
esti
leadership/certificatio
office 0
0
55 1
$$ $ $ $
1360 1,440 21,297 0 0
1,926 1,926 0 0
esti
marine/marketing/ehs
office 0
0
50 1
$$ $ $ $
1361 1,440 27,471 0 0
2,484 2,484 0 0
esti rescue
office/classroom
office 0
0
65 2
$$ $ $ $
1450 1,428 63,208 0 0
5,722 5,722 0 0
laundry @ the
gardens
residence 0
0
151 4
$$ $ $ $
Page 35 of 51Generated on: 1/29/2013 3:13:40PM

DIVISION OF ADMINISTRATIONUTILITIES & ENERGY MANAGEMENT
Energy Cost, Consumption and Energy Use/Cost Index (EUI/ECI) by Building for the previous 12 months ending November 28,
2012
# Electricity
(kwH)
CHW
(mmBtu)
HHW
(mmBtu)
Total CostEUI
(mBtu/GSF)
ECI
(Cost/GSF)
Natural Gas
(mmBtu)
GSFClassificationBuilding
0824 1,400 3,607 0 0
326 326 0 0
grounds maintenance
implement shed
supporting
facilities
0
0
9 0
$$ $ $ $
1044 1,392 2,232,000 0 0
201,849 201,849 0 0
tvmc-poultry research special use
facilities
0
0
5,471 145
$$ $ $ $
1753 1,375 34,394 0 0
2,696 2,696 0 0
reproductive sciences
bldg. d
supporting
facilities
0
0
85 2
$$ $ $ $
1754 1,375 34,394 0 0
2,696 2,696 0 0
reproductive sciences
bldg. e
supporting
facilities
0
0
85 2
$$ $ $ $
8685 1,365 53,020 0 0
4,795 4,795 0 0
teex - ps&s firing
range classroom
classroom 0
0
133 4
$$ $ $ $
0277 1,363 4,909 0 0
444 444 0 0
tx forest service
greenhouse
laboratory 0
0
12 0
$$ $ $ $
0278 1,363 4,909 0 0
444 444 0 0
tx forest service
greenhouse
laboratory 0
0
12 0
$$ $ $ $
8175 1,360 25,547 0 0
2,312 2,312 0 0
teex warehouse supporting
facilities
0
0
64 2
$$ $ $ $
4542 1,335 44,874 0 0
4,058 4,058 0 0
tvmc-wildlife & exotic
animals
office 0
0
115 3
$$ $ $ $
1388 1,327 21,200 0 0
1,915 1,915 0 0
teex emergency
services lab
0 0
0
55 1
$$ $ $ $
0729 1,300 1,655 0 0
198 198 0 0
biology greenhouse special use
facilities
0
0
4 0
$$ $ $ $
0139 1,280 18,201 0 0
1,645 1,645 0 0
esti private sector
office
office 0
0
49 1
$$ $ $ $
1198 1,280 9,741 203 0
3,476 880 2,596 0
larr support personnel
bldg
special use
facilities
0
0
185 3
$$ $ $ $
0320 1,271 21,846 0 0
1,973 1,973 0 0
esti sprinkler systems under
investigation
0
0
59 2
$$ $ $ $
0315 1,266 13,789 0 0
1,246 1,246 0 0
esti pump
maintenance building
supporting
facilities
0
0
37 1
$$ $ $ $
3098 1,264 23,451 0 0
2,568 2,568 0 0
business
management services
special use
facilities
0
0
63 2
$$ $ $ $
7183 1,260 23,669 0 0
2,142 2,142 0 0
refinery laboratory 0
0
64 2
$$ $ $ $
1150 1,253 102,359 0 0
9,414 9,414 0 0
parsons mounted cav.
tack room
supporting
facilities
0
0
279 8
$$ $ $ $
Page 36 of 51Generated on: 1/29/2013 3:13:40PM
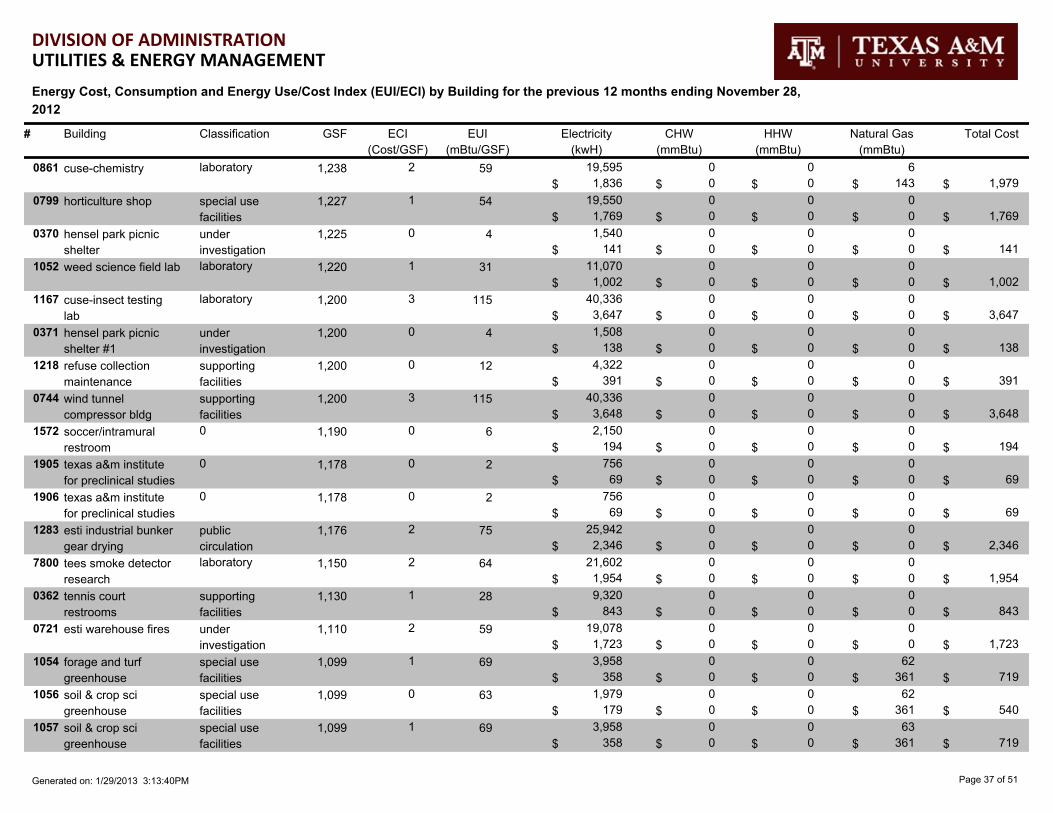
DIVISION OF ADMINISTRATIONUTILITIES & ENERGY MANAGEMENT
Energy Cost, Consumption and Energy Use/Cost Index (EUI/ECI) by Building for the previous 12 months ending November 28,
2012
# Electricity
(kwH)
CHW
(mmBtu)
HHW
(mmBtu)
Total CostEUI
(mBtu/GSF)
ECI
(Cost/GSF)
Natural Gas
(mmBtu)
GSFClassificationBuilding
0861 1,238 19,595 0 0
1,979 1,836 0 0
cuse-chemistry laboratory 6
143
59 2
$$ $ $ $
0799 1,227 19,550 0 0
1,769 1,769 0 0
horticulture shop special use
facilities
0
0
54 1
$$ $ $ $
0370 1,225 1,540 0 0
141 141 0 0
hensel park picnic
shelter
under
investigation
0
0
4 0
$$ $ $ $
1052 1,220 11,070 0 0
1,002 1,002 0 0
weed science field lab laboratory 0
0
31 1
$$ $ $ $
1167 1,200 40,336 0 0
3,647 3,647 0 0
cuse-insect testing
lab
laboratory 0
0
115 3
$$ $ $ $
0371 1,200 1,508 0 0
138 138 0 0
hensel park picnic
shelter #1
under
investigation
0
0
4 0
$$ $ $ $
1218 1,200 4,322 0 0
391 391 0 0
refuse collection
maintenance
supporting
facilities
0
0
12 0
$$ $ $ $
0744 1,200 40,336 0 0
3,648 3,648 0 0
wind tunnel
compressor bldg
supporting
facilities
0
0
115 3
$$ $ $ $
1572 1,190 2,150 0 0
194 194 0 0
soccer/intramural
restroom
0 0
0
6 0
$$ $ $ $
1905 1,178 756 0 0
69 69 0 0
texas a&m institute
for preclinical studies
0 0
0
2 0
$$ $ $ $
1906 1,178 756 0 0
69 69 0 0
texas a&m institute
for preclinical studies
0 0
0
2 0
$$ $ $ $
1283 1,176 25,942 0 0
2,346 2,346 0 0
esti industrial bunker
gear drying
public
circulation
0
0
75 2
$$ $ $ $
7800 1,150 21,602 0 0
1,954 1,954 0 0
tees smoke detector
research
laboratory 0
0
64 2
$$ $ $ $
0362 1,130 9,320 0 0
843 843 0 0
tennis court
restrooms
supporting
facilities
0
0
28 1
$$ $ $ $
0721 1,110 19,078 0 0
1,723 1,723 0 0
esti warehouse fires under
investigation
0
0
59 2
$$ $ $ $
1054 1,099 3,958 0 0
719 358 0 0
forage and turf
greenhouse
special use
facilities
62
361
69 1
$$ $ $ $
1056 1,099 1,979 0 0
540 179 0 0
soil & crop sci
greenhouse
special use
facilities
62
361
63 0
$$ $ $ $
1057 1,099 3,958 0 0
719 358 0 0
soil & crop sci
greenhouse
special use
facilities
63
361
69 1
$$ $ $ $
Page 37 of 51Generated on: 1/29/2013 3:13:40PM

DIVISION OF ADMINISTRATIONUTILITIES & ENERGY MANAGEMENT
Energy Cost, Consumption and Energy Use/Cost Index (EUI/ECI) by Building for the previous 12 months ending November 28,
2012
# Electricity
(kwH)
CHW
(mmBtu)
HHW
(mmBtu)
Total CostEUI
(mBtu/GSF)
ECI
(Cost/GSF)
Natural Gas
(mmBtu)
GSFClassificationBuilding
1058 1,099 4,294 0 0
749 388 0 0
soil & crop sci
greenhouse
special use
facilities
62
361
70 1
$$ $ $ $
1059 1,099 8,673 0 0
1,143 782 0 0
soil & crop sci
greenhouse
special use
facilities
62
361
84 1
$$ $ $ $
8508 1,080 22,030 0 0
2,297 1,991 0 0
warehouse supporting
facilities
49
306
115 2
$$ $ $ $
0724 1,060 15,605 0 0
1,411 1,411 0 0
esti breathing
apparatus
laboratory 0
0
50 1
$$ $ $ $
0314 1,010 14,869 0 0
1,344 1,344 0 0
esti breathing
apparatus storage
laboratory 0
0
50 1
$$ $ $ $
6071 1,000 80 0 0
67 67 0 0
itsi storage supporting
facilities
0
0
0 0
$$ $ $ $
0967 1,000 3,602 0 0
326 326 0 0
purchasing & stores -
volatile storage
supporting
facilities
0
0
12 0
$$ $ $ $
7500 1,000 1,510 0 0
426 187 0 0
tti pendulum test
facility
supporting
facilities
39
239
44 0
$$ $ $ $
0106 978 3,522 0 0
319 319 0 0
trailer house @ tereco laboratory 0
0
12 0
$$ $ $ $
0107 978 3,522 0 0
319 319 0 0
trailer house @ tereco laboratory 0
0
12 0
$$ $ $ $
7907 960 8,028 0 0
725 725 0 0
esti haz mat
technician shop
supporting
facilities
0
0
29 1
$$ $ $ $
6069 950 17,845 0 0
1,614 1,614 0 0
research support bldg supporting
facilities
0
0
64 2
$$ $ $ $
0977 925 8,192 0 0
3,230 743 0 0
cmp-animal housing
unit
laboratory 393
2,487
455 3
$$ $ $ $
1195 900 30,252 0 0
2,984 2,736 0 0
non surgical animal
procedure
laboratory 39
248
158 3
$$ $ $ $
1185 900 14,022 0 0
1,715 1,715 0 0
parsons cav caretaker
facility
public
circulation
0
0
53 2
$$ $ $ $
0345 820 12,072 0 0
1,091 1,091 0 0
esti breathing
apparatus storage
supporting
facilities
0
0
50 1
$$ $ $ $
7098 812 0 0 0
65 65 0 0
warehouse supporting
facilities
0
0
0 0
$$ $ $ $
0149 800 17,640 0 0
1,594 1,594 0 0
esti haz mat office office 0
0
75 2
$$ $ $ $
Page 38 of 51Generated on: 1/29/2013 3:13:40PM

DIVISION OF ADMINISTRATIONUTILITIES & ENERGY MANAGEMENT
Energy Cost, Consumption and Energy Use/Cost Index (EUI/ECI) by Building for the previous 12 months ending November 28,
2012
# Electricity
(kwH)
CHW
(mmBtu)
HHW
(mmBtu)
Total CostEUI
(mBtu/GSF)
ECI
(Cost/GSF)
Natural Gas
(mmBtu)
GSFClassificationBuilding
0145 800 7,579 0 0
685 685 0 0
esti technical
equipment storage
public
circulation
0
0
32 1
$$ $ $ $
1755 790 19,761 0 0
1,550 1,550 0 0
reproductive sciences
bldg. f
supporting
facilities
0
0
85 2
$$ $ $ $
1168 780 2,809 0 0
254 254 0 0
cuse-shop & storage supporting
facilities
0
0
12 0
$$ $ $ $
0324 777 449,476 0 0
40,676 40,676 0 0
esti wood storage under
investigation
0
0
1,974 52
$$ $ $ $
1490 746 2,687 0 0
243 243 0 0
cabin at challenge
course
special use
facilities
0
0
12 0
$$ $ $ $
0148 720 11,169 0 0
1,010 1,010 0 0
esti haz mat
classroom
classroom 0
0
53 1
$$ $ $ $
1096 720 24,202 0 0
2,189 2,189 0 0
gamma radiation lab laboratory 0
0
115 3
$$ $ $ $
8531 670 12,586 0 0
1,138 1,138 0 0
wash rack supporting
facilities
0
0
64 2
$$ $ $ $
1166 651 21,882 0 0
1,979 1,979 0 0
cuse-special project
lab & storage
laboratory 0
0
115 3
$$ $ $ $
1350 640 21,370 0 0
1,929 1,929 0 0
esti bathroom
(hazardous materials
public
circulation
0
0
114 3
$$ $ $ $
0718 617 2,222 0 0
201 201 0 0
storage--cyclotron laboratory 0
0
12 0
$$ $ $ $
0797 609 1,097 0 0
99 99 0 0
horticulture implement
shed - a
special use
facilities
0
0
6 0
$$ $ $ $
1000 600 21,330 0 0
1,926 1,926 0 0
farm service office under
investigation
0
0
121 3
$$ $ $ $
0357 579 2,085 0 0
189 189 0 0
vending machine
booth
public
circulation
0
0
12 0
$$ $ $ $
8601 576 887 0 0
85 85 0 0
teex - ps&s uxo
search grid pavilion
supporting
facilities
0
0
5 0
$$ $ $ $
0389 560 2,017 0 0
182 182 0 0
grounds maintenance
potting shed
supporting
facilities
0
0
12 0
$$ $ $ $
1573 550 1,981 0 0
226 226 0 0
equestrian tack room supporting
facilities
0
0
12 0
$$ $ $ $
1220 540 1,945 0 0
176 176 0 0
tvmc-animal isolation
bld #1
special use
facilities
0
0
12 0
$$ $ $ $
Page 39 of 51Generated on: 1/29/2013 3:13:40PM

DIVISION OF ADMINISTRATIONUTILITIES & ENERGY MANAGEMENT
Energy Cost, Consumption and Energy Use/Cost Index (EUI/ECI) by Building for the previous 12 months ending November 28,
2012
# Electricity
(kwH)
CHW
(mmBtu)
HHW
(mmBtu)
Total CostEUI
(mBtu/GSF)
ECI
(Cost/GSF)
Natural Gas
(mmBtu)
GSFClassificationBuilding
1221 540 1,945 0 0
176 176 0 0
tvmc-animal isolation
bld #2
special use
facilities
0
0
12 0
$$ $ $ $
1222 540 1,945 0 0
176 176 0 0
tvmc-animal isolation
bld #3
special use
facilities
0
0
12 0
$$ $ $ $
1223 540 1,945 0 0
176 176 0 0
tvmc-animal isolation
bld #4
special use
facilities
0
0
12 0
$$ $ $ $
1224 540 1,945 0 0
176 176 0 0
tvmc-animal isolation
bld #5
special use
facilities
0
0
12 0
$$ $ $ $
1225 540 1,945 0 0
176 176 0 0
tvmc-animal isolation
bld #6
special use
facilities
0
0
12 0
$$ $ $ $
1226 540 1,945 0 0
176 176 0 0
tvmc-animal isolation
bld #7
special use
facilities
0
0
12 0
$$ $ $ $
1227 540 1,945 0 0
176 176 0 0
tvmc-animal isolation
bld #8
special use
facilities
0
0
12 0
$$ $ $ $
1228 540 1,945 0 0
176 176 0 0
tvmc-animal isolation
bld #9
special use
facilities
0
0
12 0
$$ $ $ $
7905 533 4,457 0 0
403 403 0 0
esti haz mat
warehouse
public
circulation
0
0
29 1
$$ $ $ $
8032 520 388 0 0
35 35 0 0
ocean drilling test
facility
laboratory 0
0
3 0
$$ $ $ $
0382 516 2,096 0 0
189 189 0 0
floriculture building c laboratory 0
0
14 0
$$ $ $ $
0525 515 1,780 0 0
161 161 0 0
volatile storage
building
supporting
facilities
0
0
12 0
$$ $ $ $
0677 514 52,218 0 0
4,707 4,707 0 0
golf course halfway
house
public
circulation
0
0
347 9
$$ $ $ $
1154 500 1,801 0 0
163 163 0 0
electrical distribution
storage
supporting
facilities
0
0
12 0
$$ $ $ $
1188 500 1,005 0 0
91 91 0 0
forest science storage supporting
facilities
0
0
7 0
$$ $ $ $
1352 480 10,588 0 0
958 958 0 0
esti bathroom
(industrial area)
public
circulation
0
0
75 2
$$ $ $ $
1351 480 7,099 0 0
642 642 0 0
esti bathroom (marine
area)
public
circulation
0
0
50 1
$$ $ $ $
1280 480 5,621 0 0
507 507 0 0
esti bathroom
(parker's privy)
public
circulation
0
0
40 1
$$ $ $ $
Page 40 of 51Generated on: 1/29/2013 3:13:40PM
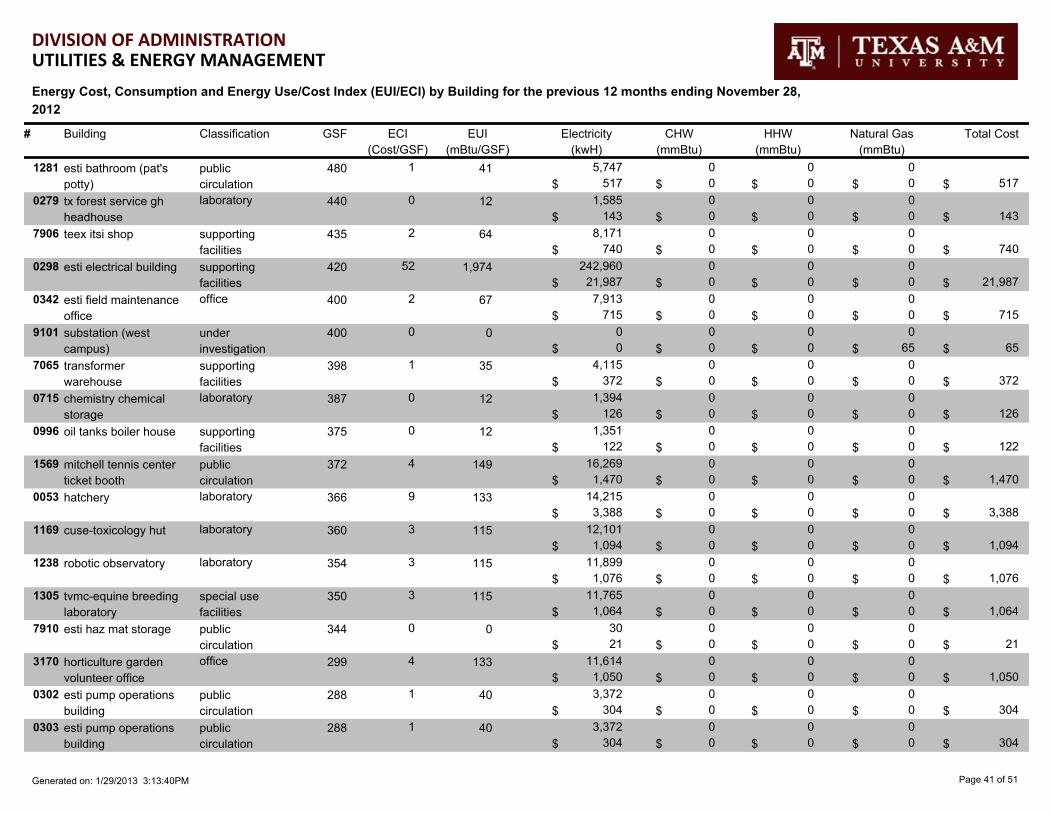
DIVISION OF ADMINISTRATIONUTILITIES & ENERGY MANAGEMENT
Energy Cost, Consumption and Energy Use/Cost Index (EUI/ECI) by Building for the previous 12 months ending November 28,
2012
# Electricity
(kwH)
CHW
(mmBtu)
HHW
(mmBtu)
Total CostEUI
(mBtu/GSF)
ECI
(Cost/GSF)
Natural Gas
(mmBtu)
GSFClassificationBuilding
1281 480 5,747 0 0
517 517 0 0
esti bathroom (pat's
potty)
public
circulation
0
0
41 1
$$ $ $ $
0279 440 1,585 0 0
143 143 0 0
tx forest service gh
headhouse
laboratory 0
0
12 0
$$ $ $ $
7906 435 8,171 0 0
740 740 0 0
teex itsi shop supporting
facilities
0
0
64 2
$$ $ $ $
0298 420 242,960 0 0
21,987 21,987 0 0
esti electrical building supporting
facilities
0
0
1,974 52
$$ $ $ $
0342 400 7,913 0 0
715 715 0 0
esti field maintenance
office
office 0
0
67 2
$$ $ $ $
9101 400 0 0 0
65 0 0 0
substation (west
campus)
under
investigation
0
65
0 0
$$ $ $ $
7065 398 4,115 0 0
372 372 0 0
transformer
warehouse
supporting
facilities
0
0
35 1
$$ $ $ $
0715 387 1,394 0 0
126 126 0 0
chemistry chemical
storage
laboratory 0
0
12 0
$$ $ $ $
0996 375 1,351 0 0
122 122 0 0
oil tanks boiler house supporting
facilities
0
0
12 0
$$ $ $ $
1569 372 16,269 0 0
1,470 1,470 0 0
mitchell tennis center
ticket booth
public
circulation
0
0
149 4
$$ $ $ $
0053 366 14,215 0 0
3,388 3,388 0 0
hatchery laboratory 0
0
133 9
$$ $ $ $
1169 360 12,101 0 0
1,094 1,094 0 0
cuse-toxicology hut laboratory 0
0
115 3
$$ $ $ $
1238 354 11,899 0 0
1,076 1,076 0 0
robotic observatory laboratory 0
0
115 3
$$ $ $ $
1305 350 11,765 0 0
1,064 1,064 0 0
tvmc-equine breeding
laboratory
special use
facilities
0
0
115 3
$$ $ $ $
7910 344 30 0 0
21 21 0 0
esti haz mat storage public
circulation
0
0
0 0
$$ $ $ $
3170 299 11,614 0 0
1,050 1,050 0 0
horticulture garden
volunteer office
office 0
0
133 4
$$ $ $ $
0302 288 3,372 0 0
304 304 0 0
esti pump operations
building
public
circulation
0
0
40 1
$$ $ $ $
0303 288 3,372 0 0
304 304 0 0
esti pump operations
building
public
circulation
0
0
40 1
$$ $ $ $
Page 41 of 51Generated on: 1/29/2013 3:13:40PM

DIVISION OF ADMINISTRATIONUTILITIES & ENERGY MANAGEMENT
Energy Cost, Consumption and Energy Use/Cost Index (EUI/ECI) by Building for the previous 12 months ending November 28,
2012
# Electricity
(kwH)
CHW
(mmBtu)
HHW
(mmBtu)
Total CostEUI
(mBtu/GSF)
ECI
(Cost/GSF)
Natural Gas
(mmBtu)
GSFClassificationBuilding
0304 288 3,372 0 0
304 304 0 0
esti pump operations
building
public
circulation
0
0
40 1
$$ $ $ $
8906 288 4,809 0 0
434 434 0 0
transportation
services barricade
under
investigation
0
0
57 2
$$ $ $ $
8083 273 120 0 0
66 66 0 0
telecommunications
building
supporting
facilities
0
0
1 0
$$ $ $ $
0373 256 322 0 0
29 29 0 0
hensel park
restrooms
public
circulation
0
0
4 0
$$ $ $ $
1517 221 7,288 0 0
659 659 0 0
horticulture cabin supporting
facilities
0
0
113 3
$$ $ $ $
1265 215 8,544 0 0
773 773 0 0
parking toll
booth-easterwood
special use
facilities
0
0
136 4
$$ $ $ $
0299 213 123,215 0 0
11,150 11,150 0 0
esti control building supporting
facilities
0
0
1,974 52
$$ $ $ $
1562 210 87,535 0 0
7,915 7,915 0 0
wireless
telecommunications
supporting
facilities
0
0
1,422 38
$$ $ $ $
0983 202 727 0 0
66 66 0 0
trans center paint
storage
supporting
facilities
0
0
12 0
$$ $ $ $
0301 200 2,342 0 0
211 211 0 0
esti pump operations
building
public
circulation
0
0
40 1
$$ $ $ $
1158 180 5,736 0 0
519 519 0 0
equine gait analysis
bldg
special use
facilities
0
0
109 3
$$ $ $ $
6047 175 3,287 0 0
297 297 0 0
chemical supplies
storage
supporting
facilities
0
0
64 2
$$ $ $ $
0356 174 906 0 0
83 83 0 0
the zen box office 0
0
18 0
$$ $ $ $
6095 173 1,625 0 0
152 152 0 0
storage and research
lab
supporting
facilities
0
0
32 1
$$ $ $ $
1492 167 550 0 0
51 51 0 0
classroom at
challenge course
office 0
0
11 0
$$ $ $ $
6060 155 2,912 0 0
263 263 0 0
volatile storage supporting
facilities
0
0
64 2
$$ $ $ $
0381 152 1,756 0 0
159 159 0 0
floriculture building b laboratory 0
0
39 1
$$ $ $ $
7078 144 2,705 0 0
246 246 0 0
flight lab storage supporting
facilities
0
0
64 2
$$ $ $ $
Page 42 of 51Generated on: 1/29/2013 3:13:40PM

DIVISION OF ADMINISTRATIONUTILITIES & ENERGY MANAGEMENT
Energy Cost, Consumption and Energy Use/Cost Index (EUI/ECI) by Building for the previous 12 months ending November 28,
2012
# Electricity
(kwH)
CHW
(mmBtu)
HHW
(mmBtu)
Total CostEUI
(mBtu/GSF)
ECI
(Cost/GSF)
Natural Gas
(mmBtu)
GSFClassificationBuilding
0380 120 1,387 0 0
125 125 0 0
floriculture building a laboratory 0
0
39 1
$$ $ $ $
7002 120 2,254 0 0
209 209 0 0
storage building supporting
facilities
0
0
64 2
$$ $ $ $
0635 118 361 0 0
37 37 0 0
grounds maintenance
storage
supporting
facilities
0
0
10 0
$$ $ $ $
1514 114 4,442 0 0
402 402 0 0
parking toll booth at
pa72
office 0
0
133 4
$$ $ $ $
1172 100 360 0 0
43 43 0 0
flammable mat
storage
supporting
facilities
0
0
12 0
$$ $ $ $
7922 100 1,444 0 0
131 131 0 0
rest rooms public
circulation
0
0
49 1
$$ $ $ $
1557 100 2,994 0 0
271 271 0 0
track & field ctr ticket
booth
public
circulation
0
0
102 3
$$ $ $ $
7004 80 170 0 0
76 76 0 0
prefabwood frame
office bldg. - riverside
laboratory 0
0
7 1
$$ $ $ $
1552 77 21,000 0 0
1,899 1,899 0 0
olsen (e.d.) grove
picnic area
supporting
facilities
0
0
931 25
$$ $ $ $
1492 30 1,067 0 0
96 96 0 0
classroom at
challenge course
office 0
0
121 3
$$ $ $ $
1563 30 108 0 0
10 10 0 0
h&k equipment
storage building
under
investigation
0
0
12 0
$$ $ $ $
1597 30 108 0 0
10 10 0 0
iodp hazmat
containment
supporting
facilities
0
0
12 0
$$ $ $ $
1491 30 108 0 0
10 10 0 0
shed at challenge
course
supporting
facilities
0
0
12 0
$$ $ $ $
1298 30 108 0 0
10 10 0 0
turbo lab support bldg supporting
facilities
0
0
12 0
$$ $ $ $
4013 20 551 0 0
39 39 0 0
cattle feeding under
investigation
0
0
94 2
$$ $ $ $
4014 20 551 0 0
39 39 0 0
cattle processing under
investigation
0
0
94 2
$$ $ $ $
1699 20 72 0 0
7 7 0 0
gte optical remote
module (odm) facility
supporting
facilities
0
0
12 0
$$ $ $ $
4015 20 551 0 0
40 40 0 0
interdisciplinary barn under
investigation
0
0
94 2
$$ $ $ $
Page 43 of 51Generated on: 1/29/2013 3:13:40PM

DIVISION OF ADMINISTRATIONUTILITIES & ENERGY MANAGEMENT
Energy Cost, Consumption and Energy Use/Cost Index (EUI/ECI) by Building for the previous 12 months ending November 28,
2012
# Electricity
(kwH)
CHW
(mmBtu)
HHW
(mmBtu)
Total CostEUI
(mBtu/GSF)
ECI
(Cost/GSF)
Natural Gas
(mmBtu)
GSFClassificationBuilding
1233 20 72 0 0
7 7 0 0
large animal barn under
investigation
0
0
12 0
$$ $ $ $
4012 20 551 0 0
39 39 0 0
sheep feeding under
investigation
0
0
94 2
$$ $ $ $
10126 2 248,849 0 0
22,526 22,526 0 0
mckenzie terminal
transformer
other 0
0
424,536 11,263
$$ $ $ $
10196 2 194 0 0
70 70 0 0
portable bldg by 0954 other 0
0
331 35
$$ $ $ $
10053 2 71,803 0 0
6,614 6,614 0 0
reed arena parking lot
light
other 0
0
122,495 3,307
$$ $ $ $
10168 1 115,598 0 0
8,604 8,604 0 0
*13950 fm 60 east other 0
0
394,420 8,604
$$ $ $ $
10171 1 4,505 0 0
590 590 0 0
*14250 fm 60 east other 0
0
15,371 590
$$ $ $ $
10173 1 164 0 0
729 729 0 0
*14250 fm 60 east other 0
0
560 729
$$ $ $ $
10174 1 29,992 0 0
7,582 7,582 0 0
*14250 fm 60 east other 0
0
102,333 7,582
$$ $ $ $
10060 1 0 0 0
65 65 0 0
08508 warehouse other 0
0
0 65
$$ $ $ $
10164 1 5,747 0 0
5,172 5,172 0 0
101 harvey mitchell
pkwy*
other 0
0
19,609 5,172
$$ $ $ $
10165 1 2,012 0 0
371 371 0 0
1300 texas avenue other 0
0
6,865 371
$$ $ $ $
10167 1 0 0 0
65 65 0 0
1400 creek cir unit b other 0
0
0 65
$$ $ $ $
10222 1 106,837 0 0
9,672 9,672 0 0
3196 hensel pnl lb -
att
other 0
0
364,528 9,672
$$ $ $ $
10223 1 115,123 0 0
10,414 10,414 0 0
3196 hensel pnl lc-
verizon
other 0
0
392,800 10,414
$$ $ $ $
10166 1 224 0 0
135 135 0 0
90099 hwy 60 other 0
0
764 135
$$ $ $ $
10175 1 0 0 0
65 65 0 0
90287 fm 50 other 0
0
0 65
$$ $ $ $
10176 1 2,238 0 0
239 239 0 0
90324 fm 50 other 0
0
7,636 239
$$ $ $ $
Page 44 of 51Generated on: 1/29/2013 3:13:40PM
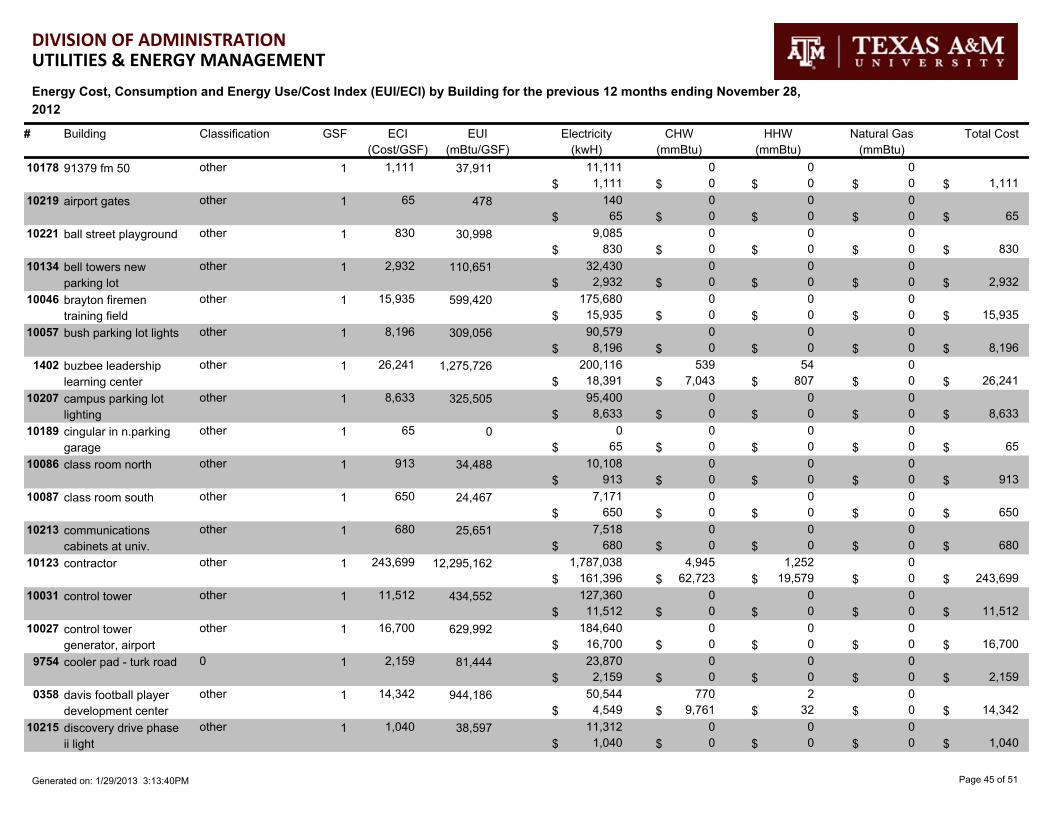
DIVISION OF ADMINISTRATIONUTILITIES & ENERGY MANAGEMENT
Energy Cost, Consumption and Energy Use/Cost Index (EUI/ECI) by Building for the previous 12 months ending November 28,
2012
# Electricity
(kwH)
CHW
(mmBtu)
HHW
(mmBtu)
Total CostEUI
(mBtu/GSF)
ECI
(Cost/GSF)
Natural Gas
(mmBtu)
GSFClassificationBuilding
10178 1 11,111 0 0
1,111 1,111 0 0
91379 fm 50 other 0
0
37,911 1,111
$$ $ $ $
10219 1 140 0 0
65 65 0 0
airport gates other 0
0
478 65
$$ $ $ $
10221 1 9,085 0 0
830 830 0 0
ball street playground other 0
0
30,998 830
$$ $ $ $
10134 1 32,430 0 0
2,932 2,932 0 0
bell towers new
parking lot
other 0
0
110,651 2,932
$$ $ $ $
10046 1 175,680 0 0
15,935 15,935 0 0
brayton firemen
training field
other 0
0
599,420 15,935
$$ $ $ $
10057 1 90,579 0 0
8,196 8,196 0 0
bush parking lot lights other 0
0
309,056 8,196
$$ $ $ $
1402 1 200,116 539 54
26,241 18,391 7,043 807
buzbee leadership
learning center
other 0
0
1,275,726 26,241
$$ $ $ $
10207 1 95,400 0 0
8,633 8,633 0 0
campus parking lot
lighting
other 0
0
325,505 8,633
$$ $ $ $
10189 1 0 0 0
65 65 0 0
cingular in n.parking
garage
other 0
0
0 65
$$ $ $ $
10086 1 10,108 0 0
913 913 0 0
class room north other 0
0
34,488 913
$$ $ $ $
10087 1 7,171 0 0
650 650 0 0
class room south other 0
0
24,467 650
$$ $ $ $
10213 1 7,518 0 0
680 680 0 0
communications
cabinets at univ.
other 0
0
25,651 680
$$ $ $ $
10123 1 1,787,038 4,945 1,252
243,699 161,396 62,723 19,579
contractor other 0
0
12,295,162 243,699
$$ $ $ $
10031 1 127,360 0 0
11,512 11,512 0 0
control tower other 0
0
434,552 11,512
$$ $ $ $
10027 1 184,640 0 0
16,700 16,700 0 0
control tower
generator, airport
other 0
0
629,992 16,700
$$ $ $ $
9754 1 23,870 0 0
2,159 2,159 0 0
cooler pad - turk road 0 0
0
81,444 2,159
$$ $ $ $
0358 1 50,544 770 2
14,342 4,549 9,761 32
davis football player
development center
other 0
0
944,186 14,342
$$ $ $ $
10215 1 11,312 0 0
1,040 1,040 0 0
discovery drive phase
ii light
other 0
0
38,597 1,040
$$ $ $ $
Page 45 of 51Generated on: 1/29/2013 3:13:40PM

DIVISION OF ADMINISTRATIONUTILITIES & ENERGY MANAGEMENT
Energy Cost, Consumption and Energy Use/Cost Index (EUI/ECI) by Building for the previous 12 months ending November 28,
2012
# Electricity
(kwH)
CHW
(mmBtu)
HHW
(mmBtu)
Total CostEUI
(mBtu/GSF)
ECI
(Cost/GSF)
Natural Gas
(mmBtu)
GSFClassificationBuilding
10206 1 119,760 0 0
10,834 10,834 0 0
easterwood high mast
lighting
other 0
0
408,621 10,834
$$ $ $ $
10217 1 280 0 0
65 65 0 0
ele car station (golf
course club house)
other 0
0
955 65
$$ $ $ $
1321 1 56,663 0 0
5,131 5,131 0 0
esti aerial cooler fires under
investigation
0
0
193,334 5,131
$$ $ $ $
1322 1 56,663 0 0
5,131 5,131 0 0
esti apartment
complex fires
under
investigation
0
0
193,334 5,131
$$ $ $ $
0328 1 56,663 0 0
5,131 5,131 0 0
esti api storage tank
fires
under
investigation
0
0
193,334 5,131
$$ $ $ $
0331 1 56,663 0 0
5,131 5,131 0 0
esti arff fires under
investigation
0
0
193,334 5,131
$$ $ $ $
0337 1 56,663 0 0
5,131 5,131 0 0
esti automobile fires under
investigation
0
0
193,334 5,131
$$ $ $ $
0338 1 56,663 0 0
5,131 5,131 0 0
esti bobtail/transport
fires
under
investigation
0
0
193,334 5,131
$$ $ $ $
0720 1 56,663 0 0
5,131 5,131 0 0
esti chemical
complex fires
under
investigation
0
0
193,334 5,131
$$ $ $ $
1323 1 56,663 0 0
5,131 5,131 0 0
esti commercial /
retail complex fires
under
investigation
0
0
193,334 5,131
$$ $ $ $
1324 1 56,663 0 0
5,131 5,131 0 0
esti commercial /
retail complex fires
under
investigation
0
0
193,334 5,131
$$ $ $ $
1337 1 15 0 0
33 33 0 0
esti drill towers
(steel/brick) shelter
under
investigation
0
0
50 33
$$ $ $ $
9786 1 20 0 0
13 13 0 0
esti fuel tank farm
(new)
0 0
0
67 13
$$ $ $ $
1327 1 0 0 0
11 11 0 0
esti hose evolutions under
investigation
0
0
0 11
$$ $ $ $
1328 1 0 0 0
11 11 0 0
esti hose loads under
investigation
0
0
0 11
$$ $ $ $
0352 1 0 0 0
11 11 0 0
esti ladder towers under
investigation
0
0
0 11
$$ $ $ $
0327 1 56,663 0 0
5,131 5,131 0 0
esti loading terminal
fires
under
investigation
0
0
193,334 5,131
$$ $ $ $
1326 1 56,663 0 0
5,131 5,131 0 0
esti lpg fires under
investigation
0
0
193,334 5,131
$$ $ $ $
Page 46 of 51Generated on: 1/29/2013 3:13:40PM

DIVISION OF ADMINISTRATIONUTILITIES & ENERGY MANAGEMENT
Energy Cost, Consumption and Energy Use/Cost Index (EUI/ECI) by Building for the previous 12 months ending November 28,
2012
# Electricity
(kwH)
CHW
(mmBtu)
HHW
(mmBtu)
Total CostEUI
(mBtu/GSF)
ECI
(Cost/GSF)
Natural Gas
(mmBtu)
GSFClassificationBuilding
1335 1 20 0 0
13 13 0 0
esti marine engine
room fires
under
investigation
0
0
67 13
$$ $ $ $
1362 1 20 0 0
13 13 0 0
esti marine ship deck
fires shelter
under
investigation
0
0
67 13
$$ $ $ $
1338 1 20 0 0
13 13 0 0
esti marine ship
superstructure fires
under
investigation
0
0
67 13
$$ $ $ $
0322 1 20 0 0
13 13 0 0
esti marine vessel
project
under
investigation
0
0
67 13
$$ $ $ $
1285 1 8 0 0
1 1 0 0
esti multi-use shelter under
investigation
0
0
29 1
$$ $ $ $
0339 1 56,663 0 0
5,131 5,131 0 0
esti multi-user shelter under
investigation
0
0
193,334 5,131
$$ $ $ $
1320 1 56,663 0 0
5,131 5,131 0 0
esti nozzles / lpg fires under
investigation
0
0
193,334 5,131
$$ $ $ $
0334 1 56,663 0 0
5,131 5,131 0 0
esti pipe rack fires under
investigation
0
0
193,334 5,131
$$ $ $ $
0335 1 56,663 0 0
5,131 5,131 0 0
esti process unit fires under
investigation
0
0
193,334 5,131
$$ $ $ $
9787 1 56,663 0 0
5,131 5,131 0 0
esti process unit fires
(new)
0 0
0
193,334 5,131
$$ $ $ $
0326 1 56,663 0 0
5,131 5,131 0 0
esti pump alley fires under
investigation
0
0
193,334 5,131
$$ $ $ $
1325 1 56,663 0 0
5,131 5,131 0 0
esti pump seal fires under
investigation
0
0
193,334 5,131
$$ $ $ $
0312 1 56,663 0 0
5,131 5,131 0 0
esti rail tank car
loading rack fires
under
investigation
0
0
193,334 5,131
$$ $ $ $
1336 1 15 0 0
33 33 0 0
esti rescue vessels under
investigation
0
0
50 33
$$ $ $ $
1329 1 0 0 0
11 11 0 0
esti salvage &
overhaul
under
investigation
0
0
0 11
$$ $ $ $
0329 1 56,663 0 0
5,131 5,131 0 0
esti tank & dike fires under
investigation
0
0
193,334 5,131
$$ $ $ $
10048 1 898 0 0
82 82 0 0
faa @ end of runway other 0
0
3,064 82
$$ $ $ $
10029 1 11,040 0 0
999 999 0 0
faa air trafic control
building
other 0
0
37,668 999
$$ $ $ $
Page 47 of 51Generated on: 1/29/2013 3:13:40PM

DIVISION OF ADMINISTRATIONUTILITIES & ENERGY MANAGEMENT
Energy Cost, Consumption and Energy Use/Cost Index (EUI/ECI) by Building for the previous 12 months ending November 28,
2012
# Electricity
(kwH)
CHW
(mmBtu)
HHW
(mmBtu)
Total CostEUI
(mBtu/GSF)
ECI
(Cost/GSF)
Natural Gas
(mmBtu)
GSFClassificationBuilding
10047 1 9,793 0 0
886 886 0 0
faa glide slope
building
other 0
0
33,414 886
$$ $ $ $
10030 1 46,360 0 0
4,193 4,193 0 0
faa radio relay station other 0
0
158,180 4,193
$$ $ $ $
10028 1 17,909 0 0
1,629 1,629 0 0
faa visual slope
indicator
other 0
0
61,106 1,629
$$ $ $ $
10190 1 9,320 0 0
849 849 0 0
football practice grass
field
other 0
0
31,800 849
$$ $ $ $
0317 1 56,663 0 0
5,131 5,131 0 0
garage & cottage fires
shelter
under
investigation
0
0
193,334 5,131
$$ $ $ $
10130 1 0 0 0
65 65 0 0
gas meter other 0
0
0 65
$$ $ $ $
10024 1 102 0 0
65 65 0 0
golf course irrigation
pump
other 0
0
347 65
$$ $ $ $
10025 1 22,202 0 0
2,005 2,005 0 0
grove other 0
0
75,753 2,005
$$ $ $ $
10129 1 1,321 0 0
119 119 0 0
grove theatre other 0
0
4,507 119
$$ $ $ $
10036 1 3,819 0 0
351 351 0 0
grove traffic light other 0
0
13,030 351
$$ $ $ $
10071 1 96,859 0 0
8,760 8,760 0 0
gte bldg other 0
0
330,483 8,760
$$ $ $ $
10179 1 59,400 0 0
5,370 5,370 0 0
harrington tower,
telecommunications
other 0
0
202,673 5,370
$$ $ $ $
0141 1 503 0 0
45 45 0 0
hay barn 0 0
0
1,716 45
$$ $ $ $
10216 1 5 0 0
0 0 0 0
high fence electric
installation on turk
other 0
0
17 0
$$ $ $ $
10037 1 1,511 0 0
137 137 0 0
joe routt traffic light other 0
0
5,156 137
$$ $ $ $
10227 1 0 0 0
30 30 0 0
mesa
telecommunication
other 0
0
0 30
$$ $ $ $
10084 1 8,880 0 0
804 804 0 0
mount aggie other 0
0
30,299 804
$$ $ $ $
10068 1 31,760 0 0
2,872 2,872 0 0
oil well pump other 0
0
108,365 2,872
$$ $ $ $
Page 48 of 51Generated on: 1/29/2013 3:13:40PM

DIVISION OF ADMINISTRATIONUTILITIES & ENERGY MANAGEMENT
Energy Cost, Consumption and Energy Use/Cost Index (EUI/ECI) by Building for the previous 12 months ending November 28,
2012
# Electricity
(kwH)
CHW
(mmBtu)
HHW
(mmBtu)
Total CostEUI
(mBtu/GSF)
ECI
(Cost/GSF)
Natural Gas
(mmBtu)
GSFClassificationBuilding
10051 1 42,880 0 0
3,910 3,910 0 0
olsen rv parking other 0
0
146,307 3,910
$$ $ $ $
10212 1 35,640 0 0
3,223 3,223 0 0
parking lot utilities other 0
0
121,604 3,223
$$ $ $ $
10045 1 289,713 0 0
26,221 26,221 0 0
pedunderpass other 0
0
988,501 26,221
$$ $ $ $
1581 1 920 0 0
83 83 0 0
penberthy recsports
maintenance bldg
other 0
0
3,139 83
$$ $ $ $
1578 1 262,204 0 0
23,598 23,598 0 0
penberthy recsports
pavillion
other 0
0
894,640 23,598
$$ $ $ $
10052 1 79,400 0 0
7,202 7,202 0 0
penberthy rv parking other 0
0
270,913 7,202
$$ $ $ $
10177 1 0 0 0
65 65 0 0
pitts road other 0
0
0 65
$$ $ $ $
10137 1 6,001 0 0
540 540 0 0
prairie chicken
(wildlife & fisheries)
other 0
0
20,475 540
$$ $ $ $
10063 1 48,863 0 0
4,447 4,447 0 0
pump for lake (fish
pond)
other 0
0
166,721 4,447
$$ $ $ $
10195 1 6,556 0 0
591 591 0 0
rec job trailer at
energy annex
other 0
0
22,369 591
$$ $ $ $
10059 1 5,210 0 0
471 471 0 0
reville oil well pump other 0
0
17,777 471
$$ $ $ $
8681 1 14,692 0 0
1,328 1,328 0 0
rifle range 0 0
0
50,129 1,328
$$ $ $ $
10144 1 19 0 0
2 2 0 0
riverside, baseball
field on pole
other 0
0
65 2
$$ $ $ $
10136 1 2,234 0 0
201 201 0 0
rlem field lab #9100 other 0
0
7,622 201
$$ $ $ $
10229 1 80 0 0
7 7 0 0
rr crossing - old main
& wellborn
other 0
0
273 7
$$ $ $ $
10038 1 7,841 0 0
714 714 0 0
rr joe routt tunnel other 0
0
26,753 714
$$ $ $ $
10039 1 2,779 0 0
251 251 0 0
rr overpass light over
60
other 0
0
9,482 251
$$ $ $ $
10180 1 85,260 0 0
7,715 7,715 0 0
rudder twr 446 at&t
(real energy)
other 0
0
290,907 7,715
$$ $ $ $
Page 49 of 51Generated on: 1/29/2013 3:13:40PM

DIVISION OF ADMINISTRATIONUTILITIES & ENERGY MANAGEMENT
Energy Cost, Consumption and Energy Use/Cost Index (EUI/ECI) by Building for the previous 12 months ending November 28,
2012
# Electricity
(kwH)
CHW
(mmBtu)
HHW
(mmBtu)
Total CostEUI
(mBtu/GSF)
ECI
(Cost/GSF)
Natural Gas
(mmBtu)
GSFClassificationBuilding
10181 1 2,378 0 0
215 215 0 0
rudder twr 446
centrex (real energy)
other 0
0
8,114 215
$$ $ $ $
10191 1 8,939 0 0
808 808 0 0
sidewalk lights at
university apartments
other 0
0
30,500 808
$$ $ $ $
10139 1 100,320 0 0
9,110 9,110 0 0
soccer field at
penberthy
other 0
0
342,292 9,110
$$ $ $ $
10140 1 292,900 0 0
26,661 26,661 0 0
softball field at
penberthy
other 0
0
999,375 26,661
$$ $ $ $
7752 1 27,521 0 0
2,537 2,537 0 0
teex - ps&s gym 0 0
0
93,902 2,537
$$ $ $ $
10182 1 72,549 0 0
6,571 6,571 0 0
telephone bldg.
(riverside)
other 0
0
247,537 6,571
$$ $ $ $
10183 1 165,120 0 0
14,931 14,931 0 0
telescom ms1371 other 0
0
563,389 14,931
$$ $ $ $
10041 1 65 0 0
6 6 0 0
temp for grove other 0
0
222 6
$$ $ $ $
1457 1 219,914 0 0
19,792 19,792 0 0
the gardens m 0 0
0
750,345 19,792
$$ $ $ $
1458 1 227,391 0 0
20,465 20,465 0 0
the gardens n 0 0
0
775,857 20,465
$$ $ $ $
1459 1 241,426 0 0
21,728 21,728 0 0
the gardens p 0 0
0
823,745 21,728
$$ $ $ $
1460 1 274,737 0 0
24,726 24,726 0 0
the gardens q 0 0
0
937,402 24,726
$$ $ $ $
10035 1 7,734 0 0
707 707 0 0
traffic light at 2818 &
george bush
other 0
0
26,388 707
$$ $ $ $
10034 1 7,557 0 0
684 684 0 0
traffic light, 60 &
discovery
other 0
0
25,784 684
$$ $ $ $
10033 1 4,849 0 0
439 439 0 0
traffic light, agronomy
@60
other 0
0
16,545 439
$$ $ $ $
10017 1 977 0 0
100 100 0 0
turf farm other 0
0
3,334 100
$$ $ $ $
10070 1 1 0 0
0 0 0 0
tv bldg other 0
0
4 0
$$ $ $ $
10200 1 89,100 0 0
8,052 8,052 0 0
usar new warehouse
(disaster city)
other 0
0
304,009 8,052
$$ $ $ $
Page 50 of 51Generated on: 1/29/2013 3:13:40PM

DIVISION OF ADMINISTRATIONUTILITIES & ENERGY MANAGEMENT
Energy Cost, Consumption and Energy Use/Cost Index (EUI/ECI) by Building for the previous 12 months ending November 28,
2012
# Electricity
(kwH)
CHW
(mmBtu)
HHW
(mmBtu)
Total CostEUI
(mBtu/GSF)
ECI
(Cost/GSF)
Natural Gas
(mmBtu)
GSFClassificationBuilding
10015 1 64,880 0 0
115,141 5,884 0 0
usda other 17,363
109,257
17,584,371 115,141
$$ $ $ $
10064 1 91,449 0 0
8,274 8,274 0 0
verizon other 0
0
312,024 8,274
$$ $ $ $
10058 1 0 0 0
65 65 0 0
water pump, behind
stores
other 0
0
0 65
$$ $ $ $
10224 1 937 0 0
85 85 0 0
west conex container
(at bldg 1156)
other 0
0
3,197 85
$$ $ $ $
10135 1 83,120 0 0
7,516 7,516 0 0
women's softball field other 0
0
283,605 7,516
$$ $ $ $
0817 1,740 6,267 0 0
567 567 0 0
well field pump station mechanical
room
0
0
12 0
$$ $ $ $
3201 900 24,546 0 0
2,517 2,399 0 0
state hgtrs thermal
plant
mechanical
room
22
118
118 3
$$ $ $ $
1347 488 21,757 0 0
1,966 1,966 0 0
usar disaster city
restroom
mechanical
room
0
0
152 4
$$ $ $ $
1282 480 7,066 0 0
639 639 0 0
esti bathroom (ryan's
roost)
mechanical
room
0
0
50 1
$$ $ $ $
1385 480 7,718 0 0
698 698 0 0
esti wmd restroom mechanical
room
0
0
55 1
$$ $ $ $
1758 151 3,777 0 0
298 298 0 0
reproductive sciences
bldg. i
mechanical
room
0
0
85 2
$$ $ $ $
Page 51 of 51Generated on: 1/29/2013 3:13:40PM