Embed Size (px)
Citation preview
Page 1/33
RNA-seq and metabolome revealed counter effectof chitosan against Botrytis cinerea on grape berriestariq pervaiz ( [email protected] )
Nanjing Agricultural University Nanjing ChinaHaifeng Jia
Nanjing Agricultural UniversityPeian Zhang
Nanjing Agricultural UniversityMuhammad Salman Haider
Nanjing Agricultural UniversitySuwen Lu
Nanjing Agricultural UniversityXinke Wei
Nanjing Agricultural UniversityHaoran Jia
Nanjing Agricultural UniversityJinggui Fang
Nanjing Agricultural University
Research article
Keywords: Botrytis cinerea, Chitosan, Growth elicitor, Transcriptomic, Metabolome, Antioxidants
Posted Date: October 11th, 2019
DOI: https://doi.org/10.21203/rs.2.15853/v1
License: This work is licensed under a Creative Commons Attribution 4.0 International License. Read Full License
Page 2/33
AbstractBackground: Plants have great potential to protect against biotic and abiotic stresses. Hence, theinteraction between defense signaling networks is incredible, which can either be activated with theapplication of growth elicitors or antimicrobial organic compounds.
Results: In this study, chitosan (15kDa) is used against grey mold (Botrytis cinerea) in two grape varieties(Shine-Muscat and Kyoho). The �ndings depicted that the interaction of DEGs and KEGGs in control andtreated samples of grapevine, which provides the evidence for selection of gray mold defense responsivegenes and chitosan for subsequent application in grapevine production/postharvest. The genes encodingcyclic nucleotide gated ion channels (CNGCs) and CaM/CML expressed a large number of transcripts,meanwhile, in treated samples, CaM/CML and RPS2 showed the highest number of up-regulated genes.In plant hormone signal transduction pathway, treated samples AUXIAA and SAUR again the highestnumber of transcripts were found. In correlation with metabolome analysis, 20 differentially expressedmetabolites were recorded. In the negative correlation in the control samples of Kyoho vs Shine mascateshowed 224 and 157 up and down-regulated respectively. Moreover, antioxidants were also signi�cantlyregulated with the chitosan application and reduced the lesion diameter, water loss and disease incidenceup to 12 days. In both varieties, the chitosan treatment superoxide dismutase, peroxidase,Malondialdehyde, catalase, and proline content was signi�cantly increased during storage.
Conclusion: The results depicted that at gene expression levels was varied at different fruit growthdevelopmental stages, and the most effective in case of plant-pathogen interaction. Chitosan is seen tobe more effective in both varieties and it acts as an anti-fungal agent. The transcriptomic study alsocon�rmed that at the transcriptome level expression was higher in treated samples, however in generaltranscription factor have not much affected with chitosan application.
BackgroundVitis vinifera L. is an important fruit crop, having more than 7.5 mha of the area under cultivation, andwith 73.3 mt production worldwide in 2017 worldwide [1]. The external in�uence caused by pathogens,diseases, and environment depict substantial effects on grapevine yield and productivity [2, 3]. Plants canarray positive complex molecular and physiological approaches to mitigate and cope the severity ofbiotic stresses [2] and disease susceptibility or resistance against disease, which not only dependents onthe speci�c plant-pathogen interaction but also on the tissue-speci�c growth stages. The externalin�uence caused by pathogens, diseases, and environment depict substantial effects on grapevine yieldand productivity [3, 4]. The ripening and maturation of �eshy and pome fruits developmental conversionthat accords with susceptible to pathogenicity. Fruit ripening and maturation comprised of complexregulatory growth networks and hormone-mediated pathways leading to signi�cant changes in thebiochemical and physiological characteristics of grape berries [5]. Hemibiotrophs pathogens areimportant and fetal to fruits that modi�ed lifestyles at different developmental stages and in several

Page 3/33
ecological conditions [6]. Thus, the infection strategies of different pathogens challenge the competencyof the host to respond naturally and develop effective defense mechanisms.
Grey mold or Botrytis bunch rot caused by Botrytis cinerea is the most devastating and economicallyimportant diseases in V. vinifera all over the globe. Floral and immature berry tissues can be infested byB. cinerea and the pathogenicity can persist during semi-dormant saprophytic state in necrotic �oraltissues or in a dormant state within the developing fruits [7, 8]. Structure-activity reports the application ofpuri�ed chitosan oligomers have presented that the degree of acetylation and polymerization affect theirbioactivity [9, 10]. Chitosan is a natural polysaccharide containing N-acetylglucosamine and glucosaminecopolymers.. Chitosan is also useful for the human body as a dietary supplement for subsiding bodyweight and decreasing the cholesterol level [11, 12]. Chitosan is used as an effective biochemical remedyagainst fungal attack during storage and replaced the SO2 treatments, resulting in the control of fungaldiseases [13, 14]. Chitosan with low molecular weight compounds are the most effective against fungaland defensive reactions than with the higher molecular weight. Furthermore, it has been reported todevelop systemic resistance in plants. Oligosaccharide growth elicitors from various pathogens reportedhaving a critical role in host plant protection mechanism encompassing plant pathogen chemoperceptionchemoperception and interaction [15].
The omic technologies: transcriptomic, genomics, proteomics and metabolomics are focused on genes,RNA, proteins, and metabolite [16]. RNA-sequencing is novel and deep-sequencing NGS technique used toacquire transcriptomic pro�ling. In a single assay, the method reveals the discovery of transcriptinformation, allele-speci�c, unique genes, single nucleotide variants and gene expression without theaccessibility of ESTs annotations. Furthermore, transcriptomic �les have also been used in de�ning large-scale genes controlling the complex pathways and interaction and metabolic activities of plants duringdifferent environmental conditions [4, 17]. Consequently, metabolomics allow the investigation ofmetabolites that are existing in higher concentration, mainly major some important carboxylic acids,amino acids, and sugars. Thus, the signi�cant roles of many metabolites but less concentratedmetabolites during growth and development is still need to investigate [16].
To take a further step to investigate the grapevine defense responses against fungus, metabolome andtranscriptome were examined. Due to the fast modi�cation in techniques and advancement in technologyof NGS including metabolomicmetabolomics, genomic, ionomic, proteomic, transcriptomic, phenomic,the producing quantity of sequencing data in experiments has increased. Due to the application of thistechnology leads to an improved level of transcriptome revelation, enriched the sequencing readsmapping. Considerably, constant developments in de�ning the Vitis transcriptome in functionalannotation [18, 19] and GOs consignments [20], currently it permits the detailed description of thefunctional assignment of V. vinifera genes [21]. So far there are very few reports predicted on geneexpression of chitosan effects; though, �rst unreported facts from the transcriptomic investigation of thechitosan Colletotrichum on avocado cv. Hass collaboration indicates important modi�cations in the geneexpression levels of the host and pathogen relation [22]. Therefore, keeping in the above techniques andproblem the comprehensive study of comparative transcriptome and metabolomic analysis is design to
Page 4/33
understand the responses of chitosan and identify putative genes, metabolites and their role in defenseand metabolic pathways.
Results And DiscussionScanning Electron Microscopy Samples
The berry samples treated with chitosan , mycelial growth of Botrytis cinerea was disordered, the overallgrowth rate slowed down, most of them collapsed, no longer obvious growth, a large number of branchesappeared at the growing point, the branch spacing became shorter, deformity appeared, showing swellingor candidal-shaped, and exudation of inclusions. However, the Botrytis cinerea without chitosantreatment grew well on the surface of fruits and mycelia were slender, straight, uniform in thickness andsmooth in line. The surface of mycelia was smooth, and its branches were formed at a certain distancefrom the top of mycelia, and the growth point was thin and well extended (Fig. 2).
Sequence quality control and Illumina RNA-seq
The data retrieved showed that the total raw reads in Kyoho control KC1 showed highest 52,864,680 in allthree controls followed by clean reads 51,534,216 and clean bases 7.73G. However in Shine-muscatcontrol showed 60,211,220 raw reads, 59,144,494 clean reads and 8.87G clean bases, which is alsohigher than the Kyoho control. In a comparison of treated samples, Kyoho KT1 showed highest raw reads67,165,372, clean reads 65,368,848 followed by 9.81G clean bases. Meanwhile, Shine-muscat ST2 hashighest raw reads 59,068,078, with 58,381,062 clean reads, and 8.76G clean bases. in overview, KT1expressed a higher number of raw reads, clean reads and clean bases (Table 2). The results showed thatthe expression level in KT will be higher than the control and Shine-muscat. This also may be due tovarietal effect with the chitosan treatment and cellular activities of RNA during metabolism and fruitdevelopment.
In case of total mapped reads in control Shine-muscat SC1 have higher percentage i.e. 53,045,265(89.69%) and in comparison within treatments Kyoho KT1 generated 57,982,396 (88.7%) total mappedreads, followed by ST R2, 52,585,277 (90.07%). Moreover 2,727,030 (4.94%) multiple mapped readsshowed in SC2, which is higher as compared to all treatments and varieties. However uniquely mappedreads were generated 55,414,067 (84.77%) by Kyoho KT1, followed by SC1 50,738,565 (85.79%) (Table3).
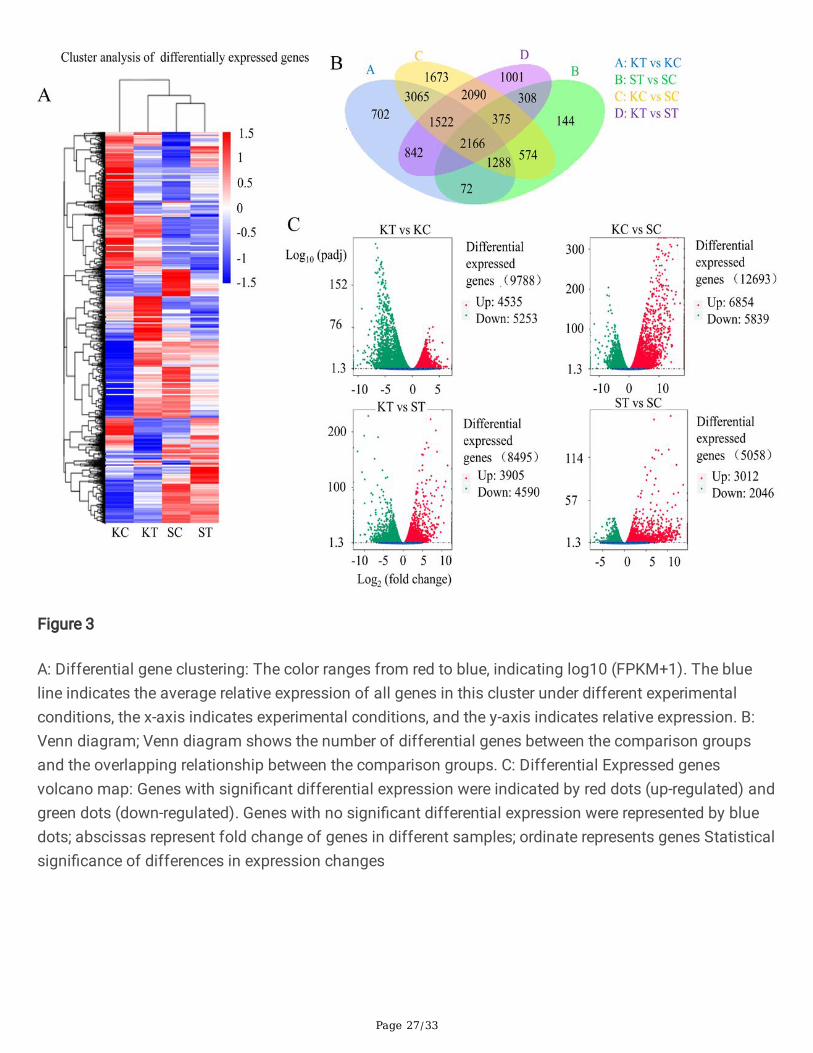
Furthermore, total differential expressed genes (DEG) in KC vs SC are 12,693 (6,854 up and 5,839 down-regulated), in KT vs KC 9,788 (4,535 up and 5,253 down-regulated), KT vs ST 8,495 (3,905 up and 4,590down-regulated) and in ST vs SC 5058 (3012 up and 2046 down-regulated) were recorded. The FPKMhierarchical clustering map, log10 (FPKM+1) values are normalized (scale number) and clustered, redindicates high expression gene, blue indicates low expression gene. The color ranges from red to blue,indicating log10 (FPKM+1) from large to small; log2 (ratios) line graph, the gray line in each sub-graphindicates the relative expression of the gene in a cluster under different experimental conditions (Fig. 3 A).

Page 5/33
DEGs were generating a Venn diagram of up and down-regulated genes. The differential genes in Venndiagram show the number of differential expressed genes between the comparison groups and theoverlap between the comparison groups. It shows the number of DEGs per comparison in control of bothvarieties and treated once, and the overlap between each set of genes shows the total up and down-regulated genes. 2,166 genes were commonly expressed in all samples including treated and control ofboth varieties. The total numbers of genes in KT vs KC showed 9788, ST vs SC 5058, KC vs SC 12,693, KTvs ST 8495 transcripts (log2-fold change of 1, P > 0.05) that were differentially regulated are shown (Fig.3B and C).
GO and KEGG Enrichment Analysis of Differential Expressed Gene
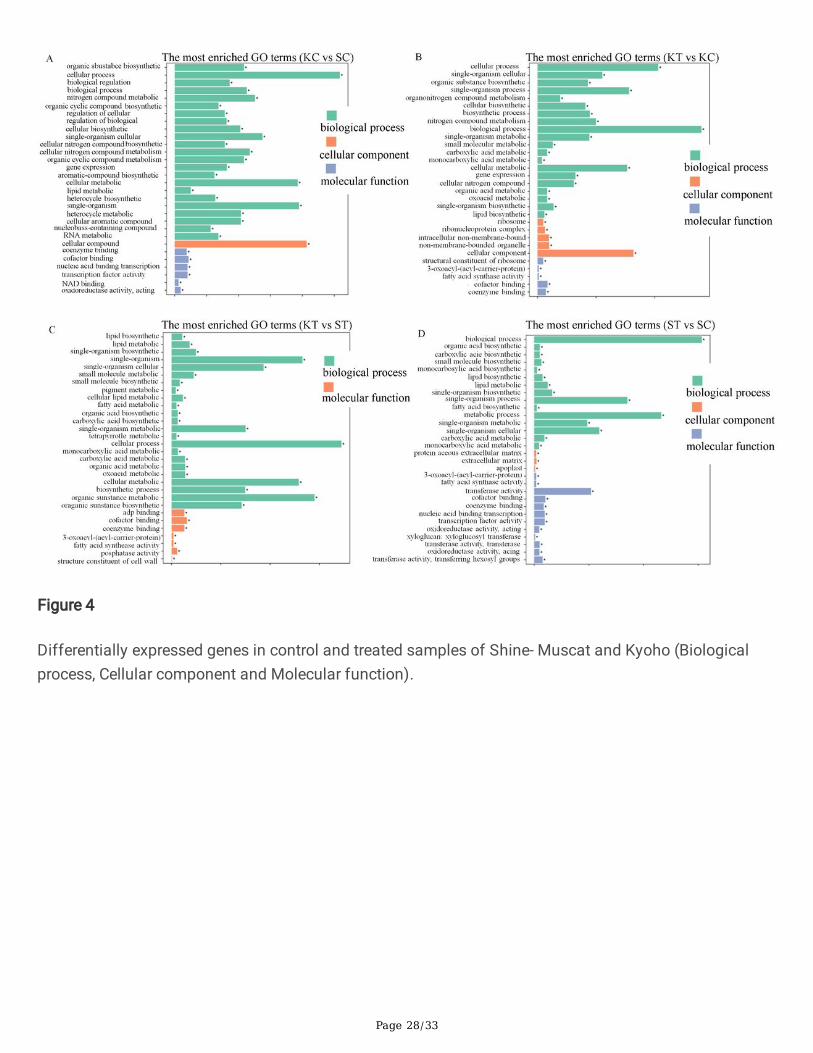
To detect the functions of Genes expression involved in the response to chitosan application, wedetermined GO assignments. Differentially expressed genes enrichment analysis in GOs were carried outby the GOseq R package software, where gene length bias were corrected. GO terms with modi�ed P.valueconsidered as signi�cantly enriched, which will be <0.05 by differential expressed genes. [23]. Maximumnumber of DEGs were generated in biological process (BP), followed by cellular component (CC) and therest of them in molecular function (MF) categories in all treated and control samples. In comparisonwithcontrol and treatment, the KC vs SC has a high value of GO terms i.e 4,341 followed by KT vs KC 4,180(Fig.4). However, in both varieties, Kyoho and Shine-muscat treated samples assigned 3,967. Meanwhileup-regulated GOs were higher in treated samples and lower in control.. In case of treated samples(highest in KT vs KC enriched with 5,595/15,822), signi�cantly enriched terms were biological regulation,cellular processes, and metabolic process, hormonal regulation, plant-pathogen interaction, and theseterms are more important to gray mold and disease incident. In cellular component group (highestshowed in KC vs SC 4,139/8,869 followed by KT vs KC 3,275/8,869), signi�cantly enriched termsincluded organelle part, cell, extracellular regions, cell part, proteinaceous extract, and apoplast, whichwere found. In the molecular function category (KC vs SC 8,472/19,544 enriched followed by KT vs KC6,663/19,544), signi�cantly enriched terms included transcription factor, transporter activity, transcriptionfactor activity, coenzymes binding, catalytic, binding, nucleic acid binding and transducer activity (Fig. 4).
Kyoto Encyclopedia of Genes and Genomes (KEGG) is a system for examining gene function andgenomic information databases, which is helpful to investigate gene expressions in complete pathwaynetwork. As a huge public database related to Pathways [24], KEGG provides excellent integration ofdevelopmental pathway networks, including biodegradation of organic matter, metabolism ofnucleosides, carbohydrates, and amino acids.The most enrichment signi�cant pathways analysis ofDEGs, allow to in-depth knowledge in the KEGG database. This analyses led to expedite understandingthe genes interactions and biological functions [25, 26]. The database has useful information forthoughtful functions and use of the biological system, such as from molecular-level information,especially large-scale molecular datasets generated by high-throughput and genome sequencingexperimental technologies, organism and the ecosystem (http://www.genome.jp/kegg/). In present studythe KC vs SC group, DEGs were signi�cantly enriched in �ve pathways with Q and P-values < 0.05:“Biosynthesis of secondary metabolites” (591 DEGs), “Plant hormone signal transduction” (132 DEGs),

Page 6/33
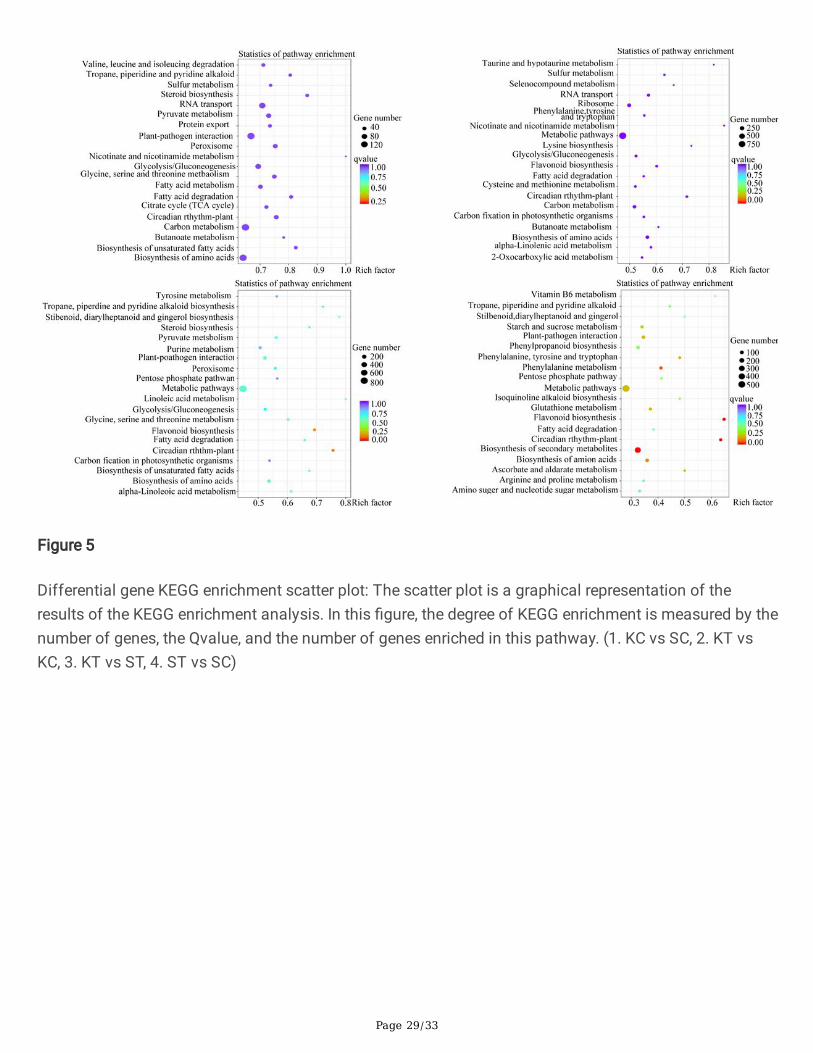
“Plant-pathogen interaction” (150), Transcription factor (21) and protein export (36) were enriched.Meanwhile, in treated samples KT vs ST Biosynthesis of secondary metabolites” (483 DEGs), “Planthormone signal transduction” (89 DEGs), “Plant-pathogen interaction” (127) and Transcription factor (8)and protein export (18) were enriched. The enrichment factor is the ratio of the number of DEG to thebackground number in a different pathway. In comparison between controls of both varieties had shownin Figure 5. The results depicted that KC and SC enriched in RNA transport, plant-pathogen interaction,carbon metabolism and biosynthesis of Amino acid. The pathways DEGs enrichment is changed as aftertreated with growth elicitor chitosan. The enrichment factor ratio in KT vs ST showed higher in metabolicpathways, plant-pathogen interaction and purine metabolism (Fig.5).
Genes Expressed in Plant Pathogen Interaction Pathway
The interaction of plants with pathogens in�uenced programmed cell death (PCD) pathways. During aresistance interaction, PCD was induced in a process termed the hypersensitive response (HR) which mayfunction to limit pathogen spread [27]. Against pathogen outbreak, crops must have the potential toinduce particular defense proteins. Cell walls play a critical role as barriers that can inhibit the outburst ofpathogens, but also have an important stock of energy-glucose [28]. The samples analyzed in control (KCvs SC) for plant-pathogen interaction pathway 150 DEGs were recorded. In fungal PAMP the CDPKshowed two up-regulated and eight transcripts were down-regulated, in the same Rboh had two up andsingle down-regulated genes. Meanwhile no gen was detected in ROS (Supplementary File S1). In thecase of Bacterial �agellin signaling (�g22), FLS2 showed one down-regulated, and MEKK1 has two upand two down-regulated. In the same series MKK1/2, MKK4/ 5 and MKK3/6 showed one up-regulatedeach. Furthermore in case of Bacterial EF-Tu two up-regulated and one down-regulated. Moreover, inBacterial Secretion system, PBS2 and RPM1 showed highest transcripts, four up and four down-regulatedand ten up-regulated and four down-regulated respectively. However, in HSP90 have a shown verydifferent number of transcripts that is two up and four down-regulated. However in Kyoho treated vscontrol (KT vs KC) the larger number of transcripts in Bacterial Secretion system (RPS2) �fteen were up-regulated and three showed down-regulation, followed by in CDPK �ve up and �ve down-regulated (S2).
The treated sample of both varieties was compared for plant-pathogen interaction, KT vs ST in FungalPAMP, CDPK expressed two up and four down-regulated and Rboh have a single down-regulatedtranscript. Fungal PAMP (CaMCML) have a correlation with Ca and also showed six up and seven down-regulated. In the case of Bacterial Flagellin �g22, MEKK1 has two up and single down-regulatedtranscripts (S2). Meanwhile MKK1/2, MKK4/5, and MPK3/6, single up-regulated transcript was recordedin each. In the same pathway Bacterial EF-Tu have one up and three down-regulated. Furthermore, inBacterial secretion system RPM1 and RPS2 expressed four up and seven down-regulated, and sixteen upand twenty-three down-regulated respectively. However, HSP90 have all up-regulated (4) transcripts. In thecomparison of control and treated, ST vs SC CDPK showed single up and two down-regulated, Rboh havesingle up and CsMCML have single up and sixteen down-regulated genes were depicted. Meanwhile inthe same comparison Bacterial Secretion system RPM1 showed four up and single down-regulated, RPS2showed three up and ten down-regulated. Furthermore in HSP90 have �ve down-regulated transcripts
Page 7/33
were recorded. In cases of Bacterial �agellin �g22, FLS2, MEKK1, MEDKK1/2 did not expressed anytranscript, only in BAKEKKI have four up-regulated, MEKK4/5 have single up-regulated, WRKY288 havetwo and PR1 have single up-regulated transcripts were recorded (S2).
Plant hormone signal transduction in relation to chitosan
Plant hormones play a crucial role in controlling the disease attack, growth, and development of plants.The hormonal regulation haste the development of the speci�c organ and assimilate them to produce theform in plants. Its impotent to investigate that how hormones are synthesized and processed, how theyact at both the molecular and organismal levels, a description of some of the roles they play in regulatingplant metabolism, and the projections for the genetic engineering of hormone production levels orreactions in plants protection [29, 30]. In the recent study, hormonal singling pathways many genes wereexpressed in control (KC vs SC), mainly in Tryptophan metabolism, AUX1 showed two down and one up-regulated, TIR1 have two up and one down-regulated, in the same series AUXIAA at two points expressedthirteen number of transcripts, out of which twelve are down and one is up-regulated, followed by GH3four and one up and down-regulated respectively. However SAUR have very divergent from rest of thehormone expression (eleven up and six down-regulated). In the second Brassinosteroid biosynthesis,BAK1 and BSK expressed two up and one down-regulated each, in the same way, BIN2 Proteasomaldegradation showed two up-regulation, BZR1/2 and CYCD3 have one down-regulated each, and �nallyTCH4 have four down-regulated transcripts (S3). Another important stage of α-Linolenic Acid metabolismbut they didn’t have any such remarkable transcript regulation, only single transcript at each stage isdown-regulated, furthermore in biosynthesis of Phenylalanine TGA have shown three up and one down-regulated. In Kyoho (KT vs KC) Tryptophan Metabolism, AUX1 showed three up and single down-regulated TIR1 single up and two down-regulate and in AUXIAA have seven up and three down-regulated,while SAUR showed three up and eight down-regulated genes. In Zeatin Biosynthesis CRE1, AHP and B-ARR have two, single and �ve up-regulated transcripts were observed respectively. Large numbers oftranscripts were recorded in Carotenoid biosynthesis, in PYR/PYL have two up and one down-regulated,PP2C �ve up and two down-regulated. SnRK2 four up and single down-regulated, ABF showed �ve up andsingle down-regulated transcripts were recorded (S3).
In treated samples of shine-muscat and Kyoho (KT vs ST) Plant Hormone single transduction pathway,Tryptophan metabolism expressed three up-regulated in AUX1, one up and two down-regulated in TIR1,four up and seven down-regulated in AUXIAA followed by six up and six down-regulated by SAUR.. InZeatin biosynthesis is also different from control, where all transcripts are up-regulated in CRE1, AHP, andB-ARR (2 up-regulated in each), but in Brassinosteroid biosynthesis, BAK1 have single up and four down-regulated transcripts were recorded. In α-Linolenic Acid metabolism, all transcripts in JAR1and COI1 areup-regulated, meanwhile in Phenylalanine metabolism NPR1 have all up-regulated and TGA have one upand two down-regulated transcripts were recorded. In comparison with ST vs SC Tryptophan Metabolism,AUXIAA showed two up and eleven down-regulated, followed by SAUR �ve up and �ve down-regulated. Incase of Brassinosteroid Biosynthesis, in BAK1 four up-regulated, BSK two up and one down-regulated.

Page 8/33
However, in BZR1/2 and TCH4 showed four down-regulated in each. Meanwhile, in Phenylalaninemetabolism, TGA has three and PR-1 single up-regulated (S3).
Biosynthesis of secondary metabolites and interaction with Chitosan application
Syntheses of secondary metabolites in response to growth elicitors are important during growth andorgan development. An analysis of pathways generally and stage speci�c secondary metabolites werehighly regulated in early developmental phase [25]. In the control samples, total down-regulatedtranscripts are 264 and up-regulated are 345, and in treated (KT vs ST) samples 132 up and 324transcripts were down-regulated. The more relevant and important secondary metabolites are Biotinmetabolism, Arginine and proline metabolism, Tryptophan, Terpenes, Zeatin, Alkaloids, Glycolysis /Gluconeogenesis were regulated in treated samples and during growth phases.
The number of transcripts in control KC vs SC three secondary metabolites were up-regulated duringBiotin metabolism, twenty-eight in Arginine and proline metabolism, seven in tryptophan, ten inditerpenoid, eight in zeatin, ten in isoquinoline alkaloid and forty-three in glycolysis / gluconeogenesismetabolism. While seven down-regulated transcripts in biotin metabolism, twenty-three in arginine andproline metabolism, thirteen in tryptophan, three in diterpenoid, nine in isoquinoline alkaloid and forty-eight during glycolysis/gluconeogenesis metabolism.
Furthermore, in treated samples (KT vs ST), secondary metabolites recorded as; one in biotin metabolism,sixteen in arginine and proline metabolism, �ve in tryptophan, diterpenoid, four in zeatin, three inisoquinoline alkaloid and thirteen in glycolysis / gluconeogenesis are metabolism. Meanwhile, sevendown-regulated in biotin, twenty-�ve in Arginine and proline metabolism, nine in tryptophan, four inditerpenoid, one in zeatin, thirteen in isoquinoline alkaloid and glycolysis/gluconeogenesis �fty-onetranscripts are recorded.
Basal transcription factors pathway in association with defense
Transcripts during transcription factors pathway in control of grapes were recorded, in KC vs SC generaltranscription factors for RNA polymerase II have shown number of transcripts, in TFIIB expressed one upand two down-regulated, in TFIID, TAF1TAF 10, TAF12 showed single down-regulation transcript.Meanwhile TAF5 TAF6, TAF13 have single gene with up-regulation. In addition TFIIH, TFIIH1, TFIIH4 andMAT1 have single down-regulated genes, while in TTDA and CDK7 have one and two up-regulatedtranscripts respectively (S4). In the comparison of treatment and control KT vs KC, the Generaltranscription factors for RNA Polymerase II showed very few transcripts expression as compared tocontrol, such as TFIIA2, TAF5, TAF7, TAF13, TFIIF2, TFIIH, TFIIH1, CDK7, and MAT1 showed noexpression. TFIIB, TFIID, TAF1, TAF7, TAF5, TAF6, TAF4, TAF10, TAF13, TFIIE, TFIIE1, TFIIF, TFIIF1, TFIIF2,TFIIH, TFIIH1and TFIIH4 expressed single up-regulated transcripts, however only TTDA showed singledown-regulated transcripts (S4).
Page 9/33
In comparison of KT vs ST, in general transcription factors for RNA polymerase II have single up anddown-regulated in TFIIB, one is up-regulated in TAF8, TAF5, and TTDA, while in CDK two up-regulated andTFIIH1 have one down-regulated transcripts were found. As in comparison with ST and SC the number oftranscripts were reduced, only TFIIB one up and TAF8 have one down-regulated transcripts were recorded(S4). However, over the transcription expression was very low and less number of transcripts were foundin control as well as in treated samples. This shows that the pathogen attack and general transcriptionfactors did not show any close regulation at any stage of berry infestation.
Co-regulated gene analysis between transcriptome and metabolome
Pathways related to metabolic activities were more stimulated in treated samples. Secondary metabolitesand terpenoid biosynthesis (sesquiterpenoid, triterpenoid, and diterpenoid, biosynthesis),phenylpropanoid (�avonol �avone, and phenylpropanoid biosynthesis) were highly enriched transcriptswith higher expression levels (Fig. 6,7, S1)
Correlation analysis, and comparison of metabolites and genes were recorded in the results of geneticand metabolic correlation analysis. 20 differential metabolites and 50 differential genes were expressed.In the KC vs SC showed negative correlation with 224 up and 157 down-regulated genes as shown inTable 4. Furthermore 6 genes in Purine metabolism, 5 in Biosynthesis of secondary metabolites, with 3each in Histidine metabolism and Flavone and �avonol biosynthesis. However in positive correlation wereobserved in the same comparison Glucosinolate biosynthesis, 2−Oxocarboxylic acid metabolism,Glycine, serine and threonine metabolism, methionine and cysteine metabolism, Pantothenate and CoAbiosynthesis, Glycerophospholipid metabolism, Tryptophan metabolism, tyrosine and tryptophan,Phenylalanine, biosynthesis, Histidine metabolism, Purine metabolism showed single genes in allmetabolome (Fig. 7, S5). In positive correlation, KC vs SC 830 genes were up-regulated. Moreover intreated samples 730 transcripts were down-regulated (Table 3). Isoquinoline alkaloid biosynthesis,Fructose and mannose metabolism showed single genes. Meanwhile in KT vs ST positive correlationdepicted 638 up and 1069 down-regulated. Monoterpenoid biosynthesis, Glucosinolate biosynthesis,2−Oxocarboxylic acid metabolism, Glycine, serine and threonine metabolism, Glycerophospholipidmetabolism, Zeatin biosynthesis, Tryptophan metabolism, Phenylalanine, tyrosine and tryptophanbiosynthesis, Pyrimidine metabolism, Cysteine and methionine metabolism, ABC transporters, Planthormone signal transduction, alpha-Linolenic acid metabolism, Glutathione metabolism, Metabolicpathways and Biosynthesis of unsaturated fatty acids, positively regulated (single gene) (Fig. 6, S5). Innegatively regulated genes 131 up and 207 down-regulated (Table 3). These co-regulated genes were alsopresented in heatmap. The redder the color, the stronger the positive correlation, the bluer the color, andthe stronger the negative correlation presented in the heatmap (Fig. 7, S5).
DEGs Validation by qRT-PCR: For reproducibility and validation of data generated from Illumina sequencetechnique, thirteen transcripts from RNA-Seq randomly selected representing the entire major up anddown-regulated functions were selected. These selected transcripts were involved in plant-pathogeninteractions, hormone signaling, and seconder metabolic activities. The results of qRT-PCR for all the 13

Page 10/33
(7 up and 6 down-regulated) were selected genes and results are consistent with the RNA-Seq results,underscoring the accuracy. The data reliability of Illumina sequence, qRT-PCR primers are presented inSupplementary S1 and Fig. 8.
Physiological and Antioxidant regulation in response to chitosan
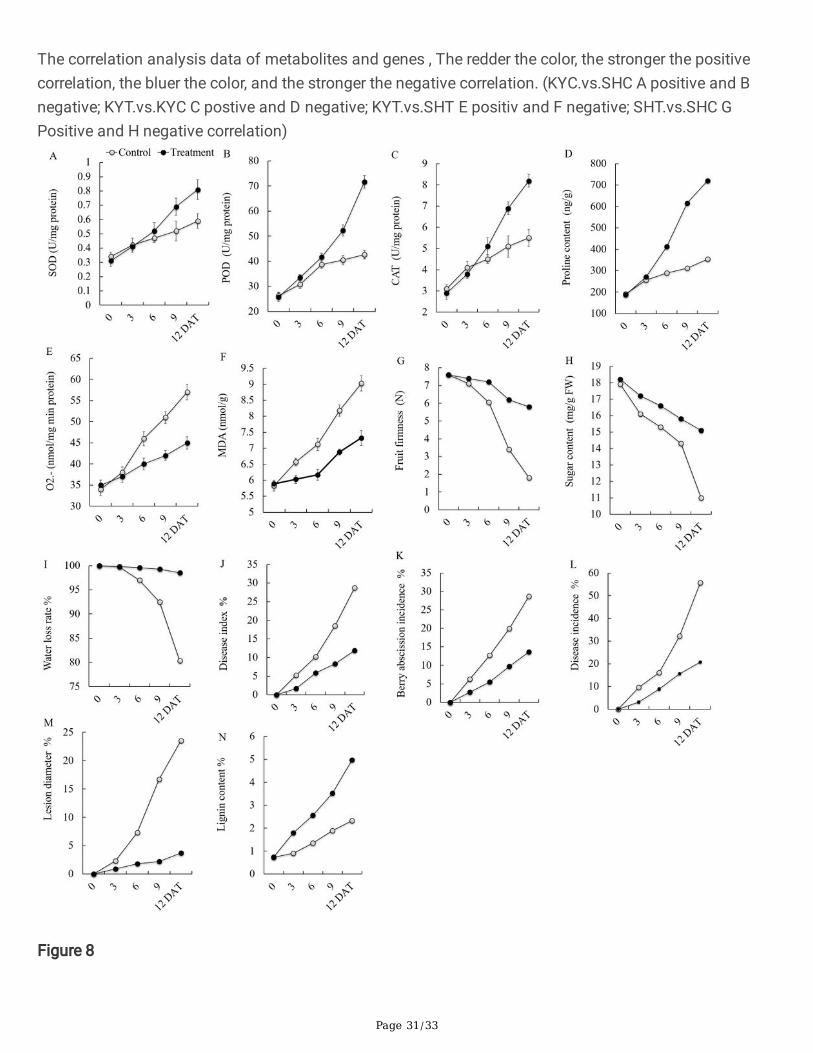
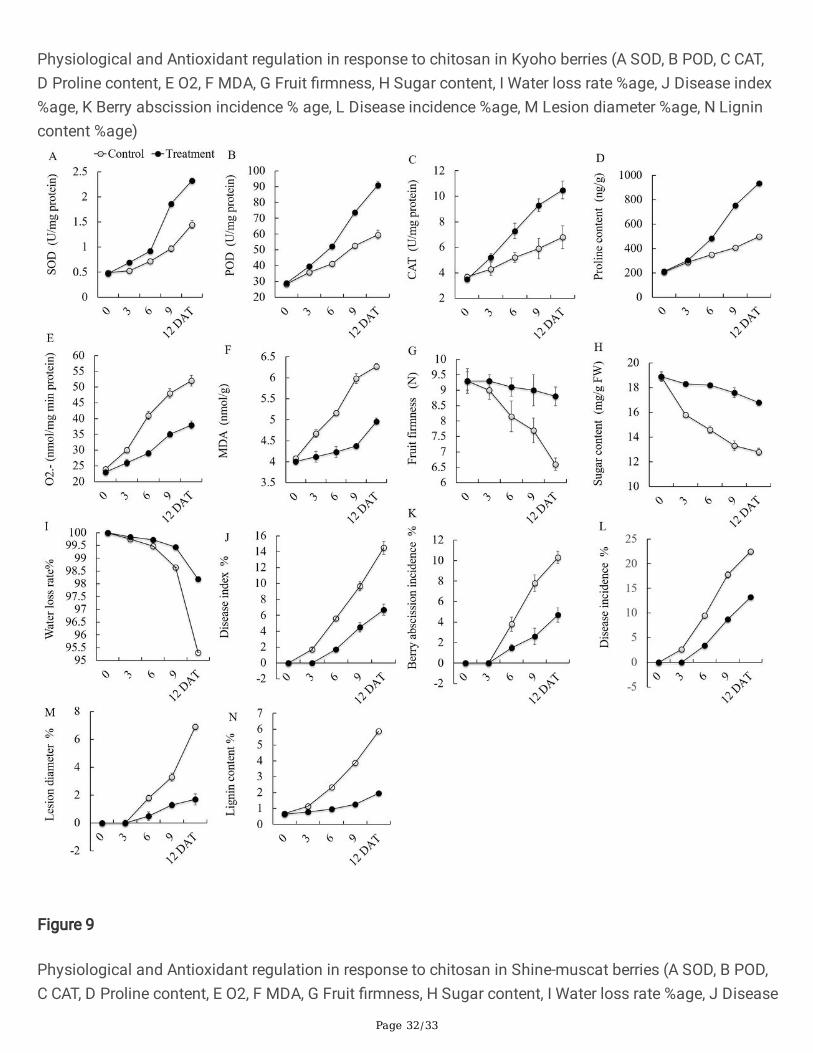
The application of chitosan on grape berries showed a positive impact on the regulation of antioxidantswith the time lapse. The results showed that with the increase in time period and infection theantioxidants activities were higher as shown in Figure 9 and 10. In case Kyoho, SOD in treated sampleswere increased as compared with control up to 12 days (i.e. 0.81U/mg protein), POD also showedincreasing trend with the increase in time, and after 12 days the value was 71.7 U/mg as compared withcontrol i.e. 42.7, CAT was also increased up to 8.5 u/mg. Proline content was increased up to 722 ng/g,O2 45 nmol/mg and MDA was 7.32 nmol/g. However, in Shine-Muscat, the antioxidant trend was almosthigher than the Kyoho, for SOD 2.33 U/mg, which was more than Kyoho. POD 91.2 U/mg and CAT was10.5 U/mg, proline content 937 ng/g and reactive O2 38 nmol/mg min protein, which is lower than Kyoho,MDA 4.96 nmol/g, is almost half than Kyoho and higher than control (Fig. 9).
The fruits samples were also assessed for physiological parameters, in which a signi�cant differencewas observed as compared to control. In Kyoho berries fruit samples fruit �rmness was 5.8N, water lossrate 98.495%, disease index 11.9%, berry abscission incidence 13.6% was recorded. However, diseaseincidence 20.8%, lesion diameter 3.7% was decreased and lower than control i.e. 23.5% and lignin content4.98% was recorded (Fig.10 ). In case of Shine-muscat fruit �rmness was 8.8 N, water loss rate 98.181%,and disease index 6.7%, berry abscission incidence 4.7%, disease incidence 13.2%, lesion diameter 1.7%and lignin content 5.87% was recorded (Fig.10).
DiscussionAlthough the research on resistance to B. cinerea has been carried out extensively, in postharvest fruits isrelatively few. Generally, Sulfur dioxide fumigation is used to treat grapes to prevent disease infection, butexcessive sulfur is harmful to human body, and is prone to sulfur pollution, resulting in the decline ofgrape quality after harvest. Chitosan, a polysaccharide polymer and harmless to human body,have beenreported to reduce B. cinerea during pre-harvest and postharvest treatments, and to modulate selecteddefense genes[31, 32]. In pathways signal transduction produced by transcription factors, which couldactivate a number of genes expression, with the subsequent physiological events, frequently connectingchanges in cell-wall structure, ion �uxes, de novo production of synthesis of phytoalexins, pathogenesis-related (PR) and reactive oxygen species (ROS) proteins production [33, 34]. However, the signalingpathways regulate comprehensive resistance and several component networks with typical schemes(Pieterse, 2009). Grapes are widely grown in the world, it plays an important role in people's life, therefore,postharvest disease resistance and fresh-keeping are becoming more and more important to realize the
Page 11/33
economic value of grapes. The studies of molecular mechanism of chitosan in induction of grape fruitresistant against B. cinerea infection was very useful for chitosan extensive application and improvementof application measures. To elucidate the whole transcriptional changes with the chitosan in grapes,following pre-harvest application of growth elicitors to the berries, transcriptome data were generated andvalidated by RT-qPCR. In the transcriptome, we found many disease-resistance genes changes afterchitosan application, and the MeJA biosynthesis genes, such as AOS, OPR3, were increased. MeJA is aimportant disease-resistance factor during fruit development, we propose that chitosan induced MeJAproduction in resistance against B. cinerea. Meantime, metabolomics analysis showed that manysubstances were changed after chitosan application that responded to B. cinerea infection. We found alot of metabolism, in transcriptome-metabolomics association analysis, were affected from genesexpression to metabolism production, suggesting that chitosan indeed in�uenced many diseaseresistance signal pathway in protection grape fruit from B. cinerea infection. These above is in accordwith that the chitosan decreased the B. cinerea infection compared to the water treatment, and the Shine-Muscat grape had more resistance against the B.cinerea, suggesting that chitosan could protect thegrape from disease infection in molecular and physiological levels. Therefore, the molecular mechanismof chitosan in resistance to B.cinerea was very important for revealing the effects of chitosan inprotection grape from disease infection.
After screening differential genes enrichment analysis was conducted to study the distribution ofdifferential genes in Gene Ontology in order to clarify the expression of gene differences in theexperiments (Fig.4). The principle of ordinary GO enrichment analysis is hypergeometric distribution. Thehypergeometric distribution relationship between these differential genes and some speci�c branches inthe GO classi�cation is calculated according to the selected differential genes, and a speci�c p-value isobtained through hypothesis veri�cation, either the differential gene is rich in the GO. Enrichmentanalyses depicted that the involvement of GOs were higher in treated samples and lower in control, aswell as in control vs treatment. In case of treated with chitosan the BP group (highest in KT vs KCenriched with 5,595/15,822), signi�cantly enriched terms were biological regulation, cellular processes,and metabolic process, hormonal regulation and plant-pathogen interaction, and these terms are moreimportant to gray mold and disease incident (Fig 4). In the previous reports tomato and Arabidopsistranscriptomic changes in response to B.cinerea stress, and also examine the expression pro�les of B.cinerea-inoculated plants to examine the defense transcriptome and reported genes involved in plantresponses to the pathogenicity[35]. In cellular component group (highest showed in KC vs SC4,139/8,869 followed by KT vs KC 3275/8869), signi�cantly enriched terms included organelle part, cell,extracellular regions, cell part, proteinaceous extract, and apoplast were found. In the molecular functioncategory (KC vs SC 8472/19544 enriched followed by KT vs KC 6663/19544), signi�cantly enrichedterms included transcription factor, transporter activity, transcription factor activity, coenzymes binding, catalytic, binding, nucleic acid binding and transducer activity. RNAseq data and GO analysis exposedplasma membrane, oxidoreductase activity, and transport as main categories induced [36]. Chitosan alsoenriches transport GO functions, respiration and oxidative metabolism in the model yeastSaccharomyces cerevisiae[37].

Page 12/33
The samples analyzed in control (KC vs SC) for pathogen interaction pathway, the total of 150 DEGs wererecorded. In fungal PAMP, the CDPK showed two up-regulated and 8 down-regulated transcripts. Howeverin case of treated samples the up-regulated transcripts were same, but the down-regulated were reduced(4). This shows the interaction of in fungal PAMP the CDPK have a potential role in inducing resistance inberries (S1), T Boller and G Felix [38] also highlighted the importance of PAMPs, which are perceived bythe plant, the basis for the �rst offense of active crop immunity, termed as PAMP-triggered immunity(PTI). As their role expected from plant-pathogen interactions, 14-3-3 proteins undertake substantialchanges succeeding PAMP sensitivity. During the response against fungal and insect attack PAMPchitosan 14-3-3 genes were reported in poplar and in sycamore cell cultures, PAMP induces accumulationof 14-3-3 proteins [39, 40]. Evidently, in A. thaliana 14-3-3κ is the closest homolog in tomato TFT1, whichis a need for PAMP-triggered accumulation of ROS, a reaction intimidated by HopM1. Hence, it has beenwondered that HopM1 suppresses in primary PTI responses, speci�cally PAMP-triggered accumulation ofROS and stomatal closure, through the decline of 14-3-3κ/TFT1, however the direct link to beinvestigated. The facts gathered from various pathosystems and crop species, this suggested that aconspicuous function of 14-3-3 proteins in immunity and defense [41, 42].. In case of KT vs KC, thenumbers of up-regulated transcripts were decreased and the down-regulation is more then up-regulatedtranscripts in FLS2, and same as in case of KV vs ST down-regulated is more then up-regulatedexpression (S1). FLS2 plays a key role in the �g22-mediated stimulation against defense through theMAPK cascade. Anyhow the total detection of �gII-28 appears inadequate to a subset of species in theSolanaceae family, complementary with �g22, which is generally documented across the plant kingdom[45-47]. Plants that showed a de�ciency of FLS2 are more vulnerable to Pseudomonas attack, these�ndings showed that FLS2 can function at an initial growth to interfere with bacterial access into theapoplast [48, 49].
In the case of control the Tryptophan Metabolism, showed more down-regulated genes i.e. in AUX1 (1),TIR1 (2), AUXIAA (11), ARF (3), GH3 (1), SAUR (6). While in comparison with treatment the expressionpattern was changed with chitosan treatment, namely in AUX1 (3), AUXIAA (6), and SAUR (6) transcriptsup-regulated. This shows that the effect of chitosan on fruit will change the expression levels (S2). Intreated and a control sample of Shine-muscat, Tryptophan Metabolism showed large number of genesdown-regualted in case of AUXIAA (11), ARF (1), GH3 (1), SAUR (5), as same in treated samples (S2).Infungal species, plant-pathogens produce chitosan throughout early infection to elude host defenses, inendophyte Pestalotiopsis sp. CDA produces chitosan oligomers that different in its chitin substrates nolonger provoke plant resistance[50, 51][52]. The nematophagous fungus Pochonia chlamydosporiaaccumulate chitosan through Meloidogyne javanica egg infection. Overexpresses of chitosanase andCDA encoding genes during this process in fungs. The action of the catalytic center of a CDA encoded inthe Pochonia chlamydosporia genome recently documented and proven experimentally [53, 54]. As earlyreported by F Lopez-Moya, M Suarez-Fernandez and LV Lopez-Llorca [54], chitosan is one of plantdefense modulator, and encourages Auxin production in A. thaliana roots. This polymer is sources ofoverexpression in the biosynthetic pathway of tryptophan-dependent auxin. It also able to blocks auxintranslocation in the root system. Furthermore, some fungal and bacterial pathogens accumulate CKs.

Page 13/33
more alike Auxs. CKs suppress resistance reactions (such as HR) to Pseudomonas savastanoi, chitosanapplication also stimulated both callose apposition and ABA accumulated in leaf tissues [55, 56].
The most relevant secondary metabolites were regulated by chitosan in treated samples with the higherexpression, as like in case of Biotin metabolism, Arginine and proline metabolism, Tryptophan, Terpenes,Zeatin, Alkaloids, Glycolysis / Gluconeogenesis synthesis. The capacity of Antioxidant in fruit wasincreased, the expression pattern is directly or indirectly reliant on the level of �avonoid classes, such asanthocyanins and �avonols [57]. Improved health bene�ts of fruit can be acquired since eminent levels ofsecondary metabolites. Induction of gene expression in strawberries related to growth and overproductionof secondary metabolites is the important objective for the future study. The use of syntheticchitosan/agrochemicals will enhance the quality and quantity of fruit and higher contents of secondarymetabolites. Chitosan application enhanced growth and also triggered the accumulation of phenolicsecondary metabolites in fruits [58]. Y He, S Bose, W Wang, X Jia, H Lu and H Yin [59] also suggested thatthe chitosan application will not only trigger plant immunity, but also in�uences the accumulation ofseveral secondary metabolites. Furthermore, chitosan also improved the cell wall structure and controlledgene expression of speci�c signi�cant enzymes convoluted in cell wall degradation and ethylenecompound biosynthesis.
In the present study, we observed the clear difference of expressions in control and treated samples inGeneral Transcription factors, mainly in TFIID (TAF7, TAF5, TAF6, TAF13), which showed most of up-regulated transcripts as compared to the treated sample. However, in comparison with KT vs KC () theexpression levels were higher (TFIIB, TAF1, TAF6, TAF4, TAF10, TFIIH4), than only treated samples (S3).As predictable, the metabolites involved in metabolic pathways also showed different expression levels. The gene-speci�c transcription factors binding leads to the conscription of adaptor complexes mainlyMediator or SAGA, both of which in turn expedites binding of general transcription factors (GTFs). In theprecious investigation, it is clear that chitosan act as growth elicitor and antifungal activities tosynthesizing multiple Transcription factor (TFIIB) is an important constituent of the RNA polymerase IIinstigation complex. TFIIB transmits out two major tasks: i.e. helps to recruit RNA polymerase II into theinitiation complex and it cooperates directly with the TATA-binding protein. The sequence of TFIIB revealsa budding zinc-binding domain and a defective repetition of almost seventy amino acids [60]. Initiallywas a fast and later on steady Cin5p-mediated response. Transcription factor Cin5p/Yap4p intricate inresponses against various stresses. CIN5 deletion led to improved chitosan sensitivity [61]. The GTFs(TFIIA, TFIIB, TFIID, TFIIE, TFIIF, and TFIIH) each plays a speci�c function. e.g., TFIIA and TFIIB areresponsible for the locating of Pol II to the promoter [62]. The identi�ed transcripts in chitosan regulationduring fungal attack at biochemical, molecular, cellular level are presented. The results also depicted theco-regulated genes in metabolome and transcriptional changes during the gray mold attach and chitosanapplication in fruits.
In the present study, we also found the antioxidant activates are regulated by chitosan and with theincrease in time the SOD, CAT, POD, and purine activities was signi�cantly higher in both varieties. Usually, ROS metabolism is regulated by a number of enzymes mostly including POD, APX, CAT, and SOD.

Page 14/33
H2O2 is also destroyed primarily by CAT and APX. It was documented fact that the application ofchemical can increase in H2O2 content is mediated by a reticence of CAT and APX in many crops [63].This evidence led to the importance of chitosan against the attack of gray mold on berries and plays as abarrier and increases the pathogen incidence.
ConclusionPresented results emphasize on In the present comparative study of metabolome and transcriptomepro�ling of the defense, responsive pathways. and genes were evaluated,. weWe described the controland treated grape berries of Shine-muscat and Kyoho against B. cinereagray mold attack. The resultsdepicted that at gene level expression was vary at different levels, and the most effective in case of plant-pathogen interaction, Chitosan is seen to be more effective in both varieties and it acts as an anti-fungalagent. The transcriptomic study also con�rmed that at the transcriptome level expression was higher intreated samples as compared to control, however in general transcription factor have not much affectedwith chitosan application. There is a need to more in-depth investigation of genes and genes pro�ling.The identi�ed transcripts in this study will be more helpful to understand the mechanism in chitosanregulation during fungal attack at biochemical, molecular, cellular level. The results also depicted the co-regulated genes in metabolome and transcriptional changes during the gray mold attach and chitosanapplication in fruitsfruits. (Fig. 10) and differentially expressed transcripts were validated via qrtPCRtechnique (Fig. 10).
Methods
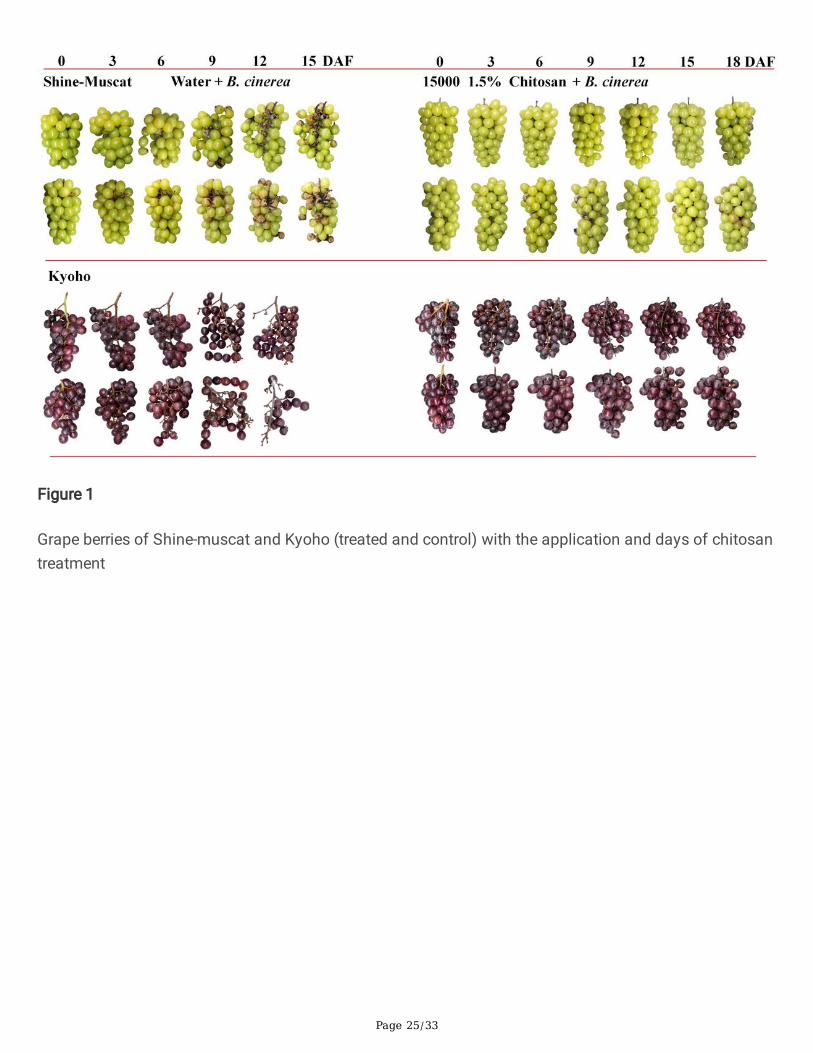
Grape berry treatment with Resistance Inducers ChitosanTwo Grape varieties Grapes (Shine-muscat and Kyoho) were gown at experimental �led �eld NanjingAgricultural University, Nanjing China. Two Grape verities The samples were treated with resistanceinducers chitosan (15 kDa), the physiological changes in the grape berry were analyzed at 80–90 %physiologically maturities, with commercial grade chitosan, and formulations were applied by foliarspray: 15% (w/v) chitosan (15 kDa) (15% (w/v) chitosan 15 kDa Fig.1). To prepareformulationsFormulations were prepared with, we used distilled water as a control. Each berry of grapy istreated as one replication and each replication is repeated together and randomized 3 times. One daylater, Botrytis cinerea spores with 104 /μl concentration were usedapplied. The gray mold fungus wasgrown on grape berries at 25 °C, and with 95 % relative humidity. Spores were washed from the fruitfollowed by15 days with distilled water with 0.01 % Tween 20. Later on, a number of spores are added tothe inoculation solution at the proper concentration. The control and chitosan-treated grape fruits wereincubated in inoculation solution which containing 104 ssporesspores in 1μl for 5 min. Then the grapeberries were incubated on paper at 25 °C under 95 % relative humidity. Relative humidity (95–100 %) wasmaintained by covered with plastic �lm. The Infection infestation status was checkedtested by countingthe total number of lesions on each fruit surface on a daily bases. Counting of biomass on the grape

Page 15/33
fruits (Table 1). Antioxidants were extracted from For extraction of antioxidants, 0.5 g of berries were andcrushed into 5 ml of 50 mm phosphate buffer with in an ice bath. After centrifuging supernatant wasextracted and homogenate for 20 mints at 18,928g (4 °C), which was used for assays of enzymeactivities as outlined as described by S Verma and R Dubey [64]. The activities of antioxidant enzymeswere quanti�ed by the following methods mention by Haider et al., [65]. Aftertreated with Botrytis cinereawe collected samples for each treatment and control (Fig.1), and frozen in liquid nitrogen, followed bydeposited at –80°C for further RNA-seq and experimental use.
Sample Preparation of for Scanning Electron Microscope MicroscopySamplesThe samples was were treated by O”Connell ‘s method: the sample was �xed at room temperature withglutaraldehyde of 3%–4% volume fraction for 4–6 hours, washed with phosphate buffer (PBS, pH 6.8) for4–6 times at intervals of 20–30 minutes, then dehydrated gradient with series of acetone (volumefraction 30%, 50%, 70%, 80%, 90%, 95%, and 100%) at intervals of 30 minutes, of which 100% acetonedehydrated three times and pure acetic acid. Isoamyl ester was replaced twice, 30 minutes each time. Thecritical point of CO2 was dry, sticky and coated. The samples were observed and photographed underJSM–6360LV scanning electron microscope[66].
RNA Extraction, cDNA library construction, and Illumina deep SeqTotal RNA was extracted from three biological fruit replicates, all samples including each treatment andcontrol; we also used control for both spartanly separately as for Kyoho and Shine-muscat. RNAextraction was done by using Trizol (Invitrogen, Carlsbad, CA, USA) reagent method and consequentlyrecycled for mRNA re�nement and library construction with the Ultra™ RNA Library Prep Kit for Illumina(NEB, USA) following the manufacturer’s instructions. The treated and control samples were sequencedon an Illumina Hiseq™2000. Sequencing was completed by the Beijing Nuohe Zhiyuan Technology Co.,Ltd. Beijing, China. After the sample was tested, the mRNA was enriched by binding of the A-Tcomplementary pairing to the clone A tail of the mRNA using magnetic beads with Oligo (dT).Subsequently, the fragmentation buffer was used to break the mRNA into short fragments. Using mRNAas a template, a single-strand cDNA was synthesized using random hexamers, and then double-strandedcDNA was synthesized by adding buffer, dNTPs and DNA polymerase I, followed by AMPure. XP beadspuri�ed double-stranded cDNA. The puri�ed double-stranded cDNA was subjected to terminal repair, A tailwas added and the sequencing linker was ligated, and then AMPure XP beads were used for fragmentsize selection, and �nally, PCR enrichment was performed to obtain a �nal cDNA library. The raw imagedata �les obtained by high-throughput sequencing (Illumina HiSeqTM) are converted into the originalsequencing sequence by CASAVA Base Calling analysis. We call it Raw Data or Raw Reads, and the resultis FASTQ.
Page 16/33
The sequences reads were mapped to a grape reference genome(ftp://ftp.ensemblgenomes.org/pub/plants/release–32/fasta/vitis_ vinifera/) for further analysis usingTopHat v2.0.9 and Bowtie. To functionally annotate genes, the unique sequences were annotated againstpublic databases, including the National Center for Biotechnology Informationnon-redundantprotein(Nr)(http://www.ncbi.nlm.nih.gov/) and Swiss-Prot (http://www.expasy.ch/sprot/), Gene Ontology (GO), andKyoto Encyclopedia of Genes and Genomes (KEGG) [67] databases.
Cluster AnalysisThe read numbers mapped to each gene were counted using HTSeq v0.6.17. Raw counts of the geneswere normalized to the fragments per kilobase of transcript per million mapped reads (FPKM). Theaverage FPKM value of each gene was calculated and transformed to two as the log base. Theexpression patterns of all the genes both in the treatment and the control were characterized by TCseq[68].
Differential Gene Expression AnalysisThe FPKM value was employed to quantify the gene expression levels. The DEseq [67] was used toidentify differentially expressed genes (DEGs) from RNA-seq data. The thresholds for the significance testwere set as a false discovery rate (FDR)≤0.01 and |Fold Change|≥2 [68]. The enrichment analysis of GOand KEGG were done using Cluster Profiler [68].
Functional AnalysisThe hypergeometric distribution relationship between differentially expressed genes and some speci�cbranches in the GO classi�cation is calculated according to the selected differential genes, and a speci�cp-value is obtained through hypothesis veri�cation. Whether the differential gene is enriched in the GO.Software approach used in our analysis of GO enrichment analysis is GO seq [23], which is based on theWallenius non-central hypergeometric distribution. Compared to the ordinary hypergeometric distribution,this distribution is characterized by the fact that the probability of extracting an individual from a certaincategory is different from the probability of extracting an individual from outside a certain category, andthe probability is different. It is estimated by estimating the length of the gene so that the probability ofGO term being enriched by differential genes can be calculated more accurately.
Pathway Signi�cant Enrichment Analysis Using Pathway in the KEGG database, hypergeometric testswere applied to �nd Pathway that was signi�cantly enriched in differentially expressed genes comparedto the entire genome background. Calculated as follows:

Page 17/33
Here N is the number of genes with Pathway annotation in all genes; n is the number of differentiallyexpressed genes in N; M is the number of genes annotated as a particular Pathway in all genes; m is thenumber of differentially expressed genes annotated as a particular Pathway. When FDR ≤ 0.05, itindicates that the differential gene is signi�cantly enriched in the Pathway. Signi�cantly enriched KEGGpathways were identi�ed with KO-based annotation system (KOBAS) 2.0 [67], using the p-value.
Extraction, Identi�cation, and Quanti�cation of MetaboliteThe grape berries were placed on ice, and 50% methanol buffer is used for metabolites extraction. Brie�y,samples of 20 μl were extracted with precooled 50% methanol of 120 μL, and carried out vortexed for 1min, followed by incubation at room temperature (10 min); after that, the extracted mixture kept overnightat −20 °C. Aand centrifuged at 4000× g for 20 min, and supernatants were moved into new plates having96-well as followed by the methods of Y Li, J Fang, X Qi, M Lin, Y Zhong, L Sun and W Cui [68].
LC-MS raw data into the mzXML format by using MS Convert, followed by the XCMS, metaX toolbox, andCAMERA, employed in the R software. The RT (combined retention time) and m/z data were used topinpoint each ion [68–70]. To elucidate the biological functions, physical and chemical properties ofmetabolites, the available PLANTCYC (http://www.plantcyc.org/), KEGG (http://www.kegg.jp/) and in-house (http://spldatabase.saskatoonlibrary.ca/), HMDB (http://www.hmdb.ca/) databanks were used toperform level-one and level-two identi�cation and annotation as described by Y Li, J Fang, X Qi, M Lin, YZhong, L Sun and W Cui [68]. Screening and quantitative analysis for differential metabolites wereconducted using metaX software (http://metax.genomics.cn/) as mentioned by [68, 71]. In order to beable to correlate with the transcription sample, �rst made the number of samples consistent, transcribeeach comparison to 3 repetitions, and metabolize each comparison to 6 replicates, in order to eliminateData is standardized by the magnitude of the impact.
qRT-PCRTo validate the expression patterns by qRT-PCR, we used to control and treated samples for both grapeverities varieties at the developmental stages of berries. PrimeScript RT Reagent Kit with gDNA Eraser(Takara, China) is used to purify RNA samples and reverse-transcribed using the following themanufacturer’s protocol. Thirteen representative random transcripts were selected for the qRT-PCR assayand carried out as described earlier by Pervaiz et al., 2016 [25]. Gene-speci�c primers were designed usingPrimer3 (http://primer3.ut.ee/) software, as mentioned in supplementary �les S1.
Statistical AnalysisStatistical analysis was performed using SPSS statistic 21.0 software (IBM, Armonk, NY, USA). One-wayanalysis of variance (p≤0.05) was conducted. Data are means±SE from three independent biologicalreplicates.
Page 18/33
AbbreviationsSMC: Shine-muscat control
SMT:Shine-muscat Treated
KYC:Kyoho control
KYT:Kyoho Treated
SOD:Superoxide dismutase
POD: Peroxidase
MAD: Malonaldhyde
CAT: Catalase
Declarations
Con�ict of interest/>Competing InterestsThere is no con�ict of interest between authors
Consent to publish:Not Applicable
Ethics approval and consent to participateIn this study dose not need any ethicl approval
Data StatementPresent data is submitted to NCBI: with accession numberGSE129046:https://www.ncbi.nlm.nih.gov/geo/query/acc.cgi?acc = GSE129046
Author’s contributionExperimental design and research work carried out by: HJ, PZ, MSH, Data analyzed by: HJ and TP,Contributed materials/analysis tools: SL, and X, Article write up: TP, HJ, JF
Page 19/33
AcknowledgmentsThis work is supported by grants from National Natural Science Foundation of China (31872938),Foundation for Distinguished Young Talents in Jiangsu (BK20180076), Fundamental Research Funds forthe Central Universities KYZ201736
References1.OIV: Statistical report on world vitiviniculture. 2018.
2.Haider MS, Kurjogi MM, Khalil-Ur-Rehman M, Fiaz M, Pervaiz T, Jiu S, Haifeng J, Chen W, Fang J:Grapevine immune signaling network in response to drought stress as revealed by transcriptomicanalysis. Plant Physiology and Biochemistry 2017, 121:187–195.
3.Jiménez S, Dridi J, Gutiérrez D, Moret D, Irigoyen JJ, Moreno MA, Gogorcena Y: Physiological,biochemical and molecular responses in four Prunus rootstocks submitted to drought stress. Treephysiology 2013, 33(10):1061–1075.
4.Haider MS, Zhang C, Kurjogi MM, Pervaiz T, Zheng T, Zhang C, Lide C, Shangguan L, Fang J: Insightsinto grapevine defense response against drought as revealed by biochemical, physiological and RNA-Seqanalysis. Scienti�c reports 2017, 7(1):13134.
5.Giovannoni JJ: Genetic regulation of fruit development and ripening. The plant cell 2004, 16(suppl1):S170-S180.
6.Kleemann J, Rincon-Rivera LJ, Takahara H, Neumann U, van Themaat EVL, van der Does HC, HacquardS, Stüber K, Will I, Schmalenbach W: Sequential delivery of host-induced virulence effectors byappressoria and intracellular hyphae of the phytopathogen Colletotrichum higginsianum. PLoSpathogens 2012, 8(4):e1002643.
7.Reglinski T, Elmer P, Taylor J, Wood P, Hoyte S: Inhibition of Botrytis cinerea growth and suppression ofbotrytis bunch rot in grapes using chitosan. Plant pathology 2010, 59(5):882–890.
8.Pezet R, Viret O, Perret C, Tabacchi R: Latency of Botrytis cinerea Pers.: Fr. and biochemical studiesduring growth and ripening of two grape berry cultivars, respectively susceptible and resistant to greymould. Journal of Phytopathology 2003, 151(4):208–214.
9.Cabrera JC, Messiaen J, Cambier P, Van Cutsem P: Size, acetylation and concentration ofchitooligosaccharide elicitors determine the switch from defence involving PAL activation to cell deathand water peroxide production in Arabidopsis cell suspensions. Physiologia plantarum 2006, 127(1):44–56.

Page 20/33
10.Wang Y, He H, Zhou Y: Effect of different molecular weight chitosan on several physiological andbiochemical characteristics related with plant defense reaction. Plant Physiology Communications 2006,42(6):1109.
11.Mhurchu CN, Dunshea‐Mooij C, Bennett D, Rodgers A: Effect of chitosan on weight loss in overweightand obese individuals: a systematic review of randomized controlled trials. Obesity reviews 2005,6(1):35–42.
12.Kao C-H, Hsiang C-Y, Ho T-Y: Assessment of chitosan-affected metabolic response by peroxisomeproliferator-activated receptor bioluminescent imaging-guided transcriptomic analysis. PloS one 2012,7(4):e34969.
13.Romanazzi G, Nigro F, Ippolito A, Divenere D, Salerno M: Effects of pre‐and postharvest chitosantreatments to control storage grey mold of table grapes. Journal of Food Science 2002, 67(5):1862–1867.
14.Romanazzi G, Feliziani E, Baños SB, Sivakumar D: Shelf life extension of fresh fruit and vegetables bychitosan treatment. Critical reviews in food science and nutrition 2017, 57(3):579–601.
15.Li P, Linhardt R, Cao Z: Structural characterization of oligochitosan elicitor from Fusariumsambucinum and its elicitation of defensive responses in Zanthoxylum bungeanum. InternationalJournal of Molecular Sciences 2016, 17(12):2076.
16.Pinu F: Grape and wine metabolomics to develop new insights using untargeted and targetedapproaches. Fermentation 2018, 4(4):92.
17.Silva P, Gerós H: Regulation by salt of vacuolar H+-ATPase and H+-pyrophosphatase activities andNa+/H+ exchange. Plant signaling & behavior 2009, 4(8):718–726.
18.Pruitt KD, Tatusova T, Brown GR, Maglott DR: NCBI Reference Sequences (RefSeq): current status, newfeatures and genome annotation policy. Nucleic acids research 2011, 40(D1):D130-D135.
19.Fortes AM, Agudelo-Romero P, Silva MS, Ali K, Sousa L, Maltese F, Choi YH, Grimplet J, Martinez-Zapater JM, Verpoorte R: Transcript and metabolite analysis in Trincadeira cultivar reveals novelinformation regarding the dynamics of grape ripening. BMC plant biology 2011, 11(1):149.
20.Du Z, Zhou X, Ling Y, Zhang Z, Su Z: agriGO: a GO analysis toolkit for the agricultural community.Nucleic acids research 2010, 38(suppl_2):W64-W70.
21.Sweetman C, Wong DC, Ford CM, Drew DP: Transcriptome analysis at four developmental stages ofgrape berry (Vitis vinifera cv. Shiraz) provides insights into regulated and coordinated gene expression.BMC genomics 2012, 13(1):691.
Page 21/33
22.Gutiérrez-Martínez P, Chacón-López A, Xoca-Orozco LA, Ramos-Guerrero A, Velázquez-Estrada R,Aguilera-Aguirre S: Chitosan and Changes in Gene Expression During Fruit–Pathogen Interaction atPostharvest Stage. In: Chitosan in the preservation of agricultural commodities. Elsevier; 2016: 299–311.
23.Young MD, Wake�eld MJ, Smyth GK, Oshlack A: Gene ontology analysis for RNA-seq: accounting forselection bias. Genome biology 2010, 11(2):R14.
24.Kanehisa M, Araki M, Goto S, Hattori M, Hirakawa M, Itoh M, Katayama T, Kawashima S, Okuda S,Tokimatsu T: KEGG for linking genomes to life and the environment. Nucleic acids research 2007,36(suppl_1):D480-D484.
25.Pervaiz T, Haifeng J, Haider MS, Cheng Z, Cui M, Wang M, Cui L, Wang X, Fang J: Transcriptomicanalysis of grapevine (cv. Summer black) leaf, using the illumina platform. PloS one 2016,11(1):e0147369.
26.Upadhyay S, Phukan UJ, Mishra S, Shukla RK: De novo leaf and root transcriptome analysis identi�ednovel genes involved in Steroidal sapogenin biosynthesis in Asparagus racemosus. BMC genomics 2014,15(1):746.
27.Devarenne TP, Martin GB: Manipulation of plant programmed cell death pathways during plant-pathogen interactions. Plant signaling & behavior 2007, 2(3):188–190.
28.Blanco-Ulate B, Morales-Cruz A, Amrine KC, Labavitch JM, Powell AL, Cantu D: Genome-widetranscriptional pro�ling of Botrytis cinerea genes targeting plant cell walls during infections of differenthosts. Frontiers in plant science 2014, 5:435.
29.Davies PJ: The plant hormones: their nature, occurrence, and functions. In: Plant hormones. Springer;2010: 1–15.
30.Doares SH, Syrovets T, Weiler EW, Ryan CA: Oligogalacturonides and chitosan activate plant defensivegenes through the octadecanoid pathway. Proceedings of the National Academy of Sciences 1995,92(10):4095–4098.
31.Feliziani E, Landi L, Romanazzi G: Preharvest treatments with chitosan and other alternatives toconventional fungicides to control postharvest decay of strawberry. Carbohydrate Polymers 2015,132:111–117.
32.Landi L, De Miccolis Angelini RM, Pollastro S, Feliziani E, Faretra F, Romanazzi G: Global transcriptomeanalysis and identi�cation of differentially expressed genes in strawberry after preharvest application ofbenzothiadiazole and chitosan. Frontiers in plant science 2017, 8:235.
33.Landi L, Feliziani E, Romanazzi G: Expression of defense genes in strawberry fruits treated withdifferent resistance inducers. Journal of Agricultural and Food Chemistry 2014, 62(14):3047–3056.
Page 22/33
34.van Loon LC, Rep M, Pieterse CM: Signi�cance of inducible defense-related proteins in infected plants.Annu Rev Phytopathol 2006, 44:135–162.
35.Kong W, Chen N, Liu T, Zhu J, Wang J, He X, Jin Y: Large-scale transcriptome analysis of cucumberand Botrytis cinerea during infection. PloS one 2015, 10(11):e0142221.
36.Lopez-Moya F, Kowbel D, Nueda MJ, Palma-Guerrero J, Glass NL, Lopez-Llorca LV: Neurospora crassatranscriptomics reveals oxidative stress and plasma membrane homeostasis biology genes as keytargets in response to chitosan. Molecular BioSystems 2016, 12(2):391–403.
37.Jaime MD, Lopez-Llorca LV, Conesa A, Lee AY, Proctor M, Heisler LE, Gebbia M, Giaever G, WestwoodJT, Nislow C: Identi�cation of yeast genes that confer resistance to chitosan oligosaccharide (COS) usingchemogenomics. BMC genomics 2012, 13(1):267.
38.Boller T, Felix G: A renaissance of elicitors: perception of microbe-associated molecular patterns anddanger signals by pattern-recognition receptors. Annual review of plant biology 2009, 60:379–406.
39.Malerba M, Crosti P, Cerana R: Defense/stress responses activated by chitosan in sycamore culturedcells. Protoplasma 2012, 249(1):89–98.
40.Lapointe G, Luckevich MD, Cloutier M, Séguin A: 14‐3‐3 gene family in hybrid poplar and itsinvolvement in tree defence against pathogens 1. Journal of experimental botany 2001, 52(359):1331–1338.
41.Lozano-Durán R, Robatzek S: 14–3–3 proteins in plant-pathogen interactions. Molecular Plant-Microbe Interactions 2015, 28(5):511–518.
42.Lozano‐Durán R, Bourdais G, He SY, Robatzek S: The bacterial effector HopM1 suppresses PAMP‐triggered oxidative burst and stomatal immunity. New Phytologist 2014, 202(1):259–269.
43.Liu J, Ding P, Sun T, Nitta Y, Dong O, Huang X, Yang W, Li X, Botella JR, Zhang Y: Heterotrimeric Gproteins serve as a converging point in plant defense signaling activated by multiple receptor-like kinases.Plant physiology 2013, 161(4):2146–2158.
44.Liu X, Yang S, Zhao M, Luo M, Yu C-W, Chen C-Y, Tai R, Wu K: Transcriptional repression by histonedeacetylases in plants. Molecular plant 2014, 7(5):764–772.
45.Clarke CR, Chinchilla D, Hind SR, Taguchi F, Miki R, Ichinose Y, Martin GB, Leman S, Felix G, VinatzerBA: Allelic variation in two distinct Pseudomonas syringae �agellin epitopes modulates the strength ofplant immune responses but not bacterial motility. New Phytologist 2013, 200(3):847–860.
46.Albert M, Jehle AK, Lipschis M, Mueller K, Zeng Y, Felix G: Regulation of cell behaviour by plantreceptor kinases: Pattern recognition receptors as prototypical models. European journal of cell biology2010, 89(2–3):200–207.

Page 23/33
47.Asai T, Tena G, Plotnikova J, Willmann MR, Chiu W-L, Gomez-Gomez L, Boller T, Ausubel FM, Sheen J:MAP kinase signalling cascade in Arabidopsis innate immunity. Nature 2002, 415(6875):977.
48.Zipfel C, Robatzek S, Navarro L, Oakeley EJ, Jones JD, Felix G, Boller T: Bacterial disease resistance inArabidopsis through �agellin perception. Nature 2004, 428(6984):764.
49.Abramovitch RB, Anderson JC, Martin GB: Bacterial elicitation and evasion of plant innate immunity.Nature Reviews Molecular Cell Biology 2006, 7(8):601.
50.Sanchez-Vallet A, Mesters JR, Thomma BP: The battle for chitin recognition in plant-microbeinteractions. FEMS microbiology reviews 2015, 39(2):171–183.
51.Pusztahelyi T: Chitin and chitin-related compounds in plant–fungal interactions. Mycology 2018,9(3):189–201.
52.Cord-Landwehr S, Melcher RL, Kolkenbrock S, Moerschbacher BM: A chitin deacetylase from theendophytic fungus Pestalotiopsis sp. e�ciently inactivates the elicitor activity of chitin oligomers in ricecells. Scienti�c reports 2016, 6:38018.
53.Aranda-Martinez A, Grifoll-Romero L, Aragunde H, Sancho-Vaello E, Biarnés X, Lopez-Llorca LV, PlanasA: Expression and speci�city of a chitin deacetylase from the nematophagous fungus Pochoniachlamydosporia potentially involved in pathogenicity. Scienti�c reports 2018, 8(1):2170.
54.Lopez-Moya F, Suarez-Fernandez M, Lopez-Llorca LV: Molecular Mechanisms of Chitosan Interactionswith Fungi and Plants. International journal of molecular sciences 2019, 20(2):332.
55.Robert-Seilaniantz A, Navarro L, Bari R, Jones JD: Pathological hormone imbalances. Current opinionin plant biology 2007, 10(4):372–379.
56.Iriti M, Faoro F: Abscisic acid is involved in chitosan-induced resistance to tobacco necrosis virus(TNV). Plant Physiology and Biochemistry 2008, 46(12):1106–1111.
57.Heinonen IM, Meyer AS, Frankel EN: Antioxidant activity of berry phenolics on human low-densitylipoprotein and liposome oxidation. Journal of Agricultural and Food Chemistry 1998, 46(10):4107–4112.
58.Rahman M, Mukta JA, Sabir AA, Gupta DR, Mohi-Ud-Din M, Hasanuzzaman M, Miah MG, Rahman M,Islam MT: Chitosan biopolymer promotes yield and stimulates accumulation of antioxidants instrawberry fruit. PloS one 2018, 13(9):e0203769.
59.He Y, Bose S, Wang W, Jia X, Lu H, Yin H: Pre-Harvest treatment of chitosan oligosaccharides improvedstrawberry fruit quality. International journal of molecular sciences 2018, 19(8):2194.
60.Buratowski S, Zhou H: Functional domains of transcription factor TFIIB. Proceedings of the NationalAcademy of Sciences 1993, 90(12):5633–5637.
Page 24/33
61.Zakrzewska A, Boorsma A, Brul S, Hellingwerf KJ, Klis FM: Transcriptional response of Saccharomycescerevisiae to the plasma membrane-perturbing compound chitosan. Eukaryotic Cell 2005, 4(4):703–715.
62.Boorsma A: Dissection of transcriptional regulation networks and prediction of gene functions inSaccharomyces cerevisiae. 2008.
63.Landberg T, Greger M: Differences in oxidative stress in heavy metal resistant and sensitive clones ofSalix viminalis. Journal of Plant Physiology 2002, 159(1):69–75.
64.Verma S, Dubey R: Lead toxicity induces lipid peroxidation and alters the activities of antioxidantenzymes in growing rice plants. Plant Science 2003, 164(4):645–655.
65.Haider MS, Kurjogi MM, Khalil-ur-Rehman M, Pervez T, Songtao J, Fiaz M, Jogaiah S, Wang C, Fang J:Drought stress revealed physiological, biochemical and gene-expressional variations in ‘Yoshihime’peach(Prunus Persica L) cultivar. Journal of Plant Interactions 2018, 13(1):83–90.
66.O’CONNELL R, Chen Y, Zhang H, Zhou Y, Fox D, Maguire P, Wang JJ, Rodenburg C: Comparative studyof image contrast in scanning electron microscope and helium ion microscope. Journal of microscopy2017, 268(3):313–320.
67.Xie C, Mao X, Huang J, Ding Y, Wu J, Dong S, Kong L, Gao G, Li C-Y, Wei L: KOBAS 2.0: a web server forannotation and identi�cation of enriched pathways and diseases. Nucleic acids research 2011,39(suppl_2):W316-W322.
68.Li Y, Fang J, Qi X, Lin M, Zhong Y, Sun L, Cui W: Combined Analysis of the Fruit Metabolome andTranscriptome Reveals Candidate Genes Involved in Flavonoid Biosynthesis in Actinidia arguta.International journal of molecular sciences 2018, 19(5):1471.
69.Kuhl C, Tautenhahn R, Bottcher C, Larson TR, Neumann S: CAMERA: an integrated strategy forcompound spectra extraction and annotation of liquid chromatography/mass spectrometry data sets.Analytical chemistry 2011, 84(1):283–289.
70.Wen B, Mei Z, Zeng C, Liu S: metaX: a �exible and comprehensive software for processingmetabolomics data. BMC bioinformatics 2017, 18(1):183.
71.Khan N, Bano A, Rahman MA, Rathinasabapathi B, Babar MA: UPLC‐HRMS‐based untargetedmetabolic pro�ling reveals changes in chickpea (Cicer arietinum) metabolome following long‐termdrought stress. Plant, cell & environment 2019, 42(1):115–132.
Figures
Page 25/33
Figure 1
Grape berries of Shine-muscat and Kyoho (treated and control) with the application and days of chitosantreatment

Page 26/33
Figure 2
Effect of chitosan treatment on mycelial morphology of grape Botrytis cinerea
Page 27/33
Figure 3
A: Differential gene clustering: The color ranges from red to blue, indicating log10 (FPKM+1). The blueline indicates the average relative expression of all genes in this cluster under different experimentalconditions, the x-axis indicates experimental conditions, and the y-axis indicates relative expression. B:Venn diagram; Venn diagram shows the number of differential genes between the comparison groupsand the overlapping relationship between the comparison groups. C: Differential Expressed genesvolcano map: Genes with signi�cant differential expression were indicated by red dots (up-regulated) andgreen dots (down-regulated). Genes with no signi�cant differential expression were represented by bluedots; abscissas represent fold change of genes in different samples; ordinate represents genes Statisticalsigni�cance of differences in expression changes
Page 28/33
Figure 4
Differentially expressed genes in control and treated samples of Shine- Muscat and Kyoho (Biologicalprocess, Cellular component and Molecular function).
Page 29/33
Figure 5
Differential gene KEGG enrichment scatter plot: The scatter plot is a graphical representation of theresults of the KEGG enrichment analysis. In this �gure, the degree of KEGG enrichment is measured by thenumber of genes, the Qvalue, and the number of genes enriched in this pathway. (1. KC vs SC, 2. KT vsKC, 3. KT vs ST, 4. ST vs SC)

Page 30/33
Figure 6
KEGG Enrich scatterplot; metabolism and transcription kegg enrichment comparison (KYC.vs.SHC Apositive and B negative; KYT.vs.KYC C postive and D negative; KYT.vs.SHT E positiv and F negative;SHT.vs.SHC G Positive and H negative)
Figure 7
Page 31/33
The correlation analysis data of metabolites and genes , The redder the color, the stronger the positivecorrelation, the bluer the color, and the stronger the negative correlation. (KYC.vs.SHC A positive and Bnegative; KYT.vs.KYC C postive and D negative; KYT.vs.SHT E positiv and F negative; SHT.vs.SHC GPositive and H negative correlation)
Figure 8
Page 32/33
Physiological and Antioxidant regulation in response to chitosan in Kyoho berries (A SOD, B POD, C CAT,D Proline content, E O2, F MDA, G Fruit �rmness, H Sugar content, I Water loss rate %age, J Disease index%age, K Berry abscission incidence % age, L Disease incidence %age, M Lesion diameter %age, N Lignincontent %age)
Figure 9
Physiological and Antioxidant regulation in response to chitosan in Shine-muscat berries (A SOD, B POD,C CAT, D Proline content, E O2, F MDA, G Fruit �rmness, H Sugar content, I Water loss rate %age, J Disease

Page 33/33
index %age, K Berry abscission incidence % age, L Disease incidence %age, M Lesion diameter %age, NLignin content %age)
Figure 10
QRT-PCR: The validation of transcripts/genes differential expressed for 13 selected genes, measured byRNA-Seq and qRT-PCR. A; Control vs Shine-muscat and B; Control vs Kyoho.
Supplementary Files
This is a list of supplementary �les associated with this preprint. Click to download.
S3PlanthormonesignaltransductionPathway.xlsx
S2plantpathogeninteraction.xlsx
S5correlatoinTransciptomandmetabolom.xlsx
S4transcriptionfactorspathwa.xlsx
S1QrtPrimers.xlsx
FigS1.jpg