Embed Size (px)
Citation preview

IO C OPYF!~~HARDCCOPY $. o
4~~~X~1?UTE tLCROHICHE $c i
~5F
AIR UNIVERSITYUNITED STATES AIR FORCE
SCHOOL OF ENGINEERING
WRIGHT-PATTERSON AIR FORCE BASE, OPOC
A-WP--SEP 63 3M af U O

EFFECT OF VIBRATION ON HEAT TRANSFERFROM CYLINDERS IN FREE CONNECTION
THEISIS
GA/ME/64-2 David F. NeelyCaot USAF
AF-WP-O-OCT 64 25

EFFECT OF VIBRATION ON HEAT TRANSFERFROM CYLINDERS IN FREE CCOVECTICt
THESIS
Presented to the Faculty of the School of Engineering of the
Air Force Institute of Technology
Air University
in Partial Fulfillment of the
Requirements for the Degree of
Master of Science
by
David F. Neely, B.S.
Capt. USAF
Graduate Astronautics
August 1964

GA/ME/64-2
Preface
This report touches upon the subject of convective heat
transfer. I hope that it will either establish a point of
departure for further study or, more optimistically, provide
some useful engineering design information. However, if
neither of these purposes is served, I can truthfully say
that this research has been of great personal value to me,
for during the last six months I have become humbly reaware
of my own inexperience and of the thrill of learning some-
thing new.
I wish to express my apprec.ation to Dr. Andrew J. Shine,
Head, Department of Mechanical Engineering, Air Force
Institute of Technology. As my thesis advisor, he gave
timely suggestions and encouragement which were invaluable.
Mr. Frank C. Jarvis, my laboratory technician, solved many
practical problems involved with the assembly of equipment.
In addition, he instructed me on the use of the Mach-Zender
interferometer and provided vital assistance during the
interferometer study. Finally, I wish to thank Mr. Millard
W. Wolfe, Foreman, School Shops, Air Force Institute of
Technology. Without his interest and patience this report
would not have been completed on time.
David F. Neely
ii
GA/N4E/64-2
Table of Contents
Page
Preface . . . . .. .. .. .. ... ... .. . ....
List of Figur. ...................... V
List of Symbols .. ........ .. .. .. .. ... .. vii
.Abstract ............ ... ... .. ... ix
I- Introduction ........ ... ....... 1Background. ................. 1Purpose .. ...................Scope .. .. ................. 2Approach ... .. .. .. .. .. .. .... 2Past Studies ... .. .. .. .. .. w....3
Present Study .. ........................ 6
II. Experimental Equipment. ......... . . 8Heat Transfer Apparatus . . .. .. .. .... 8Vibration Apparatus. ............. 10Boundary Layer Study Apparatus ......... 1
III. Measurements. ................ 13Tempaueratur. .. ............. 13Vibration Intensity. ............. 14Power .. ................. 15
IV. Calculation of Losses. .............. 16Line Losses. ................. 16Radiation aind Conduction Losses . . . . . . 17
V. Experimental Procedure .............. 19
VI. Calculation of Parameters .. .. .. ... ... 20
VII. Analysis of Errors ................ 22Power Measurement .. ....... .. ... 22Vibration Intensity. ............. 22Temperature. ........... . . . . . 23Overall Error. ................ 24

GA/ME/64-2
Page
VIII. Results and Correlation ... ............ . 25Variation of the Heat Transfer CoefficientWith Vibration Intensity .......... . 25Correlation With Other Authors ..... ... 27Analysis of the Interferograms .----------- 28
IX. Conclusions and Recommendations ........ . 30
Bibliography ....... .................... 32
Appendix A: Figure ................. 33
Appendix B: Equation Development. .......... .. 50
Appendix C: Sample Calculation .. .......... .. 52
Appendix D: Experimental Data ... ........... . 56
Vita ................... ......... 64
iv

GA/ME/64-2
List of Figures
Figure Page
1 Photograph of the Test Apparatus 34
2 Photograph of the 0.085 Inch Diameter 35Test Cylinder
3 Photograph of the 0.25 Inch Diameter 36Test Cylinder
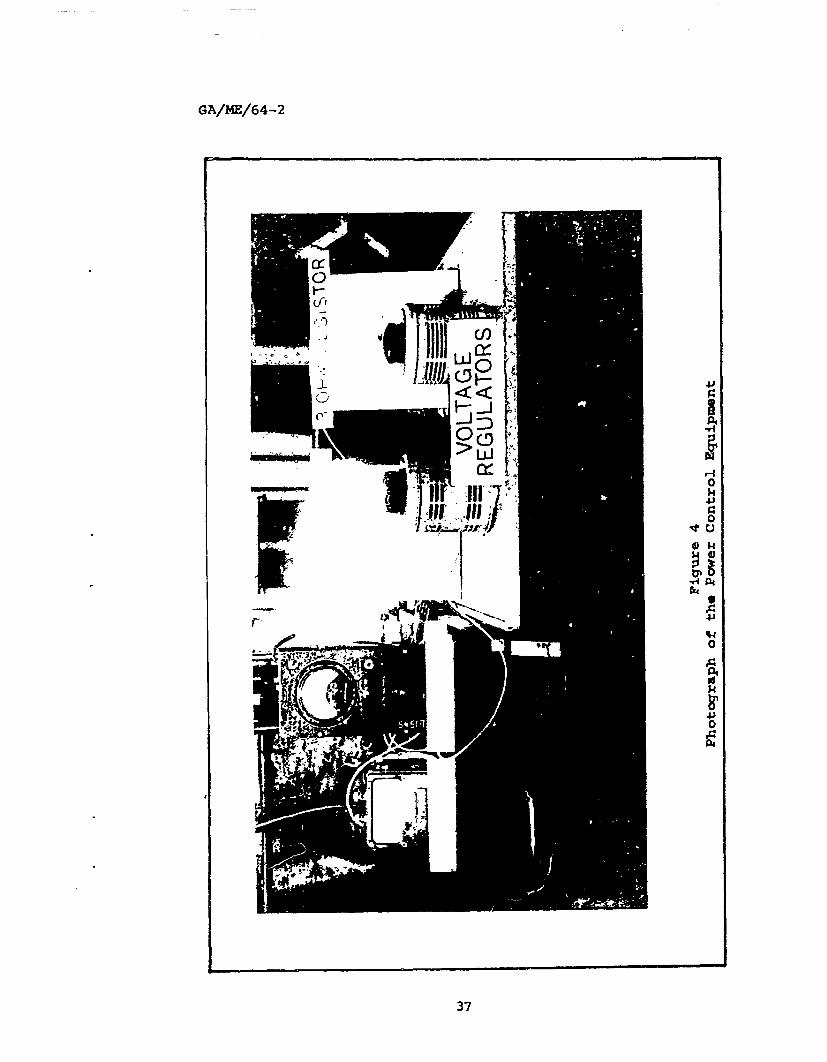
4 Photograph of the Power Control Equipment 37
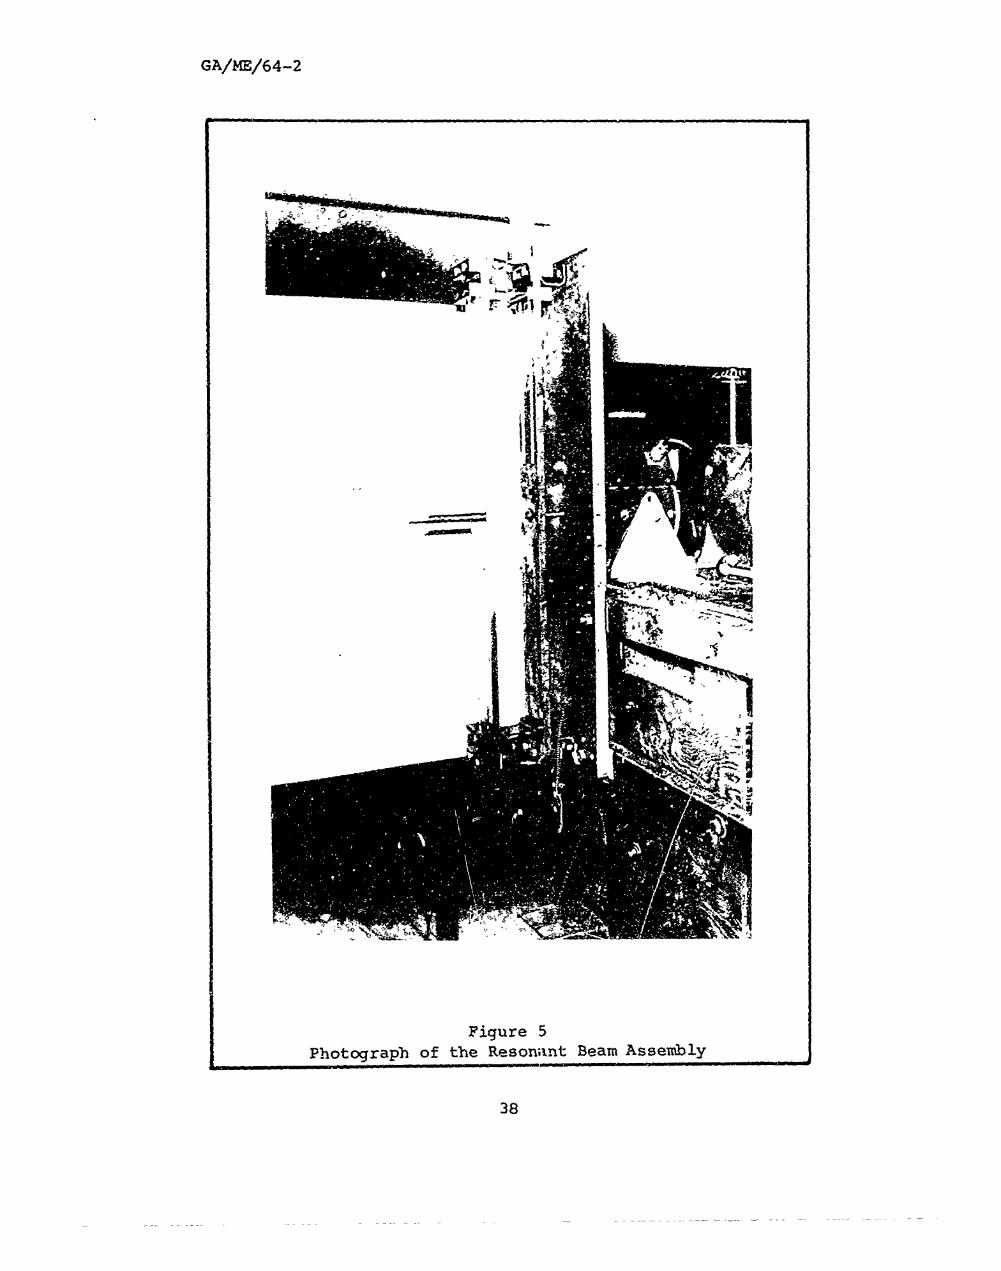
5 Photograph of the Resonant Beam Assembly 38
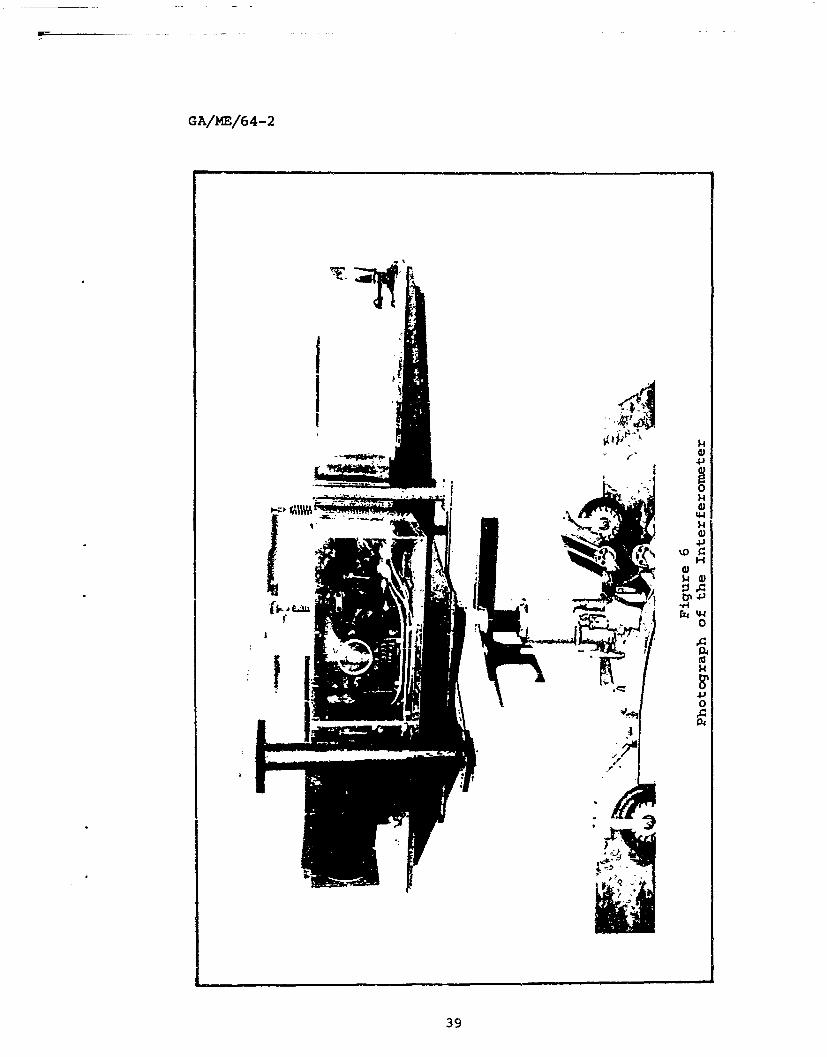
6 Photograph of the Interferometer 35
Variation of Line Resistance with Current 40for the 0.085 Inch Diameter Test Cylinder
8 Variation of Radiation and Conduction 41Losses with Temperature Difference for the0.085 Inch Diameter Test Cy]inder
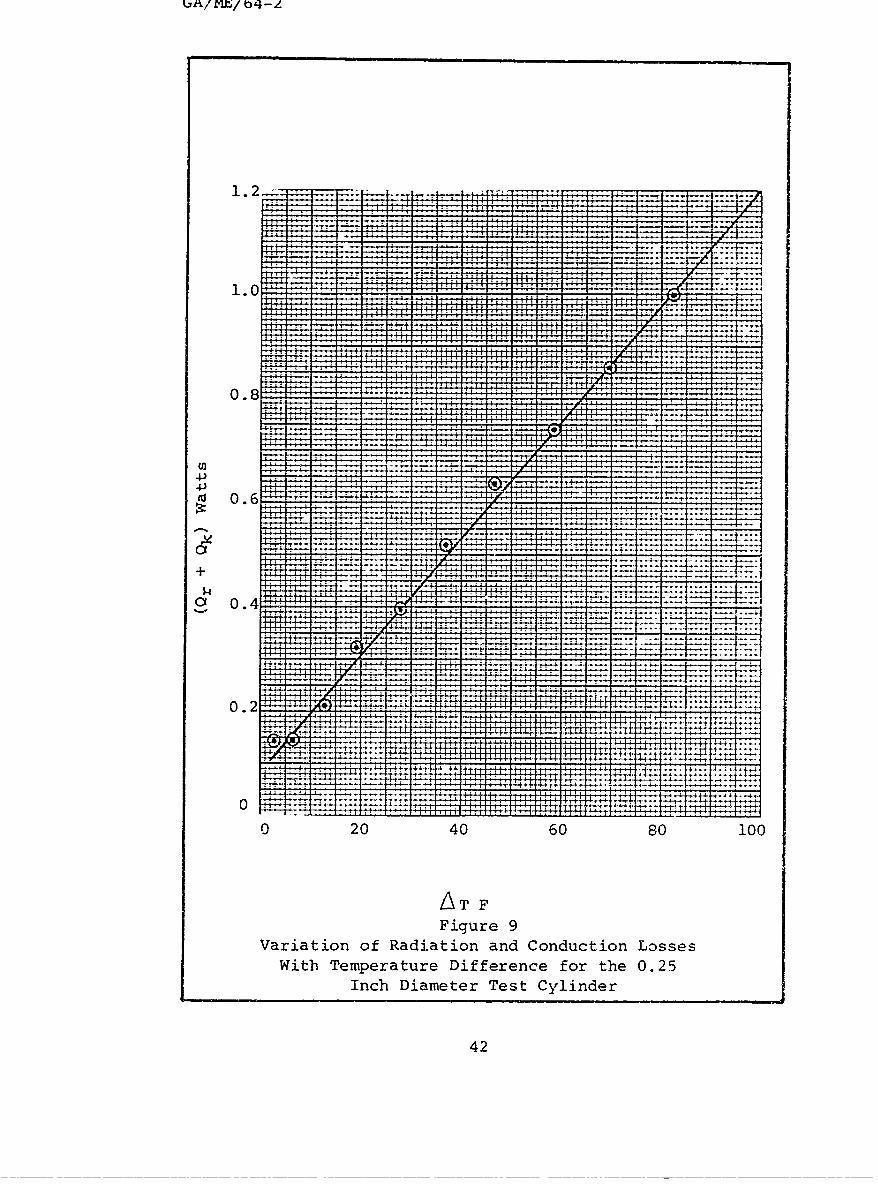
9 Variation of Radiation and Conduction 42Losses with Temperature Difference for the0.25 Inch Diameter Test Cylinder
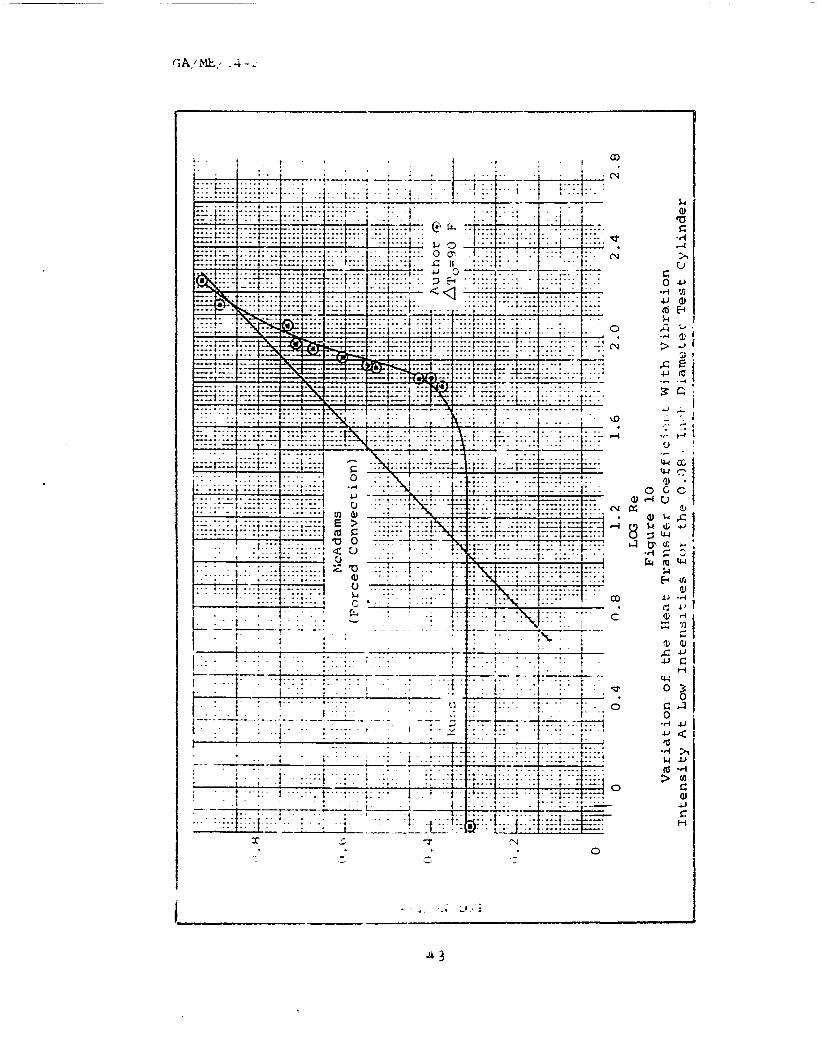
10 Variation of the Heat Transfer Coefficient 43with Vibration Intensity at Low Intensitiesfor the 0.085 Inch Diameter Test Cylinder
11 Variation of the Heat Transfer Coefficient 44with Vibration Intensity at Low Intensitiesfor the 0.25 Inch Diameter Test Cylinder
12 Variation of the Heat Transfer Coefficient 45with Vibration Intensity at High Intensitiesfor the 0.085 Inch Diameter Test Cylinder
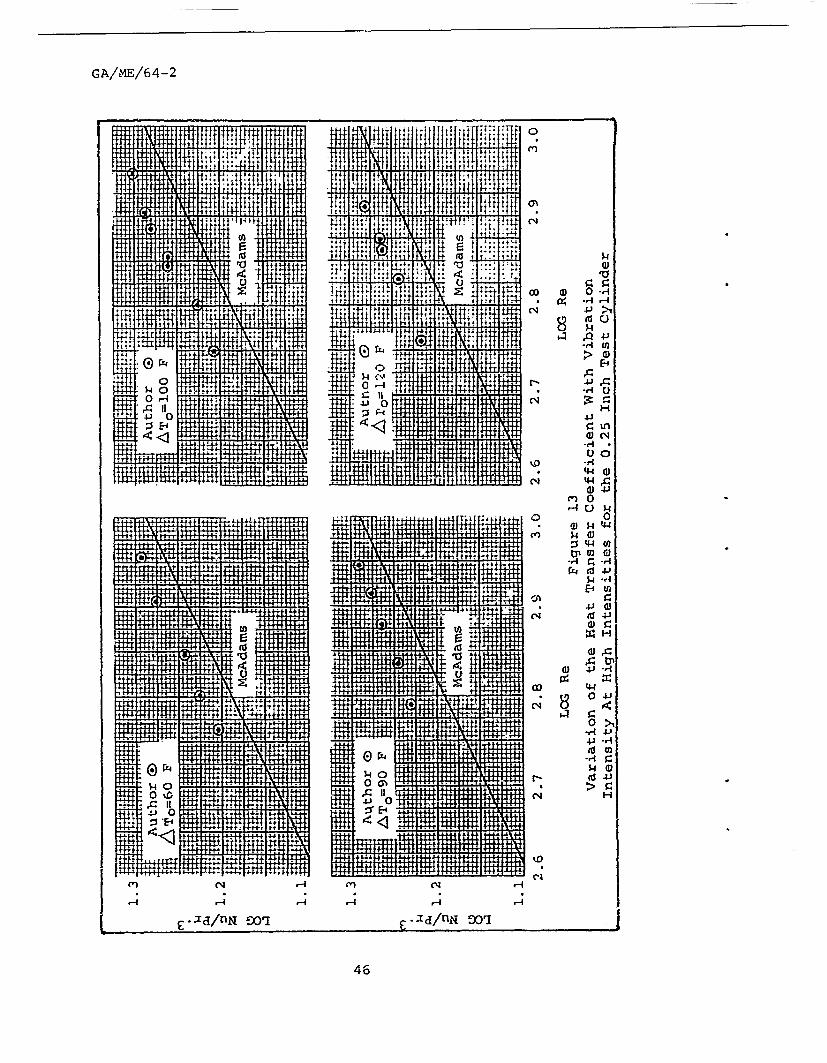
13 Variation of the Heat Transfer Coefficient 46with Vibration Intensity at High Intensitiesfor the 0.25 Inch Diameter Test Cylinder
14 Correlation with Other Authors 47
v
GA/1ME,/64-2
Figure Page
15 Interferograms of the 0.25 Inch Diameter 48
Test Cylinder
16 Interferograms of the 0.25 Inch Diameter 49Test Cylinder
vi

GA/M/64-2
List of Symbols
A Lateral surface area of test cylinder - in2
E Voltage drop in heater and lead lines - volts
Gr Grashof number - dimensionless
I Current through circuit - amps
L Length of test cylinder - in
Nu Nusselt number - dimensionless
Pr Prandtl number - dimensionless
Qc Convective heat loss - wati-
Qk Conduction heat loss - watts
Q1 Line loss - watts
Qr Radiation heat loss - watts
Qt Total power in circuit - watts
R Resistance of lead wires - ohms
Re Reynolds number - dimensionless
Ta Temperature of ambient environment - F
Tf Temperature of Boundary layer fluid - (Ta + Tw)/2 F
Tw Temperature of cylinder surface - F
L&T Temperature difference - (Tw - Ta) F
AT o Static Temperature difference - F
V Vibration velocity - (4af) in/sec
a Amplitude of vibration - in
d Diameter of test cylinder - in
f Frequency of vibration - cycles/sec
vii

GA/M/61-2
ii Heat transfer coefficient - 3TU/hr- ft 2 p
k = Mnezra1 conductivity of ai-; at T.F- BTU/hr ft F
v Vibration intexisity - (af) in/sec
V f -Krinerati.-c vi-scosi;ty of air at T. f/sec
viii
GA/I-1/64-2
Abstract
The purpose of this investigation was to determine the
effect of diameter, te -erature difference, and vibration
intensity on the free convective heat transfer rate from
horizontal cylinders subjected to transverse vibrations in
air.
The diameters of the cylinders used in this investiga-
tion were 0.085 and 0.25 inches. The cylinders were vibrated
over a frequency range of 0 to 88 cycles per second and an
amzAitude raige of 0 to 0.35 inches. The surface temnerature
of the cylinders ranged from 138 to 201 degrees Fahrenheit,
and the maximum vibration intensity was 29 inches per second.
Above vibration intensities of 12 inches per second,
the variation of the heat transfer rate for both cylinders
followed the forced convection curve recommended by McAdams,
and the value of the heat transfer rate was independent of
the temperature difference. For a given temperature differ-
ence and vibration intensity, the value of the heat transfer
rate increased as the cylinder diameter decreased. An
interferometer study showed that the boundary layer was
turbulent above vibration intensities of 12 inches per
second.
ix

GA/ME/64-2
EFFECT OF VIBRATION ON HEAT TRANSFER
FROM CYINDERS IN FREE CONVECTION
I. Introduction
Background
Free convection is actually conduction with subsequent
fluid movement caused by changes in fluid density. Move-
ment of the fluid takes place in a relatively narrow region
known as the boundary layer. Most techniques designed to
imrove convective heat transfer have as their objective
reducing the thickness of the boundary layer or increasing
the transverse fluid motion in the boundary layer. Vibra-
tion is one method of increasing the heat transfer rate by
additional fluid motion.
Purpose
The general purpose of this investigation was to deter-
mine the effect of diameter, temperature difference, and vi-
bration intensity on the free convective heat transfer rate
from the surface of horizontal cylinders subjected to
transverse vibrations. A review of the literature indicated
that a maximum vibration intensity (af) of 14.6 inches per
second had been reported by Fand and Kaye (Ref 3:495). The
specific objectives of this study were to increase the
1

GA/E/64-2
maximum vibration intensity and to correlate the results
with the forced convection curve recommended by McAdams
(Ref 6:259).
Scope
Two cylinders of different diameter and length were
used in this investigation. The smaller cylinder -was 0.085
inches in diameter and 10 inches long. The larger cylinder
was 0.25 inches in diameter and 11 inches long. These
cylinders were vibrated over a frequency range of 0 to 88
cycles per second and an amplitude range 0 to 0.35 inches.
The vibration intensity (af) varied from 0 to 29 inches per
second. Each cylinder was vibrated at static surface-to-air
temperature differentials of 60, 90, 100, and 120 degrees
Fahrenheit.
Approach
The cylinders were heated at rest on the vibration appa-
ratus. Electrical power input to the cylinder heaters was
varied until the desired static temperature differential was
established. The cylinders were then vibrated with the
heater power held constant. During vibration the surface
temperature of the cylinders dropped, indicating an increase
in the heat transfer rate. Data were collected, reduced,
and plotted in graphical form.
2
GA/IME/64-2
Past Studies
A review of the literature revealed a number of studies
over the past twenty years dealing specifically with the
effect of vibration on the heat transfer rate from wires and
small cylinders. Only the more recent and most applicable
of these studies will be listed.
In 1955, Lemlich investigated the effects of horizontal
and vertical transverse vibrations on the heat transfer rate
from wires in free convection in air. The wires were 0.0253,
0.0396, and 0.081 inches in diameter and were vibrated over
a frequency range of 39 to 122 cycles per second. The ampli-
tude varied from 0 to 0.115 inches and the temperature dif-
ference varied from 7 to 365 degrees Fahrenheit. Lemlich
reported an increase in the heat transfer coefficient of 400
percent and an independence of the heat transfer coefficient
on the direction of vibration (Ref 5:1179).
In 1957, Shine studied the effect of transverse vibra-
tions on the heat transfer rate from a vertical plate in free
convection in air. The plate was vibrated over a frequency
range of 11 to 315 cycles per second and a plate temperature
range of 131 to 279 degrees Fahrenheit. The amplitude varied
from 0 to 0%061 inches. Shine reported an increase in the
heat transfer coefficient of 30 percent at a vibration
intensity of 4.9 inches per second (Ref 8:56).
3
GA/ME/64-2
In 1961, Deaver et al. investigated the effects of ver-
tical harmonic vibrations on the heat transfer rate from a
0.007 inch diameter wire in free convection in water. The
frequency range was 0 to 4.25 cycles per second and the am-
plitude range was 0 to 1.38 inches. The maximum temperature
difference was 140 degrees Fahrenheit. Deaver found regions
of free, mixed, and forced convection and formulated empiri-
cal equations for each region. He also reported that at high
vibration intensities the effect of v?'ration on the heat
transfer rate agreed well with that of forced convection and
that at low intensities the heat transfer rate was indepen-
dent of the vibration intensity (Ref 1:254).
In 1961, James studied the effect of horizontal trans-
verse vibrations on the heat transfer rate from cylinders in
free convection in air. The frequency range was 107 to 167
cycles per second and the amplitude range was 0 to 0.064
inches. The temperature difference varied from 35 to 90
degrees Fahrenheit and the maximum vibration intensity was 7
inches per second. Cylinders of 0.085, 0.25, and 0.75 inches
in diameter were used. James reported an increase in the
heat transfer coefficient of 89 percent and found this in-
crease to be dependent only on the vibration intensity
(Ref 4:17).
4
GA/ME/64-2
In 1961, Fand and Kaye studied the effect of'vertical
transverse vibrations on the heat transfer rate from a 0.875
inch diameter cylinder in free convection in air. The fre-
quency range was 54 to 225 cycles per second and the aupli-
tude varied from 0 to 0.16 inches. The temperature differ-
ekace varied from 25 to 185 degrees Fahrenheit and the maximum
vibration intensity was 14.6 inches per second. Fand and Kaye
reported that the effect of vibration on the heat transfer
rate was negligible below intensities of 3.6 inches per
second. They also found that for values of temperature
difference less than approximately 100 degrees Pahrenheit and
vibration intensities above 11 inches per second the heat
transfer rate is independent of temperature difference and
that for temperature differences above 100 degrees Fahrenheit
the heat transfer rate can be obtained from an empirical
equation (Ref 3:497).
In 1962, Shine and Jarvis studied the effect of vertical
vibration on the heat transfer rate from cylinders in free
convection in air. The cylinder diameters were 0.032 and
0.072 inches. The frequency range was 15 to 75 cycles per
second and the amplitude range was 0.002 to 0.99 inches.
Their report stated that the heat transfer rate is unaffected
by vibration below intensities of 1 inch per second and that
the variation of the heat transfer coefficient with vibration
5
GA/ME/64-2
intensity appeared to parallel the forced convection curve
recommended by McAdams (Ref 9:2).
in 1962, Russ studied the effect of horizontal trans-
verse vibrations on the heat transfer rate from cylinders in
free convection in air. The cylinder diameters were 0.065,
0.25, and 0.75 inches. The frequency varied from 0 to 130
cycles per second and the amplitude varied from 0 to 0.165
inches. The surface temperature of the cylinders varied from
125 to 167 degrees Fahrenheit and the maximum vibration in-
tensity was 13 inches per second. Russ reported that the
heat transfer rate for a given cylinder is dependent only
upon the vibration intensity. He also found that the varia-
tion of the heat transfer rate as a function of vibration
intensity was quite complex and that for the range of his
investigation no simple analogy to that of forced convection
existed (Ref 7:32).
Present Study
This study was an extension of the work of Russ. Vibra-
tion intensities of 29 inches per second were achieved
through equipment redesign and modification. However, 30 data
points were recorded in the low intensity region investigated
by Russ. These points were compared to the results of Russ
in order to establish the accuracy of the procedures and
6

GA/1E/64-2
equipment used in this study. Correlation was excellent and
the e~iingdata p-oints were taken at vibration intensities
in excess of 12 inches per second.
7

GA/ME/64-2
II. Experimental Equipment
The equipment used in this study can be divided into
three main categories as listed below:
Heat Transfer Apparatus
Test Cylinders
Power Control Equipment
Temperature Measuring Equipment
Vibration Apparatus
Test Stand
Resonant Beam Assembly
Vibrator
Vibration Intensity Measuring Equipment
Boundary Layer Study Apparatus
Mach-Zender Interferometer
Light Sources
Camera
Heat Transfer Apparatus
The 0.085 inch diameter cylinder was a 10 inch length of
stainless steel tubing. The tube was heated electrically by
attaching the power input leads directly to the ends of the
cylinder so that the current passed through the cylinder it-
self. Four stainless steel support rods were soldered to the
cylinder to prevent undesirable modes of vibration. A
8

GA/ME/64-2
photograph of the cylinder is shown in Figure 2.
The 0.25 inch diameter cylinder was an 11 inch length
of copper tubing. Heating was accomplished electrically by
passing current through a single strand of 30 gage nichrome
wire threaded axially through the cylinder. The power input
lines were soldered to the ends of the wire and the entire
heater was insulated electrically from the copper cylinder by
a thin-walled cylindrical tube of alumina. Four stainless
steel support rods were soldered to the cylinder to prevent
undesirable modes of vibration. A photograph of the cylinder
is shown in Figure 3.
The power control equipment consisted of two voltage
regulators, two 3 ohm resistors, two ammeters, and a voltmeter.
The two voltage regulators were Powerstat, type 140, and the
voltmeter was a Ballantine, model 300. A single voltmeter was
satisfactory for both cylinders since it had a variable scale.
However, the 0.085 inch diameter cylinder required an ammeter
with a range of 0 to 5 amperes and the 0.25 inch diameter
cylinder required an ammeter with a range of 0 to 2 amperes.
Both ammeters were Weston models. The voltage regulators
were placed in series to obtain finer adjustments and the
two 3 ohm resistors were added to stabilize the circuit by
minimizing the effect of small variations in the contact
resistance of the voltage regulators.
9
GA ./_4-2
Ite a--bient tezzerature was measured with a Parr calor-
imetric mercury-in-qlass ther-ometer graduated to 0.05 degrees
'Fahrenheit. The cylinder surface teirerature was measured
with an iron-constantan thermocouple referenced to an ice-
water bath and connected to a Rubicon potentiometer. The
_otentiometer was graduated to 0.005 millivolts or approxi-
mately 0.2 degrees Fahrenheit.
Vibration oADaratus
The test stand consisted of a steel frame with plywood
sides and was completely filled with concrete. The top was
a 0.5 inch thick steel plate welded to the frame. The base
was 32 inches wide, 30 inches long, and the height of the
test stand was 50 inches.
The resonant beam assembly consisted of two parallel
beams 0.625 inches thick, 4 inches wide, and 40 inches long,
and two movable spacers, each 4 inches long. The inner beam
was made of steel and was connected to the vibrator. The
outer beam was made of aluminum and contained the mounting
bracket for the test cylinders. The position of the spacers
determined the effective length of the beams, which in turn
established the resonant frequency of the entire assembly.
By varying the position of the spacers, a resonant frequency
range of 80 to 315 cycles per second was obtained. A
10
GA/IE/64-2
photograph of the resonant beam assembly is shown in Figure
The vibrator was a Calidyne model6 shaker with a
frequency range of 0 to 700 cycles per second and an output
force of 3.1 pounds per ampere of armature current. Al-
though the maximum allowable armature current was 5 amperes,
the equipment was operated at a maximum of 4 amperes to avoid
failure of the vibrator or its power supply. This establish-
ed a maximum force output of 12.4 pounds.
A General Radio type 631 strobotac was used to calibrate
the frequency dial of the vibrator power supply. The
strobotac had a frequency range of 10 to 240 cycles per
second. A Gaertner Scientific Corporation telemicroscope was
used to measure the amplitude of vibration. This instrument
was graduated to 0.0001 inches.
Boundary Layer Study Apparatus
The Mach-Zender interferometer used in this study had
optical parts 6 inches in diameter and a test section 19
inches long. The interferometer was suspended by coil
springs attached to a steel frame. The frame was mounted on
wheels and could be raised or lowered by means of a hydraulic
jack. A photograph of the interferometer is shown in
Figure 6.
11

GA/M!/64-2
Three light sources were used in this study. A mercury
lamD was used for coarse fringe adjustments, a zirconium
lamp for fine fringe adjustments, and a spark lamp for
obtaining the interferograms. A Graflex camera, employing
type 44 polaroid film, was used for the interferograms.
12

GA/ME/64-2
III. Measurements
The acquisition of raw data required the measurement of
six experimental variables. These variables were the ambient
air temperature, cylinder surface temperature, frequency of
vibration, amplitude of vibration, current, and voltage. The
measurement of each of these variables will be discussed sep-
arately in the following paragraphs.
Temperature
The ambient air temperature was measured with a mercury-
in-glass thermometer graduated to 0.05 degrees Fahrenheit.
The physical location of the thermometer was most important
since vertical and horizontal temperature gradients as high
as 2 degrees Fahrenheit per foot existed within the labora-
tory. Consequently, the thermometer bulb was placed at the
same vertical level of the test cylinder and within 6 inches
of the cylinder horizontally.
The temperature of each cylinder was measured with an
iron-constantan thermocouple soldered to the cylinder surface.
The location of this thermocouple was critical since each
cylinder had a temperature variation along its length caused
by heat conduction along the support rods. Consequently,
nine thermocouples were soldered to the surface of each
cylinder and the temperature recorded at each location during
13

GA/1.E/64-2
four static runs and four vibration runs. These temperatures
ware plotted, the area under each curve determined, and the
average temperature obtained by dividing the area by the
length of the cylinder. The average temperature always
occurred at the same location on each cylinder. It was at
this location that the cylinder surface temperature was
measured for all subsequent test runs.
The effect of random air motion in the test area on the
cylinder surface temperature was negligible. This was
determined during five test runs in which the cylinder was
completely enclosed within an air shield. The cylinder was
then heated and vibrated at intensities in excess of 12
inches per second. When the cylinder surface temperature
had stabilized, its value was recorded and the air shield
removed. After five minutes, the surface temperature was
again recorded. During all runs, the temperature did not
change after the shield was removed.
Vibration Intehsitv
The frequency of vibration was set by a dial on the
vibrator power supply. The dial reading was checked
periodically with a strobotac and found to agree within 2
cycles per second. The amplitude of vibration was obtained
by focusing the telemicroscope on a narrow width of reflect-
ing tape placed on the end of the support cylinder. When
14

GA/IME/64-2
the cylinder was vibrating, this width of tape became a
continuous, distinct band. The width of this band was
measured with the telemicroscope. This measurement was then
corrected for the width of the tape and became equal to
double the amplitude of vibration.
Power
The current to the heater element of each cylinder was
measured with a conventional ammeter. Before each run at one
of the four static temperature differentials, the ammeter was
compared to another ammeter of the same type. The maximum
difference in the two readings was 0.01 amperes. Voltage was
measured with an electronic voltmeter. However, the voltage
drop in the heater element of each cylinder was not measured
directly. It was necessary to connect the voltmeter in such
a way that a line loss was also included in the instrument
reading. Consequently, the total power input had to be
corrected for this line loss in order to obtain the power
delivered to the heater element.
15

GA/ME/64-2
IV. Calculation of Losses
The heat lost by convection from the cylinder surface
was determined by subtracting the line, radiation, and con-
duction losses from the total power in the circuit. End
losses were considered negligible for both cylinders. This
assumption was based on a comparison of lateral surface area
to end surface area. The calculation of the line, radiation,
and conduction losses will be discussed in the following
paragraphs.
Line Losses
The line losses were computed from the line current and
resistance. The line current was measured and the line
resistance was calculated by measuring the voltage irop in
one foot of wire at different values of current. The total
resistance of the lead wires for the 0.085 inch diameter
cylinder was variable and is plotted against current in the
wire in Figure 7. However, the total resistance of the lead
wires for the 0.25 inch diameter cylinder remained constant
at a value of 0.167 ohms. This is due to the fact that the
maximum current required by the 0.25 inch diameter cylinder
was only 1.38 amperes as compared to a maximum current of 5.1
amperes for the 0.085 inch diameter cylinder.
16

GA/ME/64-2
Radiation and Conduction Losses
In this investigation, the radiation and conduction
losses were computed indirectly. Based on the assumption
that the heat lost by radiation and conduction was indepen-
dent of the vibration intensity and only a function of the
temperature difference, the follciing procedure was used in
the calculation of these losses:
1. Each cylinder was heated, at rest, to different
values of static temperature difference.
2. For each value of static temperature difference,
properties of the fluid in the boundary layer were computed
at the arithmetic average of the cylinder and ambient tem-
peratures.
3. With the fluid properties, cylinder diameter, and
temperature difference established, the product of the
Grashof and Prandtl numbers are computed.
4. With the Grashof-Prandtl product known, the Nusselt
number was obtained from McAdam's free convection curve
(Ref 6:176).
5. The convective heat transfer rate from the cylinder
surface was determined using this Nussel.t number.
6. The sum of the radiation and conduction losses was
computed by subtracting the line and convective losses from
the total power in the circuit.
17
GAA//64-2
7. The sum of the radiation and conduction losses was
then plotted against tenmerature difference for each cylinder.
These qraphs are sh(wn in Ficures 8 and 9.
18

GAME, 4-2
V. E:..eri"enta! Procedure
Four vibration tests were conducted on each cylinder.
Each test consisted of five to fifteen runs or data points
with the cylinder heater power held constant. Although the
heater power was constant for a given test, it bad a differ-
ent value for each test. These values corresponded to static
cylinder-to-ambient tenoerature differentials of 60, 90, .CC.
and 120 degrees Fahrenheit.
The specific experimental procedure used in each v.-
bration test consisted of the fol!cwina steps:
I. The cylinders were heated, at rest, to a specific
value of static temperature difference.
2. When the des4_:ed s-atic temperature difference was
established, the power input to the cylinder heaters was
held constant and the :.'A.inders were vibrated at various
intensities.
3. Wehen the cyl :-Aer surface temperature stabilized
at e ._.cn. .htv. raw data were recorded.
19

GA/ ME/64 -2
VI. Calculation of Parameters
The heat transfer rate from the cylinder surface was
calculated by subtracting the line, radiation, and conduc-
tion losses from the total power in the circuit. The total
power was determined from the recorded current and voltage.
The line loss was determined from the recorded current and
line resistance. The sum of the radiation and conduction
losses was determined from the graphs shown in Figures 8
and 9 and discussed earlier. The vibration intensity was
determined from the product of the amplitude and frequency
of vibration.
The Nusselt number was calculated from
Nu = (h) (d/kf) = (3.412Qc/A AT) (d/kf) (1)
For the 0.085 inch diameter cylinder, 10 inches in length,
Eq (1) reduced to
Nu = i.305Qc/kf 8T
For the 0.25 inch diameter cylinder, 11 inches in length,
Eq (1) reduced to
Nu = i.184Qc/kf AT
20
GA/ME/64-2
The Reynolds number was calculated from
Re = Vd/Vf = 4afd/l44Y)f (2)
For the 0.085 inch diameter cylinder, Eq (2) reduced to
Re = 2af/84.71'f
For the 0.25 inch diameter cylinder, Eq (2) reduced to
Re = 2af/288 Vf
21
GA/'6 4 -2
VII. Analysis of Errors
Human and instrument errors could have been introduced
into the raw data during the measurement of any onte-of the
six. fundamental variables. An analysis of the individual
and overall errors is presented in this section.
Pa.wer Measurement
T'he aurzeters used in this study had a maximum error of
0.75 percent of the full scale reading. The minimum reading
during test runs was 3.31 and 0.91 amperes for the smaller
and larger cylinder, respectively. These values yield
maximum errors of 2.27 and 1.65 percent.
The electronic voltmeter used in this study had an
accuracy of 2 percent of the full scale reading. The 0.085
inch diameter cylinder required a full scale reading of 1
vclt, and the 0.25 inch diameter cylinder required a full
scale reading of 10 volts. The maximum error becomes 2.86
percent for the smaller cylinder and 5.4 percent for the
larger cylinder.
Vibration Intensity
The frequency of vibration was obtained from a 'dial on
the vibrator power supply. The minimum frequencies of vi-
bration were 77 and 80 cycles per second for the smaller and
22
GA,/'4E/4-2
larqer cylinders, respectively. Based on these figures, the
maximum error would be 2.6 percent for the 0.085 inch
diameter cylinder and 2.5 percent for the 0.25 inch diameter
cylinder.
The amplitude of vibration was recorded as the average
of two readings. The maximum deviation from the average was
0.005 inches. Based on an amplitude of 0.25 inches, a
representative error of 2 percent was calculated.
Temperature
Measurement of the ambient temperature and the cylinder-
surface temperature could have introduced relatively lara
errors into the calculation of parameters. Although actual
vaiues of these two temperatures were not used directly in
the calculation procedure, their difference established the
numcrical value of AT At high vibration intensities,
vai, : of A T less than 10 degrees Fahrenheit were not
uncommon. Consequently'. an instrument error of 1 degree
Fahr-:nheit could cause rclatively large error of more
t'bac. 10 pt:rcent. In acdition, the presence of the thermD-
coup±e on the cylinder surface tended to disturb the boundary
layer fluid, and even if there were no instrument error this
disturbinq effect may result in incorrect temperature
measurements (Ref 6 :19"'.
23
GA/IIE/64-2
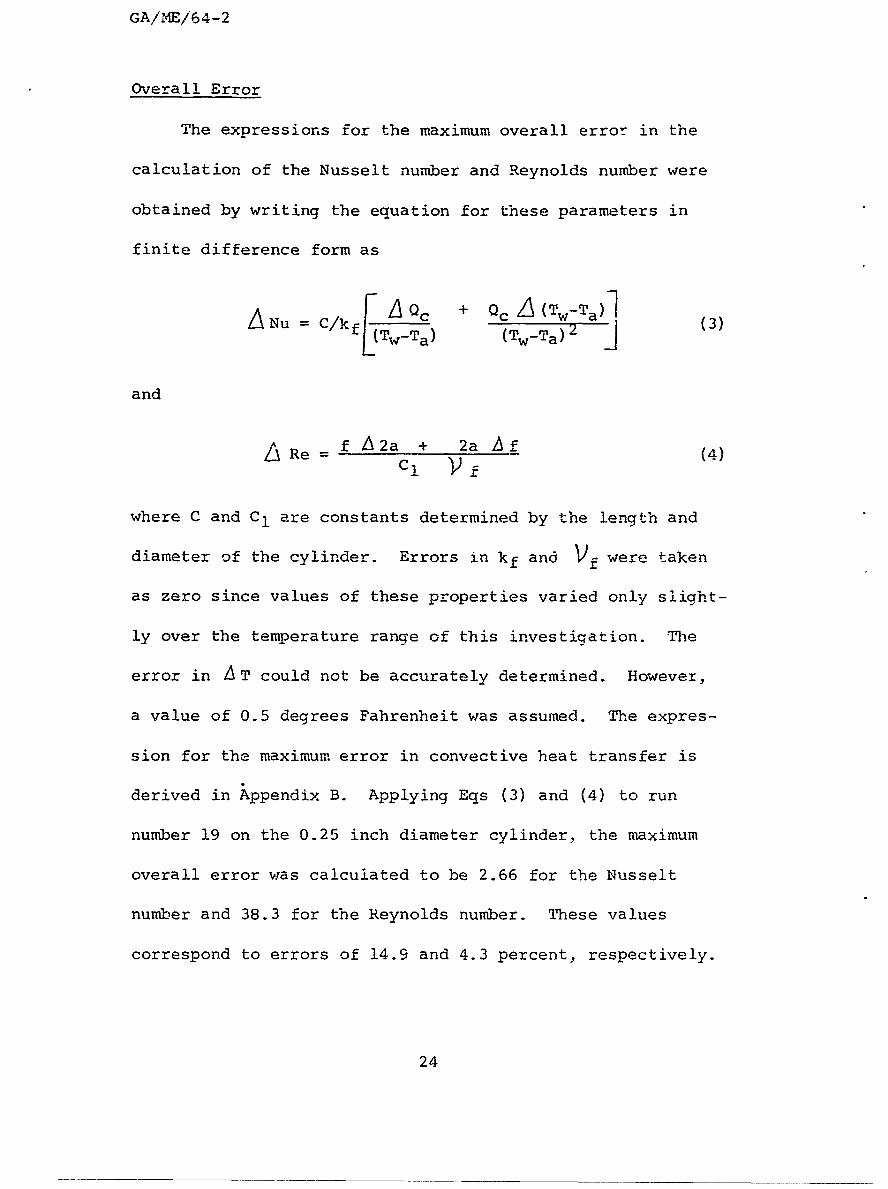
Overall Error
The expressions for the maximum overall error in the
calculation of the Nusselt number and Reynolds number were
obtained by writing the equation for these parameters in
finite difference form as
Nu= C/kf A c + c A (TTa)(l
Nu = f(Tw-Ta) (Tw-Ta)2 1(3
and
A Re= f 2a + 2a Af (4)
where C and C1 are constants determined by the length and
diameter of the cylinder. Errors in kf and Vf were taken
as zero since values of these properties varied only slight-
ly over the temperature range of this investigation. The
error in AT could not be accurately determined. However,
a value of 0.5 degrees Fahrenheit was assumed. The expres-
sion for the maximum error in convective heat transfer is
derived in Appendix B. Applying Eqs (3) and (4) to run
number 19 on the 0.25 inch diameter cylinder, the maximum
overall error was calculated to be 2.66 for the Nusselt
number and 38.3 for the Reynolds number. These values
correspond to errors of 14.9 and 4.3 percent, respectively.
24
GA; E/64 -2
VIII. Pesults and Correlation
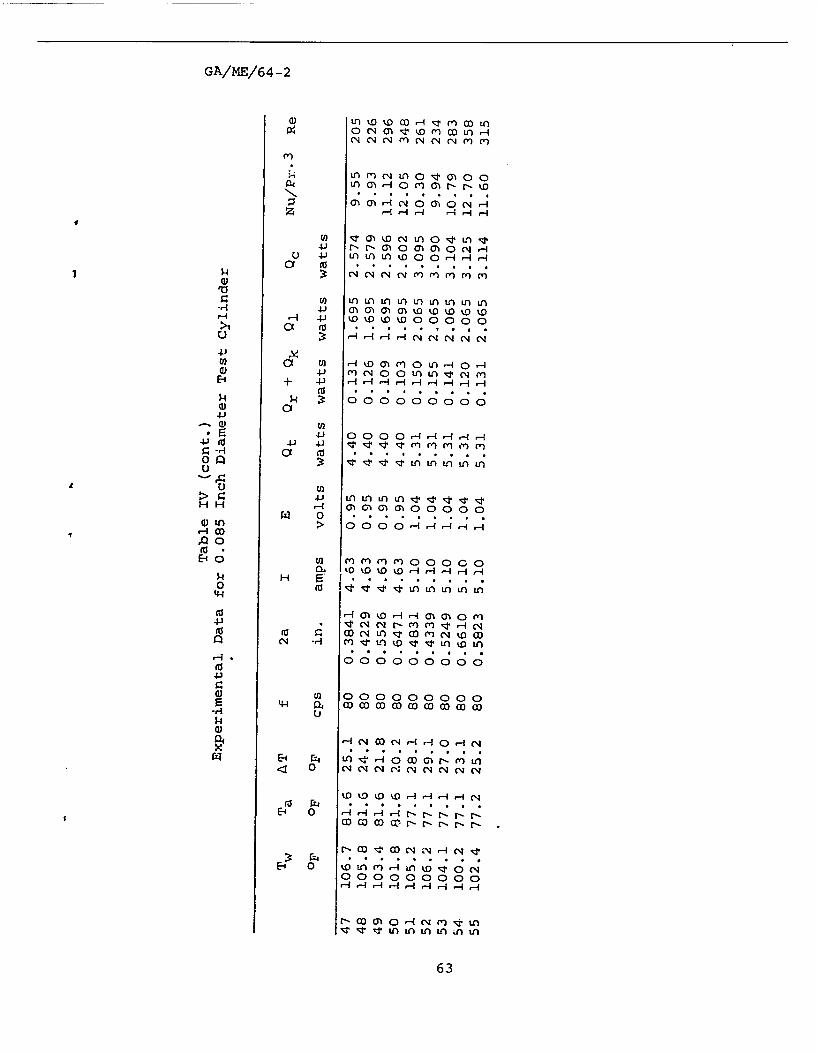
The results of this investigation are presented in both
tabular and graphical form. Tables III and IV contain listed
values of the measured variables and calculated parameters
for all of the tests. Values of the calculated parameters
shown in Tables III and IV are also presented graphically in
Figures 10 throuqh 14. A discussion of each qraph is con-
tained in the following paragraphs. In addition, overall
correlation with other authors is presented and an aralysi s
of the interferograms is included at the end of the sect ic.
Variation of the Heat Transfer Coefficient With Vibration
Intensity
Figures 10 and 11 show, in non-dimensional form, the
variazion of the heat cransfer coefficient with vibration
intens-ty fior each cylinder. The vibration intensity was
varied from 0 to 12 inches per second and the static tem-
perature 3ifferential was 90 degrees Fahrenheit. The purpose
of these Graphs was to compare the results of this study wi:1
those of Russ and thereby establish the validity of the
experimental procedures employed by this author. Correlation
with Russ was limited -o the low intensity region since he
had not obtained vibration intensities above 13.0 inches per
second. As shown in Figure 10, correlation of results for

G Ai .,/E4 -2
the 0.085 inch diameter cylinder was excellent. The differ-
ence between the two curves is never more than 2 percent an
the static value of each curve is within 1 percent of the
free convection value as found in McAdams (Ref 6:176). As
shown in Figure 11, correlation of results for the 0.25 inch
diameter cylinder is satisfactory. In general, the two
curves differ by about 10 percent. This difference could be
explained by pointing out that the static value of the heat
transfer coefficient as computed by Russ differs from
McAdams by 10 percent, while the static value determined in
this report agrees with McAdams to within 1 percent. It is
reasonable to assume that this deviation could be present in
each of the data points reported by Russ and thus explain the
lack of better correlation.
Figures 12 and 13 show, in non-dimensional form. the
variation of the heat transfer coefficient with vibratoon
intensity at intensities from 12 to 29 inches per secornd anrx
with static temperature differentials of 60, 90, 100, and
120 degrees Fahrenheit. These graphs show clearly that at
vibration intensities above 12 inches per second the varia-
tion of the heat transfer coefficient for both cylinders
follows the forced convection curve found in McAdams (Ref
6:259) and, for a given cylinder diameter and vibration
intensity, its value is independent of the temperature
26

GAi' 1./64 -2
difference. A study :.f the graphs also reveals that, for a
given vibration intensity and temperature difference, the
value of the heat transfer coefficient increases as the
cylinder diameter decreases.
Correlatior. With Other Authors
Correlation with the results of Shine and Jarvis, Fand
and Kaye, Deaver, and Russ i~s shown in Figure 14. As lis-
cussed earlier, agreement with Russ is good. Correlaticn
with each of the other authors will be discussed serara-___
in the following paragaraphs.
Agreement with thv results of Shine and Jarvis is no-t
satisfactory. Although the slopes of both curves are
ident-cal at high Reyn~lds numbers, the numerical values -
of the heat trdnsfer coefficient for the same Reynolds numt~er
diff,'-r bv about 25 percent. In an effort to find an exp.,ria-
zioi for this differen:e, this author examined closely thL-
expe_ rim'entai data an3 -:ornpuz at ions of Shine and Jarvis but
was ,nab'Le to fnc an -xplanacion for the lack of agreement.
To facilitate coT--arlson with the work of Fand and
Kaye. their results were extrapolated to vibration inten-
sities of 16 inches pc: second. Correlation with theso
ex-tiapolated results is excellent. Both curves follow the
:or~Q onvcei~ncur%, 0.. McAdamr-, and values of the heat
tran~~zor err -iet fr th,_ same Reynolds number differ by
27

GA/1-/64-2
only 12 percent. 'This difference could be explained by point-
ing out that Fand and Kaye used an internal thermocouple to
measure cylinder surface temperature while an external
thermocouple was used in this study.
Correlation with the results of Deaver is excellent at
high vibration intensities. However, in the region near the
critical vibration intensity below which heat transfer is
unaffected, the slopes of the two curves are different. The
results of Deaver show a smooth transition from subcritical
to above critical intensities, while the results of this
study show a rather abrupt increase in heat transfer as the
critical intensity is reached. The difference in the two
curves could be due to the fact that Deaver conducted his
investigation with water as the ambient fluid. The dimensions
of the tank holding the water were not much larger than those
of the test cylinder. Consequently, with amplitudes as high
as 2.76 inches, the possibility of disturbances in the
ambient fluid must be considered.
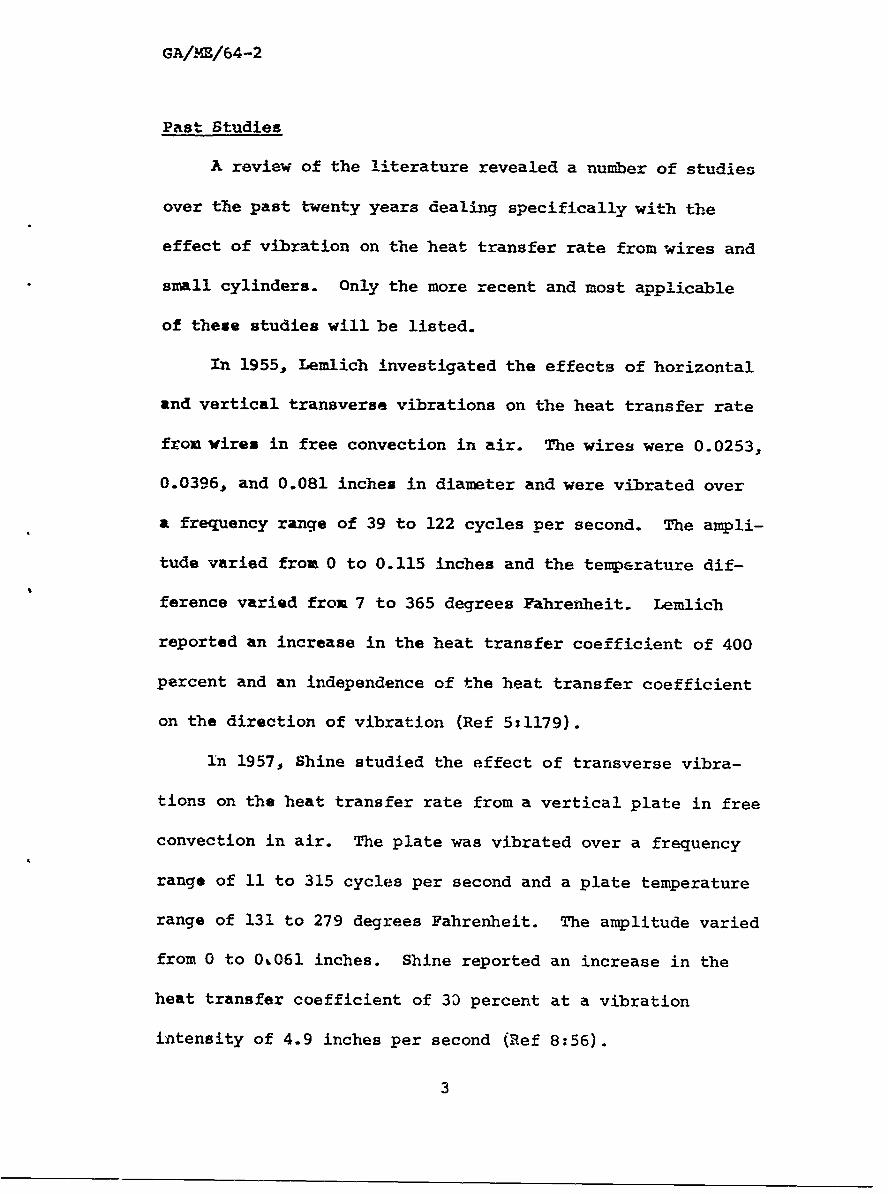
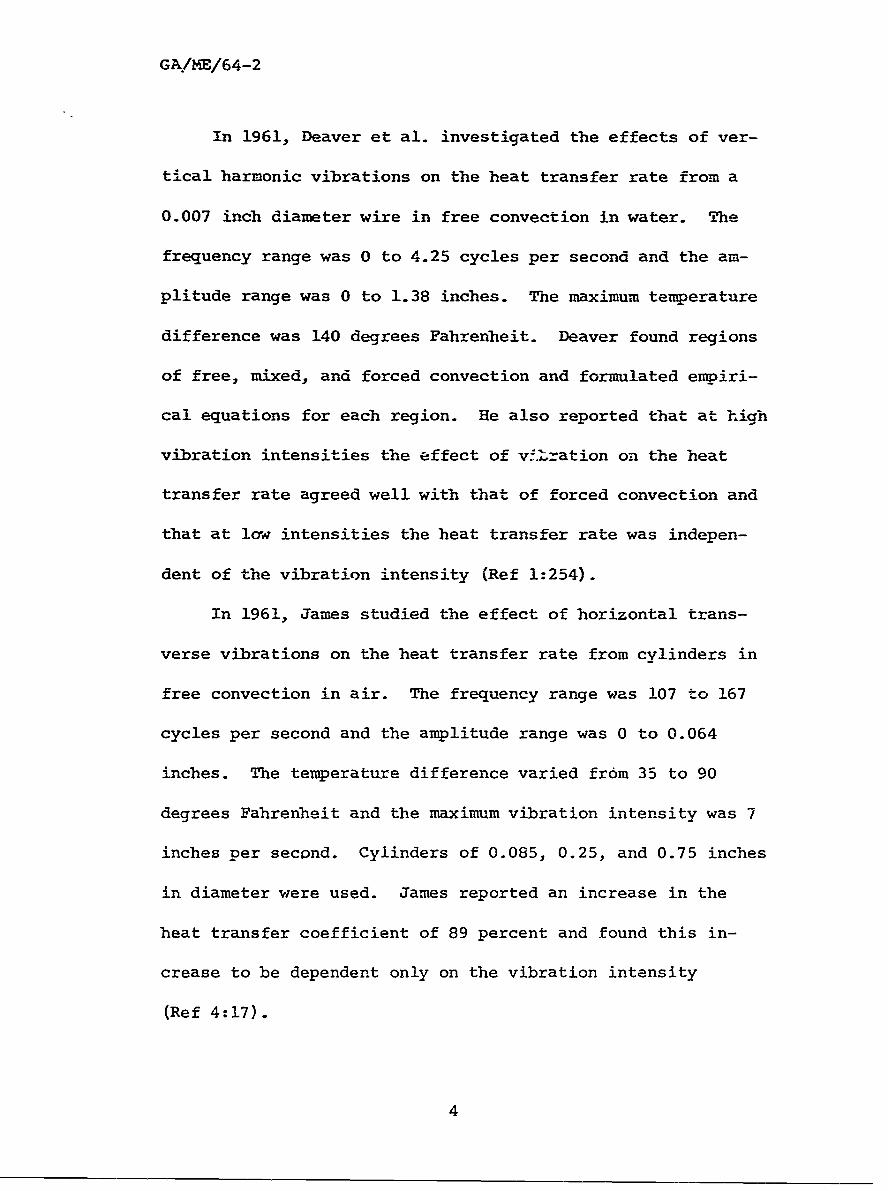
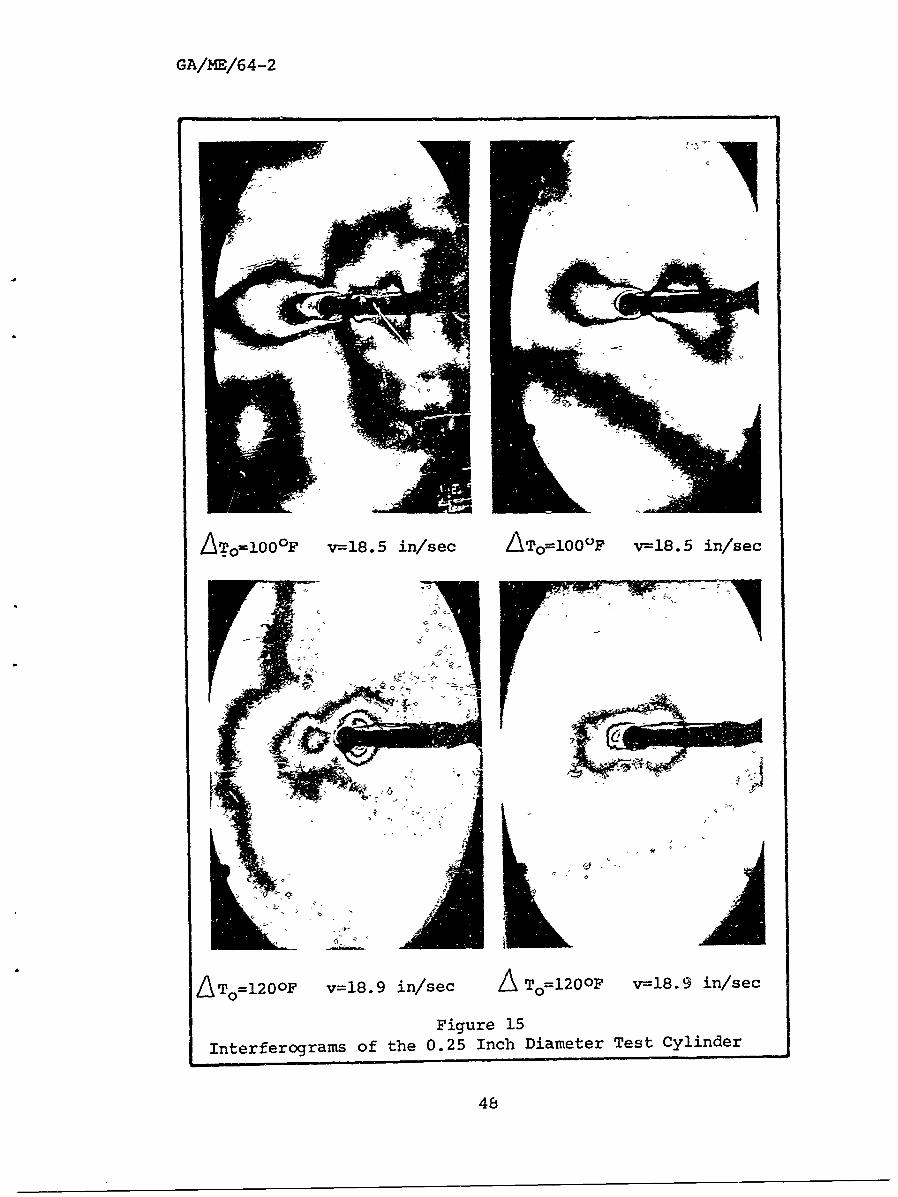
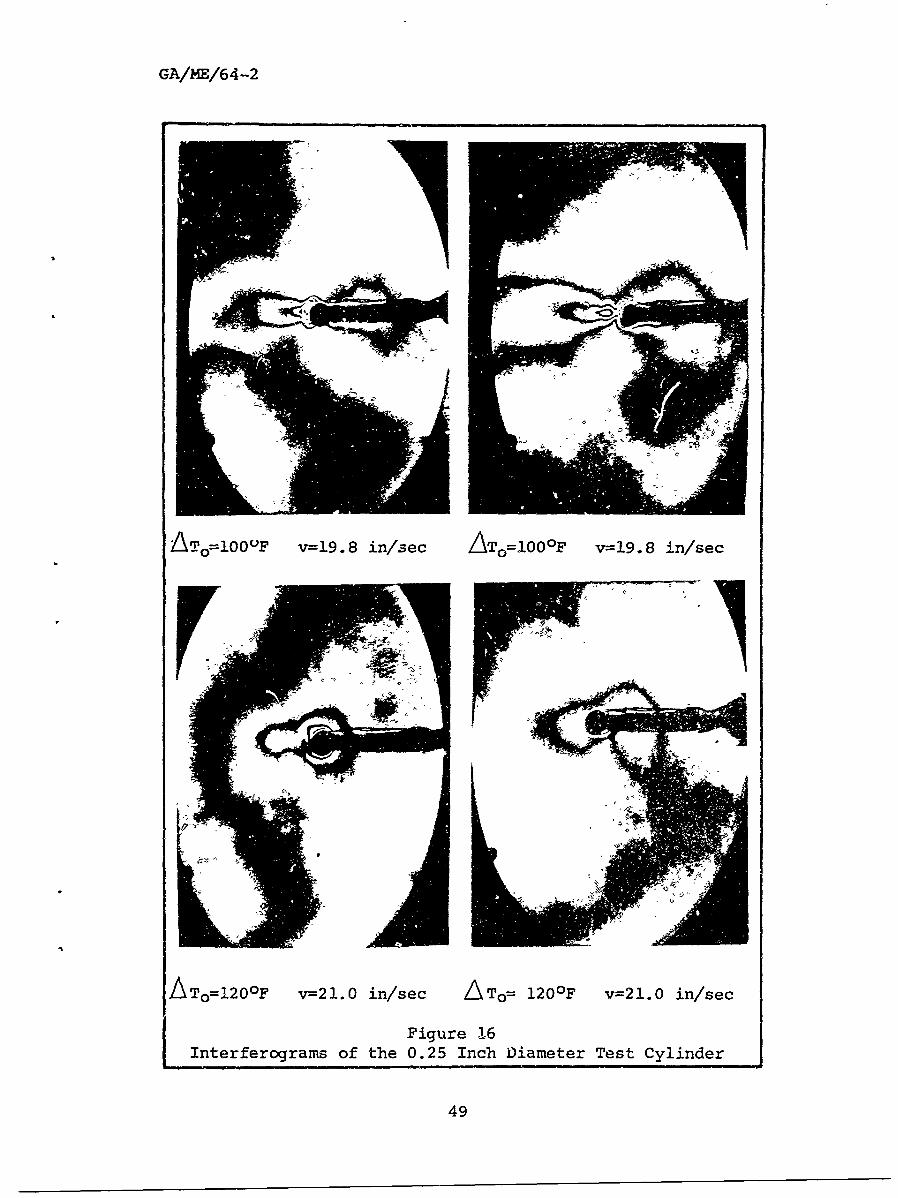
Analysis of the Interferoqrams
Interferograms of the 0.25 inch diameter cylinder at
various vibration intensities are shown in Figures 15 and 16.
Although a quantitative analysis of the boundary layer is
impossible, some qualitative information can be obtained from
the interferograms. It is seen that complete transition to
28
turbulent flca has ta*-,n nlace. and that The b.tndary laver
Lstretching to ernclo-e the re-gicn ot motion- . f the c, lirder_
In addition, the boundary layer has become quize thin and
is similar to that found in forced convection.
29
GAi.E//- 4 -2
IX. Conclusions and Recommendations
The results of this investigation of the free convection
heat transfer from vibrating cylinders lead to the follcwinq
conclusions:
1. Thne variation of the heat transfer coefficient for
vibration intensities between 12 and 29 inches per second
follows the forced convection curve recommended by McAdams
and the slope of the curve is independent of the cylinder
diameter.
2. For a given cylinder diameter and vibration in-
tensity, the value of the heat transfer coefficient is
independent of the temperature difference for vibration
intensities between 12 and 29 inches per second and within
the range of temperature difference used in this investiga-
tion.
3. The results of this investigation are in excellent
agreement with the results of Russ and Fand and Kaye.
4. The boundary layer is turbulent for vibration
intensities between 12 and 29 inches per second.
Based on the assumption that this report will provide
a starting point for further study, the following recommenda-
tions are made:
1. That the effect of direction of vibration on the
heat transfer coefficient be determined.
30
GA/ E//1 -,---
2. 'hat cvlinaers of high relative value of therral.
diffusivity be used to minimize temperature stabilization
time.
3. That internal thermocouples be used to minimize
errors in temperature measurement.
31
GA/E/64-2
Bibliographv
1. Deaver, F.K., Penny, W.R., and Jefferson, T.B. HeatTransfer from an Oscillating Horizontal Wire to Water.ASN Paper No. 61-WA-178, 1961
2. Eckert, E.R.G. and Drake, R.M. Jr. Heat and MassTransfer. New York, New York: McGraw-Hill Co., Inc.1959.
3. Fand, R.M. and Kaye, J. "The Influence of VerticalVibrations on Heat Transfer by Free Convection from aHorizontal Cylinder." International Developments inHeat Transfer, Part II: 490-498 (1961).
4. James, E.C. The Effect of Vibration on the Heat TransferRate from Cylinders in Free Convection. Thesis(unpublished). Dayton, Ohio: Air Force Institute ofTechnology, August, 1961.
5. Lemlich, R. "Effect of Vibration on Natural ConvectiveHeat Transfer." Industrial Engineering Chemistry,47:1175-1180, (June 1955).
6. McAdams, W.H. Heat Transmission. New York, New York:McGraw-Hill Co., Inc. 1954.
7. Russ, R.M. Effect of Vibration on Heat Transfer fromCylinders in Free Convection. Thesis (unpublished).Dayton, Ohio: Air Force Institute of Technology,August, 1962.
8. Shine, A.J. The Effect of Transverse Vibrations on theHeat Transfer Rate from a Heated Vertical Plate in FreeConvection. Technical Report 57-13. Wright-PattersonAir Force Base, Ohio: Wright Air Development Center,December 1957.
9. Shine, A.J. and Jarvis, F.C. Effect of Vibration on theHeat Transfer Rate from Cylinders in Free Convection.Paper (unpublished). Dayton, Ohio: Air Force Instituteof Technology, 1963.
32

GA/ME/64-2
APPEN!DIX A
Figures
33

GA/ME-/64-2
0
-4

GA/ME/64-2
E-4
04
-4-
$4 4J
0
.9440
3-4
WV
0o 0
0
35-

GA/ME/64-2
~~>1
V
a-)
4
E4).)
00
00ic
0
36~
GA/ME/64-2
-43
0
irf.2. Awl r4t
'4
37
GA/ME/64-2
Figure 5
Photograph of the Resonaint Beam Assem~bly
38
GA/24E/64-2
- -r
AA
I3

GA/ME/64-2
r;: . ......,
!40
+0
t :,t lil !t
C!~
N 0
N OD
00
(0
0 4J
0400~ 0 00
40

0.7 ~-
0.6F.. .. 4. .
0. 4i.-::
.~- .. .K
.: .~ .. * . ...
0.34
....- .. .4. ... ..
011
0~ 1;
.. .il ...
0 FL
O 20 1) 60 80 100
Z-AT FFigure 8
Va.-~ii-t.-n of radiationk and Conduction LossesWith Tempera 're Differerce for the 0.085
Ir, 1 met r C l ;Ne
1. 2 - .. ..
-,- - -
1- -4-4+ i .... 44
fu 0.6 - --
CY 0.4 = - -
77-i I:
0 15, ! THE
0 20 40 60 80 100
L TF
Figure 9
Variation of Radiation and Conduction LossesWith Temperature Difference for the 0.25
Inch Diameter Test Cylinder
42
.. .. . . . .. ... ....
t:~4~4~-. ......... L....
I . I.
44r-
.. .. . ... .0 C t
434

GA/ME/64-2
+t+i
W4-L~ ...- $
lH a) 0 )014
<11

GA/ME/64 -2
M'.HU IN~.Hrl MINOR~fM. OVA f+
*f~r iffi $
1-d N
+H
04-1
-Hif
04 GJi~ I
0 -1 0
454
GA/ME/64-2
-Nip Mt :1110H,
:al-
£tTti!ffI~ -1I
464

GA/ME/64-2
. . . . . . . . . .. . ...... ..........
.... ..... Clq... .. ........ . ........ .. ... ...... .. .. ...... ................................
... .. ... .... ............. .............. . ......... ............. ... ........ .....
...... .... ... .. ............. .P+I+
tz=.
. . .... ....... ... . ..
.... ...... . ... ...... ........ .....
......... ....... ..... . v
. ..... ... .....
........... ......... ....... ... .................... ....
........ ........... ... . . ........... ... .. ... .I ... ... .... .. - ......... .. . . .. .... .. .. .......
...... . ............. ............ .. . ..
Ci
.. ....................... .......... ............... .......... & ...... ........... ........ ............. ..........
... .. .... .............. . .... ................... ... ... ...... m ........... ... i ....... ... .. ... . ....... . ................... . .............. . ........... .. .... . ...
. ......... .. .. . ........ . .. .. .. .. ................. . . .... .. - 1.1 - I ... . ............ ......... .......... . .......... . . ..........
...... .. .......... . . ...... .. ........ .. ............. I ........ .. ....... .. ....... ........... .. .. I., .... ... .... . . ... ....CC)
.......................
.... ....... i. .... .1-- ... ... ... ............. .... ... .... .. .... ... ..... ...
............ ...... . ............... ....... . ........... .. . ... ......... .. ...... .. .. .................... .... .... .... ........ .... . .. ... ............... ................ .. ......... .i ..... . . ......... .. . . ..... .. ............ .. ..... ........ .. ....... ........ ... ......
............ .. . .............. ... ... ................. ............. -------- - ---- - --- - - ----.. .. .......
... ............
pail.- ............. . .......
Ci CKO Irt 04 r-q C;
E,
47
GA/ME/64-2
ATO-00OF v-18. 5 in/sec ATO=1000F v--18.5 in/sec
/1\TO=1200F v=18.9 in/sec ATO,=l2OF v--18.9 in/sec
Figure 15
Interferograms of the 0.25 Inch Diameter Test Cylinder
48
GA/ME/64 -2
AT0ooOOvF v=19.8 in/sec AT0 =1000F v--19.8 in/sec
,A To1200F v--21.0 in/sec A To= 120OF v=21.0 in/sec
I Figure .16IInterferograms of the 0.25 Inch Diameter Test Cylinder
49

GA/bE/64-2
APPENDIX B
Equation Development
50

GA/ME/64-2
Equation Development
The expression for the maximum error in convective heat
transfer can be drived by writing the equation for this
variable in finite difference form as
A Oc= AQt - AQ 1 - L(Qr + Qk)
with
AQt = ILIE + E AI
AQ 1 = 2IR Il + 12 A R
(Qr + Qk)=Qto - AQco _ A Q1
where the zero subscript indicates that 'the variable was
measured during preliminary static runs to determine
(Qr + Qk) , and the absence of the zero subscript indicates
that the variable was measured during vibration tests. Since
the cylinder was at rest during the preliminary static runs,
there was no turbulence around the thermocouple. Consequent-
ly, the error in A To was assumed to be zero, and since
To was the only independent variable used in the deter-
mination of Qco, it was assumed that A Qc° was also zero.
Expanding the expressions for A Qto and AQlo, substituting,
and combining terms results in
Qc = IAE + (E - 21R)4I+ I 2,AR
+ I A E + (Eo - 210Ro)L Ao + 12AR
51

GA/M4E/64-2
APPENDIX C
Samnple Calculation
52

GA/ME/64-2
Sample Calculation
This calculation was based on run #19 on the 0.25
inch diameter test cylinder. The recorded values of the
measured variables were:
Tw = 93.4 F I = 0.91 amps 2a = 0.5439 in
Ta = 80.4 F E = 3.71 volts f = 82 cps
From these data the following computations were made:
Qt = IE = (0.91) (3.71) = 3.379 watts
Q, = I 2 R = (0.91)2 (0.167) = 0.138 watts
AT = Tw - Ta = 93.4 - 80.4 = 13 F
Tf = (Tw + Ta) = (93.4 + 80.4) = 86.9 F
2 2
Radiation and conduction losses were determined from Figure
10 as
(Qr + Qk) = 0.223 watts
From tables in Eckert and Drake (Ref 2:509), the fluid
properties were determined as
kf = 0.01537 BTU/hr ft F
Vf = 17.29 (10)-5 ft2/sec
Pr = 0.707
Convective heat transfer was obtained from
Qc = Qt - (Qr + Qk ) - Q, = 3.018 watts
53

GA/ME/64-2
The dimensionless parameters were calculated from
Nu = 1.184Qc = l.1S4(3.018) = 19.85
P77 kfAT Pr- 3 0.01537 (13) (0.707) .3
and
Re -2af 0.5439(82) 896
288 V f 288(17.29(l0) 5
Calculation of the maximum overall error in the Nusselt
number and Reynolds number was calculated from
Nu = 1. 184 A Qc + 1. 184Qc A (A T)kfLAT kf (T) 2
Re = (fA2a + 2aAf)288 V f
where
A (AT) = 0.5 F
2a = 0.01 in
Af = 2 cps
The error in convective heat transfer was computed from
Qc = IAE + (E- 21R)A I + I2 AR + I o A Eo +
(E - 210Ro) A I + 12 A R
with
I = 0.91 amps. E = 3.71 volts R = 0.167 ohms
54
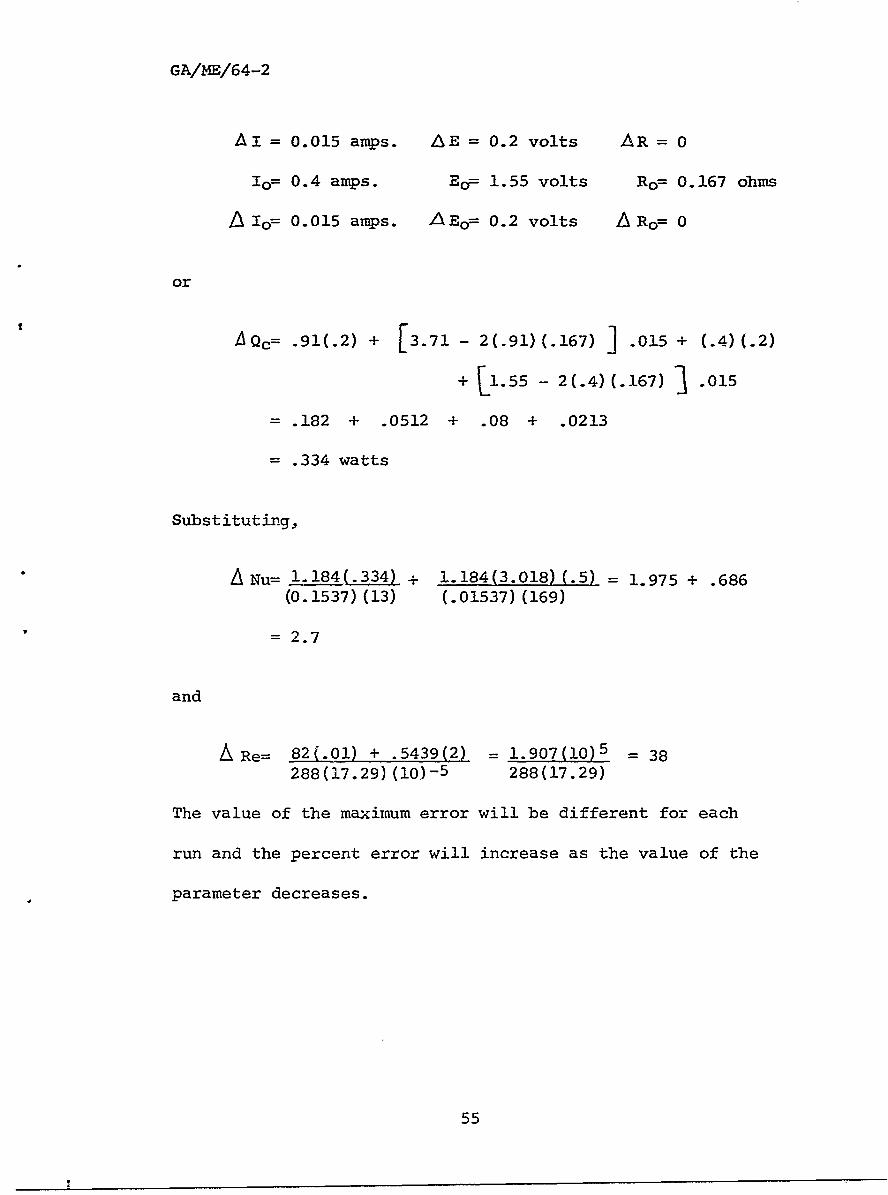
GA/ME/64-2
AI = 0.015 amps. AkE = 0.2 volts AR = 0
Io= 0.4 amps. Eo= 1.55 volts Ro= 0.167 ohms
Io- 0.015 amps. -AEo= 0.2 volts ARo= 0
or
Qc= .91(.2) + [3.71 - 2(.91)(.167) ] .015 + (.4)(.2)
+ Ll. - 2(.4) (.167) .015
= .182 + .0512 + .08 + .0213
= .334 watts
Substituting,
Nu= 1.184(.334) + 1.184(3.018) (.5) = 1.975 + .686(0.1537) (13) (.01537) (169)
=2.7
and
ARe= 82(.01) + .5439(2) = 1.907(l0) 5 - 38
288(17.29)(10)-5 288(17.29)
The value of the maximum error will be different for each
run and the percent error will increase as the value of the
parameter decreases.
55

GA/14E/64-2
APPENDIX D
Experimental Data
56

GA/ME/6 4-2
54'0)
H4 4J A O Nm OLnr0 n n- ac (d .I .04 0 000000
01) '41 0 0 C )4 ~ '
04-V N~Wrmomo0-o(U H4-) -1 N m to m rI 0
aCID
to C14N
0
(a w n o ~Ln o oo o q 00
00 (H , 4.)0H e4.)UU
110l2q0to 000L
o %Di 0 DWM%-':J > OOO OOOOOHN
(U p0 1 0 m M -
0 r--4 0000D~ooCo
-4
V
El0 r 0E z % D% 0 1C4 %D
-4 0q r4 rAtn OO
4-4
(U- ; nt r otCA-C
.557

GA/ME/64-2
V
U ~ :m ooooooomo+0P
$rd
r4 4V 0000 0OOHH- eJ
H 0 4-' -c ~ W a ON(nOfnr- 0) NIfP 0 C Y n0 nr -q
0 w2 m r-i m m N N o o40 4-) o4 n-i f2HUrio co nuri r
000 0 r- 4c mC)%
0
0
0) 024-' r, m 1*0000 00000
0 04 0 1 o - o0
toH;4.3;( C
HoO oooDmv n-
c, , n DMV t TrIO0 1 DCC 0 W~ rtI - C) CA0)
m CC) to') 0 0 (A 4n coJ ODi
V4 c4 m i~n r-
$4 0a Ni %DW Dt Dt nt nt
0 Ei 0 C o a c oo a o ao4-4
4V(d 0000000000
Et 0 m m , 4 ; o0 1N(ni~ nk
HHHH.4 - 4 HHI -Ir
4.34
58

GA/1E/64-2
a, cnNr - T1mm% DmNmto Am r N 4wo qr - o tD- A mA h mN
W ;V * MN NNN -OLOrO0 % a r C 0C
$4 ~ AC~tlOC'~~fLGw op )mzpr ninAi n4 noc - nc
mZ H 4 mHHHHHHHHHrH4 Dov q o qaoc m4r-r
c4 c;( k 4 9 c (
r4 4J 4 ;r 4 , ;L L
>1
aaVi -PrI) ri
4J - P N- N 4rirI - -Ir4cc (a
u)I
0
o r- cn r- N In N0 M N N MM M N r- ;r M A- N0 r-0WV4 p4j HHHHHm-Hr- n Nr-Ho -H o' N mN Cmw ; mw v"
C; Cd C
-P
(Dt" 0 00 000 000 DO 00 0WD 3OD O O OCOCOC3 D 'D a
E-1 rki
E 0 0 nc 4 4c ' ;L 4L ;c
r-0000- 4NMNWL n% 00o0 r 0MM M00
r-4 H H r4 Hi Hi H1 H N' Nq N'
59

GA/ME/64-2
m o m r-4No -0 D 10 M V 10W 4 a N N-
IN . . . I
o ~~ o- o o 000Now
cii a ~ .
1
0 9
0) + rd ~~eEri- C; 000000000000C; C
$-4
-00
H t
a0 N4 N MC 4mm q
a0Ef 4-4
4.) ri0 r -
0V.
0l 4-4 -4 -4 -4 H r4 0 0
$'4
(1. In r-. r- 0 *MMclm0 i
04 04 N , , nc -
E10 4 r.4c 4c -
El 0 C A -Hc) 0 r-I.Nr-I '.. -- C0
60

GA/14E/64-2
0 H~ Or- N mmLi rmmomo Nm c mm
z -HH-4HHHHH i -I r
4$
0)r - - rirIr - q) HH H HH H H 4 -1 l r--NN0 0r-
>1
NO)C )It0 o) W c ) 4 O W - mN D mmo r,
Q) + 4'
0 CU .
(0 CD
0Ur-' o- %Dm - :rt-tDo rm ;p Hom wmm 41;r m. H Oo OOOOOOtOOOOm 0w D 011T ~rr01 rA0 M0% Irr4M L DC -C w %':
4U)4.'- c' 9 u4 OOOOO 4 OOcOOOOr*0"O cOOO AO
H4O 4c)r-Mc * Un HD r-- 9'C 4r- -
0 -4- H 4 -1 -4 - 4-
o oU I o o
.4-'~~r c4 r-4 0 m H H H H HAfl N f
C61

GA/ME/64-2
N N N N rH H- mn N N N H- H- mn fn N N N N H- H- m
p4 r- - - - -
Ea~~~~ ~ ~ ~ m -i w 0i 0i m t*nr -mr tr - Do tr-P Ne - - - ,mmoommwwr -
HH HH HHHH ItHHAHtmm rI mmmmI ~r4 4 c 44444c C'44c4
4Jz 4JI r- - IrIri 4 - 4 -1rIrIrirIrIec'l - . .
H- H- V->1 Cl (dU o 000000HHHr4HHHOr4 HHHHHHHH
U) ul CO 0 DN
5-I -I 00000000000000000000000
-P
-P- -P %t-~ T tq to oo oo ooo000000000'
> V~4 00 000 OHHHHHHHHHHHHHHHH4 ic- rI i -I ir- rI AIHH H a- -r -r - -mmmmmmm N00m00ai m m
m 0 *
r-4 co
Eo U)
44
0m0w0q iztn 10 0 m - - nmNMrjt
4-ID O00COD00CO000oor-o Woo o0u
W n000-l Oi 0r ooIo-~
E- 0 CDa ~0 0 0 r-CO00O Wm mm 00m mm0 ,4
0~ OO% 000 0004Iq q0 0 0 0 00 00-10 0A0r- p4....................4............................
E-t o O ~W00r0 4"cntM- -WM0 r4WC'c c~v~v c4M r v0 %N N N m n mm 0 m qC~r z: % 4.t f 3
62r
GA/ME/64-2
0 CN 0)"ttom 00 , 4CN (N (N M~ CN (4 N (n m c
On m (N 0 z m0N0
C) M3 -I C) AW MOO , k
(n (N( N m 0 't 0 m t
$4~
aar. En M nM00u 0n.tn m
.1+ 4J H H H H HwwwQ%
-. fa .U.I .u 4-400N0N .- 4HH
4J3
rz 4- OO0OOH 4r4 -4 ri -
E0 Af m 1m'nP)00C
> . 1 M OW0 0HHH
W 0
43 ..H s
0 4 4
44
Ot2 0 00 C4L)C 0 C t00CC.4 ri cv l I D ct iL o L
4-3
44'- H4 WW W O Hxr uir4 H W ~ ~ -
~N r-r-0r--
&14 0 r-q r-I r-q rN
000000000r4 -4 H4 v4 r- rH ri j
r M M0,4 " m v miT qr zr0 n m n fl11
63

GA/ME /64-2 ____________
Personally Identifiable
Vita Information Redacted
Captain David F. Neely was born
He attended grade school and high school
there and was appointed to the United States Naval Academy
in July, 1947. He graduated from the Naval Academy in 1951,
and was commissioned as a second lieutenant in the United
States Air Force. At that time he entered pilot training.
Upon completion of pilot training, he was assigned to duty
with the Tactical Air Command at Shaw Air Force Base, South
Carolina. Subsequently, he entered residenr training for
Astronautical Engineering (Graduate) at Wright-Patterson Air
Force Base, Ohip.
Permanent address:
This thesis was typed by Mrs. Edna M. Kluesner.
64