Embed Size (px)
Citation preview
______________________________________________________________________________________________
FEASIBILITY STUDY FOR THE
BOARDMAN RIVER
GRAND TRAVERSE COUNTY, MICHIGAN
APPENDIX B - ECONOMIC ANALYSIS GREAT LAKES FISHERIES AND ECOSYSTEM RESTORATION PROGRAM
US Army Corps of Engineers, Detroit District
477 Michigan Avenue
Detroit, MI 48226-2523
US Army Corps
of Engineers Detroit District
US Army Corps
of Engineers Detroit District

Boardman River Feasibility Study Economic Analysis Appendix
FEASIBILITY STUDY FOR THE BOARDMAN RIVER
ECONOMICS ANALYSIS
Prepared for
US Army Corps of Engineers
Detroit District
477 Michigan Avenue, 6th Floor
Detroit, MI 48226
Prepared by
URS/Baird Joint Venture
c/o URS Corporation
27777 Franklin Road, Suite 2000
Southfield, MI 48034

Boardman River Feasibility Study Economic Analysis Appendix
Appendix B - i
TABLE OF CONTENTS
1 Introduction ................................................................................................................. 1
2 Socioeconomic Analysis .............................................................................................. 1
3 Existing and Future Without-Project Conditions .................................................... 4 3.1 Existing Condition................................................................................................ 4
3.1.1 Union Street Dam .................................................................................... 5 3.1.2 Sabin Dam ................................................................................................ 6 3.1.3 Boardman Dam ........................................................................................ 7
3.2 Future Without-Project Conditions ...................................................................... 8 3.3 Preliminary Screening of Measures ..................................................................... 9
4 Alternatives .................................................................................................................. 9 4.1 Alternative 1 ....................................................................................................... 10 4.2 Alternative 2 ....................................................................................................... 10 4.3 Alternative 3 ....................................................................................................... 10 4.4 Alternative 4 ....................................................................................................... 11 4.5 Alternative 5 ....................................................................................................... 11 4.6 Alternative 6 ....................................................................................................... 12 4.7 Alternative 7 ....................................................................................................... 12 4.8 Alternative 8 ....................................................................................................... 12
5 Economic Analysis .................................................................................................... 13 5.1 Environmental Outputs ...................................................................................... 13
5.1.1 Fish Habitat ............................................................................................ 16 5.1.2 Wetland Habitat ..................................................................................... 17 5.1.3 Sea Lamprey Control ............................................................................. 17 5.1.4 Average Annual Habitat Units ............................................................... 17
5.2 Project Costs ....................................................................................................... 18 5.3 Cost Effectiveness Analysis ............................................................................... 21 5.4 Incremental Cost Analysis ................................................................................. 22 5.5 Incidental Benefits.............................................................................................. 23
6 Summary .................................................................................................................... 23

Boardman River Feasibility Study Economic Analysis Appendix
B - ii
LIST OF TABLES
Table 1: Summary of 2010 Census Demographics......................................................... B-2
Table 2: Economic Characteristics and Educational Attainment ................................... B-3
Table 3: Employment by Industry Estimates .................................................................. B-4
Table 4: Alternatives Selected for Further Analysis ..................................................... B-10
Table 5: Boardman River Segments ............................................................................. B-14
Table 6: Fisheries Average Annual Habitat Units ........................................................ B-16
Table 7: Wetland Average Annual Habitat Units ......................................................... B-17
Table 8: Summary of Net Average Annual Habitat Units ............................................ B-18
Table 9: Summary of Alternative Costs ........................................................................ B-20
Table 10: Cost Effectiveness Analysis Results ............................................................. B-21
Table 11: Results of the Incremental Cost Analysis ..................................................... B-23
LIST OF FIGURES
Figure 1: Union Street Dam, view of the dam ................................................................ B-5
Figure 2: Boardman Lake, view of lake and public docks ............................................. B-6
Figure 3: Sabin Dam, view of spillway and control house ............................................. B-7
Figure 4: Boardman Dam, view of intake structure ........................................................ B-8
Figure 5: Location of Segments on Boardman River ................................................... B-15
Figure 6: Cost Effectiveness Frontier ........................................................................... B-22

Boardman River Feasibility Study Economic Analysis Appendix
Appendix B - 1
1 Introduction
The Boardman River Feasibility Study was conducted by the U.S. Army Corps of
Engineers (USACE), Detroit District, under the authority of Section 506 (Great Lakes
Fishery and Ecosystem Restoration Program) of the Water Resources Development Act
of 2000 (Public Law 106-541). The Boardman River originates in Grand Traverse and
Kalkaska Counties, MI, and flows approximately 49 miles before entering West Grand
Traverse Bay at Traverse City, MI. There are three dams along the waterway: Union
Street Dam at river mile 1.1, Sabin Dam at river mile 5.3, and Boardman Dam (also
known as Keystone Dam) at river mile 6.1. The dams disrupt the Boardman River
ecosystem through habitat fragmentation and degradation, impacts to sediment transport,
and thermally induced species disruption. The well-documented effect over the last three
decades is a reduction in populations of trout and other aquatic species immediately
upstream and downstream of the dams.
Project objectives include reconnecting and restoring tributary habitat, allowing
unimpeded movement of woody debris and sediment materials through the river system,
negating thermal disruption, and restoring the natural balance between coldwater species.
These objectives must be accomplished without transporting pollutants into the Grand
Traverse Bay of Lake Michigan or allowing upstream migration of invasive aquatic
species.
The purpose of this appendix is to explain the methodology applied in the economic
analysis of the ecosystem restoration measures and alternatives considered in the study.
2 Socioeconomic Analysis
A socioeconomic analysis was conducted to provide a better understanding of the
characteristics of the communities in the study area. Having a better understanding of the
communities can help to determine how a project could have an impact on residents.
Grand Traverse County encompasses the Boardman Lake and Sabin Pond. Adjacent to
Grand Traverse County is Kalkaska County, which contains much of the upper North and
South Branch of the Boardman River. The Boardman River offers recreation
opportunities such as fishing, canoeing, kayaking, and hunting. About 36 river miles are
designated as Blue Ribbon river sections for trout fishing. The Boardman River is
considered to be one of the top 10 best trout streams in Michigan (Huggler and
Barfknecht 1995).
The Boardman Valley Nature Preserve is adjacent to Sabin Pond and includes over 100
acres for hiking, mountain biking, nature watching, hunting, and fishing. The Natural
Education Reserve abuts the Boardman Valley Nature Preserve to the south and has 505
acres and 7 miles of trails along both banks of the Boardman River.

Boardman River Feasibility Study Economic Analysis Appendix
B - 2
Table 1 presents demographic and socioeconomic data from the 2010 U.S. Census for
Grand Traverse County, Kalkaska County, and Michigan. The percentage change is the
percentage increase/decrease from the 2000 U.S. Census. Michigan is the only State in
which the population decreased from the 2000 U.S. Census to the 2010 U.S. Census.
During the same period, the Grand Traverse County population increased 12 percent to
86,986 and the Kalkaska County population increased approximately 4 percent to 17,153.
The median age in years has increased by about 10 percent in Michigan and Grand
Traverse County and about 13 percent in Kalkaska County. The population 65 years and
over increased in Grand Traverse County and Kalkaska County by 28 percent and 25
percent, respectively. Persons under 5 years of age decreased in Kalkaska County and
Michigan and increased approximately 4 percent in Grand Traverse County.
Table 1: Summary of 2010 Census Demographics
Description Kalkaska
County Percent
Change*
Grand
Traverse
County
Percent
Change* Michigan
Percent
Change*
Population 17,153 +3.5 86,986 +12.0 9,883,640 -0.6
Persons Under 5 Years 1,043 -2.3 4,907 +3.9 596,286 -11.3
Persons 18 Years and
Over 13,260 +7.5 67,791 +17.0 7,539,572 +2.7
Persons 65 Years and
Over 2,837 +24.5 13,028 +28.4 1,361,530 +11.7
Median Age in Years 43.0 +13.2 41.3 +9.5 38.9 +9.6
Total Households 6,962 +8.3 35,328 +16.2 3,872,508 +2.3
Number of Housing
Units 12,171 +12.5 41,599 +19.4 4,532,233 +7.0
Owner-Occupied
Housing Units 5,751 +5.1 26,489 +12.6 2,793,342 +0.0
Source: U.S. Census Bureau (2010b)
*Percent change is the difference between the 2000 U.S. Census and the 2010 U.S. Census.
As indicated in Table 1, the total number of households increased by 16 percent in Grand
Traverse County and by 8 percent in Kalkaska County. Both Grand Traverse and
Kalkaska Counties have had a higher rate of growth in the number of housing units than
Michigan overall. Although the number of owner-occupied housing units increased by
about 13 percent in Grand Traverse County and 5 percent in Kalkaska County, overall,
homeownership growth over 10 years in Michigan has been flat.
Table 2 summarizes data from the U.S. Census Bureau American Community Survey for
Grand Traverse County, Kalkaska County, and Michigan. Household income is in 2010
dollars. Compared with Kalkaska County and Michigan, Grand Traverse County has
higher incomes, fewer people below the poverty level, a lower unemployment rate, and
more people with a higher education. Conversely, Kalkaska County has more people

Boardman River Feasibility Study Economic Analysis Appendix
B - 3
below the poverty level, a higher unemployment rate, and fewer people with a higher
education than both Grand Traverse County and Michigan.
Table 2: Economic Characteristics and Educational Attainment
Description Kalkaska
County Grand Traverse
County Michigan
Median Household Income (2010 $) $39,350 $50,647 $48,432
Mean Household Income (2010 $) $47,814 $66,488 $63,692
Below Poverty Level 13.0% 5.9% 10.6%
Unemployment Rate 15.4% 8.2% 11.5%
High School Graduate or Higher 84.8% 92.8% 88.0%
Bachelor’s Degree of Higher 11.6% 28.9% 25.0%
Source: U.S. Census Bureau American Community Survey (2006–2010) 5-Year Estimates (2010a)
For the employed population 16 years and older, the top industry in Michigan, Grand
Traverse County, and Kalkaska County is educational services, health care, and social
assistance (U.S. Census Bureau, 2010a). The other leading industries in Michigan are
manufacturing and retail trade. In Grand Traverse County, the other leading industries are
retail trade; and arts, entertainment, recreation, accommodation, and food services. In
Kalkaska County, the other leading industries are manufacturing; retail trade; and arts,
entertainment, recreation, accommodation, and food services. Table 3 summarizes
employment by industry for Grand Traverse County, Kalkaska County, and Michigan for
the employed population 16 years and older.

Boardman River Feasibility Study Economic Analysis Appendix
B - 4
Table 3: Employment by Industry Estimates
Industry Michigan
Grand
Traverse
County
Kalkaska
County
Civilian employed population 16 years and over
estimate 4,369,785 42,988 7,145
Agriculture, forestry, fishing and hunting, and mining 1.3% 1.6% 6.1%
Construction 5.3% 7.3% 8.4%
Manufacturing 17.6% 8.7% 11.5%
Wholesale trade 2.8% 2.9% 2.7%
Retail trade 11.6% 14.6% 11.5%
Transportation and warehousing, and utilities 4.2% 3.6% 5.7%
Information 1.9% 2.3% 0.8%
Finance and insurance, real estate and rental and leasing 5.7% 6.7% 4.5%
Professional, scientific, management, administrative and
waste management services 8.9% 8.2% 6.7%
Educational services, and health care and social
assistance 23.2% 22.6% 18.0%
Arts, entertainment, recreation, accommodation and
food services 9.1% 12.5% 15.3%
Other services, except public administration 4.7% 4.9% 4.6%
Public administration 3.8% 4.1% 4.3%
Source: U.S. Census Bureau American Community Survey (2006–2010) 5-Year Estimates (2010a)
3 Existing and Future Without-Project Conditions
Understanding the existing condition and future without-project condition is critical to
the planning process. The without-project condition represents the most likely conditions
expected to exist in the future if a project is not implemented. More detailed information
about the existing and future without-project conditions is available in the Detailed
Project Report main text.
3.1 Existing Condition
Despite its attributes as an outstanding coldwater recreational fishery, the Boardman
River system’s ecological integrity is compromised by the presence of three dams within
a 20-mile section of the river’s main stream that composes the study area. These three
dams include the Union Street, Sabin, and Boardman Dams. The presence of these dams

Boardman River Feasibility Study Economic Analysis Appendix
B - 5
disturbs the Boardman River ecosystem through habitat fragmentation and degradation,
impacts to sediment movement, and thermally induced disruptions that adversely affect
overall species diversity.
3.1.1 Union Street Dam
The Union Street Dam (Figure 1) is located in Traverse City at river mile 1.1. The dam
was constructed in 1867 to supply power to a flour mill that no longer exists. Currently,
the Union Street Dam is used to regulate the water level in Boardman Lake (Figure 2). A
natural lake of 259 acres, Boardman Lake has increased to 339 acres with the damming
of the river. The Union Street Dam consists of 250 lineal feet of earthen embankment,
two spillways, and a fish ladder. Overall, the dam is reported to be in good condition and
subject to good maintenance practices. Seepage at the downstream toe of the
embankment and turbulent flow in some of the discharge culverts were recently
observed, possibly indicating deterioration of the culverts. No major rehabilitation
appears to be required in the immediate future to maintain dam safety. The fish ladder is
designed for the passage of salmon and trout while preventing upstream travel of sea
lamprey and appears to be structurally sound.
Figure 1: Union Street Dam, view of the dam

Boardman River Feasibility Study Economic Analysis Appendix
B - 6
Figure 2: Boardman Lake, view of lake and public docks
From Union Street Dam downstream to Lake Michigan, habitat quality is generally good,
with slight impairment and warmwater temperatures. This section is accessible to fish
from Lake Michigan, and thus receives runs of fish including salmon, steelhead, sea
lamprey, and sometimes lake sturgeon. The U.S. Fish and Wildlife Service (USFWS)
treat this river segment to control the production of sea lamprey. The little available
habitat data for Boardman Lake (Figure 2) suggests that aquatic macrophytes are
common and zebra mussels are prevalent. This water body does provide an average
fishery for sport fish such as walleye, smallmouth bass, and northern pike. Boardman
Lake to Sabin Dam supports brown trout, smallmouth bass, and Chinook salmon.
However, water in this segment can reach temperatures that are harmful to coldwater
species.
3.1.2 Sabin Dam
The Sabin Dam (Figure 3), located at river mile 5.3, was constructed in 1906 and
completely rebuilt in 1930. The dam was decommissioned in 2006 and power generation
ceased. The Sabin Dam consists of earthen embankments, a powerhouse, a stop-log
spillway, and a tainter gate spillway. A 1917 map shows a fish ladder just east of the
powerhouse; this feature no longer exists. The structure exhibits minor cracks in the
powerhouse superstructure, concrete deterioration on the downstream side of the
powerhouse, a leaking roof, and minor corrosion at brick mortar joints and window

Boardman River Feasibility Study Economic Analysis Appendix
B - 7
lintels. No major rehabilitation appears necessary at this time to maintain dam safety.
Routine maintenance is required.
The Sabin Dam impoundment provides a poor fishery. Although brown trout density is
quite low in this segment, brown trout growth is quite high, with more than a third of
brown trout greater than the legal minimum “keep” length.
Figure 3: Sabin Dam, view of spillway and control house
3.1.3 Boardman Dam
The Boardman Dam (Figure 4), also called Keystone Dam, is located at river mile 6.1.
The dam consists of earthen embankments, an emergency spillway, and a concrete
structure and penstock intake. Cass Road is located on the top of this dam and the bridge
is directly tied to the dam structure. The Boardman Dam was constructed in 1894 and
rebuilt in 1930; it was decommissioned in 2007. The dam exhibits significant cracking in
the walls of the structure (which also serve as sub-structural supports for the bridge). The
concrete beams that form the bridge superstructure are cracked and there is significant
spalling on the fascia beams, exposing steel girders. The bridge barrier railing is in
significant disrepair. The dam requires considerable repairs.
The Boardman Dam impoundment supports a fair-to-poor warmwater fishery. Rock bass
and white sucker are the most abundant species present. Smallmouth bass and northern
pike are common and bluegill, yellow perch, largemouth bass, and pumpkinseed sunfish
are also present in low relative abundance. Upstream of the Boardman Dam, the former

Boardman River Feasibility Study Economic Analysis Appendix
B - 8
Brown Bridge Dam was located at river mile 18.5. Removal of the Brown Bridge Dam
and restoration of the waterway was completed in 2013. The habitat of the former Brown
Bridge Dam impoundment serves as the best available reference for what conditions in
the Boardman River would be like absent the impacts of the dams. The habitat quality is
good to excellent, with stable banks, abundant gravel, and coldwater temperatures.
Relatively high densities of brown and brook trout exist, with average growth rates.
Figure 4: Boardman Dam, view of intake structure
3.2 Future Without-Project Conditions
The Union Street, Sabin and Boardman Dams would remain in place, without any
modifications. Traverse City and Grand Traverse County would have various
responsibilities related to dam maintenance and regulatory requirements. In 2006, Grand
Traverse County lowered the water level of Boardman Lake approximately 17 feet to
meet spillway capacity requirements required by Michigan Dam Safety Regulations. This
level is anticipated to remain as part of the without-project conditions.
Removal of the Brown Bridge Dam and restoration of the waterway was initiated by local
interests in August 2012 and completed in 2013. Therefore, the Brown Bridge Dam was
not part of the future without-project condition for this Feasibility Study. Removing the
dam created an estimated 156 acres of new wetland area. It is likely that the removal of
the dam mitigated thermal disruptions downstream of the former dam, and extended the
existing coldwater fishery downstream.

Boardman River Feasibility Study Economic Analysis Appendix
B - 9
The remaining dams would continue to fragment the Boardman River into three
discontinuous segments, leading to continued loss of genetic diversity in the trout
populations, as well as continued habitat degradation, and thermally induced species
disruptions. Trout populations, biomass, and individual fish size would be expected to
remain artificially low, and other coolwater fish populations would also experience
negative effects. Species such as the lake sturgeon would not have access to the river.
3.3 Preliminary Screening of Measures
The purpose of this study is to identify and evaluate alternatives that would eliminate
obstacles to the migration of fish and address the critical habitat features that can be
improved on the Boardman River by removing or modifying the Union Street Dam,
Sabin Dam, and/or Boardman Dam. The management measures were evaluated during a
preliminary screening.
The preliminary screening evaluated the measures and eliminated measures that did not
meet the objectives of the study or were not cost effective. The modification of the Sabin
Dam or the Boardman Dam does not alleviate the thermal disruption of the
impoundments and does not result in additional stream habitat for coldwater species.
Although modifying the Sabin Dam or the Boardman Dam would allow for the passage
of brook trout and longnose dace, no new coldwater stream habitat would be created for
these species. Brook trout and longnose dace are exclusively coldwater species and are
extremely sensitive to increased water temperatures. Modification of the Sabin Dam or
the Boardman Dam would not lower water temperatures, whereas dam removal would
lower the water temperature and increase available stream habitat. Increasing the habitat
for lake sturgeon is contingent upon the modification of the Union Street Dam.
Three measures were removed from further consideration. In accordance with the
USFWS desire to retain the Union Street Dam as a lamprey barrier, removal of the Union
Street Dam was not considered further. Because modifications of the Sabin Dam and the
Boardman Dam are costly, provide minimal habitat improvement, and do not meet the
objectives of the project, these measures were removed from further consideration.
4 Alternatives
The remaining measures were combined to create eight alternatives, summarized in
Table 4, to carry forward for further analysis. The alternatives were developed based on
the individual measure that would be applied to each dam.

Boardman River Feasibility Study Economic Analysis Appendix
B - 10
Table 4: Alternatives Selected for Further Analysis
Alternative Union Street Dam Sabin Dam Boardman Dam
Alternative 1 No Action No Action No Action
Alternative 2 Modify No Action No Action
Alternative 3 Modify Remove No Action
Alternative 4 Modify No Action Remove
Alternative 5 Modify Remove Remove
Alternative 6 No Action Remove No Action
Alternative 7 No Action No Action Remove
Alternative 8 No Action Remove Remove
4.1 Alternative 1
Alternative 1 (No Action Alternative) consists of retaining and maintaining all of the
dams, powerhouses, and spillways. No measures would be implemented to restore or
improve coldwater habitat. Water levels and impoundment sizes would not change. The
dams would not be modified to allow increased fish passage. The fish ladder at the Union
Street Dam would be maintained, along with the MDNR Boardman River fish weir. The
No Action Alternative is included in the analysis to provide a baseline against which the
beneficial and adverse impacts of the with-project alternatives may be compared.
4.2 Alternative 2
Alternative 2 consists of modifying the Union Street Dam to improve fish passage with
the establishment of a trap-and-transfer operation at the MDNR Boardman River fish
weir. It would provide spawning and foraging habitat in Boardman Lake and the
Boardman River up to Sabin Dam for lake sturgeon that were manually transferred past
the weir/dam. The dam and existing fish ladder would remain in place to maintain the
current Boardman Lake level, but downstream passage would be improved through the
dam’s auxiliary spillway. The Sabin Dam would be maintained as it currently exists. The
Boardman Dam would be retained and the pool elevation would remain lowered to meet
the Dam Safety Act requirements of the MDEQ.
4.3 Alternative 3
Alternative 3 consists of modifying the Union Street Dam to improve fish passage with
the establishment of a trap-and-transfer operation at the MDNR Boardman River fish
weir. The dam and existing fish ladder would remain in place to maintain the current
Boardman Lake level, but downstream passage would be improved through the dam’s
auxiliary spillway. The Sabin Dam would be removed to allow a free-flowing river to be
restored from the Boardman Dam to Boardman Lake. The Sabin Dam would be breached

Boardman River Feasibility Study Economic Analysis Appendix
B - 11
in the area of the auxiliary spillway. In this area the river and floodplain would be
designed. All other parts of the dam (i.e. the powerhouses and other portions of the
earthen embankment) would remain in place. The proposed river alignment would
include engineered riffles/grade control structures at the former Sabin Dam location that
would add stability to the restored channel in areas of relatively steep slopes. In addition
to engineered rock riffles, other bank stabilization measures might be used at this location
to redirect the channel and protect stream banks. The Boardman Dam would be retained
and the pool elevation would remain lowered to meet the Dam Safety Act requirements
of the MDEQ.
4.4 Alternative 4
Alternative 4 consists of modifying the Union Street Dam to improve fish passage with
the establishment of a trap-and-transfer operation at the MDNR Boardman River fish
weir. The dam and existing fish ladder would remain in place to maintain the current
Boardman Lake level, but downstream passage would be improved through the dam’s
auxiliary spillway. The Sabin Dam would be maintained as it currently exists. The
Boardman Dam would be removed and Boardman Pond would return to a more natural
riverine state. The proposed river alignment would include engineered riffles/grade
control structures at the former location of the Boardman Dam that would add stability to
the restored channel in areas of relatively steep slopes. In addition to engineered rock
riffles, other bank stabilization measures might be used at this location to redirect the
channel and protect stream banks. The bridge and road construction project required as a
result of moving the river channel is being undertaken by the Grand Traverse County
Road Commission and is not part of the USACE Ecosystem Restoration Project.
4.5 Alternative 5
Alternative 5 consists of modifying the Union Street Dam to improve fish passage with
the establishment of a trap-and-transfer operation at the MDNR Boardman River fish
weir. The dam and existing fish ladder would remain in place to maintain the current
Boardman Lake level, but downstream passage would be improved through the dam’s
auxiliary spillway. The Sabin Dam and the Boardman Dam would be removed to allow a
free-flowing river to be restored from the Boardman Pond to Boardman Lake. The dams
would be breached in the location of the historic channel. In this area the river and
floodplain would be designed. All other parts of the dam (i.e. the powerhouses and other
portions of the earthen embankment) would remain in place. The proposed river
alignment would include engineered riffle/grade control structures at both dams that
would add stability to the restored channel in areas of relatively steep slopes. In addition
to engineered rock riffles, other bank stabilization measures might be used at the dams to
redirect the channel and protect stream banks. The bridge and road construction project
required as a result of moving the river channel is being undertaken by the Grand

Boardman River Feasibility Study Economic Analysis Appendix
B - 12
Traverse County Road Commission and is not part of the USACE Ecosystem Restoration
Project.
4.6 Alternative 6
Alternative 6 consists of retaining the Union Street Dam, along with the existing fish
ladder and fish weir operation. The current fish ladder operation would continue. The
Sabin Dam would be removed to allow a free-flowing river to be restored from the
Boardman Pond Dam to Boardman Lake. The Sabin Dam would be breached in the area
of the auxiliary spillway. In this area the river and floodplain would be designed. All
other parts of the dam (i.e. the powerhouses and other portions of the earthen
embankment) would remain in place. The proposed river alignment would include
engineered riffles/grade control structures at the Sabin Dam that would add stability to
the restored channel in areas of relatively steep slopes. In addition to engineered rock
riffles, other bank stabilization measures might be used at the former Sabin Dam location
to redirect the channel and protect stream banks. The Boardman Dam would be retained
and the pool elevation would remain lowered to meet the Dam Safety Act requirements
of the MDEQ.
4.7 Alternative 7
Alternative 7 consists of retaining the Union Street Dam, along with the existing fish
ladder and fish weir operation. The Sabin Dam would be maintained as it currently exists.
The Boardman Dam would be removed and Boardman Pond would return to a more
natural riverine state. The Boardman dam would be breached through the earthen
embankment in the location of the historic channel. In this area the river and floodplain
would be designed. All other parts of the dam (i.e. the powerhouses and other portions of
the earthen embankment) would remain in place. The proposed river alignment would
include engineered riffles/grade control structures at the former Boardman Dam location
that would add stability to the restored channel in areas of relatively steep slopes. In
addition to engineered rock riffles, other bank stabilization measures might be used at this
location to redirect the channel and protect stream banks. The bridge and road
construction project required as a result of moving the river channel is being undertaken
by the Grand Traverse County Road Commission and is not part of the USACE
Ecosystem Restoration Project.
4.8 Alternative 8
Alternative 8 consists of retaining the Union Street Dam, along with the existing fish
ladder and fish weir operation. The Sabin Dam and Boardman Dam would be removed to
allow a free-flowing river to be restored from the Boardman Pond to Boardman Lake.
The dams would be breached in the location of the historic channel. In this area the river
and floodplain would be designed. All other parts of the dam (i.e. the powerhouses and
other portions of the earthen embankment) would remain in place. The proposed river

Boardman River Feasibility Study Economic Analysis Appendix
B - 13
alignment would include engineered riffle/grade control structures at both dams that
would add stability to the restored channel in areas of relatively steep slopes. In addition
to engineered rock riffles, other bank stabilization measures might be used at the dams to
redirect the channel and protect stream banks. The bridge and road construction project
required as a result of moving the river channel is being undertaken by the Grand
Traverse County Road Commission and is not part of the USACE Ecosystem Restoration
Project.
5 Economic Analysis
The Water Resources Council publication Economic and Environmental Principles and
Guidelines for Water and Related Land Resources Implementation Studies (1983) directs
Federal agencies to formulate plans that are economically and environmentally sound.
Cost Effectiveness and Incremental Cost Analyses (CE/ICA) are recommended for
evaluating ecosystem restoration projects. The environmental outputs are not expressed
in monetary terms because there is currently no acceptable method for measuring many
environmental outputs in monetary terms.
This CE/ICA follows the procedures specified by the USACE publication Ecosystem
Restoration in the Civil Works Program (1995a) and the Institute for Water Resources
(IWR) Report, Evaluation of Environmental Investment Procedures Manual (1995b). The
CE/ICA tool from the IWR Planning Suite was used for the evaluation. The Ecosystem
Restoration in the Civil Works Program (1995a) describes CE/ICA as follows:
A CE analysis is conducted to ensure that the least cost alternatives are
identified for various levels of environmental output. After the CE of the
alternatives has been established, subsequent ICA is conducted to reveal
and evaluate changes in costs for increasing levels of environmental
output. Its primary purpose is the explicit comparison of the additional
costs and additional outputs associated with alternative plans or plan
features.
5.1 Environmental Outputs
Studies were undertaken to measure and quantify the habitat effects to fisheries and
wetlands for each proposed alternative. The benefits relating to controlling the passage of
sea lamprey control were also quantified. The fish habitat was assessed using habitat
suitability index (HSI) models developed by the USFWS. By using existing HSI models
and modifying them with regional field data, both the current status of the Boardman
River and the results of implementing the alternatives can be analyzed in terms of habitat
suitability for each of the selected fish species. This analysis produces alternative-specific
HSI scores, which can be used to estimate how critical fish species would be affected by
each alternative. The HSI scores for each alternative contributed to the estimated average

Boardman River Feasibility Study Economic Analysis Appendix
B - 14
annual habitat units (AAHUs) for each alternative. To assess wetland habitat, the
Michigan Rapid Assessment Method (MiRAM) was used to generate a function and
value score for the wetlands impacted by each alternative. The wetland AAHUs were
calculated using the MiRAM score and the wetland size. The benefits related to
controlling sea lamprey were quantified as AAHUs using miles of river protected by a
physical barrier to prevent infestation. The results of these assessments are then
considered when selecting alternatives and can be used to improve the habitat of fisheries
within the Boardman River. More detailed information relating to the AAHUs
assessments is available in Appendix E.
The HSI and sea lamprey control assessments were evaluated by river segment. The
Boardman River is divided into 10 segments. Table 5 describes the locations and lengths
of the Boardman River segments. Figure 5 illustrates the location of the segments on the
Boardman River as described in Table 5.
Table 5: Boardman River Segments
Segment
Number Location
Length
(miles)
1 From Union Street Dam downstream to Lake Michigan and Hospital Creek,
also known as Kids Creek
1.14
2 Union Street Dam impoundment, also known as Boardman Lake 2.14
3 From Sabin Dam downstream to Union Street Dam impoundment 2.15
4 Sabin Dam impoundment (Sabin Pond) upstream to Boardman Dam 1.04
5 Boardman Dam impoundment, also known as Boardman Pond or Keystone
Pond
1.34
6 From Brown Bridge Dam downstream to Boardman Dam impoundment 12.03
7 Brown Bridge Dam impoundment, also known as Brown Bridge Pond 1.63
8 From the Forks downstream to the Brown Bridge Dam impoundment 6.95
9A North Branch of the Boardman River 3.00
9B South Branch of the Boardman River 3.00

Boardman River Feasibility Study Economic Analysis Appendix
Appendix B - 15
Figure 5: Location of Segments on Boardman River

Boardman River Feasibility Study Economic Analysis Appendix
Appendix B -16
5.1.1 Fish Habitat
The conversion of an impoundment to riverine habitat would provide more usable habitat
for the brook trout, longnose dace, and lake sturgeon by lowering water temperatures and
increasing the current, which seem to be the limiting factors for these fish species along
with, to a lesser degree, substrate type and riffle habitat.
HSI scores were evaluated by river segment and include only the river segments that
would be affected. The scores assume that the Brown Bridge Dam was removed. The
scores also account for habitat connectivity (i.e., whether migratory fish, such as lake
sturgeon, can pass through the Union Street Dam).
HSI scores for lake sturgeon predictably increase for each alternative that provides access
to additional reaches of the Boardman River. Any viable alternative to increase sturgeon
habitat must include passage through the Union Street Dam. Fish passage through just the
Union Street Dam significantly increases HSI scores by giving the fish access to
Boardman Lake and the main stem of the river. Removal of the Sabin Dam also increases
the HSI scores. However, the largest increase comes with the removal of the Sabin and
Boardman Dams, which would provide access to the entire Boardman River system.
Alternative 5, which incorporates removal of both the Sabin and Boardman Dams and the
modification of Union Street Dam would greatly increase the available habitat in the
Boardman River for lake sturgeon by providing access to riverine habitat that is predicted
to be suitable for lake sturgeon spawning and embryo development. The species-specific
HSI scores for each river segment were used to calculate the AAHUs for each alternative.
The AAHUs associated with the brook trout, longnose dace, and lake sturgeon were
combined when applicable. Table 6 presents the total and the net AAHUs estimated for
each alternative for improvements to fisheries. The net AAHU is the difference between
the with-project and without-project (No Action Alternative) values.
Table 6: Fisheries Average Annual Habitat Units
Alternative Fisheries
AAHUs
Fisheries Net
AAHUs
1. No Action 2,908 0
2. Modify Union 2,973 65
3. Modify Union, Remove Sabin 3,176 268
4. Modify Union, Remove Boardman 3,233 325
5. Modify Union, Remove Sabin and Boardman 3,928 1,020
6. Remove Sabin 3,089 181
7. Remove Boardman 3,168 260
8. Remove Sabin and Boardman 3,349 441 AAHUs = average annual habitat units

Boardman River Feasibility Study Economic Analysis Appendix
Appendix B -17
5.1.2 Wetland Habitat
Wetland habitat was assessed using MiRAM scores. MiRAM is a rating system meant for
comparing the functional value of a wetland to other wetlands in Michigan, regardless of
ecological type. The quantitative rating is a series of metrics designed to provide a
numerical score that reflects the total functional value of a wetland, which includes a
wetland’s ecological condition (integrity) and its potential to provide ecological and
societal services (functions and values).
MiRAM assessments favor wetlands associated with river restoration because these
wetlands typically include high plant diversity, forested habitat, complex hydrology, and
multiple habitat features, and they lack invasive species. When wetland size is taken into
account, alternatives involving dam removal score high because of the additional acres of
wetland habitat that is anticipated to form from draining of the impoundments. The total
and net AAHUs for each alternative generated from the MiRAM analysis are presented in
Table 7.
Table 7: Wetland Average Annual Habitat Units
Alternative Wetland
AAHUs
Wetland Net
AAHUs
1. No Action 1,726 0
2. Modify Union 1,726 0
3. Modify Union, Remove Sabin 3,371 1,645
4. Modify Union, Remove Boardman 3,142 1,416
5. Modify Union, Remove Sabin and Boardman 4,787 3,061
6. Remove Sabin 3,371 1,645
7. Remove Boardman 3,142 1,416
8. Remove Sabin and Boardman 4,787 3,061 AAHUs = average annual habitat units
5.1.3 Sea Lamprey Control
For each alternative, sea lampreys would be controlled by the existing Union Street Dam.
Because the Union Street Dam is considered to be a barrier impermeable to sea lamprey,
Alternative 1 (the No Action Alternative), receives the same score for controlling sea
lamprey as the other alternatives, 3,328 AAHUs. Therefore, the net AAHU for sea
lamprey control for each alternative is zero. The results of the sea lamprey control
analysis indicate that modifying the Union Street Dam to continue preventing the
migration of sea lamprey is the best technique to limit this invasive species’ impact on
the Boardman River.
5.1.4 Average Annual Habitat Units
The net AAHUs scores from the fisheries, wetlands, and sea lamprey control analyses are
combined, and the sums generate the total AAHUs for each alternative. The net AAHU is
the difference between the with-project and the without-project (No Action Alternative)

Boardman River Feasibility Study Economic Analysis Appendix
Appendix B -18
values. The net AAHUs are used in the CE/ICA. A summary of the net AAHUs is
presented in Table 8. Alternative 5 would produce the most AAHUs, while Alternative 2
would produce the fewest additional AAHUs.
Table 8: Summary of Net Average Annual Habitat Units
Alternative Fisheries
AAHUs
Wetlands
AAHUs
Total Net
AAHUs
1. No Action 0 0 0
2. Modify Union 65 0 65
3. Modify Union, Remove Sabin 268 1,645 1,913
4. Modify Union, Remove Boardman 325 1,416 1,741
5. Modify Union, Remove Sabin and
Boardman 1,020 3,061 4,081
6. Remove Sabin 181 1,645 1,826
7. Remove Boardman 260 1,416 1,676
8. Remove Sabin and Boardman 441 3,061 3,502
AAHUs = average annual habitat units
5.2 Project Costs
All costs were calculated in terms of present value and then annualized. The average
annual cost (AAC) is based on 2012 price levels, the current fiscal year (FY14) Federal
discount rate of 3.50 percent, and a 50-year period of analysis. The discount rate,
specified by the Water Resources Council, is to be used by Federal agencies in the
formulation and evaluation of water and land resource plans. Costs include all
expenditures required to implement the alternatives. More detailed cost information is
available in Appendix C.
Construction costs for the Sabin and Boardman Dams include earthworks and site
preparation, stream restoration, dam removal, incidental construction, and re-vegetation.
The Union Street Dam construction costs include fish lift costs, demolition of the existing
spillway, earthworks and site clearing, structural concrete, and fencing. Administration
costs for the Sabin and Boardman Dams include soil sampling/analysis during the
planning, engineering and design phase and a Phase I analysis which would be completed
6 months prior to the acquisition of real estate. The interest during construction for each
alternative is calculated based on a period of 6 months for construction. The
environmental monitoring cost for each alternative is $10,000 per year for 3 years after
construction is complete and the present value is $28,000. Monitoring costs include
temperature and dissolved oxygen monitoring; fish sampling to assess fish species
diversity and abundance; and monitoring the channel and habitat structure stability.
Alternative 1, the No Action Alternative, assumes the three dams would be maintained
for another 50 years; the present value of the necessary improvements and maintenance is
approximately $1,929,100, an AAC of $82,200. This cost assumes an annual operation

Boardman River Feasibility Study Economic Analysis Appendix
Appendix B -19
and maintenance cost of $20,000 for each dam, a $500,000 repair of stop log structures at
the Union Street Dam, and $20,000 each for the Sabin and Boardman Dams to repair
degradation of structures. Cass Road is located on the top of the Boardman Dam. The
operation, maintenance, repair, replacement, and rehabilitation (OMRR&R) cost for the
No Action Alternative does not include costs to repair Cass Road Bridge, only the costs
to maintain the existing dams.
The OMRR&R cost for the Union Street Dam modification is approximately $24,000
(present value of $562,900), which includes trap-and-transfer costs. After their removal,
the Sabin and Boardman Dams would not have annual OMRR&R costs. For each
alternative, OMRR&R is calculated for the entire system, including all three dams. For
alternatives that include the removal of a dam or dams, the OMRR&R is associated with
the remaining dam(s).
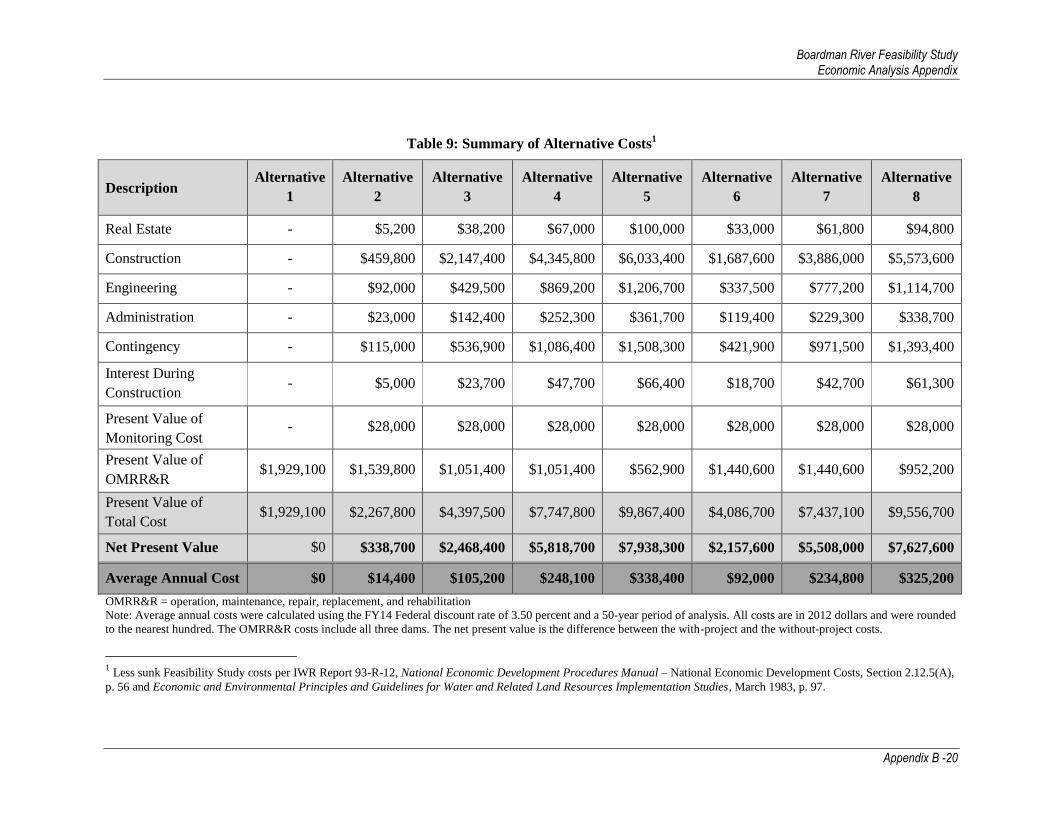
Table 9 summarizes the estimated cost for each alternative. All anticipated study costs
are included in the project costs. However, once study costs are incurred, they become
sunk costs and are no longer included in the project costs. Because the study costs
associated with this Feasibility Study have already been incurred, these costs are
considered sunk costs and are not included in the CE/ICA. The net present value is the
difference between the with-project and without-project costs. The net AACs are used in
the CE/ICA.
Boardman River Feasibility Study Economic Analysis Appendix
Appendix B -20
Table 9: Summary of Alternative Costs1
Description Alternative
1
Alternative
2
Alternative
3
Alternative
4
Alternative
5
Alternative
6
Alternative
7
Alternative
8
Real Estate - $5,200 $38,200 $67,000 $100,000 $33,000 $61,800 $94,800
Construction - $459,800 $2,147,400 $4,345,800 $6,033,400 $1,687,600 $3,886,000 $5,573,600
Engineering - $92,000 $429,500 $869,200 $1,206,700 $337,500 $777,200 $1,114,700
Administration - $23,000 $142,400 $252,300 $361,700 $119,400 $229,300 $338,700
Contingency - $115,000 $536,900 $1,086,400 $1,508,300 $421,900 $971,500 $1,393,400
Interest During
Construction - $5,000 $23,700 $47,700 $66,400 $18,700 $42,700 $61,300
Present Value of
Monitoring Cost - $28,000 $28,000 $28,000 $28,000 $28,000 $28,000 $28,000
Present Value of
OMRR&R $1,929,100 $1,539,800 $1,051,400 $1,051,400 $562,900 $1,440,600 $1,440,600 $952,200
Present Value of
Total Cost $1,929,100 $2,267,800 $4,397,500 $7,747,800 $9,867,400 $4,086,700 $7,437,100 $9,556,700
Net Present Value $0 $338,700 $2,468,400 $5,818,700 $7,938,300 $2,157,600 $5,508,000 $7,627,600
Average Annual Cost $0 $14,400 $105,200 $248,100 $338,400 $92,000 $234,800 $325,200
OMRR&R = operation, maintenance, repair, replacement, and rehabilitation
Note: Average annual costs were calculated using the FY14 Federal discount rate of 3.50 percent and a 50-year period of analysis. All costs are in 2012 dollars and were rounded
to the nearest hundred. The OMRR&R costs include all three dams. The net present value is the difference between the with-project and the without-project costs.
1 Less sunk Feasibility Study costs per IWR Report 93-R-12, National Economic Development Procedures Manual – National Economic Development Costs, Section 2.12.5(A),
p. 56 and Economic and Environmental Principles and Guidelines for Water and Related Land Resources Implementation Studies, March 1983, p. 97.

Boardman River Feasibility Study Economic Analysis Appendix
Appendix B -21
5.3 Cost Effectiveness Analysis
A CE analysis is conducted to ensure the least-cost alternatives are identified for various
levels of environmental output. The CE analysis begins with a comparison of the AAC
and the AAHUs of each alternative to identify the least-cost alternative for every level of
environmental output considered. The results of the CE analysis are summarized in Table
10.
Table 10: Cost Effectiveness Analysis Results
Alternative AAC AAHUs AAC/
AAHU
Cost Effective
(Y/N)
1. No Action $0 0 $0 Y
2. Modify Union $14,400 65 $222 Y
3. Modify Union, Remove Sabin $105,200 1,913 $55 Y
4. Modify Union, Remove Boardman $248,100 1,741 $143 N
5. Modify Union, Remove Sabin and
Boardman $338,400 4,081 $83 Y
6. Remove Sabin $92,000 1,826 $50 Y
7. Remove Boardman $234,800 1,676 $140 N
8. Remove Sabin and Boardman $325,200 3,502 $93 Y
AAC = average annual cost, AAHUs = average annual habitat units
Note: Average annual costs were calculated using the FY14 Federal discount rate of 3.50 percent and a
50-year period of analysis. All costs are in 2012 dollars.
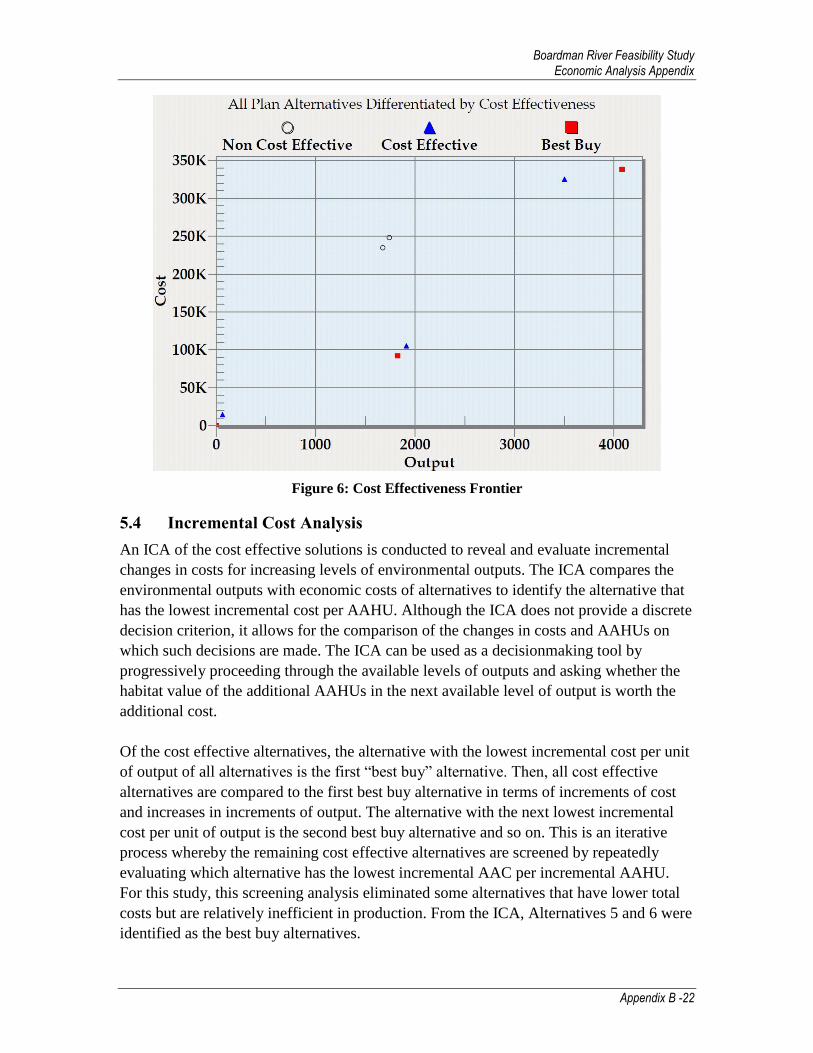
Figure 6 plots the environmental output of each alternative against the cost of each
alternative to create the “cost effectiveness frontier,” as indicated by an imaginary line
passing through all cost effective alternatives. Any alternatives above and to the left of
the cost effectiveness frontier line are not cost effective. Alternatives 4 and 7 are not cost
effective because Alternative 6 can produce more AAHUs at less cost. Therefore,
Alternatives 4 and 7 are removed from further consideration. Alternatives 1, 2, 3, 5, 6,
and 8 were determined to be cost effective.
Boardman River Feasibility Study Economic Analysis Appendix
Appendix B -22
Figure 6: Cost Effectiveness Frontier
5.4 Incremental Cost Analysis
An ICA of the cost effective solutions is conducted to reveal and evaluate incremental
changes in costs for increasing levels of environmental outputs. The ICA compares the
environmental outputs with economic costs of alternatives to identify the alternative that
has the lowest incremental cost per AAHU. Although the ICA does not provide a discrete
decision criterion, it allows for the comparison of the changes in costs and AAHUs on
which such decisions are made. The ICA can be used as a decisionmaking tool by
progressively proceeding through the available levels of outputs and asking whether the
habitat value of the additional AAHUs in the next available level of output is worth the
additional cost.
Of the cost effective alternatives, the alternative with the lowest incremental cost per unit
of output of all alternatives is the first “best buy” alternative. Then, all cost effective
alternatives are compared to the first best buy alternative in terms of increments of cost
and increases in increments of output. The alternative with the next lowest incremental
cost per unit of output is the second best buy alternative and so on. This is an iterative
process whereby the remaining cost effective alternatives are screened by repeatedly
evaluating which alternative has the lowest incremental AAC per incremental AAHU.
For this study, this screening analysis eliminated some alternatives that have lower total
costs but are relatively inefficient in production. From the ICA, Alternatives 5 and 6 were
identified as the best buy alternatives.

Boardman River Feasibility Study Economic Analysis Appendix
Appendix B -23
Table 11 presents a summary of the ICA. The ICA results show the additional cost that
would be incurred to gain additional AAHUs for each successive level of attainable
AAHUs. Because Alternative 1 entails making no changes, the concept of incremental
values does not apply. Alternatives 5 and 6 were identified as best buy alternatives.
Table 11: Results of the Incremental Cost Analysis
Alternative AAC AAHUs Incremental
Cost
Increment
al AAHUs
Incremental
Cost per
AAHU
Best
Buy
1. No Action $0 - - - - Y
2. Modify Union $14,400 65 $14,400 65 $222
6. Remove Sabin $92,000 1,826 $77,600 1761 $44 Y
3. Modify Union,
Remove Sabin $105,200 1,913 $13,200 87 $152
8. Remove Sabin
and Boardman $325,200 3,502 $220,000 1589 $138
5. Modify Union,
Remove Sabin
and Boardman
$338,400 4,081 $13,200 579 $23 Y
AAC = average annual cost, AAHUs = average annual habitat units
Note: Average annual costs were calculated using the FY14 Federal discount rate of 3. 50 percent and a 50-
year period of analysis. All costs are in 2012 dollars.
5.5 Incidental Benefits
The presence of the dams has disrupted the Boardman River ecosystem and has reduced
the populations of trout and other coldwater fish species. For each dam that would be
removed, the populations of trout and other coldwater fish species are anticipated to
increase as the populations of warmwater fish species decline. Fishing for warmwater
fish species may decrease; however, other fisheries nearby would serve as substitute
fishing sites, whereas coldwater fisheries are less common in the area. Canoeing and
kayaking on the Boardman River requires portaging at each existing dam. Dam removal
may increase canoeing and kayaking trips on the Boardman River, as the river would be
more continuous.
6 Summary
Alternatives 5 and 6 were identified as best buy alternatives, with Alternative 5 producing
the most AAHUs of all the alternatives. The CE/ICA is not intended to lead to a single
best solution (as in an economic cost-benefit analysis); however, the analyses improve
the quality of decisions by ensuring a supportable approach for considering and selecting
an alternative.

Boardman River Feasibility Study Economic Analysis Appendix
Appendix B -24
References
Charter Township of Garfield. 2012. Five-Year Parks and Recreation Master Plan.
Charter Township of Garfield, Grand Traverse County, Michigan. Available online:
http://garfield-twp.com/downloads/garfield_township_parks_and_ recreation_plan_
011312_ final_draft.pdf; accessed January 2012.
Huggler and Barfknecht. 1995. Fifty Rivers (Fish Michigan). Friede Publications.
Davison, Michigan.
U.S. Army Corps of Engineers. 1995a. Ecosystem Restoration in the Civil Works
Program, EC 1105-2-210, U.S. Army Corps of Engineers, Washington, DC.
———. 1995b. Evaluation of Environmental Investments Procedures Manual: Cost
Effectiveness and Incremental Cost Analyses. Institute for Water Resources
Report #95-R-1, U.S. Army Corps of Engineers, Alexandria, VA.
———. 1993. National Economic Development Procedures Manual – National
Economic Development Costs. Institute for Water Resources Report #95-R-12,
U.S. Army Corps of Engineers, Fort Belvoir, VA.
U.S. Census Bureau. 2010a. American Community Survey 2006–2010, 5-Year Estimates:
Kalkaska County, Grand Traverse County, Michigan. Available online:
http://www.census.gov/acs/www/; accessed January 2012.
———. 2010b. American FactFinder: Kalkaska County, Grand Traverse County,
Michigan. Available online:
http://factfinder2.census.gov/faces/nav/jsf/pages/index.xhtml; accessed January
2012.
Water Resources Council. 1983. Economic and Environmental Principles and Guidelines
for Water and Related Land Resources Implementation Studies. Water Resources
Council, Washington, DC. March 10.