Embed Size (px)
Citation preview

Application of High Speed UHPLCApplication of High‐Speed UHPLC and High‐Resolution Orbitrap‐MS in the Analysis of Pharmaceutical Compounds
Christian Huber
ThermoScientific Lunch Symposium @ HPLC2011
Citius,altius,
f tifortius
Department of Molecular BiologyDivision of Chemistry and Bioanalytics 2
Cs. Horváth, LC GC Magazine, 9, 1996, 622‐623
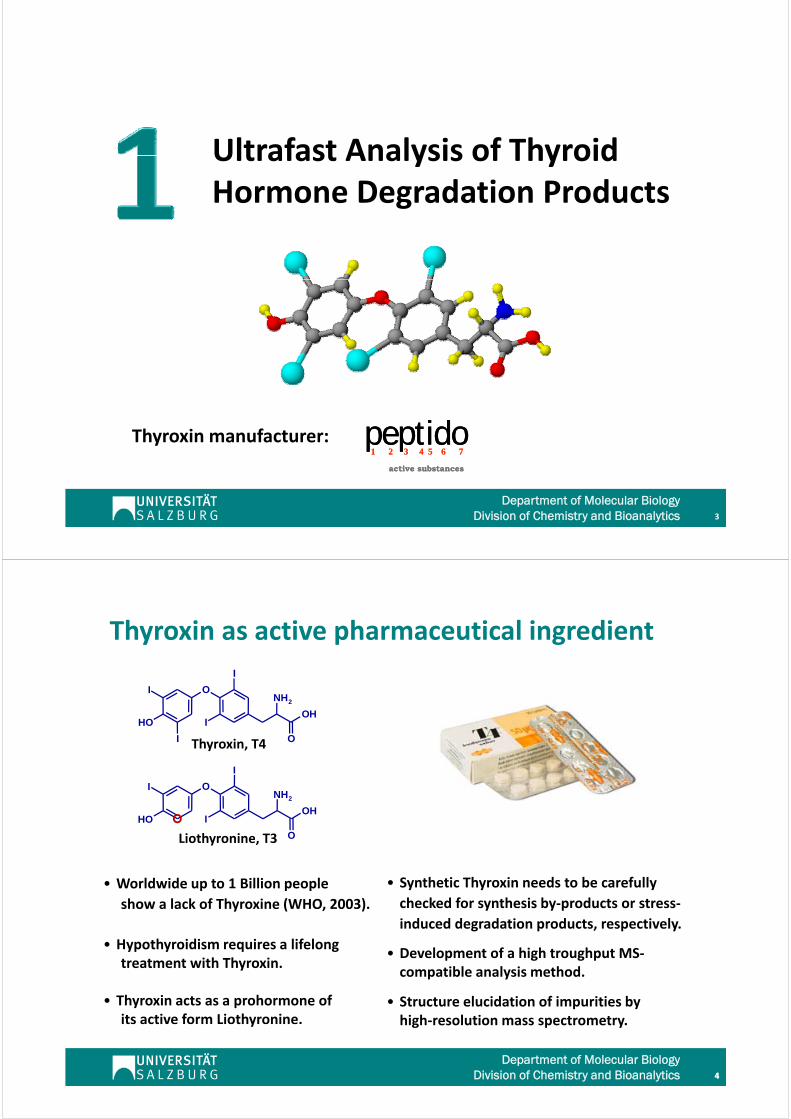
Ultrafast Analysis of ThyroidUltrafast Analysis of Thyroid Hormone Degradation Products
Thyroxin manufacturer: peptido1 2 3 4 5 6 7peptido
1 2 3 4 5 6 7
Department of Molecular BiologyDivision of Chemistry and Bioanalytics 3
active substancesactive substances
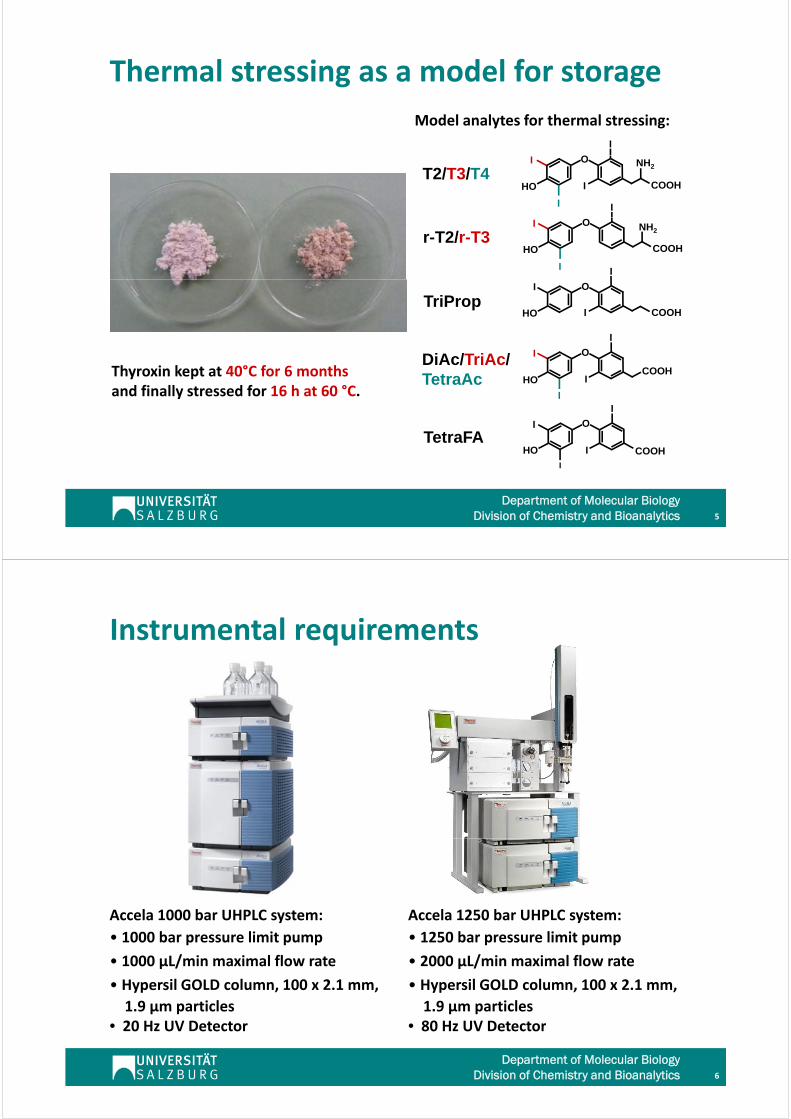
Thyroxin as active pharmaceutical ingredient
I O
I
OH
NH2
Thyroxin, T4
OH
I
IOH
O
I
Liothyronine T3
I
OH
O
IOH
O
NH2
Liothyronine, T3 O
• Synthetic Thyroxin needs to be carefully
checked for s nthesis b prod cts or stress
• Worldwide up to 1 Billion people
h l k f Th i (WHO 2003) checked for synthesis by‐products or stress‐
induced degradation products, respectively.
• Development of a high troughput MS‐
show a lack of Thyroxine (WHO, 2003).
• Hypothyroidism requires a lifelong treatment with Thyroxin
compatible analysis method.
• Structure elucidation of impurities byhigh‐resolution mass spectrometry.
treatment with Thyroxin.
• Thyroxin acts as a prohormone ofits active form Liothyronine.
Department of Molecular BiologyDivision of Chemistry and Bioanalytics 44
high resolution mass spectrometry.y
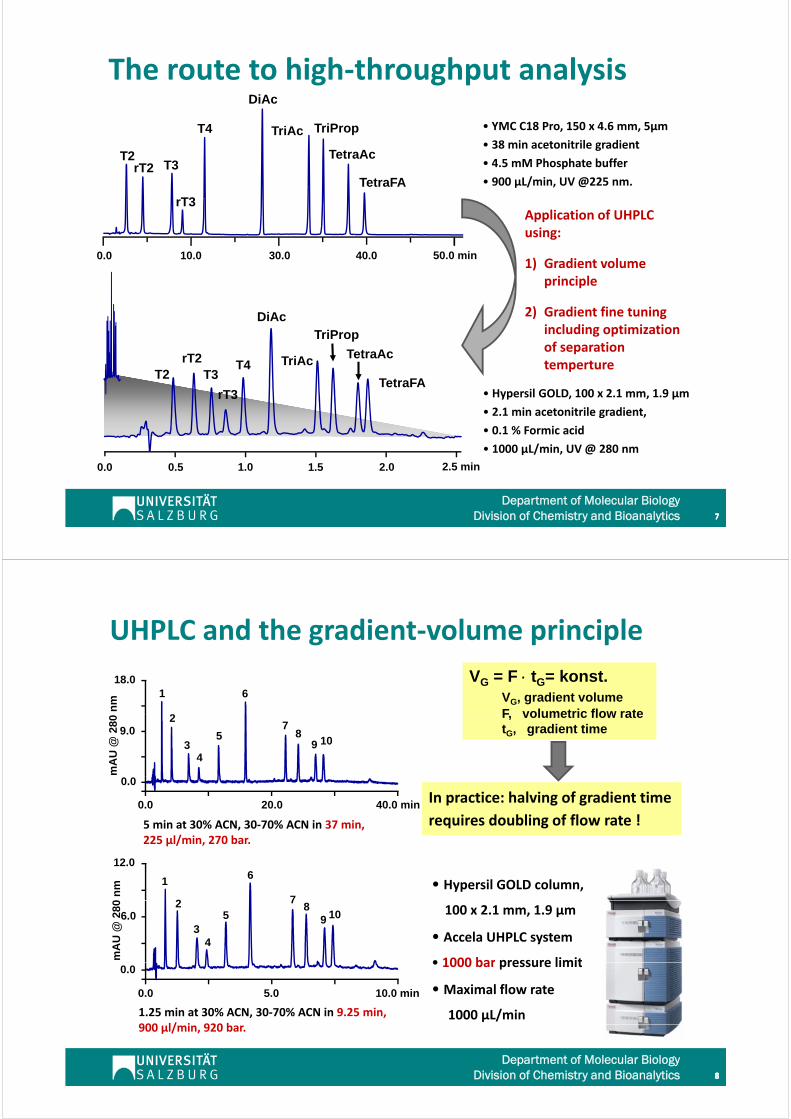
Thermal stressing as a model for storage
Model analytes for thermal stressing:
O
I
T2/T3/T4O
I
HO
I
I
NH2
COOH
I
r-T2/r-T3
I
O
HO
I NH2
COOH
I
TriPropO
HO
I
I COOH
I
Thyroxin kept at 40°C for 6 monthsand finally stressed for 16 h at 60 °C.
DiAc/TriAc/TetraAc
O
I
HO
I
ICOOH
TetraFAO
I
I
HO
I
I COOH
Department of Molecular BiologyDivision of Chemistry and Bioanalytics 5
I
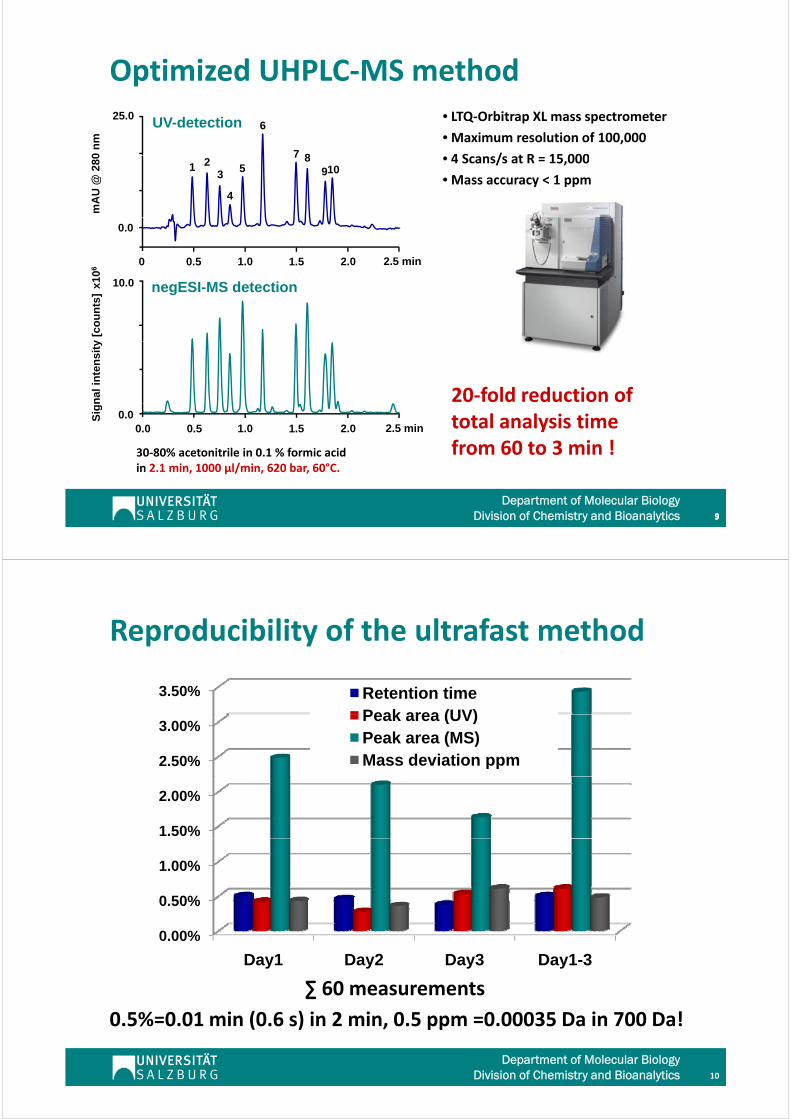
Instrumental requirements
Accela 1000 bar UHPLC system:
• 1000 bar pressure limit pump
• 1000 µL/min maximal flow rate
Accela 1250 bar UHPLC system:
• 1250 bar pressure limit pump
• 2000 µL/min maximal flow rate• 1000 µL/min maximal flow rate
• Hypersil GOLD column, 100 x 2.1 mm,
1.9 µm particles• 20 Hz UV Detector
• 2000 µL/min maximal flow rate
• Hypersil GOLD column, 100 x 2.1 mm,
1.9 µm particles• 80 Hz UV Detector
Department of Molecular BiologyDivision of Chemistry and Bioanalytics 6
• 20 Hz UV Detector • 80 Hz UV Detector
The route to high‐throughput analysis
• YMC C18 Pro, 150 x 4.6 mm, 5µm
• 38 min acetonitrile gradientT4
DiAc
TriAc TriProp
TetraAcT2• 4.5 mM Phosphate buffer
• 900 µL/min, UV @225 nm.
rT3
rT2 T3TetraAc
TetraFA
Application of UHPLC
T2
Application of UHPLC using:
1) Gradient volumeprinciple
0.0 10.0 30.0 40.0 50.0 min
principle
2) Gradient fine tuning including optimization
DiAcTriProp
of separation temperture
T2
• Hypersil GOLD, 100 x 2.1 mm, 1.9 µm
rT2
rT3
T3T4 TriAc
p
TetraAc
TetraFA
0 0 0 5 2 5 min1 5 2 01 0
• 2.1 min acetonitrile gradient,
• 0.1 % Formic acid
• 1000 µL/min, UV @ 280 nm
Department of Molecular BiologyDivision of Chemistry and Bioanalytics 77
0.0 0.5 2.5 min1.5 2.01.0
UHPLC and the gradient‐volume principle
18.0
nm
1
2
6
VG = F tG= konst.VG, gradient volumeF volumetric flow rate
mA
U @
280
2
34
57
89 10
9.0
F, volumetric flow ratetG, gradient time
5 min at 30% ACN, 30‐70% ACN in 37 min, 225 µl/min 270 bar
0.0 20.0 40.0 min
0.0
In practice: halving of gradient time
requires doubling of flow rate !225 µl/min, 270 bar.
12.0
0 n
m 1
2
6
7• Hypersil GOLD column,
mA
U @
280 2
34
5
78
9 106.0 100 x 2.1 mm, 1.9 µm
• Accela UHPLC system
• 1000 bar pressure limit
1.25 min at 30% ACN, 30‐70% ACN in 9.25 min, 900 l/ i 920 b
0.0 5.0 10.0 min
0.0• 1000 bar pressure limit
•Maximal flow rate
1000 µL/min
Department of Molecular BiologyDivision of Chemistry and Bioanalytics 888
900 µl/min, 920 bar.
Optimized UHPLC‐MS method0
nm
25.06
7 8
UV-detection • LTQ‐Orbitrap XL mass spectrometer
• Maximum resolution of 100,000
4 S / t R 15 000
mA
U @
280 1 2
3
4
7 89105
• 4 Scans/s at R = 15,000
• Mass accuracy < 1 ppm
106
0.0
10 0
0 0.5 2.5 min1.5 2.01.0
y [c
ou
nts
]x1 10.0 negESI-MS detection
20‐fold reduction of nal
in
ten
sity
total analysis time from 60 to 3 min !
Sig
n
0.00.0 0.5 2.5 min1.5 2.01.0
30‐80% acetonitrile in 0.1 % formic acid i 2 1 i 1000 l/ i 620 b 60°C
Department of Molecular BiologyDivision of Chemistry and Bioanalytics 999
in 2.1 min, 1000 µl/min, 620 bar, 60°C.
Reproducibility of the ultrafast method
3.50% Retention timePeak area (UV)
2.50%
3.00%Peak area (UV)Peak area (MS)Mass deviation ppm
1.50%
2.00%
0 50%
1.00%
0.00%
0.50%
Day1 Day2 Day3 Day1-3Day1 Day2 Day3 Day1 3
∑ 60 measurements
0.5%=0.01 min (0.6 s) in 2 min, 0.5 ppm =0.00035 Da in 700 Da!
Department of Molecular BiologyDivision of Chemistry and Bioanalytics 10
0.5% 0.01 min (0.6 s) in 2 min, 0.5 ppm 0.00035 Da in 700 Da!
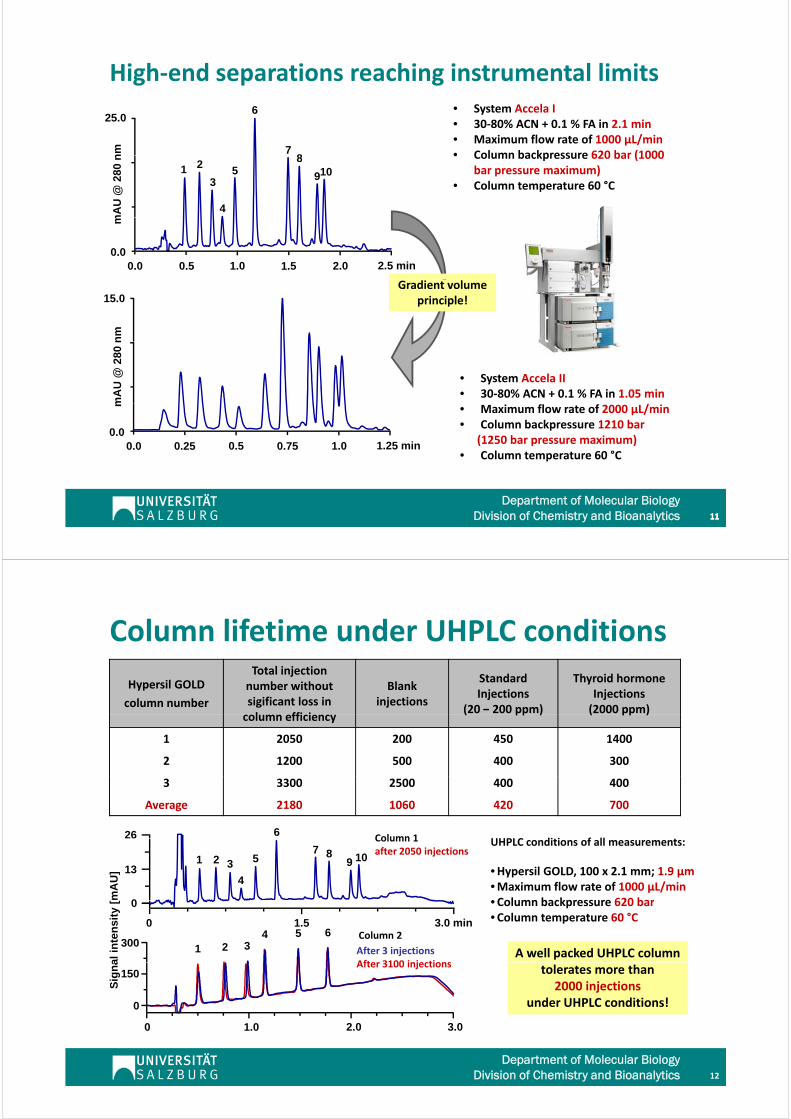
High‐end separations reaching instrumental limits
25.0n
m• System Accela I• 30‐80% ACN + 0.1 % FA in 2.1 min• Maximum flow rate of 1000 µL/min• Column backpressure 620 bar (1000
6
78
mA
U @
280
n • Column backpressure 620 bar (1000 bar pressure maximum)
• Column temperature 60 °C
1 2
3
4
8
9105
0.00.0 0.5 2.5 min1.5 2.01.0
m
15.0
nm
Gradient volume principle!
mA
U @
280
n
• System Accela II• 30‐80% ACN + 0.1 % FA in 1.05 min
0.00.0 0.25 1.25 min0.75 1.00.5
m • Maximum flow rate of 2000 µL/min• Column backpressure 1210 bar
(1250 bar pressure maximum)• Column temperature 60 °C
Department of Molecular BiologyDivision of Chemistry and Bioanalytics 111111
Column lifetime under UHPLC conditions
Hypersil GOLD
column number
Total injection number without sigificant loss in column efficiency
Blankinjections
StandardInjections
(20 – 200 ppm)
Thyroid hormoneInjections(2000 ppm)
column efficiency( pp ) ( pp )
1 2050 200 450 1400
2 1200 500 400 300
3 3300 2500 400 400
Average 2180 1060 420 700
26 6Column 1 UHPLC di i f ll
0
132 3
4
57
9 1081
Column 1 after 2050 injections
UHPLC conditions of all measurements:
•Hypersil GOLD, 100 x 2.1 mm; 1.9 µm•Maximum flow rate of 1000 µL/min•Column backpressure 620 barm
AU
]
0
0
1.5 3.0 min
•Column backpressure 620 bar•Column temperature 60 °C
A well packed UHPLC column300
al i
nte
nsi
ty [
1 2 34 5 6
After 3 injectionsAfter 3100 injections
Column 2
tolerates more than 2000 injections
under UHPLC conditions!
0
0
150
1 0 2 0 3 0
Sig
na After 3100 injections
Department of Molecular BiologyDivision of Chemistry and Bioanalytics 12
0 1.0 2.0 3.0
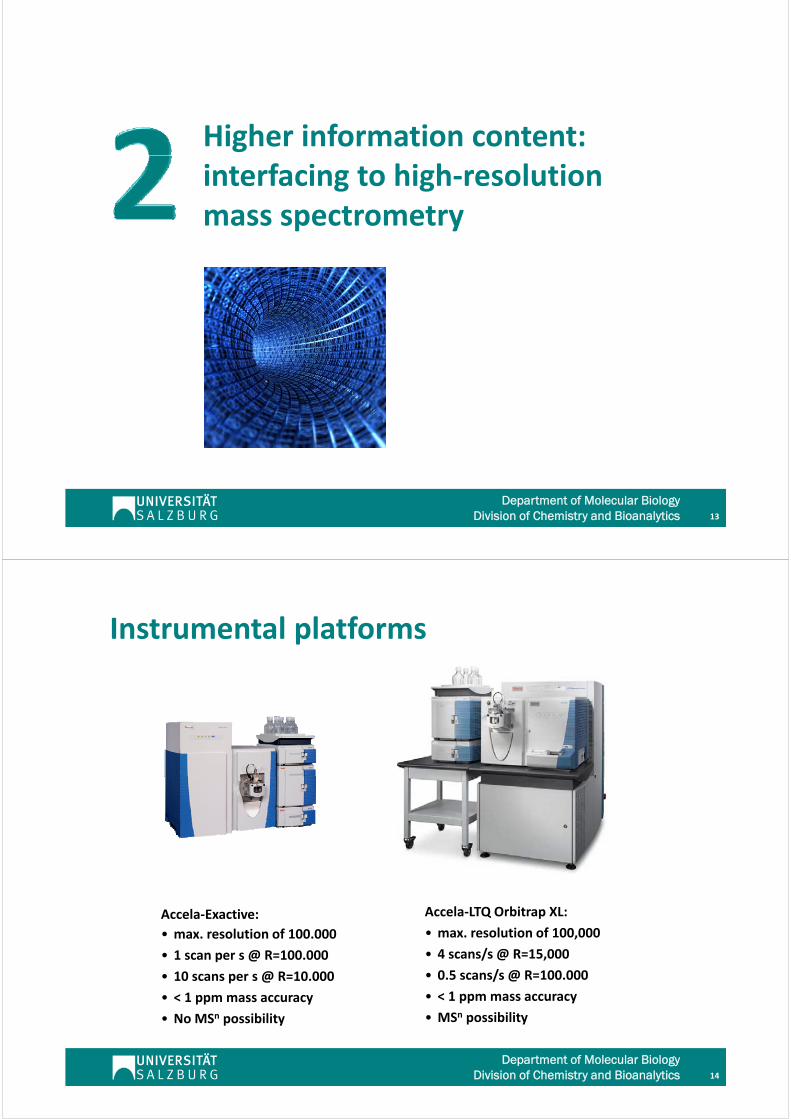
Higher information content: interfacing to high‐resolutionmass spectrometrymass spectrometry
Department of Molecular BiologyDivision of Chemistry and Bioanalytics 13
Instrumental platforms
Accela‐Exactive:
• max. resolution of 100.000
• 1 scan per s @ R=100.000
Accela‐LTQ Orbitrap XL:
• max. resolution of 100,000
• 4 scans/s @ R=15,000
• 10 scans per s @ R=10.000
• < 1 ppm mass accuracy
• No MSn possibility
• 0.5 scans/s @ R=100.000
• < 1 ppm mass accuracy
• MSn possibility
Department of Molecular BiologyDivision of Chemistry and Bioanalytics 14
p y p y
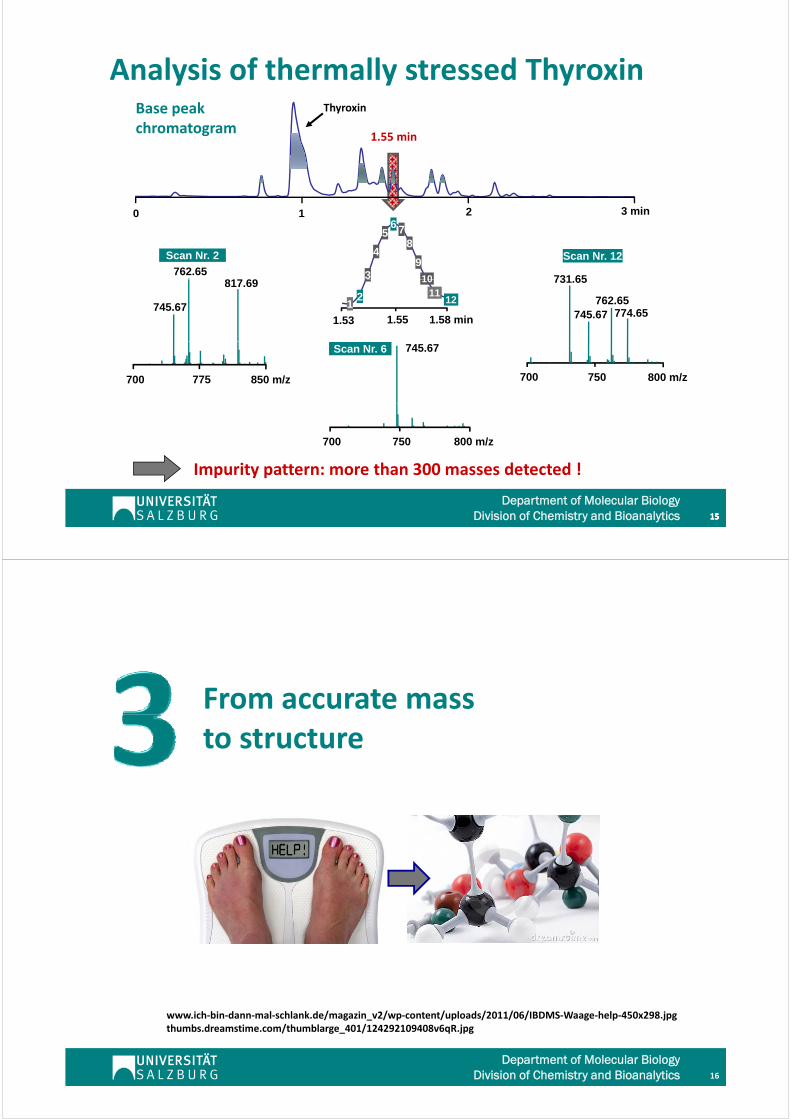
Analysis of thermally stressed Thyroxin
1.55 min
Base peak chromatogram
Thyroxin
1 2 3 min0
3
4
5 78
9
10817 69762.65
Scan Nr. 2
6
731 65
Scan Nr. 12
1.53 1.55 1.58 min
1
10
112817.69
745.6712 762.65
774.65745.67
731.65
775 850 m/z700
745.67Scan Nr. 6
750 800 m/z700
750 800 m/z700
I it tt th 300 d t t d !
Department of Molecular BiologyDivision of Chemistry and Bioanalytics 151515
Impurity pattern: more than 300 masses detected !
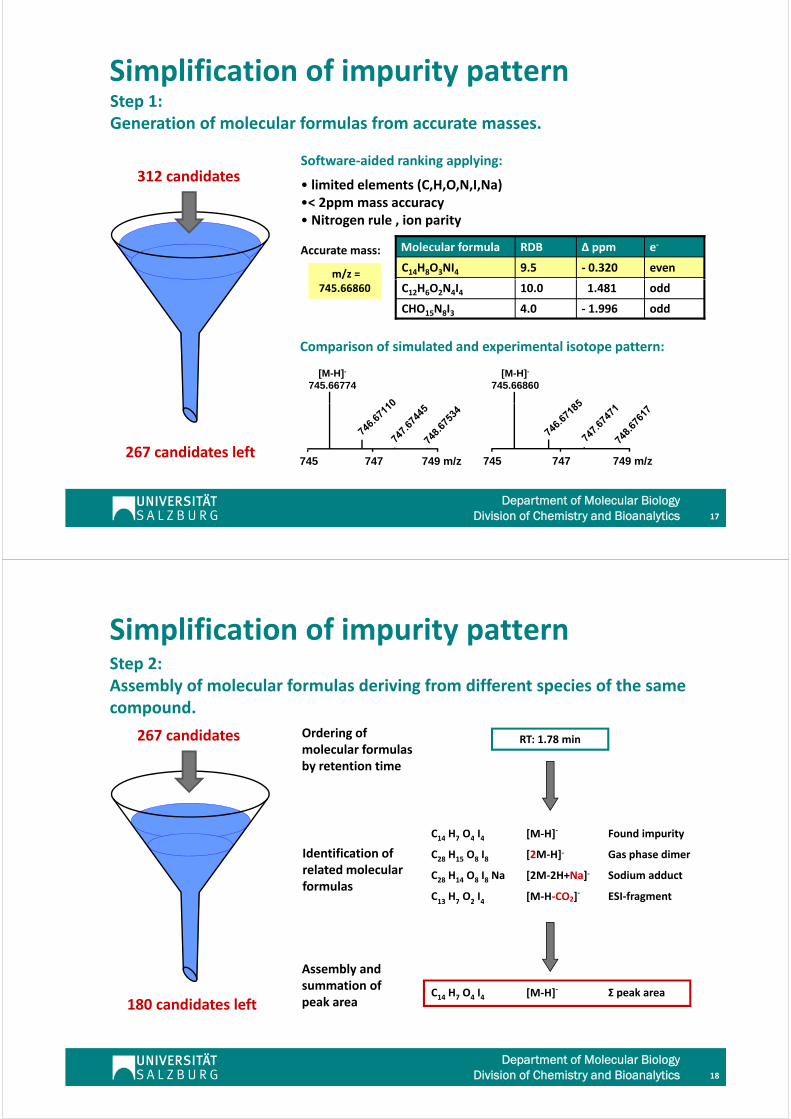
From accurate mass to structure
www.ich‐bin‐dann‐mal‐schlank.de/magazin_v2/wp‐content/uploads/2011/06/IBDMS‐Waage‐help‐450x298.jpgh b d / h bl /
Department of Molecular BiologyDivision of Chemistry and Bioanalytics 16
thumbs.dreamstime.com/thumblarge_401/124292109408v6qR.jpg
Simplification of impurity patternStep 1: Generation of molecular formulas from accurate masses.
f id d ki l i312 candidates
Software‐aided ranking applying:
• limited elements (C,H,O,N,I,Na)•< 2ppm mass accuracy Nit l i it
even‐ 0.3209.5C14H8O3NI4
e‐Δ ppmRDBMolecular formula
• Nitrogen rule , ion parity
m/z =
Accurate mass:
odd‐ 1.9964.0CHO15N8I3
odd1.48110.0C12H6O2N4I4
i f i l d d i l i
745.66860
[M-H]-
745.66774
Comparison of simulated and experimental isotope pattern:
[M-H]-
745.66860
267 candidates left749 m/z745 747 749 m/z745 747
Department of Molecular BiologyDivision of Chemistry and Bioanalytics 17
Simplification of impurity patternStep 2: Assembly of molecular formulas deriving from different species of the same compound.
267 candidates
p
Ordering of molecular formulasby retention time
RT: 1.78 min
[M‐H]‐ Found impurityC14 H7 O4 I4
[M‐H‐CO2]‐
[2M‐2H+Na]‐
[2M‐H]‐
[ ]
Sodium adductC28 H14 O8 I8 Na
Gas phase dimerC28 H15 O8 I8
ESI‐fragmentC13H7O
2I4
p y14 7 4 4
Identification of related molecularformulas
[ 2] g13 7 2 4
180 candidates left[M‐H]‐ Σ peak areaC14 H7 O4 I4
Assembly andsummation of peak area
Department of Molecular BiologyDivision of Chemistry and Bioanalytics 18
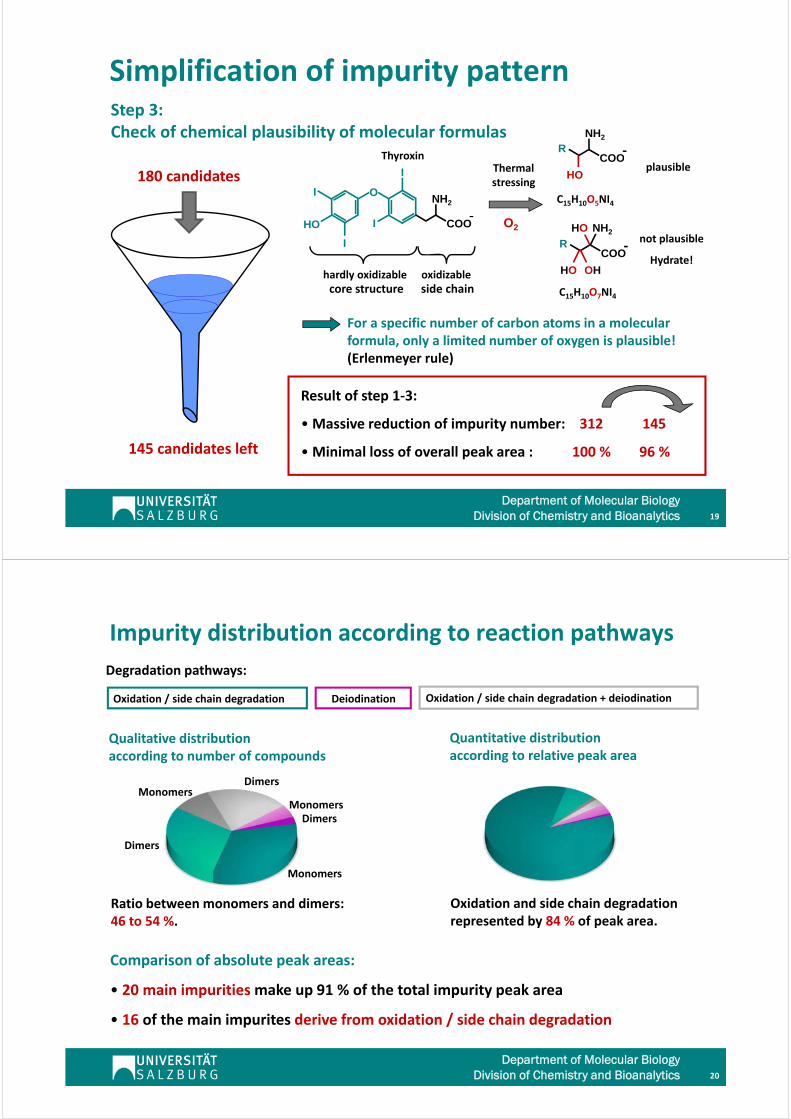
Simplification of impurity patternStep 3: Check of chemical plausibility of molecular formulas NH2
COOR
Thyroxin
180 candidatesplausibleThermal
stressing
COO
HO
C15H10O5NI4O
I
INH2
Thyroxin
NH2
COOR
HO OH
HOnot plausible
Hydrate!
O2
hardly oxidizable
I
HO I COO
oxidizable
For a specific number of carbon atoms in a molecularformula only a limited number of oxygen is plausible!
C15H10O7NI4
ycore structure side chain
formula, only a limited number of oxygen is plausible!(Erlenmeyer rule)
Result of step 1‐3:
145 candidates left
•Massive reduction of impurity number: 312 145
•Minimal loss of overall peak area : 100 % 96 %
Department of Molecular BiologyDivision of Chemistry and Bioanalytics 19
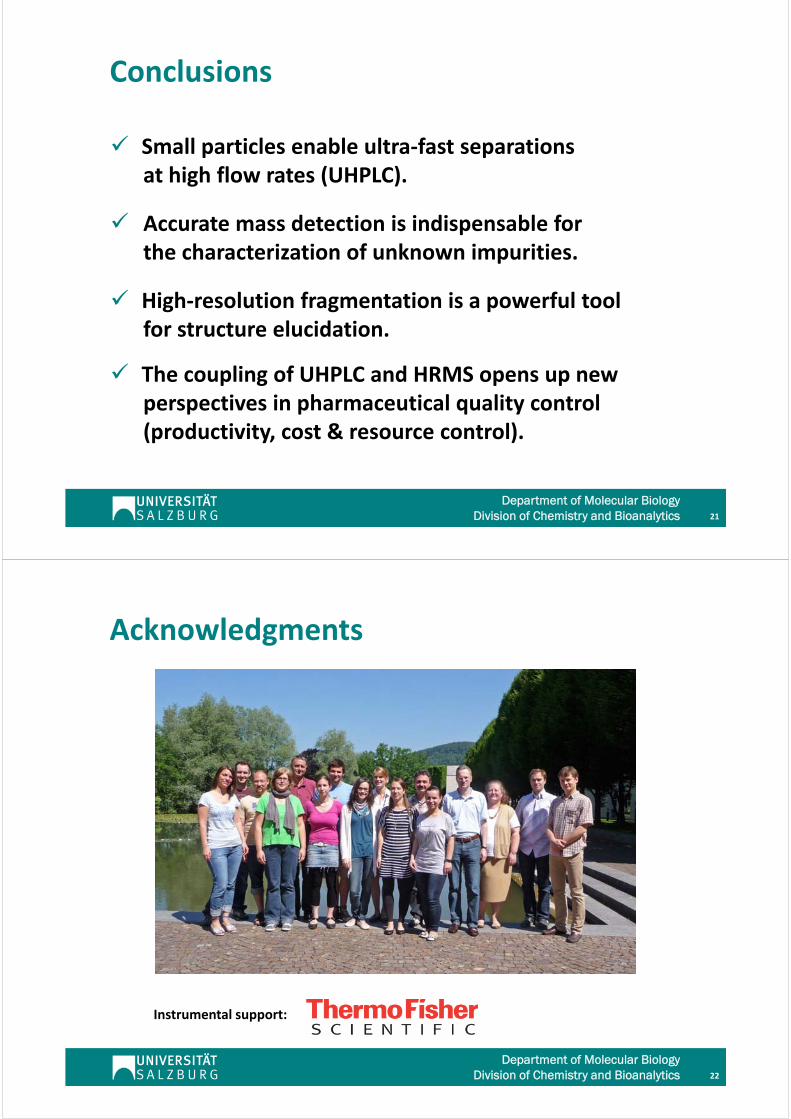
Impurity distribution according to reaction pathways
Degradation pathways:
Deiodination Oxidation / side chain degradation + deiodinationOxidation / side chain degradation
Quantitative distributionaccording to relative peak area
Qualitative distributionaccording to number of compounds
MonomersDimers
MonomersDimers
O id ti d id h i d d tiR ti b t d di
Monomers
Dimers
Oxidation and side chain degradationrepresented by 84 % of peak area.
Ratio between monomers and dimers: 46 to 54 %.
Comparison of absolute peak areas:Comparison of absolute peak areas:
• 20 main impurities make up 91 % of the total impurity peak area
• 16 of the main impurites derive from oxidation / side chain degradation
Department of Molecular BiologyDivision of Chemistry and Bioanalytics 20
16 of the main impurites derive from oxidation / side chain degradation
Conclusions
Small particles enable ultra‐fast separationsp pat high flow rates (UHPLC).
A t d t ti i i di bl f Accurate mass detection is indispensable for the characterization of unknown impurities.
High‐resolution fragmentation is a powerful toolfor structure elucidation.
The coupling of UHPLC and HRMS opens up new perspectives in pharmaceutical quality controlperspectives in pharmaceutical quality control(productivity, cost & resource control).
Department of Molecular BiologyDivision of Chemistry and Bioanalytics 21
Acknowledgments
Instrumental support:
Department of Molecular BiologyDivision of Chemistry and Bioanalytics 22