Embed Size (px)
Citation preview

AID-RI48 684 DEVELOPMENT OF HOLOGRAPHIC PARTICLE FIELD DATA i-REDUCTION BY FOURIER ANALY..(U) SPECTRON DEVELOPMENTLABS INC COSTA MESA CA J D TROLINGER ET AL. 14 AUG 84
UNCLASSIFIED SDL-84-233 3FAFALTR429F/ 14/5 NL
EEEBEllEEEhhhEE/EEEEE/EEEEhEEEllhhE/hhhhE

1111la I.'112-2hu
1111.8jjjjjL25 111 .4 1111
MICROCOPY RESOLUTION TEST CHARTNATIONAL BURAU OF STANDARDS 1963 A
0A
AFWAL-TR-84-2091
DEVELOPMENT OF HOLOGRAPHIC PARTICLE FIELD DATAREDUCTION BY FOURIER ANALYSIS
Dr. James D. TrolingerDr. Cecil F. Hess
SPECTRON DEVELOPMENT LABORATORIES, INC.3033 HARBOR BLVDCOSTA MESA, CALIFORNIA 92626
00 AUGUST 1984
"' FINAL REPORT FOR PERIOD FEBRUARY - OCTOBER 1984
APPROVED FOR PUBLIC RELEASE; DISTRIBUTION UNLIMITED
DTICELECTiDEC 1 794
AERO PROPULSION LABORATORY K UAIR FORCE WRIGHT AERONAUTICAL LABORATORIESAIR FORCE SYSTEM COMMANDWRIGHT-PATTERSON AIR FORCE BASE, OHIO 45433
* 84 12 06 078

'6 VI"%
NOTICE
When Government drawings, specifications, or other data are used for any purposeother than in connection with a definitely related Government procurement operation,the United States Government thereby incurs no responsibility nor any obligationwhatsoeier; and the fact that the government may have formulated, furnished, or inany way supplied the said drawings, specifications, or other data, is not to be re-garded by implication or otherwise as in any manner licensing the holder or anyother person or corporation, or conveying any rights or permission to manufacture
• .. use, or sell any patented invention that may in any way be related thereto.
This report has been reviewed by the Office of Public Affairs (ASD/PA) and isreleasable to the National Technical Information Service (NTIS). At NTIS, it willbe available to the general public, including foreign nations.
This technical report has been reviewed and is approved for publication.
ABDOLLAH S. NEJf, 2Lt, USAF 'RO QfR R. CRAIGAerospace Engin er Technical Area ManagerRamjet Technology Branch Ramjet Technology BranchRamjet Engine Division Ramjet Engine Division
FORAero Propulsion Laboratory Aero Propulsion Laboratory
FRANK D. STULL, Actg. Deputy DirectorRamjet Engine Division
* * :Aero Propulsion Laboratory
0
0 i"f vJur address has changed, if you wish to be removed from our mailing list, orif the addressee is no longer employed by yoqr organization please notifyAFWAL/PORT_,
"" W-PAFB, OH 45433 to help us maintain a current mailing list".
". Copies of this report should not be returned unless return is required by securityr" considerations, contractual obligations, or notice on a specific document.
• . ' * .°I * * ~ - **%** . , .~

.UNCLASSIFIED* SECURITY CLASSIFICATION OF THIS PAGE
REPORT DOCUMENTATION PAGEIa. REPORT SECURITY CLASSIFICATION lb. RESTRICTIVE MARKINGS
Unclassified2a, SECURITY CLASSIFICATION AUTHORITY 3. OISTRIBUTION/AVAILABILITY OF REPORT
N/A Approved for public release; distribution2b. OECLASSIFICATION/DOWNGRADING SCHEDULE unlimited.N/A unlimited.
4. PERFORMING ORGANIZATION REPORT NUMBER(S) 5. MONITORING ORGANIZATION REPORT NUMBER(S)
SDL No. 84-2338-03F AFWAL-TR-84-20916& NAME OF PERFORMING ORGANIZATION b. OFFICE SYMBOL 7a. NAME OF MONITORING ORGANIZATION
Spectron Development (Itappla be) Aero Propulsion Laboratory (AFWAL/PORT)Z Laboratories _Air. Force Wright Aeronautical Laboratories
6c. ADDRESS (City. State and ZIP Code) ?b. ADDRESS (City. State and ZIP Code)
3033 Harbor Blvd., Suite G-3Costa Mesa CA 92626 Wright-Patterson AFB OH 45433
-a. NAME OF FUNDING/SPONSORING Sb. OFFICE SYMBOL 9. PROCUREMENT INSTRUMENT IDENTIFICATION NUMBER=, ,O R GAN IZAT ION (if appicable)ORAIZO F33615-83-C-2372
Se. ADDRESS (City. State and ZiP Code) 10. SOURCE OF FUNDING NOS.
PROGRAM PROJECT TASK WORK UNITELEMENT NO. NO. NO. NO.
11. TITLE (include Security Clafication) Development of HolD-graphic Particle Field Data Reduction by 65502F 3005 20 06
12. PERSONAL AUTHORMs)Fourier Analysis (U)Dr. James D. Trolinqer and Dr. Cecil F. Hess
13.. TYPE OF REPORT 13b. TIME COVERED 14. DATE OF REPORT (Yr.. Mo.. Day) 15. PAGE COUNT
Final FROM 13Feb84 TO 130ct8 14 August 1984 6816. SUPPLEMENTARY NOTATION
This report is the result of a SBIR program.17. COSATI CODES lS SUBJECT TERMS (Continue on reuere if necemary and Identify by block number)
FIELD GROUP SUB. GR.
21 08 Holography, Particle Sizing,12 01 Automatic Particle Size Distribution Analysis
19. ABSTRACT (Continue on rerse if neceaaary and identify by block number)
The purpose of this work is to establish the feasibility of using a Fourier transform- analysis to automatically extract size distribution from particle field off-axis holograms.* Both experimental and theoretical studies were conducted to show that this technique is
feasible. A holographic system was designed and built compatible for use with acommercially available Fourier transform analyzer and software. Holograms of a standardparticle field were obtained, and the scattered light of both the particle field and itshologram were Fourier transform analyzed. The Sauter mean diameter determined by the twomethods agreed to within 5%. The experimental and theoretical studies show that theprediction of the size distribution could be improved by increasing the diffractionefficiency of the hologram. This can be accomplished by producing phase holograms.
Spray holograms were also Fourier transform analyzed at various locations of the spray.
Photographs of the spray are provided for comparison. The results of this phase_ (c.aat!4)--
* 20. DISTRIBUTION/AVAILABILITY OF ABSTRACT 21. ABSTRACT SECURITY CLASSIFICATION
UNCLASSIFIED/UNLIMITED U{ SAME AS APT. C OTIC USERS 0 Unclassified
22a. NAME OF RESPONSIBLE INDIVIDUAL 22b. TELEPHONE NUMBER 22c. OFFICE SYMBOL(Include Ape Code)
Abdollah S. Nejad, 2LT, USAF (513) 255-4171 RT
' DO FORM 1473,83 APR EDITION OF I JAN 73 is OBSOLETE. UNCLASSIFIEDSECURITY CLASSIFICATION OF THIS PAGE
%..

- SECURITY CLASSIFICATION OF THIS PAGE
6 BLOCK 19. ABSTrACT (Cont'd)
-show that this method will yield very fast analysis of large amounts of holographic data.
The integration of holography and Fourier transform analysis will permit the acquisitionand analysis of very useful data yet unattainable. Moreover, this combination will solvethe long standing problem of extracting the vast quantity of data stored in holograms.This technique will find commercial applications in a variety of two-phase flows includingspray combustion, rocket plume studies, explosions, and other transient events, atmosphericstudies and spray diagnostics to mention a few.
I _L(
~UNCLASSIFIED
~SECURITY CLASSIFICATION OF THIS PAGE
4 ," .'_'.. _ ,.. 9. -.- . ... ., .. .. .- ,.., . ., .-.-. -.......... 4... ..:.i.:. ,,Z.... ,,.,;

-7
APPENDIX BU.S. DEPARTMENT OF DEFENSE
SMALL BUSINESS INNOVATION RESEARCH PROGRAMPHASE I-FY 1983
PROJECT SUMMARY- SDL No. 84-2338-03F F33615-83-C-2372
FOR DOD USE ONLY
SProgram Office Proposal No. 1Topic No.
S.'TO BE COMPLETED BY PROPOSER
Name and Address of Proposer Spectron Development Laboratories, Inc.
3303 Harbor Blvd., Suite G-3
* 'Costa Mesa, CA 92626
Name and Title of Principal InvestigatorJames D. Trolinger, Ph.D., Technical DirectorCecil F. Hess, Ph.D., Senior Scientist and Timothy R. Wilmot, Electro-Optical Engineer
f. Title of Project
DEVELOPMENT OF HOLOGRAPHIC PARTICLE FIELD DATA REDUCTION BY FOURIER ANALYSIS
.*. Technical Abstract (Limit to two hundred words) The purpose of this work is to establish the
feasibility of using a Fourier transform analysis to automatically extract size distributiofrom particle field off-axis holograms. Both experimental and theoretical studies were
U] conducted to show that this technique is feasible. A holographic system was designedand built compatible for use with a commercially available Fourier transform analyzerand software. Holograms of a standard particle field were obtained, and the scatteredlight of both the particle field and its hologram were Fourier transform analyzed. TheSauter mean diameter determined by the two methods agreed to within 5%. The experimentaland theoretical studies show that the prediction of the size distribution could be improvedP by increasing the diffraction efficiency of the hologram. This can be accomplished by
producing phase holograms.Spray holograms were also Fourier transform analyzed at various locations of the
* spray. Photographs of the spray are provided for comparison. The results of this phase
* -. show that this method will yield very fast analysis of.large amounts of holographic data.
Anticipated Benefits/Potential Commercial Applications of the Research or Development
The integration of holography and Fourier transform analysis will permit theacquisition and analysis of very useful data yet unattainable. Moreover, this combinationwill solve the long standing problem of extracting the vast quantity of data stored in
holograms. This technique will find commercial applications in a variety of two-phaseflows including spray combustion, rocket plume studies, explosions, and other transientevents, atmospheric studies and spray diagnostics to mention a few.
V &

! I. '
TABLE OF CONTENTS
Page
INTRODUCTION ............................................. I
1.0 SUMMARY OF WORK CONDUCTED UNDER PHASE I .................. 3
1.1 Summary of Tasks .................................. 3
2.0 HOLOGRAPHIC VERSUS DIFFRACTION FOURIER TRANSFORM. ,DATA ANALYSIS ............................................ 5
3.0 DESCRIPTION OF APPARATUS ................................. 9
3.1 Holographic System ................................ 9
3.2 The Malvern System ................................ 13
3.3 Particle Fields ................................... 15
4.0 EXPERIMENTAL DETERMINATION OF EFFICIENCY AND RESOLUTION.. 17
4.1 Resolution When a Small Part of the Hologram
U is Used ........................................... 19
5.0 RESULTS .................................................. 23
5.1 Photomask Data .................................... 23
5.2 Procedure to Align the Malvern Receiver ........... 24
5.3 Energy Requirement ................................ 26
5.4 Model Independent Data ............................ 29
5.5 Spray Hologram Data ............................... 35
I- 6.0 FUTURE WORK .............................................. 37
7.0 REFERENCES ............................................... 41
.4 APPENDIX 1 - MALVERN OUTPUT DATA
APPENDIX 2 - HOLOGRAM PROCESSING, OPTIMIZATION, ANDCHARACTERI ZATI ON
| -

LIST OF FIGURES
Figure Page
I Schematic Representation of the Holographic System ....... 10
2 Photograph of Holographic System ......................... 11
3 Photograph of Holographic System ......................... 11
4 Photograph of Holographic System Interfaced to theMalvern Recevier ......................................... 14
5 Photograph of calibration reticle RR-50-3.0-O.08-102-CF.. 16
6 Recording a Hologram of a Particle Field ................. 20
7 Reconstructing from a Restricted Portion of the Hologram. 21
8 Effect of Non-Rossin Rammler Volume Distribution .......... 30
- 9 Size histogram of reconstructed Hologram 21 using
. Hologram 20 as background ................................ 31
10 Size histogram of reconstructed Hologram 21 usingHologram 20 as background ................................ 32
11 Size histogram of directly measured photomask usingthe glass substrate as background........................ 33
12 Size histogram of directly measured photomask usingthe glass substrate as background ........................ 34
13 Fourier Diffraction Analysis of a Fuel Spray Hologram .... 36
% -. LIST OF TABLES
Table Page
. .. I Particle Field Image - Advantages and Disadvantages...... 8.4- . 2 Photomask Data ........................................... 28
'%
t i i

-"-S-S.. S - *S. . . .. . .. S
'be:
-- 'S'p.
'-S.
9.
4."
~~55~
-.
.4.St
'p
-p..
0
'5-'*q~4
C
I,.
'V.~ ~ -:*:..- %*.*S.**%S**4. -***** *S**. **.*.~S.4~SS.S*.*'S*...
5. **S,*S- S* S.... ~ ~ SS.'*S * 55S.-'p *.***
5 ~5-
4',k
5.**,. *

INTRODUCTION
S*.. This final report documents the work conducted under Phase I of
the SBIR Program, "Development of Holographic Particle Field Data
Reduction by Fourier Analysis".
°".- The objective of this program is to establish the feasibility of
using a Fourier transform analysis to automatically extract size
' *,.distribution from particle field off-axis holograms. Since the first
application of holography for the diagnostics of particle fields, many
P Iattempts have been made to speed up the extraction of data from
holograms. None of them has resulted in a successful procedure of
practical utility. In the first phase of this program, we have
14 proceeded systematically to show that the Fourier transform analysis of
an off-axis particle field hologram yields very similar results to the
Fourier tranform analysis of the direct particle field, thus leading to
qa potential solution of the problem of data extraction from particle
field holograms.
In order to prove that, we chose a particle field with known
invariable characteristics: a calibration reticle with a known particle
distribution. These particles are chrome edged disks over a glass
. . substrate. This particle field should yield the same result when
analyzed directly or when its image, stored intermediately in a
hologram, is analyzed (apart from noise and experimental errors).
A holographic system was designed and built compatible for use
o with a commercially available Fourier transform analyzer and software.
The availahility of such a system proved to be extremely cost effective
-1- 84-233803F/39
-. .. , . . '. . .. ..... _...,~~~,,6, % . V % N,
for the purpose of this research, although it might not necessarily be
the optimum choice if a total system were to be developed. Several
iterations of the holographic system became necessary before arriving at
a fully operational system.
In addition to the calibration reticle, other more generalized
particle field holograms were examined. In particular, one of these
consisted of a hologram of a spray of SRC2 previously obtained with a
pulsed ruby laser holocamera. This helped identify some of the
limitations and requirements of integrating these two techniques and,
*therefore, provided very useful information for future systems.
-
-o-
.%"' -2- 84-233803F/39
i-,. ,- .. , .-.- -. ,-.. ',., , , . . ........ *. ,-". - .. ,.?.J&.% , -'.4 *- -- S, ,, .. e

1.0 SUMLMARY OF WORK CONDUCTED UNDER PHASE I
In this section, a brief account of the effort conducted under
Phase I is reported. This will provide the reader with an overall view
of the program while each section will discuss in detail the various
accomplished tasks.
1.1 Summary of Tasks
1. Analytical computations of resolution, S/N, type of
emulsion.
2. Analytical computations of laser power requirement and
exposure time for two types of holographic emulsions.
3. Design of geometry and selection of components to build a
custom holographic system for this job.
4. Modify design and build three versions of a holographic
system. The third versi-n proved successful.
5. Evaluation of diffraction efficiency as a function of
reference to object power ratio, illumination and exposure
time, type of emulsion, and development method.
6. Evaluation of resolution using as object the 1951 USAF
resolution chart.
7. Acquisition of holograms of calibration reticle.
* 8. Liaise with Energy and Environmental Systems Corporation to
obtain use of a Malvern Systems Corporation Fourier
Transform Particle Field Analyzer.
-3- 84-233803F/39
*.~~~~~~~~?%SS%**~~~~~~ % . ~ - ** ** ~ .V 5 . -. . * V .

7 .; ..
9. Characterize the Fourier diffraction analysis of the
scattered field produced by the calibration reticle under
various levels of laser power.
10. Interface the Malvern particle analyzer receiver and
software to the holographic system. Eliminate sources of.
extraneous light.
11i. Reconstruct and Fourier transform analyze the holograms of
the calibration reticle.
12. Acquire new holograms of retic'.e to obtain accurate
background with same collimation as the signal. Analyze
the new holograms.
13. Choose adequate spray holograms from Spectron's files and
perform Fourier transform analysis at various spray
locations.
14. Photograph representative planes in the reconstructed image
of the spray hologram for comparison with the Fourier
transform analysis.
15. Final and interim reports.
S
-4- 34-233803F/39
- °
- .,.g.

g 2.0 HOLOGRAPHIC VERSUS DIFFRACTION FOURIER TRANSFORM DATA ANALYSIS
It is important to understand and contrast the capabilities of
pulsed laser holography and real time Fourier transform analysis as
applied to particle field diagnostics. In the latter case, we will be
referring to commercial particle analyzers such as the Malvern Systems
Corporation Particle Analyzer which provides near real time analysis of
. the diffraction field produced by a particle distribution. Each one is
capable of providing very useful data; however, combining the two will
offer the capability of obtaining and analyzing very important data
which until now have been unattainable. Moreover, the combination of
Fourier transform analysis with holography provides a solution to a long
standing problem of how to extract the vast quantity of data which can
be stored in holograms. For years, this problem had rendered the
otherwise extremely powerful technique of particle field holography to
be extremely limited.
In this section, the differences and similarities of both methods
are summarized. As mentioned earlier, the objective of this research
program is to develop an automatic data reduction process of particle
field holograms. Specifically, to Fourier transform analyze the
diffracted light of the reconstructed image and thus obtain the parcicle
size distribution. Particle diagnostics can be performed directly on
the diffracted light field from a particle set without using the
intermediary step of holographic recording. There are, however,
b differences between Fourier transform analyzing the field from a dynamic
event and that from a holographically reconstructed field of the event,
and they will be pointed out here.
-5- 84-233803F/39

"77,777
A pulsed hologram stores the image of the particle field present
in a certain volume at a given instance of time. As such, it will
provide useful information of both steady state and transient phenomena.S.'
Examples of the transient processes include turbulent combustion,
pulsating sprays, and explosions. The hologram becomes a permanent
record of the diffraction field of particles at a certain time.
Holograms obtained at different times would then provide the information
needed to track the transient phenomena. These holograms can then be
analyzed via the Fourier transform inversion technique to provide the
size distribution as a function of time. Since the time response of the
photodiodes used in the Malvern receiver is slow and their requirements
for adequate light levels is high, the holograms would provide an ideal
source of illumination since it is constant.
By contrast, the real time diffraction Fourier transform requires
integration from many signals over a reasonable period of time (in order
of seconds) to obtain adequate S/N. As such, its time resolution is
limited and it provides instead a time average distribution of the
particle field. For many applications, this information is quite useful
and sufficient. There are other applications where the time resolution
is necessary and therefore the pulse capability is required.
In turbulent combustion phenomena, l.azer beam steering is a
O problem associated with most (if not all) light scattering techniques.
Since pulsed laser holography freezes the motion, the reconstructed
image is stationary and can be analyzed with leisure. In explosions,
the interesting phenomena may take place within a few microseconds.
This time is too short to fully excite the photodiodes of the Malvern
-6- 84-233803F/39
'p-V

receiver. However, holograms of the particle field can be obtained and
then analyzed with the Malvern receiver. Other examples where a pulsed
hologram will provide information unattainable by any other means
include unsteady sprays, and shock waves.
In summary, the Fourier diffraction analysis is a slow (order of
seconds) process which, until now, could only be used directly to study
steady stare events, or events where the time variation is not
-* important, or events which are repetitive in nature thus allowing the
accumulation of data over various cycles. This study shows that it can
also be used to analyze particle field pulsed holograms thus extending
its capabilities to areas of extreme interest and importance. Each
technique (particle sizing holography and particle sizing by Fourier
diffraction analysis) provides very useful information for a variety of
phenomena. Marrying the two techniques will provide an extremely
powerful tool to obtain and analyze data not attainable until now,
providing all of the advantages of both procedures. Table I summarizes
the characteristics and advantages of each method.
S-7- 84-233803F/39

TABLE I
I. Recording the Particle Field Image in a Hologram before Analysis
Advantages
1. A large volume can be recorded in extremely short time
elements with subsequent analysis of any part or all of thefield.
2. Images of particles, ligaments, breakup events, can be
examined in detail.
3. Fourier analysis can be applied to provide statisticaldata.
4. Correction for beam steering can be made.
5. The diffraction analysis can be validated by limitedcounting and sizing of images.
6. Highly dynamic phenomena can be analyzed.
Disadvantages
1. Data can be taken only at limited, discrete intervals.
- An extra step is added.
II. Analyzing the Diffraction Field Directly
Advantages
I. Averages over time are provided (this is sometimes
advantageous, sometimes disadvantageous.
• 2. It provides real time information of the particle
distribution.
Disadvantages
1. Subject to beam steering in combusting flows.
2. Limited time resolution for many practical transient
events.
3. Real data is not stored, therefore, it is hard to checkresults "a posteriori".
4. It will be fooled by ligaments and other irregularly shapedbodies.
-8- 84-233803F/39
"-
3 3.0 DESCRIPTION OF APPARATUS
" iThe apparatus used in the reported experiments consisted of three
components: (1) a holographic data acquisition/reduction system; (2)
n -*the alvern Fourier diffraction analyzer; (3) the particle field.
Descriptions and design or selection criteria of these components is now
given in detail.
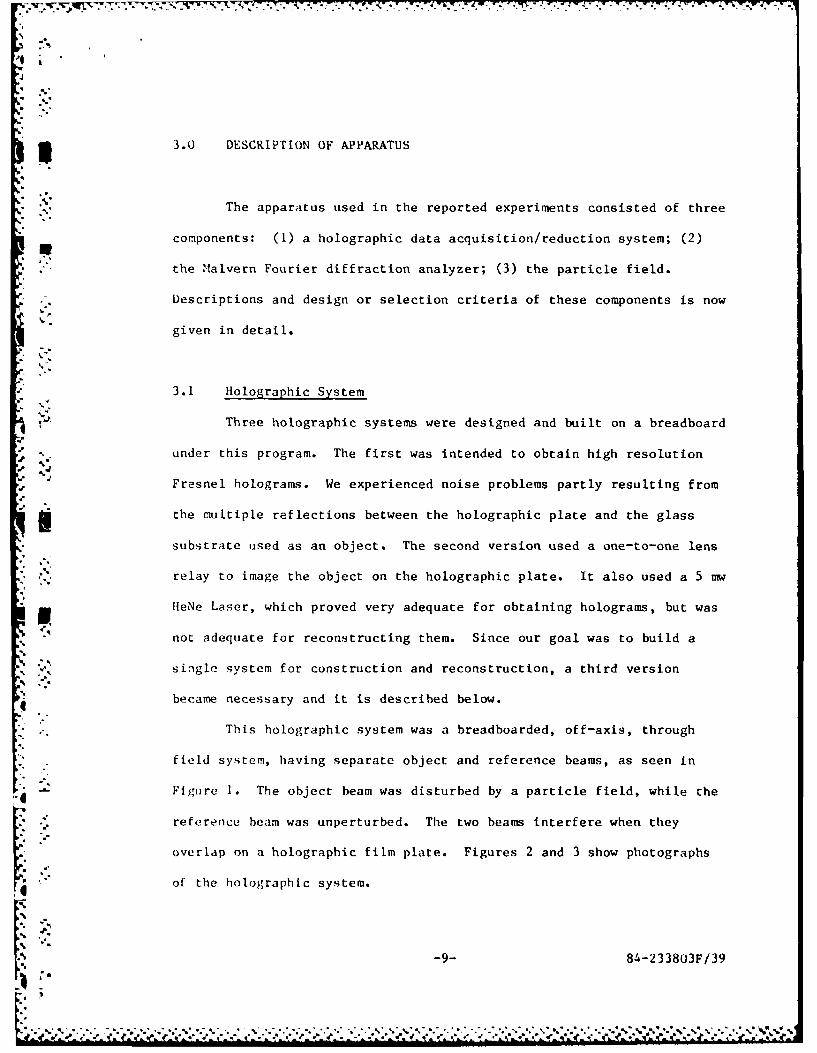
3.1 Holographic System
Three holographic systems were designed and built on a breadboard
under this program. The first was intended to obtain high resolution
Fresnel holograms. We experienced noise problems partly resulting from
"1 the multiple reflections between the holographic plate and the glass
substrate used as an object. The second version used a one-to-one lens
relay to image the object on the holographic plate. It also used a 5 mw
HeNe Laser, which proved very adequate for obtaining holograms, but was
-not adequate for reconstructing them. Since our goal was to build a
single system for construction and reconstruction, a third version
became necessary and it is described below.
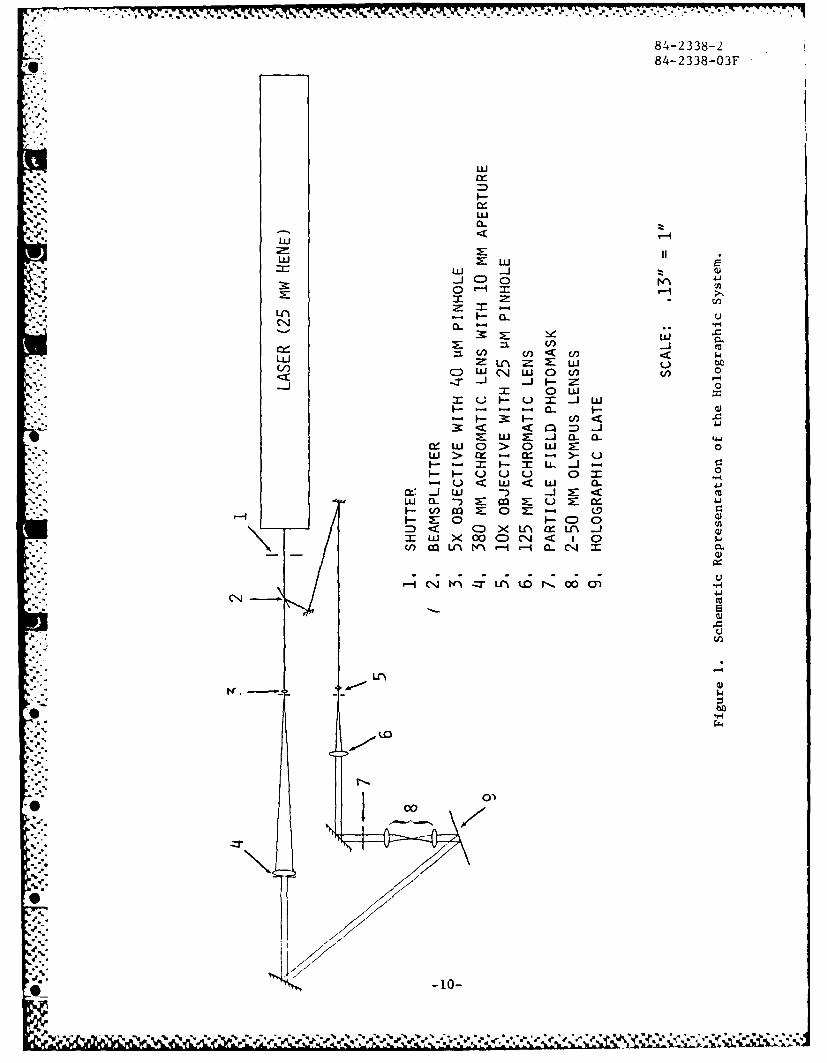
This holographic system was a breadboarded, off-axis, through
field system, having separate object and reference beams, as seen in
-- F~gure 1. The object beam was disturbed by a particle field, while the
reference beam was unperturbed. The two beams interfere when they
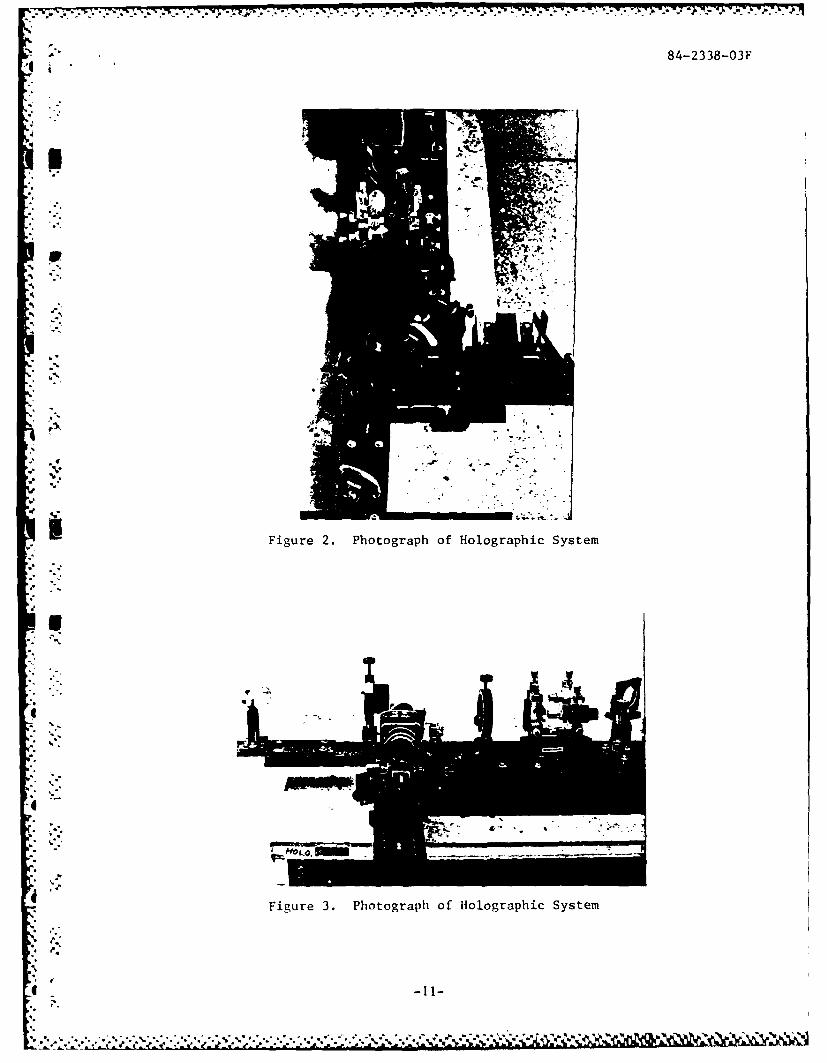
overlap on a holographic film plate. Figures 2 and 3 show photographs
of the holographic system.
-9- 84-233803F/39
84-2338-
84-2338-03
0-238-3
ww
w ww I-,
C)E0
In( (n-Q
wwCL W
Cl) Zi l~ =z Wj - a-) a- -
w 0 Wr 0- - M- U -0
-i wI
m: Wj w 00 C) .C1 <
0)
CNO
UIIA
tr $4
Ito
000
- - 84-2338-03F'I i
4
I
U
.5,
4 *e.g.,.4~ -
.5. ~S**
-. *%.. . S
5,
Figure 2. Photograph of Holographic System
S
S.-
'U,
- '-S
4
S..
* 5.'
dFigure 3. Photograph of Holographic System
- S.
l*5*
5',
* 1'
6~ -11--* S.
.... * *. *.5.~** *..* .. * . ...-......-. *..*.-*..*-. 5*.5 ~S - -. *~*S
* . 5

-
A 25 mW Helium Neon Laser (Spectra Physics Model 107) was used as
an illumination source. The beam was split with an uncoated glass
beamsplitter (Newport Corporation #20BIONC.1). A split ratio of 4:1
(reference to object beam) was chosen to provide good reconstruction
efficiency while remaining in the linear region of the film. The ratio
was adjusted by varying the angle of incidence to the beamsplitter, thus
changing the reflectivity.
The reference beam was expanded using a 5x microscope objective
and spatially filtered with a 40 micron pinhole. It was collimated by a
• 380 mm focal length achromatic lens and apertured to a 10 mm diameter
nearly uniform intensity beam. The collimated reference beam was then
directed to the holographic plate, were its peak intensity was measured
A .2at 28 pw/mm
A lOx microscope objective and a 25 micron pinhole were used to
*expand and filter the object beam. An achromatic collimating lens, with
a 125 mm focal length, produced a Gaussian object beam with a diameter
of 10 mm (W/e2). The object beam illuminated a particle field which was
%: imaged on the holographic plate by a 1:1 magnification lens system.
This imaging system consisted of two 50 mm Olympus Lenses positioned
back-to-back, connected by bellows. It collected the forward scattered
radiation and the unscattered radiation and relayed them to the
* holographic plate. The object beam peak intensity was measured to be
6.4 Ww/mm2 .
The angle between the object and reference beams (-40O) was
* seectud to prodtuce a fringe spacing which was larger than the grain
size of the film see Appendix 2 (2500 lines/mm for 8E75), taking into
-12- 84-233803F/39
.''-,...

consideration some mechanical limitations. The holographic film plate
was positioned such that its normal nearly bisected this angle. The
object and reference beam paths were matched in distance, to within the
coherence length of the laser.
3.2 The Malvern System
In its normal configuration, the Malvern Model 2600 Particle and
* Droplet Size Distribution Analyzer consists of a transmitter and a
receiver. The transmitter provides a collimated 8 mm diameter (l/e2)
4 - Gaussian beam, which illuminates a particle or droplet field. A Fourier
transform lens, in the receiver, collects both the forward scattered and
unscattered radiation and focuses it onto a concentric photodiode
array. The scattered radiation is transformed to a series of
diffraction rings at the focal plane of the lens. The 30 concentric
half-ring diodes receive these data which are transferred to a mini-
computer for processing. The unscattered radiation is focused on a
pinhole at the focal plane of the receiving lens. This radiation
* *- illuminates a separate diode, indicating the amount of unscattered
radiation.
" .In the experiments reported here, the Malvern's transmitter was
" not used. Instead, a reconstructed image of a particle field hologram
was presented to the Malvern receiver. Figure 4 shows a photograph of
the holographic system interfaced to the Malvern receiver which is
interfaced to a microprocessor based data reduction system. The
" -holographic recording/reconstruction system was designed to produce
holograms capable of simulating the Malvern transmitter beam
illuminating a particle field.
-13- 84-233803F/39
e e r -°°Z!° 6, -,,!*,_-°. . t%

-uJ'I~w~ ~ *p . -* . -. - ~~p ...7.-7-
84-2338-03F
0
0o
r=-
04
0Li
bo
* *. * Iz.

b
3.3 Particle Fields
Two particle fields were ,sed throughout these experiments. The
first was a calibration photomask (Laser Electro-Optics Ltd. IRR 50-3.0-
0.08-102.CF) which contains a known size distribution of circular
particles. The second was a particle field hologram of a spray of
synthetic fuel (SRCII) acquired in a previous program using a pulsed
laser holographic system.
The photomask was chosen for two primary reasons:
1. If provided, a known and stationary particle field of which
holograms could be taken with a cw laser.
2. Both the photomask and holograms of the photomask could be4.
analyzed and compared against an absolute invariable
distribution.
The calibration standard photomask consisted of a 2-dimensional
sample array of 10,000 circular discs of chrome deposited on a glass
substrate. The discs are randomly oriented in an 8 mm diameter sample
area. The photonask contains a Rossin Rammler size distribution with
X = 50 pm and a width parameter of 3.0 (Figure 5).
The particle field hologram described here containing a synthetic
fuel spray was taken previously using a pulse ruby laser holocamera.
The receiving optics provided a premagnification of 3:1. It has
previously been determined, through existing reconstruction techniques,
V. that tle ,nean size of the spray droplets in this hologram lies in the
ranve from 50 to 100 pm (depending on location) which will be
interpreted as 150 to 30U im on the magnified image of 3:1.
-15- 84-233803F/39
% %

84-2338-'O3F
RR-50.0-3.0-0.06 -102 uZs b)a)
' v LA--; ;Z T S L 'D.
Figure 5. Photograph of calibration reticle RR-50-3.O-O.OS-102-CF.A (a) Magnified 1.5X. (b) Sample area and quality control0 array magnified 6.37X.
* -16-
*.*-.* ~ *~*~* ~ .. *.-* .... . . * . * * ~ * % J

3 4.0 EXPERIMENTAL DETERMINATION OF EFFICIENCY AND RESOLUTION
The holography system was optimized, with respect to object to
reference beam intensity ratio and angle of incidence, in order to
produce efficient, high resolution holograms. The actual image
resolution and reconstruction efficiency were determined by preliminary
holograms, taken of a 1951 USAF resolution target (Newport Corporation,
#RES.1). This target is similar in constructi-n to the particle
photomask consisting of chrome deposited on a glass substrate.
S-"The preliminary holograms not only kontained the object, but also
optical noise. Noise contained in the particle field holograms could
result in false readings by the Malvern. Scattered radiation from
3various optical components interfered with the object and referencebeams resulting in undesirable fringes. It was necessary to eliminate
or account for this noise before determining resolution and efficiency,
- p and continuing with the experiment.
There were reflections from the film's glass substrate, which
S "remained within the beam paths, eventually returning to the film. This
*condition was remedied by slightly altering the angle of the film with
-- respect to the incoming radiation.
The glass substrate of the particle photomask caused similar
reflections, requiring that its angle be slightly altered as well. A
change of -1U0 in both cases steered the extra reflections out of the
beam path.
-_ Another source of reflected radiation was the 2 Olympus imaging
lenses. Their AR coatings are optimized for yellow light (photography)
-17- 84-233803F/39
-

resulting in slight reflections in the red (HeNe). Since tilting the
lens would aberrate the image, we were not able to eliminate this
problem. The result of these particular reflections is aberrated
diffraction rings focused in the reconstructed image space. However,
they could be maneuvered not to coincide with the reconstructed image,
in order to reduce their effects.
An effort was made to produce efficient high resolution
holograms. The efficiency was measured by reconstructing the holograms
and monitoring the reconstructed beam with respect to the input power.
For instance, when reconstructing hologram number 20 with a 5.5 mw
(total power) reconstruction beam, the power of the resultant
reconstructed beam was measured at 150 1w, showing an efficiency of
-3%. This occurred when the transmission was 20% and the beam ratio was
*" 4:1. Most of the acquired holograms had efficiencies between 2 and 3%.1r
The resultant transmission of a hologram is affected during the
exposure and development. The exposure time was determined frcm the
sensitivity of the emulsion and the available laser power. Two types of
emulsions were used in these studies, 8E75 and 10 E75 (AGFA-GEVAERT).
The IOE75 was determined to be too sensitive for the final laser power
and the available shutter speed. The 8E75 has a sensitivity of 90
2ergs/cm, resulting in a shutter speed of 1/500 sec. To achieve the
proper transmission (tA = 16% is ideal), the holograms were developed
for 6 miniutes each. TA was measured by comparing the reconstruction
beam intensity in front of and behind the hologram.
The highest resolution achieved with this system was on the order
of 3 Om. This was determined by visual inspection of the reconstructed
-18- 84-233803F/39
..--o...

hologram of the resolution target. The fourth element of the seventh
group was clearly visible with the aid of a [Ox eyepiece.
At this point, it is important to mention that even though the
maximum diffraction efficiency of an absorption hologram is b.25%, phase
holograms can have (in theory) efficiencies approaching 100%. There are
other problems associated with phase holograms, but if these can be
overcome, there is the potential to increase the power of the
reconstructed image 10 to 20 times. The implication is to raise the
signal to noise ratio since tiuch of the noise is produced by light
t" scattered from the emulsion.
4.1 Resolution When A Small Part Of The Hologram Is Used
A hologram of a volume of particles images the particles with a
useful resolution which depends upon both natural limits and upon limits
set by the quality of the recording. These include the following:
pA. Natural (diffraction) limits
1. The diameter of the hologram.
2. The distance of the particle (or its image) from the
hologram.
3. The wavelength used in the recording.
B. QuaLity Limits
- 1. The resolution of the recording medium (coherent
transfer function).
2. The alignment of the hologram during reconstruction.
3. The duplications of the reference wave duiring
recois tructon.
-19- 84-233803F/39
S -** m

4. The duplication of wavelength during reconstruction.
5. Optical noise generated by the hologram, optics, and
the particle field.
Quality limits can be calculated for a given recording medium and
particle field. For the purposes of this discussion, it is assumed that
the hologram is diffraction limited; that is, the quality of the
hologram is high enough that natural diffraction limits are the limiting
factors in the recording. This condition is achievable in a wide range
of applications when extreme care and skill is used.
* Consider a sample volume which has been illuminated by a
collimated object beam of diameter Do (See Figure 6)."0
Hologram
0.'." '- - Do Particle Field
Object Beam-- /o
* Reference Beam
F igure 6. Recording a Hologram of a Particle Field
-20- 84-233803F/39
N
. --.*4 I,.a., . ~ , . . .. . -... . .* * *
.o
h
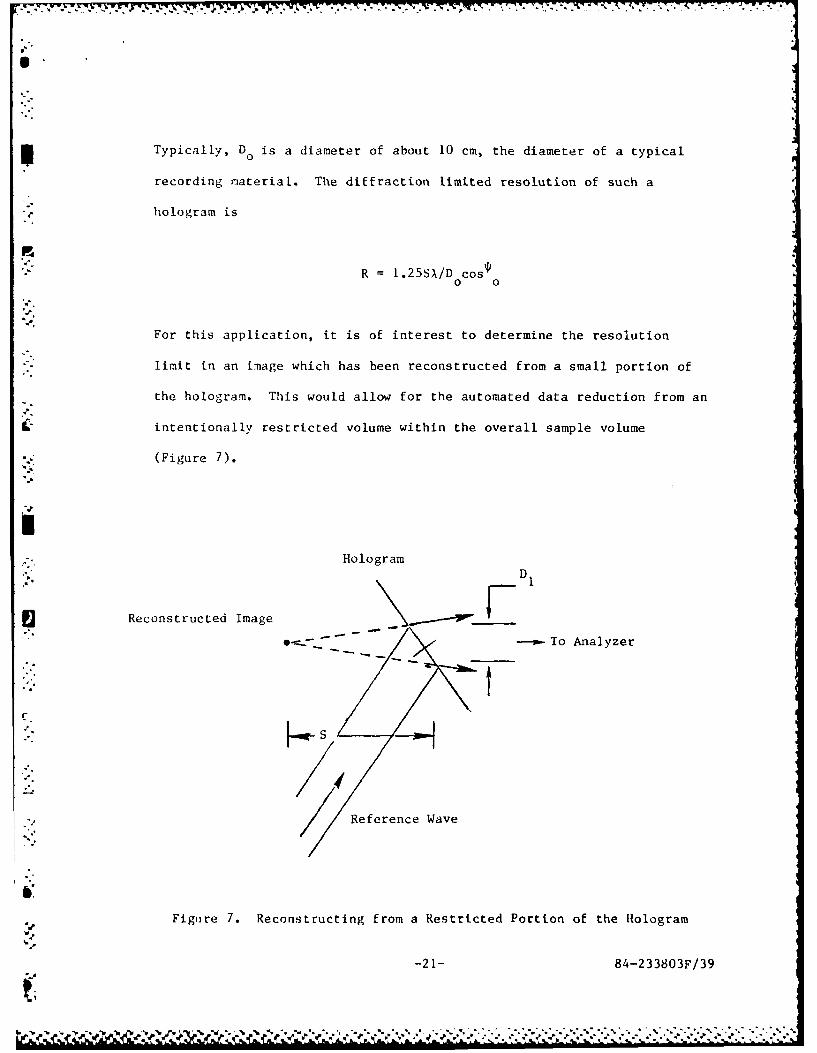
Typically, D~ is a diameter of about 10 cm, the diameter of a typical
recording riateriaL. The diffraction limited resolution of such a
hologram is
R =1.25SX/D cos0 0
For this application, it is of interest to determine the resolution
limit in an image which has been reconstructed from a small portion of
the hologram. This would allow for the automated data reduction from an
intentionally restricted volume within the overall sample volume
-. (Figure 7).
Hoblo gram VReconstructed Image
- -- ----- To Analyzer
Reference Wave
6'
le Figuire 7. Reconstructing from a Restricted Portion of the Hologram
-21- 84-233803F/39

-.* * .. •*. • S L
The diffraction limited resolution is now determined by the
reconstruction geometry and is given by
R 1.2SX/D l
since this by definition is the smaller of t'Ie two resolution limits
caused by diffraction (the first during recording, the second during
reconstruction).
Consider a typical case.y %
S = 5 cm
D= 1cm
X = .6 micrometers
This gives a diffraction limited resolution of 3.6 micrometers, whereas,
if the entire hologram had been used, the resolution could have been
nearly five times better.
To put things in proper perspective, we have to establish the
diffraction limited resolution of the Malvern receiver. Typically, this
receiver uses a collection lens of 50 mm diameter and a focal length of
300 mm. In this case, R = 1.2 x 300 x 0.6/50 = 4.3 pm. Therefore, the
3.6 pim resolution obtained above is not the limiting factor.
There will be, however, cases when reconstructing a small portion
*' of a hologram will limit the resolution and the alternative might be to
reconstruct a larger portion and thus lose some spatial resolution.
-22- 84-233803F/39.. :....-..-,.

-: ***-
.O RESULTS
* ,Three particle fields were analyzed with the Malvern receiver:
(1) a calibration reticle or photomask, (2) a reconstructed image of a
hologram of such photomask, (3) reconstructed image of a spray
" -hologram.
The Two different softwares provided by Malvern were used where
appropriate: the Rossin Rammler and the model independent softwares.
The values of X and N (defined in Section 5.3) were obtained with the
Rossin Rammler distribution and are indicated in the figure legends of
the model independent data.
The results are now discussed for the photomask and the spray
data. A sample of these results is presented in this section while the
remaining data including the outputs from the Malvern are included in
" "Appendix 1.
5.1 Photomask Data
S..A total of eighteen holograms of the photomask and three
holograms of the background were obtained under various conditions. As
explained earlier, the objective of the parametric variation was to
establish the conditions that lead to very clean, linear, and high
S--diffraction efficiency holograms. From these, we will present the data
corresponding to hologram 13 with 12 as background, and of hologram 21
with 20 as background.
There are several factors which influenced our decision to choose
these holograms in addition to the ones that influence the hologram
-23- 84-233803F/39
S . .-','..' \. N

.. - . . . . . . . . . ...
quality. These factors are constraints imposed by the Malvern
- initrument to ensure adequate data reduction.
These constraints are:
1. The reconstructed image must be collimated to ensure the
focus of the unscattered radiation on the center disk of
the photodetector array.
2. The signal and background holograms should be acquired
under the exact same conditions to ensure equal
reconstructed power, equal degree of collimation, and the
same traveling direction of the reconstructed image.
There are some differences between the 12/13 pair and the 20/21 pair
which will now be described. Holograms 12/13 were obtained on different
plate holders; the background was obtained without the photomask holder
in place; the hologram was acquired with the first version of the
holographic breadboard and reconstructed on the second version.
Holograms 20/21 were obtained using the same plate holder; they
were also reconstructed on the same plate holder; the background was
obtained illuminating the substrate of the photomask; the same version
O d of the holography system was used for acquisition and reconstruction; a
limiting mask of 5 mm was placed on the object beam to measure and
correct its degree of collimation. We should, therefore, expect better
results from this pair of holograms.
5.2 Procedure to Align the Malvern Receiver
The reconstructed image of the hologram must be collected by the
4 receiving lens (we used the 300 mm in all the tests) and focused on the
-24- 84-233803F/39
N'..

diode arr.ay. Since the receiving lens of the Malvern has no focus
adjustment, it is important that the reconstructed unscattered radiation
be collimated and, therefore, produce a sharp focus on the hole in front
of the center diode.
The receiver of the Malvern was steered until its optical axis
was parallel to the reconstructed unscattered light. It was then
translated vertically and horizontally until the light beam entered
through the center of the lens.
The final fine adjustments were made with the adjustment screws
of the receiver.
- -In the process of analyzing the reconstructed image with the
Malvern, we established that in addition to the precautions taken during
the acquisition and reconstruction of holograms 20 and 21 the plate
holder should be of the type used in interferometric holography. This
• will ensuire that the angle between the plate and the illumination beam
p is the same as the angle between the plate and the reference beam. If
-"this angle changes by either tilting or rotation of the plate, the
. reconstructed image will follow a path slightly different than the
* original object. The consequence of this difference would be that the
background light will focus in a different point than the unscattered
- light of the particle holograms.
Two different procedures of signal reconstruction were explored:
1.- With the background hologram in place, the Malvern was
carefully aligned until most of the light of the
reconstructed image fell in the center diode. At this
point, the Malvern was aligned and was not touched again.
-25- 84-233803F/39
The particle field hologram was then reconstructed and
% analyzed after subtracting the background.
2. In the second procedure, the Malvern receiver was aligned
with the background hologram and realigned with the
unscattered radiation of the particle field hologram. This
procedure ensured that the unscattered radiation would fall
in either case on the center diode.
This last procedure was, in general, more successful because of
the slight variations encountered when repositioning the hologram on the
holder. It was also necessary for analyzing the spray hologram since
the reference beam used during the acquisition of this hologram was
diverging, and therefore the angle of the reconstructed image would
change with position on the hologram.
5.3 Energy Requirement
We established that the radiation power of the reconstructed
image for the final holographic system was typically .15 mw. This can
be obviously increased using a more powerful laser or increasing the
*diffraction efficency of the hologram. Since the Malvern apparatus uses
a 2.5 mw laser, we had to establish the performance of the photodiode
array at low power. The procedure consisted in illuminating the
photomask with different levels of laser power. For this purpose, a
variable neutral density filter was placed in front of the laser such
: . that the total power of the light incident on the receiver varied
between 50 ow and 2.5 mw. Under each one of these laser power levels we
obtained a size distribution using the Rossin Rammler and the model
-26- 84-233803F/39
-W..
independent softwares. Power levels of 100 Pw and more produced the
same size distribution of the photomask. Power levels below 50 pw were
not acceptable. It was also necessary, in order to work with the low
power levels, to darken the room to reduce background radiation. Based
on these results, it was expected that the 200 pw signal obtained from
the reconstructed image would be more than adequate. Let us point out
again that higher signal levels could be attained by reconstructing with
a more powerful laser or by producing more efficient holograms.
Obviously, increasing the diffraction efficiency without compromising
the linearity would be the preferred choice since part of the noise
comes from scatterers on the emulsion.
The photomask data are summarized on Table 2. This table shows
3 the data obtained by analyzing with the Malvern receiver, the
reconstructed holographic image of the photomask, and also the light''4
scattered from the direct photomask. The parameters describing the size
U distribution are X and N which are the two parameters of the Rossin
Rammler distribution which is given by:
- (x )NV=e
where V is the volume fraction of drop material occurring in drops of
diameter greater than X. The volume distribution is given by:
N-1 - Ndv NX -(X/X)
=x e
The SMD is related to X and N by the expression:
-27- 84-233803F/39
. *., . -. . . .. ,_ . . .. . . .. .V ... .. . ... .. _

S 1.4
%~ .0 0 ~ 00
A*4.4..
wJ U 0 0 D>W >. >.
4 - 0 Jn
1.4 1- (L)C M 4 bo to ..wJ c ) w . 0 "a 000 00 U 0 ~ -4 ) i
a ti 4 W~4
0to W-4 bLD 0' bfl P- c- 0a)t-,4 0 c). 1.0 41 0 *4. o
C 4 0 0 w2 -4 O W~ .0 *,
V) W~ 00 .y, 0 r, -c4 04 CC4 4 4 4O 14,4
I O xO 1OC 00. 00. Oi ~
®r C N C1 n en o
CC
4-4 C~ 4N - 4 C4 - C
.C44
CL -
4) 0
% I. C
00
0
C-28

S MD =
r 1- IN
To illustrate the effect of X and N on the size distribution, Figure 8
Sshows two volume distributions corresponding to X = 50 and N = 3 and
3.5. Large values of N correspond to narrow distributions.
5.4 Model Independent Data
The photomask and its holographic reconstructed image were also
analyzed using the model independent software of Malvern. The
L histograms of the size distribution produced by this software will be
related to the energy distribution over the photodiode ring array. As
mentioned earlier, one of the difficulties encountered in processing the
holographic data stemmed from the inaccuracy in repositioning the
hologram. Some of the unscattered radiation would miss the central
diode and illuminate the second diode. This will show as a bin in the
large size hand. Figures 9 and 10 correspond to reconstructed holograms
(20121) and illustrate this problem. The last column shows the light
measured in each of fifteen pairs of diode rings. For instance, on
Figure 9 the maximum light level (2047) is measured in the 30.3 to
39.0 Pm band and this level drops toward the larger size bands only to
increase again to 402 in the hand of 261.6 to 564.0 jm. A similar
behiavior can be observed on Figure 10.
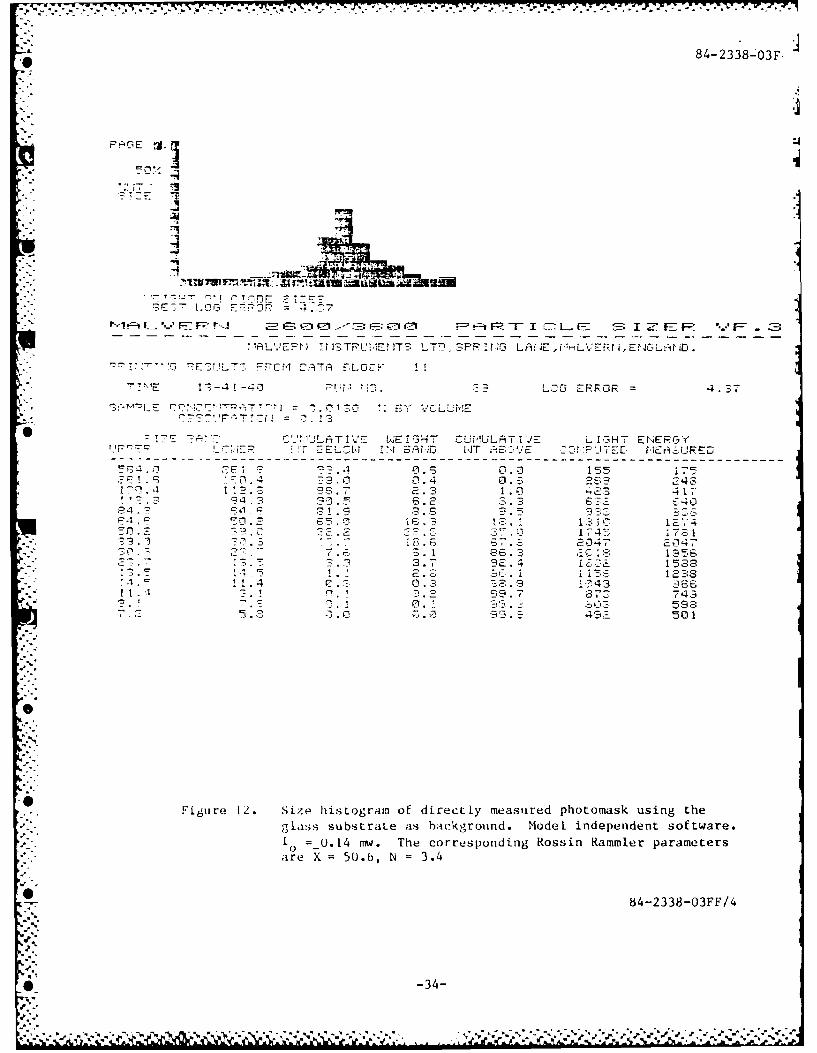
Figures 11 and 12 correspond to direct measurements of the
photomask. Here the peak measured light energy also falls in the 30.3
to 39 pm size band. However, the histograms are very smooth and don't
-29- 84-233803F/39
%

'6 84-2338-03FV
Rossin Rammier
dv _NXN
dx -N
dxx
41/N
N 3
-4 20 350 5 0 7 0 9 0
Figure 8. Effect of N On Rossin Rammier Volume Distribution.
030

84-2338-03F
II
PU r-1.1,°,G E R R6 2
:j -7 1
CW.1
- - -
- '. .C -.: . ..
;j- 1 [.! 'Sff Ll Pff F, tAT~i L.EE! I. 1H1- VWr-ID -J- SO
=~~1. 0. 34R B LM
-. 4SE ZE5,
-4 5C-? G.- a 1 0 0
7 F-5.2 4---.. -4
'*'.°3 1 -- .:: ET- _ 6 :.-..,-E:E0,
-4 - 15, 177.
0.Z4 ?6 0~n. 2S.8 1 7 10 D
857 r4- I
.. . 0 1 1 3 5 3energy level" -10 = ... w o the i 1._..=,m and
1 .4 c.15ifrtebCgon hoorm c urrspodin
,o-, - parameters fl X. 51. N 3
I C:_ll~~il~lh0T 1'.'E [J -G T ~ tTC '- 4 ' 35 ,."7 E."-,'"
1 1 .4 - . . . . . . .. . . . . . . . . . . .. . .. . . . . . . . . . . . . . . . . . . . . . . . . . . .
0-r 0 1 - 1033F/
..0 3 4 75 1
Figure 9e7.2 Siehstga of ecnsrute Hologra21 usig oora
2(J as background0. Modl ndpedet ol we . -he otaenergy -2 lee iS 1=.1 rfo the paIcle hoogaman
-
t::::. . - - - - - .--.. .

O 84-2338-03F
--.4
'-- ..- ji E E ,E
~itL W~t-J ~ ifll-- 3r~ff 586C.. 1S I E : ..r -
R?1171.1 ~ F3 -355 T RO,:5
I. -o LO EE4O1 z7-I-ii
5.* S- 19 a =5 G BY3L
14" , - 4 i0EL
•T4. IN -N1- 7SE -- _ l - -OUE M E
9', 5 13- 1 11 CIE.1 R
i1 4 -1. +9 ~ l
- I I'I 71 5 1J 0
-o- ,E E
C1. -II .4
i.-. .-. 1.4 _ "C. . -.': .. ""'1. :*1 'R Iii.G ER OR =r .
-. 1 -.C
I.' E .0E I._- 3 . . 1'O. 421738
% Figrure 10. Size histogram of reconstructed Hologram 21 using Hologram20 as background. Model independent software. The total
energy level is 10 = U.14 mw for the particle hologram and=0.15 mw for the background hologram. The corresponding
Rossin Rammler parameters are X =50.5, N =3.8.
84-2338-O3FF/4* -32-
. -.---,- *4 7 ' 8 7 3 3 S

* 84-2338-03p
.- I
- ..... ~r
'---'F- 'r', VA !E 1- -- 2-E eD F:' FR-F I QL-E: 8 I ZE-:FR .F-- -- B
... - -- - - - ," -- - -_ -- {-
r,'" r~qL.'-J r F-TUNE-NTS LTE.-?FRING LE.hiL'.;ERINENGLiND
PR!NITU;CG PE:LrLT-3 Fr-].' -T, £L7'K io
1 NO -"-2 4 43
? 12c~aJ -1 ,,,T - i.:E;T L ,TIVTIE LIGHT ENERGYt- -1 f- - - , f-.±~i,. WT FiOVE COMPUTED MESItSURED
rZI ::- - -1.' lC,1- I .. 1., . 0 . 16 1 115
'4-S112.5 1.3 4 0 41512. 34.7 E.,
-7 10.6 951 4--7,. 7,., 1 ;3 .4 3 .174S I773
?. Figure .. 6.2 20m r u 047
0 4. 3.3 1"-7-.4 . ! .15 1 2 E. 8 Scl . 1154 1 Sa4114 0re X L;5.6 1032 3 3.4". . 0.2 95. S 375 75:,,
...2 0 0. -33 610 601" 0-.0 100.0 472 4 a.7
• "-Fig. re 11. Size hi.togram of directl~y measured photomask using the'""glsssubstrate as background. ModeL independent software.1o =_1.25 row. The corresponding ossin Rammler parameters
• -are X =50.6, N =3.4
..- 84-2338-O3FF/4
-33-
"- 84-2338-03F
"OO
-7'
°24
--l 'l -I1 - "- - - - - - - - - - - - - - --- - -.,,,,,,,, ,--! -' 1 - -- -~l~ - -: l -il -
!';'FLVEitI L TTiE.iTS STN..3PIr4O L7.E,, LYEF, i'EN.LAr.N
--:" : : °":'-, --, SL? TS C, ' TO F:L OCI. 1
'" -:"": IR- 1-,-a ::ib: i_ --'3L.Ji ERFOR = .- "
- , ; I T
• ?' -2 r T '_ ,ii:JFrTI'' t.;E iGHT CUILT[J L IHT ErjEPCY
E3 I, N1 CE.l' i tT --'v I I T- I Uir UPED...............................................................................
0c. - 0 2 Sn4 1 I , 3 417
-f -: 04-1 2 1 E5
S .t 4 . 43 E;
1 59,35.S .4 5, -501
0 Figure 12. Size histogram of directly measured photomask using theglass substraLe as background. Model independent software.
1O =_0.14 rw. The corresponding Rossin Rammler parametersare X = 50.6, N = 3.4
-- ~84-2338-03FF/4
S_-34-
exhibit the added bin at the large size band (which correspond to the
inner diodes).
The use of a precision holographic plate holder will reduce this
problem considerably. Appendix 1 contains the remaining data.
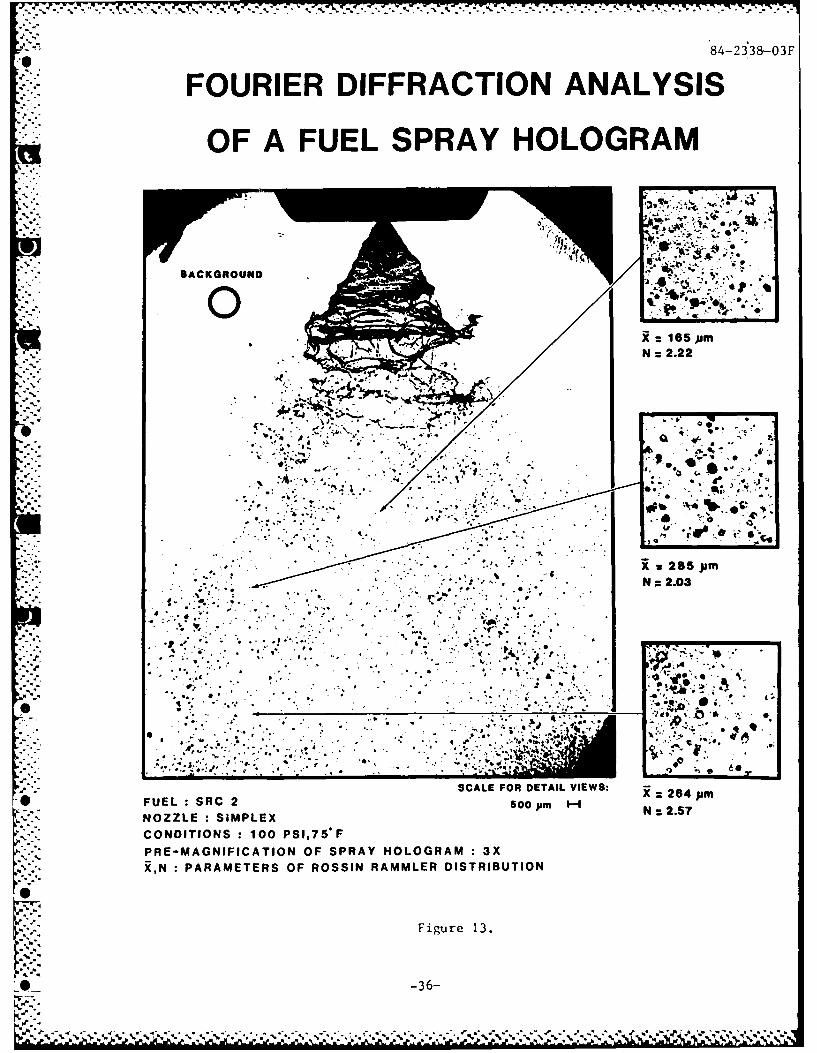
Si- 5.5 Spray Hologram Data
A hologram of a spray field of synthetic fuel (SRCII) previously
acquired with a pulse ruby laser was then analyzed. This hologram was
obtained using (almost) uniform object and reference beams and a pre-
I magnification of 3. To best simulate the conditions normally used bythe Malvern, a Gaussian beam of 6 mm diameter (1/e2) was used for
reconstruction. The reconstructed image had a total power of about O.25
3 imw and a (almost) Gaussian intensity profile. The divergence of the
illuminating reconstruction wave was controlled to produce a well
collimated reconstructed wave.
Three regions of the hologram were reconstructed and analyzed
with the Malvern receiver, and a region without spray was used to obtain
the background information. These data are shown on Figure 13. It is
*important to realize that since the hologram was acquired with a 3:1
magnification, the actual droplet size is 1/3 of that shown.
Figure 13 shows a photograph of a given plane of the 3-D
* hologram, and inserts corresponding to the locations where data were
acquired. Notice that the mean value changed from 285 lim (actual size
4 95 uin) ait the edge of the spray to 165 pm (actual size 55 jm) at the
" center. This is the typical trend of sprays formed by simple pressure
nozzles in which more large droplets are found at the edge of the spray.
-35- 84-233803F/39
°- .
84-23&- 3 F
FOURIER DIFFRACTION ANALYSIS
OF A FUEL SPRAY HOLOGRAM
BACKGROUND .
TXz 165 pmN z 2.22
L~04wg
Q 4 J
* 0
SCL FO DETAI VIWS 24 pm
FUE SRC22S0 p
NOZZL : SIPLEXN z2.57
CONDITONS :100 PS,75*P-MANFCTO OF SPRA HOOGAM 3
XN ~ ~ ~ ~~~~~~~1 PAAEESO**SI AM RDSRBTO
Fiur 13
-36-.

6.0 FUTURE WORK
* ". The goal of the next phase of this work will be to produce and
demonstrate a prototype recording and data reduction system with
- 'integrated holographic and Fourier transform analysis systems.
The results of Phase I have demonstrated the feasibility of this
technique under ideal controlled conditions as well as an actual spray
hologram. The approach under Phase II will be to demonstrate the data
reduction capabilities in an extended range of environments of interest
*' to the Department of Defense (DoD) and obtain data which until now have
been unattainable.
Due to the success experienced with the Malvern receiver during
Phase I and the fact that many government agencies and private
industries already have such instrument, it is attractive to consider it
*{ for the Fourier diffraction analysis. On the other hand, the Malvern
system was designed for real time data acquisition and may not be
optimal for the proposed application. The ideal Fourier transform
-. analyzer will be defined and its features will be compared to the
Malvern receiver.
* * For the most part, the approach will be to develop the best
.*. holographic interface to the Malvern receiver and to test it,
", demonstrate it, and acquire unique and needed data.
S The objectives are two-fold: (I) to produce the best possible
holograms and reconstruct them as faithfully as possible minimizing the1,
-=noise while optimizing the signal; (2) to use the most adequate Fourier
transform analyzer of the scattered radiation.
-37- 84-233803F/39
[ . .. . . . : : - I l ~i Iil i~i i i l i
l lm l l l l ,%
S7
The results obtained under Phase I indicate the areas that
.- require improvements. These areas are:
(a) Increase the diffraction efficiency by using phase
hologlrams. This should have a positive effect on the
S/N. We expect a ten-fold increase in the efficiency.
(b) Reduce the holographic noise by minimizing extraneous light
and scattering agents on the surface of the plate.
(c) Use plate holders which will allow repositioning the
hologram with extreme accuracy (such as double plate
holographic interferometer plate holder).
(d) Consider thermoplastic emulsions in a single data
- acquisition/reconstruction system to avoid moving the
hologram as well as to provide rapid, on-line results.
(e) Explore the feasibility of constructing and reconstructing
with the same wavelength to eliminate achromatic errors.
The limitation here is imposed by the need of pulse
lasers. YAG lasers can provide such source of illumination
and possibly recontruction. Another approach could beO
constructing the hologram with the YAG laser with a
wavelength of 5320A and reconstructing it with a Krypton
ion laser at 5309A, or an Argon ion laser at 5287A.
-38- 84-233803F/39

iN (f) Using the more conventional Ruby for construction and HeNe
for reconstruction, correct the change in wavelength of the
size parameter.
"- Upon development of a holographic construction-reconstruction-
i Fourier analysis system, the approach will be to test and demonstrate it
in various environments of interest. In order of complexity they are:
(1) Steady State Sprays. This will allow direct comparison
' between the hologram and the spray. Note that Fourier
transform analyzing the light scattered by an unsteady
spray will result in a time average which is different than
gthe distribution found at any arbitrary time. It is,
therefore, necessary to produce a steady spray in order to
obtain good agreement.
(2) Unsteady Sprays. This can be accomplished with a variable
pressure drive thus resulting in a changing and cyclic size
-6 and velocity distributions. Holograms can be obtained at
selected times, synchronized with the driving mechanism and
thus resolve the time evolving size distribution.
"4
(3) Burning Sprays. A simple kerosene burning spray can be
used in these experiments. Here the proposed system will
provide capabilities not yet achieved. Scattering
instruments are limited in hot environments because of the
-39- d4-233803F/39
.

*r 'ICr :I, B I
Z" 7 PZi--M
refraction imposed on the laser. The laser beam will
wander as the result of this fluctuating refraction,
therefore impairing on the alignment. Laser pulse
holography will freeze the action and analyses can be
conducted afterwards with the Fourier diffraction analyzer.
(4) Transverse Injector in a Cross Flow at the Ramjet Fuel
Injection Facility at Wright-Patterson. This demonstration
will be extremely significant since it combines the
requirements and difficulties of the previous ones. Laser
pulse holography should prove very powerful when obtaining
measurements in the combustor. If steady state conditions
can be achieved, the results can then be compared to those
obtained directly with the Malvern.
..-
%
u .
j.* - j.. - * . .- * -* *. ~*~..~*..**~* *

V7.0 REFERENCES
1. B. C. R. Ewan, "Fraunhofer Plane Analysis of Particle Field
Holograms", Applied Optics, Vol. 19, No. 8, 1980.
41
-41- 84-233803F/39

APPENDIX 1
MALVERN OUTPUT DATA
84-2338-03A-1
84-2338-03A-1
- ".: - - -- - - -. , - -- --" - J - -,-i'-L*
. _ K H LG3 E:R', P
,.' ". . ..... 3.--13F -R>4 J9.-:O 5.14
:- -- I 1 T _l IE
IT I-.--:" . . +7 T V. EL i T.. . .
~4:3 00 .C 0
C 1fl : J fl? n o_ i_.... ,,.' -. 0 0 0
I --O
C, 1
0 1 ..... 0 h D? . 0
CA 00"D1 C 1 ID
1 n'
, .::'? 7_'7 "-5 .F:,3.5 0.9% 4 .4 .5 4.4" +T]5r 7.3 8 " 14.2
0 . 5.R. 4
,. ~ ~~~ .+' I .0O S 3 .-.. r ,8 *r -
L -Oil
T 7 TI-" ' 5 E 1.
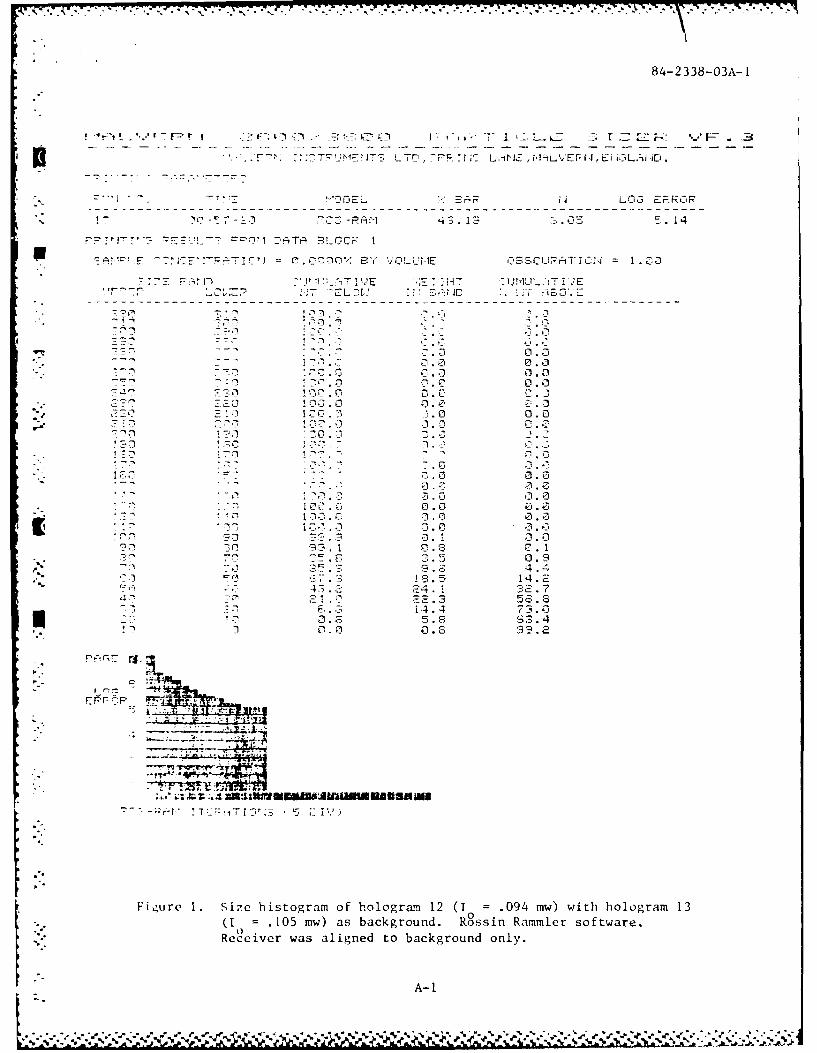
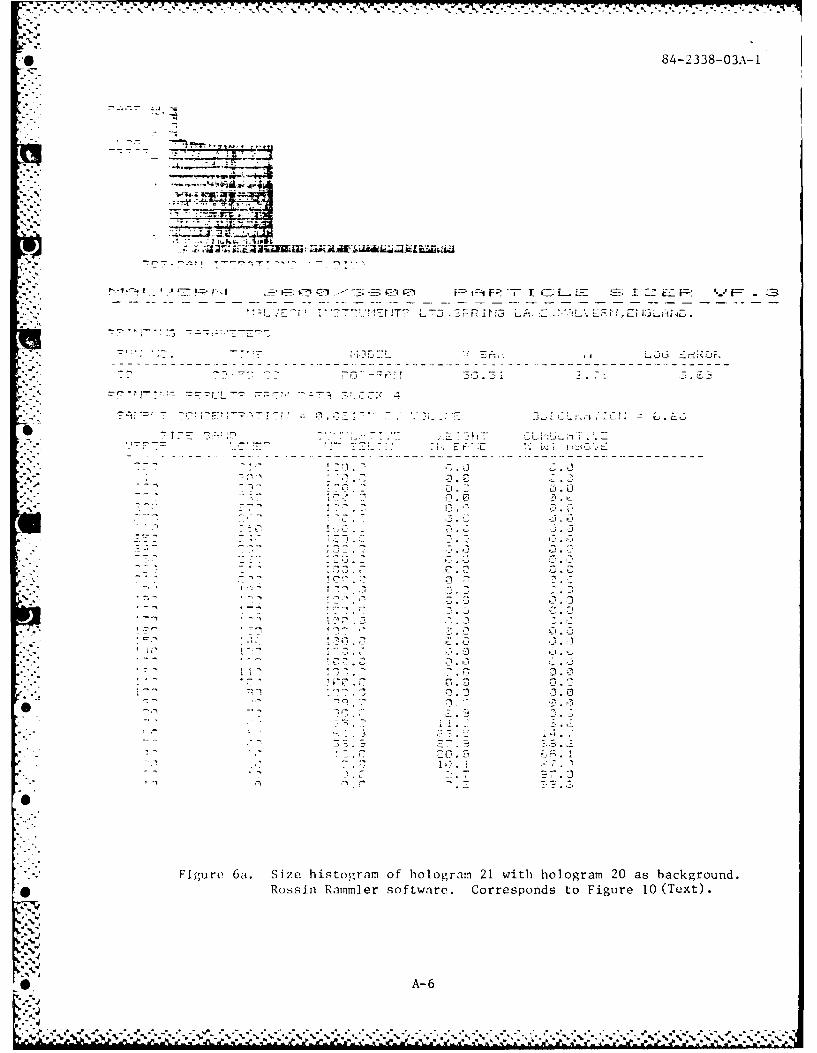
Fi4ure 1. Size histogram of hologram 12 (1 0 .094 mw) with hologram 13
(1 .1I05 mw) as background. Rossin Ramm].er software."."Rerive was aligned to background only.
A-1
..... 2s.V V1
A-i,
84-2338-03A- 1S
r. .l ( , _ I, F.-L o -- 1 ,E 1 LE V = Z3-
* K. P r,. 7 - N P1 LOG EPPOP
1i i! -2 IC P1 -1pc 40 2 . 5Z 5.53
-177. - .r C, ... T 25 'CAT'CJ 7.. .
Ftrrrr. r L~C! ;r7 !47- IT"E,- L' .' - ""n-I- - - - -- - - --- - - - -- - -- - -- -- - - ---' ' " I - - - - - -- -- - -- - - - - - - - -- - - - - --
-- n
70-
in1 0i 0._7- f i1 X. 0 ti. ,1
Iz< -- 10- .j In. 17 0 .
E 0' 10' 0 1
.. 0 .7- I ' 0 . .
"" .1"
l-l'" 1-?, -, Sil''
!-_ 00 . s
-. 1.7 t ,7. F 0- 7 S 1 .7
P 'r/:'] ~r ' ' *CLOCK 12
l'' i ; T I T r!E 0 - 1, 1 r r I ,
1 -1 - - I - .
--- - -,
... n.-
%'." 3 1 .?
nn
Figur 2. R ci t of- sieL) oorm 12w t oorm 1
as. bcr',od Reevrwa lge t akronny
0A-2
S£-"1-A.
iI " -3.'
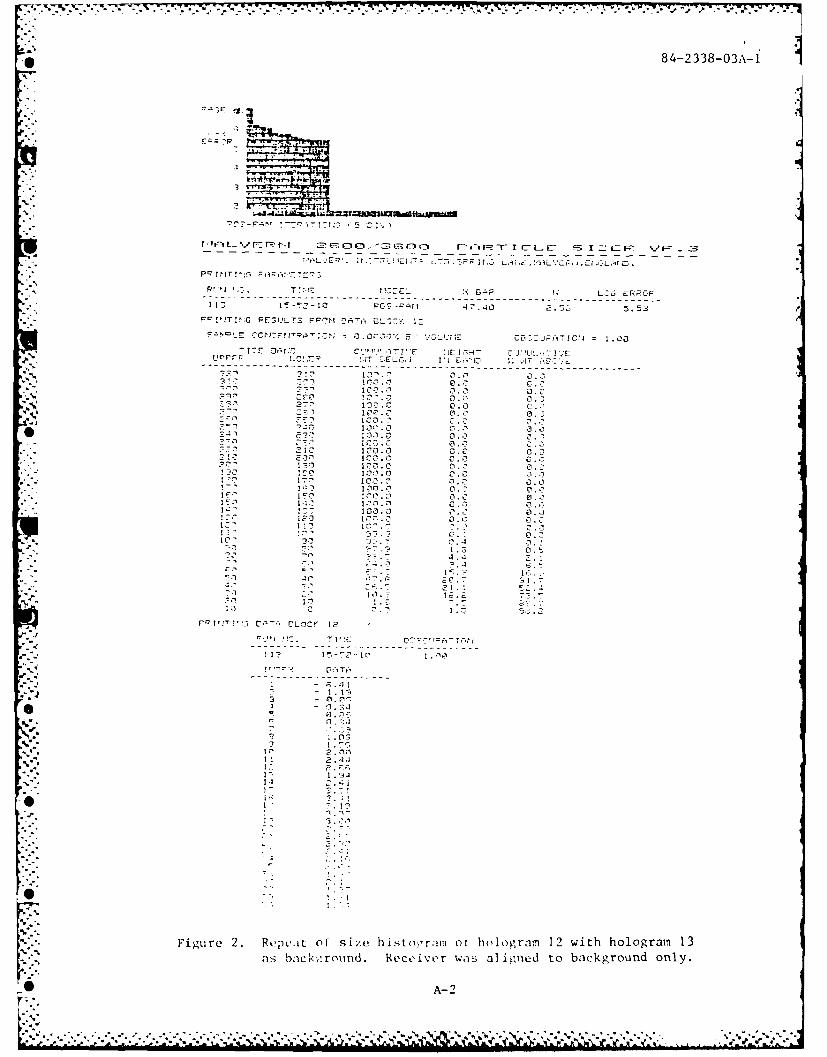
Figure 2. Rtpt',it ot si 'e histoo-ram ot hologram 12 with hologram 13as back;'round. Receiver was aligned to background only.
. _ A --.
.. .7..-.: . . . - . . . ,.. . . , . .,.$. % ... . . ...-
- - . . . - . - ... ..
'.
84-2338-03A-1
C .
t I t r' ' - - ' ! -+ r -. L 1 7 .- " 7m, f )i I F r F -' T I C L E, C B I E-= .F , 1' C
"P+ !rPT '5: PC+ II ?C r.E'P,'p.--._
71-, 2
-- - - - - - - - - - .1 - - - - - - - - - - - - - - - - - - - - - - - - - - - - - -
I C - .3- _- VM Cr. 27 5'. '. 0
= 0 -74--% C I:2 C Q..
T--E ? P + L -+L 7,_: T :+' + "-- '" _'
-- - - - - -- - - -
-'C,-
-- 1! ;" C0 ,
AV-
2ZO ~ ~~ ~~ 2! I-7 . .O
-I !n*-. 00. 0. 0
7 CCa
-4'
Figure 3t h1itr of hol .1
A-S 3
'-i ' 1%-.'. 44 - * *$0 . '" 4= +-4-44 *44%4. * ;-. --. .* . .. - ' -* . 4
! ? : ~ 3 10,. . ,
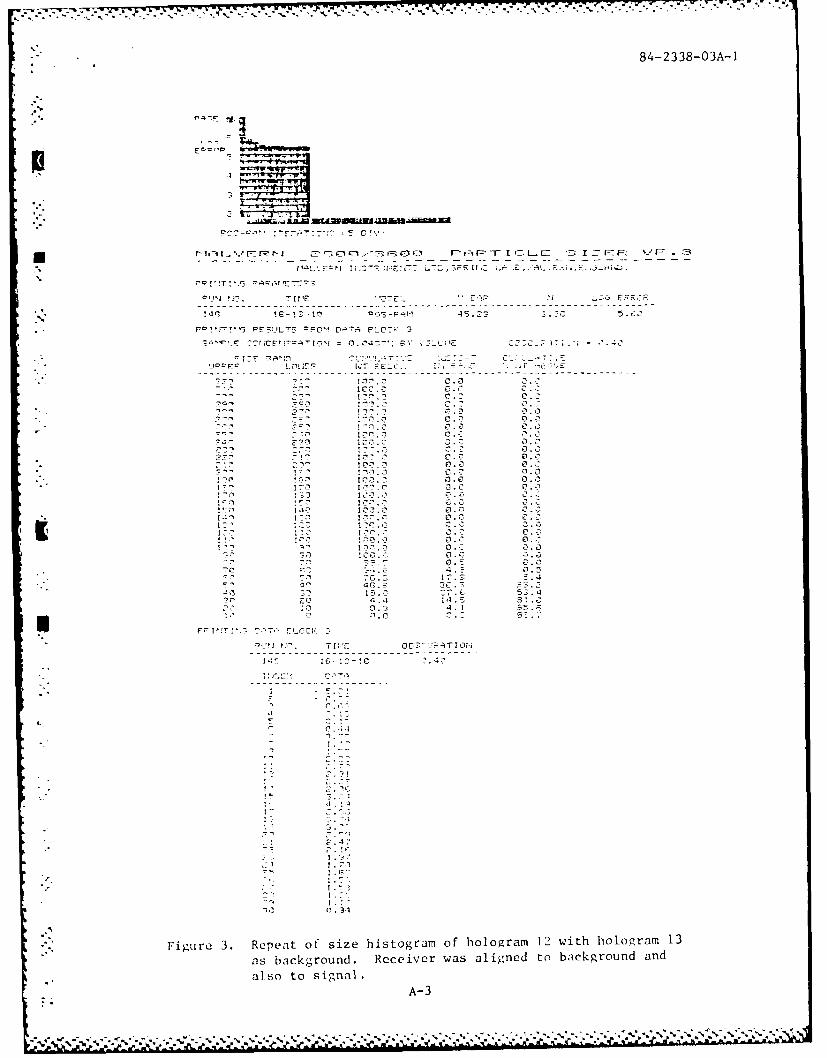
Figur 3. Repeat of siz hitora of hoora-2 wih .
als to! sig ;a . - 14. .,
F I''!T ';- +
T:' ' '+
LCA -3

iY
84-2338-03A 1
I F: t- - -F- Tr I - ." F" .7
- - . -%--
" "rT r V -7:1%:,' : - r " ,T _T7 _; ;_ :; :!;L EF .E t~ ~ E. ,
B.. ..c, ,r",,L.- -qRriE- -- +
'... 77 E , L D
!T J7f.Li
-- -- - ---.- ".. -- -- - -- - -- ----4 - - - -- ,- -- -. - -_ -- --- --. - - --,' --
Np, m -- r7 . .'.r' J A ' E 7 _-T C + Ui-::- 7 1 .'
J1 T 7 -! ", ': . 3 F_ . U E
17 3
,'." -" -O C -- " ' ? . 0 C, +_ , C', ,"
I C3 00C
"'C '-"C ;l_7 ;}f 0 0 -1
It 0R OI D!+ C8 . . 0 ,
. :"tf 1- i-n 7. ri a 0 -4.
7'C
Fiur 4.? Siz hi-a of- hooga 21 (10 .14 mw wihhlorm2
13 5 12 . C'] "
(14 ! 0 .15 w). a bakr . Dat wee0 ta is hn
in th moiigwtotralgigteMlen
"1 ~ 11. 0.
-
,- -:, -9. .5 r .A
- " t .15- mw) asbakro. 1)t"wrbtiedfrt hn
..
.4
*I A- 4
'., . . . .- -. .-. -. •.-. . .- -. " -. , ,. ,, ,, ....N- -"%'.' .f '; '. " -f t." -" "- - 4". '' ,"''"'4t '; ''
84-2338-03A-1
31.47 S.. 5T,.GO
ZI E[C A
7 no
00
-",E 0IHT C .VL CTIvE*."'-r rT EL]J .i B c NT , BOVE
- -1., .1
10 19.
" - - :.!¢
-, , <3 , r .
. C ' ..-- 17.
- P ~ ~~ ~ 0" .G 7 ;i" L,
- C' 7 ? - 0.1
- -* ... - C fl 1 '. " .. .1.. .
C I
'12 ' 3:,0 _, -. ; -'
132 2
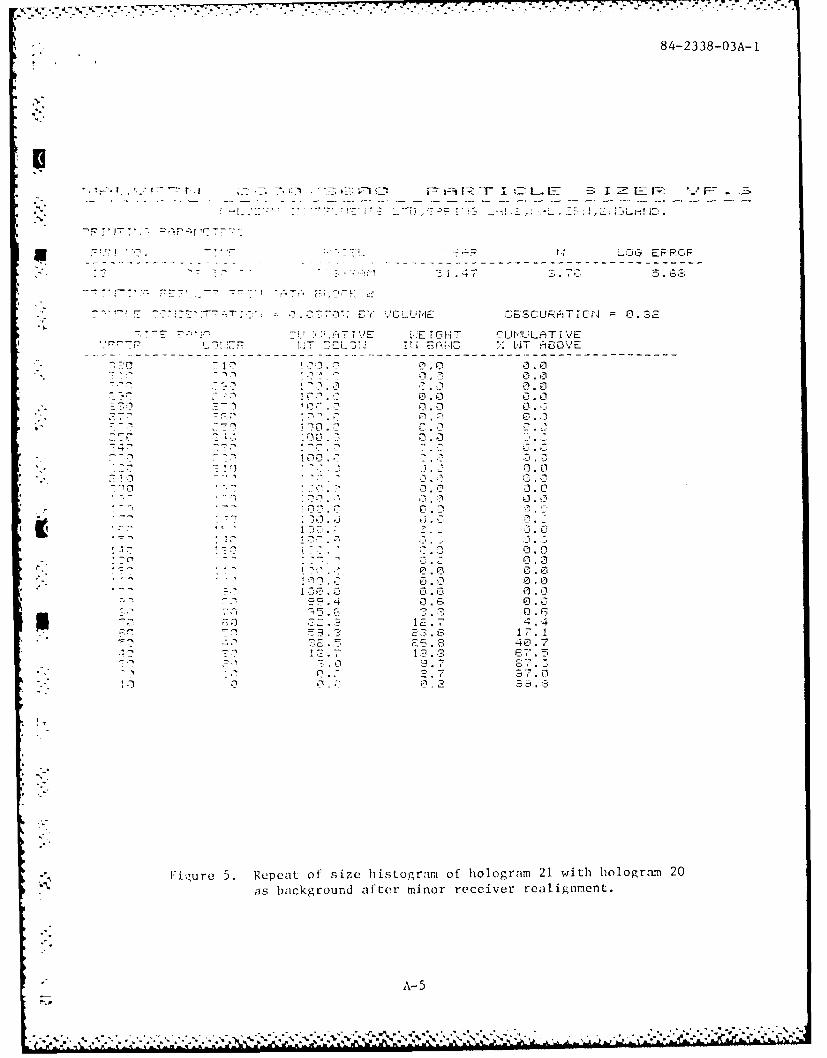
FLur 5.. Repea Of 30.,3 h ,0a of hoorm 2_ it oorm 2
" ' :, I C ',- i .
A-50
--" 12,:.7. 12 3 7 ,4:'
"-n ,. U. , -., o37.:• .C ..: ' ':n 2 . -.' .
-. p
-N * *.". ..
. (.%.7Q*'V.. -..- - - -
4 84-2338-03A-1
2-i L mu 7 '7-3
-f~ -~- - - --r -- -- - - -
.E 3* r."-1.:." *_ 'A. ir:": t-r:-*.-a z w _:-"--: .. --c--- : -:i r-6..lr;. - L _: . - ._ _ _:. :2 , -- '...-- - "
.,.:-:.' ":'L~~iIE-r U :--T':b--_I'1T LTh.B. E NIB' LA , .: .ViL&' I .~E[J:L i.IIL.
.-' *J'.L z ri , . L.,.U zi. C'Ur.
-1 .,
-7. ,
*. .*- A'
'T 1T. "i'. .
""si ..me softare Corsod to Fiue10(et
-- A-6
* " 'I -;'- .-.' " . .- .
• ""' ; . 2 - .,a
, -- A 1
*'. iue6.SzehsormoIooga 1wt oora 0a akrud
I --NI
0 -"-7-i I ~ l~il l~lkl lI ll ll ,l1,~ Idi, l.i,~l l U.-B,.
84-2338-03Ak-1
4
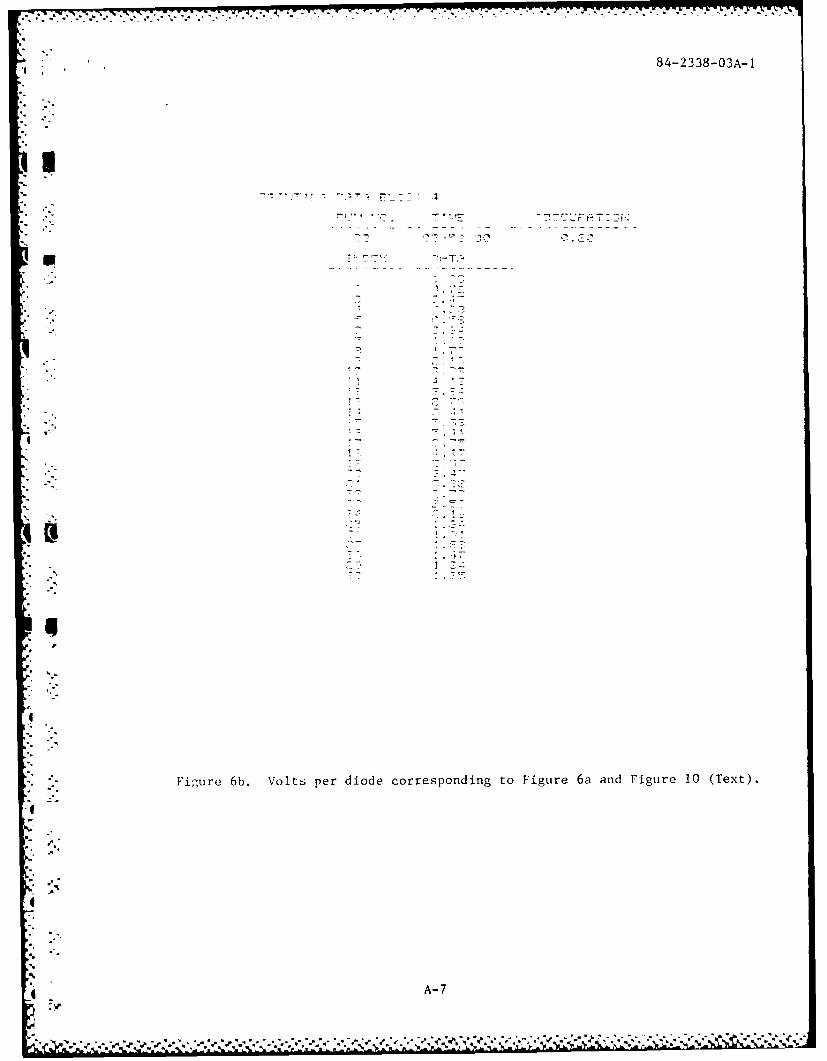
* -FiguLre 6b. Volts per diode corresponding to Figure 6a and Figure 10 (Text).
A- 7

,,, - p, -_ P w . p ,I .. .. ....
84-2338-03A-1
-5-.
7 - 7G 7 ,-1LE.L
5--- -T LG EFRO = 4.5k
"-'1 L , 'E F;; VA4 ;FR E- -) ' ..-' 12) C-1 F _ e ~ R" -F T .T_ FL f---; I Z F F..' F Z. 3k. ., t'!, -',.:E ISTRUPIENTS LT SF I L'N i,'L E N.N L I4.
--'c I'IT F" F E._-ILTS FFON, D.41TA BLOCK. 6T iE 11 ZU. NO. C, LOG ERROR 4.50
_~ ~ ~ ~0 ....E0r. _,i' 1-3 " BY VC LINE
,t ;T CITI F; .E ,-:i' CL!UIUJL, T ",)E 1-,2EI HT :t.L TI ELIGHT ENERGY
F, -'7 L C-! F!7 IT F-!ELC!.' 1." 1',r.E WT -IBO"E COIrAPUTED rMEHSURECT
.?d. 2 ._ '.5 0.019!5-?Et 1-=0. 4 -145. .5 325 3,53
4 -- 1 Z .3 Dq 4.-...6 4-4 4 "!jC,q 6- .E 667 68S
9? 94979 . 7.S. IS. 7 956 93 -.,.. 4. 59, 6-0.5 15.5 24.0 1324 1282
''.,3. -9.' 1 30. 3 30.2 :33.5 1745 1 70,-o , 0 I,= .S' 17.7 63. 7 2047 2047".5.4 -3 2 -- 19542- 3 7 4.-1 E RR 2 OR E109 153
m 514.5 i .2.-7i 5. 1164 1241.4.5 11.4 0.3 0.9 .98.3 i06 1 9321!.4 9. ?3O '.i 2 f-.7 C .S 7-" ""4 I7.i: c0 '._-4!.:_- G2:3 62 17,2. 0 . 0 OHO 10.O E 460 4 .5
.' :
.2241.. 6- 6
." Figure 7. Size histogram of directly measured photomask with glassO substrate as background. Model independent software., 0.5 mw illustrates effect of not focusing unscattered
light on center diode.
:; A-8
3 ,lcf'- 514917

84-2338-03A- 1
tIAL.VERN T1ri2,T7-L~jtlEtJT$ T EPI13LiE FiVR cLiD
-!I o:0 T "rlF C E X -11F H LOG ERROF
FOS-PFM '70 . E 4 .3$
*:LT- FF O'l A C, Lc J 0 PC''I EI~t "L~ I
WETTC* 0.10 ~ VCLUN,,E OEC~zT~. .
I CAE IEt;h0 -Utr'JT!3 -r IE WiE 1 GH4T C UI 1LL T I YE-JFF L C',ER 'JT EL07 I WTN B.' 0T Y'EOE
-..- : ------L..., ------- -- "- ",- -- -- - -- - ----------.------ :>r : ' - _L.-------- ---- -- 'J F
- io o 1 . .o- *0 . 0.
100.. 0.0 0 0. . .0.. 0. 007O 1..0 0 C-
2c 4 0 Lo)0 .00 1 0 . CC 0 0.0
0 1000 0. a11 1000 D. 0.0
?0 1Igo. 0. C00 C .0C.1 0 .0
41100 .0 .0. 0 0.,0
O= T r ? -' LTFO' 0 100B.0C 0. '
I11-0.0 0j. 0 0 .0C, .0. 0.00 C
;70 1.30.0 01. t 0. 00100 0. 30.
110n:0 0.0 00
h, # - fl- f. 6i .n .no.e
-00.0 0 CJ 0
-'0 0.. . 0 0D91 0 .8 a
7 4 1 -44
S0 0.5 0." ' " . '] 47;i-0 .
70, 0% _S 2 '- .438
*t
"4,1 , !0 13. 2, C, J3 8.
"4~~~~~. ;S' .C 000O6I.
-* 5: P9 _ P.4 .
-
_41 'W_1
C'T_, 44 A=
Figure 8. Rossin Ramler parameters corresponding to Figure 11 (Text).
-A-
. .-. " .- .., .
.--.--,. .." . ... . .T-...T. --.*" -*- t/

. . . h b o i . . . . w ..a a o " -~ - '+ - ' - '' i - ~ ' o .'
. +, '- .,. " - .
- 84-2338-03A-
3r--- flT r - h -' ~ F m .- 1-2F -%/F - - - - -- - - - - - -3
7n = T -7 2IhT IT BP INS L3NE ,lLVRNENL7J
C: . T Tt-'ErL LI LOG ERROR
a"..3 ~ ~ !'-4 i -4, FO - ;.~ F+a 7'1 3 .7_
,.. PR!P7M?-' ... .. ?-- SILT2 r--'-'+,+ :"-t ._ BLCCY.+PP11771! 77, 1 f'r LC
,1."1125- BY .LUPME CBSCUATI Ti. = 0. 1373 _ r.! " L .TIVE E ICHT CUL A T i ,
UPP ':- ,_-LtE[iT --.'L,:t., I'.J B ;-.O :.; [..J rit.,'i E
1--.- -- ----- - --- ---.- - ---,-- -
0 0 0 3
n:5 0J. C, -01 ;". 0.0
.- a" %. --,a_- 1.. .. 1 0 L_. 0
. 0 3. 0M-i nn L 0
I ,0"= + 011' ..2" fl 0 .
,* . 1. ,++.* . ,-ic> '_ 'I . +
•- f, , 0 . .0
A-10
*1 "110.
,-.'-.'Figure 9. Rassin Rammier parameters corresponding to Figure 12 (Text).
*oA--10,'',
l1
'p"
-,N t-.a-r%"V .lS.,V a.a - -

84-2338-03A-1
- -. -- - -..- - -. r-..- ,T _ r - - - - -'. E ,- - - nL- ER-",-,Eit - L E - - - -
.1*~VL'EL* TKT'r1rr LD R~ 1N LFi!rE , NF)L V E R NJ, E t ZL i
U 1JT" IG 7-:..0 > EP~
R. , Tt!E 0". E L B i L3 ERROR
SS P 13E4. E. %3 5.33
F I TT -,iT 1-,, '-; 7: _1 -.- 7
r . -rC;F 'T="TT ' . -I; B', C.10O4Y lOUIHiE 0.I TION = 0.11
0 IUIiiL T !, E H I GHFT C UL i TIVE0' LOtNER LIT1 :L,0, I4N E.P.F11 " ,JT &BO%.'E
.74 -1 " 35.4
79 0
S'. DJ
S I FK 0.S . 4
-,". " -'. ifi . - "
- -= 7I-. .3.4
2. 7 -9.
l~~S16 5..'2. 4.B
1.0,4 1. ,4
Cl1 :47. 1~
" 7 ' ! :R~m RC . F 1, is .
SC1.3 - .0
oI . 5 ic r I'P -' 3
.... 1 I.4 6.-
_a e sotae Corsod t--o cete view o.f Figue.1
" '.O A 1 -11
V. I ,
.-. -Z r C--"a_
"" Figure IOa. Size histogram of spray hologram obtained with Rossin.,. Rammler software. Corresponds to center view of Figure 13"- (Trext).
* A-il
8 4-2 338-0 3A-1
11.41
47.7
2.J2.-S
--3 4
A11

84-2338-03A- I
''4
- --5-: -3 ca d- - -
IrT~rj =0. 1S
T 72s 'E'.r.Dr LE'- IGHGI
flfl -'. , -A: TAF-; -=_' - -- -- --------- ----. -'.! -']rK - ---------------------: --; -O E -- ,,
Fof
I-,
1141
4'74
.4
1 11.
1 .3 35.S
Om 1n 0.1
nu- "
.
p.I:-Figrz ;ure lla Rc tOf position shown on Figure 10a.
C A- 13
=' t."T,'!-. =E - U:T ~r' D:.T LOC .-

F..7
- - - - - !7 7 - - 7 - ;- - - - - - A h ~ -
r. 15
-~~~ ~~ -.- !. 3 4E; r~ z
44
.. 4
ko, . 3
*A11
.a,
% d,,--
F;'L' .]
" 19. 2 I -E IF LF TT_
,ai m- '-I i - , E 'o i&S. - .C '.+ :,
T0.03
' " "-r' q 8
TO? - 0. 34
-. "
'a"
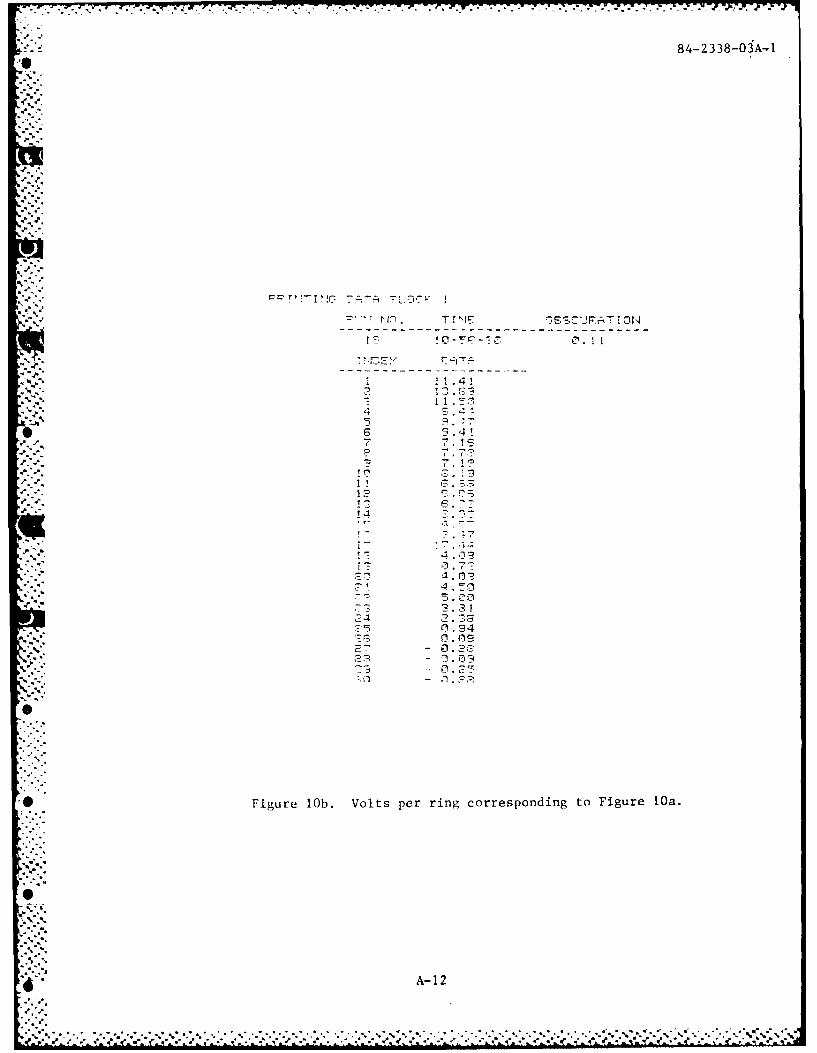
a.0{ Figure liib. Volts per ring corresponding to Figure lla.
4-a-
4.°
i m- A- 14

* . 84-2338-03A- 1
JI c . z -
- - -l - - - -LT-;-PEE-.F=
~. '0LIN LGERROR'
-.T 7 E'~ ~ E 1 H T CU NU L.T 1 .'Er-J~ P . 'LC7 T1i4 E,;.1JO .. T FiOY
*~~2 .I' 0''.G5 4 3.4 3
74 . 4 j 3110 45 ;:
15 .4 ,1 41
71 4o
*G 7i I
1 1) 10.
1 T1
Fiur 13~ (Tx)
A-15
'IC-

84-2338-03A-1
5
4 7
zz 4
23 0 17
2-P 7
n.
3 5r ; .',-.-
-16
- n ;%
r - 7 ,- n .---;
*.'- A1-5 16
• -. J -- , .-' .-..............". . . . . . *m .-. *.*
*4 I 84-2338-03A-1
T C.,O tMLJ5JI
-;T~I i3a
G
--- I4
I7
- ----- ~ ----
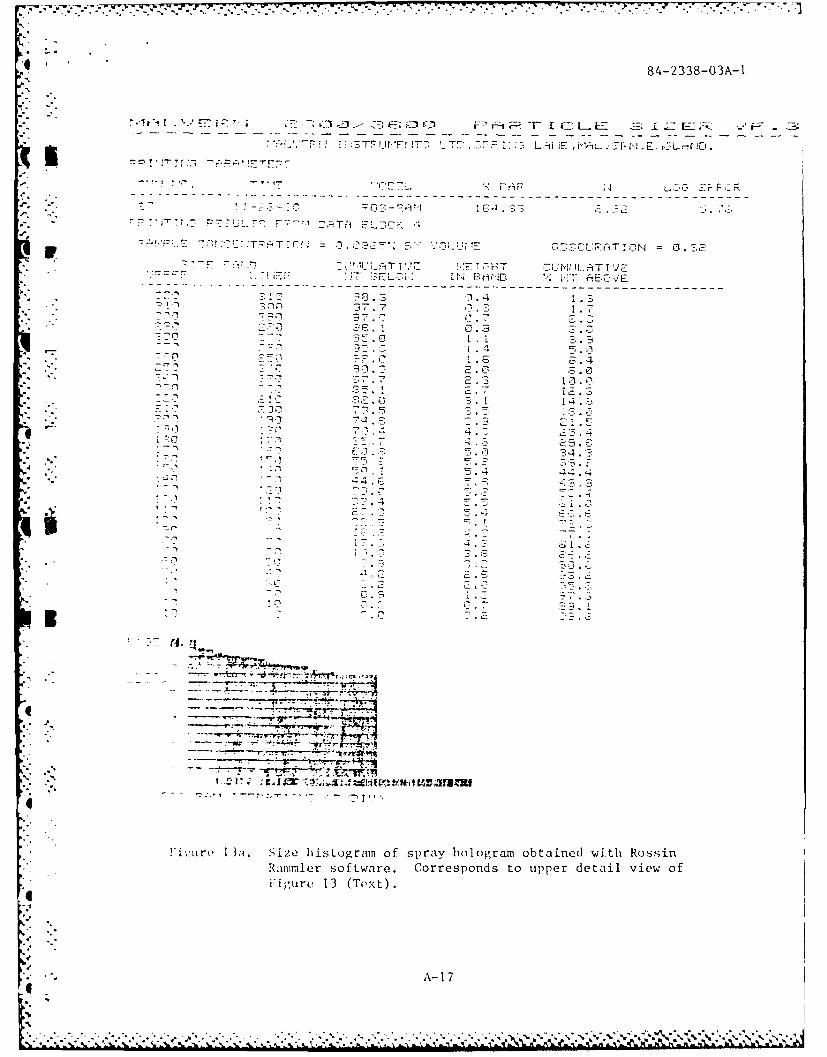
Fi.:tre 3. SiZO histogram of spray hologram obtained with Rossin
ammier software. Corresponds to upper detail view of
Ifigure 13 (Text).
A-1 7

8 4 -2 338-03A-1"
-. ,
%
*" ---
' -.r- '-' _ - n : r;
iu.r b V s r
- 1e corresponding to Figure 13a.
0 A- 18
S-- " - V.S S
Sr a
I
a.
-a
V
'a,
a'
a' "'a
4
APPENDIX 2
LI HOLOGRAM PROCESSING, OPTIMIZATION, AND CHARACTERIZATION
3
I
I
* '4
* a.-a a"
8423 3803A2/36
I
4.
-a -..- *--*, . . a
.......- 'a a. a~ -. - a -w - - -
.a.a(a'W a'.. a~.a'.a.a,. . -.- ,* .. ,~ .* ~- ~.

V.
*APPENDIX 2
1.0 HOLOGRAM PROCESSING, OPTIMIZATION, AND CHARACTERIZATION
1.1 Hologram Quality
The quality of a hologram can be defined by three parameters:
(I) diffraction efficiency (brightness), defined as the ratio of the
diffracted (or reconstructed) and illuminating (or reconstructing)
energy levels, (2) resolution (spatial bandwidth) and, (3) signal-to-
noise ratio (the smallest retrievable object intensity).
Diffraction efficiency depends upon the type of emulsion and upon
jolographic fringe visibility. Fringe visibility is highest when the
object and reference waves are of equal intensity. (This is not where
the highest signal-to-noise occurs). In some material diffraction
efficiency can approach 100 percent resulting in extremely bright
holog rams. Brightness is an important parameter for some applications
and it becomes important in particle diagnostic applications when light
detector thresholds are approached. A direct tradeoff occurs between
" •reconstruction laser power, detector sensitivity, and hologram
diffraction efficiency.
4Resolution is defined by recording geometry, hologram size,
emulsion type, and the quality of optical components. Optical component
quality can he compensated for by proper recording and reconstruction
4 procedures.
A-I 84233803A2/36

S-
7#
Signal-to-noise ratio (S/N) is defined by the type of emulsion
and by the overall quality of procedure, for example, cleanliness,
linear recording, use of liquid gates, and refined processing methods.
Therefore, in producing a hologram one must pay attention to four
thin gs which can be mutually excluding and requiring tradeoff.
(1) Maximum diffraction efficiency for a bright image
(2) hiigh S/N for a clean image
(3) Hfigh resolution for good image definition
(4) A short recording time so that motion during recording isnot a factor.
1.2 Noise Sources
Optical noise is probably the most limiting parameter in particle
nolography. Coherent noise appearing in the form of speckle causes
images to break up into small patches of light which are difticult to
distinguish from signal. This reduces the true resolution of the
recording. Also, coherent noise can render virtually any automated
imag;e analy7er unusable.-a
In this discussion any light which is not a part of the immediate
irn;rLe under examination will be considered noise. The following are
noi~ie sources. (Refer to Figure 1 and Table I).
I. The beam emerging from the laser does not have a smooth intensity
profile. This can be caused by dirty laser windows, laser
miaSd iLigonnnt, Laser design.
e4 2. 'hIhe object beam, upon striking the hologram contains light which
has been scattered from the original laser beam by scatterers -.
A-2 84233U3MA/3b
- . * " ..

DOUBLE PULSED IMAGE OF DROPLET FORMATION PROCESSDELAVAN 60A: 100 pslg FUEL PRESSURE
60 pm DROPLET '. ~70 pm DROPLET(12 Ws)(14 m/s)
All*
44.
4 ~ .~g* .k.A
N.-01 - 5-
~. p~..0..
107m.AP-I(IDE ITLAE N.2FE I
PUSESPCIG:lx 06se PLS PAIN: x1 6ve
Figure ta-
UvTABE
*' COEETNIEEIEN NAOEPCUE
* Film Cam Nois
* ~ ~ ~ ~ ~ ~ 0 CotmnatDfrato Pten* Inerfeenceof Eulsin Suface* ~ ~ ~ ~ ~~~~. Inefrneo ubtaeSrae
SRC-11 Out-o-Focu DITmaTE ges 2 UL I
A- -6 423803-PUS SPCIG .oi sec PULS SPAING *. I sec .. . . .~ .%*
-- ~ ~ ~ ~ ~ ~ Fgr 1...*p.*** ~ ***,
TABL I

other than the object field. There may be contaminants on
optical surfaces or anywhere else, scratches, surface texture of
components.
3. The reference beam contains light scattered from the original
laser beam by contaminants, scratches, or surface texture of
components.
4. Either object or reference waves may contain additional
wavefronts caused by multiple reflection in beamsplitters,
lenses, the recording emulsion, and the emulsion backing. These
give rise to multiple images and interference fringes which cause
nonuniform recording intensity.
* 5. Nonlinear recording creates a noise component which is predicted
through holography theory. This component of noise is negligible
when the exposure range on the emulsion remains in a region
wherein the amplitude transmittance is proportional to
exposure. A recording can be recognized as nonlinear through the
multiplicity and brightness of reconstruction orders beyond the
first.
. 6. Scattering by the emulsion grain creates a speckle noise which
increases with emulsion density as well as with development time.
* 7. Diffraction noise from edges is impossible to avoid entirely. A
diffraction pattern in the object or reference wave causes a
density variation in the hologram. This makes it impossible toSoptimize exposure and the diffraction pattern intensity variationreappears in the reconstructed image.
8. Light scattered from contaminants in the reconstruction system
" optics as well as in the hologram appear in the reconstructed
image.
9. Light scattered from the part of the object field not under
immediate observation into the region of observation can be
highly limiting. This occurs in large volumes and in high number
A-4 84233bO3A2/3b
e0_

p Bdensity particle field studies when plane-by-plane observation is
desired. it is not a factor, however, when an integrated light
scattering measurement is desired.
[O. A hologram is made by mixing an object wave with a reference
wave. In fact, the hologram does not distinguish waves. On the
same recording holograms are made by the interference of object
and noise source waves, noise source and reference wave, and by
light coming from different parts of the object wave. Reduction
of the latter noise source can be reduced only by optimizing
recording geometry and this will be discussed further.
Unlike incoherent light, scattered or reflected coherent light
interferes with the signal causing much larger intensity variations.
For example, a secondary beam having intensity of only I percent of the
main beam will contain fringes of about 20 percent contrast! Therefore,
contamination and secondary reflections are more serious from a noise
standpoint in coherent optics.
A major task of successful holography is the choice of recording
geometry, components and processing technique to minimize the noise
sources listed above.
1.3 Real Emulsion Characteristics
Emulsion characteristics which must be considered are resolution,
modulatioi transfer function (MITF), contrast (Gamma), sensitivity and
noise. An extremely useful collection of tables describing various
holographic emulson characteristics can be found in reterence 2.
Certain parts of those tables have been extracted and presented here.
A-5 84233?O3A2/3b

The typicaL behavior of a holographic emulsion is summarized in
Figure 2, which describes a generic hoLography film.
As the exposure increases, the diffraction efficiency
(proportional to a increases until it peaks at a density of
approximately U.8 (tor all holography emulsions) after which it
decreases as the exposure increases further. The grain noise, likewise,
first increases with exposure, peaks (before the diffraction efficiency
has peaked) then decreases as the effect of added density is to -educe
the amount of light transmitted by the emulsion at a rate exceeding the
increase in amount of light scattered by the grain.
Note that the grain noise is heavily peaked in the direction of
the illuminating beam. This suggests that one should choose as large an
angle between object and reference waves as is possible until some other
effect becomes important.
Reference 2 summarizes the necessary constants for five different
emulsions which can be used to quantity image quality.
1.4 Com,,puting Signal to Noise Ratio
Reconstructed image intensity is given by T Irecn where n is the
diffraction efficiency at the hologram and drec is the reconstructing
wave intensity
=[22 a(E) *m (v) M (V) 12 a2
d' a-RZnl(Owhe re c(E) un lg t sca() yThe V aM
* E
-A-b 84233bU3A2/3
0%
"U eeec umrzstencsaycntnsfrfv ifrn
m emusionswhichcau e use to qant..y.i.ge.q..ity

NOI SE
-~A
bxlO DIFFRACTIONEFFICIENCY D. E.
9 %1010 ~ K(.4
f _________
8 O
NOISE'IS.ANIGL .4
CHOISEISIC OS. SILVEE HA4 D 0MLIN
DEFINITIONS:
- Optical noise power reconstructe prbadit sqrd
- incident optical flux
*- Angle between incident light and the measured quantity
1) -Photographic density
'A- Amiplituide transmission coefficient
0T. - Intensity transmission coefficient
F Exposuire
D.E. -Diffraction efficiency
84-2338-03A-2
A- 7

m (V) - input modulation A(log E)
M (v) - modulation transfer function
v - recording spatial frequency
v film gamma
rec refrl ref [.22 a.] 2 (2)
letting a2 3, H .6 and I > I (Typical values)
*E + /E-t (.U5) log E R R h-
rec ref ER h
ER reference wave exposure
Eh - object wave illumination which actually strikes thp hologram.
Assuming the scatter cross section is the actual cross section,
the exposure at the hologram, Eh, arising from the object is
"E d R
4(L.22 d
40.168 d RE
* s2
where S is the object-hologram distance
R is the scatter coefficient
d is the element diameter in the object tield.
A-8 84233803A2/36
• .. ,, + '. " " ,P. ,,," 4" - % '. ," ,+" , - ." 4 • 4' ,, q ," " " ,,. ' - ." .o. + - .' ' 4" ." ."... "+....,. ',," .",-. - - ".
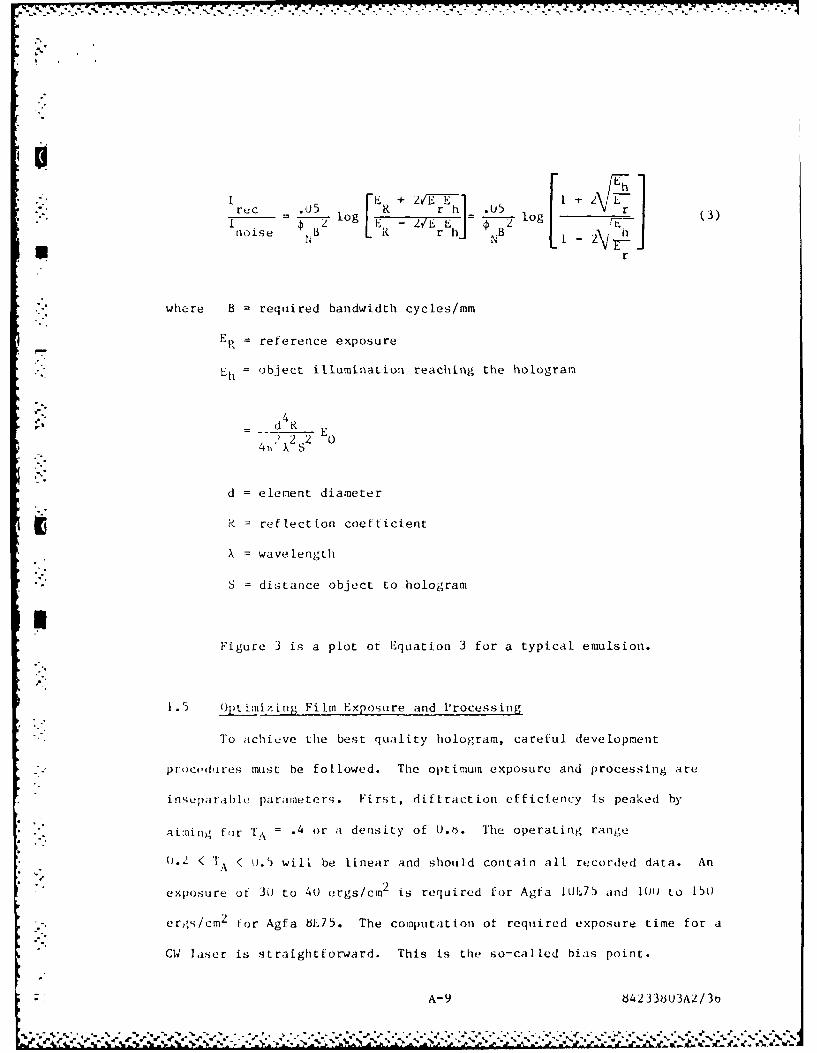
6 + ZV E2T~ h1W. rc _ .o5 .U5
no11ise b 2 lo EV~ i,--7ErEh 3
Ur
where B = required bandwidth cycles/mm
E reference exposure
E l = object illumination reaching the hologram
4d. R E
2411' X2 0'4 X S
d = element diameter
R reflection coefficient
X = wavelength
S = distance object to hologram
UFigure 3 is a plot of Equation 3 for a typical emulsion.
1.5 Optimizing Film Exposure and Processing
To achieve the best quality hologram, careful development
procedures must be followed. The optimum exposure and processing are
inseparable parameters. First, diftraction efficiency is peaked by
aiming for T\ = .4 or a density of U.b. The operating range
0.2 < TA < k.5 will be linear and should contain all recorded data. An
exposure of 30 to 40 ergs/cm2 is required for Agfa IUL75 and IUIJ to 15(
Crgs/cm2 for Agfa M'75. The computation ot required exposure time for a
CW laser is straightforward. This is the so-called bias point.
A-9 84233U3A2/3o

I 84-2338-01%-2
'-I
- 0 CNJ0C)ci >- X_
C1- c nC-
4-Q co CD
-~~~r ")1J~Q 0 .
C) .14 Q)
4-4 U cjC~r ~ $4~ C-E- Q
CJ~~m CJ )
L)
LD cri
to2
* 1
I C.
C 0 0
A-104

*q ' i. . . . - . . . . . .. .
I iThe most refined hologram processing methods commonly known
include the following points which are uncommon in ordinary photography.
1. Used degassed, distilled water.
. 2. Discard developer after use.
3. Monitor photographic density during development and stop at
the chosen density.
4. A final washing in distilled water.
. 5. Drying at room temperature.6. Stress relieving before recording should be considered.
7. Latent image loss can be severe. Test should be run.
4
S,1.6 Summary for Hologram Optimization
Table 1i provides a summary for overall optimization of hologram
qutality.
* J "inimuri Geo:detricaL ReIquirenents
* I Figure 4 illustrates the recording and reconstructing geometries
-- for a hologram. The object and reference wave should impinge at equal
and )pposite an;gles with respect to the hologram normal (see
Reference 1). it the reference wave and object wave (before striking
.- the object) ;ir, both parallel, the basic spatial carrier frequency is
"':: ::, ,- = :. sin , /p .
Thi,; is hf' h :rdiiiimui requirermiet of the recording emunlsion. The required
5amiuwidWi aru uni th-, cirrier can be computed if the effective hologram
size is known, simply by calculating the largest and smallest angle
A-11 642338JU3AZ/3b
I
• . .. . . - ' -' . - .-; . *. -, , , .• -' . - -. . . , .-I'- ' -' ' , ," x % .% £ . ,v . - .. - . ..- ' -5 . ' -L -L , L , :
- d"* *- ... * * 'C.....................................

,,. .-..,. . - , .,.., . , . . , . . . . n.. -,. . ,, ... . . . - . - . . . - + - - -
TABLE II
TEIiI!')ULS FOR HOLO.C P(.-li$AM ITALt Y
;.1) SE SIGNAL h NOISEAPI !ED RATIO RESOLUTION
SIGN 1. se as few optical elements 1. Hologram size ust beas possible. Low scatter large enough
eleents 2. Emulsion resolution high
2. -affel stray lit 3. Low b,-
3. Spatial filter beams angle
4. Choose an emulsion with low 4. Use flat platesnoise, high MTF. high Gamma S. Place object close to hologram
5. Have reference wave at least 6. Use direct (not diffuse) ignt10 times object wave
6. Ohjct reterence angle is 7. High ;jalltv -tics fflatness.0- . bisected by plate normal paalielisr, good leoses)
8. Image and agn:fy the object7. Object/r-ference angle larger betee recordtn
than suhtended object angle9. High coherence
1. Kee'p everything clean in the I. Keep evervthing stat-nry to
-( 10KDING optical train A/10
2. Maintain uniform intenity 2. Kee, windows thin and go thtough
waoefronts them straight3. Put as lIttle as posnible in
the object field
4. Expose optimally
p ING; Dentem, to trars.. . ity of Same as for high S/NFo(i 'INI; .16-. 20
Shorten develpment time
Maintain cleanlinss
Final distilled water .ah
0); 1. K-Fp ciptical train free of I. Or Ient ho Ica p, I t i
)T.)Y, dustprcet
2. Unitorn beans 2. Use real i-el e' v- ted ',Use liqld grt, rnlect ii-'. ho.khards tbrh,h
3. 11- . liqll.n gate any optics origlally used
4. 11il.n. . len i the part of 3. Use correct waoeh'ngthhocgrae required
4. Dupli-.ate original ilerence5 5. :rpatlal Filter
12* 84-1-338-03A-2
. .u .5
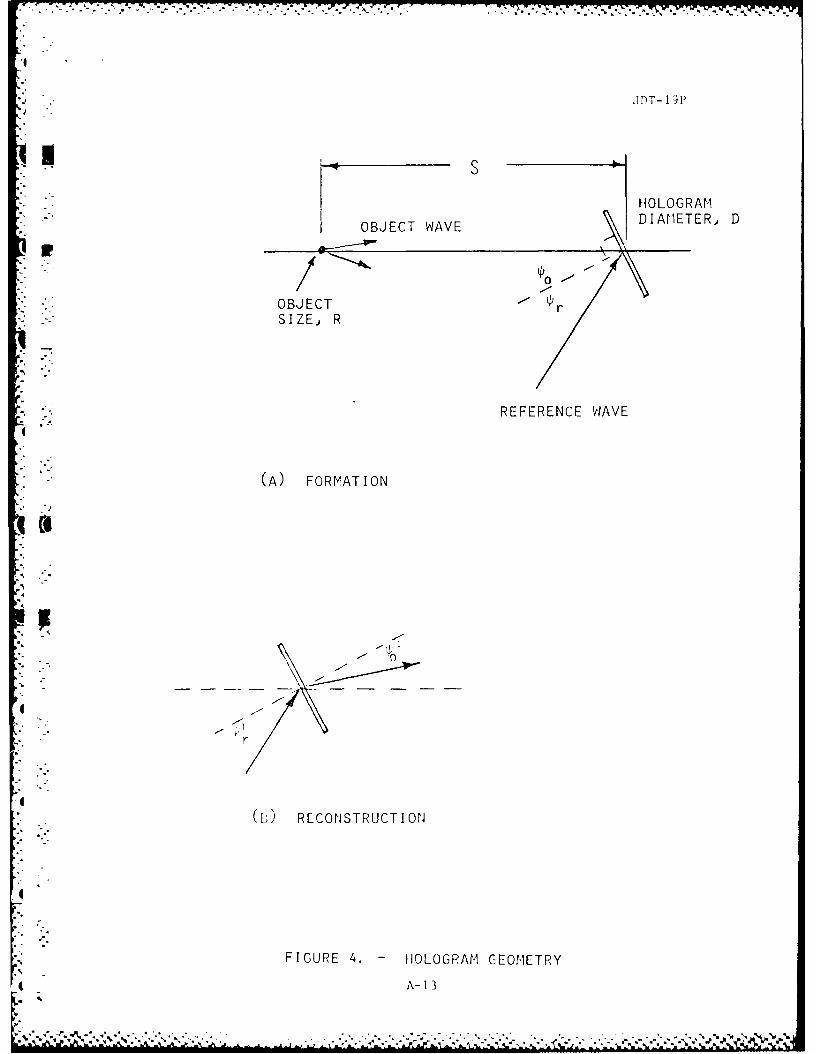
.IDT- 1' P
HOLOGRAM
- REFERENCE WAVE
* (A) FORMATION
Alq
A-1

-. ' - - C W .
between the object and reference wave. Then the two dimensional
baudwtdth which is used to compute total noise is the square of the one
dimensional case. This one dimensional bandwidth is given approximately
by
I X~ 0 2S )-Sf
The required effective diameter for the hologram is proportional
to the required resolution, K.
1.2 SX
req R cos
liigher resolution requirement demands either a larger effective hologram
dianeter or a smakler object distance, S.
P;ir; ters for this Experiment
Carrir Freqtiec.v The angle between the object and reference
wawve2s Ls 4 ) d,_:ree . Hence,
20.0 i - = 1(8: lines/mm
X.. M
B]]i ;inf-dtii 'he oject distancc, S, is approximately 15 mm from a
',)lo;,rAxn o)t diarm.ter, LO mti.
A-14 84233803A2/3b
0 -.d
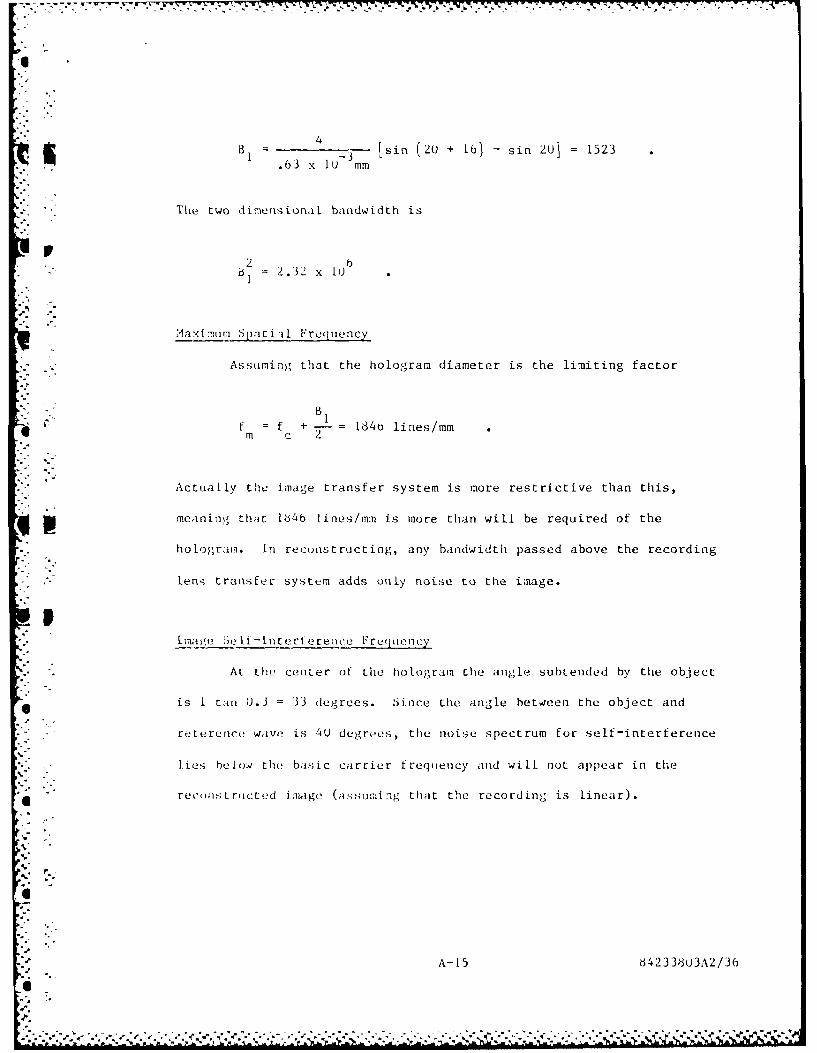
I4
- . N
.r3 x u [sin (2( + 16) - sin 20] = 1523
.63. x-I mm
The two dimensional bandwidth is
2 3 x
Maximun Spaci-il Freqiuency
. Assuming that the hologram diameter is the limiting factor
•B 1
f f + 1 1846 lines/mmm c 2
Actually the image transfer system is more restrictive than this,
meaning that 1b4b lines/mm is more than will be required of the
hologram. In reconstructing, any bandwidth passed above the recording
lens transfer system adds only noise to the image.
-mage S? f-Lntertereare Freq uency
At the center of the hologram the angle subtended by the object
is I tan 0.3 '33 degrees. Since the angle hetween the object and
reterurice w;ive is 4U degrees, the noise spectrum for self-interference
Lies helow the basic carrier frequency and will not appear in the
rectostrcted image (a ;suming that the recording is linear).
A-15 84233803A2/36
6.

~S uemma r'.
The recording medium requires a resolution of 164b lines/mm.
i: tither Agra [UE75 or 8E75 will accommodate this with a nearly peaked
',ITF. The basic carrier frequency will be 1085 lines/mm.
The resolution for the hologram will be limited by the image
transfer system to approximately 4 microns. This could be reduced, if
needed, by using a higher resolution image transfer.
Lens Configurations and Image Transfer in holography
* In an imaging holocamera the possibilities for positioning and
magnifying the image before and after reconstruction are many and it is
-* important to understand how these affect the ultimate appearance of the
data. Lt is extremely important to know in advance the probable
location of the image. This can save a vast amount ot confusion and
delay during the reconstruction. It also allows one to optimize the
r:constructed data for whatever recording or viewing system is used.
-'. Three classes of imaging systemis must be considered.
* 1. A coLLimator pair which images one-to-one in 3 dimensions. This
was the configuration used in the present system.
2. A collimator pair which mgnifies such that the agnification in
the image field is uni::orm everywhere but the magnification is
not the same in the depth dimension as it is in the planar
di,.eris or. 'he fnagoificatIon is the ratio of the focal lengths
of the two collimators used.
3. Use of the single lens to image and rmgnify before reconstruction.
A-16 84233803A2/36

.. ,
In the following discussion each of these lens systems and its imaging
properties is described in detail. For the first part of thisdiscussion the hologram itself is not mentioned. The reader must only
remember that the hologram itself only recreates what exists optically,
-so in any of these discussions Lhe hologram position could be at any
place in the entire diagram. Ideally, with or without the hologram, the
image space stays the same. One can consider the image space as being
produced by the alignment laser and the holocamera lenses when the
hologram is not present, or being produced by the hologram when it is
set up in a reconstruction system. From an optics point of view, when
the optical wave from the hologram is examined one cannot discern
whether it has come from the hologram or from the imaging system in the
holocamera. The two ideally should be identical.
Figure 5 describes the imaging properties of a collimator pair
which images I to I in 3 dimensions. This system allows the largest
wfield of view and because the image space is identical to the object
space it is the simplest system to analyze.
There are 3 separate cases that imust be considered when the two
matched Lens collimator pair is used. Case 1, which is illustrated in
Figure 5a and in Figure 5b, has a sample space defined by a volume that
Is two focal lengths long and one lens diameter wide. The hologram can
be positioned anywhere on the right hand side of the second lens. In
some cases where an image plane hologram is desirable the image of the
sa,7mple volume exists on both sides ot the hologram, as shown in Figure
5b. As previously mnentioned it is sometimes convenient to position tlie
hologram such that all of the sample space appears on only one side of
A-17 642336U3A2/3b

r 71-77 TV V W1WWWWXTVW
80-2155-2 2,
LENObj oc t f Poasitio If Image
BC D B? Ct D A'
LENSI E F oiin2E' F'
I f f
Object Space Image Space
B'I C1 D
LENSB C D E F G Positjon 3 E' F' 1 '
-4 If f
Object Space Image Space
Objeoct Space is represented by A, B, C, D), E, F, G. The corr esponding image
*(C'ongllg,'at0) Points are primed] (\' , B' , etc. ) respect ivelv . Note that the relative
* . pow; i tons of the oh or t-and imnage space are fixed regardless of the location ofrh tIo ns pa ir ! InI I onTI s os i tion 3 no0te that thbe ohject aind image spaces overliap.
FIGI \'E1 5. o)N[:-w*-().F;- IMAGING IN TflREF IW11'NS IoNS1~ IN A >.\CHI) (2aLl ITOR PAI R
A- 18

Reference
A j AV C
Saimple Volume Image of Sample Volume
CASE 1: RECORDING WITH TWO COLLIMATORS
Virtual RealImage Image
A' B' Ct
Image of Sample Volume
P RECONSTRUCT INC THE ORIG INAL WAVE
Real VirtualImage /Iage
*A' B' C1
Imaige of Saimple Volutme
RE(I > S~lCT NCA CON.] UATE, OF THE OR ITNAL WAVE
- F IGURE. 5,). IOIO(RAPHY WITH A ONE-TO-ONE IMACGING SYSTEM
*A- 19

V~.77
the hologram. When the image exists on both sides of the hologram part
of it is a real image and part of it is a virtual image. The real image
can actually be presented directly to a frosted screen for viewing or
directly to a lensless camera. The virtual part of the image must be
reimaged into a real image before viewing on a frosted screen or
recording.
The part of the image that is virtual can be made real in
holography simply by reversing the direction of the reference wave and
projecting backwards through the hologram as shown in the third figure
* of Figure 5b. In this case the reference wave comes from the right and-
the viewer sees the reconstructed image on the left hand side of the
- hologram. The part of the image that was virtual now becomes real.
This process is often useful when presenting an image directly to the
" . face of the vidicon without using other lenses where part of the field
of interest happens to exist behind the hologram in a virtual space.
[his procedure allows one, by turning the hologram over, to convert this
virtual space into a real space.
The two lens image method just described applies both lenses
• before the recording of the hologram. In an equivalent technique one
can apply one of these lenses before a holographic recording and the
other during holograhic reconstruction. This is illustrated in
Figure 5 c. The recording is made with the hologram in a position just
forward of where the second collimator would hove been placed, for
exa:nple, as shown in Figure 5c. The diverging wave is then recorded in
O" the holo,;ram. During reconstruction the reconstructed wave will be that
diverging wave. The collimator which was used during recording can then
A-20 84233803A2/3bS
- .... .,
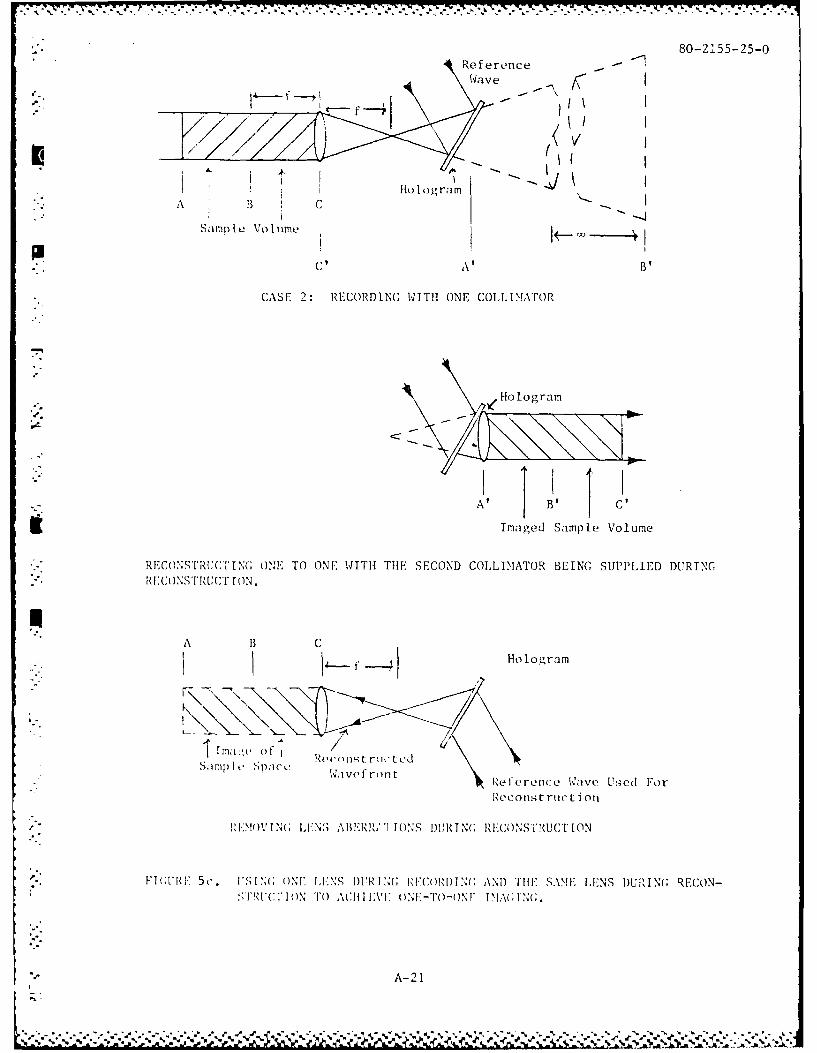
80-2155-25-0
I HologramA 3 C
SzwmpLi2 VolIutme
c'A B'
CASE 2: RECORDING WITH ONE COLLIMATOR
Imaged Sample Volume
RECONSTRUC:TING ONE TO ONE WITH THE SECOND COLLIMATOR BEING SUPPLIED DURTIGREC:ONSTRUCT TON.
f Hologram
rfl-d~ of Reconst rui tied
S;In I ~ W~ie I on SeIcrerice k-.ive Used For
Reconst rtimtion
I~KU)VI LKN;ABERI ' IONS DURTINC RCNTUTIO
FICVRI 2 ~ ~ ~ ~ ~ 'F '~u N N ESD' N EODIN(; AND THEi S.\ME: LENS DURING RECON-SII YI ON TO ACII I IN ONE-TO-ONF I "AV I "x.
A- 21

.6,* 5 4 .2.: ?,: J
be used as an exact matched collimator to collect this diverging wave
and recoLlimate it, producing a one to one image of the original sample
volume. The points A', b', C' in this image correspond to the original
A, B, and C, in the sample volume.
When it is desired to produce an image of ultimate quality,
removing any defects th-t may exist in the collimator as an imaging
element, the technique used in the bottom figure produces a so-called
conjugate wave traveling antiparallel to the original wave to be
projected backwards through the collimator used during recording.
* Aberrations that were impressed upon this wave during its original
tr,-'smission by the lens are then removed before the image appears once
again in the original sample space free of geometric aberrations.
Figure b illustrates the process of imaging with magnification.
Two separate cases need to be considered, one in which the image space
is a constant magnification of the object space and the other in which
the magnification of the object space depends upon the location in that
-pace. The top diagram illustrates the imaging for the former case.
•- Here two collimators with different focal lengths are used taking a
O col Lima,:Ld wave from the object space and reproducing a collimated wave
Lil the im ge space. The magnification is tile ratio of the two focal
[en),t hs. This is tile magnification for the x and y dimensions.
O Manification in the z dimension can be seen from this diagram to be the
squaro of the magnification of tile x and y dimensions. For the lens
shown, therefore, magnification in the x and y dimensions is 3 while
. m;gni ication in tie z dimsension is a 9. For example, the distance RC
is imaged B', C', nine times the origi ,al object dimension. This type
A-22 B42336U3A2/3b
e6-

S80-2 15 5-21
Lens 2Lens 1
-f f hlt f Ima-e SpaceSpace L 1
B' C C'DE F
* SIMAGING WovITH TW~O LENSES TO PRODUCE CONSTANT MAGNIFICATION.
0r
B C. D I-
5.c
n-s.... Ek~iin m=xvmIllfcail
s5 =-S...is ane-. en
1A-2

. .
of lens configuration is extremely useful because the image space is
magnified by a constant value independent of the position in the
original object space. The volume lying from one focal length in front
of the short lens up to the surface of the small lens is imaged to the
right hand side of the large lens in a space which is convenient for
producing holograms. As with the previous lens the hologram can be
positioned at any place in the image space. Precisely the same method
- * for handling the reconstructed image for the matched collimator pair can
be used here. If any part of the image is a virtual image in the
reconstruction, it can be converted to a real image simply by reversing
the direction of the reconstruction reference wave, a practice which is
achieved normally by turning the hologram over. The stretching out of
the image space in this reconstruction does make the analysis of the
reconstructed image require more space if the object itself has
considerable z dimension. When such is the case, it is often better to
reconstruct the wave back through the lens pair to create an image space
identical to the original object space.
When an object field is magnified with a single lens, the amount
of magnification depends upon the position of the object. The closer
the object is to the focal point of the lens the greater the
magnification. When a very thin object field is used this creates
Little prbLem since the amount of magnification is ea .! to determine
simply by knowing where the object or image field is. The equations are..-
%. provided in Figure b. The magnificaition is simply the ratio of the
image to object distance or when either the image or the object distance
;aone is known then one of the other two relationships for magnification
A-24 84233du3A2/3b
@.5-S-*-* S.# .s
• °--."~-5 *''S - - 5 - . - - - --v'"•" . " " " """ ,," ""," ""', . ""." "","q "- " " 4 S,, ',,""" - *'" -" "",s- - -. itUm J .x% . ,"'."""'' ,,'' -,""",,t" i , , li i', , ,"",,"."""-'."" i":"- m ,;, aSm I " "" ' "
' ' ' '"'
, cni be used. For example, if only the image distance is known, as night
be the case in observing a reconstructed image, the magnification is
provided by the difference between the image distance and the focal
*length d ivided by the focal length.
When a larger sample volume is desired with magnification, it is
sometimes convenient to produce a constant magnification image space.
This can be done either during recording, as illustrated in the top
figure of Figure t, or during reconstruction, as illustrated in
Figure 7.
* By studying Figures 5 through 7, it is easy to see how, by using
ditfere.nt lens configurations, the image space of the hologram can be
located almost anywhere. Without some predetermination of this image
space Location it is likely to occur in in an inconvenient space and
require reiinaging. Locating the image space can be done by using the
riolitiuOshLps shown in these figures or as described previously by
inserting the calibration object in the object space and observing the
location of its im age relative tc the hologram.
lb
A-L5 b42J 30U3A2/3b
- . - --' ".- . - "- " + - "-" *- • - S "- - ."-.'.-" " .',*-.." - , ..'.' '- {- "-. - ,S , .- *~"

10-2lj5- 30-:
Re rer011CQ
Soloram
* Lens Added To Provide/ Consta-nt Magnification
N )PM1AL R Ed )NS TRI Cl IoN
Ho~ o1 ram
A-2
. . .. . . . . . . .% %pl

L RE- tNCE S
. I L. rlier, "Analysis of Holographic Diagnostics Systems,IC 1 -mi'nt-rrw 19, 122, (198U)
r-l~i R ecording Aaterials, Topics in Applied Physics,
V .- lj ii).
--- '
4Sir
8 -4