Embed Size (px)
Citation preview
1
University of Vaasa
VEBIC - Vaasa Energy BusinessInnovation Centre, School ofTechnology and Innovations, Schoolof Marketing and Communication
Vaasan yliopisto
VEBIC, Tekniikan jainnovaatiojohtamisen yksikkö,Markkinoinnin ja viestinnän yksikkö
Biogas Utilization Opportunities inOstrobothnia Region (BUOOR)BiokaasunhyödyntämismahdollisuudetPohjanmaallaCurrent State Analysis and interviewanalysisNykytila-analyysi jahaastatteluanalyysi
August 2021
Acknowledgements
This report is prepared as part of Biogas Utilization Opportunities in Ostrobothnia Regionproject by the University of Vaasa. The work has been co-funded by the European RegionalDevelopment Fund (ERDF), the Regional Council of Ostrobothnia, Wärtsilä Finland Oy,Westenergy Oy Ab, Ab Stormossen Oy, and Wasaline/NLC Ferry Ab Oy.
Astrid [email protected]
Karita [email protected]
Petra [email protected]
Abstract
Due to the current state of climate change we live in, the energy sector is developing itself to decrease itsreliance on non-renewable energy sources. As a renewable source of energy, biogas has shown to hold apotential for growth in production and use in the future. Consequently, investigating the current state asa basis to develop the future work of the biogas sector is actual and relevant. We argue that gatheringknowledge of and promoting collaboration are very relevant at this time where energy coupling isconsidered the way in the future.
This report aims to present the current state of the biogas sector through literature and interviewfindings. The first part focuses on analyzing the current state of the biogas business sector through aliterature review and analyzing existing examples. The current state analysis begins with discussing thebiogas sector as a whole. It is followed by a presentation of the sector at the EU level, including keynumbers and relationships to the transport sector, circular economy, agriculture and local economy.After that the Finnish biogas industry is presented, encompassing legislation, sector goals and actors.Then, the role of biogas in Ostrobothnia to the area and key actors involved are introduced. Finally,biogas ecosystem examples are covered at the farm, industrial and municipal levels as well as distributionand sales networks.
The second part analysis the market environment of the actors involved in this particular network. Thefocus is on the needs, value creation, critical factors, differences and common characteristics of biogasmarket actors.
Tiivistelmä
Käynnissä olevan ilmastomuutoksen myötä, energiasektori kehittyy ja muuttuu kun riippuvuussuhdettauusiutumattomiin energialähteisiin pyritään vähentämään. Biokaasu on uusiutuva energianlähde jonkaarvioidaan olevan kasvupotentiaalia sen tuotannon ja käytön alueilla tulevaisuudessa. Tämän vuoksi,nykytila-analyysi rakentaminen kehittääkseen biokaasualan tulevaa työtä on relevanttia ja ajankohtaista.Me arvioimme myös, että tiedonkeruu ja yhteistyöhön kannustaminen ovat hyvin olennaisia tällä hetkelläsillä sektorikytkentä sanotaan olevan tulevaisuutta.
Nykytila-analyysin tavoitteena on arvioida biokaasualan nykytilaa kirjallisuuskatsauksen jahaastattelulöydösten perusteella. Ensimmäinen osa biokaasualan nykyisiä toimintatapojakirjallisuuskatsauksen ja olemassa olevien esimerkkien avulla. Nykytila-analyysi alkaa esittelemälläbiokaasumarkkinaa yleisellä tasolla. Tämän jälkeen alaa tarkastellaan EU-tasolla käyden läpi keskeisiänumeroita ja suhteita kuljetussektorille, kiertotalouteen, maatalouteen and paikalliseen talouteen.Seuraavaksi Suomen biokaasumarkkinaa esitellään lakien, tavoitteiden ja toimijoiden kautta. Tämänjälkeen Pohjanmaan biokaasutilannetta tarkastellaan sekä sen toimijoita. Lopuksi käydään esimerkkejäbiokaasuverkostoista maatila-, teollisuus- ja kunnallistasoilla sekä jakelu- ja myyntiverkostojen kautta.
Toinen osio analysoi samassa verkostossa olevien toimijoiden markkinnatilannetta. Analyysi keskittyytoimijoiden tarpeisiin, arvon luontiin, kriittisiin tekijöihin, eroihin ja samankaltaisuuksiin.
ContentsAbbreviations .................................................................................................................................... 1
Glossary ............................................................................................................................................ 1
1. The biogas sector in a nutshell ................................................................................................... 2
1.1. The biogas sector in the European Union (EU)......................................................................... 2
1.1.1.EU biogas sector in numbers ............................................................................................. 4
1.1.2. Biogas in the EU transport sector ..................................................................................... 5
1.1.3. Circular economy in the EU .............................................................................................. 6
1.1.4. Biogas impacts on the EU agriculture and local economies ............................................... 7
2. The biogas sector in Finland ........................................................................................................... 8
2.1. National legislation ................................................................................................................. 8
2.2. National biogas sector goal: 4 TWh in 2030 ........................................................................... 10
2.3. Actors in the Finnish biogas sector ........................................................................................ 12
2.3.1 Meso level - primary biogas actors in Finland: ................................................................. 14
2.3.2. Meso level - secondary biogas actors in Finland ............................................................. 16
2.3.3 Meso level – tertiary biogas actors in Finland .................................................................. 17
2.3.4 Micro level - the end users .............................................................................................. 17
3. The biogas sector in Ostrobothnia ............................................................................................... 19
3.1 Meso level biogas actors in Ostrobothnia ............................................................................... 21
3.1.1 Feedstock providers in Ostrobothnia ............................................................................... 21
3.1.2. Biogas producers in Ostrobothnia .................................................................................. 22
3.1.3. Distribution network providers in Ostrobothnia ............................................................. 22
3.1.4. Logistical partners in Ostrobothnia ................................................................................. 23
3.1.5. Tertiary actors in Ostrobothnia ...................................................................................... 23
3.2 Micro level users of biogas in Ostrobothnia ........................................................................... 23
4. Examples of biogas collaborative networks .................................................................................. 25
4.1. Farm centered biogas collaborative models .......................................................................... 28
4.1.1. Case Uusikaupunki, Southwest Finland ........................................................................... 28
4.1.2. Case Palopuro, Southern Finland Symbiosis .................................................................... 28
4.1.3. Case Biohauki, Eastern Finland ....................................................................................... 29
4.1.4. Case Habitus, Central Ostrobothnia ................................................................................ 30
4.2. Industry centered biogas collaborative models ..................................................................... 31
4.2.1. Case Norrköping, Southeast Sweden .............................................................................. 31
4.2.2. Case Honkajoki biokaasu, Western Finland ..................................................................... 32
4.2.3. Case Vehmaa, Southwest Finland ................................................................................... 33
4.2.4. Case Tammisaari, Southern Finland ................................................................................ 34
4.3. Municipal centered biogas collaborative models ................................................................... 34
4.3.1. Case BIG – a common brand for biofuel stations ............................................................ 35
4.3.2. Case Lahti symbiosis ....................................................................................................... 35
4.3.3. Case Kiertokaari ............................................................................................................. 36
4.4. Distribution and sales of gas centered biogas collaborative models....................................... 37
4.4.1. Case Gasum – LNG distribution to start in Vaasa ............................................................ 37
4.4.2. Large plant producing LBG.............................................................................................. 38
4.4.3. Transportation collaboration with Gasum ...................................................................... 38
4.4.4. SEO – The Finnish Energy Cooperative ............................................................................ 39
5. Central findings from interview analysis....................................................................................... 40
5.1. The needs of actors ............................................................................................................... 41
5.2. Value creation of actors ........................................................................................................ 43
5.3. Critical factors to actors ........................................................................................................ 46
5.4. Differences and common characteristics between actors ...................................................... 47
6. Conclusion ................................................................................................................................... 49
References ...................................................................................................................................... 50
Appendix 1 SWOT & PESTEL ............................................................................................................ 57
Appendix 2 Biogas plant examples ................................................................................................... 58
Table 1 Scenarios of growth of Finnish biogas sector by 2030 (Virolainen-Hynnä 2021) ................... 10Table 2 Measures to achieve the goal of 4 TWh in Finland (Fredriksson et al. 2020) ........................ 11Table 3 Biogas sector stakeholders adapted from (Mutikainen et al. 2016). ..................................... 13Table 4 Most common feedstock in biogas production and their growth potential in Finland (TEM2020) ............................................................................................................................................... 15Table 5 The amount of biogas facilities in Finland at the end of 2017 (Huttunen et al. 2018) .......... 16Table 6 Biogas products, demand and end users in Finland 2030 (Fredriksson et al. 2020) .............. 18Table 7 Biogas sector stakeholders in Ostrobothnia adapted from (Mutikainen et al. 2016) ............ 20Table 8 Comparison of biogas plant networks in Finland through farm level examples .................... 25Table 9 Comparison of biogas plant networks in Finland through industry level examples ............... 26Table 10 Comparison of gas distribution and sales solutions in Finland through examples ............... 27Table 11 Comparison of biogas plant networks in Finland through municipal level examples........... 27Table 12 Central findings from interview analysis – description of current and estimated futuredirections ........................................................................................................................................ 40
Figure 1 EU Target of 14% renewables in transport by 2030 (Euractiv 2018) ...................................... 3Figure 2 Estimated amount of biogas in the future (EBA 2020). ......................................................... 4Figure 3 Number of biogas plants in Europe (EBA 2020) .................................................................... 5Figure 4 Number of biomethane plants in Europe (EBA 2020) ............................................................ 5Figure 5 Biogas ecosystem adapted from Mutikainen et al. 2016) ................................................... 12Figure 6 Agriculture in Finland (Ruokatieto 2021) ............................................................................ 21Figure 7 Biogas plants in Ostrobothnia 2021 (Suomen Biokaasu ja Biokierto ry 2021) ..................... 22Figure 8 Filling stations in Ostrobothnia 2021 (Kaasuautoilijat 2021) ............................................... 23Figure 9 Need of fertilizer (Luostarinen et al. 2019). ........................................................................ 25Figure 10 Farm level centralised biogas plant in Uusikaupunki, Southwest Finland (Biolinja 2021) ... 28Figure 11 Farm level centralised biogas plant in Hyvinkää, Southwest Finland (University of Helsinki2020) ............................................................................................................................................... 29Figure 12 Farm level decentralised biogas plant in Mikkeli, Eastern Finland based on description(Biohauki 2021) ............................................................................................................................... 30Figure 13 Farm level decentralised biogas plant project Habitus coordinated by Centria in CentralOstrobothnia (Habitus 2020) ........................................................................................................... 31Figure 14 Industry level centralised biogas plant in Norrköping, Sweden (Industriellekologi 2021a) . 32Figure 15 Industry level centralised biogas plant in Kankaanpää, Satakunta (Honkajoki 2021) ......... 33Figure 16 Industry level decentralised biogas plant in Tammisaari, Southern Finland (Jalotofu 2021)........................................................................................................................................................ 34Figure 17 Demonstrates the process of CBG production (Biogas 2021) ............................................ 35Figure 18 Municipal level centralised biogas plant in Lahti, Päijänne Tavastia (Circhubs 2021) ......... 36Figure 19 Municipal level centralised biogas plant in Oulu, North Ostrobothnia (Kiertokaari 2021a) 37Figure 20 Biogas plant producing CBG and LBG in Turku (Ojanpää 2020) ......................................... 38
1
AbbreviationsBUOOR Biogas Utilization Opportunities in Ostrobothnia Region
CBG Compressed biogas
LNG Liquified natural gas
LBG Liquified biogas
GHG Greenhouse Gas
TWh Terawatt hour
GlossaryFeedstock - Feedstock refers to the raw material that is required for some industrial process.
Digestate - Digestate is the remaining after the anaerobic digestion of a biodegradable feedstock.
Green deal – The European Green Deal is an EU level response to challenges associated with climatechange and environmental degradation. It seeks to ensure modernization, resource-efficiency andcompetitivity of the economy by aiming to have: no net emissions of greenhouse gases by 2050,economic growth decoupled from resource use and no person and no place left behind.
Biogas solutions – In this report biogas solutions refers to the various products made of biogas.
Tank-to-wheel (TTW) - describes the use of fuel in the vehicle and emissions during driving.
Well-to-wheel (WTW) – includes the production of the energy source (petrol, diesel, electricity,natural gas), fuel supply (transport to the charging point or fuel pump), its use and emissions ofeach.
2
1. The biogas sector in a nutshell
Within the current environmental and political context, biogas solutions play an important role inreducing the total amount of greenhouse gas emissions. Biogas solutions commonly involve cross-sectoral cooperation, where waste streams and wastewater flows are transformed into valuableproducts such as renewable energy and biofertilizer (Lindfors et al. 2019). Systems for producing andusing biogas, biomethane and digestate, support waste management and longevity of the nutrientcycle. Biogas and liquefied biogas replace other energy resources used in transportation, industry,heating and electricity production (Hagman and Eklund 2016, Gustavsson and Anderberg 2021).Biogas related activities also create new opportunities for the agricultural sector as farms canprovide their organic waste to be used in producing biogas and the remaining nutrients from theproduction process can be re-used in the fields (Mutikainen et al. 2016).
Altogether, it has been found that biogas solutions can contribute to many of the UN sustainabilitygoals (Gustavsson and Anderberg 2021). Biogas solutions can also strengthen the local economywhen biogas is produced from local feedstock, which is processed, and the end products are usednearby. Local production and use reduce logistical costs and emissions as well as contributes to thedevelopment of local markets. Simultaneously, the local market development supports the export ofknow-how and customer solutions as well as the adoption of new technology. The way of workingbetween players, technologies and skills can be exported to other similar regions. (IEA 2020, EBA2019)
Growth areas of the biogas sector are the use of gas in transportation, use of gas for energy andindustry, greater use of waste and the longevity of the nutrient cycle, and utilizing farms asadditional biogas producers (Mutikainen et al. 2016).
On a general level the growth of the biogas sector can be supported through changes in statutes andsupport mechanisms, national strategies and policies, communication and influence, collaborationand new skills (Mutikainen et al.2016). The sector is suffering from the so-called egg-chickenproblem where, as an example, considerable investments including plants and filling stations areneeded before users invest in biogas vehicles. Investors are thus required to take considerable risk ina context of great uncertainty. (Tolpo 2020)
1.1. The biogas sector in the European Union (EU)
The EU has as its objective to achieve carbon neutrality by 2050 (EBA et al. 2020). The current statusvaries in each EU Member State. The Renewable Energy Directive (RED II) states that 32% of theenergy produced should come from renewable sources by 2030. Renewable energy is the collectivename for energy, that is produced using the earth’s natural resources, like sunlight, wind, waterresources (rivers, tides and waves), heat from the earth’s surface, or biomass. The process, by whichthese renewable resources are converted into energy, emits no net greenhouse gases, which is whyrenewable energy is also referred to as ‘clean energy’. (European Commission 2020)
The European Green Deal pushes the energy sector to develop its efficiency and interconnectednessto achieve net-zero greenhouse gas emissions. It also provides an action plan to boost the efficientuse of resources by moving to a clean, circular economy, restore biodiversity and cut pollution(European Commission 2021). The EU focuses primarily on electrification but renewable gas will beneeded in areas where it does not suffice, including industry and transportation. In addition,
3
although the potential of hydrogen is valued, biomethane will maintain an important role in theenergy sector of the EU (EBA 2020). In the EU in 2025, it is estimated there will be 13 million vehiclesthat release low and zero CO2 emissions. There will be 1 filling station per 100 full electricity orbiogas cars according to the European directive on the deployment of the alternative fuels’infrastructure. (Knuts et al. 2020)
The most common sources for biogas are crops and animal manure feedstock and upgrading biogasto biomethane presents potential as a major source of future growth (IEA 2020). Biogas has been a“hot topic” in the EU because of the indirect land-use change (ILUC). ILUC refers to modifying land touse its feedstock in biofuel production e.g. increasing demand for biofuels leading to agriculturalexpansion and the conversion of natural lands. The RED II defines high ILUC biofuels as thoseproduced from feedstocks for which a significant expansion onto high carbon stock land is observed.Low ILUC biofuels are defined as those produced from feedstocks that avoid displacement of foodand feed crops through improved agricultural practices or the cultivation of areas not previouslyused for crop production (ICCT 2018). Thus, high ILUC biofuels such as palm and soybean oils,influences food and feed supply and can even negate emission savings resulting from the use ofbiofuels (European Commission 2019).
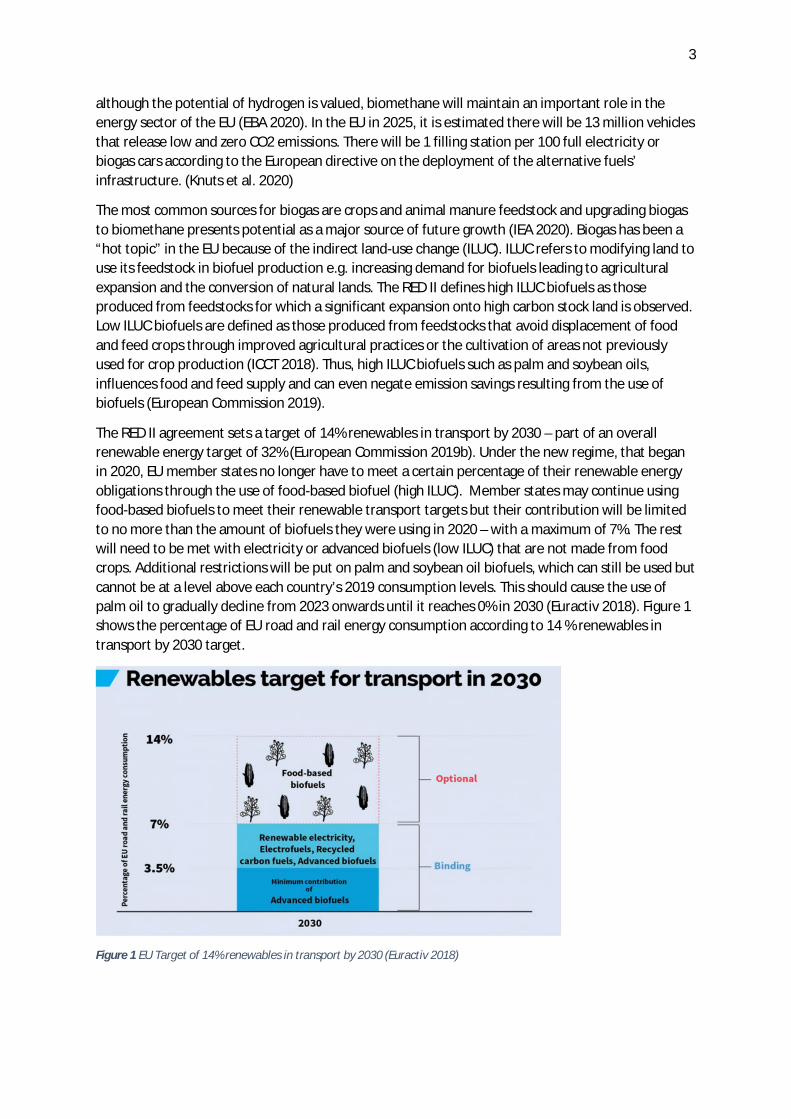
The RED II agreement sets a target of 14% renewables in transport by 2030 – part of an overallrenewable energy target of 32% (European Commission 2019b). Under the new regime, that beganin 2020, EU member states no longer have to meet a certain percentage of their renewable energyobligations through the use of food-based biofuel (high ILUC). Member states may continue usingfood-based biofuels to meet their renewable transport targets but their contribution will be limitedto no more than the amount of biofuels they were using in 2020 – with a maximum of 7%. The restwill need to be met with electricity or advanced biofuels (low ILUC) that are not made from foodcrops. Additional restrictions will be put on palm and soybean oil biofuels, which can still be used butcannot be at a level above each country’s 2019 consumption levels. This should cause the use ofpalm oil to gradually decline from 2023 onwards until it reaches 0% in 2030 (Euractiv 2018). Figure 1shows the percentage of EU road and rail energy consumption according to 14 % renewables intransport by 2030 target.
Figure 1 EU Target of 14% renewables in transport by 2030 (Euractiv 2018)
4
The RED II defines advanced biofuels as biofuels that are produced from feedstocks such as algaecultivated on land in ponds or photobioreactors, biomass fraction of mixed municipal and industrialwaste, bio-waste from private households and animal manure and sewage sludge (see part A ofAnnex IX in RED II). It is important to note that the feedstock, and not the process used to producethe advanced biofuels, determine whether the biofuels are considered to be “advanced”. (EAFO2019)
The current EU bioenergy policies have also been criticized for leading to an increased wood harvest(Harvey 2020, Raven et al. 2021) because it classifies forest biomass as zero carbon in the RED II. Thisrefers to the regulation on the inclusion of greenhouse gas emissions and removals from land use,land use change and forestry (LULUCF) and its current forest reference levels (European Comission2021). As member states have met their 2020 emission targets, the increased need for renewablepower has near doubled the amount of energy derived from solid biomass (Euractiv 2021). Usingforest biomass for fuel might be a reason behind the rapid increase of harvesting observed in theNordic countries from 2016 onwards. The increase in the rate of forest harvest is the result of therecent expansion of wood markets, as suggested by econometric indicators on forestry, wood-basedbioenergy and international trade. If such a high rate of forest harvest continues, the post-2020 EUvision of forest-based climate mitigation may be hampered, and the additional carbon losses fromforests would require extra emission reductions in other sectors to reach climate neutrality by 2050.(Ceccherini et al. 2020)
1.1.1.EU biogas sector in numbers
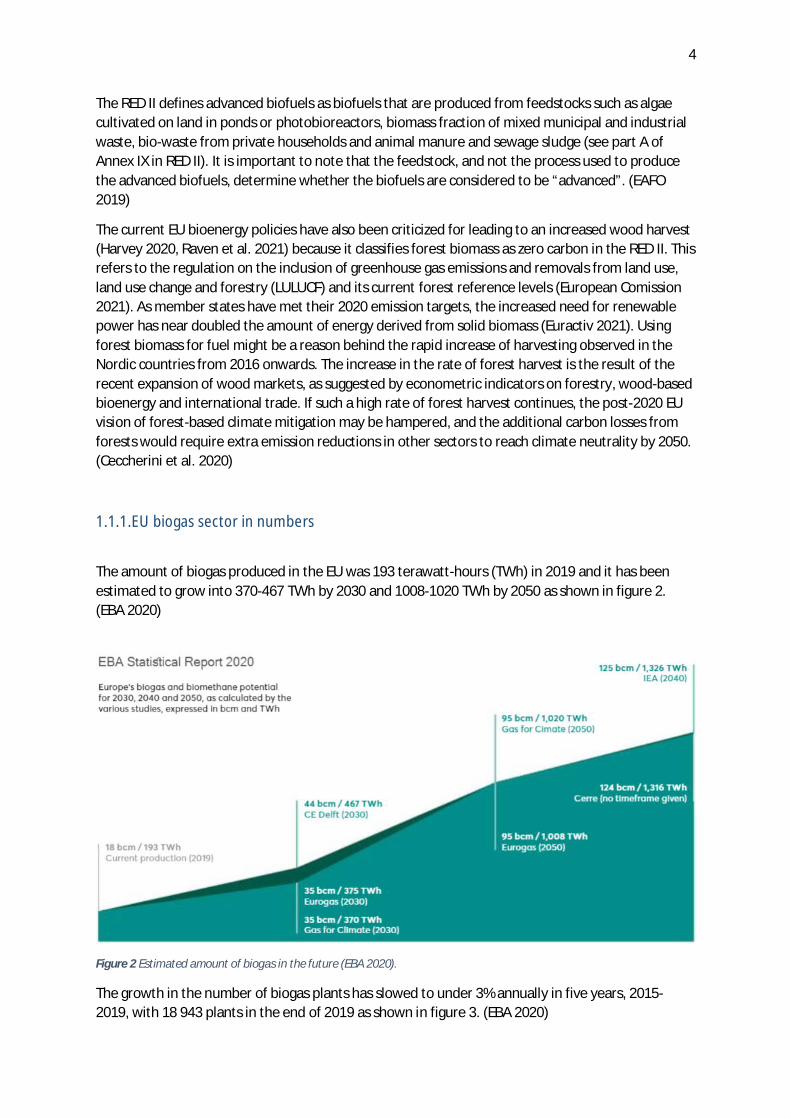
The amount of biogas produced in the EU was 193 terawatt-hours (TWh) in 2019 and it has beenestimated to grow into 370-467 TWh by 2030 and 1008-1020 TWh by 2050 as shown in figure 2.(EBA 2020)
Figure 2 Estimated amount of biogas in the future (EBA 2020).
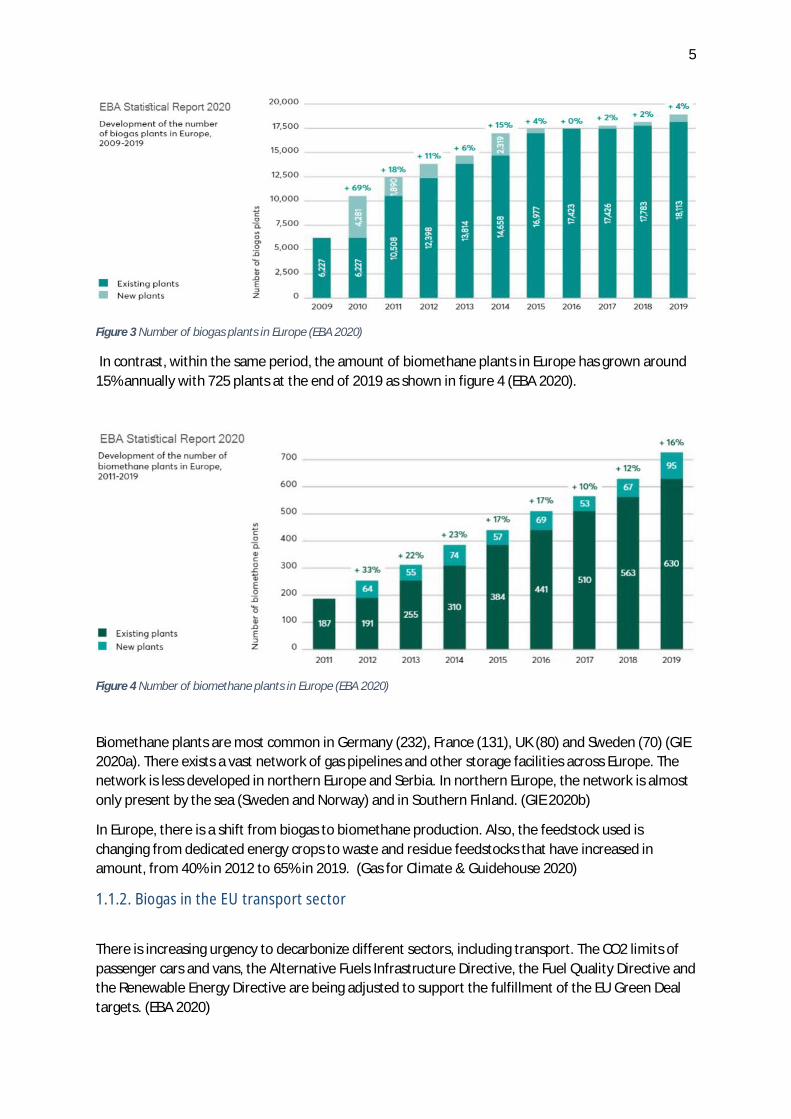
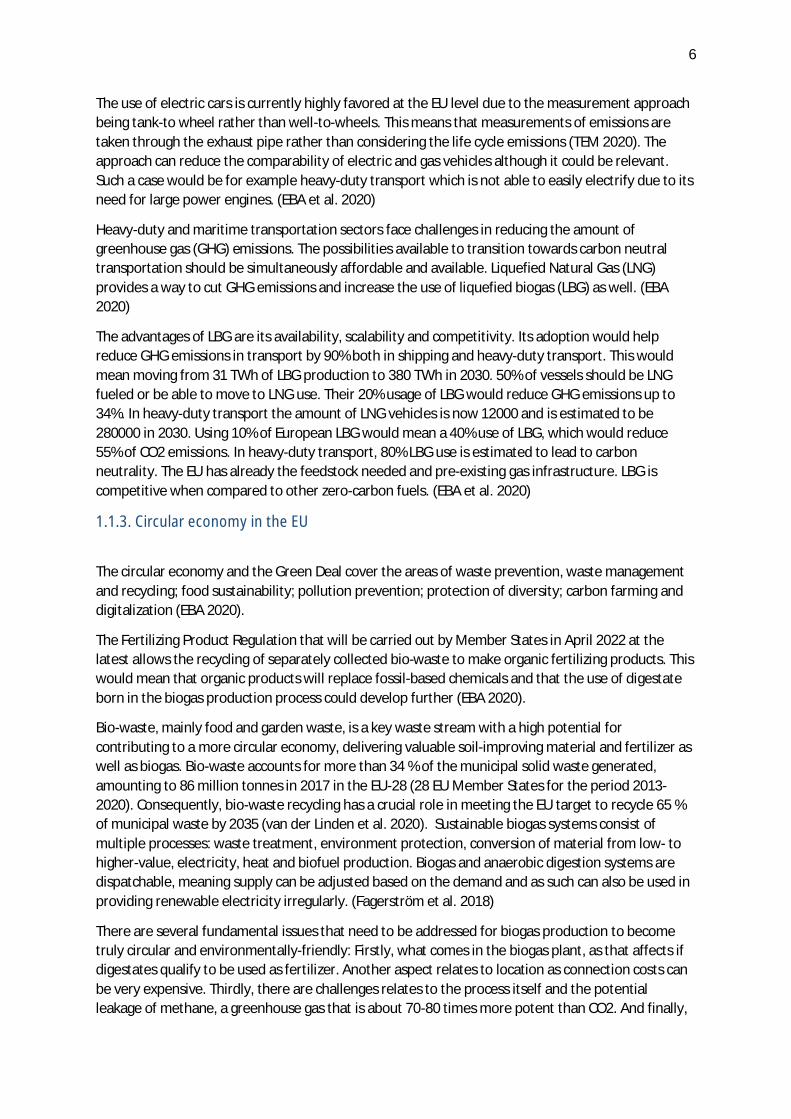
The growth in the number of biogas plants has slowed to under 3% annually in five years, 2015-2019, with 18 943 plants in the end of 2019 as shown in figure 3. (EBA 2020)
5
Figure 3 Number of biogas plants in Europe (EBA 2020)
In contrast, within the same period, the amount of biomethane plants in Europe has grown around15% annually with 725 plants at the end of 2019 as shown in figure 4 (EBA 2020).
Figure 4 Number of biomethane plants in Europe (EBA 2020)
Biomethane plants are most common in Germany (232), France (131), UK (80) and Sweden (70) (GIE2020a). There exists a vast network of gas pipelines and other storage facilities across Europe. Thenetwork is less developed in northern Europe and Serbia. In northern Europe, the network is almostonly present by the sea (Sweden and Norway) and in Southern Finland. (GIE 2020b)
In Europe, there is a shift from biogas to biomethane production. Also, the feedstock used ischanging from dedicated energy crops to waste and residue feedstocks that have increased inamount, from 40% in 2012 to 65% in 2019. (Gas for Climate & Guidehouse 2020)
1.1.2. Biogas in the EU transport sector
There is increasing urgency to decarbonize different sectors, including transport. The CO2 limits ofpassenger cars and vans, the Alternative Fuels Infrastructure Directive, the Fuel Quality Directive andthe Renewable Energy Directive are being adjusted to support the fulfillment of the EU Green Dealtargets. (EBA 2020)
6
The use of electric cars is currently highly favored at the EU level due to the measurement approachbeing tank-to wheel rather than well-to-wheels. This means that measurements of emissions aretaken through the exhaust pipe rather than considering the life cycle emissions (TEM 2020). Theapproach can reduce the comparability of electric and gas vehicles although it could be relevant.Such a case would be for example heavy-duty transport which is not able to easily electrify due to itsneed for large power engines. (EBA et al. 2020)
Heavy-duty and maritime transportation sectors face challenges in reducing the amount ofgreenhouse gas (GHG) emissions. The possibilities available to transition towards carbon neutraltransportation should be simultaneously affordable and available. Liquefied Natural Gas (LNG)provides a way to cut GHG emissions and increase the use of liquefied biogas (LBG) as well. (EBA2020)
The advantages of LBG are its availability, scalability and competitivity. Its adoption would helpreduce GHG emissions in transport by 90% both in shipping and heavy-duty transport. This wouldmean moving from 31 TWh of LBG production to 380 TWh in 2030. 50% of vessels should be LNGfueled or be able to move to LNG use. Their 20% usage of LBG would reduce GHG emissions up to34%. In heavy-duty transport the amount of LNG vehicles is now 12000 and is estimated to be280000 in 2030. Using 10% of European LBG would mean a 40% use of LBG, which would reduce55% of CO2 emissions. In heavy-duty transport, 80% LBG use is estimated to lead to carbonneutrality. The EU has already the feedstock needed and pre-existing gas infrastructure. LBG iscompetitive when compared to other zero-carbon fuels. (EBA et al. 2020)
1.1.3. Circular economy in the EU
The circular economy and the Green Deal cover the areas of waste prevention, waste managementand recycling; food sustainability; pollution prevention; protection of diversity; carbon farming anddigitalization (EBA 2020).
The Fertilizing Product Regulation that will be carried out by Member States in April 2022 at thelatest allows the recycling of separately collected bio-waste to make organic fertilizing products. Thiswould mean that organic products will replace fossil-based chemicals and that the use of digestateborn in the biogas production process could develop further (EBA 2020).
Bio-waste, mainly food and garden waste, is a key waste stream with a high potential forcontributing to a more circular economy, delivering valuable soil-improving material and fertilizer aswell as biogas. Bio-waste accounts for more than 34 % of the municipal solid waste generated,amounting to 86 million tonnes in 2017 in the EU-28 (28 EU Member States for the period 2013-2020). Consequently, bio-waste recycling has a crucial role in meeting the EU target to recycle 65 %of municipal waste by 2035 (van der Linden et al. 2020). Sustainable biogas systems consist ofmultiple processes: waste treatment, environment protection, conversion of material from low- tohigher-value, electricity, heat and biofuel production. Biogas and anaerobic digestion systems aredispatchable, meaning supply can be adjusted based on the demand and as such can also be used inproviding renewable electricity irregularly. (Fagerström et al. 2018)
There are several fundamental issues that need to be addressed for biogas production to becometruly circular and environmentally-friendly: Firstly, what comes in the biogas plant, as that affects ifdigestates qualify to be used as fertilizer. Another aspect relates to location as connection costs canbe very expensive. Thirdly, there are challenges relates to the process itself and the potentialleakage of methane, a greenhouse gas that is about 70-80 times more potent than CO2. And finally,
7
the size of biogas plants matters, the infrastructure cannot be too small to have economies of scalebut you cannot have super-large infrastructure either. (Euractiv 2019)
1.1.4. Biogas impacts on the EU agriculture and local economies
The agricultural sector’s contribution to the total GHG emissions of the EU is nearly 10%. By 2030,the Union’s emissions should be cut by 40% (30% in non-ETS sectors like agriculture), the share ofrenewable energy should be at least 32%. Production of renewable energy on farms can help toreduce and avoid emissions, improve the security of supply, bring extra income for farmers and leadeven to energy self-sufficiency. (EBA 2021)
The Member States will be granted more responsibility regarding Common Agricultural Policy (CAP)related investment and policy plans. In other words, Member States will manage the design,implementation and evaluation of CAP and present their plans by the end of 2021. The plans shouldstate how they plan to meet the CAP objectives and targets of the Farm to Fork strategy (EBA 2020).CAP will increase the capacity of anaerobic digestion, which supports biogas deployment, productionof bio-fertilisers, protein feed, bioenergy and bio-chemicals. The Farm to Fork strategy recognizesbiorefineries’ role in transitioning to a climate-neutral economy. (EBA 2020b)
The biogas solutions approach that has the most sustainability potential is “the circular economyapproach rooted at the local level” (Euractiv 2019). Biogas plays a role in the local economy as itrequires collaboration between multiple players, makes local energy sources available and providesnew business opportunities. The sector offers local opportunities and reduces the demand of energytransported from outside. Collaboration between players can provide new sources of income andgreater valorization of local feedstock and end-products of biogas production. The players canbenefit from locally produced heat, electricity, fuel and fertilizer. The upgrade of biogas tobiomethane is increasingly attractive as it can be used interchangeably with natural gas. (IEA 2020;EBA 2019)
8
2. The biogas sector in Finland
Opportunities to the development of the Finnish biogas sector include carbon neutrality goals, thedevelopment needs of nutrient recycling, security of supply and regional vibrancy, transport andagriculture emission reduction goals (Virolainen-Hynnä 2021).
The actors of the Finnish biogas sector are generally eager to develop it further. At the EU level,Finland is categorized as a moderately developed biogas market. There is an already somewhatdeveloped production and distribution infrastructure as well as group of users (Kampman et al.2017). Multiple national players provide construction and development services of biogas plants.There is some distribution infrastructure including a pipe network in Southern Finland (Gasgrid 2021)and filling stations mainly in the South and Western Finland (Kaasuautoilijat 2021). One intervieweefrom the Biogas Utilization Opportunities in Ostrobothnia Region (BUOOR) project stated that CBGuse by biogas private vehicles is competitive cost-wise. They state that, private biogas vehicles andCBG fuel are fairly priced. The price of biogas private vehicles is said to be equal to others andcheaper in use. It is added that private vehicles can be converted to biogas vehicles easily and for areasonable price. (Mutikainen et al. 2016)
Challenges include the low profitability of biogas production as the market is still underdevelopment. This influences decisions made regarding how and if energy production and nutrientmanagement processes should be carried and their extent. The cheap price of fossil fuel is also afactor slowing down development. (Virolainen-Hynnä 2021)
At the national level, the largest issues are the lack of a common infrastructure and an unreliableamount of supply and demand. Currently, the amount of biogas produced remains small comparedto its potential (Mutikainen et al. 2016). Building long-term plans appear to be challenging due tothe high investment cost and the level of riskiness due to a lack of demand. On the supply side,clients perceive the provision of biogas unreliable. Clients are waiting for more stability in themarket (political and strategic) to start adopting biogas. The market is fragmented and there is quitelittle communication between stakeholders (EU 2020; BUOOR Interviews 2021).
Solutions include policy instruments focused on biogas and nutrient recycling market development.Profitability can be improved through aids, incentives and legislative means. The sector could benefitfrom predictability for players to be more eager to invest (Virolainen-Hynnä 2021).
2.1. National legislation
At the national level, there is a general eagerness to reduce the amount of emissions. The goal ofemission reduction in Finland is set to 51% renewable energy by 2030. In Finland, the mostimportant renewable energy sources are bioenergy, especially wood and wood-based fuels andhydropower. In addition, the use of wind power has been increasing and it accounts for around 10%of annual electricity production. Also, geothermal heat and solar power energy production areincreasing. In 2019, renewable energy sources accounted for almost 38% of total consumption and43% of end consumption compared to 1990 when they represented only 18% of total consumption.The growth pace has increased in the 2010s. The long-term national strategy to reduce GHGemíssions focuses on growth in bioenergy, wind power and geothermal heat pump use. After 2035
9
the list will also include solar power. The RED II directive also requires that 14% of the energy used intransportation will be renewable by 2030. (Motiva 2021)
The national waste legislation will be renewed in 2021 in response to the goals set to Member Statesby the EU. Member states should recycle at least 55% by 2025, 60% by 2030 and 65% by 2035. Thelaw will require the collection of biowaste from municipalities with over 10 000 habitants from thebeginning of 2024, or the use of compost. (Molok 2021)
According to the national Roadmap for Carbon-free traffic, there is an aim to halve GHG emissionsby 2030 and achieve zero GHG emissions in the transportation sector by 2045. In 2030 34% of thefuel used should be from a renewable source, including biogas. The Roadmap notes that biogas andsynthetic gases have an important role in reducing road transportation GHG emissions over the midand long term. The plan includes the following: to integrate biogas and synthetic fuels to theobligation to supply (jakeluvelvoite) and simultaneously ensure that the competitivity of biogas priceremain sufficient; to offer support to the production of biofuels, biogas and synthetic fuels duringthe 2020th century; to support the production, use and infrastructure development through policies;to increase biogas production and vehicles amount to 2,5 TWh in 2030; to ensure that biogasvehicles are considered in the EU law setting limits to GHG emissions of new cars; to support heavy-duty biogas vehicle purchase through an aid also after 2021; continue the vehicle conversion to gasaid; renewing vehicles to lower or zero emission by providing incentives to technologies, fuels andtheir use; to consider emission trading as a possible action. In addition, a special tax (free of theCO2-emission component) will be applied. (Liikenne- ja viestintäministeriö 2021)
Public procurement plays a role in the development of the biogas sector, for example throughvehicle choices. The EU's Clean Vehicles Directive is planned to be implemented with a new law thataims to more eco-friendly public procurement of vehicles and transport services. The law consists ofnew requirements. Between 2021 to 2025 38, 5% of vans and private vehicles should produce amaximum of 50 CO2 g/km and between 2026-2030 38,5% of vans and private vehicles shouldproduce 0 CO2 g/km. In the case of heavy-duty vehicles, 9% in 2021-2025 and 15% in 2026-2030should be using alternative fuels biofuel, electricity, gas or hydrogen. The local buses are included inthe expectation related to alternative fuels. However, the amount should be 41% in 2021-2025 and59% in 2026-2030. In addition, 20,5% should be fully electric buses from 2021-2025 and 29,5% in2026-2030. The directive does not recognize the potential of the biogas vehicles largely. Theemission limits should be in line with the directive only nationally and can therefore be regionallyvarying. (Valtioneuvosto 2021)
10
2.2. National biogas sector goal: 4 TWh in 2030
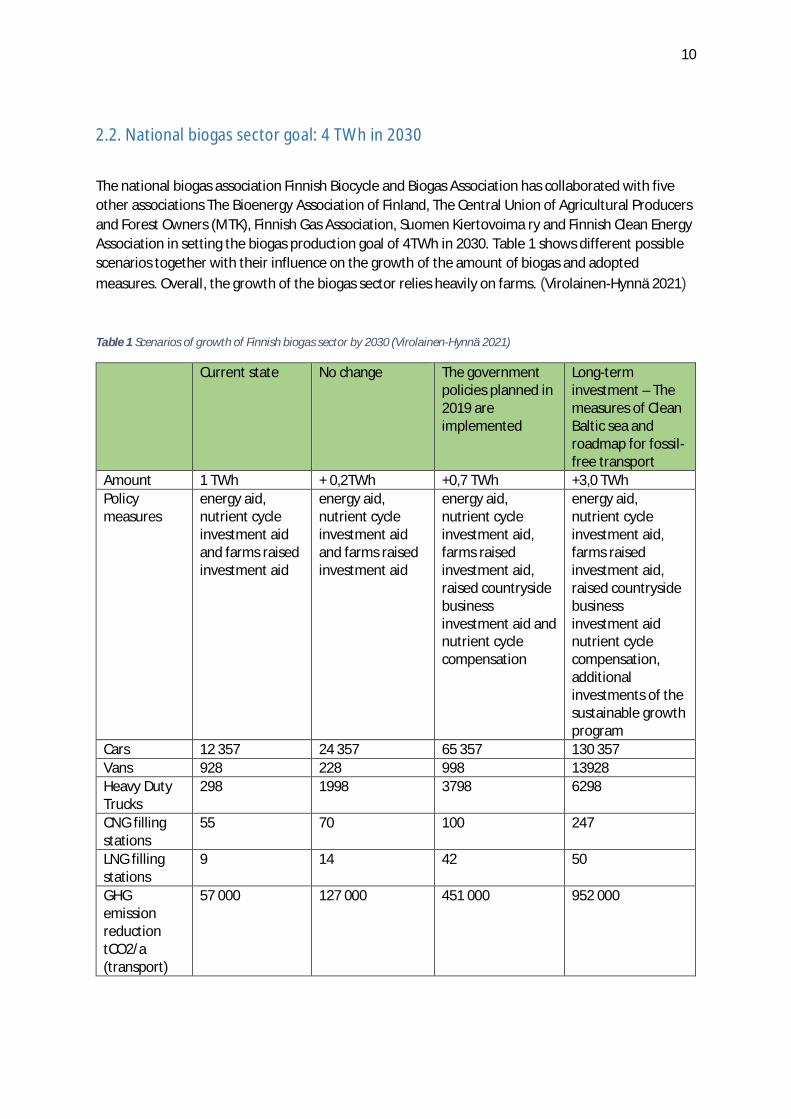
The national biogas association Finnish Biocycle and Biogas Association has collaborated with fiveother associations The Bioenergy Association of Finland, The Central Union of Agricultural Producersand Forest Owners (MTK), Finnish Gas Association, Suomen Kiertovoima ry and Finnish Clean EnergyAssociation in setting the biogas production goal of 4TWh in 2030. Table 1 shows different possiblescenarios together with their influence on the growth of the amount of biogas and adoptedmeasures. Overall, the growth of the biogas sector relies heavily on farms. (Virolainen-Hynnä 2021)
Table 1 Scenarios of growth of Finnish biogas sector by 2030 (Virolainen-Hynnä 2021)
Current state No change The governmentpolicies planned in2019 areimplemented
Long-terminvestment – Themeasures of CleanBaltic sea androadmap for fossil-free transport
Amount 1 TWh + 0,2TWh +0,7 TWh +3,0 TWhPolicymeasures
energy aid,nutrient cycleinvestment aidand farms raisedinvestment aid
energy aid,nutrient cycleinvestment aidand farms raisedinvestment aid
energy aid,nutrient cycleinvestment aid,farms raisedinvestment aid,raised countrysidebusinessinvestment aid andnutrient cyclecompensation
energy aid,nutrient cycleinvestment aid,farms raisedinvestment aid,raised countrysidebusinessinvestment aidnutrient cyclecompensation,additionalinvestments of thesustainable growthprogram
Cars 12 357 24 357 65 357 130 357Vans 928 228 998 13928Heavy DutyTrucks
298 1998 3798 6298
CNG fillingstations
55 70 100 247
LNG fillingstations
9 14 42 50
GHGemissionreductiontCO2/a(transport)
57 000 127 000 451 000 952 000
11
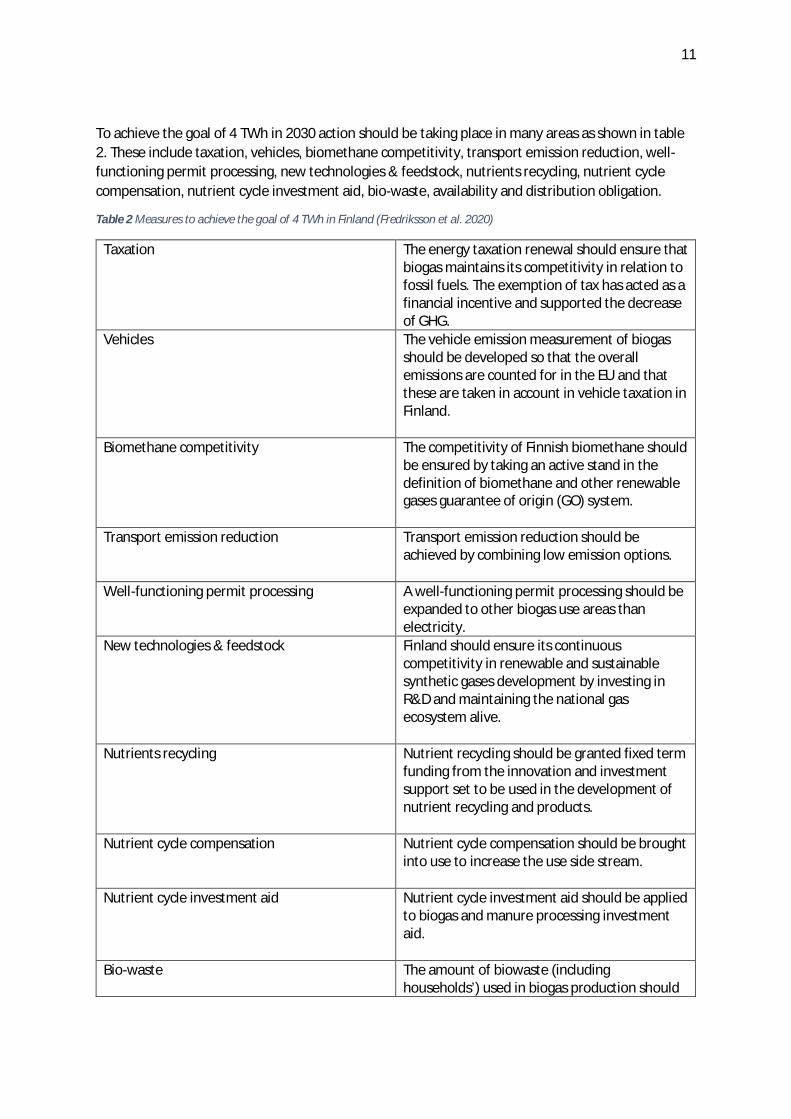
To achieve the goal of 4 TWh in 2030 action should be taking place in many areas as shown in table2. These include taxation, vehicles, biomethane competitivity, transport emission reduction, well-functioning permit processing, new technologies & feedstock, nutrients recycling, nutrient cyclecompensation, nutrient cycle investment aid, bio-waste, availability and distribution obligation.
Table 2 Measures to achieve the goal of 4 TWh in Finland (Fredriksson et al. 2020)
Taxation The energy taxation renewal should ensure thatbiogas maintains its competitivity in relation tofossil fuels. The exemption of tax has acted as afinancial incentive and supported the decreaseof GHG.
Vehicles The vehicle emission measurement of biogasshould be developed so that the overallemissions are counted for in the EU and thatthese are taken in account in vehicle taxation inFinland.
Biomethane competitivity The competitivity of Finnish biomethane shouldbe ensured by taking an active stand in thedefinition of biomethane and other renewablegases guarantee of origin (GO) system.
Transport emission reduction Transport emission reduction should beachieved by combining low emission options.
Well-functioning permit processing A well-functioning permit processing should beexpanded to other biogas use areas thanelectricity.
New technologies & feedstock Finland should ensure its continuouscompetitivity in renewable and sustainablesynthetic gases development by investing inR&D and maintaining the national gasecosystem alive.
Nutrients recycling Nutrient recycling should be granted fixed termfunding from the innovation and investmentsupport set to be used in the development ofnutrient recycling and products.
Nutrient cycle compensation Nutrient cycle compensation should be broughtinto use to increase the use side stream.
Nutrient cycle investment aid Nutrient cycle investment aid should be appliedto biogas and manure processing investmentaid.
Bio-waste The amount of biowaste (includinghouseholds’) used in biogas production should
12
increase while the amount of biowaste shoulddecrease.
Availability Boosting availability of biomethane andimproving its price competitiveness to ensureinterest from industry and transportationsector.
Extending the biofuel distribution obligation tobiomethane
The extension of biomethane to the biofueldistribution obligation should be thoroughlyinvestigated prior to decision-making.
2.3. Actors in the Finnish biogas sector
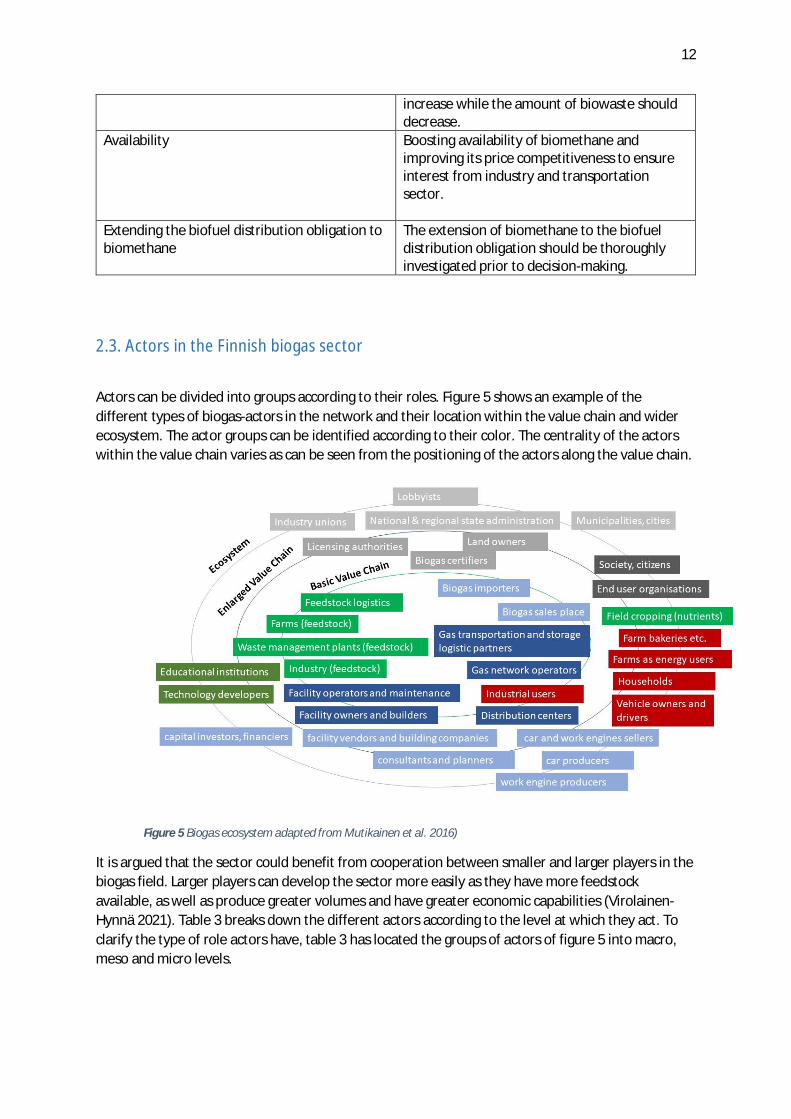
Actors can be divided into groups according to their roles. Figure 5 shows an example of thedifferent types of biogas-actors in the network and their location within the value chain and widerecosystem. The actor groups can be identified according to their color. The centrality of the actorswithin the value chain varies as can be seen from the positioning of the actors along the value chain.
Figure 5 Biogas ecosystem adapted from Mutikainen et al. 2016)
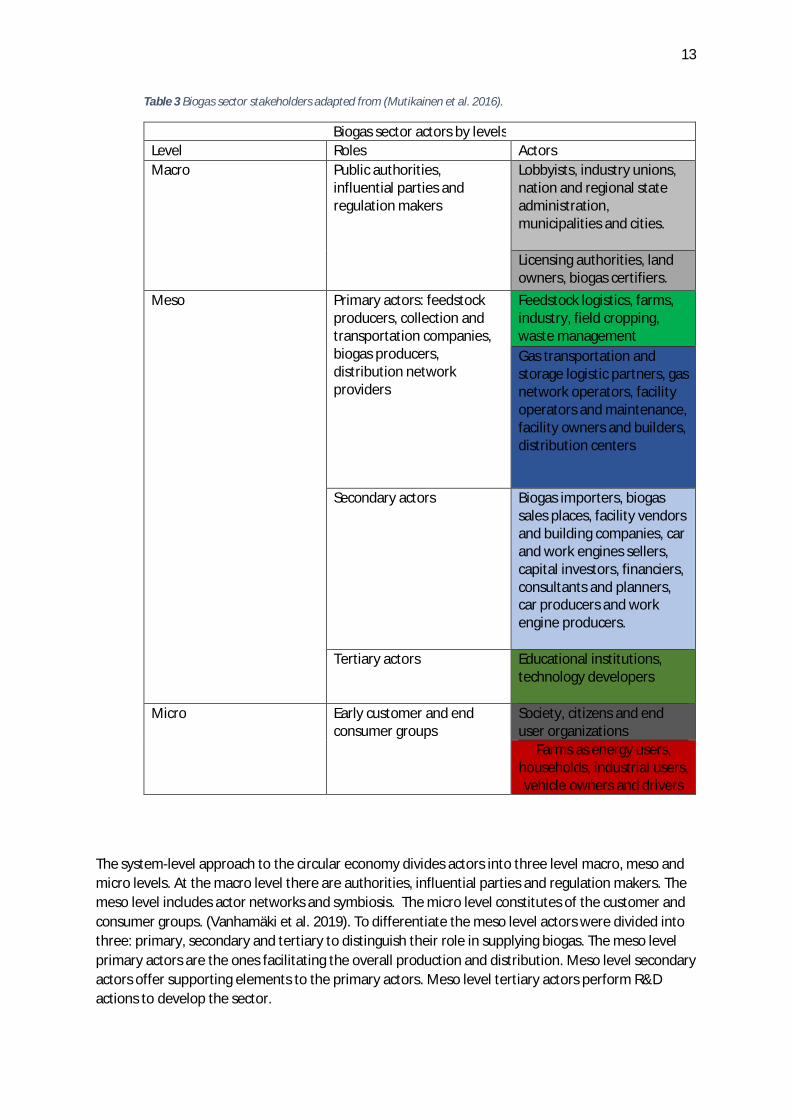
It is argued that the sector could benefit from cooperation between smaller and larger players in thebiogas field. Larger players can develop the sector more easily as they have more feedstockavailable, as well as produce greater volumes and have greater economic capabilities (Virolainen-Hynnä 2021). Table 3 breaks down the different actors according to the level at which they act. Toclarify the type of role actors have, table 3 has located the groups of actors of figure 5 into macro,meso and micro levels.
13
Table 3 Biogas sector stakeholders adapted from (Mutikainen et al. 2016).
Biogas sector actors by levelsLevel Roles ActorsMacro Public authorities,
influential parties andregulation makers
Lobbyists, industry unions,nation and regional stateadministration,municipalities and cities.
Licensing authorities, landowners, biogas certifiers.
Meso Primary actors: feedstockproducers, collection andtransportation companies,biogas producers,distribution networkproviders
Feedstock logistics, farms,industry, field cropping,waste managementGas transportation andstorage logistic partners, gasnetwork operators, facilityoperators and maintenance,facility owners and builders,distribution centers
Secondary actors Biogas importers, biogassales places, facility vendorsand building companies, carand work engines sellers,capital investors, financiers,consultants and planners,car producers and workengine producers.
Tertiary actors Educational institutions,technology developers
Micro Early customer and endconsumer groups
Society, citizens and enduser organizations
Farms as energy users,households, industrial users,vehicle owners and drivers
The system-level approach to the circular economy divides actors into three level macro, meso andmicro levels. At the macro level there are authorities, influential parties and regulation makers. Themeso level includes actor networks and symbiosis. The micro level constitutes of the customer andconsumer groups. (Vanhamäki et al. 2019). To differentiate the meso level actors were divided intothree: primary, secondary and tertiary to distinguish their role in supplying biogas. The meso levelprimary actors are the ones facilitating the overall production and distribution. Meso level secondaryactors offer supporting elements to the primary actors. Meso level tertiary actors perform R&Dactions to develop the sector.
14
Main macro players include the government, the ministries, associations, licensing authorities andbiogas certifiers. The government decides the national regulations. Main associations supporting thebiogas sector in Finland are the Finnish Biocycle and Biogas Association, The Bioenergy Associationof Finland, The Central Union of Agricultural Producers and Forest Owners (MTK), Finnish GasAssociation, Suomen Kiertovoima ry and Finnish Clean Energy Association. The Finnish Safety andChemicals Agency (Tukes) grants licenses for natural gas pipeline or gas filling station constructionand for storing natural gas. If the stored amount is 5 tonnes or larger a construction permit has to begranted by Tukes, for quantities below that a notification to Tukes suffices. In addition, anoperations supervisor and deputies should be appointed and notified to Tukes before the use of gascan begin. Installation of a gas pipeline or filling station should be performed by operatorsauthorised by Tukes. Inspections tend to be performed by an inspection body. Operation permits aregranted by Tukes or an inspection body. (Tukes 2021). For biogas products to be sold as provedrenewable, certification is required. Certificates are supplied by Gasgrid Finland Oy (Kaasuautoilijat2019). Some interviewees of the BUOOR project argued that certificates and obtaining rights takestime that is precious in a market of low profit margin.
Micro actors include end-users of the biogas solutions (Mutikainen et al. 2016). Interviewees fromthe BUOOR project state potential users of the energy products and processed digestate includeindustrial customers, heavy-duty traffic, marine traffic, private customers and farms. They argue thattheir choice to move to biogas reduces their reliance on fossil fuels and increases the use of localfuels whilst reducing GHG emissions. Examples mentioned by few interviewees entail a need forbiogas users to also have an alternative fuel in case the flow of biogas is momentarily disturbed. Insuch cases, natural gas or other energy products may be used. Other interviewees also mention thatwhen used in large amounts gas users tend to prefer LNG or use considerably more LNG than LBGdue to better availability and more attractive pricing. LBG is stated to have lower total GHGemissions. Interviewees argue that mixing the two allows access to their qualities.
Meso players are organisations directly or indirectly involved in the actual biogas sector. We havedecided to divide them into three groups based on their centrality in the value chain. The primarymeso players are feedstock producers, collection and transportation companies, biogas producers,distribution network providers. The secondary players are organisations who sell the gas itself, orproducts and services which are linked to the production and use of biogas. The tertiary playersrepresent organisations who perform R&D work around the area of biogas.
The macro players won’t be discussed any further in this chapter as they were discussed in theChapter 1 part more thoroughly. This chapter will continue by discussing meso and micro levelactors in the Finnish biogas market.
2.3.1 Meso level - primary biogas actors in Finland:
Feedstock providers
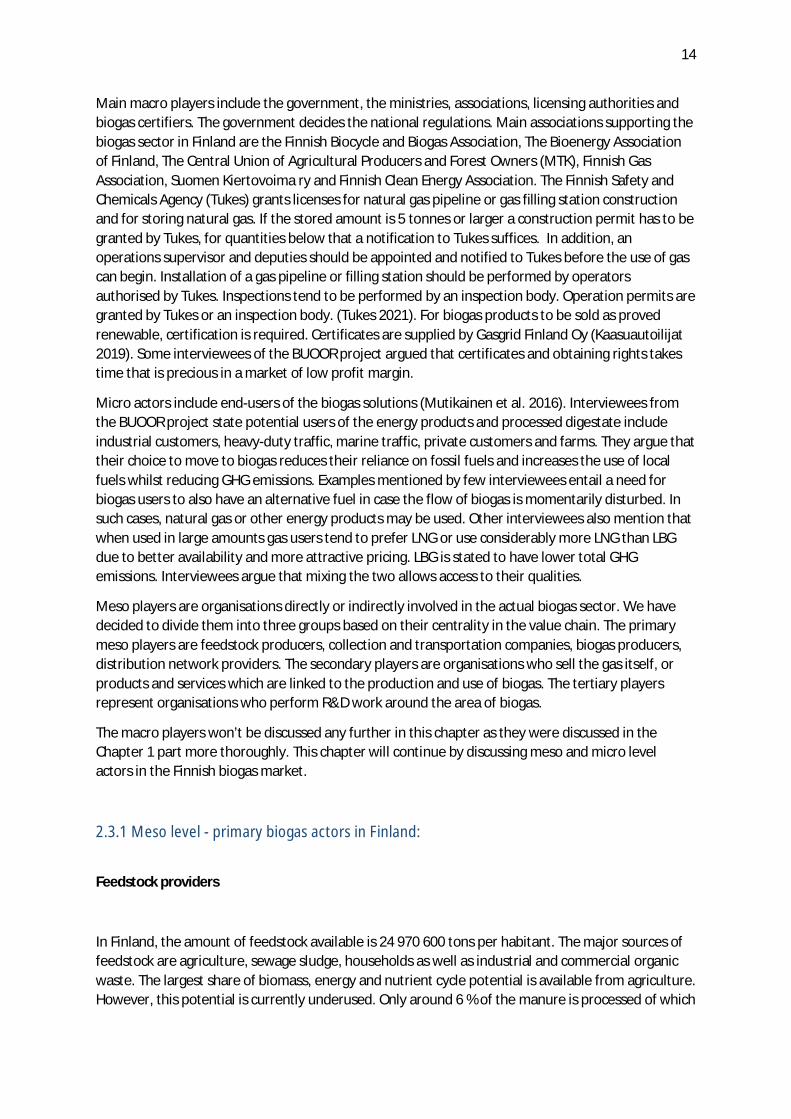
In Finland, the amount of feedstock available is 24 970 600 tons per habitant. The major sources offeedstock are agriculture, sewage sludge, households as well as industrial and commercial organicwaste. The largest share of biomass, energy and nutrient cycle potential is available from agriculture.However, this potential is currently underused. Only around 6 % of the manure is processed of which
15
only 1,4% is used in the production of biogas. The amount of sewage sludge is 4,7 million tons a yearand 81% of it is used in biogas production. Therefore, it only has small growth potential. (TEM 2020).
The amount of organic waste of households is 0,8 million tons a year, of which around a third, 0,36million tons are collected. The amount collected should rise to 60% to be in line with the nationalwaste program. (TEM 2020)
The industry has different amounts and types of organic waste with differing use potential.Currently, details of those are not centrally collected and the industry does not hold a large potentialfor use in biogas production and nutrient cycle. (TEM 2020). Table 4 summarizes the most commonfeedstock in biogas production and their growth potential in Finland.
Table 4 Most common feedstock in biogas production and their growth potential in Finland (TEM 2020)
Sources of feedstock Growth potentialAgriculture GreatestHouseholds Second greatestIndustrial & commercial organic waste Second lowestSewage sludge Lowest
BUOOR interviewees stated that feedstock is either collected by waste management companies orby the feedstock provider themselves. Some added that the logistic costs are paid by the feedstockprovider. In addition, it was brought up that feedstock providers have municipal agreements statingto which biogas producer they have to deliver the feedstock such as, in the case of households. Oneinterview highlighted that when this is not the case the logistical partner selects the most cost-effective choice available considering pricing and physical distance to the plant. Another intervieweementioned the diversity of biogas producers as some biogas producers may accept feedstock free-of-charge while others collect gate-fees to be paid by either the logistical partner or the feedstockprovider (BUOOR 2021).
Biogas producers
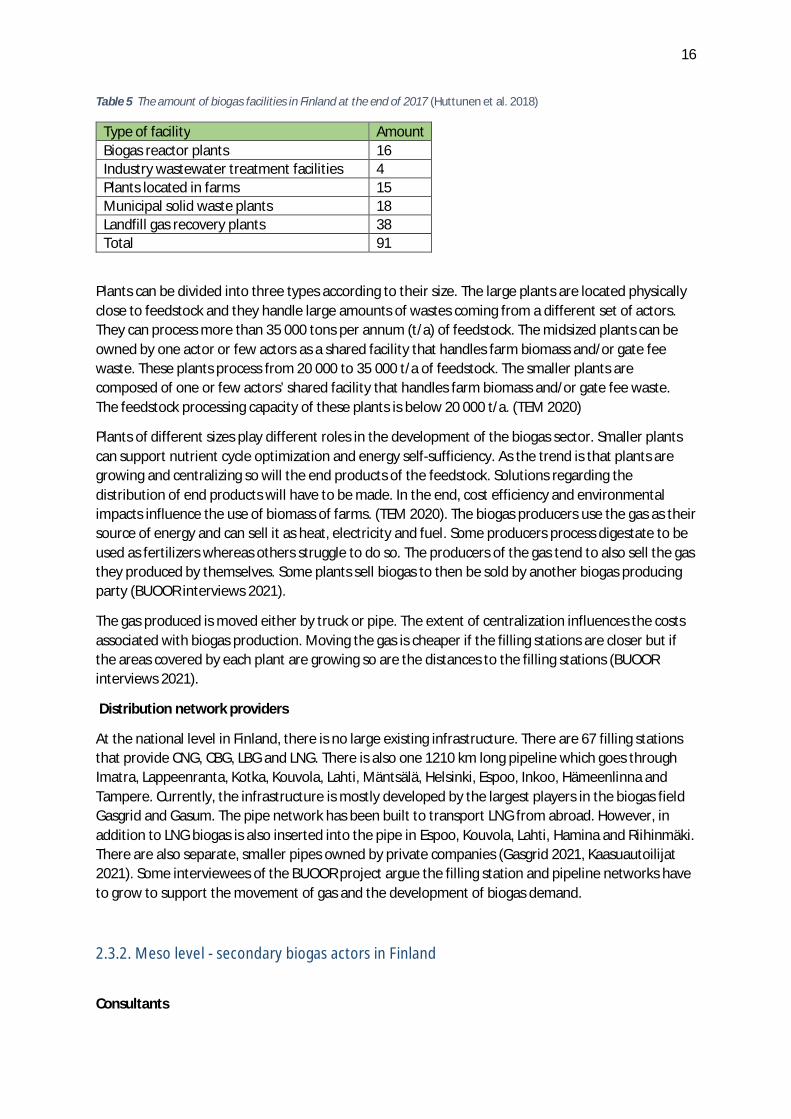
In Finland, there are currently around 91 biogas facilities (Huttunen et al. 2018). The largest biogasproducer Gasum owns 10 biogas plants in Finland. It operates in both natural and biogas sectors innorthern Europe (Gasum 2021de). Multiple interviewees mentioned a tendency among actors tocollaborate when appropriate for example, through providing feedstock and buying the biogasproduced. Relationships like this can lead to interdependencies that can support the continuous flowof feedstock and biogas to customers and make prices attractive to involved parties (BUOOR 2021).
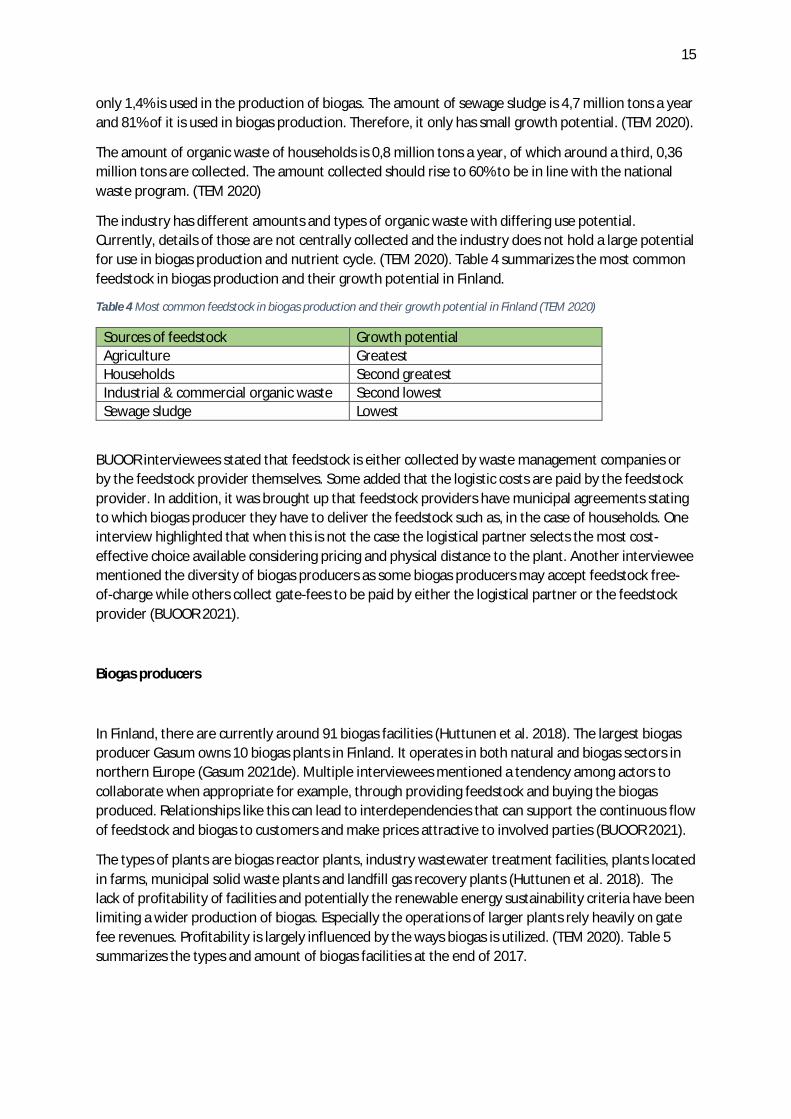
The types of plants are biogas reactor plants, industry wastewater treatment facilities, plants locatedin farms, municipal solid waste plants and landfill gas recovery plants (Huttunen et al. 2018). Thelack of profitability of facilities and potentially the renewable energy sustainability criteria have beenlimiting a wider production of biogas. Especially the operations of larger plants rely heavily on gatefee revenues. Profitability is largely influenced by the ways biogas is utilized. (TEM 2020). Table 5summarizes the types and amount of biogas facilities at the end of 2017.
16
Table 5 The amount of biogas facilities in Finland at the end of 2017 (Huttunen et al. 2018)
Type of facility AmountBiogas reactor plants 16Industry wastewater treatment facilities 4Plants located in farms 15Municipal solid waste plants 18Landfill gas recovery plants 38Total 91
Plants can be divided into three types according to their size. The large plants are located physicallyclose to feedstock and they handle large amounts of wastes coming from a different set of actors.They can process more than 35 000 tons per annum (t/a) of feedstock. The midsized plants can beowned by one actor or few actors as a shared facility that handles farm biomass and/or gate feewaste. These plants process from 20 000 to 35 000 t/a of feedstock. The smaller plants arecomposed of one or few actors’ shared facility that handles farm biomass and/or gate fee waste.The feedstock processing capacity of these plants is below 20 000 t/a. (TEM 2020)
Plants of different sizes play different roles in the development of the biogas sector. Smaller plantscan support nutrient cycle optimization and energy self-sufficiency. As the trend is that plants aregrowing and centralizing so will the end products of the feedstock. Solutions regarding thedistribution of end products will have to be made. In the end, cost efficiency and environmentalimpacts influence the use of biomass of farms. (TEM 2020). The biogas producers use the gas as theirsource of energy and can sell it as heat, electricity and fuel. Some producers process digestate to beused as fertilizers whereas others struggle to do so. The producers of the gas tend to also sell the gasthey produced by themselves. Some plants sell biogas to then be sold by another biogas producingparty (BUOOR interviews 2021).
The gas produced is moved either by truck or pipe. The extent of centralization influences the costsassociated with biogas production. Moving the gas is cheaper if the filling stations are closer but ifthe areas covered by each plant are growing so are the distances to the filling stations (BUOORinterviews 2021).
Distribution network providers
At the national level in Finland, there is no large existing infrastructure. There are 67 filling stationsthat provide CNG, CBG, LBG and LNG. There is also one 1210 km long pipeline which goes throughImatra, Lappeenranta, Kotka, Kouvola, Lahti, Mäntsälä, Helsinki, Espoo, Inkoo, Hämeenlinna andTampere. Currently, the infrastructure is mostly developed by the largest players in the biogas fieldGasgrid and Gasum. The pipe network has been built to transport LNG from abroad. However, inaddition to LNG biogas is also inserted into the pipe in Espoo, Kouvola, Lahti, Hamina and Riihinmäki.There are also separate, smaller pipes owned by private companies (Gasgrid 2021, Kaasuautoilijat2021). Some interviewees of the BUOOR project argue the filling station and pipeline networks haveto grow to support the movement of gas and the development of biogas demand.
2.3.2. Meso level - secondary biogas actors in Finland
Consultants
17
Consultants are used widely in planning, constructing, maintaining and developing plants anddeveloping the knowledge of market players. The plant manufacturers develop their offering so thatit is adaptable in versatile contexts both nationally and abroad. In Finland, there exist many facilityvendors and building companies such as Pro-group, Sarlin, Doranova Oy, Metener and Demeca(automation). Metener and Demeca, which built their business initially by constructing plants totheir farms, are one of the pioneers in the area and they provide both consultant services andfacilities (Metener 2021, Demeca 2021). There are also other consultants such as Afry, Vaisala,Watrec Oy, Doranova Oy, Envitecpolis Oy , Biokymppi Oy, Ductor Oy, Kiertokasvu Oy and VogelsangOy. Regarding finance, in practice, project interviewees said financing is obtained through multipleinvestment organizations, investment aids and bank loans (BUOOR interviews 2021).
Conversion service providers
In transportation, vehicles can be converted to use gas. Conversion service providers include TerraGas Finland and Action Car Service ACS Oy. There are also gas vehicles and engines sold by differentcompanies. An important number of used biogas cars are imported from abroad. Also, theconversion of traditional cars to biogas is financially supported (TEM 2020). A couple of intervieweesof the BUOOR project say that the purchase price and availability of private cars is currently not anissue.
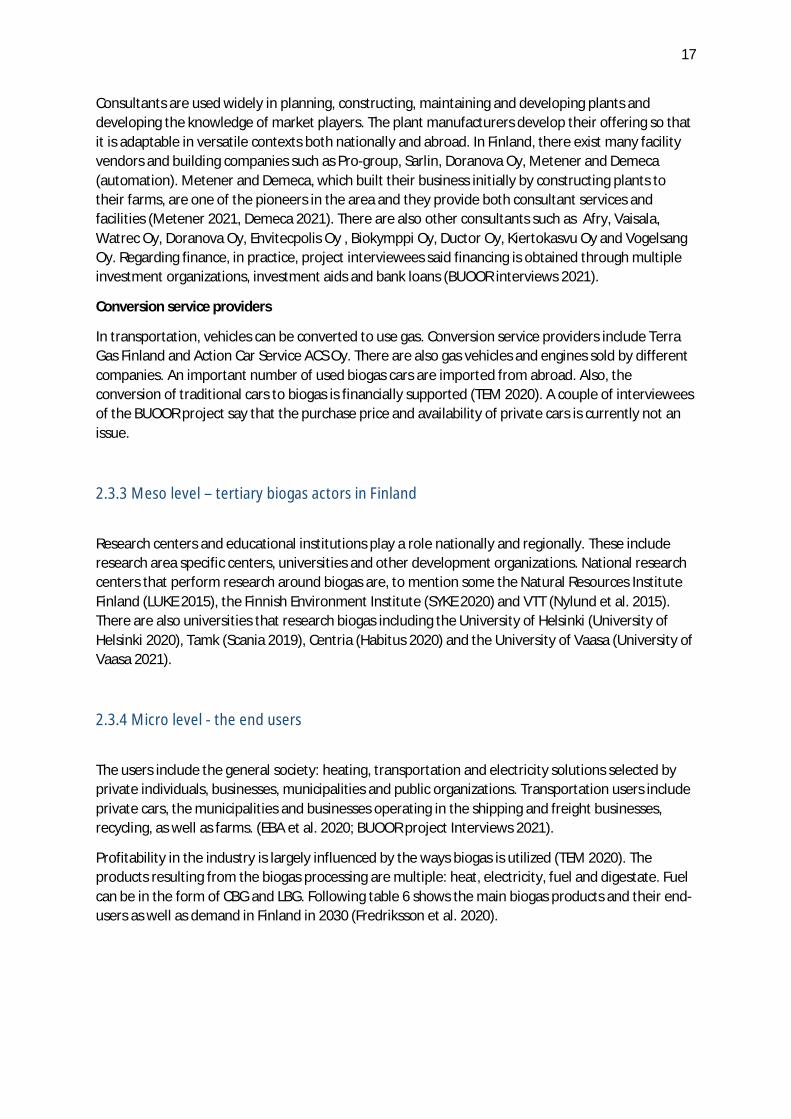
2.3.3 Meso level – tertiary biogas actors in Finland
Research centers and educational institutions play a role nationally and regionally. These includeresearch area specific centers, universities and other development organizations. National researchcenters that perform research around biogas are, to mention some the Natural Resources InstituteFinland (LUKE 2015), the Finnish Environment Institute (SYKE 2020) and VTT (Nylund et al. 2015).There are also universities that research biogas including the University of Helsinki (University ofHelsinki 2020), Tamk (Scania 2019), Centria (Habitus 2020) and the University of Vaasa (University ofVaasa 2021).
2.3.4 Micro level - the end users
The users include the general society: heating, transportation and electricity solutions selected byprivate individuals, businesses, municipalities and public organizations. Transportation users includeprivate cars, the municipalities and businesses operating in the shipping and freight businesses,recycling, as well as farms. (EBA et al. 2020; BUOOR project Interviews 2021).
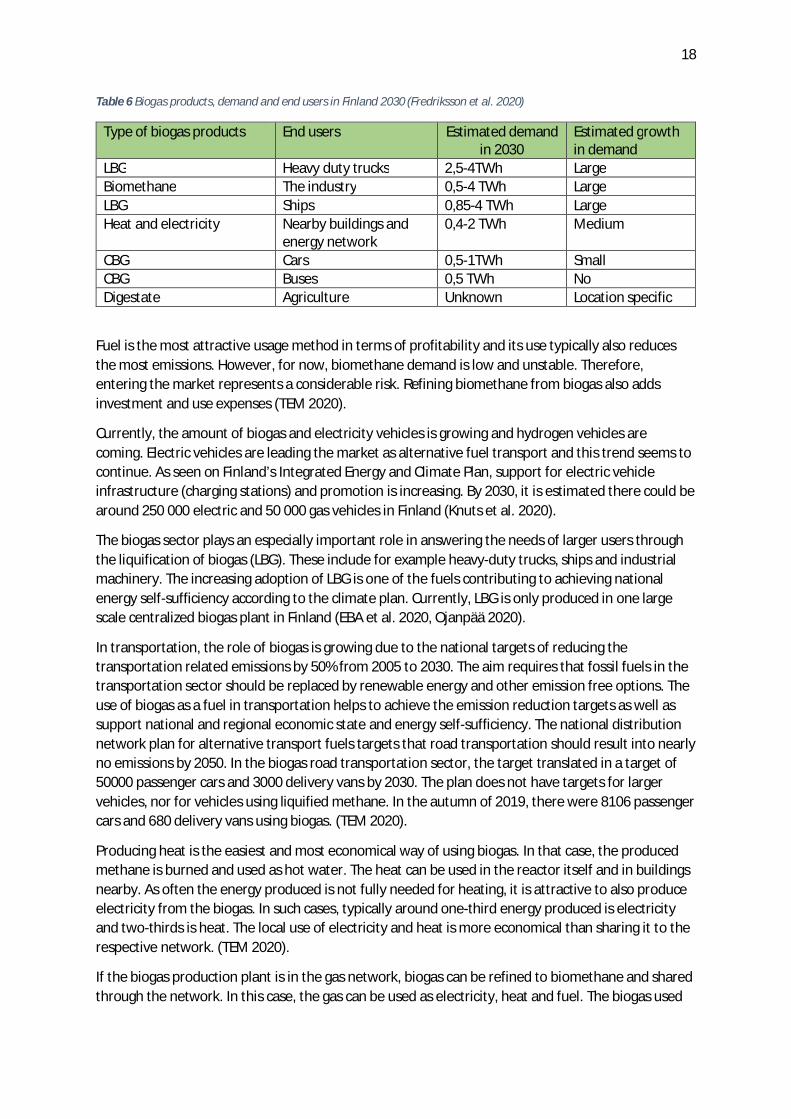
Profitability in the industry is largely influenced by the ways biogas is utilized (TEM 2020). Theproducts resulting from the biogas processing are multiple: heat, electricity, fuel and digestate. Fuelcan be in the form of CBG and LBG. Following table 6 shows the main biogas products and their end-users as well as demand in Finland in 2030 (Fredriksson et al. 2020).
18
Table 6 Biogas products, demand and end users in Finland 2030 (Fredriksson et al. 2020)
Type of biogas products End users Estimated demandin 2030
Estimated growthin demand
LBG Heavy duty trucks 2,5-4TWh LargeBiomethane The industry 0,5-4 TWh LargeLBG Ships 0,85-4 TWh LargeHeat and electricity Nearby buildings and
energy network0,4-2 TWh Medium
CBG Cars 0,5-1TWh SmallCBG Buses 0,5 TWh NoDigestate Agriculture Unknown Location specific
Fuel is the most attractive usage method in terms of profitability and its use typically also reducesthe most emissions. However, for now, biomethane demand is low and unstable. Therefore,entering the market represents a considerable risk. Refining biomethane from biogas also addsinvestment and use expenses (TEM 2020).
Currently, the amount of biogas and electricity vehicles is growing and hydrogen vehicles arecoming. Electric vehicles are leading the market as alternative fuel transport and this trend seems tocontinue. As seen on Finland’s Integrated Energy and Climate Plan, support for electric vehicleinfrastructure (charging stations) and promotion is increasing. By 2030, it is estimated there could bearound 250 000 electric and 50 000 gas vehicles in Finland (Knuts et al. 2020).
The biogas sector plays an especially important role in answering the needs of larger users throughthe liquification of biogas (LBG). These include for example heavy-duty trucks, ships and industrialmachinery. The increasing adoption of LBG is one of the fuels contributing to achieving nationalenergy self-sufficiency according to the climate plan. Currently, LBG is only produced in one largescale centralized biogas plant in Finland (EBA et al. 2020, Ojanpää 2020).
In transportation, the role of biogas is growing due to the national targets of reducing thetransportation related emissions by 50% from 2005 to 2030. The aim requires that fossil fuels in thetransportation sector should be replaced by renewable energy and other emission free options. Theuse of biogas as a fuel in transportation helps to achieve the emission reduction targets as well assupport national and regional economic state and energy self-sufficiency. The national distributionnetwork plan for alternative transport fuels targets that road transportation should result into nearlyno emissions by 2050. In the biogas road transportation sector, the target translated in a target of50000 passenger cars and 3000 delivery vans by 2030. The plan does not have targets for largervehicles, nor for vehicles using liquified methane. In the autumn of 2019, there were 8106 passengercars and 680 delivery vans using biogas. (TEM 2020).
Producing heat is the easiest and most economical way of using biogas. In that case, the producedmethane is burned and used as hot water. The heat can be used in the reactor itself and in buildingsnearby. As often the energy produced is not fully needed for heating, it is attractive to also produceelectricity from the biogas. In such cases, typically around one-third energy produced is electricityand two-thirds is heat. The local use of electricity and heat is more economical than sharing it to therespective network. (TEM 2020).
If the biogas production plant is in the gas network, biogas can be refined to biomethane and sharedthrough the network. In this case, the gas can be used as electricity, heat and fuel. The biogas used
19
for vehicles can be prepared at the plant itself and distributed to gas stations. Biogas can also beliquified making its volume shrink. Transportation in that form is more economical and it can be usedfor heavy-duty trucks. (TEM 2020).
Digestate includes phosphorus and nitrogen that can be used as fertilizers reducing nutrient loss andimproving the nutrient cycle. The use of digestate is a part of a larger national nutrient recyclingprogram. (TEM 2020). According to the BUOOR project interviewees, local use of processeddigestate reduces the negative impact of transportation the most. An interviewee stated one way todo this is to use biogas fuel trucks that transport both feedstock from and digestate to the farms.
3. The biogas sector in Ostrobothnia
The capital of Ostrobothnia, Vaasa is the home of EnergyVaasa, the largest and leading energytechnology hub in the Nordic countries. Consequently, it is a world leader in multiple technologicalareas including smart electrical solutions, sustainable energy, flexible power generation anddigitalisation. 80% of the products and services of the hub companies are exported. The area isconsidered the most innovative area in Finland where educational institutions, companies andmunicipalities work together in developing research, products, innovation and education. (Vaasa2021)
In the biogas sector, it has led to different players working together. The municipal playerStormossen entered the market in 1990 and has collaborated with multiple actors over the years.The industrial player Jeppo Biogas has successfully cooperated with the food industry. Themunicipality has contributed to the development of the biogas infrastructure through its energychoices. The further development of the region is possible due to the availability of feedstock,knowledge and development potential. (Knuts et al. 2020)
Ostrobothnia has over 30 years of experience in the production of biogas. The area could foster itsdevelopment by building a common plan regarding biogas production and distribution. Based on thenumber of cars in 2019 there will be 10 000 fully electric cars and 2 000 gas cars already in 2030. Thiswould require 100 charging stations and 20 gas filling stations which are estimated to be a total of9,6 million euros investments. As the volumes and costs are rising, the area could benefit from ashared gas network. Making the decision to use biogas in transportation is a valuable way to besustainable and competitive in the market. (Knuts et al. 2020)
It is recommended to build a common plan regarding biogas production and distribution which willinvestigate the gas network of Ostrobothnia as well as its conditions and possibilities. This shouldinclude actors, costs, infrastructure, volume, routing, capacity and environmental influences. Also, itcould be beneficial to perform a cost estimate of an LBG production plant focusing on technical andeconomic aspects. LBG could serve as a local alternative to LNG. Finally, important areas to considerwhen building an industrial biogas plant include environmental and investment issues, continuousfeedstock availability, short distances, the use of biogas (primarily as fuel) as well as the use ofdigestate as fertilizer. (Knuts et al. 2020)
An area that has potential for improvement is the use of digestate as fertilizer through processing.There is already some knowledge around this topic and there is potential to develop it (Knuts et al.2020). In Finland, the company Soil Food provides digestate processing and sales services to ownersof biogas plants (Soil Food 2021). Table 7 summarizes the actors and their roles in Ostrobothnia.
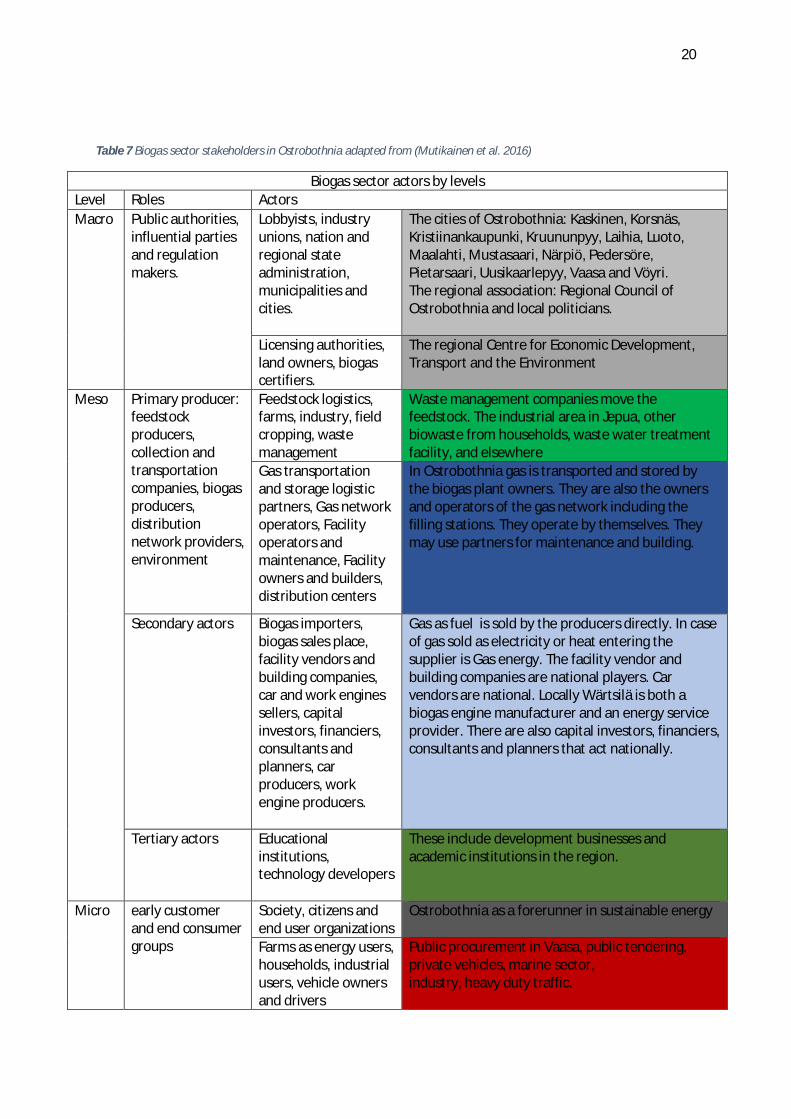
20
Table 7 Biogas sector stakeholders in Ostrobothnia adapted from (Mutikainen et al. 2016)
Biogas sector actors by levelsLevel Roles ActorsMacro Public authorities,
influential partiesand regulationmakers.
Lobbyists, industryunions, nation andregional stateadministration,municipalities andcities.
The cities of Ostrobothnia: Kaskinen, Korsnäs,Kristiinankaupunki, Kruununpyy, Laihia, Luoto,Maalahti, Mustasaari, Närpiö, Pedersöre,Pietarsaari, Uusikaarlepyy, Vaasa and Vöyri.The regional association: Regional Council ofOstrobothnia and local politicians.
Licensing authorities,land owners, biogascertifiers.
The regional Centre for Economic Development,Transport and the Environment
Meso Primary producer:feedstockproducers,collection andtransportationcompanies, biogasproducers,distributionnetwork providers,environment
Feedstock logistics,farms, industry, fieldcropping, wastemanagement
Waste management companies move thefeedstock. The industrial area in Jepua, otherbiowaste from households, waste water treatmentfacility, and elsewhere
Gas transportationand storage logisticpartners, Gas networkoperators, Facilityoperators andmaintenance, Facilityowners and builders,distribution centers
In Ostrobothnia gas is transported and stored bythe biogas plant owners. They are also the ownersand operators of the gas network including thefilling stations. They operate by themselves. Theymay use partners for maintenance and building.
Secondary actors Biogas importers,biogas sales place,facility vendors andbuilding companies,car and work enginessellers, capitalinvestors, financiers,consultants andplanners, carproducers, workengine producers.
Gas as fuel is sold by the producers directly. In caseof gas sold as electricity or heat entering thesupplier is Gas energy. The facility vendor andbuilding companies are national players. Carvendors are national. Locally Wärtsilä is both abiogas engine manufacturer and an energy serviceprovider. There are also capital investors, financiers,consultants and planners that act nationally.
Tertiary actors Educationalinstitutions,technology developers
These include development businesses andacademic institutions in the region.
Micro early customerand end consumergroups
Society, citizens andend user organizations
Ostrobothnia as a forerunner in sustainable energy
Farms as energy users,households, industrialusers, vehicle ownersand drivers
Public procurement in Vaasa, public tendering,private vehicles, marine sector,industry, heavy duty traffic.
21
Local macro level actors include the local cities, politicians and associations. Local authorities inOstrobothnia include the municipalities and cities of Ostrobothnia. These are Kaskinen, Kornäs,Kristiinankaupunki, Kruununpyy, Laihia, Luoto, Maalahti, Mustasaari, Närpiö, Pedersöre, Pietarsaari,Uusikaarlepyy, Vaasa and Vöyri. These cities can influence the local biogas sector through theirdecisions regarding transportation choices, heat and electricity types. They can also choose tosupport biogas locally for example by providing storage facilities for liquified biogas. The RegionalCouncil of Ostrobothnia drives the change towards a digitally-minded and greener economic area. Itsfocus areas include biogas and circular economy (Pohjanmaanliitto 2020). The Centre for EconomicDevelopment, Transport and the Environment of Ostrobothnia states the need for an environmentalinfluence assessment based on the documentation given by biogas producers (ELY-keskus 2017).
3.1 Meso level biogas actors in Ostrobothnia
3.1.1 Feedstock providers in Ostrobothnia
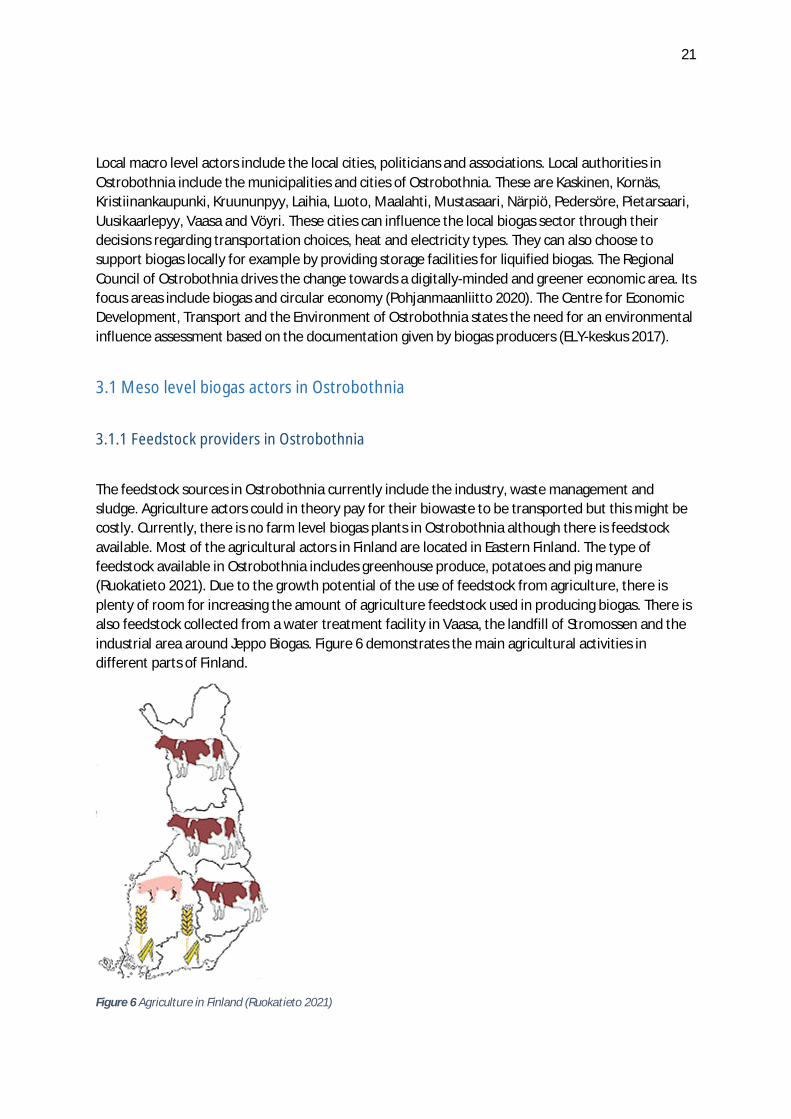
The feedstock sources in Ostrobothnia currently include the industry, waste management andsludge. Agriculture actors could in theory pay for their biowaste to be transported but this might becostly. Currently, there is no farm level biogas plants in Ostrobothnia although there is feedstockavailable. Most of the agricultural actors in Finland are located in Eastern Finland. The type offeedstock available in Ostrobothnia includes greenhouse produce, potatoes and pig manure(Ruokatieto 2021). Due to the growth potential of the use of feedstock from agriculture, there isplenty of room for increasing the amount of agriculture feedstock used in producing biogas. There isalso feedstock collected from a water treatment facility in Vaasa, the landfill of Stromossen and theindustrial area around Jeppo Biogas. Figure 6 demonstrates the main agricultural activities indifferent parts of Finland.
Figure 6 Agriculture in Finland (Ruokatieto 2021)
22
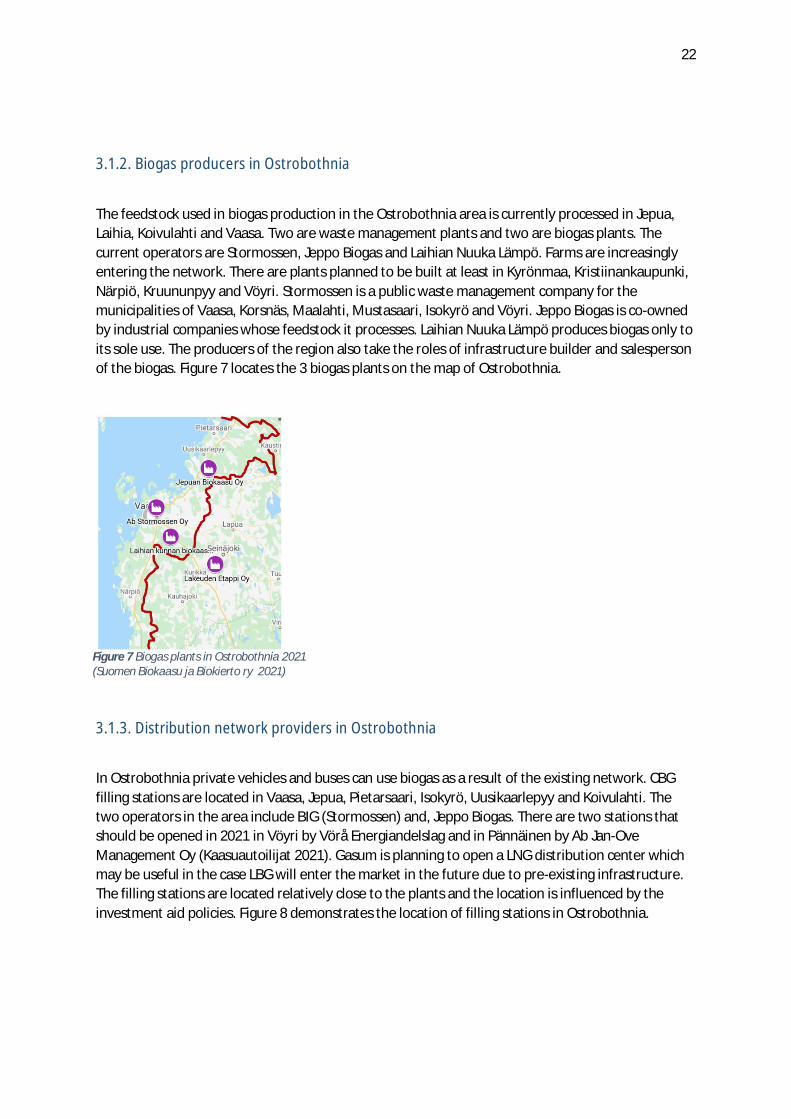
3.1.2. Biogas producers in Ostrobothnia
The feedstock used in biogas production in the Ostrobothnia area is currently processed in Jepua,Laihia, Koivulahti and Vaasa. Two are waste management plants and two are biogas plants. Thecurrent operators are Stormossen, Jeppo Biogas and Laihian Nuuka Lämpö. Farms are increasinglyentering the network. There are plants planned to be built at least in Kyrönmaa, Kristiinankaupunki,Närpiö, Kruununpyy and Vöyri. Stormossen is a public waste management company for themunicipalities of Vaasa, Korsnäs, Maalahti, Mustasaari, Isokyrö and Vöyri. Jeppo Biogas is co-ownedby industrial companies whose feedstock it processes. Laihian Nuuka Lämpö produces biogas only toits sole use. The producers of the region also take the roles of infrastructure builder and salespersonof the biogas. Figure 7 locates the 3 biogas plants on the map of Ostrobothnia.
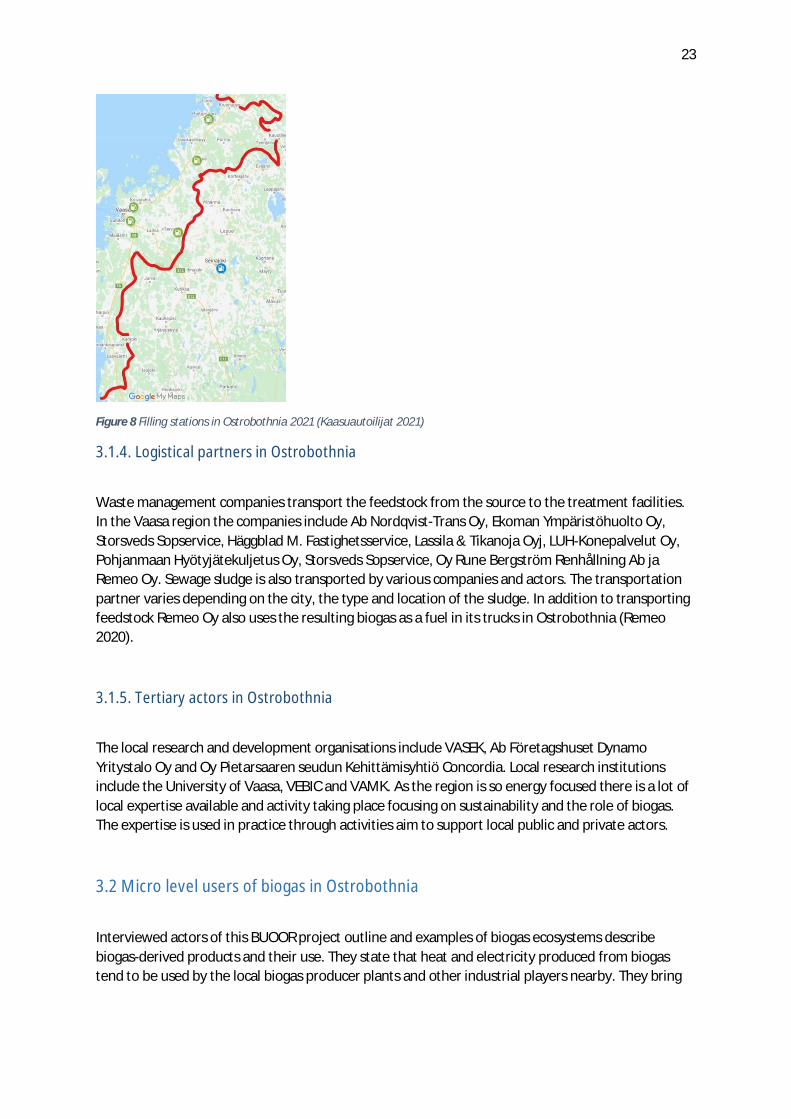
3.1.3. Distribution network providers in Ostrobothnia
In Ostrobothnia private vehicles and buses can use biogas as a result of the existing network. CBGfilling stations are located in Vaasa, Jepua, Pietarsaari, Isokyrö, Uusikaarlepyy and Koivulahti. Thetwo operators in the area include BIG (Stormossen) and, Jeppo Biogas. There are two stations thatshould be opened in 2021 in Vöyri by Vörå Energiandelslag and in Pännäinen by Ab Jan-OveManagement Oy (Kaasuautoilijat 2021). Gasum is planning to open a LNG distribution center whichmay be useful in the case LBG will enter the market in the future due to pre-existing infrastructure.The filling stations are located relatively close to the plants and the location is influenced by theinvestment aid policies. Figure 8 demonstrates the location of filling stations in Ostrobothnia.
Figure 7 Biogas plants in Ostrobothnia 2021(Suomen Biokaasu ja Biokierto ry 2021)
23
Figure 8 Filling stations in Ostrobothnia 2021 (Kaasuautoilijat 2021)
3.1.4. Logistical partners in Ostrobothnia
Waste management companies transport the feedstock from the source to the treatment facilities.In the Vaasa region the companies include Ab Nordqvist-Trans Oy, Ekoman Ympäristöhuolto Oy,Storsveds Sopservice, Häggblad M. Fastighetsservice, Lassila & Tikanoja Oyj, LUH-Konepalvelut Oy,Pohjanmaan Hyötyjätekuljetus Oy, Storsveds Sopservice, Oy Rune Bergström Renhållning Ab jaRemeo Oy. Sewage sludge is also transported by various companies and actors. The transportationpartner varies depending on the city, the type and location of the sludge. In addition to transportingfeedstock Remeo Oy also uses the resulting biogas as a fuel in its trucks in Ostrobothnia (Remeo2020).
3.1.5. Tertiary actors in Ostrobothnia
The local research and development organisations include VASEK, Ab Företagshuset DynamoYritystalo Oy and Oy Pietarsaaren seudun Kehittämisyhtiö Concordia. Local research institutionsinclude the University of Vaasa, VEBIC and VAMK. As the region is so energy focused there is a lot oflocal expertise available and activity taking place focusing on sustainability and the role of biogas.The expertise is used in practice through activities aim to support local public and private actors.
3.2 Micro level users of biogas in Ostrobothnia
Interviewed actors of this BUOOR project outline and examples of biogas ecosystems describebiogas-derived products and their use. They state that heat and electricity produced from biogastend to be used by the local biogas producer plants and other industrial players nearby. They bring
24
also mention that CBG is used in transportation by small vehicles and LBG has potential as a fuel ofthe future.
According to some interviewees of this project, the most attractive characteristic of the CBG is itsprice. The biogas fuel price is considerably lower than traditional fuel. Remeo has biogas trucks thatmake them competitive in cases of public procurement. Private vehicles also use biogas. Other costsassociated with the use of biogas vehicles do slow down the transition to biogas vehicles. Theseinclude switching costs, the cost of the vehicle and the small number of stations.
In Vaasa, public procurement has had a positive role in the development of the local biogas sector.One BUOOR project interviewee elaborated that the choice of the city of Vaasa to use biogas buseshas provided a reason to build a distribution network to make fuel available. This provides a basis formarket development as there is pre-existing demand and supply (Arfan 2019). The city of Vaasa has12 biogas buses in public transport (Kuntaliitto 2019). They also mentioned they aim to supportrenewable energy through public procurement tendering. Another interviewee exemplified thisthrough the environmental management company Remeo which has biogas trucks that make themcompetitive in cases of public procurement. In the first workshop and during BUOOR interviewsTaxi’s were introduced as potential future users of biogas in the future.
The use of liquified gas can be attractive to various users. In Ostrobothnia BUOOR projectinterviewees mention opportunities in industry users, ships and heavy traffic. Players of the industryand maritime shipping have already agreed to use LNG provided by Gasum (Gasum 2021).Interviewees also consider mixing LNG and LBG more attractive than sole use of LBG as the totalGHG is expected to be lower and the mixture has a more attractive price.
In the first BUOOR project workshop (organized by the university of Vaasa 25 March 2021) two corecustomer actors of the marine sector shipping and freight businesses, Wasaline and Wärtsilä, wereidentified. Wasaline ships travel from Vaasa to Umeå, Sweden moving both passengers and cargo.Wärtsilä provides gas engines to the marine sector. Interviewees also stated road cargo transportcompanies might benefit from biogas in the future through the use of LBG (BUOOR Interviews 2021).
The recycling company Westenergy plans to increase its amount of use of biogas in its logistics chain.In general, there are many industrial players which could start using biogas in the area possibly forexample the largest industrial players in the Vaasa region: Wärtsilä, ABB, Alteams Finland Oy,Crimppi Oy, Danfoss, Finnfeeds Oy, Logset Oy, Oy Botnia Marin Ab, Oy KWH MIRKA AB, Oy PrimoFinland Ab, Riitan Herkku Oy, Scott Health & Safety Oy, UPC Konsultointi Oy, VEO Oy. (VASEKyrityshakemisto 2021)
The interviewees of BUOOR project consider biogas a source of competitivity. Some argue that theadoption of LBG at the local level could result in a competitive advantage to the area ofOstrobothnia nationally and abroad. Some also mention that from the perspective of theorganisations the companies could develop their sustainability image and act as examples ofsuccessful business cases at a global level.
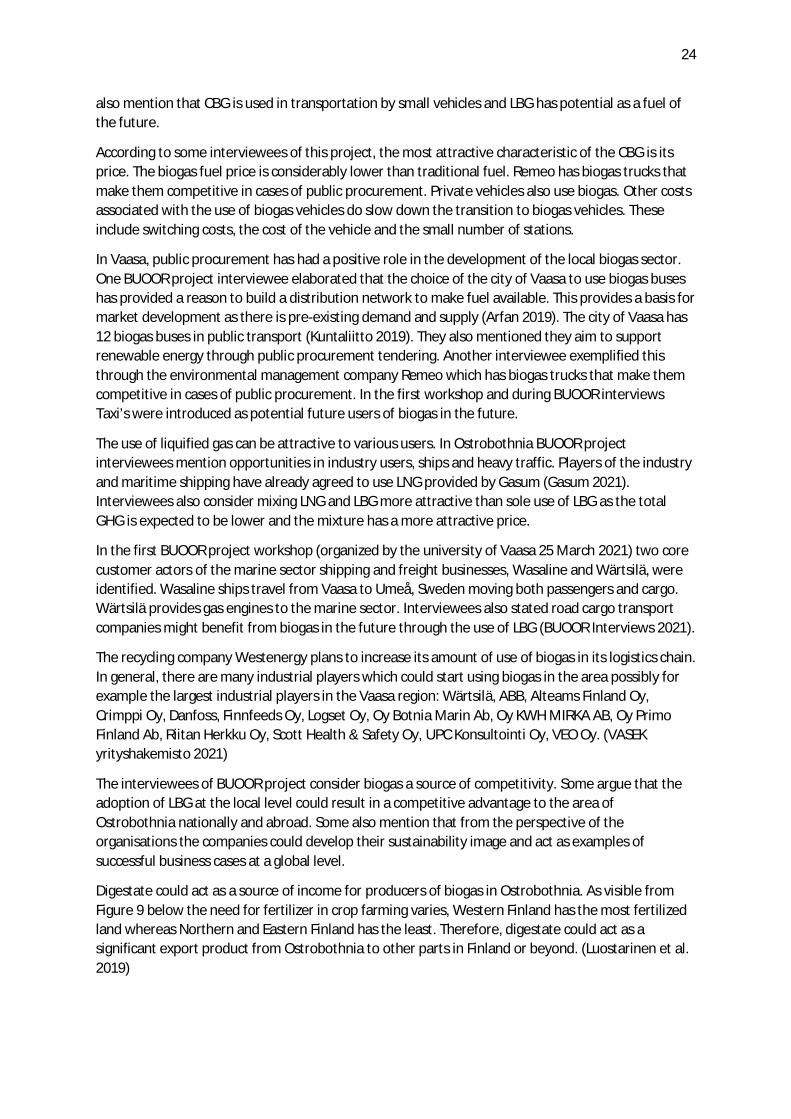
Digestate could act as a source of income for producers of biogas in Ostrobothnia. As visible fromFigure 9 below the need for fertilizer in crop farming varies, Western Finland has the most fertilizedland whereas Northern and Eastern Finland has the least. Therefore, digestate could act as asignificant export product from Ostrobothnia to other parts in Finland or beyond. (Luostarinen et al.2019)
25
Figure 9 Need of fertilizer (Luostarinen et al. 2019).
According to some of the interviewees of the BUOOR project, processing digestate from biogasproduction into fertilizer is an attractive activity in many ways. Many argued that its mainattractiveness is its nutrient circularity effect but also some mentioned its business opportunitiesdue to the high density of nutrients and renewability. For now, it is considered expensive and riskyby respondents as it is a still untouched market lacking supportive policies.
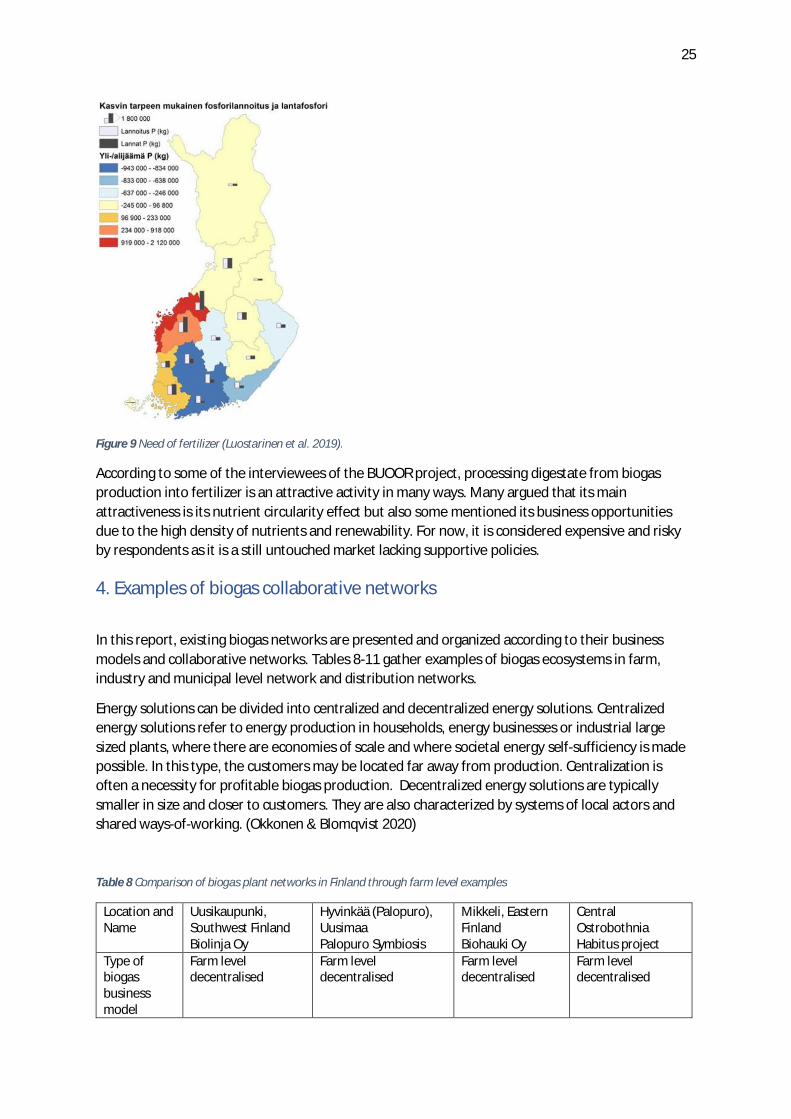
4. Examples of biogas collaborative networks
In this report, existing biogas networks are presented and organized according to their businessmodels and collaborative networks. Tables 8-11 gather examples of biogas ecosystems in farm,industry and municipal level network and distribution networks.
Energy solutions can be divided into centralized and decentralized energy solutions. Centralizedenergy solutions refer to energy production in households, energy businesses or industrial largesized plants, where there are economies of scale and where societal energy self-sufficiency is madepossible. In this type, the customers may be located far away from production. Centralization isoften a necessity for profitable biogas production. Decentralized energy solutions are typicallysmaller in size and closer to customers. They are also characterized by systems of local actors andshared ways-of-working. (Okkonen & Blomqvist 2020)
Table 8 Comparison of biogas plant networks in Finland through farm level examples
Location andName
Uusikaupunki,Southwest FinlandBiolinja Oy
Hyvinkää (Palopuro),UusimaaPalopuro Symbiosis
Mikkeli, EasternFinlandBiohauki Oy
CentralOstrobothniaHabitus project
Type ofbiogasbusinessmodel
Farm leveldecentralised
Farm leveldecentralised
Farm leveldecentralised
Farm leveldecentralised
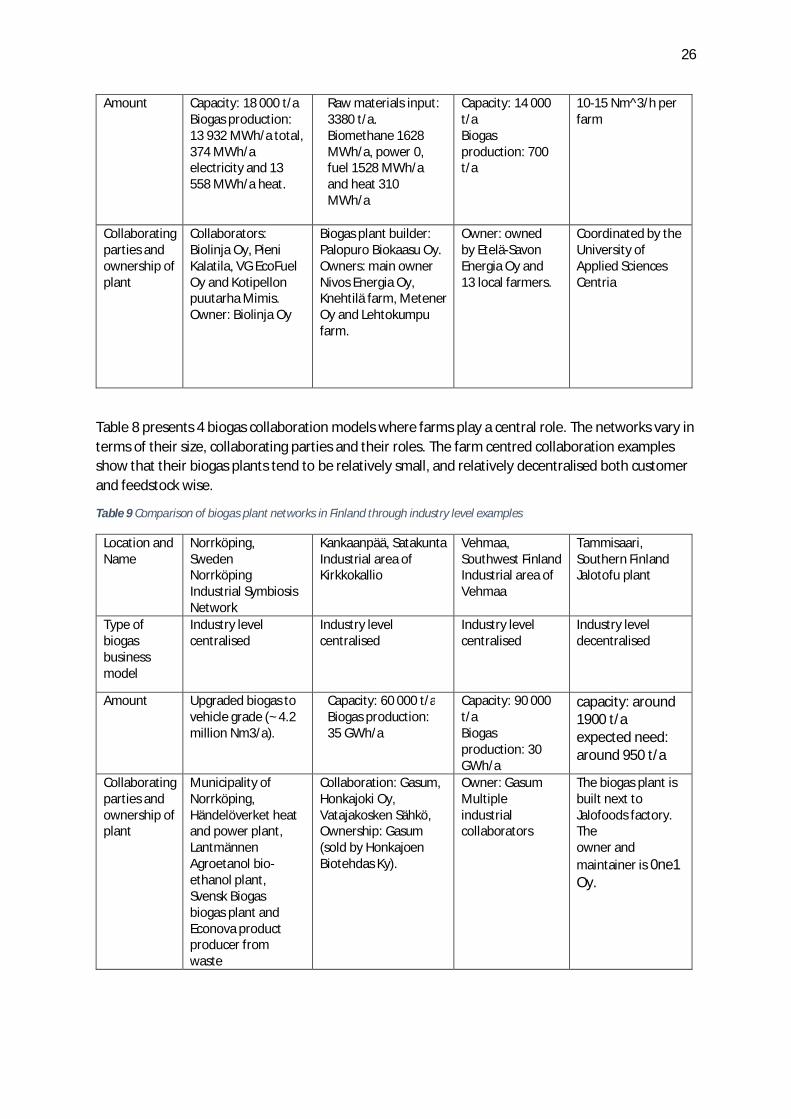
26
Amount Capacity: 18 000 t/aBiogas production:13 932 MWh/a total,374 MWh/aelectricity and 13558 MWh/a heat.
Raw materials input:3380 t/a.Biomethane 1628MWh/a, power 0,fuel 1528 MWh/aand heat 310MWh/a
Capacity: 14 000t/aBiogasproduction: 700t/a
10-15 Nm^3/h perfarm
Collaboratingparties andownership ofplant
Collaborators:Biolinja Oy, PieniKalatila, VG EcoFuelOy and Kotipellonpuutarha Mimis.Owner: Biolinja Oy
Biogas plant builder:Palopuro Biokaasu Oy.Owners: main ownerNivos Energia Oy,Knehtilä farm, MetenerOy and Lehtokumpufarm.
Owner: ownedby Etelä-SavonEnergia Oy and13 local farmers.
Coordinated by theUniversity ofApplied SciencesCentria
Table 8 presents 4 biogas collaboration models where farms play a central role. The networks vary interms of their size, collaborating parties and their roles. The farm centred collaboration examplesshow that their biogas plants tend to be relatively small, and relatively decentralised both customerand feedstock wise.
Table 9 Comparison of biogas plant networks in Finland through industry level examples
Location andName
Norrköping,SwedenNorrköpingIndustrial SymbiosisNetwork
Kankaanpää, SatakuntaIndustrial area ofKirkkokallio
Vehmaa,Southwest FinlandIndustrial area ofVehmaa
Tammisaari,Southern FinlandJalotofu plant
Type ofbiogasbusinessmodel
Industry levelcentralised
Industry levelcentralised
Industry levelcentralised
Industry leveldecentralised
Amount Upgraded biogas tovehicle grade (~ 4.2million Nm3/a).
Capacity: 60 000 t/aBiogas production:35 GWh/a
Capacity: 90 000t/aBiogasproduction: 30GWh/a
capacity: around1900 t/aexpected need:around 950 t/a
Collaboratingparties andownership ofplant
Municipality ofNorrköping,Händelöverket heatand power plant,LantmännenAgroetanol bio-ethanol plant,Svensk Biogasbiogas plant andEconova productproducer fromwaste
Collaboration: Gasum,Honkajoki Oy,Vatajakosken Sähkö,Ownership: Gasum(sold by HonkajoenBiotehdas Ky).
Owner: GasumMultipleindustrialcollaborators
The biogas plant isbuilt next toJalofoods factory.Theowner andmaintainer is 0ne1Oy.
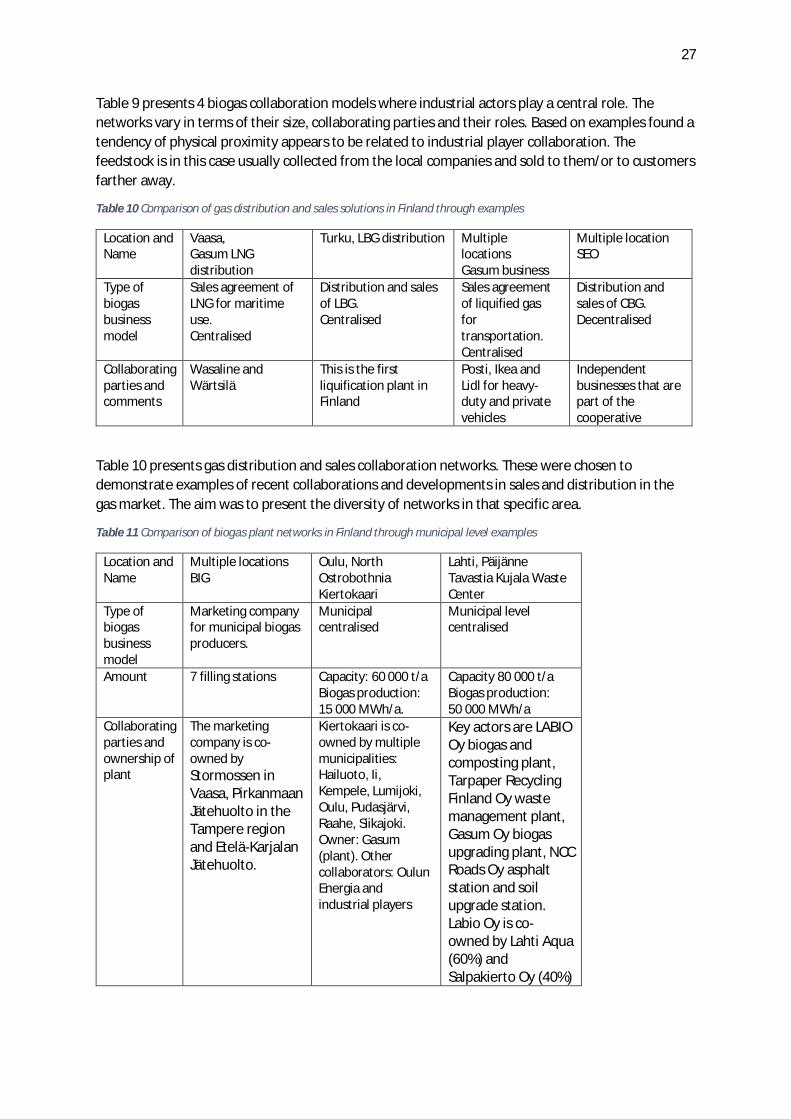
27
Table 9 presents 4 biogas collaboration models where industrial actors play a central role. Thenetworks vary in terms of their size, collaborating parties and their roles. Based on examples found atendency of physical proximity appears to be related to industrial player collaboration. Thefeedstock is in this case usually collected from the local companies and sold to them/or to customersfarther away.
Table 10 Comparison of gas distribution and sales solutions in Finland through examples
Location andName
Vaasa,Gasum LNGdistribution
Turku, LBG distribution MultiplelocationsGasum business
Multiple locationSEO
Type ofbiogasbusinessmodel
Sales agreement ofLNG for maritimeuse.Centralised
Distribution and salesof LBG.Centralised
Sales agreementof liquified gasfortransportation.Centralised
Distribution andsales of CBG.Decentralised
Collaboratingparties andcomments
Wasaline andWärtsilä
This is the firstliquification plant inFinland
Posti, Ikea andLidl for heavy-duty and privatevehicles
Independentbusinesses that arepart of thecooperative
Table 10 presents gas distribution and sales collaboration networks. These were chosen todemonstrate examples of recent collaborations and developments in sales and distribution in thegas market. The aim was to present the diversity of networks in that specific area.
Table 11 Comparison of biogas plant networks in Finland through municipal level examples
Location andName
Multiple locationsBIG
Oulu, NorthOstrobothniaKiertokaari
Lahti, PäijänneTavastia Kujala WasteCenter
Type ofbiogasbusinessmodel
Marketing companyfor municipal biogasproducers.
Municipalcentralised
Municipal levelcentralised
Amount 7 filling stations Capacity: 60 000 t/aBiogas production:15 000 MWh/a.
Capacity 80 000 t/aBiogas production:50 000 MWh/a
Collaboratingparties andownership ofplant
The marketingcompany is co-owned byStormossen inVaasa, PirkanmaanJätehuolto in theTampere regionand Etelä-KarjalanJätehuolto.
Kiertokaari is co-owned by multiplemunicipalities:Hailuoto, Ii,Kempele, Lumijoki,Oulu, Pudasjärvi,Raahe, Siikajoki.Owner: Gasum(plant). Othercollaborators: OulunEnergia andindustrial players
Key actors are LABIOOy biogas andcomposting plant,Tarpaper RecyclingFinland Oy wastemanagement plant,Gasum Oy biogasupgrading plant, NCCRoads Oy asphaltstation and soilupgrade station.Labio Oy is co-owned by Lahti Aqua(60%) andSalpakierto Oy (40%)

28
Table 11 shows some collaboration networks built by municipal actors. The municipal actors receivehousehold waste. Their feedstock providers and end customers do not tend to be close to them.
4.1. Farm centered biogas collaborative models
The farms’ example below are symbiosis where the players depend on each other for the activity tocontinue. They demonstrate the multiple opportunities that arise from collaboration at a farm leveland combination of different types of collected feedstock whilst supporting the local symbiosis.
4.1.1. Case Uusikaupunki, Southwest Finland
The biogas ecosystem example located in Uusikaupunki is the result of the collaboration betweenBiolinja Oy, Pieni Kalatila, VG EcoFuel Oy and Kotipellon puutarha Mimis. Biolinja Oy is a closednutrient cycle that receives feedstock from the industry, households and agriculture in SouthwestFinland. The biogas production at Biolinja Oy results into heat and digestate. The heat is sold to theheat grid and to the greenhouse Kotipellon puutarha Mimis. The digestate product is used asfertilizer in the local fields. The feedstock produced by the fish farm Pieni Kalatila and the localgreenhouse Kotipellon puutarha Mimis is used to produce bio-oil and biogas. The bio-oil plant VGEcoFuel Oy produces biofuel from the biofuel and recycled vegetable oil. The fish farm water isfiltered from nutrients that are used by Kotipellon puutarha Mimis. (Biolinja 2021; Motiva 2021).This closed network provides incentives for participating organisations to develop and communicatewith each other. Figure 10 shows visually the actions taking place between players.
Figure 10 Farm level centralised biogas plant in Uusikaupunki, Southwest Finland (Biolinja 2021)
4.1.2. Case Palopuro, Southern Finland Symbiosis
The biogas ecosystem example located in Hyvinkää is the result of the collaboration betweenKnehtilä farm, local henhouse, local biogas plant owned by Nivos Energia Oy, local vegetable farms.
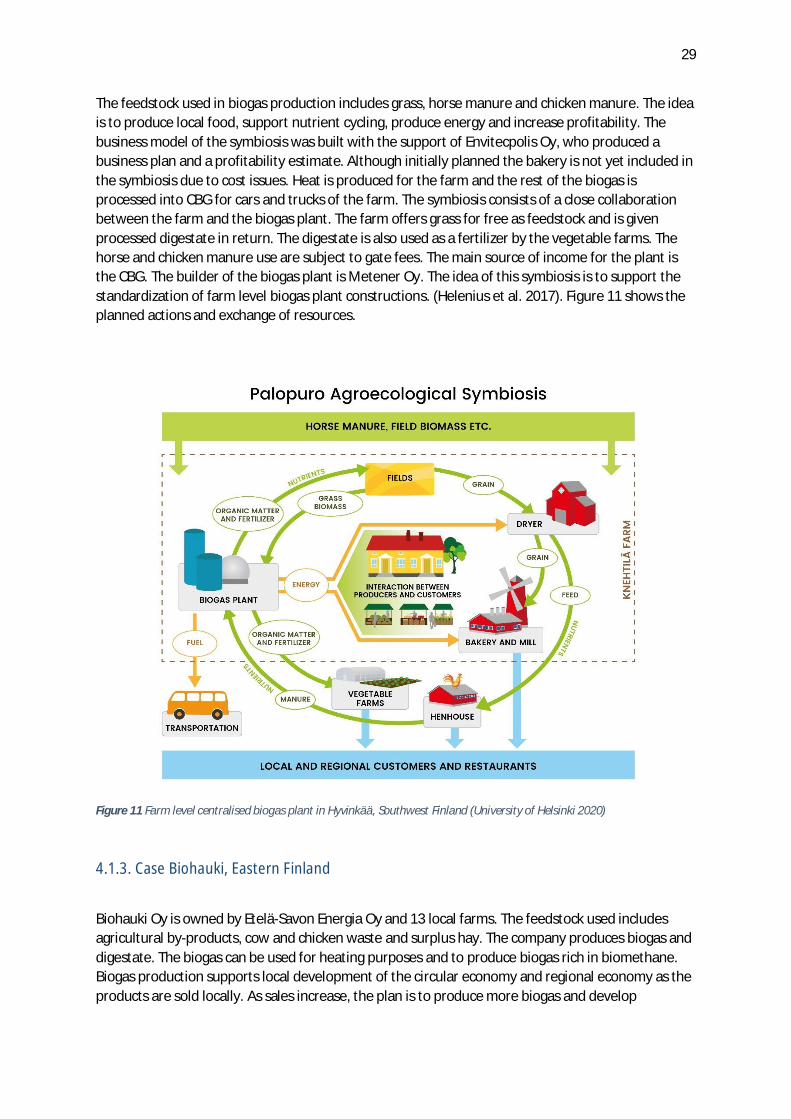
29
The feedstock used in biogas production includes grass, horse manure and chicken manure. The ideais to produce local food, support nutrient cycling, produce energy and increase profitability. Thebusiness model of the symbiosis was built with the support of Envitecpolis Oy, who produced abusiness plan and a profitability estimate. Although initially planned the bakery is not yet included inthe symbiosis due to cost issues. Heat is produced for the farm and the rest of the biogas isprocessed into CBG for cars and trucks of the farm. The symbiosis consists of a close collaborationbetween the farm and the biogas plant. The farm offers grass for free as feedstock and is givenprocessed digestate in return. The digestate is also used as a fertilizer by the vegetable farms. Thehorse and chicken manure use are subject to gate fees. The main source of income for the plant isthe CBG. The builder of the biogas plant is Metener Oy. The idea of this symbiosis is to support thestandardization of farm level biogas plant constructions. (Helenius et al. 2017). Figure 11 shows theplanned actions and exchange of resources.
Figure 11 Farm level centralised biogas plant in Hyvinkää, Southwest Finland (University of Helsinki 2020)
4.1.3. Case Biohauki, Eastern Finland
Biohauki Oy is owned by Etelä-Savon Energia Oy and 13 local farms. The feedstock used includesagricultural by-products, cow and chicken waste and surplus hay. The company produces biogas anddigestate. The biogas can be used for heating purposes and to produce biogas rich in biomethane.Biogas production supports local development of the circular economy and regional economy as theproducts are sold locally. As sales increase, the plan is to produce more biogas and develop
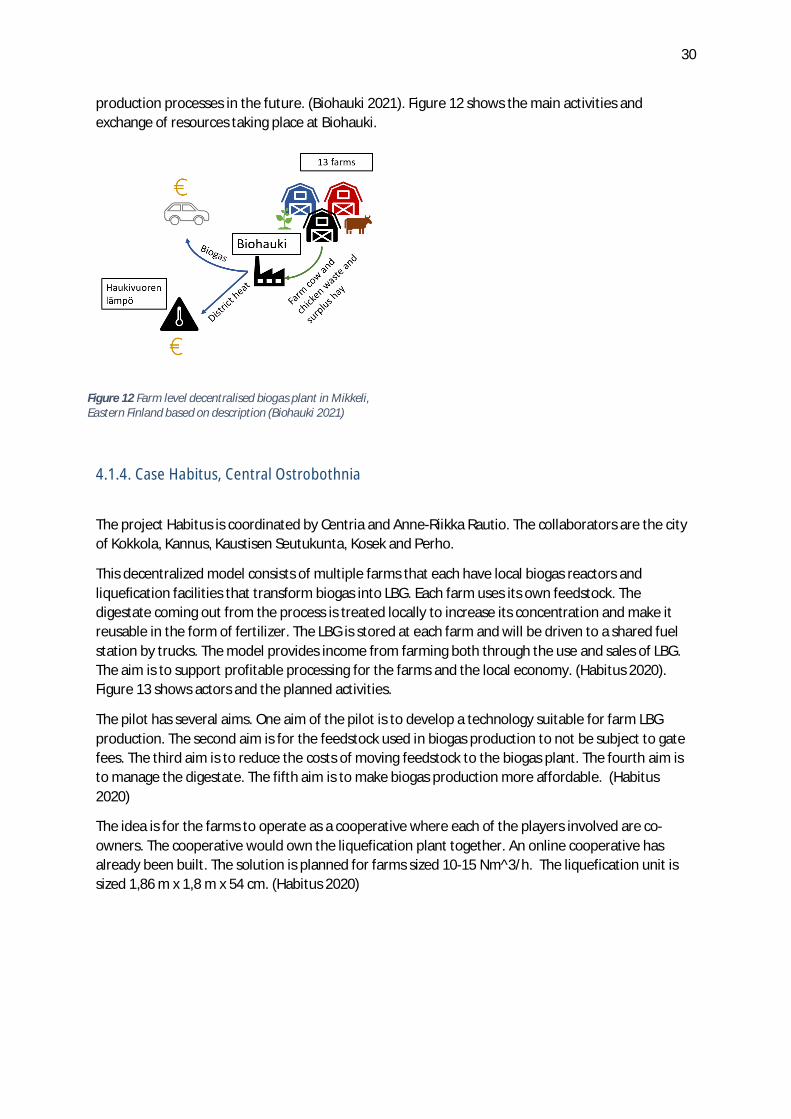
30
production processes in the future. (Biohauki 2021). Figure 12 shows the main activities andexchange of resources taking place at Biohauki.
4.1.4. Case Habitus, Central Ostrobothnia
The project Habitus is coordinated by Centria and Anne-Riikka Rautio. The collaborators are the cityof Kokkola, Kannus, Kaustisen Seutukunta, Kosek and Perho.
This decentralized model consists of multiple farms that each have local biogas reactors andliquefication facilities that transform biogas into LBG. Each farm uses its own feedstock. Thedigestate coming out from the process is treated locally to increase its concentration and make itreusable in the form of fertilizer. The LBG is stored at each farm and will be driven to a shared fuelstation by trucks. The model provides income from farming both through the use and sales of LBG.The aim is to support profitable processing for the farms and the local economy. (Habitus 2020).Figure 13 shows actors and the planned activities.
The pilot has several aims. One aim of the pilot is to develop a technology suitable for farm LBGproduction. The second aim is for the feedstock used in biogas production to not be subject to gatefees. The third aim is to reduce the costs of moving feedstock to the biogas plant. The fourth aim isto manage the digestate. The fifth aim is to make biogas production more affordable. (Habitus2020)
The idea is for the farms to operate as a cooperative where each of the players involved are co-owners. The cooperative would own the liquefication plant together. An online cooperative hasalready been built. The solution is planned for farms sized 10-15 Nm^3/h. The liquefication unit issized 1,86 m x 1,8 m x 54 cm. (Habitus 2020)
Figure 12 Farm level decentralised biogas plant in Mikkeli,Eastern Finland based on description (Biohauki 2021)
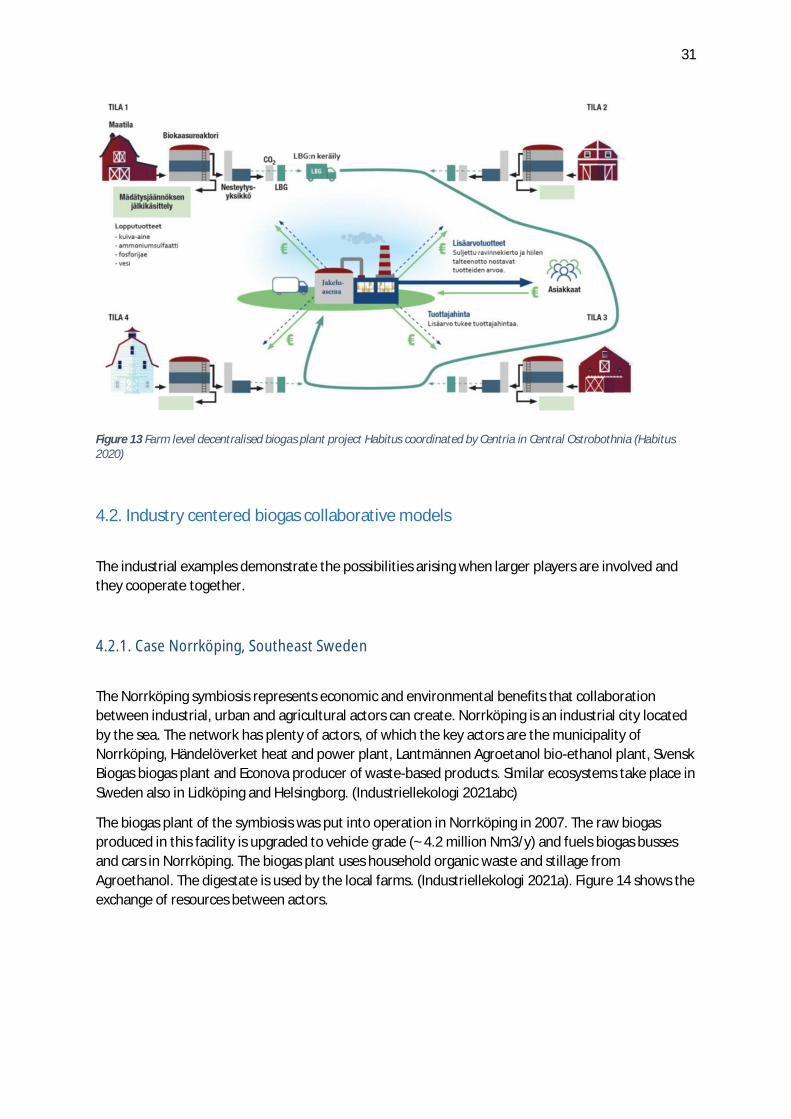
31
Figure 13 Farm level decentralised biogas plant project Habitus coordinated by Centria in Central Ostrobothnia (Habitus2020)
4.2. Industry centered biogas collaborative models
The industrial examples demonstrate the possibilities arising when larger players are involved andthey cooperate together.
4.2.1. Case Norrköping, Southeast Sweden
The Norrköping symbiosis represents economic and environmental benefits that collaborationbetween industrial, urban and agricultural actors can create. Norrköping is an industrial city locatedby the sea. The network has plenty of actors, of which the key actors are the municipality ofNorrköping, Händelöverket heat and power plant, Lantmännen Agroetanol bio-ethanol plant, SvenskBiogas biogas plant and Econova producer of waste-based products. Similar ecosystems take place inSweden also in Lidköping and Helsingborg. (Industriellekologi 2021abc)
The biogas plant of the symbiosis was put into operation in Norrköping in 2007. The raw biogasproduced in this facility is upgraded to vehicle grade (~ 4.2 million Nm3/y) and fuels biogas bussesand cars in Norrköping. The biogas plant uses household organic waste and stillage fromAgroethanol. The digestate is used by the local farms. (Industriellekologi 2021a). Figure 14 shows theexchange of resources between actors.
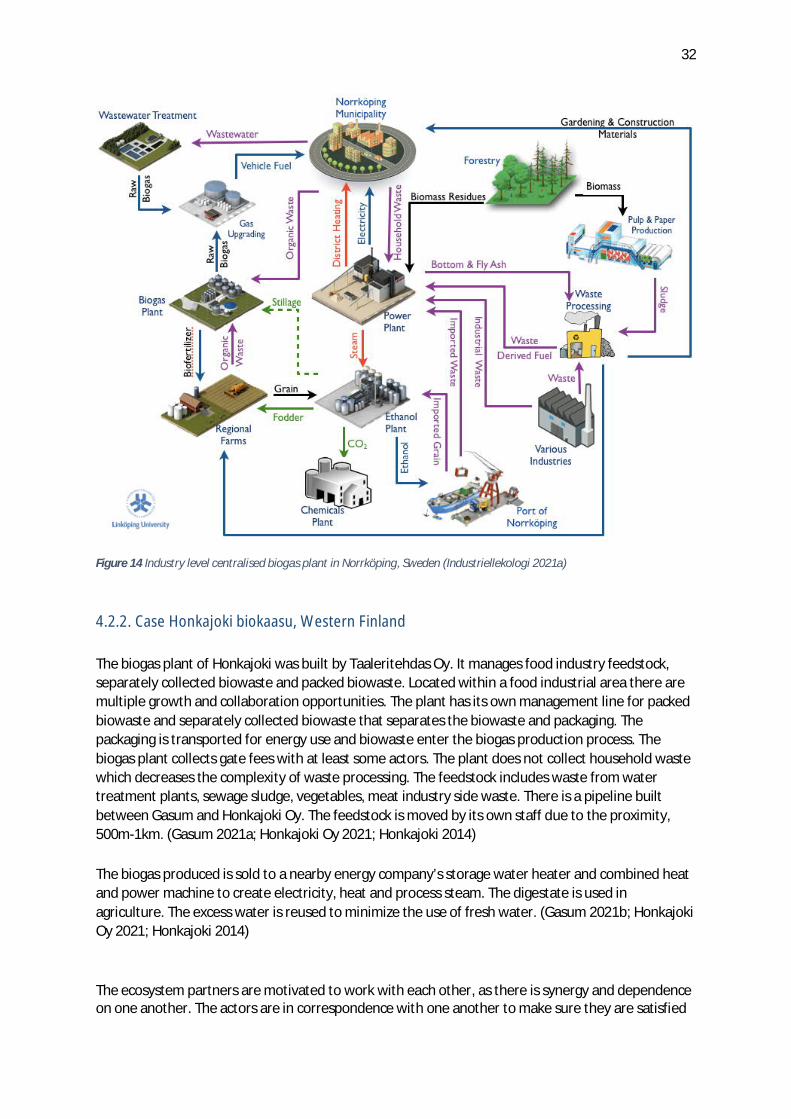
32
Figure 14 Industry level centralised biogas plant in Norrköping, Sweden (Industriellekologi 2021a)
4.2.2. Case Honkajoki biokaasu, Western Finland
The biogas plant of Honkajoki was built by Taaleritehdas Oy. It manages food industry feedstock,separately collected biowaste and packed biowaste. Located within a food industrial area there aremultiple growth and collaboration opportunities. The plant has its own management line for packedbiowaste and separately collected biowaste that separates the biowaste and packaging. Thepackaging is transported for energy use and biowaste enter the biogas production process. Thebiogas plant collects gate fees with at least some actors. The plant does not collect household wastewhich decreases the complexity of waste processing. The feedstock includes waste from watertreatment plants, sewage sludge, vegetables, meat industry side waste. There is a pipeline builtbetween Gasum and Honkajoki Oy. The feedstock is moved by its own staff due to the proximity,500m-1km. (Gasum 2021a; Honkajoki Oy 2021; Honkajoki 2014)
The biogas produced is sold to a nearby energy company’s storage water heater and combined heatand power machine to create electricity, heat and process steam. The digestate is used inagriculture. The excess water is reused to minimize the use of fresh water. (Gasum 2021b; HonkajokiOy 2021; Honkajoki 2014)
The ecosystem partners are motivated to work with each other, as there is synergy and dependenceon one another. The actors are in correspondence with one another to make sure they are satisfied
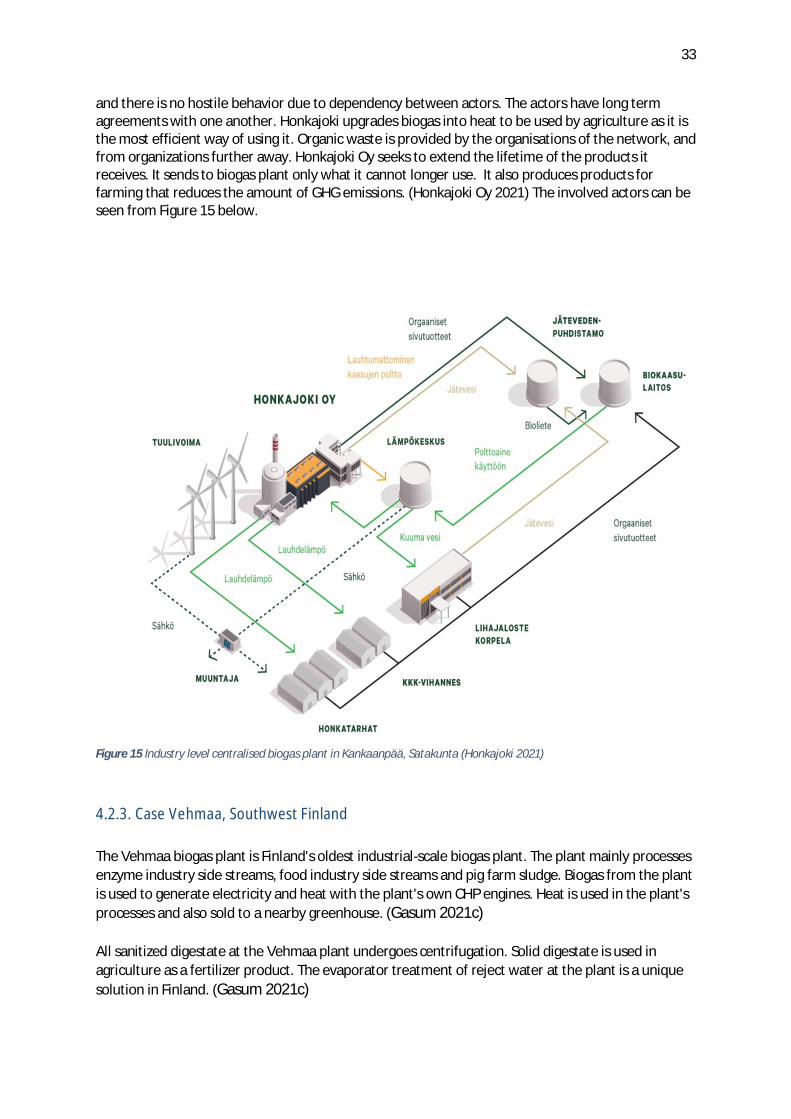
33
and there is no hostile behavior due to dependency between actors. The actors have long termagreements with one another. Honkajoki upgrades biogas into heat to be used by agriculture as it isthe most efficient way of using it. Organic waste is provided by the organisations of the network, andfrom organizations further away. Honkajoki Oy seeks to extend the lifetime of the products itreceives. It sends to biogas plant only what it cannot longer use. It also produces products forfarming that reduces the amount of GHG emissions. (Honkajoki Oy 2021) The involved actors can beseen from Figure 15 below.
Figure 15 Industry level centralised biogas plant in Kankaanpää, Satakunta (Honkajoki 2021)
4.2.3. Case Vehmaa, Southwest Finland
The Vehmaa biogas plant is Finland's oldest industrial-scale biogas plant. The plant mainly processesenzyme industry side streams, food industry side streams and pig farm sludge. Biogas from the plantis used to generate electricity and heat with the plant's own CHP engines. Heat is used in the plant'sprocesses and also sold to a nearby greenhouse. (Gasum 2021c)
All sanitized digestate at the Vehmaa plant undergoes centrifugation. Solid digestate is used inagriculture as a fertilizer product. The evaporator treatment of reject water at the plant is a uniquesolution in Finland. (Gasum 2021c)
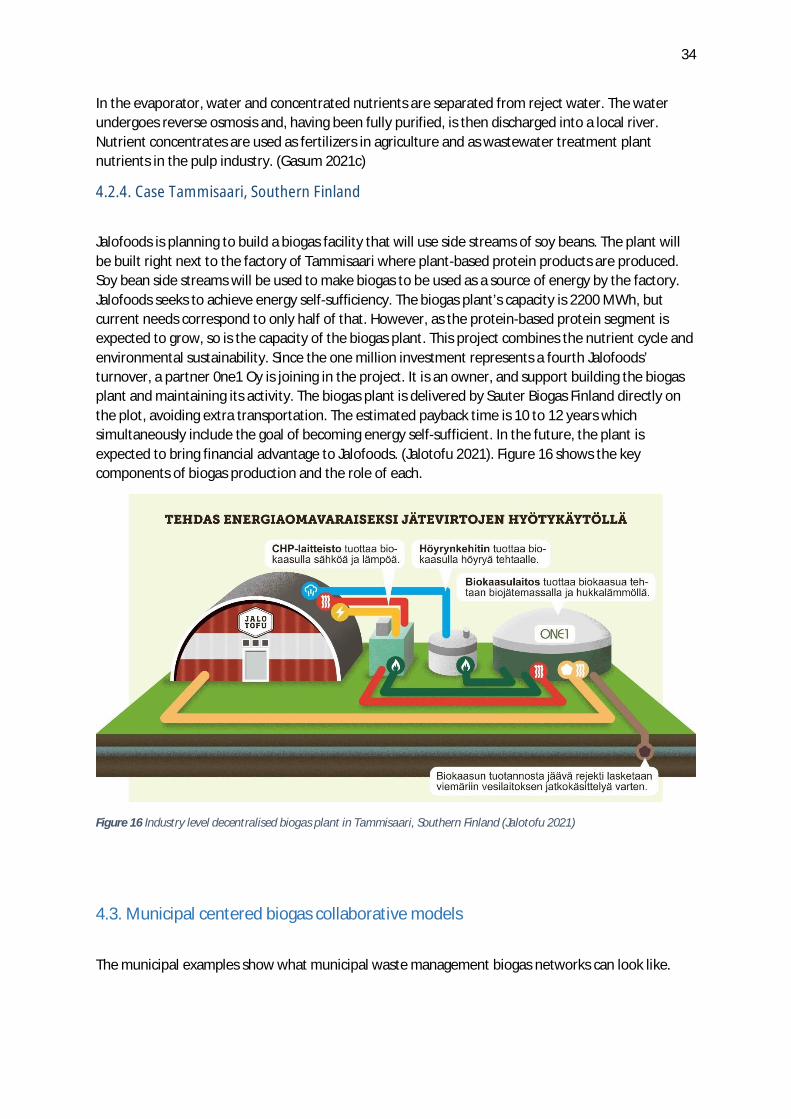
34
In the evaporator, water and concentrated nutrients are separated from reject water. The waterundergoes reverse osmosis and, having been fully purified, is then discharged into a local river.Nutrient concentrates are used as fertilizers in agriculture and as wastewater treatment plantnutrients in the pulp industry. (Gasum 2021c)
4.2.4. Case Tammisaari, Southern Finland
Jalofoods is planning to build a biogas facility that will use side streams of soy beans. The plant willbe built right next to the factory of Tammisaari where plant-based protein products are produced.Soy bean side streams will be used to make biogas to be used as a source of energy by the factory.Jalofoods seeks to achieve energy self-sufficiency. The biogas plant’s capacity is 2200 MWh, butcurrent needs correspond to only half of that. However, as the protein-based protein segment isexpected to grow, so is the capacity of the biogas plant. This project combines the nutrient cycle andenvironmental sustainability. Since the one million investment represents a fourth Jalofoods’turnover, a partner 0ne1 Oy is joining in the project. It is an owner, and support building the biogasplant and maintaining its activity. The biogas plant is delivered by Sauter Biogas Finland directly onthe plot, avoiding extra transportation. The estimated payback time is 10 to 12 years whichsimultaneously include the goal of becoming energy self-sufficient. In the future, the plant isexpected to bring financial advantage to Jalofoods. (Jalotofu 2021). Figure 16 shows the keycomponents of biogas production and the role of each.
Figure 16 Industry level decentralised biogas plant in Tammisaari, Southern Finland (Jalotofu 2021)
4.3. Municipal centered biogas collaborative models
The municipal examples show what municipal waste management biogas networks can look like.
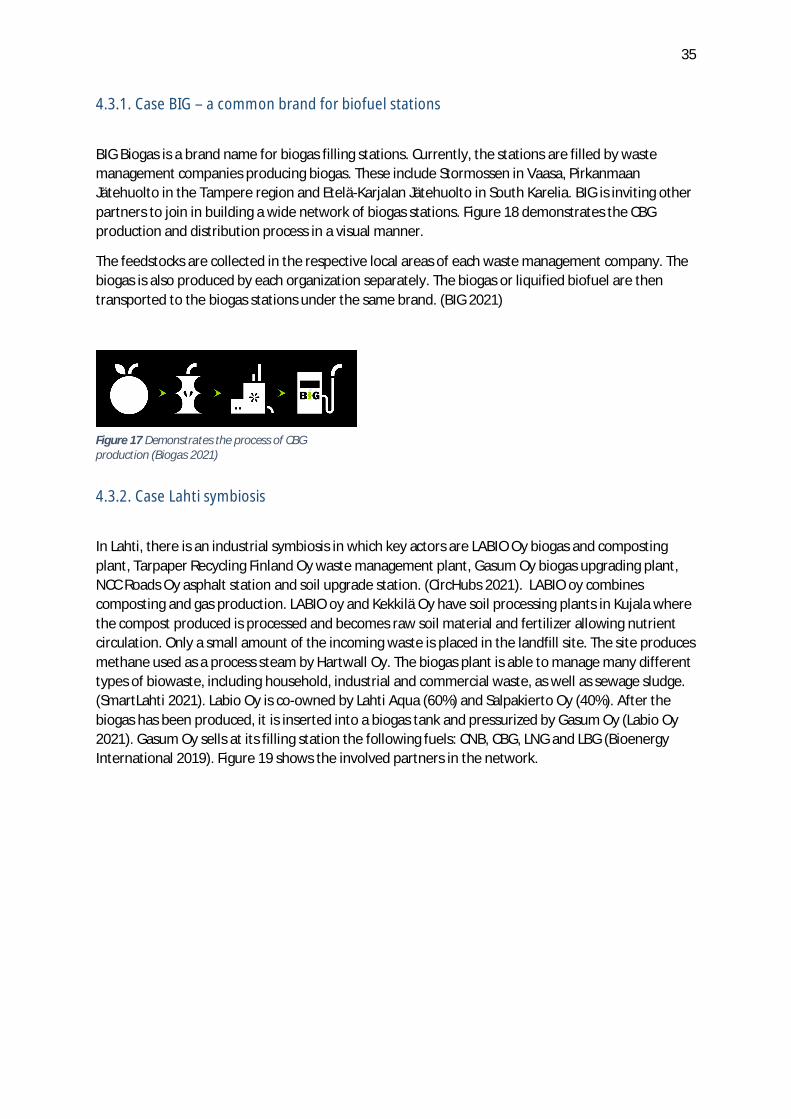
35
4.3.1. Case BIG – a common brand for biofuel stations
BIG Biogas is a brand name for biogas filling stations. Currently, the stations are filled by wastemanagement companies producing biogas. These include Stormossen in Vaasa, PirkanmaanJätehuolto in the Tampere region and Etelä-Karjalan Jätehuolto in South Karelia. BIG is inviting otherpartners to join in building a wide network of biogas stations. Figure 18 demonstrates the CBGproduction and distribution process in a visual manner.
The feedstocks are collected in the respective local areas of each waste management company. Thebiogas is also produced by each organization separately. The biogas or liquified biofuel are thentransported to the biogas stations under the same brand. (BIG 2021)
4.3.2. Case Lahti symbiosis
In Lahti, there is an industrial symbiosis in which key actors are LABIO Oy biogas and compostingplant, Tarpaper Recycling Finland Oy waste management plant, Gasum Oy biogas upgrading plant,NCC Roads Oy asphalt station and soil upgrade station. (CircHubs 2021). LABIO oy combinescomposting and gas production. LABIO oy and Kekkilä Oy have soil processing plants in Kujala wherethe compost produced is processed and becomes raw soil material and fertilizer allowing nutrientcirculation. Only a small amount of the incoming waste is placed in the landfill site. The site producesmethane used as a process steam by Hartwall Oy. The biogas plant is able to manage many differenttypes of biowaste, including household, industrial and commercial waste, as well as sewage sludge.(SmartLahti 2021). Labio Oy is co-owned by Lahti Aqua (60%) and Salpakierto Oy (40%). After thebiogas has been produced, it is inserted into a biogas tank and pressurized by Gasum Oy (Labio Oy2021). Gasum Oy sells at its filling station the following fuels: CNB, CBG, LNG and LBG (BioenergyInternational 2019). Figure 19 shows the involved partners in the network.
Figure 17 Demonstrates the process of CBGproduction (Biogas 2021)
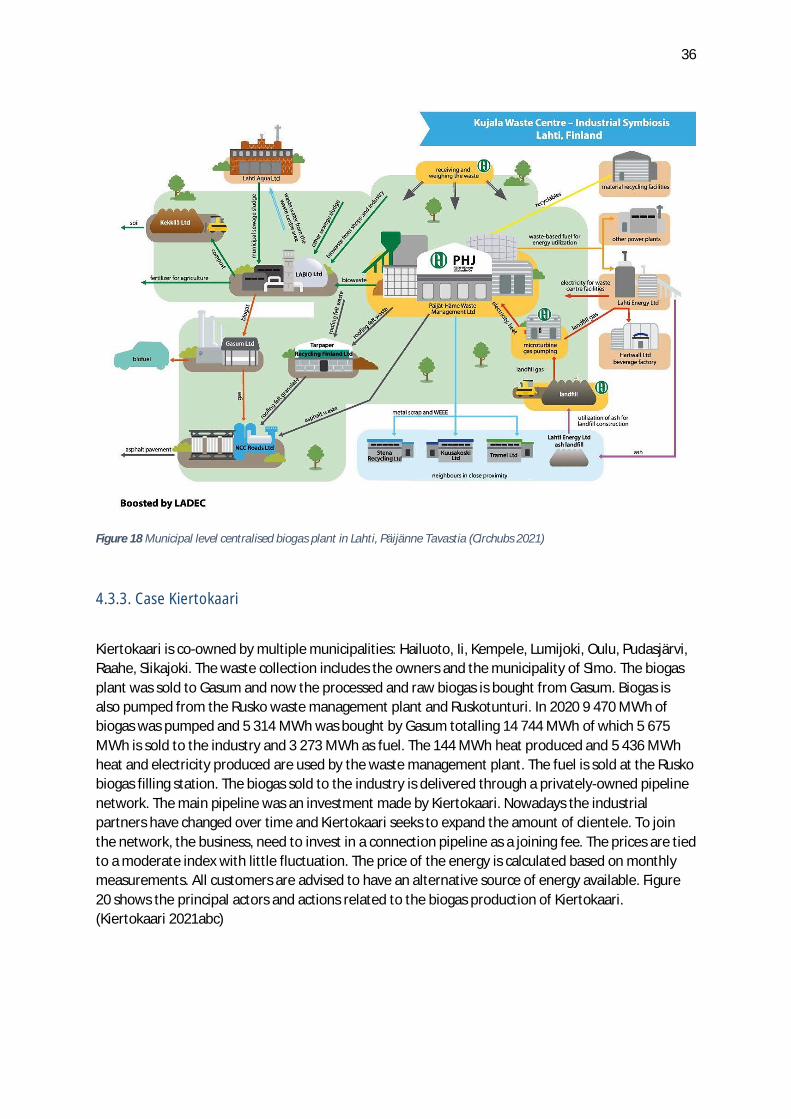
36
Figure 18 Municipal level centralised biogas plant in Lahti, Päijänne Tavastia (Circhubs 2021)
4.3.3. Case Kiertokaari
Kiertokaari is co-owned by multiple municipalities: Hailuoto, Ii, Kempele, Lumijoki, Oulu, Pudasjärvi,Raahe, Siikajoki. The waste collection includes the owners and the municipality of Simo. The biogasplant was sold to Gasum and now the processed and raw biogas is bought from Gasum. Biogas isalso pumped from the Rusko waste management plant and Ruskotunturi. In 2020 9 470 MWh ofbiogas was pumped and 5 314 MWh was bought by Gasum totalling 14 744 MWh of which 5 675MWh is sold to the industry and 3 273 MWh as fuel. The 144 MWh heat produced and 5 436 MWhheat and electricity produced are used by the waste management plant. The fuel is sold at the Ruskobiogas filling station. The biogas sold to the industry is delivered through a privately-owned pipelinenetwork. The main pipeline was an investment made by Kiertokaari. Nowadays the industrialpartners have changed over time and Kiertokaari seeks to expand the amount of clientele. To jointhe network, the business, need to invest in a connection pipeline as a joining fee. The prices are tiedto a moderate index with little fluctuation. The price of the energy is calculated based on monthlymeasurements. All customers are advised to have an alternative source of energy available. Figure20 shows the principal actors and actions related to the biogas production of Kiertokaari.(Kiertokaari 2021abc)
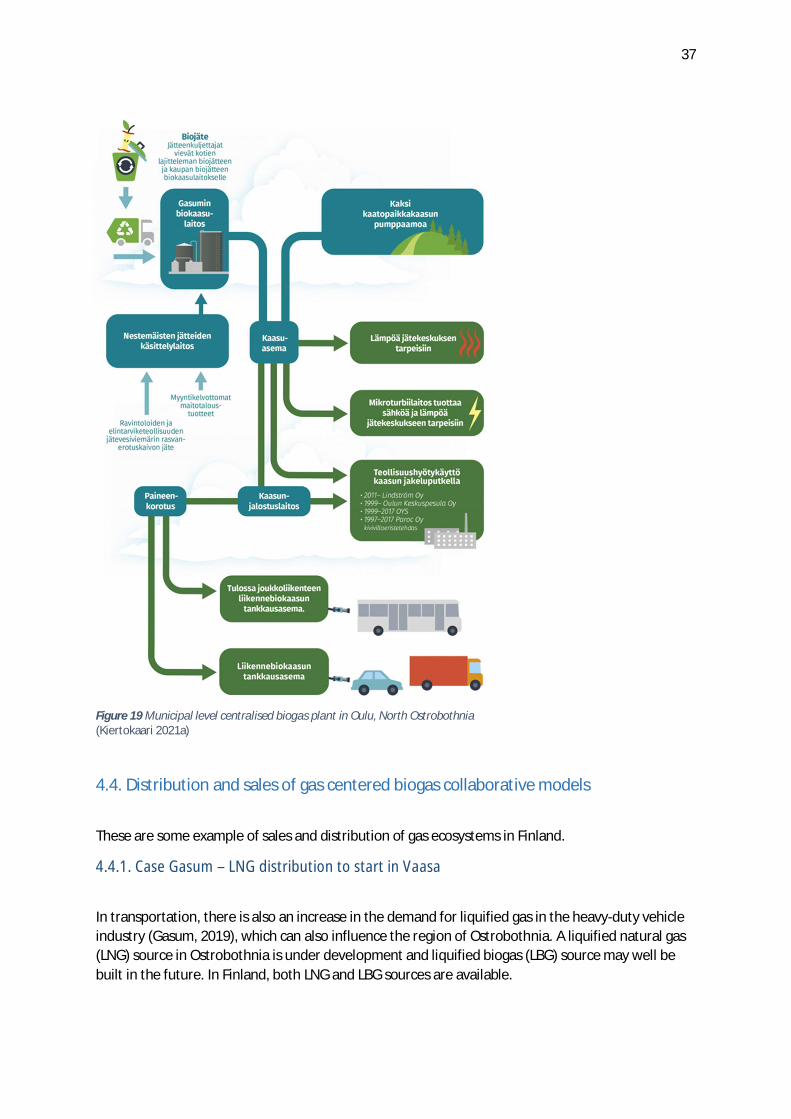
37
4.4. Distribution and sales of gas centered biogas collaborative models
These are some example of sales and distribution of gas ecosystems in Finland.
4.4.1. Case Gasum – LNG distribution to start in Vaasa
In transportation, there is also an increase in the demand for liquified gas in the heavy-duty vehicleindustry (Gasum, 2019), which can also influence the region of Ostrobothnia. A liquified natural gas(LNG) source in Ostrobothnia is under development and liquified biogas (LBG) source may well bebuilt in the future. In Finland, both LNG and LBG sources are available.
Figure 19 Municipal level centralised biogas plant in Oulu, North Ostrobothnia(Kiertokaari 2021a)
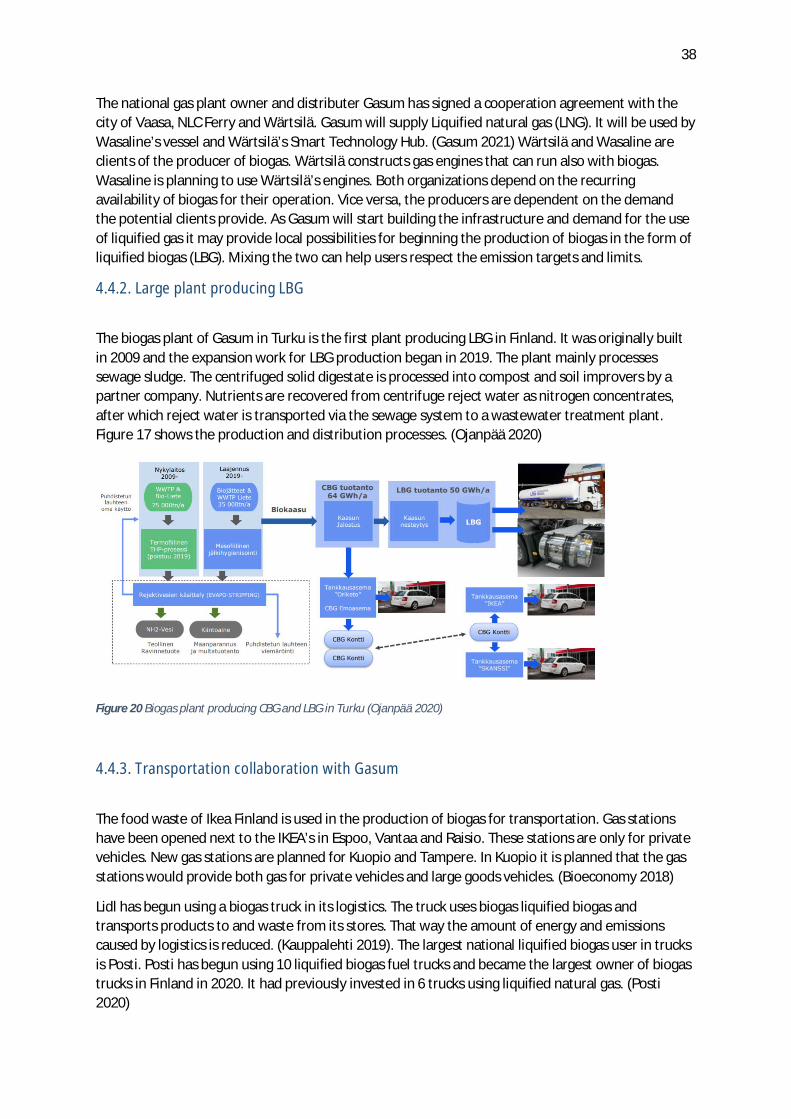
38
The national gas plant owner and distributer Gasum has signed a cooperation agreement with thecity of Vaasa, NLC Ferry and Wärtsilä. Gasum will supply Liquified natural gas (LNG). It will be used byWasaline’s vessel and Wärtsilä’s Smart Technology Hub. (Gasum 2021) Wärtsilä and Wasaline areclients of the producer of biogas. Wärtsilä constructs gas engines that can run also with biogas.Wasaline is planning to use Wärtsilä’s engines. Both organizations depend on the recurringavailability of biogas for their operation. Vice versa, the producers are dependent on the demandthe potential clients provide. As Gasum will start building the infrastructure and demand for the useof liquified gas it may provide local possibilities for beginning the production of biogas in the form ofliquified biogas (LBG). Mixing the two can help users respect the emission targets and limits.
4.4.2. Large plant producing LBG
The biogas plant of Gasum in Turku is the first plant producing LBG in Finland. It was originally builtin 2009 and the expansion work for LBG production began in 2019. The plant mainly processessewage sludge. The centrifuged solid digestate is processed into compost and soil improvers by apartner company. Nutrients are recovered from centrifuge reject water as nitrogen concentrates,after which reject water is transported via the sewage system to a wastewater treatment plant.Figure 17 shows the production and distribution processes. (Ojanpää 2020)
Figure 20 Biogas plant producing CBG and LBG in Turku (Ojanpää 2020)
4.4.3. Transportation collaboration with Gasum
The food waste of Ikea Finland is used in the production of biogas for transportation. Gas stationshave been opened next to the IKEA’s in Espoo, Vantaa and Raisio. These stations are only for privatevehicles. New gas stations are planned for Kuopio and Tampere. In Kuopio it is planned that the gasstations would provide both gas for private vehicles and large goods vehicles. (Bioeconomy 2018)
Lidl has begun using a biogas truck in its logistics. The truck uses biogas liquified biogas andtransports products to and waste from its stores. That way the amount of energy and emissionscaused by logistics is reduced. (Kauppalehti 2019). The largest national liquified biogas user in trucksis Posti. Posti has begun using 10 liquified biogas fuel trucks and became the largest owner of biogastrucks in Finland in 2020. It had previously invested in 6 trucks using liquified natural gas. (Posti2020)

39
4.4.4. SEO – The Finnish Energy Cooperative
SEO, the Finnish Energy Cooperative allows customers to support Finnish entrepreneurship andemployment. The cooperative has over 200 filling stations across Finland of which 2 are currentlybiogas filling stations. It is estimated the amount will increase as society will take more stepstowards carbon neutrality. (SEO 2021ab)
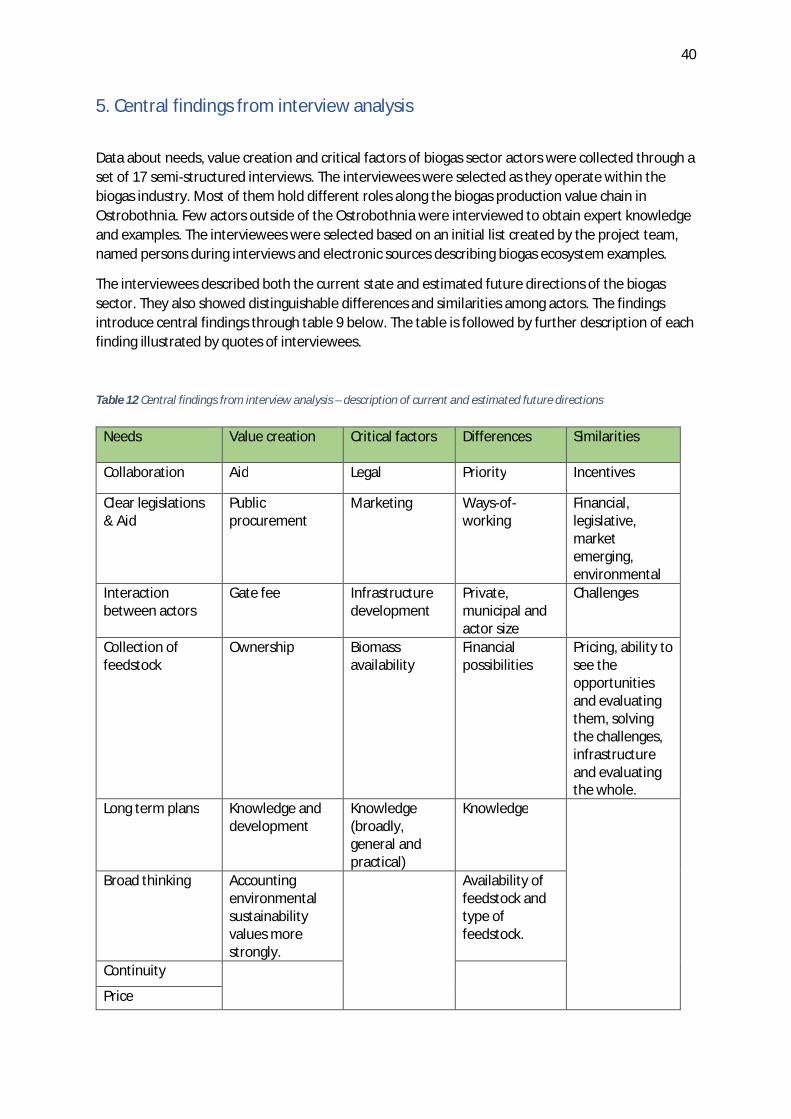
40
5. Central findings from interview analysis
Data about needs, value creation and critical factors of biogas sector actors were collected through aset of 17 semi-structured interviews. The interviewees were selected as they operate within thebiogas industry. Most of them hold different roles along the biogas production value chain inOstrobothnia. Few actors outside of the Ostrobothnia were interviewed to obtain expert knowledgeand examples. The interviewees were selected based on an initial list created by the project team,named persons during interviews and electronic sources describing biogas ecosystem examples.
The interviewees described both the current state and estimated future directions of the biogassector. They also showed distinguishable differences and similarities among actors. The findingsintroduce central findings through table 9 below. The table is followed by further description of eachfinding illustrated by quotes of interviewees.
Table 12 Central findings from interview analysis – description of current and estimated future directions
Needs Value creation Critical factors Differences Similarities
Collaboration Aid Legal Priority Incentives
Clear legislations& Aid
Publicprocurement
Marketing Ways-of-working
Financial,legislative,marketemerging,environmental
Interactionbetween actors
Gate fee Infrastructuredevelopment
Private,municipal andactor size
Challenges
Collection offeedstock
Ownership Biomassavailability
Financialpossibilities
Pricing, ability tosee theopportunitiesand evaluatingthem, solvingthe challenges,infrastructureand evaluatingthe whole.
Long term plans Knowledge anddevelopment
Knowledge(broadly,general andpractical)
Knowledge
Broad thinking Accountingenvironmentalsustainabilityvalues morestrongly.
Availability offeedstock andtype offeedstock.
Continuity
Price
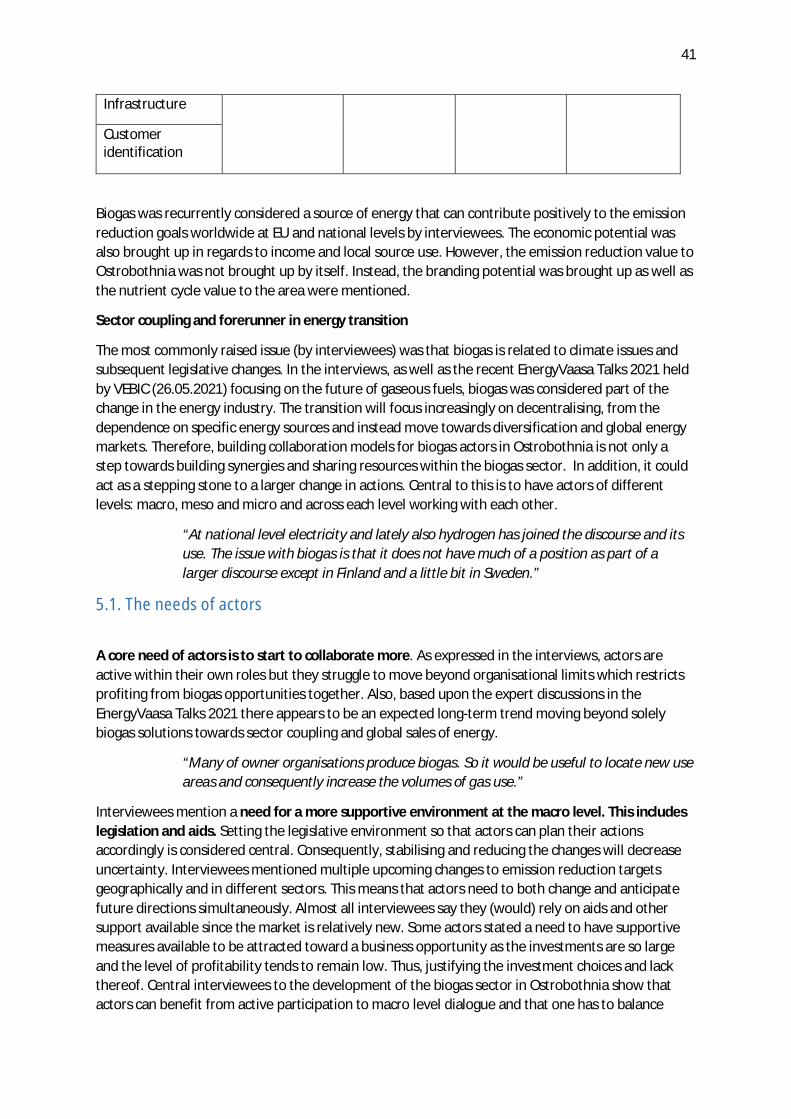
41
Biogas was recurrently considered a source of energy that can contribute positively to the emissionreduction goals worldwide at EU and national levels by interviewees. The economic potential wasalso brought up in regards to income and local source use. However, the emission reduction value toOstrobothnia was not brought up by itself. Instead, the branding potential was brought up as well asthe nutrient cycle value to the area were mentioned.
Sector coupling and forerunner in energy transition
The most commonly raised issue (by interviewees) was that biogas is related to climate issues andsubsequent legislative changes. In the interviews, as well as the recent EnergyVaasa Talks 2021 heldby VEBIC (26.05.2021) focusing on the future of gaseous fuels, biogas was considered part of thechange in the energy industry. The transition will focus increasingly on decentralising, from thedependence on specific energy sources and instead move towards diversification and global energymarkets. Therefore, building collaboration models for biogas actors in Ostrobothnia is not only astep towards building synergies and sharing resources within the biogas sector. In addition, it couldact as a stepping stone to a larger change in actions. Central to this is to have actors of differentlevels: macro, meso and micro and across each level working with each other.
“At national level electricity and lately also hydrogen has joined the discourse and itsuse. The issue with biogas is that it does not have much of a position as part of alarger discourse except in Finland and a little bit in Sweden.”
5.1. The needs of actors
A core need of actors is to start to collaborate more. As expressed in the interviews, actors areactive within their own roles but they struggle to move beyond organisational limits which restrictsprofiting from biogas opportunities together. Also, based upon the expert discussions in theEnergyVaasa Talks 2021 there appears to be an expected long-term trend moving beyond solelybiogas solutions towards sector coupling and global sales of energy.
“Many of owner organisations produce biogas. So it would be useful to locate new useareas and consequently increase the volumes of gas use.”
Interviewees mention a need for a more supportive environment at the macro level. This includeslegislation and aids. Setting the legislative environment so that actors can plan their actionsaccordingly is considered central. Consequently, stabilising and reducing the changes will decreaseuncertainty. Interviewees mentioned multiple upcoming changes to emission reduction targetsgeographically and in different sectors. This means that actors need to both change and anticipatefuture directions simultaneously. Almost all interviewees say they (would) rely on aids and othersupport available since the market is relatively new. Some actors stated a need to have supportivemeasures available to be attracted toward a business opportunity as the investments are so largeand the level of profitability tends to remain low. Thus, justifying the investment choices and lackthereof. Central interviewees to the development of the biogas sector in Ostrobothnia show thatactors can benefit from active participation to macro level dialogue and that one has to balance
Infrastructure
Customeridentification
42
uncertainty and grasping the opportunity to succeed. Meaning, a well thought through risk has to betaken for the sector to advance.
Based on the interviews, at the meso level it seems that organisations are not particularly aware ofeach other’s day-to-day activities and circumstances. Hence, it could be useful for actors to interactwith each other more, to learn, understand each other and consequently be able to find out aboutcollaboration possibilities. Interviewed actors recognise development possibilities to the sector butthey cannot name the specific direction nor steps towards them. As one interviewee brought up: Itcould be useful to define a common long-term plan for the biogas sector (or beyond) inOstrobothnia and then measure its performance.
The biogas specific strengths mentioned by interviewees include its nutrient cycle, economic andsustainable impact which show the shared motivation to develop the sector. Also, interestingbusiness areas that interviewees are eager to explore include digestate processing into fertilizer,biogas liquefication for heavy-duty traffic and vessels and biogas as a source of energy within theindustry. In addition to business areas, according to the discussions, education and improvementregarding own activities are planned. The actors should, however, discuss these together during theplanning and execution phase to account for those when determining the role of the plan and itsinfluence. It could also be useful if actors could then see the sector as a whole, enabling them toaccount it when making decisions.
The planning could also allow discussing multiple other themes including emission reduction,branding of Ostrobothnia, branding of own business and ability to work together, roles of actors andtheir division, the relationship of biogas to other energy sources, best use areas, customer areas andplans to build those, plan to digestate production, the ability to transition and approaches toconsidering future outlook.
”If there is no clear view of the future direction, it can lead to very different types ofinvestments which can make the sector disparate. Or if the future is too unclear wedon’t have the courage to invest.”
More practically, interviewees raised that continuity in the supply of feedstock and biogas isneeded for customers to feel secure about moving to biogas use. For example, in case the biogasproducers should decide to begin liquefication of biogas, the expected customers will be onesrequiring large and stable amounts of availability. Thus, engaging farmers and looking for potentialcollaboration solutions can be valuable. Some interviewees raised that farmers cannot afford to paygate fees which motivates them to build their own biogas plant. Few actors argue that finding anentrepreneur which would push farmers to provide biowaste and start producing it, could be anoption. Another actor estimates that the new waste legislation to households should increase theamount of feedstock arriving to Stormossen consequently increasing production.
“Do you feel secure to invest in this when you have this, who will be the expert in this,who will be the technical director, because you will need to have one of those.”
Based on the interviews it seems there is some struggle in defining what is and should be the roleof biogas now and in the future. Establishing the value of biogas as related to other energy sourcesis important to find where it provides the most value and why and targeting those areas. A valueapproach would be more than its market price and instead also, highlight its strengths, benefitsand role as an energy source. An analysis could help to define customer segments and steps to betaken towards them. Adopting such an approach could help justify the expensive price of biogas as
43
compared to fossil fuels. The benefits of biogas including CO2 emissions and nutrient cycle couldserve as a marketing and awareness increase tool to customers and the larger society.
“What is the most important is to get the nutrients to circulate, such as phosphorus.Gas is really just energy, phosphorus represent the most important part here. And totake carbon back to the ground.“
Many interviewees stated that the gate fees and end price are unattractive, uncompetitive, evenunworthy to consider. Therefore, it could be useful to look at the costs comprehensively to findways to reducing the price. For example, could the purchase of LBG or other biogas products reducegate fees of feedstock provided. Another example discussed by an interviewee would be customersusing a mixture of LNG and LBG which provides benefits of biogas whilst also decreasing the overallprice for customers. Generally, a price reduction could be possible by developing work with actorsand production to reduce costs. Also having an increasing amount of biowaste used to producebiogas could allow price reduction.
There seems to be a strong need for new infrastructure: Including filling stations and pipenetwork, but also attachment to terminals and other related infrastructure. It is argued that thenumber of filling stations should increase, and they should be spread to be near customers. Thecentre of Vaasa is mentioned as an example of a location from which for example taxis and privatecustomers would benefit from a filling station. In the interviews, some described the ideal route of apotential pipe network that could be built to Ostrobothnia. The pipe network could enable sharingcosts between players which could equalise costs and reduce them over time. As it would link theplayers together, it could also facilitate collaboration between them. The sector coupling idea couldalso be considered, for example, the possibility to move also hydrogen in the future or to build thetwo solutions simultaneously. Taking into account sector coupling could also enable taking otheraspects of energy sector collaboration to reduce barriers to potential future collaborations acrossenergy sectors. It could also be useful for actors to identify stakeholders on whom to basedevelopment steps.
”It has been stated that filling stations should be around 15 to 20km away from users.If the distance is larger, people do not buy biogas vehicles nor drive long distances torefuel.”
Interviewees consistently underlined the importance of location and logistics. They added that it isimportant to have feedstock, production and users not too far from each other. A few mentioned ithas been shown that this should not be an issue as there appears to be a considerable amount offeedstock within a reasonable distance from Vaasa (within a 100km radius). Some mentioned thatthere is a division of greenhouse and animal farming between south and north Ostrobothnia whichcan influence both location and logistical issues.
“With one word: price. It may be worth driving more far if it is cheaper there.”
5.2. Value creation of actors
It is argued that for value potential to be addressed aid should be available to those areas. Value issupported by the availability of aid that enables the existence of the sector in many sense.Therefore, aid policies should be aligned to support the specific areas in which improvement is
44
considered beneficial. Some central areas presented include digestate processing and the inclusionof farms.
Public procurement can support the development of the sector comprehensively as we have seen inVaasa through the feedstock, biogas production, distribution, infrastructure and as a user. A centralinterviewee to this success story highlighted that it was a result of a lot of work within the cityorganisation, other organisations, so far as to macro level decision-makers. Many intervieweesrecognised the many facets of value, simultaneously the city has been able to reduce its emissionsand been able to build a sector that supports the local economy.
“At the city it works, and it wouldn’t be working if the city management and councilhad not put work towards it and then an eager and motivated official like myselfwould have pushed the issue forward, it is largely about putting work in.”
Interviewees argue that some areas hold more value potential than others. In regards to feedstock,the greatest amount is available from farms. Logistically closeness of actors within the value chain isvaluable since it reduces costs or sustainably planning logistics both economic and environmental.To producers, value exist in improving their production process. Also, producers can get valuefrom biogas by using it by themselves. For users, the value is built by balancing marketing effects,sustainability, price and compliment with current legislation. Consequently, although the benefitsof biogas may be acknowledgeable it is not the most attractive option.
“In the South of Vaasa, there are feedstock from farms. If these will be utilized in theproduction of biogas then we will obtain above 6 million kilos of biogas.”
The most attractive sector to biogas producers and sellers is transportation, both financially as wellas for the environment. Sold for transportation, the profit margin of biogas is the highest, andenvironmentally it is the most attractive as there are other options available for heating andelectricity. More specifically liquified biogas is described as better than electricity for transportingheavy weight to long distances, proposing opportunities in heavy-duty traffic and marine vessels.
“The heavy-duty traffic cannot be solved with electric options. “
“The liquified biogas growth is likely to be important in the upcoming years. And itthat area there are users in road traffic. So that would mean there could be multiplefilling stations for heavy-duty traffic in the area of Vaasa. There is already one inSeinäjoki. But here at the coast, I presume there is not. And then there is the marinetraffic in the area of Vaasa.”
To distributers increasing the amount of filling stations is attractive as it contributes to the valueavailable for consumers who will then have more filling station options. The distribution networkcan also benefit from building a distribution network together which consist of moving from the useof trucks to a common pipe that would allow movement of gas between actors. The sellers of biogascan create value by branding biogas to customers. Branding takes place through filling stations aswell as customer segments and offering to clients. The interviewees argue for marketing throughfilling stations as many mention the BIG brand launched by Stormossen with partners.
The production of fertilizer from digestate is described as an attractive area of business in terms ofemission reduction and expanding nutrient cycle longevity as well as a business opportunity.However, interviewees also say that since it is a new unexplored market there is a lack of policies,knowledge and profitability. In cases where gas is not used as fuel, it is argued that supply to the
45
industry could be an option. Although the profitability may not be as high, some interviewees statethe demand can be attractively large.
Some actors believe that customers will follow rather than they should be present on the waythroughout the process. This can result in situations where the offering does not match the wants ofcustomers. This includes missing filling stations, unsatisfied customers, commitment and marketingissues. On the other hand, others argue that one large customer should be present from the startto build commitment. As production has started commitment can be enabled through supply andsales agreements.
The use of gate fees hinders the biogas sector which unfortunately remains largely dependent onthis system. To many producers, the gate fees enable their business whilst reducing theattractiveness to provide feedstock to the plant which could help reduce gate fees as a consequenceof increased sales. To biomass holders, feedstock provision is a cost, used when no alternativeoption is available. The cost is paid by the provider or logistic partner. In the case of farmers, startingtheir own production could allow them to avoid gate fees. Therefore, it could be wise to address theneed of feedstock providers to have reduced or no gate fees as well as the dependency on gatefees for biogas production to take place.
”The yearly cost is really large.”
The type of ownership affects how the value created is shared and used. The centrality of thebiogas to the core business of the organisation and the number of owners can influence the agility tomake decisions and the type of decisions made. Some interviewees brought up that multitude ofroles that biogas producers currently hold simultaneously (biogas producer, infrastructure builderand seller) is hindering the development of the sector.
The profitability of biogas businesses varies. Where possible owners affect future value creation bythe decisions they make regarding investments. The amount of knowledge and ability to developinfluence the ability to develop operative and business aspects as well as the ability to be responsiveto market development. Generally, starting to develop the sector requires thorough knowledge andskill set. Understanding and acknowledging environmental issues are important to value formationas transitions are happening in energy use of heat, electricity, fuel and fertilizer. At the same time,they are valuable business wise over the long term.
“They work in two areas so they work as gas distributor, infra builder and gasproducer, gas importer.”
Interviewees also outlined that for marine actors the attractiveness of LBG is diminished by its largeprice as compared to LNG which becomes even larger as the fuel is not taxed in marine. Some statedthe measurement approach from the tank does not allow to measure the relatively minimal totalemissions of biogas as compared to fossil fuels. Simultaneously, the use of LBG can be a way ofmarketing oneself as green, emission reducing, forerunner in responsible travelling not only formarine actors but beyond Vaasa, Ostrobothnia and Finland.
“If you measure the emissions from the vessel. Then, it doesn’t matter if it is biogas ornatural gas. The measured amount is the same. And if that is the only factor thatmatters. Then it makes no sense to use biogas unless it is cheaper or that it can becounted that the emissions released are just returned to nature.”
46
The nutrient cycle aspect of biogas is considered a major strength by interviewees however themarket is perceived the most uncertain since it is a new market. Simultaneously, it is considered avaluable potential product that could replace non-sustainable options and permit circularity.
“We would need some kind of tool to make use of recycled nutrients. And these aidswill be reduced progressively as the market develops.”
When processed the digestate containing valuable products won’t be left on the land of theproducers and instead be used where it holds the most value. The digestate processing of the biogassegment suffers from a lack of aid which makes it unattractive and risky although it is alsoconsidered attractive, as brought up in the first workshop of this project.
5.3. Critical factors to actors
The law sets the scope of action due to consequential limitations and opportunities. Some centrallegislations were brought up by interviewees. For municipal players, the amount of householdbiowaste will increase nationally in Finland which will then increase the potential amount of biogasproduced. Public procurement will be pushed nationally towards electric vehicles but the extent ofthis varies regionally as the goal is only nation-wide. The roadmap for fossil-free transport in Finlandwill influence private drivers and companies which will have to adjust to the new regulations.
Some interviewees argue that the aid and rights processes should be simplified with more equalguidance and granting styles. Receiving decisions can take a considerable amount of time.Knowledge of procedures has to be acquired and assistance sought as needed. Different parties mayprovide differing guidance and may offer different aid in the same conditions.
”A clarification of support schemes.”
Many interviewees considered marketing to be very important so that the understanding ofconsumers and stakeholders could increase. To the interviewees, marketing is a tool to maintaincurrent actors within the network and attract new ones. It is also viewed as a way to compete withother actors. If the development of the biogas sector continues the role of marketing may grow ascompetition increases.
“A shared marketing. To attract more consumers.”
To remain competitive, it could be beneficial to look beyond own role and the biogas sector toconsider the work of organisations within the ecosystem not only now but in the future. Thisenables sustainable development towards long term goals. Interviewees appeared to already do thisto varying extents and to have a motivation to take a step forward together. The relationshipbetween biogas, electrification and hydrogen is discussed by interviewees. The data also show thatthe need to collaborate is acknowledged. This could include building awareness of the diverseviewpoints of others and taking steps to potentially share roles or divide them differently whenjudged suitable. In the context of households, the new waste management regulation would providea good situation to spread information about biogas and raise awareness of its benefits.
The Chicken-egg problem of demand and supply is an issue brought up by interviewees who call foractions to decrease that challenge. Some interviewees argue that the problem has already beaddressed and there is a strong base on which to build the sector through a willingness to take
47
measured risk. The development of the infrastructure is a requirement for the sector’s developmentas customers find the closeness of filling stations important. Simultaneously, the availability offeedstock is crucial to the development of the sector.
Some interviewees argue that increasing the amount of knowledge comprehensively, businesswise, technically and operationally is important and it would be good to have some sort ofeducational material available. Other interviewees not as central to biogas production mention theyare not too familiar with the sector. VAMK is already planning courses related to counting carbonfootprint, carbon neutrality and circular economy which could be interesting to biogas sector actors.The course offering could potentially be extended to discuss biogas related knowledge, renewableenergy source networks, sector coupling etc. As the knowledge already exists spread betweeninterviewees and beyond, it would make sense to collaborate in developing educational materials.For new entrants and for current players to improve their skills in biogas production it could beuseful to have some materials easily available.
“What is the challenge is that to if you become a biogas entrepreneur is thatknowledge in Ostrobothnia is at a very general level.”
5.4. Differences and common characteristics between actors
The interviews show that the extent to which the biogas sector is a priority varies between players.For energy sector players, the area is quite relevant due to change, environmental and legalpressure. To other actors the sector does not appear to be a priority and more important can beother sustainable solutions or the profitability of their business. Currently, the biogas sector is notsupported due to the emission measurement approach from the tank rather than well-to-wheelapproach, or even the lifetime emission approach. There are cheaper solutions that are in line withthe current expectations of emissions reductions. However, the emission reduction goals areexpected to rise over time which will make meeting them even more challenging. Emission reductionis a long-term action and therefore companies who look at their sustainability over the long termcould benefit by adopting the smarter approach rather than switching multiple times as emissionreduction goals grow in ambition. For some actors and use purpose, the use of biogas is a better fitthan others. In the best case, biogas is used where it best fits.
Interviewees also demonstrated differences in conditions between sectors and persons. Somesectors and persons among the interviewed appeared more forerunners and eager to develop andothers are more careful and conservative. The data showed that in many ways the producers ofbiogas in Ostrobothnia are forerunners as well as the region in the energy sector as a whole.However, it also disclosed that to players where biogas is not a core activity the role of biogas is notseen as central and incentives are lacking to motivate them. The main reason that was raised wasthe price and lack of financial support which makes action unworthy. It is also visible that actors towhom biogas is not central appear to have less knowledge of it. Greenhouses, for example, haveplastic that should be separated prior to biogas production, limiting their options since such biomassis not accepted at every plant. More largely farmers may be motivated to build their own plants butthese motivations are limited by time constraints. To end-users, total cost makes considering otheroptions such as electric vehicles more attractive.
“First of all the purchasing price is higher to the equipment and then depending on theweather the user costs can also be larger.”
48
The research showed that private companies and municipal actors approach the sector differently.The private sector has more financial pressure to be business-oriented whereas the municipal side isnot limited by that necessarily as much, which can allow for example more long term planning. Theirincome and costs are different. Private companies appear to focus mostly on their business areaswhereas municipal actors have many other areas of focus. To municipal actors it is a source ofincome, it may be more of a cost reduction method and a tool to impact municipal politics than abusiness opportunity. The type of waste received also varies as municipal players receive feedstockfrom households and industrial waste streams. The industrial players are more attracted to be client-oriented because their action is based on that. In the case of municipal actors the household’sbiowaste is collected as required by the law, paid by the households and the revenues are collectedby the municipality owners.
The actors also raised common characteristics in the interviews. The actors are motivated by thefinancial opportunities, such as cost reduction and possibility for additional income, the legislativefield, the market orientation, answering to customers wishes and expectations and also theircreation. The environment is also important to actors. When considering the goals set by Finland,the EU and globally the goal set will increase in terms of importance in the long term.
“We have been following the markets within the five years timeframe and from timesto times we have accepted budget offer for liquification plants. But we have neverhad the courage to go there, as there was no market yet. It is not very mature rightnow either, but it is likely it will be increasing.”
The actors also share challenges. The price of biogas influences actors’ sales and purchaseagreements and customers interest in biogas. Actors need support in growing awareness ofpossibilities of the biogas sector and to evaluate those. Development organisations and universitiescan help with this. Actors are finding it challenging to build a path towards the solutions bythemselves. The infrastructure is a challenge to all actors and its development means simultaneouslylarge investments and taking risks. Interviewees also demonstrated hardship in evaluating theoverall sector beyond their own lens which collaboration within the sector would support.
“Surveys are always a good base for us when we have to make decisions.”
49
6. Conclusion
There is political and environmental pressure for the renewable energy source market and thebiogas market to grow in the EU, Finland and Ostrobothnia. The sector is expected to grow with anincreasing focus on LBG. Biogas solutions provide many opportunities of which the main onesinclude the use of feedstock from farms and agriculture, usage of gas in transportation andprocessing of digestate. Issues to be considered from a sustainability perspective are the choice ofbiomass (e.g. challenges in using feedstock from forest biomass, high ILUC or municipal waste if itincludes a lot of pollutants), localization of the units to avoid transport and connection costs as wellas the size of the plant. Also controlling the possible methane leakages of plants and vehicles iscrucial and requires a skilled workforce.
Altogether, the future direction of biogas solutions in Ostrobothnia, as well as Finland, is still uncleardue to legislative issues, investment costs and lack of knowledge. Should the biogas industry receivesufficient support the industry can be expected to grow considerably and within different businessareas.
The climate strategy of Ostrobothnia includes the following themes: energy management, living andbuilding, traffic, waste management and manufacturing (Pohjanmaan liitto 2015). According to thevision of Ostrobothnia, the Energy coast 2040 includes the following points: In Ostrobothnia, wecollaborate energetically and make courageous and long-term decisions; our societies arestructurally sustainable and good habitat to a growing population; our region is energy self-sufficientand all energy is produced using renewable sources; our local food, energy, waste management andclean tech knowledge are international and national export products. The goals of the Ostrobothniaclimate strategies include: a sustainable energy system; an optimal urban structure; no waste –everything can be a commodity; knowledge, collaboration and trust; and an environmentally smartcountryside. (Pohjanmaan liitto 2015)
There are some specific parts related to biogas solutions. The region has planned to reduce theamount of biowaste taken to landfills, use forest-based biomass to replace coal, increase localbiomass based energy production and use, develop closed nutrient and material cycles in farmedbased energy production, developing the network of biofuel filling stations (Pohjanmaan liitto 2015).The capital of the region of Ostrobothnia, Vaasa is seeking to become carbon neutral by 2035. Thecarbon emissions have decreased by 28 % between 2011 and 2016 within the capital. (Deloitte 2018)
Following the vision and goals mapped out for Ostrobothnia, it seems that amplifying the availabilityof biogas solutions would serve the region, both as support for a strong local economy as well asanswering the sustainability challenges. More collaboration between regional actors providesopportunities for new, innovative ways to make business, export knowledge and technology whilesupporting the quality of life by protecting the local biodiversity and combating climate change.
50
References
Arfan, M. (2019). Biogas Value Chain in Gävleborg Feedstock, Production and Use. Gävle UniversityPress. [online] Gävle University Press. Available at: <http://hig.diva-portal.org/smash/get/diva2:1360909/FULLTEXT01.pdf> [Accessed 29 April 2021].
Big (2021). Big-biokaasu. [online] Big-biokaasu. Available at: <https://big.fi/> [Accessed 29 April2021].
Bioeconomy (2018). IKEA foodwaste gets a new life as pure Gasum biogas. [online] Bioeconomy.Available at: <https://www.bioeconomy.fi/ikea-foodwaste-gets-a-new-life-as-pure-gasum-biogas/>[Accessed 29 April 2021].
Bioenergy International (2019). Gasum opens LNG/LBG filling station in Lahti. [online] BioenergyInternational. Available at: <https://bioenergyinternational.com/storage-logistics/gasum-opens-lng-lbg-filling-station-in-lahti> [Accessed 29 April 2021].
Biohauki Oy (2021). Biokaasu.[online] Biohauki Oy. Available at:<https://www.biohauki.fi/biokaasu/> [Accessed 29 April 2021].
Biolinja Oy (2021). Biokaasulaitos. [online] Biolinja Oy. Available at:<https://biolinja.fi/biokaasulaitos> [Accessed 29 April 2021].
Biotalous (2015). Agroekologinen symbioosi toimii bioenergialla ja kierrättää ravinteet. [online]Biotalous. Available at: <https://www.biotalous.fi/agroekologinen-symbioosi-toimii-bioenergialla-ja-kierrattaa-ravinteet/> [Accessed 29 April 2021].
Ceccherini, G., Duveiller, G., Grassi, G. et al. (2020). Abrupt increase in harvested forest area overEurope after 2015. Nature 583, 72–77. [online] Available at: <https://doi.org/10.1038/s41586-020-2438-y> [Accessed 26 June 2021].
CircHubs (2021). Kujalan Jätekeskus. [online] CircHubs. Available at:<https://circhubs.fi/toimija/kujalan-jatekeskus/> [Accessed 29 April 2021].
Deloitte (2018). Kuntien ilmastotavoitteet ja -toimenpiteet, Liite 2 Suomen 50 suurimman kunnanilmastoprofiilit. [online] Deloitte. Available at: < https://media.sitra.fi/2018/10/12124312/deloitte-sitra-liite-2-kuntaprofiilit.pdf> [Accessed 26 June 2021].
Demeca (2021). Maatilat kuntoon. [online] Demeca. Available at: < https://demeca.fi/> [Accessed 29April 2021].
EAFO (2019). WHAT ARE ADVANCED BIOFUELS? [online] Advanced biofuels. European AlternativeFuels Observatory. Available at: <https://www.eafo.eu/alternative-fuels/advanced-biofuels/generic-information> [Accessed 1 June 2021].
EBA (2019). Biogas trends for this year, EBA, Brussels. [online]. European Biogas Association.Available at: <https://www.europeanbiogas.eu/biogas-trends-for-this-year/> [Accessed 29 April2021].
EBA (2020b). Biodiversity and Farm to Fork strategies: positive push for biogas development. [online]European Biogas Association. Available at: <https://www.europeanbiogas.eu/13412-2/> [Accessed29 April 2021].
51
EBA (2021). Sustainable and efficient agriculture - Developing a resource-efficient agriculture[online] European Biogas Association. Available at: <https://www.europeanbiogas.eu/legislation-on-sustainable-agriculture/> [Accessed 16 June 2021].
EEA (2020). Bio-waste in Europe — turning challenges into opportunities. [online] EuropeanEnvironment Agency, EEA Report No 4 published 17 June 2020. Available at:<https://www.eea.europa.eu/publications/bio-waste-in-europe> [Accessed 1 June 2021].
ELY-keskus (2017). Etelä-Pohjanmaan ELY-keskus on antanut lausunnon Jeppo Biogas Ab:n Jepuanbiokaasulaitoksen YVA-selostuksesta (Pohjalaismaakunnat). [online] ELY-keskus. Available at:<https://www.ely-keskus.fi/-/etela-pohjanmaan-ely-keskus-on-antanut-lausunnon-jeppo-biogas-ab-n-jepuan-biokaasulaitoksen-yva-selostuksesta-pohjalaismaakunnat-> [Accessed 29 April 2021].
EU. (2020). In focus: Renewable energy in Europe. [online] Energy News 18 March Brussels. Availableat: <https://ec.europa.eu/info/news/focus-renewable-energy-europe-2020-mar-18_en> [Accessed18 may 2021].
Euractiv (2018). Palm oil to be phased out in EU by 2030. [online] Dave Keating in Euractiv News 14June 2018 (updated: 20 June 2018). Available at: < https://www.euractiv.com/section/future-of-mobility/news/palm-oil-to-be-phased-out-in-eu-by-2030/>. [Accessed 18 May 2021].
Euractiv (2019). The future of biogas in Europe: it’s a local affair. [online] Frédéric Simon in EuractivNews 20 September 2019. Available at: <https://www.euractiv.com/section/energy/news/the-future-of-biogas-in-europe-its-a-local-affair/> [Accessed 3 June 2021].
Euractiv (2021). How the EU’s Renewable Energy Directive risks destroying Europe’s forests. [online]Dominic Scott, Jan Rosenow and Samuel Thomas in Euractiv News 22 June 2021. Available at: <https://www.euractiv.com/section/biomass/opinion/how-the-eus-renewable-energy-directive-risks-destroying-europes-forests/> [Accessed 28 June 2021].
European Commission (2019). Sustainability criteria for biofuels specified. European Commission[online] Available at:<https://ec.europa.eu/commission/presscorner/detail/en/MEMO_19_1656>
European Comission (2019b). Renewable Energy – Recast to 2030 (RED II). EU SCIENCE HUB,European Comission [online] Available at:< https://ec.europa.eu/jrc/en/jec/renewable-energy-recast-2030-red-ii> [Accessed 28 June 2021].
European Commission (2020). In focus: Renewable energy in Europe. European Commission [online]Available at: <https://ec.europa.eu/info/news/focus-renewable-energy-europe-2020-mar-18_en>[Accessed 28 June 2021].
European Commission (2021). A European Green Deal Striving to be the first climate-neutralcontinent. European Commission [online] Available at<https://ec.europa.eu/info/strategy/priorities-2019-2024/european-green-deal_en> [Accessed 28June 2021].
European Comission (2021b). Land use and forestry regulation for 2021-2030. [Online]. EuropeanCommission, Climate Action. Available at: <https://ec.europa.eu/clima/policies/forests/lulucf_en>[Accessed 26 june 2021]
Fagerström, A., Al Seadi, T., Rasi, S., Briseid, T, (2018). The role of Anaerobic Digestion and Biogas inthe Circular Economy. Murphy, J.D. (Ed.) IEA Bioenergy Task 37, 2018: 8 [online] Available at:
52
<https://www.ieabioenergy.com/wp-content/uploads/2018/06/Integrated-biogas-systems_WEB.pdf> [Accessed 28 June 2021].
Fredriksson, T., Kainulainen, A., Virolainen-Hynnä, A. Kauppinen, H., Eksymä, R., Tuomi.,T. (2020)KOTIMAISEN BIOKAASUN 2030 TAVOITTEEKSI 4 TWH. [online]. Biokaasu2030 Available at:<https://biokaasu2030.fi/> [Accessed 29 April 2021].
Gas for Climate & Guidehouse (2020). Market state and trends in renewable and low-carbon gases inEurope. Gas for Climate & Guidehouse [online] Available at: >https://www.europeanbiogas.eu/wp-content/uploads/2020/12/GfC_MSTReport_2020_final.pdf> [Accessed 29 April 2021].
Gas Infrastructure Europe (2020a) European Biomethane Map. Gas Infrastructure Europe [online]Available at:< https://www.gie.eu/product/european-biomethane-map> [Accessed 29 April 2021].
Gas Infrastructure Europe (2020b). LNG MAP Existing and planned infrastructure 2019. GasInfrastructure Europe [online] Available at: <https://www.gie.eu/product/gie-lng-map/> [Accessed29 April 2021].
Gasum (2019). Nesteytetyn kaasun käyttö kasvaa raskaassa liikenteessä – Edullinen tapa vähentääpäästöjä syy vaihtaa kaasuun. [online] Gasum. Available at:<https://www.gasum.com/ajassa/puhdas-liikenne/2019/nesteytetyn-kaasun-kaytto-kasvaa-raskaassa-liikenteessa//> [Accessed 29 April 2021].
Gasum (2021). Gasum to supply LNG to Wasaline and to Wärtsilä’s new technology hub. [online]Gasum. Available at: <https://www.gasum.com/en/About-gasum/for-the-media/News/2021/gasum-to-supply-lng-to-wasaline-and-to-wartsilas-new-technology-hub/> [Accessed 29 April 2021].
Gasum (2021b). Honkajoen biokaasulaitos. [online] Gasum. Available at: <https://www.gasum.com/kaasusta/biokaasu/biokaasulaitokset/honkajoen-biokaasulaitos/>[Accessed 29 April 2021].
Gasum (2021c). Vehmaa biogas plant. [online] Gasum. Available at:<https://www.gasum.com/en/About-gas/biogas/Biogas-plants/vehmaa-biogas-plant/> [Accessed 29April 2021].
Gasum (2021d) Gasum biogas plants in Nordics. [online] Available at:<https://www.gasum.com/en/our-operations/biogas-production/biogas-plants/> [Accessed 1 June2021]
Gasum (2021e) Together towards a carbon-neutral future. [online] Available at:<https://www.gasum.com/en/About-gasum/Information-about-Gasum/Gasum-in-brief/> [Accessed1 June 2021]
Gustafsson, M and Anderberg, S. (2021). Dimensions and characteristics of biogas policies –Modelling the European policy landscape. Renewable and Sustainable Energy Reviews, 135. [online]Available at:<https://reader.elsevier.com/reader/sd/pii/S1364032120304901?token=9C3FEC868672BBB3B6E68C10BB2601E4909A025D5471063926B888B4B4E1D2A07A958914947F2F4C5B7FD988FD7FE9FC&originRegion=eu-west-1&originCreation=20210806052602> [Accessed 2 June 2021]
Habitus (2021). Hajautettu biokaasun tuotanto ja nesteytys Suomessa. [online] CentriaAmmattikorkeakoulu Available at: <https://tki.centria.fi/hanke/habitus/2296> [Accessed 29 April2021].
53
Hagman, L., & Eklund, M. (2016). The role of biogas solutions in the circular and bio-based economy.Biogas Research Center. [Accessed 2 June 2021]
Harvey, F. (2020). Europe losing forest to harvesting at alarming rate, data suggests - Rise inharvesting could affect ability to combat climate crisis due to carbon absorption capacity reducing[online] Trees and forests in The Guardian 1 July 2020. Available at: <https://www.theguardian.com/environment/2020/jul/01/europe-losing-forest-to-harvesting-at-alarming-rate-data-suggests> [Accessed 16 June 2021].
Honkajoki Oy (2014). Honkajoelle rakennettava biokaasulaitos täydentää kierrätysideologiaa.[online] Honkajoki Oy. Available at: <https://www.honkajokioy.fi/honkajoelle-rakennettava-biokaasulaitos-taydentaa-kierratysideologiaa/>[Accessed 29 April 2021].
Honkajoki Oy (2021). Kasvua kierrättämällä. [online] Honkajoki Oy. Available at: <https://www.honkajokioy.fi/> [Accessed 29 April 2021].
Huttunen, M. J., Kuittinen, V., & Lampinen, A. (2018). Suomen biokaasulaitosrekisteri N:o 21. [online]UEF. Available at: <http://epublications.uef.fi/pub/urn_isbn_978-952-61-2856-6/urn_isbn_978-952-61-2856-6.pdf> [Accessed 10 May 2021].
ICCT (2018). Analysis of high and low indirect land-use change definitions in European Unionrenewable fuel policy. [online] Working paper 15th November 2018 by Stephanie Searle and JacopoGiuntoli. The International Council on Clean Transportation. Available at:<https://theicct.org/publications/analysis-high-and-low-iluc-definitions-eu> [Accessed 1 June 2021].
IEA (2018). The role of Anaerobic Digestion and Biogas in the Circular Economy [online] IEABioenergy Task 37 August 2018. Available at: <https://www.ieabioenergy.com/blog/publications/the-role-of-anaerobic-digestion-and-biogas-in-the-circular-economy/> [Accessed 1 June 2021].
IEA (2020). Outlook for biogas and biomethane: Prospects for organic growth. [online] World EnergyOutlook special report. Fuel report March 2020. Available at: <https://www.iea.org/reports/outlook-for-biogas-and-biomethane-prospects-for-organic-growth> [Accessed 1 June 2021].
Industriellekologi (2021a). Norrköping Industrial Symbiosis Network. [online] Industriellekologi.Available at: <http://www.industriellekologi.se/symbiosis/norrkoping.html> [Accessed 29 April2021].
Industriellekologi (2021b). Lidköping Industrial Symbiosis Network. [online] Industriellekologi.Available at: <http://www.industriellekologi.se/symbiosis/lidkoping.html> [Accessed 29 April 2021].
Industriellekologi (2021c). Industrial Symbiosis in Helsingborg. [online] Industriellekologi. Availableat: <http://www.industriellekologi.se/symbiosis/helsingborg.html> [Accessed 29 April 2021].
Jalotofu (2021). Rohkea askel kohti kiertotaloutta ja energiaomavaraisuutta: rakennutamme omanbiokaasulaitoksen! [online] Jalotofu. Available at: <https://jalotofu.fi/rohkea-askel-kohti-kiertotaloutta-ja-energiaomavaraisuutta-rakennutamme-oman-biokaasulaitoksen/> [Accessed 16June 2021].
Kaasuautoilijat ry (2019). Kysymyksiä biokaasusta [online] Kaasuautoilijat ry. Available at:<https://kaasuautoilijat.fi/2019/07/01/10-kysymysta/> [Accessed 26 June 2021].
Kaasuautoilijat ry (2021). Kaasun tankkaaminen - Tankkausasemat. [online] Kaasuautoilijat ry.Available at: <https://kaasuautoilijat.fi/2019/07/24/tankkausverkosto/> [Accessed 29 April 2021].
54
Kauppalehti (2019). Biojätteestä biokaasuksi – näin Lidl hyödyntää hävikin polttoaineeksi. [online]Kauppalehti Available at: <https://studio.kauppalehti.fi/gasum-puhtaampaa-energiaa/biojatteesta-biokaasuksi-nain-lidl-hyodyntaa-havikin-polttoaineeksi> [Accessed 29 April 2021].
Kampman, B., Leguijt, C., Scholten, T., Tallat-Kelpsaite, J., Brückmann, R., Maroulis, G. , WageningenResearch: Lesschen, J. P., Meesters, K., Sikirica, N., Elbersen, B. (2017). Optimal use of biogas fromwaste streams An assessment of the potential of biogas from digestion in the EU beyond 2020[online] European Commission. Available at:<https://ec.europa.eu/energy/sites/ener/files/documents/ce_delft_3g84_biogas_beyond_2020_final_report.pdf> [Accessed 1st June 2021].
Kiertokaari (2021a). Kiertotalouden edistäminen ja hiilineutraliteetti. [online] Kiertokaari OyAvailable at: <https://kiertokaari.fi/kiertokaari-oy/kiertotalouden-edistaminen-ja-hiilineutraliteetti/>[Accessed 29 April 2021].
Kiertokaari (2021c). 2020 Vuosikertomus. Kiertokaari [online] Available at:<https://kiertokaari.fi/wp-content/uploads/2021/04/KIERTOKAARI_vuosikertomus2020-low2.pdf> [Accessed 14 April 2021].
Kiertokaari Oy (2021b). Kiertokaari Oy:n tehtävä. [online] Kiertokaari Oy Available at:<https://kiertokaari.fi/kiertokaari-oy/tehtava/> [Accessed 29 April 2021].
Knuts, T., Östberg, G., & Hautala, R. (2020). Pohjanmaa Matkalla Muutokseen Kestävän kehityksenja kiertotalouden tiekartta. [online] Available at:<https://www.vasek.fi/cerm-tiekartta/> [Accessed26 June 2021]
Kuntaliitto (2019). Kuntien kiertotaloustärpit - Vaasa: Kotitalouksien biojätteet ja lietteethyödynnetään joukkoliikenteen ja yksityisautojen biopolttoaineena. [online] Kuntaliitto. Available at:<https://www.kuntaliitto.fi/yhdyskunnat-ja-ymparisto/ymparisto/kiertotalous/kuntien-kiertotaloustarpit/vaasa> [Accessed 29 April 2021].
Labio Oy (2021). LABIO Environmentally friendly, reliable and responsible biogas and compostingplant in Kujala, Lahti. [online] LABIO. Available at: <https://www.labio.fi/> [Accessed 26 June 2021].
Liikenne- ja viestintäministeriö (2021). LUONNOS FOSSIILITTOMAN LIIKENTEEN TIEKARTTA –VALTIONEUVOSTON PERIAATESPÄÄTÖS KOTIMAAN LIIKENTEEN KASVIHUONEKAASUPÄÄSTÖJENVÄHENTÄMISESTÄ. [online] Liikenne- ja viestintäministeriö. Available at:<https://api.hankeikkuna.fi/asiakirjat/d99a3ae3-b7f9-49df-afd2-c8f2efd3dc1d/e4e97efb-1f23-4c22-bdf1-f1fc27809030/LAUSUNTOPYYNTO_20210115060016.PDF> [Accessed 29 April 2021].
Lindfors A, Feiz R, Eklund M, Ammenberg J. Assessing the Potential, Performance and Feasibility ofUrban Solutions: Methodological Considerations and Learnings from Biogas Solutions. Sustainability.2019; 11(14):3756. [online] Available at: <https://doi.org/10.3390/su1114375> [Accessed 26 June2021].
LUKE (2015) New methane bioreactor produces environmentally friendly energy and mitigatesclimate change [online] Available at: < https://www.luke.fi/en/news/new-methane-bioreactor-produces-environmentally-friendly-energy-and-mitigates-climate-change/> [Accessed 26 June2021].
Luostarinen, S., Tampio, E., Niskanen, O., Koikkalainen, K., Kauppila, J., Valve, H., Salo, T. & Ylivainio,K. (2019). Lantabiokaasutuen toteuttamisvaihtoehdot. Luonnonvara- ja biotalouden tutkimus40/2019. Luonnonvarakeskus. Helsinki. 75 s.[online] Luonnonvarakeskus. Available at:
55
https://jukuri.luke.fi/bitstream/handle/10024/544244/luke-luobio_40_2019.pdf?sequence=1&isAllowed=y [Accessed 26 June 2021]
Metener (2021). Fossiilitaloudesta Biotalouteen. [online] Metener. Available at:<http://www.metener.fi/> [Accessed 29 April 2021].
Molok Oy (2021). Ajantasainen jätelaki – tämä sinun tulisi tietää. [online] Molok Oy. Available at: <https://www.molok.com/fi/blogi/ajantasainen-jatelaki >[Accessed 29 April 2021].
Motiva (2021a). Sybimar Oy, Suljetun kierron konsepti. [online] Motiva. Available at:<https://www.motiva.fi/ratkaisut/uusiutuva_energia/palvelut/greenenergycases/sybimar_oy_suljetun_kierron_konsepti.13.html> [Accessed 29 April 2021].
Motiva (2021b). Uusiutuvan energian RED II – direktiivi. [online] Motiva. Available at:<https://www.motiva.fi/ratkaisut/ohjauskeinot/direktiivit/uusiutuvan_energian_red_ii_-direktiivi>[Accessed 29 April 2021].
Mutikainen, M., Sormunen, K., Paavola, H., Haikonen, T., & Väisänen, M. (2016). Biokaasusta kasvua.Sitran Selvityksiä, (111), 124. Available at: <https://www.sitra.fi/julkaisut/Selvityksiä-sarja/Selvityksia111.pdf> [Accessed 26 June 2021].
Nylund, N., Tamminen, S., Sipilä, K., Laurikko,J., Sipilä, E., Mäkelä, K., Hannula, I., Honkatukia, J.(2015) Tutkiumusraportti – Tieliikenteen 40%:n hiilidioksidipäästöjen vähentäminen vuoteen 2030:Käyttövoimavaihtoehdot ja niiden kansantaloudelliset vaikutukset. VTT [online] Available at:<http://www.transsmart.fi/files/248/Tutkimusraportti_VTT-R-00752-15_liitteineen.pdf> [Accessed26 June 2021].
Ojanpää M. (2020). Biokaasun ekosysteemi Varsinais-Suomessa. Gasum [online] Available at:<https://circvol.fi/wp-content/uploads/2020/05/Biokaasu-Varsinais-Suomessa-GASUM-20200505.pdf> [Accessed 26 June 2021].
Okkonen & Blomqvist (2020) Biokaasun liiketoimintamalleja -UusiutuWat. Karelia-amk. [online]Available at: <https://energiaraitti.karelia.fi//content/uploads/2020/12/Biokaasun-liiketoimintamalleja_verkko.pdf> [Accessed 26 June 2021].
Pohjanmaan liitto (2015). Pohjanmaan ilmastostrategia 2040 Tausta-aineisto. [online] Pohjanmaanliitto Available at: <https://www.obotnia.fi/assets/Sidor/1/60/Energiarannikko-Pohjanmaan-ilmastostrategia-2040-raportti-1.pdf> [Accessed 26 June 2021].
Pohjanmaan liitto (2020). Alueellinen elpymissuunnitelma tukee vientiteollisuutta ja vihreääsiirtymää. [online] Pohjanmaan liitto Available at: <https://www.obotnia.fi/fi/pohjanmaan-maakunta/ajankohtaista-liitosta/alueellinen-elpymissuunnitelma-tukee-vientiteollisuutta-ja-vihreaa-siirtymaa-> [Accessed 29 April 2021].
Posti (2020). Case: Biokaasulla raskaan liikenteen päästöistä 90 % pois. [online] Posti. Available at: <https://www.posti.com/vastuullisuus/kaytannon-esimerkit/case-biokaasulla-raskaan-liikenteen-paastoista-90--pois/> [Accessed 29 April 2021].
Raven P., et al., (2021). Letter Regarding Use of Forests for Bioenergy. To President Biden, Presidentvon der Leyen, President Michel, Prime Minister Suga, and President Moon. [online] Scientist Letterto Biden, von der Leyen, Michel, Suga & Moon Re. Forest Biomass February 11, 2021. Available at: <https://www.woodwellclimate.org/letter-regarding-use-of-forests-for-bioenergy/> [Accessed 1 June2021].
56
RED II (2018). Renewable Energy Directive (RED II) Directive (EU) 2018/2001 on the promotion of theuse of energy from renewable sources. [online] Official Journal of the European Union. Available at:<https://eur-lex.europa.eu/legal-content/EN/TXT/HTML/?uri=CELEX:32018L2001&from=EN>[Accessed 1 June 2021].
Remeo (2020). Remeo mukana biokaasun tutkimushankkeessa. [online] Remeo. Available at: <https://remeo.fi/remeo-mukana-biokaasun-tutkimushankkeessa/> [Accessed 29 April 2021].
Ruokatieto (2021). Maatalous eri osissa Suomea. Ruokatieto [online] Available at:<https://www.ruokatieto.fi/ruokakasvatus/ruokaketju-ruuan-matka-pellolta-poytaan/maatilalla-kasvatetaan-ruokaa/maatalous-suomessa-perustuu-perheviljelmiin/maatalous-eri-osissa> [Accessed16 June 2021].
SEO (2021a). SEO HUOLTOASEMAT JA LÄMMITYSÖLJYT. [online] SEO. Available at: < https://seo.fi/>[Accessed 16 June 2021].
SEO (2021b). SEO biokaasu. [online] SEO. Available at: <https://seo.fi/biokaasu/> [Accessed 16 June2021].
SmartLahti (2021). Kujala waste symbiosis. [online]. Smart & Clean Lahti. Available at:<https://www.smartlahti.fi/content/kujala-waste-symbiosis/> [Accessed 16 June 2021].
Soil Food (2021). Biokaasu- ja bio-etanolilaitokset [online] Soil Food. Available at:<https://soilfood.fi/palvelut-teollisuudelle/biokaasu-ja-bioetanolilaitokset/> [Accessed 16 June2021].
Suomen Biokierto ja Biokaasu ry (2021). Suomen biokaasulaitokset. [online] Suomenbiokaasulaitokset. Available at:<https://www.google.com/maps/d/viewer?mid=1RJ8Zkag_PTw_T3FkLFJohBMtV7g&ll=63.167847105644164%2C22.85462414377998&z=8> [Accessed 29 April 2021].
SYKE (2020) Nutrients, energy and livelihood for the countryside from a biogas plant (BioRaEE).[online] Available at: <https://www.syke.fi/en-US/Research__Development/Research_and_development_projects/Projects/Nutrients_energy_and_livelihood_for_the_countryside_from_a_biogas_plant_BioRaEE > [Accessed 29 May 2021]
The European Biogas Association (2020). Annual Report 2020 European Biogas Association. [online]The European Biogas Association. Available at: < https://www.europeanbiogas.eu/eba-annual-report-2020/> [Accessed 29 April 2021].
The European Biogas Association, Gas Infrastructure Europe, The Natural & Bio Gas VehicleAssociation and Sea-LNG (2020). BioLNG in Transport: Making Climate Neutrality a Reality. [online]The European Biogas Association, Gas Infrastructure Europe, The Natural & Bio Gas VehicleAssociation and Sea-LNG. Available at: <https://www.europeanbiogas.eu/wp-content/uploads/2020/11/BioLNG-in-Transport_Making-Climate-Neutrality-a-Reality.pdf> [Accessed29 April 2021].
Tolpo, A., 2020. 15 miljoonan euron biokaasulaitos pakottaa avaamaan kannattamattomiatankkausasemia pikkukyliin: "Jos ei ole asemia, ihmiset eivät hanki autoja". [online] Yle Uutiset.Available at: <https://yle.fi/uutiset/3-11354542> [Accessed 29 April 2021].
Tukes (2021). Natural gas and biogas. [online] Tukes. Available at: <https://tukes.fi/en/industry/natural-gas-and-biogas> [Accessed 29 April 2021].
57
University of Helsinki (2020). Palopuro Agroecological Symbiosis. [online] University of Helsinki.Available at: <https://blogs.helsinki.fi/palopuronsymbioosi/english/> [Accessed 29 April 2021].
University of Vaasa (2021) Biokaasun hyödyntämismahdollisuudet Pohjanmaalla. [online] Availableat: <https://www.uwasa.fi/fi/tutkimus/hankkeet/biokaasun-hyodyntamismahdollisuudet-pohjanmaalla>[Accessed 29 May 2021]
Vaasa (2021). ENERGYVAASA - THE NORDIC HUB FOR ENERGY TECHNOLOGY. Vaasa. [online]Available at:< https://www.vaasa.fi/en/energyvaasa/> [Accessed 29 May 2021]
Valtioneuvosto (2021, 29. April). New government proposal: public procurement of vehicles andtransport services must be eco-friendly. Valtioneuvosto [online] Available athttps://valtioneuvosto.fi/en/-/new-government-proposal-public-procurement-of-vehicles-and-transport-services-must-be-eco-friendly [Accessed 1 May 2021]
Van der Linden, Reichel, Brusselaars, Winterstetter, Dils, Arnold, Teittinen, Braekevelt & Ullstein(2020). Bio-waste in Europe — turning challenges into opportunities. EEA report 04. [online]Available at: <https://www.eea.europa.eu/publications/bio-waste-in-europe> [Accessed 15 July2021].
Vanhamäki S., Medkova M., Malamakis A., Kontogianni S., Marišová E., Huisman Dellago D. &Moussiopoulos N. (2019) Bio-based circular economy in European national and regional strategies.International Journal of Sustainable Development and Planning (14:1) 31-43. [Accessed 29 April2021].
VASEK (2021). Yrityshakemisto. VASEK [online] Available at:<https://vasek.yrityshakemistot.fi/default.asp?op=NaytaYritykset> [Accessed 29 April 2021].
VEBIC, University of Vaasa (26.05.2021) EnergyVaasa talks: Gaseous fuels as a booster of energytransition – reality or a distant dream? [online] Available at:<https://www.uwasa.fi/en/event/energyvaasa-talks-gaseous-fuels-booster-energy-transition-reality-or-distant-dream> [Accessed 26th May 2021].
Virolainen-Hynnä A. (2020). Biokaasun tuotanto ja käyttö Suomessa 2030. Suomen Biokierto jaBiokaasu ry. [online] Available at: <https://biokierto.fi/wp-content/uploads/2020/06/Biokaasu2030_raportti_17062020.pdf> [Accessed 1st March 2021].
Virolainen-Hynnä, A. (2021, 16. helmikuuta). Biokaasusektorin visio ja toimenpiteet 2030 -työpaja.
Watrec (2021). Honkajoen laitos Jatkuvuutta ja toimivuutta tuova jätteenkäsittelyratkaisu. [online]Watrec. Available at: <https://watrec.fi/referenssit/jatkuvuutta-ja-toimivuutta-tuova-jatteenkasittelyratkaisu/> [Accessed 29 April 2021].
Appendix 1 SWOT & PESTEL
+ -Internalenvironment ofthe biogas sector
Strengths WeaknessesEagerness to develop the sector,emission decrease possibilities,local economy.
Lack of a common infrastructure,unreliable demand and supply,market is fragmented andlittle cooperation.
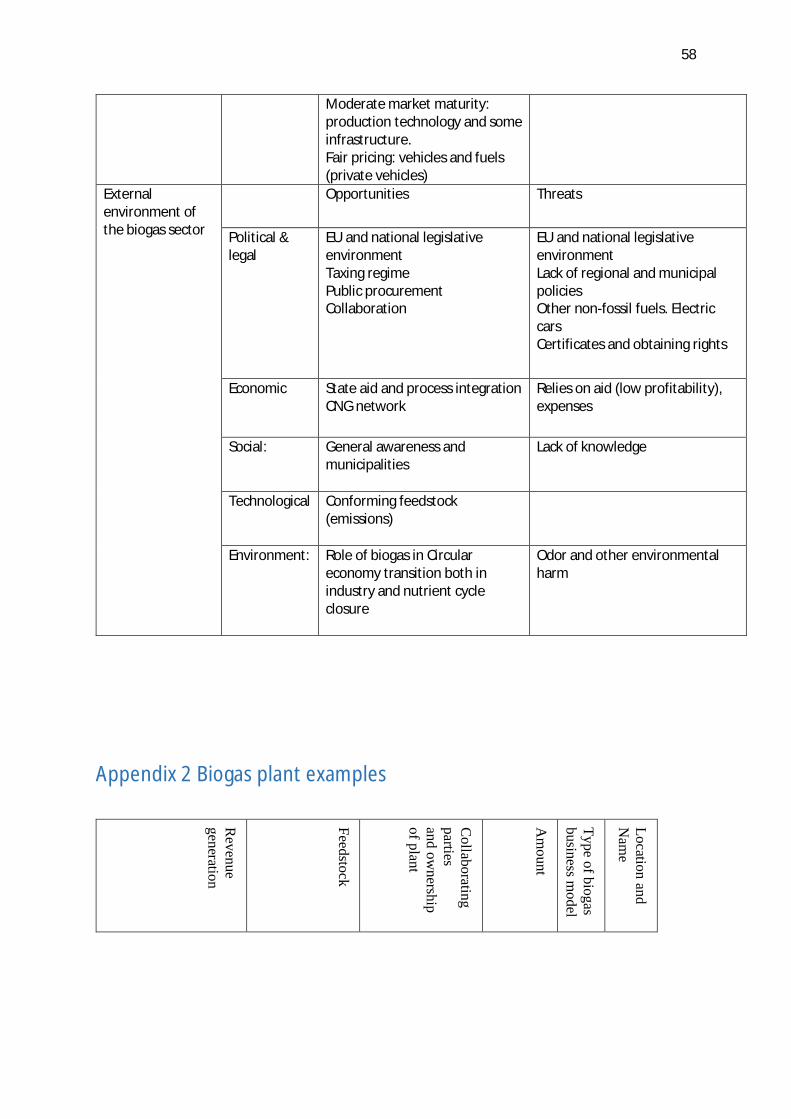
58
Moderate market maturity:production technology and someinfrastructure.Fair pricing: vehicles and fuels(private vehicles)
Externalenvironment ofthe biogas sector
Opportunities Threats
Political &legal
EU and national legislativeenvironmentTaxing regimePublic procurementCollaboration
EU and national legislativeenvironmentLack of regional and municipalpoliciesOther non-fossil fuels. ElectriccarsCertificates and obtaining rights
Economic State aid and process integrationCNG network
Relies on aid (low profitability),expenses
Social: General awareness andmunicipalities
Lack of knowledge
Technological Conforming feedstock(emissions)
Environment: Role of biogas in Circulareconomy transition both inindustry and nutrient cycleclosure
Odor and other environmentalharm
Appendix 2 Biogas plant examples
Revenue
generation
Feedstock
Collaborating
partiesand ow
nershipof plant
Am
ount
Type of biogasbusiness m
odel
Location andN
ame
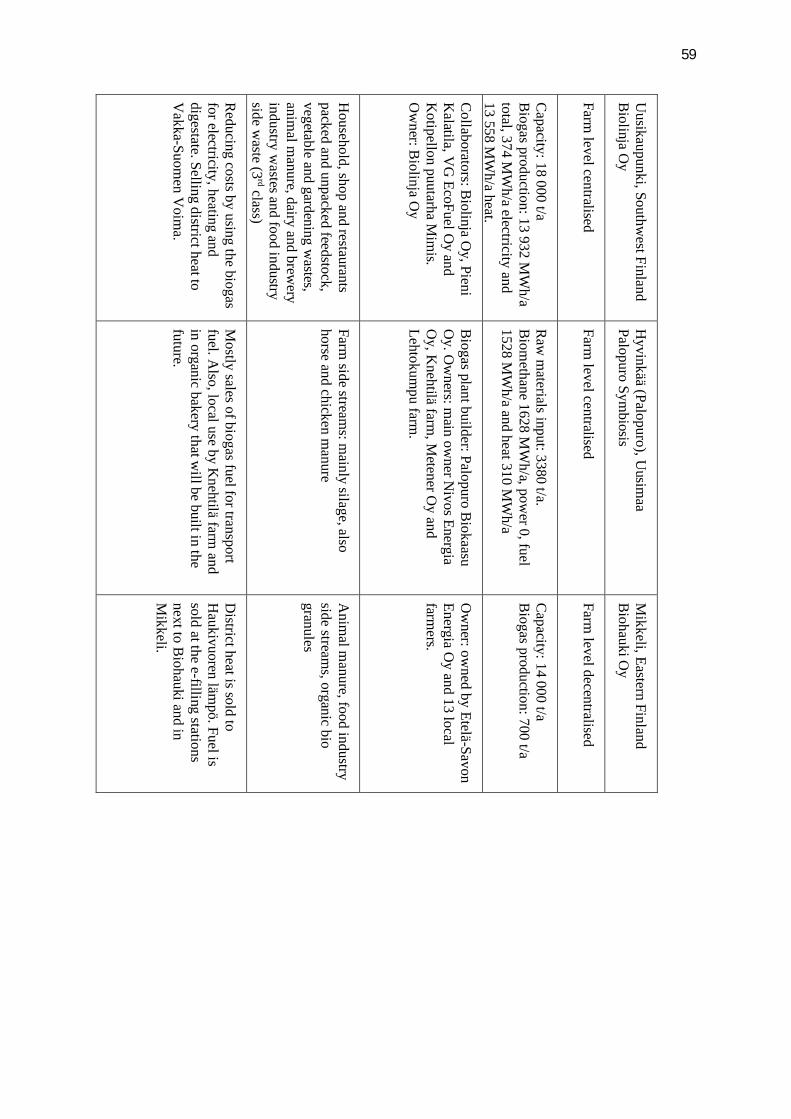
59
Reducing costs by using the biogas
for electricity, heating anddigestate. Selling district heat toV
akka-Suomen V
oima.
Household, shop and restaurants
packed and unpacked feedstock,vegetable and gardening w
astes,anim
al manure, dairy and brew
eryindustry w
astes and food industryside w
aste (3rd class)
Collaborators: B
iolinja Oy, Pieni
Kalatila, V
G EcoFuel O
y andK
otipellon puutarha Mim
is.O
wner: B
iolinja Oy
Capacity: 18 000 t/a
Biogas production: 13 932 M
Wh/a
total, 374 MW
h/a electricity and13
558 MW
h/a heat.
Farm level centralised
Uusikaupunki, Southw
est FinlandB
iolinja Oy
Mostly sales of biogas fuel for transport
fuel. Also, local use by K
nehtilä farm and
in organic bakery that will be built in the
future.
Farm side stream
s: mainly silage, also
horse and chicken manure
Biogas plant builder: Palopuro B
iokaasuO
y. Ow
ners: main ow
ner Nivos Energia
Oy, K
nehtilä farm, M
etener Oy and
Lehtokumpu farm
.
Raw
materials input: 3380 t/a.
Biom
ethane 1628 MW
h/a, power 0, fuel
1528 MW
h/a and heat 310 MW
h/a
Farm level centralised
Hyvinkää (Palopuro), U
usimaa
Palopuro Symbiosis
District heat is sold to
Haukivuoren läm
pö. Fuel issold at the e-filling stationsnext to B
iohauki and inM
ikkeli.
Anim
al manure, food industry
side streams, organic bio
granules
Ow
ner: owned by Etelä-Savon
Energia Oy and 13 local
farmers.
Capacity: 14 000 t/a
Biogas production: 700 t/a
Farm level decentralised
Mikkeli, Eastern Finland
Biohauki O
y
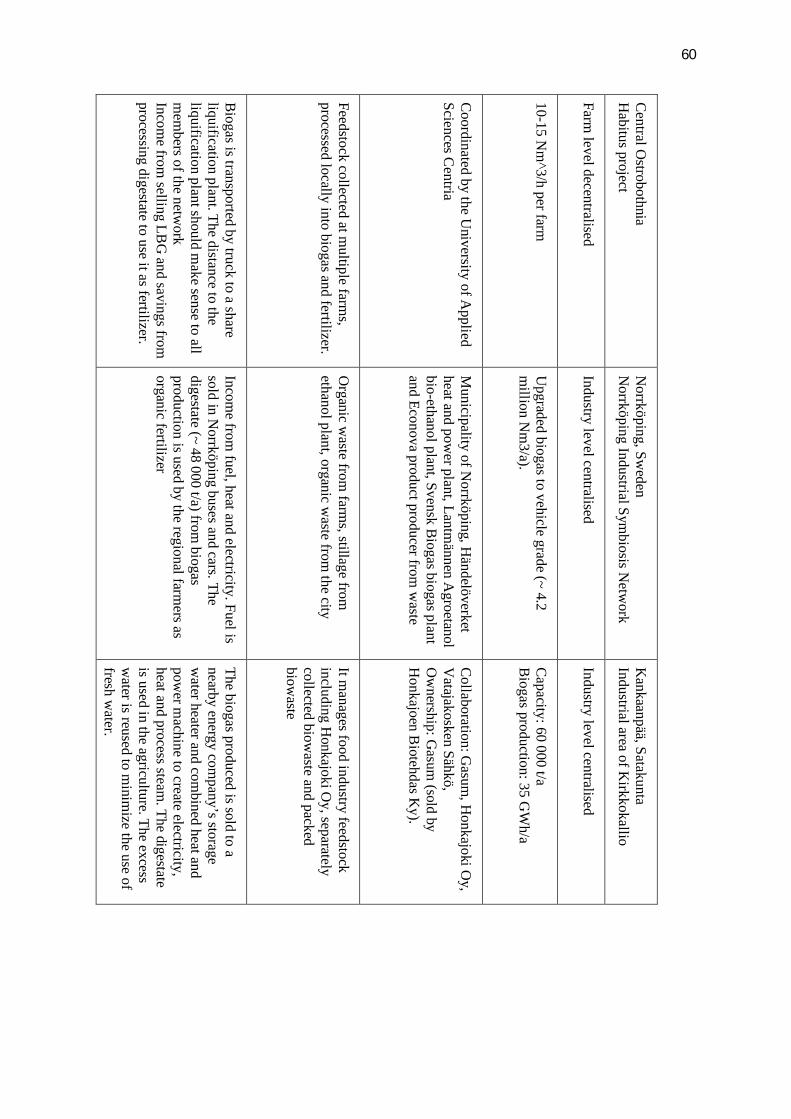
60
Biogas is transported by truck to a share
liquification plant. The distance to theliquification plant should m
ake sense to allm
embers of the netw
orkIncom
e from selling LB
G and savings from
processing digestate to use it as fertilizer.
Feedstock collected at multiple farm
s,processed locally into biogas and fertilizer.
Coordinated by the U
niversity of Applied
Sciences Centria
10-15 Nm
^3/h per farm
Farm level decentralised
Central O
strobothniaH
abitus project
Income from
fuel, heat and electricity. Fuel issold in N
orrköping buses and cars. Thedigestate (~ 48 000 t/a) from
biogasproduction is used by the regional farm
ers asorganic fertilizer
Organic w
aste from farm
s, stillage fromethanol plant, organic w
aste from the city
Municipality of N
orrköping, Händelöverket
heat and power plant, Lantm
ännen Agroetanol
bio-ethanol plant, Svensk Biogas biogas plant
and Econova product producer from w
aste
Upgraded biogas to vehicle grade (~ 4.2
million N
m3/a).
Industry level centralised
Norrköping, Sw
edenN
orrköping Industrial Symbiosis N
etwork
The biogas produced is sold to anearby energy com
pany’s storagew
ater heater and combined heat and
power m
achine to create electricity,heat and process steam
. The digestateis used in the agriculture. The excessw
ater is reused to minim
ize the use offresh w
ater.
It manages food industry feedstock
including Honkajoki O
y, separatelycollected biow
aste and packedbiow
aste
Collaboration: G
asum, H
onkajoki Oy,
Vatajakosken Sähkö,
Ow
nership: Gasum
(sold byH
onkajoen Biotehdas K
y).
Capacity: 60 000 t/a
Biogas production: 35 G
Wh/a
Industry level centralised
Kankaanpää, Satakunta
Industrial area of Kirkkokallio
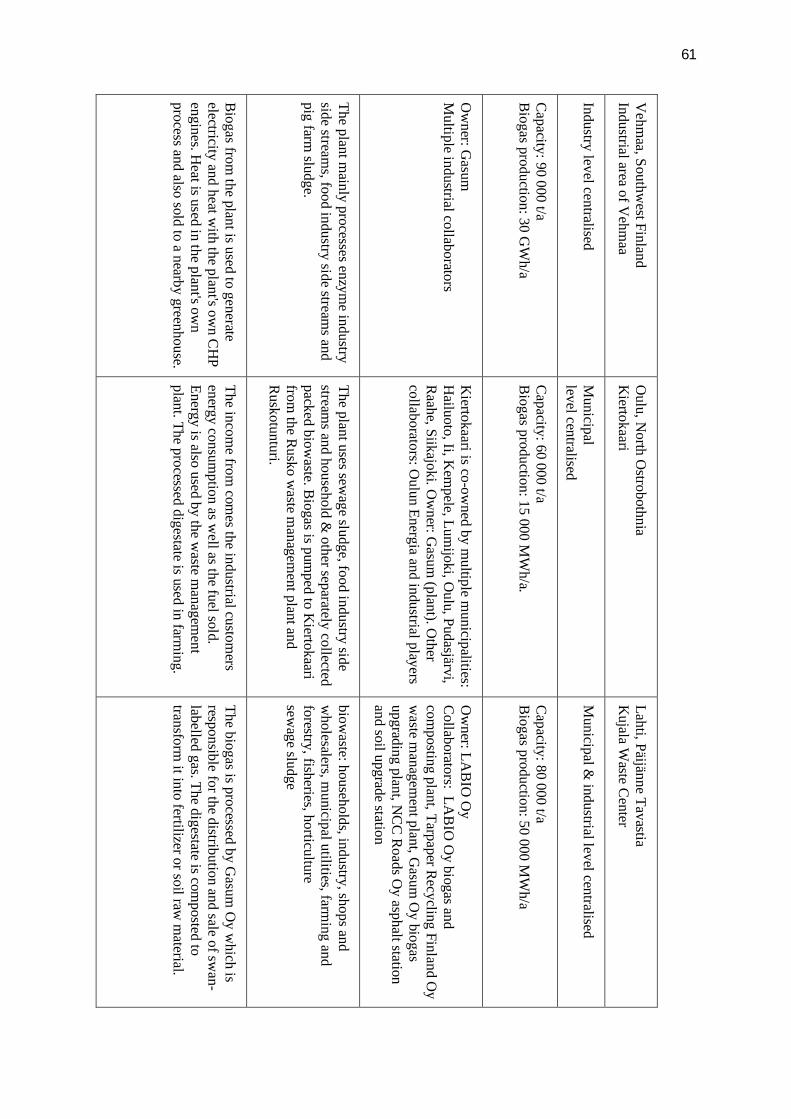
61
Biogas from
the plant is used to generateelectricity and heat w
ith the plant's own C
HP
engines. Heat is used in the plant's ow
nprocess and also sold to a nearby greenhouse.
The plant mainly processes enzym
e industryside stream
s, food industry side streams and
pig farm sludge.
Ow
ner: Gasum
Multiple industrial collaborators
Capacity: 90 000 t/a
Biogas production: 30 G
Wh/a
Industry level centralised
Vehm
aa, Southwest Finland
Industrial area of Vehm
aa
The income from
comes the industrial custom
ersenergy consum
ption as well as the fuel sold.
Energy is also used by the waste m
anagement
plant. The processed digestate is used in farming.
The plant uses sewage sludge, food industry side
streams and household &
other separately collectedpacked biow
aste. Biogas is pum
ped to Kiertokaari
from the R
usko waste m
anagement plant and
Ruskotunturi.
Kiertokaari is co-ow
ned by multiple m
unicipalities:H
ailuoto, Ii, Kem
pele, Lumijoki, O
ulu, Pudasjärvi,R
aahe, Siikajoki. Ow
ner: Gasum
(plant). Other
collaborators: Oulun Energia and industrial players
Capacity: 60 000 t/a
Biogas production: 15 000 M
Wh/a.
Municipal
level centralised
Oulu, N
orth Ostrobothnia
Kiertokaari
The biogas is processed by Gasum
Oy w
hich isresponsible for the distribution and sale of sw
an-labelled gas. The digestate is com
posted totransform
it into fertilizer or soil raw m
aterial.
biowaste: households, industry, shops and
wholesalers, m
unicipal utilities, farming and
forestry, fisheries, horticulturesew
age sludge
Ow
ner: LAB
IO O
yC
ollaborators: LAB
IO O
y biogas andcom
posting plant, Tarpaper Recycling Finland O
yw
aste managem
ent plant, Gasum
Oy biogas
upgrading plant, NC
C R
oads Oy asphalt station
and soil upgrade station
Capacity: 80 000 t/a
Biogas production: 50 000 M
Wh/a
Municipal &
industrial level centralised
Lahti, Päijänne TavastiaK
ujala Waste C
enter

62