Embed Size (px)
Citation preview

-- -------- -- -- of - - -
OFFICE OF INSPECTOR GENERAL
FEBRUARY 1998 OEI-09-95-00410

E X E C U T I V E S U M M A R Y
PURPOSE
To provide baseline data about the ambulance industry and determine how State and local ordinances affect the delivery of ambulance services.
BACKGROUND
According to Section 1861(s)(7) of Social Security Act, Medicare pays for medically necessary ambulance services when other forms of transportation would endanger the beneficiary’s health. Ambulance suppliers provide two distinct levels of service--advanced life support and basic life support. The major distinctions between the levels are the types of vehicles and the skills of the personnel and the services they render.
The Health Care Financing Administration (HCFA) is considering proposed Medicare regulations that would base reimbursement for ambulance services on the patient’s condition rather than the type of vehicle and personnel used. The final rule may include a special waiver for suppliers in non-Metropolitan Statistical Areas who would be hurt financially if they use only advanced life support ambulances. The HCFA may consider several options and may include a special waiver only if HCFA is convinced through overwhelming information of the need for the waiver.
We decided to examine the effect and need for a special waiver based on Metropolitan Statistical Areas and non-Metropolitan Statistical Areas. In addition, we developed baseline information on the number of ambulance suppliers, vehicles, and personnel nationwide. We conducted in-person and telephone interviews with 53 State Emergency Medical Services Directors for the 50 States, the District of Columbia, the Commonwealth of Puerto Rico, and the U.S. Virgin Islands. Using a structured discussion guide, we (1) identified State, county, and municipal mandates that require specific levels of ambulance services and (2) obtained baseline data on the number of suppliers, licensed vehicles, and certified personnel operating within the States in 1995 and 1996. We analyzed the 1995 universe of Medicare ambulance claims to determine the distribution of allowed claims by Metropolitan Statistical Areas and non-Metropolitan Statistical Areas for the 53 States. We also reviewed financial analyst reports on the ambulance industry.
FINDINGS
Medicare ambulance costs and services are skyrocketing
Between 1987 and 1995, Medicare allowances increased 229.1 percent from $602 million to almost $2.0 billion. More than four out of five Medicare ambulance services are provided in Metropolitan Statistical Areas. In 1995, this translated to about 6 million of the 7.5 million services rendered in Metropolitan Statistical Areas.
1

Ambulance service is a growth industry controlled by a few major corporations
The Emergency Medical Services Directors in 41 of the 53 States noted that three large corporations are buying out small private ambulance companies in their States. The three major corporations--Laidlaw, American Medical Response, and Rural/Metro--are located in all 41 primary and shared State markets. By the end of 1996, these three corporations owned at least 20 percent of the national private ambulance market.
All States regulate ambulance services; however, less than half mandate levels of service and only one requires advanced life support
All States have administrative codes and regulations that set standards for ambulance services. The codes and regulations set requirements for licensure, certification, and recertification of ambulance suppliers, vehicles, and personnel to operate within the States. Nationally, 21 of the 53 States legislatively mandate a minimum level of ambulance services. Of these, Hawaii is the only State that requires advanced life support services. Approximately 11 percent of localities also mandate ambulance services, and another 11 percent of localities contract for ambulance services using general tax revenues.
Only two States use Metropolitan Statistical Areas to designate ambulance service areas
Of the 53 States, 5 1 (or 96.2 percent) do not define their ambulance service areas as Metropolitan Statistical Area and non-Metropolitan Statistical Area. The significance is that HCFA may consider a waiver exception in the proposed ambulance regulations based on a Metropolitan Statistical Area/non-Metropolitan Statistical Area designation. If the waiver exception is based on this designation and all non-Metropolitan Statistical Area suppliers qualified for waivers, HCFA would continue to allow at least $185.7 million annually in advanced life support reimbursement. Furthermore, a portion of the current $134.0 million in basic life support allowed services may be billed and allowed at the higher advanced life support level assuming suppliers with waivers converted their programs to provide advanced life support services only.
RECOMMENDATION
Previous Office of Inspector General studies have recommended that HCFA base reimbursement on the patient’s condition rather than the type of vehicle and personnel used. We continue to support this recommendation. In addition, HCFA should:
re-evaluate its proposal to use the Metropolitan Statistical Area/non-Metropolitan Statistical Area designation as the basis for granting waivers when determining a waiver policy in its final rule on ambulance coverage.
ii

AGENCY COMMENTS
We received comments on the draft report from the Assistant Secretary for Management and Budget (ASMB) and HCFA. The HCFA concurred with the general findings and recommendation of our draft report. Since we released the draft report, HCFA published the Notice of Proposed Rulemaking for Medicare ambulance services on June 18, 1997. The proposal includes two options for a waiver provision for suppliers in non-Metropolitan Statistical Area designations.
Both HCFA and ASMB stated that HCFA had not yet decided which option, if any, it would use to grant waivers. Based on these agency comments, we modified the recommendation on the Metropolitan Statistical Area/non-Metropolitan Statistical Area by making an explicit reference to proposed rule. We also made changes based on
technical comments.
The full text of each agency’s comments appears in appendix D.
111

T A B L E O F C O N T E N T S
PAGE
EXECUTIVE SUMMARY
INTRODUCTION . . . . . . . . . . . . . . . . . . . . . . . . . . . . . . . . . . . . . . . . . 1
FINDINGS . . . . . . . . . . . . . . . . . . . . . . . . . . . . . . . . . . . . . . . . . . . . . . 7
� Medicare ambulance costs . . . . . . . . . . . . . . . . . . . . . . . . . . . . . . . . . . . 7
� Growth industry . . . . . . . . . . . . . . . . . . . . . . . . . . . . . . . . . . . . . . . . 8
� State standards . . . . . . . . . . . . . . . . . . . . . . . . . . . . . . . . . . . . . . . . . 12
� Metropolitan Statistical Areas . . . . . . . . . . . . . . . . . . . . . . . . . . . . . . . . 12
RECOMMENDATION . . . . . . . . . . . . . . . . . . . . . . . . . . . . . . . . . . . . . . 14
AGENCYCOMMENTS . . . . . . . . . . . . . . . . . . . . . . . . . . . . . . . . . . . . . 14
APPENDICES
A: Emergency Medical Services Training Requirements for Ambulance Personnel . . A-l
B: Number of Ambulance Suppliers, Vehicles, and Personnel for 1995 and 1996 . . . . . . . . . . . . . . . . . . . . . . . . . . . . . . . . . . . . . . B-l
C: Breakdown of 1995 Ambulance Services and Allowed Amounts by and . . . . . . . . . . . . . . . . . . . . . . . . . . . . . . . . . . . . . . . . C-l
D: Agency Comments . . . . . . . . . . . . . . . . . . . . . . . . . . . . . . . . . . . . . . D-l

I N T R O D U C T I O N
PURPOSE
To provide baseline data about the ambulance industry and determine how State and local ordinances affect the delivery of ambulance services.
BACKGROUND
Coverage and payment for ambulance services under Medicare depend on a variety of factors including the patient’s medical condition, the equipment used to transport the patient, and the types of personnel rendering services. To help explain these factors, we have included the following scenario.
John Blue, age 72, gets up early one Saturday morning to mow the lawn. He has not been feeling well the last few days and dreads the yard work. He starts the mower, however, and begins to mow. After making the first pass over the lawn, he feels a terrible pressure in his chest, as if someone kicked him. He leaves the mower running and sits down on the lawn. By now, he is pale and is sweating profusely. He then clutches his chest, his vision goes black, and he falls to the ground.
Across the street, Jane Smith is returning from her morning jog and sees Mr. Blue collapse. Jane runs across the street and quickly senses that her neighbor may be in cardiac arrest. She calls 911 for help from her cellular telephone, gives the information to the dispatcher, and starts cardiopulmonary resuscitation (CPR) .
The dispatcher sends emergency medical services teams. Within 2 minutes, the first responders, who are volunteer fire fighters, arrive. They begin two-person CPR. Within another 2 minutes, paramedics arrive by ambulance. They quickly evaluate Mr. Blue’s condition and apply an automatic defibrillator to electrically stimulate the heart. Mr. Blue now has a pulse and is being ventilated with supplemental oxygen. The paramedics administer medication and start an intravenous drip. The paramedics then transport Mr. Blue to Central Hospital. Within minutes of his collapse, Mr. Blue is on his way to the hospital.
We will use this scenario to illustrate Medicare coverage and reimbursement for emergency ambulance services in this report.
‘Scenario adapted from Bryan Bledsoe, Robert Porter, and Bruce Shade, Paramedic Emergency Care, 3rd edition, 1997, p. 18.
1

Medicare Coverage of Ambulance Services
Medicare pays for medically necessary ambulance services, according toSection 1861(s)(7) of The Social Security Act, when “the use of other methods oftransportation is contraindicated by the individual’s condition, but only to the extentprovided in regulations. Health Care Financing Administration (HCFA) regulations statethat ambulance services are covered only if other forms of transportation would endangerthe beneficiary’s health. Medicare does not cover other forms of transportation, such as awheelchair or stretcher van, that could transport patients who do not require ambulanceservices. In the scenario, other forms of transportation may have endangered Mr. Blue’scondition.
Ambulance suppliers* must satisfy State and local requirements to operate within a Stateand must comply with regulations to qualify for Medicare reimbursement. Tomeet definition of an ambulance, each vehicle must (1) be designed specificallyfor transporting the sick or injured; (2) contain a stretcher, linens, first aid supplies,oxygen equipment, and other lifesaving equipment required by State or local ordinances(usually adapted from the General Services Administration KKK-A-1822 standards); and(3) be staffed with personnel trained to provide first aid treatment. The paramedics in thescenario provided emergency medical treatment and then transported the patient to thehospital in an ambulance.
Levels of Ambulance Service
Ambulance suppliers provide two distinct levels of service, advanced life support (ALS) and basic life support (BLS). In order to be considered ALS, the ambulance must be equipped with specialized equipment and medications such as defibrillators and pulmonary/cardiac monitors. The specialized equipment may be permanently mounted or portable in nature. The ALS vehicles also maintain radio-telephone contact with physicians or hospitals.
A more important distinction between ALS and BLS is the personnel who staff the ambulance. In most States, BLS services are rendered by basic and intermediate emergency medical technicians and the more intensive ALS services are rendered by paramedic The ALS services may include:
administering intravenous medications,
defibrillating the patient, and
performing other advanced life support services, such as electrocardiogram monitoring and airway monitoring.
will refer to ambulance companies, services, and providers as “ambulance suppliers.”
2

Currently, ambulance reimbursement is based on the type of ambulance and personnel used (ALS or BLS) and the service status (emergency or non-emergency). In the scenario, the ambulance supplier would bill Medicare for emergency ALS services.
Growth of State Emergency Medical Services Systems
The emergency medical services (EMS) system emerged only in the past 30 years. Prior to the late local fire departments provided most EMS. Fire fighters often had minimal training in emergency procedures, airway management, or other lifesaving techniques. The emphasis was on rapid transportation; the prevailing belief was that care began in the hospital emergency room. Rescue techniques, personnel training, and equipment were rudimentary.
The federal government allocated funds for EMS after publication of a major study on prehospital emergency medical care. In 1966, the National Academy of Science/National Research Council published Accidental Death and Disability: The Neglected Disease of Modern Society. The report suggested developing EMS systems, training prehospital emergency care providers, and upgrading ambulances and their equipment. This led to the enactment of the National Highway Safety Act of 1966 that compelled States to develop EMS systems or lose highway funding. The Emergency Medical Services Act of 1973 funded the development of regional EMS systems. Since 1981, the Consolidated Omnibus Budget Reconciliation Act eliminated all federal funding for EMS except block grants. The Departments of Transportation and Health and Human Services administer these grants.
The EMS system is marked by increased technology and upgraded professional standards for regulating and licensing ambulance vehicles and for training and certifying ambulance
However, regional differences may exist in the frequency and sophistication of prehospital care.
Licensing Vehicles and Certifying Personnel in States
The State EMS Directors oversee (1) inspecting and licensing and (2) testing and certifying emergency medical personnel’ within the States. The organizational structure of these offices varies considerably throughout the country. Some offices are located in the State’s Public Health Department or Department of Health and Human Services, while others are in the Department of Public Safety. A few States have an independent board that proposes regulations and reports directly to the Governor’s office. All State EMS Directors set administrative policies and procedures for vehicle and
pp. 5 and 20.
will refer to registering or permitting ambulance vehicles as “licensing vehicles.”
will refer to credentialing, registering, or licensing EMS personnel as “certifying personnel.
3

personnel standards. The chart below describes the major EMS personnel who provide prehospital medical care to patients.
KEY PLAYERS IN PREHOSPITAL EMERGENCY MEDICAL CARE
A first responder is a police officer, fire fighter, or lay person who has received basic emergency medical training such as CPR and basic airway management in an approved first responder program. This person’s role is to stabilize the patient until the EMT or paramedic arrives. First responders usually do not transport patients.
The following personnel do transport patients:
A basic EMT is currently certified through the U.S. Department of Transportation National Standard Curriculum for basic The person is competent in CPR, airway management, hemorrhage control, fracture stabilization, emergency childbirth, basic extrication (disentanglement), communications, and use of a pneumatic anti-shock garment.
An intermediate EMT is a person who has all the basic EMT skills and is competent in limited advanced life support care (typically intravenous therapy and advanced airway management).
A paramedic EMT is a person with the highest level of training for prehospital providers. The person has all the basic and intermediate EMT skills and is trained in advanced patient assessment, trauma management, pharmacology, cardiology, and other medical emergencies. Paramedics should successfully complete Advanced Cardiac Life Support and Pediatric Advanced Life Support courses as offered by the American Heart Association.
Several States certify various combinations of EMT levels with airway and/or cardiac management, defibrillation, and intravenous therapy.
The HCFA requires at least two trained personnel in the ambulance, one of whom must have first aid training. As shown in the scenario, prehospital emergency care services are rendered by various levels of personnel, from first responders to paramedics. The U.S. Department of Transportation has developed standardized curricula for initial training and recertification of first responders and all three levels of The initial training includes classroom lectures, practical skills laboratory work, and hospital clinical experience. At the advanced levels, training may include a supervised field internship. Continuing education includes refresher courses and periodic in-service skills training. Most States use U.S Department of Transportation curricula to train and certify their
pp. 28-29.

ambulance personnel. The other States enhance these basic curricula with more requirements. (The requirements for initial training, continuing education, and recertification for EMT personnel are described in appendix A.)
Ambulance Industry Consolidation
Until recently, the $7 billion ambulance industry was very Most ambulance suppliers were fire department rescue squads and other public agencies, many operating with only one ambulance. The remaining suppliers were private companies, primarily small “Mom and Pop” firms.’ Several years ago, several large suppliers started acquiring competitors. After years of “consolidation, these suppliers have emerged with a substantial share of the national ambulance market.
Proposed Changes for Medicare Coverage of Ambulance Services
The HCFA is considering proposed regulations to revise Medicare guidelines for ambulance services. Under current HCFA regulations, the type of vehicle and EMS personnel who render medically necessary services determine whether the supplier receives BLS or ALS reimbursement. In the scenario, paramedics treated the patient, transported him to the hospital in an ALS vehicle, and subsequently the ambulance supplier submitted a Medicare claim for ALS reimbursement. Under proposed regulations, HCFA may consider reimbursing suppliers based on the patient’s condition rather than the type of vehicle and personnel used. The final rule may include a waiver for suppliers outside Metropolitan Statistical Areas who might be hurt financially if they use only ALS ambulances. The HCFA may consider several options and may include a special waiver only if HCFA is convinced through overwhelming information of the need for the waiver.
METHODOLOGY
We decided to examine the effect and need for a special waiver based on Metropolitan Statistical Areas and non-Metropolitan Statistical Areas. In addition, we developed baseline information on the number of ambulance suppliers, vehicles, and personnel nationwide. We conducted in-person or telephone interviews in November and December 1996 with 53 State EMS Directors including the 50 States, the District of Columbia, the Commonwealth of Puerto Rico, and the U.S. Virgin Islands. (We will refer to the 53 States and territories collectively as States.) We excluded the Pacific
“‘Ambulance Chasing,” Time Magazine, December 9, 1996, p. 58.
Companies Adapt to Market, Modern Healthcare, May 27, 1996, p. 40.
Magazine, op. cit.
5

Island Trust Territories because of the small number of services rendered during 1995. Using a structured discussion guide, we:
identified State, county, and municipal legislative mandates that require specific levels of ambulance services;
identified the responsibilities of the EMS office for inspecting and licensing ambulance vehicles and training and certifying ambulance personnel;
obtained data on the number of ambulance suppliers currently operating within each State;
obtained data on the number of ambulance vehicles licensed in 1995 and 1996 by type of vehicle; and
obtained data on the number of personnel certified in 1995 and 1996.
We analyzed the 1995 universe of ambulance claims to determine the distribution of allowed claims by and for the 53 EMS States. We also reviewed financial analyst reports and articles on the ambulance industry.
This report is the first in a series on Medicare ambulance services prepared by the Office of Inspector General.
6

F I N D I N G S
MEDICARE AMBULANCE COSTS AND SERVICES ARE SKYROCKETING
The cost of Medicare ambulance services has skyrocketed over an period. Between 1987 and 1995, Medicare allowances increased from $602 million to almost $2.0 billion. The graphic below shows the 229.1 percent increase.
2 . 1 $
1 . 8
1987 1994 1995
Year
The number of ambulance personnel, vehicles, and services provided also is increasing dramatically. According to the States, between 1995 and 1996, licensed vehicles increased from approximately 28,000 to more than 45,000 (60.7 percent increase) and certified ambulance personnel increased from approximately 427,000 to nearly 7 15,000 (67.4 percent increase). (See appendix B for further detail.) According to HCFA, the number of services increased from 7.2 million in 1994 to 7.4 million in 1995.
More than four out of five Medicare ambulance services are provided in In 1995, this translated to about 6 million of the 7.5 million services rendered in These services represented about $1.6 billion of Medicare payments. Almost half of the services
define an ambulance “service” as a one-way or round-trip ambulance service provided on a single date by a supplier.
7

in are BLS services. The table below shows the breakdown of national expenditures by type of service for and
1995 National Expenditures for Ambulance Services
Category/Type of Service
Cannot determine ALS or BLS
SUBTOTAL
Virgin Islands (not categorizedinto MSA/non-MSA)
Zip code outside United States, Puerto Rico, and Virgin Islands
Cannot determine location of zip code
TOTALS
19.1 17.3
230 0.0 $66,423 0.0
101 0.0 $33,604 0.0
7,883 0.1 0.1
100.0 100.0
AMBULANCE SERVICE IS A GROWTH INDUSTRY CONTROLLED BY A FEW MAJOR CORPORATIONS
Beginning in 1991, several large ambulance suppliers started consolidating the industry by acquiring competitors, large and small. By the end of 1996, three major suppliers had emerged with at least 20 percent of the national private ambulance market. American Medical Response (AMR), after absorbing 75 competitors in 4 years, now operates in
“The total amounts and percents may not exactly equal the sums of individual amounts and percents because of rounding.
8

28 States with annual revenues of more than $500 million. a subsidiary of the Toronto-based Inc., grew ten-fold into at least a $500 million operation in 23 States. Rural/Metro, operating in 14 States, increased its revenues 46 percent to $250 million. In January 1997, announced that it will purchase AMR and merge it with estimates that it then will have about 14 percent of the U. S . ambulance market.
The EMS Directors in 41 of the 53 States (or 77.4 percent) noted that three large corporations are buying out small private ambulance companies in their States. The three major corporations--Laidlaw, AMR, and Rural/Metro--are located in all 41 primary and shared State markets. Many factors are combining to favor consolidation and to insure the growth of the ambulance industry and the costs of ambulance services:
The aging of the U.S. population is likely to increase the total number of ambulance services per year, both emergency and non-emergency.
Rapidly advancing technology and skills are expanding the range of procedures that can be performed by ambulance personnel, thereby increasing the average revenue per service.
Privatization of municipal emergency response and fire protection services may increase as cities and towns contract with ambulance suppliers. Financial analysts expect this to overcome a counter “reverse privatization” trend where municipal fire departments take over emergency services in addition to providing first response.
Increasingly, volunteer municipal rescue squads, which have been providing essentially free ambulance services, will bill Medicare and other third party insurers for their costs.
Growing economies of scale for regionally dominant ambulance suppliers will take market share from smaller firms. These economies are a result of the minimum staffing and response time requirements for EMS services and the cost of purchasing and maintaining a fleet of ambulances and dispatching operations. By combining contiguous operations, a larger player is able to consolidate dispatching and eliminate duplicate ambulance units.
Increasing the need for non-emergency interfacility ambulance services will result from managed care plans discharging their members from hospitals sooner into less expensive alternative care sites.
on market share are based on financial analyst reports about the ambulance industry copyrighted by The Investext Group 1996; State EMS Directors reported State coverage by consolidators.
New York Times, January 7, 1997, p. C-2.
9

Increasing use of non-emergency or scheduled ambulance service, especially among large ambulance corporations, will continue. Only 11 States license other health care vehicles, such as wheelchair vans. In other States, these vehicles are licensed by the same agencies that inspect and license taxicabs. Although these 11 States licensed 4,158 wheelchair vans and other vehicles in 1996, these vehicles represent only about 9.2 percent of all licensed patient transportation vehicles.
The map and chart on the next page show the State EMS Directors’ responses about the extent of ambulance corporations nationwide.
10

National Ambulance Transportation Corporations and their 41 Primary and Shared State Markets
AMR only
AMR and other
Other
iz None
With the merger of AMR and the new AMR (AMR, MEDTRANS, and will have a major presence in 19 STATES and operate in 16 other STATES. RURAL/METRO will maintain a presence in 2 STATES and operate in 12 other STATES, including 10 with AMR. 2 STATES have corporations other than AMR and RURAL/METRO, and 12 STATES have no known corporations.

ALL STATES REGULATE AMBULANCE SERVICES; HOWEVER, LESS THAN HALF MANDATE LEVELS OF SERVICE AND ONLY ONE REQUIRES ADVANCED LIFE SUPPORT
All States have administrative codes and regulations that set standards for ambulance services. The codes and regulations set requirements for licensure, certification, and recertification of ambulance suppliers, vehicles, and personnel to operate within the States. Four States require ambulance suppliers to apply for a certificate of need and appear at a hearing to justify the need for their services. Suppliers can operate within these States only after receiving the certificate of need.
Nationally, 21 of the 53 States legislatively mandate a minimum level of ambulance services. Of these, Hawaii is the only State that requires ALS services. The other 20 States require “at least” BLS services. Often the mandates are described as minimum levels of trained personnel who attend patients. For example, to provide BLS services, most States require at least two personnel in the vehicle, with one EMT (basic or intermediate) in the back with the patient. The remaining 32 of the 53 States do not legislatively mandate a minimum level of ambulance services.
Approximately 11 percent of localities mandate minimum standards for ambulance services. Throughout our interviews, respondents emphasized that almost all localities voluntarily exceed the minimum State standards by providing BLS and ALS services. As an example, an EMS Director mentioned, “Though we do not have a State law mandating any level of ambulance services, ALS services are available to 98 percent of our population.
Another 11 percent of localities contract for ambulance services using general tax revenues. State EMS Directors noted that a locality may solicit bids for BLS and ALS services and use tax revenues to finance the contracts. Of the localities with contracts, about 44 percent contract for BLS services and 40 percent contract for ALS services.
ONLY TWO STATES USE METROPOLITAN STATISTICAL AREAS TO DESIGNATE AMBULANCE SERVICE AREAS
Of the 53 States, 5 1 (or 96.2 percent) do not define their ambulance service areas as MSA and non-MSA. The State EMS Directors define the service areas by (1) counties, (2) naturally-occurring population densities, or (3) suppliers’ areas of coverage when they initially apply to provide services.
The significance is that HCFA may consider a waiver exception in the proposed ambulance regulations based on an MSA/non-MSA designation. A waiver may allow non-MSA suppliers to demonstrate financial hardships resulting from lower BLS reimbursement because they operate with ALS vehicles and personnel only. Some State EMS Directors believe that most non-MSA suppliers in their States would apply for a waiver. For example, one Director believes that most of his 275 suppliers would apply for waivers.
12

If HCFA considers and includes a waiver exception in any proposed ambulance regulations, this exception may have a financial impact on Medicare reimbursement. The table on page 8 shows that HCFA allowed about $342.8 million (or 17.3 percent) in
for ambulance services nationally in 1995. The breakdown was about $185.7 million for ALS services and $134.0 million for BLS services (we cannot determine the exact level for about $23.1 million of services). If the waiver exception is based on an MSA or non-MSA designation and all non-MSA suppliers qualified for waivers, HCFA would continue to allow at least $185.7 million annually in ALS reimbursement. Furthermore, a portion of the current BLS allowed services may be billed and allowed at the higher ALS level assuming suppliers with waivers converted their programs to provide ALS services only.
13

R E C O M M E N D A T I O N
Previous Office of Inspector General studies have recommended that HCFA base reimbursement on the patient’s condition rather than the type of vehicle and personnel used. We continue to support this recommendation. In addition, HCFA should:
re-evaluate its proposal to use the Metropolitan Statistical Area/non-Metropolitan Statistical Area designation as the basis for granting waivers when determining a waiver policy in its final rule on ambulance coverage.
We have included national and State baseline ambulance data in appendices B and C for HCFA’s information and analysis.
AGENCY COMMENTS
We received comments on the draft report from the Assistant Secretary for Management and Budget (ASMB) and HCFA. The HCFA concurred with the general findings and recommendation of our draft report. Since we released the draft report, HCFA published the Notice of Proposed Rulemaking for Medicare ambulance services on June 18, 1997. The proposal includes two options for a waiver provision for suppliers in non-Metropolitan Statistical Area designations.
Both HCFA and ASMB stated that HCFA had not yet decided which option, if any, it would use to grant waivers. Based on these agency comments, we modified the recommendation on the Metropolitan Statistical Area/non-Metropolitan Statistical Area by making an explicit reference to HCFA’s proposed rule. We also made changes based on HCFA’s technical comments.
The full text of each agency’s comments appears in appendix D.
14

A P P E N D I X A
EMERGENCY MEDICAL SERVICES TRAINING REQUIREMENTS FOR AMBULANCE PERSONNEL
Since the the National Highway Traffic Safety Administration of the U.S. Department of Transportation (DOT) has provided National Standardized Curricula for prehospital EMS personnel. Most States have incorporated these DOT standards into their certification requirements for emergency medical technicians All curricula allow students to gain the knowledge, skills, and attitude necessary to be a competent, productive, and valuable member of the EMS team. Courses are designed to instruct students to serve as a vital link in the chain of the health care team. Training includes all skills necessary for to provide emergency medical care at the BLS or ALS level with an ambulance or other specialized service. All States require continuing education and recertification for EMS personnel at all levels. Specific courses and refresher skills vary among States.
In addition to requirements summarized below, DOT also has curricula for EMS dispatchers and emergency vehicle operators.
FIRST RESPONDERS
The first responder is the first individual who arrives at the scene regardless of the individual’s certification. It is the goal of the DOT First Responder: National Standard Curriculum to provide students with the core knowledge, skills, and attitudes to a limited amount of equipment to perform initial assessment and intervention, and assist other EMS providers. The DOT course provides an introduction to these concepts and an orientation to the specific systems and services with which the first responder will be affiliated. This level of provider is not intended to be utilized as the minimum staffing for an ambulance. Enrichment programs and continuing education help fulfill other specific needs for first responder training.
Twenty-two States report that they currently certify first responders or have plans to do so shortly.
BASIC EMT
The core curriculum is presented within a 1 lo-hour training program. The basic EMT works with other health care professionals to deliver professional prehospital emergency medical care. After successfully completing the program, the student is capable of performing the following functions at the minimum entry level:
Recognize the nature and seriousness of the patient’s condition or extent of injuries to assess requirements for emergency medical care;
A - l

Administer appropriate emergency medical care based on assessment findings of the patient’s condition;
Lift, move, position, and otherwise handle the patient to minimize discomfort and prevent further injury; and,
Perform safely and effectively the expectations of the job description.
Twenty-four States require the basic DOT course, 12 States require 120 hours, and the remaining 17 States require more than 120 hours of training.
INTERMEDIATE EMT
The intermediate EMT course includes basic EMT skills and training in specific medical management skills. These skills include the use of 12-lead electrocardiogram machines, airway management by endotracheal intubation and defibrillating life-threatening arrhythmias, plus the provision of certain intravenous medications.
The intermediate EMT training requirements vary widely. Ten States do not certify this EMT level. For the other 43 States, additional training ranges from 27 to 300 hours.
PARAMEDIC EMT
As the highest-trained prehospital emergency care person in the EMS system, the paramedic concentrates on the care and well-being of the patient. Paramedics must complete from 500 to more than 1,800 hours of training beyond the other EMT levels. Paramedics must complete training in advanced medical techniques, such as transcutaneous cardiac pacing, drug therapy, chest decompression, gastric tube placement, and the administration of a large range of medications.
Minimum training requirements for paramedics vary substantially from State to State. Thirty-two States require less than 900 hours, 16 States require between 900 and 1,400 hours, and 5 States do not specify the minimum hours.
A - 2

A P P E N D I X B
NUMBER OF AMBULANCE SUPPLIERS, VEHICLES, AND PERSONNEL FOR 1995 AND 1996
During the interviews with EMS Directors, we obtained data on the number of services, licensed ambulance vehicles by type, and the number of ambulance personnel by type of certification. While most States had some data available, many do not have computerized databases and keep cumulative counts of services, vehicles, and personnel only.
PLEASE NOTE:
For States with available data, EMS Directors stated that 18,523 ambulance suppliers operate in the 53 States as of December 1996.
For the number of licensed ambulance vehicles:
10 of the 53 States (18.9 percent) did not have statistics available for 1995. 4 of the 53 States (7.5 percent) did not have statistics available for 1996. 5 of the 53 States (9.4 percent) did not have statistics available for both years.
For the number of certified ambulance personnel, many States could not provide separate statistics for both years. They did, however, provide cumulative statistics for 1996.
The percents of vehicles and personnel may not total 100.0 percent due to rounding.
B - l

LICENSED AMBULANCE VEHICLES
VEHICLE TYPE
1995 1996
Vehicles Percent Vehicles Percent
ALS-only vehicle 9,284 33.4 14,773 32.6
BLS-only vehicle 7,337 26.4 10,580 23.4
vehicle 7,266 26.1 12,363 27.3
Rescue vehicle I 548 I 2.0 I 918 I 2.0
Fire trucks I 974 I 3.5 I 1,925 I 4.3
Air ambulances (fixed wing and rotor)
Water/Marine ambulances
286 1.0 570 1.3
6 0.02 6 0.01
Wheelchair vans
Other health care vehicles
807 2.9 954 2.1
1,305 4.7 3,204 7.1
TOTALS I 27,813 I 100.0 I 45,293 I 100.0
CERTIFIED AMBULANCE PERSONNEL
PERSONNEL TYPE
*NOTE: These statistics include the cardiac technician and other advanced level personnel between the basic and paramedic levels.

A P P E N D I X
BREAKDOWN OF 1995 AMBULANCE SERVICES AND ALLOWED AMOUNTS BY AND
The following tables display the number of services and allowed amounts for 1995 Medicare ambulance services, broken out by Metropolitan Statistical Area (MSA) and type of service, for each of the 50 States, the District of Columbia, the Commonwealth of Puerto Rico, and the U.S. Virgin Islands. In these tables, the total amounts and percents may not exactly equal the sums of individual amounts and percents because of rounding. We defined a “service” as a one-way or round-trip ambulance service provided on a single date by a single supplier.
ALABAMA
Category/Type of Service
Cannot
Cannot determine ALS or BLS
SUBTOTAL
TOTALS
47,894 29.7 31.8
161,069 100.0 100.0
C - l

ALASKA
Cannot determine ALS or BLS
ARIZONA
non-MSA Cannot determine ALS or BLS
SUBTOTAL 8,926 14.4 20.5
TOTALS 62,178 100.0 100.0
c - 2

- ARKANSAS
Category/Type of Service
MSA
non-MSA
ALS
BLS
Cannot determine ALS or BLS
SUBTOTAL
ALS
BLS
Cannot determine ALS or BLS
SUBTOTAL
TOTALS
Category/Type of Service
MSA
non-MSA
ALS
BLS
Cannot determine ALS or BLS
SUBTOTAL
ALS
BLS
Cannot determine ALS or BLS
SUBTOTAL
TOTALS
t --
t -
Services
Number Percent
37,577 45.9
36,159 44.1
739 0.9
CALIFORNIA
Services
553,863 96.2
14,045 2.4
1,872 0.3
40.6
$707,472 2.4
$229,112 0.8
43.7
49.5
5.7
Medicare Allowed Amount
Amount Percent
45.8
42.7
6.3
94.7
1.0
0.8
c - 3

COLORADO
Category/Type of Service
ALS
BLS
MSA Cannot determineALS or BLS
SUBTOTAL
ALS
BLS
non-MSA Cannot determineALS or BLS
SUBTOTAL
TOTALS
Services
Number Percent
22,162 44.3
17,058 34.1
2,438 4.9
41,658 83.3
4,234 8.5
3,694 7.4
414 0.8
8,342 16.7
50,000 100.0
CONNECTICUT
Medicare Allowed Amount
Amount Percent
48.6
28.2
6.8
83.6
9.7
$835,641 5.6
$173,425 1.2
16.4
100.0
Category/Type of Service Services Medicare Allowed Amount
Number Percent Amount Percent
Cannot determine
Cannot determineALS or BLS
SUBTOTAL
TOTALS
c - 4

DELAWARE
Category/Type of Service
Cannot determine ALS or BLS
DISTRICT OF COLUMBIA
Category/Type of Service Medicare
Cannot determine ALS or BLS
SUBTOTAL 0 0.0 $0 0.0
TOTALS 18,568 100.0 100.0
C - 5

- FLORIDA
MSA
Category/Type of Service
ALS
BLS
Cannot determine ALS or BLS
SUBTOTAL
non-MSA
ALS
BLS
Cannot determine ALS or BLS
SUBTOTAL
TOTALS
t -
Services
Number Percent
Medicare Allowed Amount
Amount Percent
2.0
383,830 93.6 1 93.7
8,208 2.0
611 0.1
1 6.3
100.0
- GEORGIA
Category/Type of Service
MSA
non-MSA
ALS
BLS
Cannot determine ALS or BLS
SUBTOTAL
ALS
BLS
Cannot determine ALS or BLS
SUBTOTAL
TOTALS
E
t -
Services
Number Percent
149,345 69.0
36,594 16.9
27,973 12.9
Medicare Allowed Amount
Amount Percent
33.5
30.0
4.6
68.2
18.9
11.1
C - 6

HAWAII
Services Medicare Allowed Amount
Amount Percent
41.0
$228,011 8.7
$50,582 1.9
51.6
$484,911 18.4
$693,336 26.4
Category/Type of Service Number Percent
-
6,357 1 58.3
834 7.6
ALS
BLS
Cannot determine ALS or BLS
SUBTOTAL
ALS
BLS
Cannot determine ALS or BLS
SUBTOTAL
MSA 80 0.7
7,271 66.7
2,875 1 26.4
340 1 3.1
non-MSA 418 3.8
3.633 1 33.3
10,904 I 100.0TOTALS
IDAHO
Services Medicare Allowed Amount
Amount PercentCategory/Type of Service
Number Percent
2,310 1 15.5 ALS
BLS
Cannot determine ALS or BLS
SUBTOTAL
ALS
BLS
Cannot determine ALS or BLS
SUBTOTAL
3.091 20.7
0 9130 1
5,531 37.1
MSA $41,682 1.5
II
I 35.3 11
2,627 1 17.6
6,306 42.3
non-MSA $122,636 4.3
II460 3.1
9,393 62.9
14,924 1 100.0TOTALS
.
c - 7

ILLINOIS
Category/Type of Service
MSA
--
non-MSA
ALS
BLS
Cannot determine ALS or BLS
SUBTOTAL
ALS
BLS
Cannot determine ALS or BLS
SUBTOTAL
TOTALS
MSA
Category/Type of Service
ALS
BLS
Cannot determine ALS or BLS
SUBTOTAL
non-MSA
ALS
BLS
Cannot determine ALS or BLS
SUBTOTAL
TOTALS
Services
Number Percent
L 22,207 5.7
318,997 81.3
15,715 4.0
53,848 13.7
INDIANA
Services
94,311 73.0
11,520 8.9
22,678 17.6
Medicare Allowed Amount I
Amount Percent
24.7
51.9
I
83.5
I 1.3
II
1 16.5 11
100.0 II
Medicare Allowed Amount
Amount Percent
32.3
39.5
$484,387 2.1
73.8
11.4
13.8
;
C - 8

IOWA
Category/Type of Service
Cannot determine
KANSAS
Category/Type of Service Medicare
Cannot determineALS or BLS 1,668 2.8 $644,920 4.4
SUBTOTAL 29,573 49.6 46.7
TOTALS 59,608 100.0 100.0
c - 9

KENTUCKY
Category/Type of Service
Cannot determine ALS or BLS
SUBTOTAL
TOTALS
85,533 50.3 52.9
170,198 100.0 100.0
LOUISIANA
Category/Type of Service
ALS
BLS
MSA Cannot determineALS or BLS
SUBTOTAL
ALS
BLS
non-MSA Cannot determine ALS or BLS
SUBTOTAL
TOTALS
Services Medicare Allowed Amount
Number Percent Amount Percent
49,309 35.2 39.5
48,418 34.6 26.5
5,703 4.1 5.7
103,430 73.9 71.7
20,593 14.7 18.3
14,327 10.2 8.1
1,554 1.1 $884,974 1.9
36,474 26.1 28.3
139,904 100.0 100.0
c - 10

MAINE
Category/Type of Service Services Medicare Allowed Amount
Number Percent Amount Percent
MSA
ALS 9,700 21.1 22.6
BLS 15,398 33.5 26.5
Cannot determineALS or BLS 1,193 2.6 $396,832 3.3
SUBTOTAL 26,291 57.1 52.3
non-MSA
ALS 6,905 15.0 20.2
BLS 11,245 24.4 22.8
Cannot determineALS or BLS 1,584 3.4 $576,818 4.7
SUBTOTAL 19,734 42.9 47.7
TOTALS 46,025 100.0 100.0
MARYLAND
Category/Type of Service
Cannot determine
Cannot determineALS or BLS
SUBTOTAL
TOTALS
262 0.2 $50,464 0.1
11,732 7.5 7.1
157,464 100.0 100.0
c- 11

MASSACHUSETTS
Category/Type of Service
MSA
-
non-MSA
ALS
BLS
Cannot determine ALS or BLS
SUBTOTAL
ALS
BLS
Cannot determine ALS or BLS
SUBTOTAL
TOTALS
Category/Type of Service
MSA
non-MSA
ALS
BLS
Cannot determine ALS or BLS
SUBTOTAL
ALS
BLS
Cannot determine ALS or BLS
SUBTOTAL
TOTALS
Services
358,838 99.8
55 0.0
532 0.1
MICHIGAN
Services
250,170 86.9
18,950 6.6
Medicare Allowed Amount
Amount Percent
17.8
79.4
2.6
99.8
$196,227 0.1
$79,913 0.1
Medicare Allowed Amount II
Amount Percent
45.0
36.8 11
I 3.2 II
1 84.9 11
1 9.9 II 4.3 II
0.9 1$617,463 1
1 15.1
100.0 II

- MINNESOTA
MSA
Category/Type of Service
ALS
BLS
Cannot determine ALS or BLS
SUBTOTAL
non-MSA
ALS
BLS
Cannot determine ALS or BLS
SUBTOTAL
TOTALS
Category/Type of Service
MSA Cannot determine ALS or BLS
SUBTOTAL
non-MSA
ALS
BLS
Cannot determine ALS or BLS
SUBTOTAL
TOTALS
t --
t -
Services
Number Percent
33,804 64.3
5,669 10.8
11,984 22.8
MISSISSIPPI
Services
36,158 48.8
18,177 24.5
18,544 25.0
Medicare Allowed Amount
$850,768 I
5.5
1 65.0 11
17.2
14.0
$590,803 3.8
35.0
100.0 II
$13.513.552 56.6 11
1 58.7
1 27.9 11
1 11.5 11
1.9 1$459,441 /
1 41.3
1 100.0 II
c - 13

MISSOURI
Category/Type of Service
ALS
BLS
MSA Cannot determineALS or BLS
SUBTOTAL
ALS
BLS
non-MSA Cannot determineALS or BLS
SUBTOTAL
TOTALS
Services Medicare Allowed Amount
Number Percent Amount Percent
58,306 42.8 49.8
34,106 25.1 19.7
2,089 1.5 $899,727 2.4
94,501 69.4 71.9
30,755 22.6 22.2
9,408 6.9 4.6
1,445 1.1 $495,693 1.3
41,608 30.6 28.1
136,109 100.0 100.0
MONTANA
Category/Type of Service
Cannot determine
Cannot determineALS or BLS
SUBTOTAL
TOTALS
918 7.6 $334,007 11.2
8,832 73.3 70.6
12,047 100.0 100.0
c - 14

NEBRASKA
Category/Type of Service
NEVADA
non-MSA Cannot determine ALS or BLS
112 0.6 $138,071 1.8
SUBTOTAL 2,666 13.2 $998,073 13.3
TOTALS 20,257 100.0 100.0
c - 15

NEW HAMPSHIRE
Category/Type of Service Services Medicare Allowed Amount
Number Percent Amount Percent
MSA
ALS 5,714 18.3 23.3
BLS 14,860 47.5 41.2
Cannot determineALS or BLS 933 3.0 $325,645 4.0
SUBTOTAL 21,507 68.7 68.5
non-MSA
ALS 2,916 9.3 $909,306 11.1
BLS 6,531 20.9 19.0
Cannot determineALS or BLS 351 1.1 $119,091 1.4
SUBTOTAL 9,798 31.3 31.5
TOTALS 31,305 100.0 100.0
NEW JERSEY
Category/Type of Service
Cannot determineALS or BLS
SUBTOTAL
TOTALS
0 0.0 $0 0.0
0 0.0 $0 0.0
236,896 100.0 100.0
C - 16

NEW MEXICO
Category/Type of Service
Cannot determine ALS or BLS
NEW YORK
non-MSA Cannot determineALS or BLS 1,176 0.2 $529,448 0.4
SUBTOTAL 31,201 6.0 6.5
TOTALS 522,924 100.0 100.0
c - 17

NORTH CAROLINA
Category/Type of Service
Cannot determine
NORTHDAKOTA
Cannot determine ALS or BLS
SUBTOTAL
TOTALS
8,084 68.1 62.9
11,879 100.0 100.0
c - 18

Category/Type of Service
Cannot determine ALS or BLS
SUBTOTAL
TOTALS
65,699 17.0 12.9
387,460 100.0 100.0
OKLAHOMA
Category/Type of Service
ALS
BLS
MSA Cannot determineALS or BLS
SUBTOTAL
ALS
BLS
non-MSA Cannot determine ALS or BLS
SUBTOTAL
TOTALS
Services Medicare Allowed Amount
Number Percent Amount Percent
30,114 36.8 45.5
9,060 11.1 6.6
4,679 5.7 7.2
43,853 53.6 59.3
19,667 24.0 29.3
16,745 20.5 8.9
1,587 1.9 $655,936 2.5
37,999 46.4 40.7
81,852 100.0 100.0
c - 19

OREGON
Category/Type of Service
MSA
non-MSA
ALS
BLS
Cannot determine ALS or BLS
SUBTOTAL
ALS
BLS
Cannot determine ALS or BLS
SUBTOTAL
TOTALS
Services
Number Percent
27,578 66.7
9,454 22.9
280 0.7
Medicare Allowed Amount
Amount Percent
60.2
6.8
$173,276 0.9
67.9
26.1
$148,001 0.8
PENNSYLVANIA
Category/Type of Service
MSA
non-MSA
ALS
BLS
Cannot determine ALS or BLS
SUBTOTAL
Amount Percent
27.2
59.2 11
2.0 II
88.4
ALS
BLS
Cannot determine ALS or BLS
SUBTOTAL
1 4.1 II
0.3 1$537,124 /
11.6
TOTALS 664,507 100.0 1 100.0 II
Services Medicare Allowed Amount II
c - 20

PUERTO RICO - -Category/Type of Service
MSA
-
non-MSA
ALS
BLS
Cannot determine ALS or BLS
SUBTOTAL
ALS
BLS
Cannot determine ALS or BLS
SUBTOTAL
TOTALS
Category/Type of Service
MSA
non-MSA
ALS
BLS
Cannot determine ALS or BLS
SUBTOTAL
ALS
BLS
Cannot determine ALS or BLS
SUBTOTAL
TOTALS
--
Services
Number Percent
46,154 91.3
50 0.1
4,346 8.6
RHODE ISLAND
Services
Number Percent
44,675 100.0
0 0.0
0 0.0
f --
t -
Medicare Allowed Amount
Amount Percent
$64,483 0.7
89.6
$43,348 0.4
90.6
$16,943 0.2
$12,077 0.1
Medicare Allowed Amount II Amount Percent
23.4
74.9 11
$187,016 I 1.6 II
100.0 II
I II I II
1
1 100.0 II
c - 21

SOUTH CAROLINA
Category/Type of Service
Cannot determine
SOUTH DAKOTA
non-MSA Cannot determine ALS or BLS
215 1.5 $55,517 2.3
SUBTOTAL 11,432 79.0 81.0
TOTALS 14,468 100.0 100.0
c - 22

TENNESSEE
Category/Type of Service
TEXAS
non-MSA Cannot determineALS or BLS 5,935 1.4 2.3
SUBTOTAL 87,151 20.0 20.4
TOTALS 435,893 100.0 100.0
C - 23
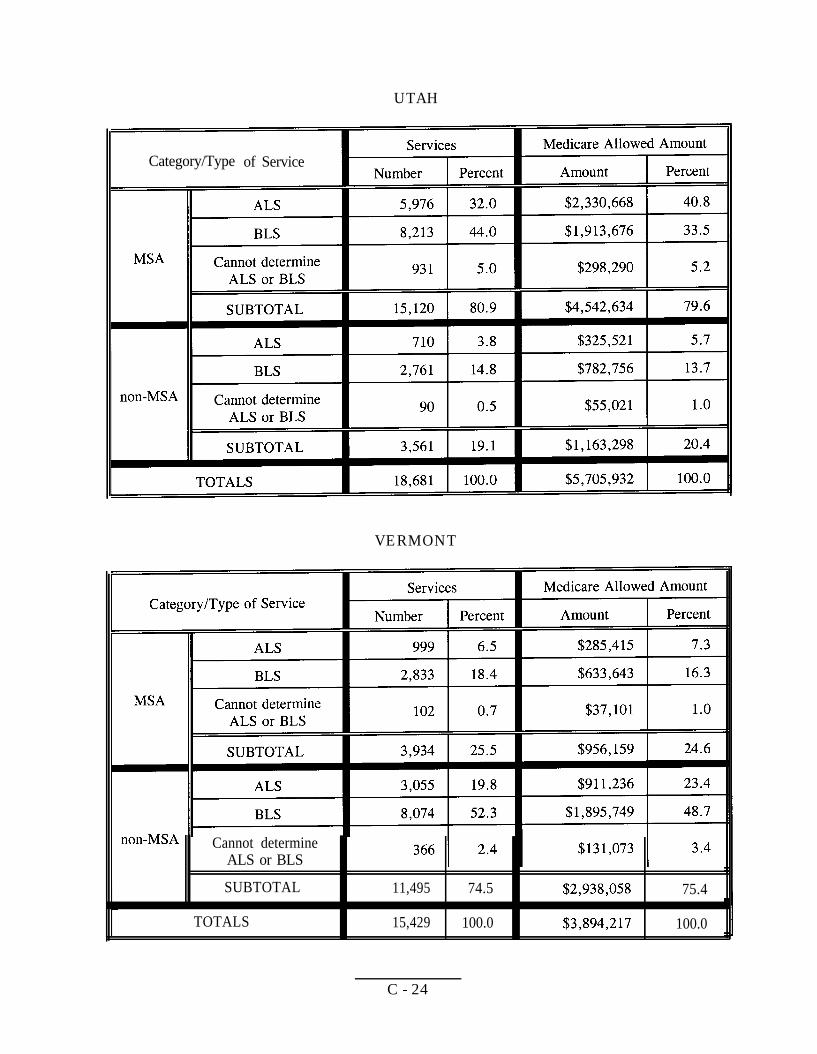
UTAH
Category/Type of Service
VERMONT
Cannot determine ALS or BLS
SUBTOTAL 11,495 74.5 75.4
TOTALS 15,429 100.0 100.0
C - 24

VIRGIN ISLANDS
Type of service
ALS
BLS
Cannot determine ALS or BLS
Services Medicare Allowed Amount
Number Percent Amount Percent
30 13.0 $8,329 12.5
198 86.1 $53,034 79.8
2 0.9 $5,060 7.6
TOTALS 230 100.0 $66,423 100.0
This table combines the MSA and non-MSA data, because the Virgin Islands have not been categorized into MSA and non-MSA areas.
VIRGINIA
Category/Type of Service
Cannot determine ALS or BLS
SUBTOTAL
TOTALS
30,772 27.3 29.9
112,810 100.0 100.0
c - 25

WASHINGTON
Category/Type of Service
MSA
-
non-MSA
ALS
BLS
Cannot determine ALS or BLS
SUBTOTAL
ALS
BLS
Cannot determine ALS or BLS
SUBTOTAL
TOTALS
Services
Number Percent
65,397 77.8
9,329 11.1
8,692 10.3
Medicare Allowed Amount
Amount Percent
34.1
39.3
$644,412 2.5
75.9
14.5
;
WEST VIRGINIA
Category/Type of Service
MSA
ALS
BLS
Cannot determine ALS or BLS
SUBTOTAL
1 17.1 11
1 18.8 11
$249,986
37.3 11
ALS
BLS
Cannot determine ALS or BLS
SUBTOTAL
17.213 1 16.6
61,798 59.5 62.7 11
TOTALS 103,834 100.0 100.0 11
non-MSA
Services
Number I Percent
C - 26

WISCONSIN
Category/Type of Service
MSA
-
I I
non-MSA
ALS
BLS
Cannot determine ALS or BLS
SUBTOTAL
ALS
BLS
Cannot determine ALS or BLS
SUBTOTAL
TOTALS
MSA
Category/Type of Service
ALS
BLS
Cannot determine ALS or BLS
SUBTOTAL
non-MSA
ALS
BLS
Cannot determine ALS or BLS
SUBTOTAL
TOTALS
Services
86,640 76.0
5,538 4.9
19,770 17.4
WYOMING
Services
Number Percent
1,517 27.0
2,148 38.2
1,838 32.7
Medicare Allowed Amount
Amount Percent
$163,440 11.6
$153,452 10.9
$46,695 3.3
$363,587 25.9
$658,828 46.9
$339,937 24.2
21.4
48.9
8.3
78.6
7.3
11.3
$703,751
Jl
C - 27

A P P E N D I X D
AGENCY COMMENTS
The full text of comments received from the Health Care Financing Administration and the Office of the Assistant Secretary for Management and Budget follows.
D - l

Comments from the Health Care Financing Administration
DEPARTMENT OF HEALTH HUMAN SERVICES Health Care
C .
To: June Gibbs Brown General
SUBJECT: of Inspector General (OIG) Draft Report: “State Ambulance Policies and Services,”
We have reviewed the above-referenced report, which discusses coverage of services and proposes changes to Medicare’s payment policies. The report is
one of a series of OIG reports concerning Medicare coverage and payment for ambulance services. Previous studies conducted recommended that reimbursement be based on the patient’s medical condition rather the type of and personnel used in providing an ambulance service. As the report indicates, the Care Financing Administration (HCFA) proposed this reimbursement change, along with a proposal to consider waivers in certain non-Metropolitan Statistical Areas in a Notice of Proposed issued in June of 1997.
As report suggests, and payment for ambulance services under Medicare depend on a variety of factors, including the patient’s medical condition, the used to transport patient, and the type of personnel rendering services. Medicare pays for medically necessary ambulance under section 186 of the Social
Act, when “the use of other methods of transportation is by the individual’s condition, but only to the provided in regulations.”
The OIG report explains that Medicare ambulance costs and services (defined as a way or round-trip ambulance service provided on a single date) have increased
over past eight years. Between 1987 and 1995, Medicare allowances increased million to almost billion. The number of ambulance personnel, vehicles, and services provided also increased. The determined that more than four out of five Medicare ambulance are provided in These alone represent about 1.6 billion in Medicare payments.
D - 2

Page Two
OIG continues to support its prior recommendation that HCFA base reimbursement for ambulance services on the patient’s medical condition rather than the type of
used. OIG also recommends that HCFA rc-evaluate the use of the MSA designation as a possible basis for waivers to this payment policy.
HCFA concurs all OIG recommendations. Our detailed are as follows:
OIG Recommendation
HCFA should base reimbursement on the patient’s medical condition rather than the type of and personnel used.
HCFA
We concur. HCFA agrees with the general findings and recommendations suggested in this OIG report and is considering how best to and implement them.
On June 17, 1997. HCFA published in the Federal a Notice of Proposed addressing several of the issues raised by the OIG report about
coverage and payment for ambulance The was based on the work of convened by which worked with representatives the ambulance industry in developing the proposed rule. In addition to proposing that payment for ambulance services be based on the medical condition of the the NPRM included several other proposals to update and Medicare’s ambulance policies, and solicited comments in all of these areas.
In August 1997, after publication of NPRM, the President signed into law the Balanced Budget Act of 1997 (BBA), which included a mandate to develop a schedule for ambulance services through negotiated to take by January
A number of members of subsequently raised concerns about whether the proposal the NPRM to base payment on the medical condition would
with payment issues to be addressed in the fee schedule regulation and urged HCFA to incorporate this proposal into the negotiated mandated by the BBA.
In addition, HCFA received approximately 2,270 public comments in response to the NPRM, and is reviewing those comments. HCFA plans to proceed further development of the proposals, including the change payment recommended by OIG. However, in view of the BBA and Congressional
D - 3

Page Three
concerns, we are how best the proposed policy to base reimbursement on patient’s medical condition.
Recommendation
HCFA reevaluate the use of the designation as the basis for granting waivers.
We concur. The main issue addressed by the report is consideration of a possible waiver procedure for the proposed new ambulance rule included in the which would base ambulance reimbursement levels on medical condition of the patient rather than on the type of and personnel used.
In discussions about this proposal, some representatives of the industry voiced concerns that this policy could have a negative impact on a supplier’s
to serve communities with small populations. Some representatives argued that, in areas where it is not economical to operate both basic life support (BLS) ambulances and advanced support (ALS) ambulances, the policy cause some suppliers to go out
discussions led to solicit comments in the interested on the need for an exception to the proposed and the areas and
type of suppliers to which such an exception might apply. The NPRM specifically described two options being considered if an exception were determined to be warranted. one of which (identified as the option) would have been available only in MSA areas. However, it is important to note that HCFA has not decided to adopt an at aud if so, whether waivers should be based on a non-MSA designation. HCFA specifically invited comments (which were due on August 18.1997) on other waiver options not included iu the and is reviewing those comments.
Technical
baram& This short entitled Consolidation” seems incomplete. While it tells us what the industry looked “until recently,” it does not say how the industry has consolidated, as the title implies (e.g., what it looks now).
D - 4

Page Four
13:The report concludes that, if a waiver were to be based on a non-MSA designation, “HCFA would continue to allow at least $185.7 million in
According to data, this is the amount in 1995 for ALS in The conclusion appears to assume that
every non-MSA would for a waiver. In proposed waiver option includes other that must be met in addition to location in a non-MSA the
must be the sole supplier in the area and must provide vehicles and staff). data suggest that many provide both ALS and
assumes if a waiver based on were to be adopted, all would convert their programs to to the waiver criteria If so, this assumption should be made clear.
D - 5

Comments from the Assistant Secretary for Management and Budget
DEPARTMENT OF HEALTH HUMAN SERVICES Office of the
M 1997
Washington.
MEMORANDUM TO: June Gibbs Brown Inspector General
FROM: John J. Callahan Assistant Secretary f
SUBJECT: Concur with Comment: OIG Draft Report, “State Ambulance Policies and Services
The wording of recommendation in this report implies that HCFA has finalized a decision to use designations as the basis for granting waivers to its proposed ambulance coverage policy.
In fact, HCFA is only proposing this waiver option in regulation. The regulation will also propose an alternative waiver option and will seek public comment on both options, as well as any other options commenters might suggest.
OIG should change the language in its report to clarify that: 1) HCFA has not finalized a decision on granting waivers, 2) using MSA and non-MSA designations in granting waivers is only one of two options being considered in its ambulance regulations, and 3) commenters will be asked to react to the two alternatives and suggest additional options.
OIG may also want to consider changing the wording of its recommendation to say:
. “When determining a waiver policy in its final rule on ambulance coverage, HCFA should re-evaluate its proposal to use Metropolitan Statistical Area/non-Metropolitan Statistical Area designations as the basis for granting waivers.”
7 -Y A
D - 6