Embed Size (px)
Citation preview

STATE OF OREGON DEPARTMENT OF GEOLOGY AND MINERAL XNDUSTRlES
Suite 177 800 NF, Oregon S t #28 Portland, Oregon 97232
OPEN-FILE REPORT 0-95-05
EXPLANATION OF MAPPING METHODS AND USE OF THE TSUNAMI
HAZARD MAP OF THE SILETZ BAY AREA,
LINCOLN COUNTY, OREGON
George R. Priest, editor Oregon Department of Gealagy and Mineral Industries
Funded in part by
Oregon Coastal Management Program, Oregan Department of h n d Conservation and Development, from hnds provided by the Oregon Legislature, US Depmcnt of Commerce National Oceanographic and Atmospheric
Administration ofice of Coastal Resource Management under Section 306 Coastal Zone Management grants, and Section 309 Program Enhancement grants
with additional support h m
State lottery, State General Fund, and donated in-kind suppart from the Oregon Graduate Institute of Science & Technology.

NOTICE The Oregon Department of Geology and Mineral Indusuies is publishing this paper because the information furthers the mission of the Department. To facilitate timely distribution of information, this repan has not been edited to our
usual mdards.


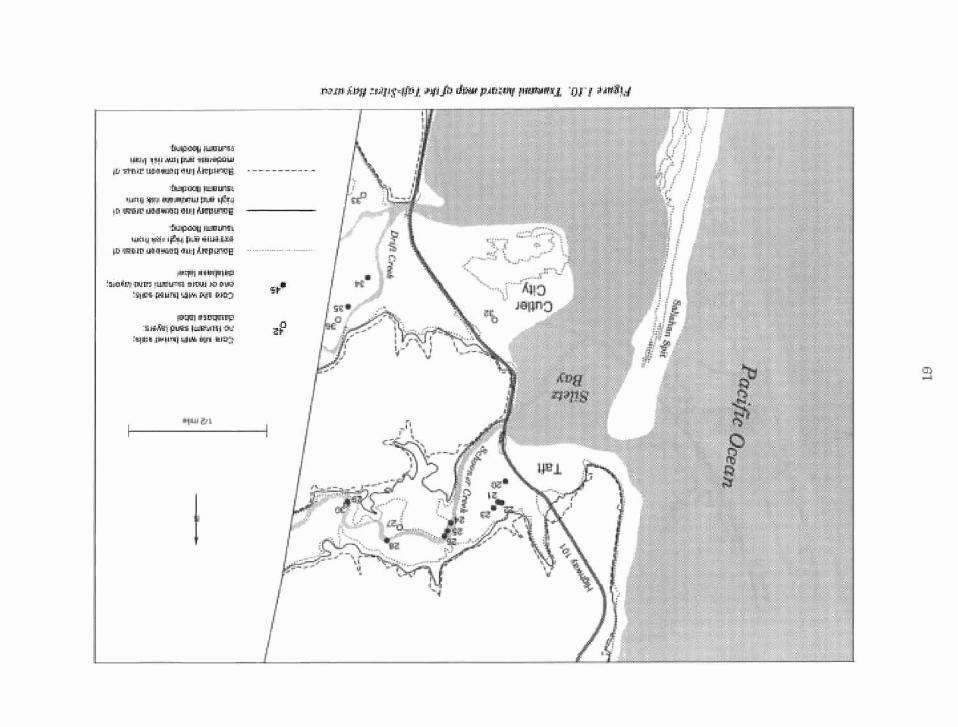
Figure 1.6 Official tsunami signs for the State of Oregon ........... ..... ..... .. .......... ........ ..... .. ... .. .. 12 Figure 1.3 Location of coring sites in study area ...... . . ... .. ..... . . . .. .. . .. . . ... .. . .. . . . . . . . . . . . . . . . . . . . . . . . . IS Figure 1.8 Vertical cross section of Figure 1.7 . .. . . .. . . . . . .. .. . .. . . . . . .. . .. . .. ... .. .. . .. . .. . . . . . . . . . . . . . . . . 16 Figure 1.9 Tsunami hazard map of the Devils Lake-Lincoln City area .................................. .. 18 Figure 1.10 Tsunami hazard map of the Taft-Siletz Bay area ............................ ....................... 1.9 Figure I. 11 Tsunami hazard map of the GIeneden Beach-Siletz Bay area ................................. 20
Chapter 2
Figure 2.1
Figure 2.2
Figure 2.3 Figure 2.4 Figure 2.5a
Figure 2.5b
Figure 2 . 5 ~
Figure 2.6
Figure 2.7
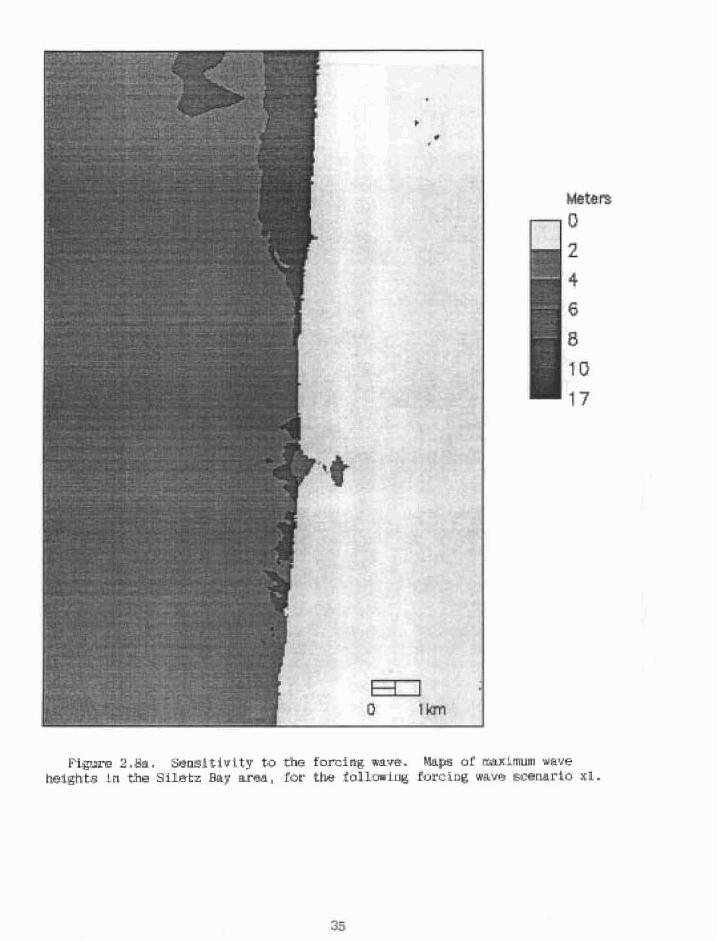
Figure 2.8a
Figure 2.8b
Figure 2 . 8 ~
Figure 2.9 Figure 2.10
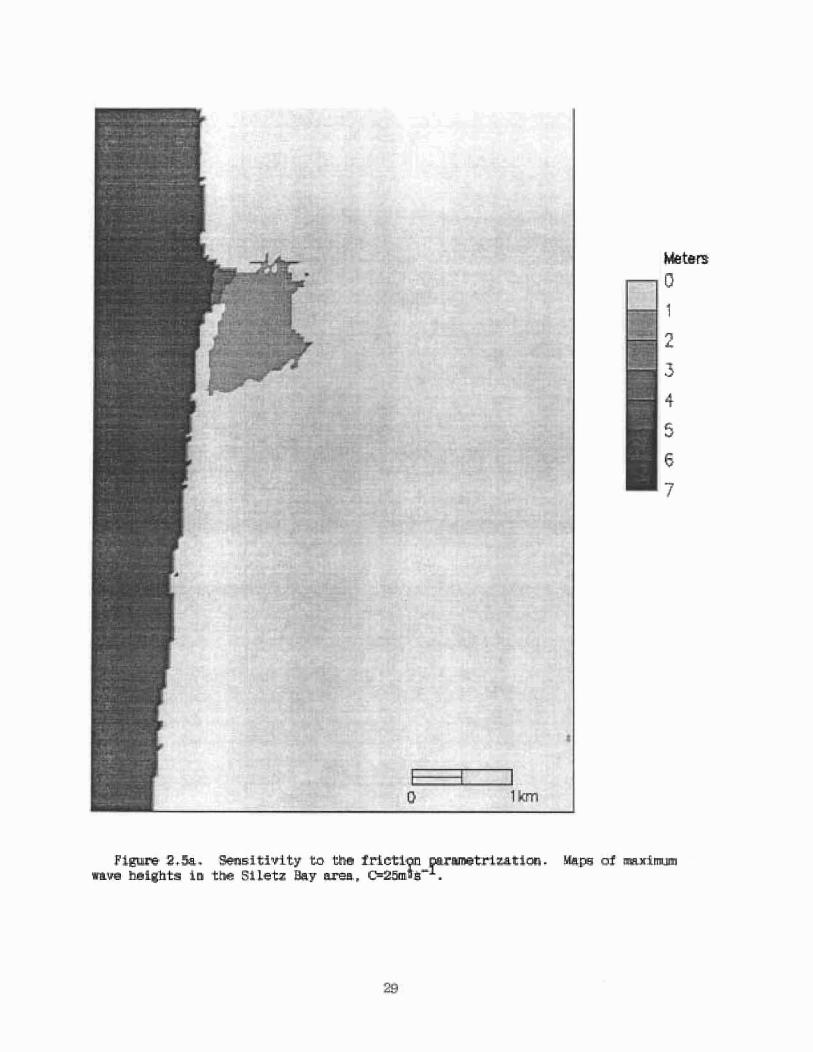
Comparison of tidal elevations at selected pelagic stations of the eastern North Pacific. .. .. . . . .. . . . . . . . .. . .. . . .. . .. .. . . . . . . . . . . , . . . , . , . . , . . , . . . . . . . , . . . , . . , . . . , . . , . . . . 23 Maximum wave heights along coasts of Washington and Oregon for different source scenarim ............................................................................. 25 Forcing wave used as ocean boundary condition for Siletz Bay simulation., . .. . .. .. . .. 26 Domain of study.. ............................................................................................... 28 Sensitivity to the friction parametrization. Maps of maximum wave heights
Y 1 in the Silm Bay area, C=25m 's- .................................... .... ........................... 29 Sensitiviq to the friction parametrization. Maps of maximum wave heights in the Siletz Bay area, ~=50m"s" .............................................................. ......... 30 Sensitivity to the friction parametrization. Maps of maximum wave heights
Y 1 in the Siletz Bay area, C=75m 's- . . . . . . . . . . . .. .. . .. .. . .. .. ... ... .. .. .. . . . . . . . . . . . .. .. . . .. . . .. 3 1 Sensitivity to the friction parametrization. Maximum wave heights vs. water depth within SiEetz Bay, for (a) ~=25rn"s", (b) ~=50rn"s-', and
n -I (c) C=75m s . ...................... .. .......... ..... ....................................................... 32 Sensitivity to the forcing wave. Maximum wave heights vs. water depth, within Siletz Bay, fur different ampIification factors for the reference waveform: (a) xl; @) x2; (c) x4. .. . . . .. .. . .. . .. .. ... .. . . . . . . .. . . . .. . . . .. . , . . , . . . , . . . . . , . . . . . , . . . . . , . , 34 Sensitivity to the forcing wave. Maps of maximum wave heights in the Siletz Bay area, for the following forcing wave scenario x 1 .. . . . .. ... ... .. . .. . . . .. ... ... .. . .. . 35 Sensitivity to the forcing wave. Maps of maximum wave heights in the SiIetz Bay area, for the following forcing wave scenario x2 ................................... 36 Sensitivity to the forcing wave. Maps of maximum wave heights in the Siletz Bay arm, for the following forcing wave scenario x4 ................................... 37 Comparison of maximum wave heights vs. water depth, within Siletz Bay. .. . .. . .. .. . . 3 8 Sensitivity ta the initial water level. M u m wave heights vs, water depth, within Siletz Bay, for initial levels at (a) MSL+l m; and @) MSLr2.3 rn .............. 39
Figure 3.1 Location ofthe study area and geographic names used in the text . .. . . . . . . .. .. . . . . . . . .. . . .. 45 Figure 3.2 tocation of core sites .... . .. . . . .. . . . .. . .. .. . .. . . . .. . . . .. . . . , . .. . , . . . . . . . . . . . . . . . . . . . . . . . . . . . . . . . . . . . . . . . . 47 Figure 3.3 Plot of estimated coseismic coastal-subsidence associated with youngest
Cascadia earthquake (300 years B.P.) ..... .. ... ... .. ... ..... .. . ..... .... ,, . . . . . . . . . . . . 53 Figure 3.4 Plots of estimated beach retreat in the Lincoln City littoral cell .............................. 56
CHAPTER 1
SIMPLIFIED EXPLANATION OF THE TSUNAMI HAZARD MAP OF THE SlILETZ BAY AREA, LINCOLN COUNTY, OREGON
by Gearge R Priest, Oregon D p r n e n t of Geology and Minerd Indudes
M n i o M. Baptista and Ming Qi .Oregon Graduate Institute of Science and Technology Curt D. Peterson and Mark E. Darienzo. Portland State Unjversitv
EXECUTIVE SUMMARY This report explains the results of a pilot tsunami hazard mapping project fo lsed on the Siletz Bay area. Tsunami hazard maps were published by the Oregon Department of GBoIogy and Mineral Industries (DOGMI) at two dierent scales: an initial, hand-drawn compilation (Open-File Report 0-956) at 1 :4,800 ( l inch = 400 feet) and a final publication (GMS-99) at the 1:12.000 ( I inch = 1,000 feet)-scale. Small-scale illustrations of the mapped inundatron are also included in this chapter as Appendix 1.2. The maps depict areas potentially vulnerable to tsunami flooding for three different scenarios:
Scenario I: Magnitude 8.8' subduction zone earthquake: no factor of safe@ applied; tsunami striking while tide is at mean sea level; 1 rn (3 A) coseismic subsidence (regional subsidence during a great earthquake); wave height at the open coastaI shoreline of appcokirnatelg 6-8 m (20-25 ft); scenario depicts the minimum hazard from a locally generated tsunami.
ScmariD 2: Magnitude 8.g subduction zone earthquake; predicted wave amplitude (one half the crest to trough distance) in 50 rn (164 feet ) of water multiplied by 2 (200 wrcent &or of safety); tsunami stnking while tide is at mean higher high water; I m (3 ft) coseismic subsidence; wave height at the open coastal shoreline oC approximately 9-11 m (30-35 ft); scenario may be viewed as the most probable case. Inundation is identical to that adopted for implementation of Senate Bill 379 (ORS 455.446 and 455.447), limiting construction of essential and speciaI occupanq faciIities in t m m i inundation zones.
Scenario 3. Magnitude: 8.8 subduction zone earthquake; predicted wave amplitude in 50 m (164 feet ) of water multiplied by 4 (400 percent factor of safetv); tsunami stdung while tide is at mean higher hgh water, 0 rn of coseismic subsidence; wave height at the open coastal shoreline of approximately 15-17 m (50-55 ft). Scenario simulates the model tsunami used for wacuatlon planning in northern California hazard maps and may be viewed as an extreme case.
The hazard map can be used to find following risk zones:
W m e RIsk: Elevations below the run-up elevation of Scenario 1.
High Risk Elevations between the nm-up elevation of Scenarios 1 sad 2.
Modera& Risk: Elevations between the run-up elevation of Scenarios 2 and 3,
L w REsk: Elevations between the mn-up elevation of Scenario 3 and 30 m (1 00. ft).
Nqligible Risk. Elevations above 30 m (100 ft).
The three scenarios were developed from numerid sirnufations af Eaptista and coworkers to estimate the tsunami flooding from a large subduction zone earthquake immediately offshore of the study area. Scenario 2 contalns a numkr ofcorreetion factors that reflect uncertainties in the modeling technique and tides, whereas Scenario 1 is free of correction factors. Scenario 3 approximates the numerical modeling methodology used by the State of California and the National Oceanographic and Atmospheric Administration for a tsunami hazard map of Humbolt Bay and Crescent City in California. While Scenario 3 simulates flooding from a large subduction tone earthquake. it has
1 The scenario magnitude is to some extent arbitmy, since earthquakes from M8 to M4 are possible. so the tenth decimal place listing does not imply that we know the scenario magnitude to that precision.

additional factors of safety that account for increases in wave height that may be caused by storm surges. larger uplift or subsidence of the sea floor than estimated here, and subrnanne landslides.
Peterson and coworkers mnducted mapping and hazard analysis of prehistoric tsunami deposits to check the numerical simulations. They also estimated on the basis of buried soils that a maximum of 1 m of coastal subsidence ~vould accompany a great earthquake. This value was used for the numerical simulations of Scenarios 1 and 2. The prehistoric tsunami dam is most consistent wish open coastal run-up on the order of 8-10 m (26-33 ft). decreasing to 3 m (10 ft) or less in areas more than 1.6 km (1 mile) inland. The prehistoric data is thedore compatible with Scenario 2 ma-up elevations st the open coast and Scenario T run-up predictions about 1.6 kin (1 mite) or more inland.
The numerical simulations and the evidence from prehistoric tsunami deposits cIearly show that Scenario 1 and 2 tsunamis with open~oastal run-up elevations on the order of 6-1 1 m (20-35 ft) are possible. and that areas near the banks of wtwries at least 4.0 krn (2.5 mi.) inland (the edge of the study area) are at risk fmm ltsunami flooding. The Scenario 2 ma-up elevation (the boundaty between the modepate and high risk zones) is probably the most likely case. Scenario 1 and 3 boundaries may be viewed as the potential error abut t h ~ s middle case. A m above 30 m ( 1 00 ft) elevation are above nearly any conceivable earthquake-generated tsunami.
C& erosion is likely to resuit from the sudden subsidence that accompanies great (M 8-91 earthquakes. Most beaches and foredunes on the open coast will be removed over a period of years when the area subsides the predicted 0.5- 1 rn (2-3 R). since wave will reach that much higher. Loss of the buffering effect of beaches will make all open coastal shore1ines in the study asea subject to severe erosion by storm waves.
In the event of a large undersea earthquake in this area, there will be about I5 minutes to evacuate befare the flooding from the first wave crest becomes severe; therefore if v m fed an earthquake witR 21) s e w & or more of strong grouad slrakiw, head immediately inland or to h i ~ h ground. A number of wuves will come i r~ over a period of s e v d hours, so do notso hock to the shoreline until an official "all clear" k issued. Strong shaking is enough to make ~t hard to stand up dunng the earthquake. These guidelines will dtminate most false aIanns, but tsunamis can in some cases be zmerated bv less felt shakin~:, iocaljurisdictiotts moy choose Fo use more conservative thresholds for evacuation (e .~ . anv felt earth4uakel. Owng to the generally low seismic~ly of this a m a lower heshold of shalung could be justified; this is a dec~sion for local authorities.
h n g to unresolved problems with the numerical simulations (see Chapter 21, the flooding lines are not in genera! mommended for site-specific land use and engineering decisions. However. they are a useful guide to broad areas that may be at risk from tsunami flooding.
Scientific findings ofthe last scvwal ycars have shown that the Ore* coast is wlnerable to shaking and tsunami flooding from great (M 8-91 undersea earthquakes that can occur on the offshore Cascadia subduction zone fault -tern (Figure 1.1; see Madin, 1992, and Atwater and others, 1995, for summaries). The estimated chance in the hext 50 years of a great subduction zone earthquake is between 10 and 20 percent (Peterson and others, 199 1; Darienzo and Peterson, 1495). 'So prepare the State for this threat. the Oregon Department of Geology and Mineral indwtnes @OGAMI) solicited support from the Oregon D m m e n t of Land Consemtion and DweIopment @LCD) to produce a pilot tsunami hazard map of the Siletz Bay area (Figure 1.2).

46- -
Eugene 44- -
P' la!. 1
Figure I . I . The length of the crosshatched area is the Figure 1 -2. Location of the study area and regional approximate length of the postulated fault ruprsrxc for geographic pface names rnenrioned in the rexr a magnitude 8.8 earthquake on rhe Cascodia subducrion zone. During he earthquake, the shaded area will be thrust upward, creating n series of aunami waves. Areas east of the shaded area will' subsidc up to 1-2 m. This subsidence will persist for a number of years, causing flooding during high tides and erosion during winter srormr. Neither subsidence nor uplift will occur af the eastern edge of the shaded area ("hinge zone" or "zero isobase" between subsidence and uplifr}.
Undersea earthquakes of magnitude 8-9 wiIl produce amamis when the sea floor and overlying ocean is deformed by faulting and submarine landslides. These waves will travel at hundreds of kilometers per hour (kph) in the deep wean but will rapidly slow as they approach shore. As they slow, the tsunami waves increase in height from as little as a few centimeters in the deep ocean to m a n y meters at the shoreline. When they slrike shore. they wilt stiIE be aaveling at speeds greater than one can run and can cause severe loss of life and property.
Tsunamis From dismt undersea earthquakes in Alaska and Chile can strilce the Oregon coast several hours a f ~ r the earthquake, giving the Alaska Tsunami Warning Center ( A W C ) time to issue warnings. En the Siletz Bay area these tsunamis have smtisticalty predicted run-up elevations (Figwe 1.3) of 2.4 m (8 ft) at a recurrence of 100 years and 4.3 m (14 ft) at a recurrence of 500 years (Charland and hiest, 1995 fmm graphs of Houston and Garcia, 1978). The Alaskan earthquake of 1964, which approximates a 500-year event, caused tsunami waves to run up to elevations of about 4.4 m (15 St) in t i i s part of the coast (during a high tide), but did no reported damage to the study area (Schatz and others. 1964: h d e r and others, 1993). Therefore this report focuses on the much more serious threat from Iocally generated Cascadja tsunamis.
In contrast to dismt earthquakes. a locd undersea earthquake on the Cascadia subduction zone could send tsunamis to the Siletz Bay m a within minutes, leaving no time for an ATWC waming. Advance emergency evacua~ion planning aided by an accurate map of the hazardous areas i s therefore essential to prepare for prompt response to this event.
This project responds to this need by producing a tsunami hazard map and by exploring methods for mapping this hazard in other coasml communities. Small-scale illustrations of the tsunami h& map produced for this study are given in Appendix 1.2 ('Figures 1.9.1.10, and 1.11). Published maps were relmed as DOGAMI maps GMS-99

(I: 12,000 s d e ) and Open-File Repon 0-95-06 (1 :4,80Q scale]. In addition, a map (DOGAM1 Open-File Repon 0- 95-25) ar the E:24.M!O-scale illusmating tsunami flooding identical, to that of this study's middle case, Scenario 2, was produced to implement ORS 455.446 wid 455.447. These statutes I i r n ~ t new construction of essential and special occupancy facilities in tsunami inundation zones. A preliminary version of the same 1:24,000-scale map. (included in DOGAMI Open-File Report 0-95-68) illusmtes tsunami flooding equivalent to this study's lowest and middle case, Scenarios 1 and 2, respectively.
A simplified explanation of the h d map and mapping methods is given below. An expanded explanation of the numerical simulation technique is given in Chapter 2. Derailed descriptions ofthe geologic evidence at Siletz Bay for earthguakehduced (coseismic) coastal subsidence and tsunami hazards are given in Chapter 3 and Appendix 1.1. The following discussion explains how tsunami run-up elevation and inundation were estimated for each of three scenario tsunamis. The three hazard scenarios were selected to illustmte the uncemhty of the tsunami flooding predictions. so domed decisions can be made by local g o v e m e n l and the public.
MAX MRUSfON
1 Figure 13. Tsunami amplitude. inundation, and run-up (modified from Curtis, 1991). MSL = mean sea level.
METHODS Tsunami nm-up elevations for the three different scenarios (high, medium, and low) were estimated by numerical methods. These rnethds provide approximate run-up elevations and inundation distances based on an analysis of the f n t two horn of tsunami waves (see Chapter 2 fosa technical discussion). Waves in the first 2-3 hours typically have the highest sun-up elevations. See Chapter 2 for detailed explanation of the numerical simulation technique.
The first step in the procedure was to numesically simulate tsunamis genemal from theoretical sea floor deformation caused by a magnitude 8.8 subduction zone earthquake. The m bowed upward by such an event is represented approximateFy by the cross hatched area on Figure 1.1. Landward of the cross hatched area would be a trough of subsidence similar in width to the uplifted area. A cross section across the defwmed earth would therefore describe and "S " shape, which is aIso the initial shape of the overlying sea swfge after the earthquake. This initial dimbance of the sea produces numerous waves that strike sharelimes though out the Pacific. This regional simulation was used to predict the size and shape of two hours of tsunami waves arriving in the study area at offshore p o i n ~ in 50 rn ( 1 M ft) water depth. At that point another computer program did a detailed calculation of the tsunami flooding (inundation) that could be expected from these waves, T'his inundation program cdculated maximum water elevations (run-up) on a rectilinear grid at a spacing of 40 m (131 ft), so actual flooding boundaries had to be extrapolated to the much more detailed topogmphic dam

ExaapoIation of the numerid data w x achieved by dmwing the inundation boundaries on a 1:4800-scale mhophoto topographic m q with 1.5 m (5 St) eIevation contours, inferring the lboundxry p s i t ion using professional judgment (see West and others. 1994, for a technical discussion of the base map). In cach case about 1.2 rn (4 It) was added to the numerically predicted nm-up elevation to eliminate underestimation of the flooding hazard caused by uncertainties in the elevation contours. The contours have a vertical precision of k 0.8 m (2.5 ft). Inspection of the onhophoto maps. which were produced from photos taken at low tide, reveals that the zero elevation isdine (geodetic mean sea level) plots in the wave swash zone at the open coast and near the low water line within the bay. This suggests that local mean sea level may be 0.3-0.4 m (1.0-1.5 ft) higher than geodetic mean sea level: hence, the correction factor.
The three flooding scenarios (Table 1.1) stan with the listed wave amplitudes (Figure 1.3) in 50 m (164 ft) of water. running up to the listed elevations when they reach the open coast. A qualitative estimate of the risk zones bounded by each flooding h e is Listed to simplify interpretarion by the
Table I .I. Summary of tsunami scenarios mapped for this invesrigarion.
Scenario 1 is h e numerical simulation without any factors of safety. Scenario 2 adds the effect of a high tide (about 1.3 rn or 4 ftS and a 200 percent factor of safety to the Scenario 1 wave amplitude, 'the latter factor of safety is justified by (1) uncertainties in the sea floor deformation that causes the tsunami. and (2) the common observation in modern tsunami that actual wave heights are generally too low by varying amounts relative to the numetically predicted heights (see Chapter 2). Scenario 2 nm-up is essentially the same as that used to implement Senate Bill 379 (ORS 455.446 and 455.447). even though the run-up was derived somewhat differentiy (see Model 2 of Priest. 1995 ). Senate Bill 379 limits construction of essential and special occupancy structures in tsunami inundation zones. Scenario 3 adds a 400 percent factor of safety to the Scenario f wave and assumes high tide, but does not incorporate coseismic subsidence thought to be as much as 1 rn (3 ft) from study of prehistoric buried soils in the m a (see Chapter 3 for details). me 1 m of coseismic subsidence was ehinated from Scenario 3 so that it could, as closely as possible. match a scenario tsunami used by the State of California for the HumboIt Bay-Crescent City area (Topporada md others. 1995). This was done to allow our scenarios to be more easily compared with the standard used in California for evacuation p h m h g purposes. The additional factors of safety in Scenario 3 may be justified by &e observation that tsunamis can be amplified beyond the model prediction by storm surges. submarine landslides. unusually high tides, or some cornbition of these factors.
Risk Zone Boundary
-
For the purposes of this hazard map. the presence of prehistoric tsunami deposits (Chapter 3) is considered an indication of minimum tsunami inundation, The following observations demonstrate hat this assumption is highIy conservative of life and propetty. Alterations in the shape of the bay and spit couId have allowed prehistoric tsunamis somewhat better access than at present. For example, the Highway 101 emba~&~~ent. agricultml dikes, fill, shoreline
'Additional scenario tsunamis and emhquake sources were extensively investigated by Mest (1995) after the Siletz Bay study was completed. Two of these scenarios, his Model 2 and Model 3. were utilized by hiest (1995) for regional mapping of tfllnami inundation on the Oregon coast. The maximum open coastal run-up for Model 3 essentially equals that of Scenario 1 in this study: likewise, Mcdel2 is similar to Scenario 2. An additional preliminary scenario was investigated by Mest (1995) in order to reconcile differences in Models 2 and 3. This scenario, though somewhat crude. probably represents the best time history of wave arrivals and w a used in construction of h e time history figure, Figure 1.5, below. 'Amplitude is at an offshore point at 50 rn ( 164 ft) water deprh.
Tsunami Amplitude3
m (ft)
Scenario 1 Extreme-High I (3.3)
Tidal Level
m (ft) Above Mean Sea Level
Open CoastaE Run-up
Elevation m Ift)
Scenario 2 High-Moderate 5 I161
Scenaria 3 Mdemte-Low 10 (33) -
Coseismic Subsidence
m (Ft)
9-1 1 (30-35)
15-17 (50-55)
1.3 (4)
1.3 (4)
1 (3.3)
0

protection stnrmres. and accelerated growth and stabilization of dunes by the introduction of European kach grass, no doubt offer less accm for tsunami flooding than in prehiskoric Z~rnes. Therefore future tsunamls will likely not reach as far inland as the prehistoric ones.
F l d i n g from all scenario tfllnamis covered all known tsunami sand deposits. but in some cases the lowest simulated run-up. Scenario 1. did not wet f l d i n g paths to these deposits predicted from analysis of the mineralogy of the tsunami sands (see Chapter 3). In each case a judgment was made which was as conservative of life and propem as pssibIe without seriously compromising the integrity d the numerical simuiation. In general. if the elevation at the flooding path predicted from prehistoric tsunami sands was less than 1 m above the model run-up devation, then the path was assumed to be f l d e d . Predicted flooding paths bloeked by barriers 1 m or more higher than the model run- up were assumed not to be flooded. In all cases where the flooding paths were blocked by barriers higher than 1 rn, it was obvious that the barriers had been modfied from their prehistoric condition by such factors as artificial fill, rip rap, and the dune growth caused by European beach grass.
Lack of tsunami sand deposits was not considered evidence that no tsunami flooding occurred. The most easily recognized tsunami sands are those that lie atop buried m h soils, but the prehiszoric record from buried soils is fragmentary. Erosion by IatemIIy migrating tidal and river channels can remove buried soils and tsunami sands. Buned marsh soils may not exist at all, i fa marsh was not growing prior to coseismic subsidence. If roseismic subsidence is not large enough to put the soil down to intertidal or tidal levels where deposition of muds can occur, it may not be buried; then surface erosion by min and wind can remove the tsunami sand. Even if the buried soil is we11 preserved. lack of a capping tsunami sand may indicate only that a sand source war not available, or that the tsunami lost sand as it slowed down and crossed vegetated areas. Multiple tsunami surges can also erode away previous deposits.
No area below 3 m (lo ft) eIevation was considered safe, if it was adjacent to zones of predicted tsunami floPding. All areas below this elevation are generally in or very close to a wetiand condition and will be even more likdy to k flmded after coseismic subsidence.

HOW REASONARLE ARE THE ESTIMATED RUN-UP ELEVATIONS?
EVIDENCE FROM PREHISTORIC TSUNAMIS
Salishan Spit (Figure I .4) was a barrier to prehistoric tsunamis, offering m opportunity to estimate open coastal run-up height from the distribution of prehistoric tsunami sands immediately behind the spit. Sands deposited by tsunamis striking about 300 and ROO years ago were not deposited behind parts of the spit presently about 10- 12 m (33-39 ft) ahove mean sea level. The actual heights of these same high spots 300-800 yem ago could have been as low as 5-7 rn (16-21 ft) within the uncertainties of the data (See Chapter 3 and Appendix 1.1 for detailed discussionsl. Assuming that the current topography of Salishan Spit is representative of times past. it is apparent that low spts on the order of 6-8 m (20-26 Ft) were conduits for prehistoric tsunamis, and barriers over about 10- 12 rn (33-39 ft) stopped prehistoric tsunamis. Hence, the most likely open coastal run-up is on the order of 7-9 m (23 -30 ft), although the uncertainties in the data cannot rule out prehistoric tsunamis as low as 5 m (16 ft) or as high as 12 m (39 ft)-(see Chapter 3 and Appendix 1.1).
Even higher tsunamis probabIy struck the coast in prehistoric times. The tsunami that flooded the Oregon coast about 1400 years ago
Figure 1.4. Geographic place names in the sfudy area.. may weU have been higher than either the 300 or 800 yr. events (see arguments in Chapter 3). Many of these great prehistoric earthquakes have triggered submarine landslides (Adams. 1990), and landslides have ken mapped on the continental slope, particularly in southern Oregon and northem California (Chris Goldfinger, 1995. personal communication). For example. a 12 krn-wide landslide mass was mapped at the tw of the continental slope west of Florence (Goldfinger and others, 1992). Such landslides couId have increased wave heights significantly. Unusually severe storms can force tidal levels to 1-2 m higher than normal. Any of these factors, singly or in combination, could increase tsunami run-up height beyond predictions from modeling w the prehistoric record. How much higher could the tsunamis Be? The answer awaits further nurnwicd simularion of the effect of these factors. particularly submarine landslides, but maximum run-up on the order of 16 m {SO feet):' the approximate value for Scenario 3, m a y be possible.
EVIDENCE FROM HISTORICAL TSUNAMIS In the Pacific Basin magnitude 8-9 earthquakes are capable of producing tsunamis with maximum run-up heights on the order of 2-30 rn (6- I 0 0 ft), averaging ahnut 9 f 7 rn (28 rt 22 ft)5 near the epicenters (calcuIations on d a ~ ~ of
"This value is derived from the average Pacific Basin run-up of 9 m plus the estimated error (one standard deviation about the mean) of 7 m (see the section on hisrotical tsunamis), 'This mean was calculated From the maximum run-up elevations listed in the table of Lockridge and Smith (1984) for each of the thrust-type magnitude 8-9 earthquakes that occurred on subduction zone fault systems of the Pacific Basin. This is the faulting thought to occur on the Casca&a subduction zone. Since the type of fault mechanism was

Lockndge and Smith, 1984). Two recent earthquakes demonstrate that even those smaller than magn~tude 8 can generate significant tsunamis. The magnitude 7.8 Hokkaido NanseiUki earthquake of 1993 produccd sun-up heights on the order of 6-30 m (I5 to 100 ft) in areas 48-80 km (30-50 mi.) from the epicenler (Bernard and Gonzalez. 1993; run-up sunqs ofthe Hokkaido event by G. R Priest. A. M, Baprista. and Y. Tanioka 1993). The 1992 magnitude 7.6 earthquake in Nicaragua produced ma-up as high as 9 m (30 ft) on nearby shorelines (BapEIsta and others. 1993). Because of unusual characteristics of the faulting that -caused this earthquake. it had very little felt shaking at the coast. so the midents had little warning.
Satakc and others (19%) concfuded that the 2-3 rn (7-10 ft) tsunami that caused extensive damage to the Japanese Tslands thc morning of January 27,1700 was possibly caused by a magnitude 9 undersea earthquake on the Cascadia subduction zone. If the condusions of this paper are correct. then this w a ~ none other than the 300 yr. event recorded in the marshes of Siletz Bay. Although this was prehistoric to Oregon, it was very much historic to the Japanese. If the maximurn run-up was 3 m ( I0 ft) after the tsunami traveled to Japan across thousands of kilometers of the Pacific, one can speculate that the AD 1700 waves must havc reached considerably higher elevations on the Oregon coast.
CONCLUSION The scenario tsunamis chosen here accord well with Pacific Basin records of open coastal tsunami tun-up. Scenario 2. which matches the upper limit of the prehistoric evidence for a maximum wave, is very close to the average maximum tsunami run-up elevation for the Pacific Basin. Likewise, Scenarios 1 and 3 have open coastal run-up elevations within one standard deviation above and below the mean of the Pacific Basin data All three scenarios produce run- ups in excess of 3 m (10 ftl, the maximum nm-up in the Japanese islands from the AD 1700 event. WhiIe exzreme in terms of the prehistoric record., a Scenario 3 tsunami with run-up elevations on the order of 16 m (50 feet) may be possible within the uncertainties caused by tides, storm swrges, and submarine landslides.
HOW REASONABLE ARE 'FEIE ESTIMATES OF INUNDATTON?
Based on the distn'bution of tsunami sands, mainly from the last two prehistoric tsunamis. it is apparent that these m o events flooded areas immediately adjacent to tidal channels and atuaries but lacked the energy (or the sand sources) to carry sands more than a few hundred meters away from the channels in the eastern part of the study arm Figure 1.7 of Appendix 1.1; Chapter 3). A soil busied as a result of ooseismic subsidence during the last event lies beneath the marsh immediately east of Cutler City but lacks a tsunami sand cap or even organic debris typically washed in by tsunami waves(see core site 32 on Figurt 1.7 of Appendix 1.1 and Figure 1.10 of Appendix 1.2; seealso Chapter 3). Hence, it is possible that much of the area now occupied by Cutler City w a ~ not overtopped by the last prehistoric tsunami, effectively shielding this core site from flooding (see Chapter 3 for detaiIed discussion). Thwe observations suggest that the prehistoric tsunamis quickly lost their strength as they traveled inland, faif ing to reach elevations over about 3 m (10 ff) 1.6 km (1 mile) inland. However, as discussed above, nondeposition of tsunami sand daes not prove that an area was not f lood4 and some tsunamis older than the last two may have been larger. In any case. this pattern of rapidly dccrcasing flooding potential inland is best reproduced by the numerical simulation d Scenario 1, although wen that simulation puts core site 32 and some parts of CutIer City under water (Figu1-e 1.10 of Appendix 1.2).
Relative to the run-up implied by the prehistoric record and by the experience of many who study tsunamis. Scenario 2 and 3 simulations appear to predict run-up that is somewhat hfgh in areas 1.6 km (1 mile) or more inland. For example, Paul Whitmore of the Alaska Tsunami Warning Center wmte the following in a 1995 review comment for this paper:
listed in Lackridge and Smith ( 1984). a judgement was made regarding: a thrust-type. subduction tone source trased on the regional gealogy of h e area and the tsunami height If a negligible near-field tsunami was generated from a magnitude 8-9 event, it i s unlikely to be a t h s t mechanism. Where a range was listed, the highest value was used. The 17 m (k22 ft) error i s the one sigma error (68 percent confidence), assuming a norma1 Guassian probab~Iity Qstributlon.

"Here at the Tsunami W m i n g Center we have a rule-of-thumb that areas a mile or more from the open water have low tsunami danger. Historically. areas this far away from open water have only experienced small bores mveting up river, which only affect those on the river or its banks."
These observations are in accord with the inundation predicted by Scenario 1 and implied by the prehistoric tsunami sand data. This conclusion d m not, however, prove that the open coastal run-up elevations for Scenarios 2 and 3 are unrealistic, only that the numerically prcdictcd mn-up elevations in the most inland (eastern) pans of the study area are somewhat high. TZus may be caused by assuming bottom friction that is too low, not assuming a boretype tsunami. or using a wave with a period that is too long. Whatever the cause, use of the inundation lines for Scenarios 2 and 3 for evacuation planning in the eastern part of the study area adds an additional factor of safety.
WHAT W E L THE SCENARIO TSUNAMIS DO TO THE SILETZ BAY M A ?
GENERAL OBSERVATIONS All of the scenario tsunamis wiIl produce a number of waves, zhe first striking the coast within minutes of the earthquake figure 1.5). therefore, if you fee[ an earthquake d h 20 seconds or more of stronp mound s h a k i n ~ ~ head immediatelv inland or 5 0 hiah ground. Strong shaking means that it is generally hard to stand up during the earthquake. The 20 seconds or more of shaking is typical of great undcrsea earthquakes that can generate blg tsunamis. To get a feel for this. try shahng a chair with a family member in it for 20 seconds. Using both criteria should eliminate most false a l m s . As demonstrated by the 1992 Nicaraguan earthquake. b i ~ tsunamis can be producedfrom Iasm amoa~ts of shaking, so local j r r r i ~ d i ~ o f t s may choose to evacuate far anv felt earthquake. Check wth your city or county emergency managers for local guidelines. Since the Siietz Bay area has had very little historical earthquake activity, it is unlikely that evacuating for lesser amounts of shaking would generate an undue number of "false darms."
All of the scenario tsunamis will flood some populated areas with currents strong enough to do damage and cause loss of life. It is beyond the scope of this report to predict tsunami damage, but it is likely that single story w c d frame structures, mobile homes, and light weight steel frame buildings are highly susceptible (Toppozada and others, 1995). Just about any building can be damaged by logs or cars swept against it.
The combination of shaking and tsunami flooding will do substamid damage to utilities, water front facilities, and transporntion routes. Expect disruptions for several clays or weeks. The following description of the aftermath d the magnitude 9.2 Alaskan earthquake that struck SewarQ Alaska, in 1964 was used by Toppozada and others (1 995) to give same sense of the disruption to electric pbwer selvice:
"Some storage tanks at the Standard Oil tank farm broke open during the earthquake and oil ignited. The nearby building, housing the standby generators. burned, and all the equipment was destroyed. The 69-kV transmission line across the freshwater lagoon was demolished. Power poles and spans dconductws were datmyed in the old town site by slides, destruction of the dock, movement or destruction of buildings, and by waves. The only electric service available after the earthquake w a s fiom an emergency generator that provided a limited amount of power at the hospital" (National Academy of Science, 1973).
Figure 1.5 illnstrates the possible patterns of surge and withdrawal of water for the -8 h m . Note that the waves arriving 2-2-5 hours after the earthquake may be nearly as high as the first. Similar but smaller changes of water level will continue for 8-10 hours after the rarthquake, so do not rdum to l a v I v i n ~ amas after the f i tsunami wave. Wdt r d an oflciol "all clear" is issued.

SILETZ BAY AREA - GENERALIZED TIME HISTORY
-1 0 0 1 2 3 4 5 6 7 8
Time (hours)
Observation point is offshore
Figure 1.5. Time history for tsunami run-up at a point immediarely offshore of the Tap area. Because the point is offshore, the verrical axis does nor directly psedicr run-up elevarion ar the shoreline. Thefigure is given to show [he general pattern ofwave activity, not absolute run-up elevarion. Taken from a preliminary simularion by Priesr (1995) using earthquake-induced botlom deformatio~ inferredporn dura of Hyndman and Wang (1993).
To visualize the meaning of Figure 1 J . imagine standing at the open s h m after the earthquake and seeing the water immediatety start to rise. Sea level would continue to rise at an accelenthg rate. f i l y reaching the maximum run- up after 24 minutes. The tsunami ceuId come in as a surge like a rapidly rising tide or as a breaking wave, depending on local conditions. Normal wind waves will produce a complex, "choppy'Mace on the nunamis. so evacuation should be well above the estimated run-up Iine, if possible. Tsunami waves nearly as high as the first one will continue to strike in the following 2 hours. Smaller oscillations of sea level will continue for at least the following 6-8 hours. making it risky to be near the water's edge. Hence h e entire tsunami event will last for at Imt 8-10 hours. net counting any tsunamis caused by aftershocks.
SCENARIO 1 A Scenario I tsunami will run up to elevations of 6-8 m (20-25 ft) at the open coast. decreasing to 3.7-4.6 m (12-15 ft) in TaEt md 3 m (I0 ft) or less south of Taft. This will flood the Iow lying areas of Taft. parts of CutIer City. and the D

River but will not overtop most of SaIishan Spit. However. the lowest beach front homes on the spit could be damaged. The Taft area immediately adjacent to the mouth of the bay avd along Schooner C m k wiIl be heavilv damaged. The tsunami wi1I likely do little damage to the southern end of Siletz Bay, Devils Lake, or the eastern edge of the study a m except immediately adjacent to tidal channels and marshes. Bluffed areas like Gleneden Beach and Lincoln City will escape nearty unscathed. Severe currents in and around the main tidal channels will cause damage to docks and boats. People remaining at low elevations, espwrally on the beaches. couId be swept out to sea.
SCENARIO 2 A Scenario 2 tsunami will run up to elevations of 9-1 1 m (30-35 A) at the open coast, 6-8 rn (20-25 fi) in Taft and Cutler City, and generally about 3.7-4.6 m (12-15 R) throughout most of the eastern part of the study area. Th is will flood low lying areas of Taft. all of Cutler City. and will: overtop much of Salishan Spit. washing houses and sand into Siiek Bay. The D River area will be severely impacted. Devils Lake developments along the shoreline could get agnificant flooding. Most bluffed areas of Lincoln City and Gleneden Beach will escape damage. except In a few drainages that cut into the bids. The highest parts of Salishan Spit will k reasonably safc, especially thosc areas that are high and back from the open shore. Interdune lagoons will offer important protection to these back dune areas by storing and fitmeling water to either side. Currents much more severe than those of Scenario 1 will do damage In low lying arcas throughout the study area washing away or severely damaging all but the sturdiest structures zn the flooding zone. Substantial erosion of Salishan Spit will occur. damagmg roads and shoreline protection structures. Siletz Bay, roads. and local beaches will be cluttered with debris from the extensive destruction.
SCENARIO 3 A Scenario 3 tsunami will run up to elevations of 15-17 rn (50-55 ft) at the open coast, 12-14 m (40-45 ft) in Tafi and Cutler City, and about 9 m (30 ft) in the eastern part of the study area This will flmd low lying areas of Taft, all of Cutler City, and will overtop nearly all of Salishan Spit. Only a few small knolls in the central spit will remain above the waves. Structures on the spit could bc almost totaI1y desrroyed, and severe erosion of the spit will occur from the intense currents, damaging shoreline protection structures and roads. Exuernely heavy damage can be expected at the P River and significant flooding wiIl wmr throughout Devils Lake. Even the Iower parts of the bluffed areas in Lincoln C~ty and Glenedcn Beach wiIl be inundated and heavily damaged in this scenario. Debris piled up on roads will likely make many impassable.
WRGT DOES COSEISMlC SUIBSIIIENCE DO TO THE AREA? Regional coseismic subsidence of the coastline wiIl persist for many years and will cause high tides to be 0.5- 1 m (2-3 - A) higher, f l d i n g areas that are mmntly beyond the reach of thcse tides. Hence many shoreline developments around Siletz Bay will find themselves flooded especially during unusually high spring tides and storm surges. Emystems that currently thrive on high marshes could be destroyed by intertidal environments and associated animals and vegetation. Areas presently at intertidal levels will be belaw most tides.
Floods from the Siletz River and adjoining drainage systems will be capable of reaching elevations as much as 1 m h~gher in the estuary. Of most mnccrn will be unusually high (100-year or 500-year) floods which could be 1 rn higher in the esmay than would be predicted from current flood hazard maps produced by Ehe Fedefal Emergenq Management Agency (ITMA). FEMA flood insurance maps will have ta k revised.
As explained in Chapter 3, s rise in sea level caused by subsidence could remove the sand from all of the bluffed open- coastal beaches, allowing storm waves free access to the soft sediments which form the sea cliffs. This situation will probably pctsist for a number of years or even decades, greatly accelerating erosion of ?he entire shoreline. Indeed. the developed bluffs face far more threat from erosion than fmm tsunami flooding. The rate of post-earthquake bluE erosion is not known, but d will greatly exceed the current rates, which vary between 9 d y r . (0.3 Wy.) at Lincoln City to I8 c*. (0.6 fVyr.1 at Gleneden Beach (Priest and others. 1994). Winter storms during a single year have caused up to 4 m (30 ft) of I d sea cliffs at Gleneden Beach to fall into the sea when the buEering beach sand was removed (Priest and others, 1993). Episodes of this kind will become much more common after coseismic subsidence.
The dune-backed beaches like Salishan Spit will be particularly vulnerable to this invigorated wave erosion. especially where not cored by the previously mentioned older soil and underlying semi-consolidated sediments. It rnight well be
worth mapping this older mistant core to berter evduate where erosion will be slowed. keas that probably lack the mistant deposits are the Snlishan golf course at its l o w ekvatioms and the wesm margin and north end of Salishan Spit, where dunes are genenlly lower than 8-9 rn (20-25 ft).
ShoreIine protection smctmes will ofFet a measure of short term protection for b t h bhrff- and dune-hked shorelines, but the relentless attack of the sea may cause h s i z mctures tu fail unless con.tinualty repaired. 'Ihis is a particular concern fur the S a l i s h develqmenr at SaZishan Spit. Whereas the developed spit is Eargel y armored with rip rap, if this were to fail. a =way couuld open up in the vicinity of the golf course. cutting off mad access to the spit
HOW SHOULD THE HAZARD MAP BE USED? nEe haPrrd map is inmded p~ixmi1y for mmmi cwamiun plannhrg. In reality thac is a conbbnrmn of hamd frwn lower efevalim close to the open shore to higher elevations inland. so going inland and uphill is dways the best m g y . Users should view the scenario nm-up elevations as boundaries between the following risk zones:
Extram R3k Elevations below the nm-up elevation of Scenario I.
Hbh R&k Elevations between the m p ekvatim of Sc- 1 ad2
M o d e m Rbk EleMtions between the nm-up elevations of S c h m 2 and 3.
Low Risk Elevations between the nm-up elemim of Scenario 3 and 30 m (100 ft).
Nggiigibh Rlpk: Elevations a h 30 m (100 frl.
Tsunami warning signs (Figure 1.6) should be posted at strategic points in the highest risk zma tu wam and edum visitms and midents about the hazard. Evacuation routes should be beclearly d e d with signs (Figure 1.6). Contact the Oregon Department of Tmportacim to obtain these oficial state signs.
Figure 1.6. Oficial tsunami cwrcllorion and waning signsfir the Stare of Oregon.
The tsunami hazard mnp should be wed in conjunction with companion maps of Wang and West (1995) depicting earthquake hazards from liquefaction (formaion of quick sand during shaking), ;amplification of shaking, and slope innability (landslides and slumps). Hence, an evacuation planner should &e sure that planned escape mutes are not compromised by one of thm other hazryds. For example. bridges on liquefable soil and roads next to unsmble slopes may not he appropriate for safe evacuation.
The map should not be used to set insurance rates m for site-specific land use planning. It may. however, swve as a general guideline for regional planning. For example, when looking for general areas appropriate for schools. hospitals. and emergency response facilities, it would be wise to avoid the highest risk zones. if at all possible. The inundation boundary for Scenario 2 is the same inundation boundary utilized ro implement ORS 455.446 and 455.447. limiting construction of these and other essential and specid occupancy faciIities in tsunami inundation zones.
ACKNOWLEDGMENTS Support for the project was provided in part from the Oregon CoastaI Management Program, Oregon Depadmcnt of Land Consmation and Development, from funds pmvided by the Oregon Legislature, U.S. Department of Commerce National Oceanographic md Atmospheric Admlnismtion ofice of Coastal Resource Management under Section 306 Coastal Zone Management grants. and M o n 309 Program Enhancement grants. The project was also funded from State lottery, State General Fund, donated in-kind support from the Oregon Graduate Znstitutc of Science & Technology, and the Sea Grant College program under grant number NA36RG045 1 .RICP-78. Reviews were provided by Dennis Olmstead, John D. Beaulieu, and Donald A. Hull of D O G M , James N. Hawley of Lincoln Counry Emergency Management. John I. Marra o f Shoreland Solutions, Paul M. Whitmore of the Alaska Tsunami Warning Center, Charles L. Mader of the Mader Consulting Company, and Brian E. Atwater of the U.S. GeologicaI Swq. All of their suggestions are seatly appreciated.
RErnRENCES Adams, J., 1990, Paleoseismicity of the Cascadia subduction zone: evidence h m turbidites off the Oregon-
Washington margin: Tectonics, v. 9, p.569-583
Atwater, B.F., Nelson, A.R, Clague, J.J., Carver, G.A., Yamaguchi, Q.K., Bobrowsky, P.T., Bourgeois, I., Danenzo, M.E., Grant, W.C., Hemphill-HaIey, E., Kelsey, H.M., Jacoby. G.C., Nishenko. S.P., Palmer, S.P.. Peterson, C.D., and R e i m M.A., 1995, Summary of coastal geologic evidence fur past great earthquakes at the Cascadia subduction zone: Earthquake Spectra, v. 1 1, no. 1, p. 1 - 18.
Baptism A.M., Priest G.R, and Murty T.S., 1993, Field Survey of the 1992 Nicaragua tsunami: Marine Geodesy. v. 16. no. 2, p. 169-203.
Bernard, E.N., and Gonzalez, E L , 1993, Tsunami run-up distribution generated by the July 12, 1993, Hokkaido Nansei-Oki earthquake: Tsunami Newsletter, December issue, p. 3-8.
Charland, J. W., and Priat, G.R., 1995, Inventory of critical and essential facilities vulnerable to earthquake or tsunami hazards on the Oregon coast: Oregon Department o f h l o a and Mineral Industries, Open-File Report 0-95-2, 52 p.
Curtis. G.D., 199 1, Final report: Hawaii tsunami inundationlevacuationmp project: Joint Institute far Marine and Atmospheric Research, Contribution No. 91-237,29 p.
Darieniro, ME., 199 1, Late Holocene palmseismicity along the northern Ocegon mast: unpublished Ph.D. Thesis. Portland State University, 168 p.
Darienzo, M.E., and Peterson. C.D., 1995, Magnitude and frequency of sulxluction-zone ahquakes along the northern Oregon mast in the past 3,000 years: Oregon Geology, v. 57, no. 1, p. 3-12.
Houston. J.R. and Garcia, A. W., 1978, Type 16 f l d insurance study: tfllnami predictions for the West Cmst of the continental United States: P.O. Box 63 1, Vicksburg, Mss., U.S. Army Engineer Waterways Experiment Station, Hydraulics Laboratory, TechnicaI Report H-78-26, 38 p.
Hyndman, RD., and Wang, K., 1993, Thermal constraints on the zone of a major thrust earthquake fdure: the Caseadia subduction zone: Jwrnal of Geophysical reswch, v. 98, no. b2, p. 2039-2060.
Zander. J.F.. h k n d g e . P.A.. and Kozuch. M.1, 1993, Tsunamis affecting the west coast of the United States: Department of Commerce. National Oceanic and Atmospheric Administration (NOAA), Documentation No. 29. 242 p.

Lockridge, P.A., and Smith, RH., 1984, Tsunamis in the Pacific Basin. 1900-1983: Bodder. Colorado, National Oceanographic and Atmospheric Administration, National GeophysicaI Data Center and World Data Ccnter A for Solid Earth Geophysics. 1:7,720,000 scale map.
Madin I.. 1992, Seismic hazards on the Oregon coast. in God. J.W. and Ridlington. S.S.. eds.. Coastal natural hazards science. engineering, and public policy: Oregon Sea Grant, No. ORESU-&-92-001, p. 3-27.
'National Academy of Science, 1973, The Great Alaska Earthquake of 1964: National Academy of Science. Engineering Volume. Washington, D. C.
Peterson, C.D., Darienzo, M.E., and Clough, C., 1991, Recurrence intervals of coseismic subsidence events h northern Oregon bays ofthe Cascadian margin: Final technid progress report to Otcgon Depanment of Geology and Minwal Industries, 14 p.
Priest, G.R., 1995, Explanation of mapping methods and use ofthe tsunami hazard maps of the Oregon coast: Oregon Department of Geology and Mineral Industria, Open-File Report 0-9547.
Pries?, G.R, Saul, I., and Diebenow, J., 1993, Pilot erosion rate data study of the central Oregon coast, Lincoln County: Oregon Department of Geology and Mineral Industries, Open-File Report 0-93-10,228 p,
Priest, G.R.. Saul, T., and Diebenow, J., 1994, ExpIanatim of chronic geologic hazard maps and erosion rate database, coastal Lincoln County, Oregon: Salmon Rrver to Seal Rocks: Oregon Department of Geology and Mineral Industries, Open-File Report 0-94- 1 1,45 p.
Satake, K., S h i d , K., Tsuji, Y.. and Ueda, K.. 1996. Time and size of a giant earthquake in Camdia inferred from Japanese tsunami records of January 1700: Nature v. 379, p. 246-249.
Schatz, C.E., Curl, H.C.. Jr.. and Burt, W.V.. 1964, Tsunamis an the Oregon coast: Oregon Department of Geology and Mneral Industries, Ore Bin, v. 26, no. 12, p. 23 1-232.
Toppozada, T., Borchardt, G., Haydon, W., Petersen, M.. Olson, R, Lagorio, H., and Anvik, T., 1995. Planning scenario in Humbolt and Del Norte Counties, California, for a g m t earthquake on ttre C m d i a subduction zone: California Division of Mines and Gealogy, Special Publication 1 15, 157 p.
Wang, Y.. and Priest, G.R., 1995, Relative earthquake hstzard maps of the SiEm Bay area, coastal Lincoln County, Oregon: Oregon Department of Geology and Mineral Industries GMS-93.3 1: 12,000 scale maps and text.

APPENDIX 1.1 - PREHISTORIC TSUNAMI RUN-UP: EVIDENCE FROM SALISHAN SPIT
SUMMARY Sands from the last two prehistoric tsunamis are well developed landward of low passes in Salishan Spit with present elevations between 6 and X m (20-27 ft) (sae discussion in Chapter 2). Prehistoric tsunami sands deposited about 300 and about 800 y m before present 03.P.) are absent on buried soiIs in marshes behind dunes 9-23 rn (30-74 Tt) high (Figure 1.7. core sites 14,15 and 16: see Appendix 1.2 for more der;liled locations). The real question is how high were these dune barriers 300 and 800 years ago. The following discussion shows that run-up from these two tsunamis may have been between S and 12 m (16-39 ft) within the uncertainties of the data If the present i s the key to part, and one assumes h t the. 6-8 m passes were overtopped by at least 1 rn, then the most credible open coastal tsunami run-up is abut 7-9 m (23-30 ft).
Tsunami sand present
O Tsunami sand absent
Tsunami sand absent in some holes
Figure 1.7. Map ofrhe audy area showing the bcmion of coring sites where marsh soils buried after coseismic subsidence were found. These coseismic subsidence events occurred during one or more of 7 carthquakts rhar struck during the last 2,800 years (see Chapter 3). As indicated, some core sites hove prehistoric tsunami sands on one or more of (he buried soils (see Appendix J .2 and Chapter 3 for addirional derail). A-A ' is the location of the cross section of Figure 1.8. As explained in f igure I .8 and in the texr, a barrim west of sites J4,15, and 16 (stippled area) prevented deposition of tsunami sand ar those siles when earthquakes struck about 300 and 800 years ago (older records were desrroyed by erosion). Sites 17-18, and 19 have well developed tsunami sands derived from dunes and beach sand ro rhe wesl. so dunes west of these sites wtra overtopped by tsunamis 300 and 800 years ago.
North South
sea level
A I Salishan Spit 1 tsunamis blocked overtopped by tsunamis - rn m
Gleneden Beach I
drill holes
L I
Vartlcd exaggeration ax u
Dune sand + Compact sand Buried sand dune Sedimentary underlying probably more soil last exposed rocks millions estuarine mud than 10,000 about 850 years ago of years old 4 0,000 years years old old
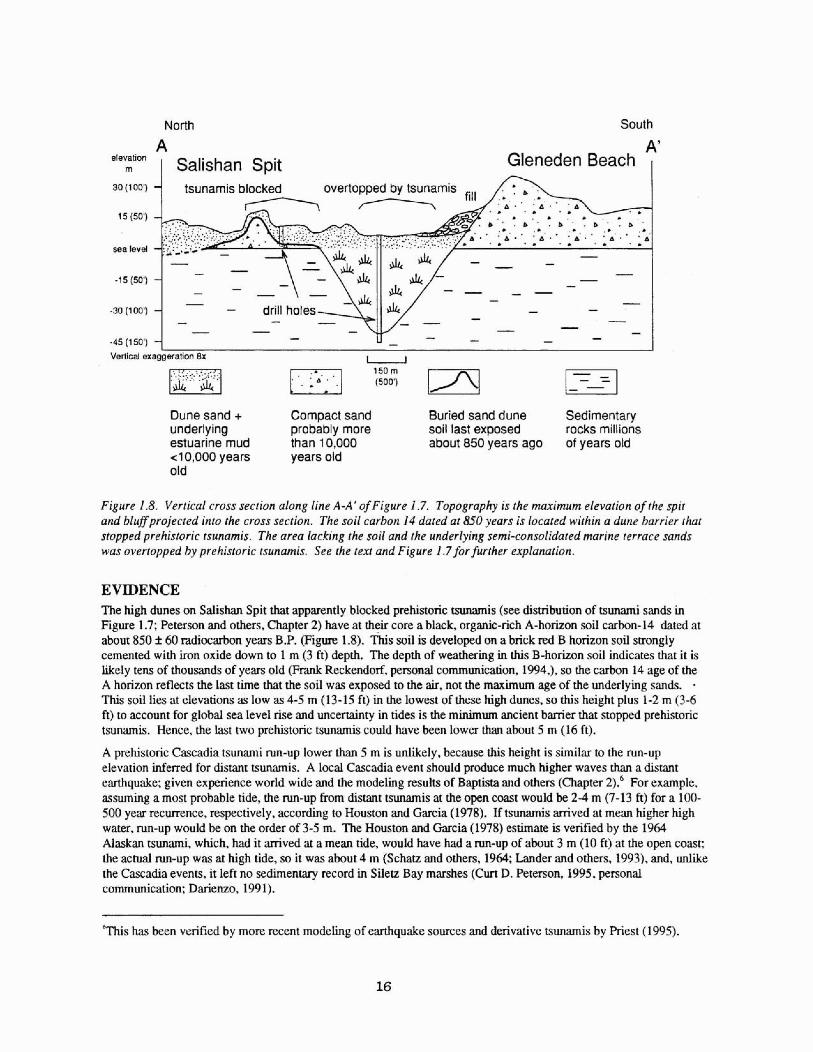
Figure 1.8. Vertical cross section along line A-A ' of Figure 1.7. Topography is the m i m u m elevation of the spit and bluffprojec~cd into the cross section. The soil carbon 14 dated at 850 years is locared within a dune barrier thar stopped prehistoric tsunamis. The area lacking the SOU and the underlying semi-consolidared marine rerruce sands was overiopped by prehistoric tsunamis. See the red and Figure 1.7 for further explanation.
EVIDENCE The high dunes on Salishan Spit that apparently blocked prehistoric suna am is (see disvibution of tsunami sands in Figure 1.7; Peterson and o h m , Chapter 2) have at their core a black. organic-rich A-horizon soil carbon- 14 dated at about 850 k 60 radiocarbon yeats BP. (Figure 1.8). This soil is develowd on a brick red B horizon soil m g l y cemented with iron oxide down to 1 m (3 ft) depth. The depth of weathering in this B-horizon soil indicates ha t it is Iikcly tens of thousands of years old (Frank Reckendorf, personal cmunication, 1994,). so the carbon 14 age of the A horizon reflects the last time h t the soil was exposed to the air, not the maximum age of the underlying sm&. This soil lies at elevations as low as 4-5 m (13-15 ft) in the lowest of these high dunes, so this height plus 1-2 rn (3-6 ft) to account for global sea level rise and uncerminty in tides is h e minimum ancient barrier hat stopped prehistoric tsunamis. Hence, the iast two prehistoric hmmis could have been lower than ahout 5 m (16 ft).
A prehistoric Cascadia tsunami run-up lower than 5 m is unlikely, because this height is similar bo the run-up elevation inferred for distant tsunamis. A local kcad ia event should produce much higher waves than n distant earthquake: given experience world wide and the modeling results of Baptism and othws (Chapter 2): For example. assuming a most probable tide, the run-up from distant tsunamis at the open u m t would be 2-4 m (7-13 ft) for a 10% 500 year recmnce. respectively, according to Houston md Garcia (1978). If tsunamis arrived at mean higher high water. run-up would be on Ute order of 3-5 5. The Houston and Garcia (1978) estimate is verified by the 1964 Alaskan a n i , which had it arrived at a mean tide, would have had a run-up of about 3 rn (10 ft) at the open coast: the actual run-up was at high tide. so it was about 4 rn (Schaa and others, 19M. Lander and others. 1993). and, unlike the Cascadia events. it left no sedimentary record in Siletz Bay m h e s (Cun D. Peterson, 1995, personal communication: Darienzo. 1991).
%s has been verified by more recent modding of earthquake sources and derivative tsunamis by Priest (1995).

Regarding the maximum banier height that blwked prehistoric tsunamis, any dune sand mantling the A-horizon marker mil would raise the estimated height of the barrier that sfopped ancient tsunarnls. Mantling sand was probably present, at least at the time of the 300 yr. B.P. tsunami, since the radiocarbon "clock" was started by burial approximately 800-900 years ago. European beach grass now present on the dunes is more efficient at stabiliztng and growing dunes than the native beach grass that was available 300 years ago, so the maximurn ancient barrier he~ght in the lowest of the dune barriers is Eikely the present height of 9-10 m (30-33 ft) plus the 1-2 m ( 3 6 fl) of uncertainty for sea level. Therefore the last prehistoric tsunami could have been as high as about 12 m (39 ftl and still have k e n blocked at the places predicted by tsunami sdiment distribution, assuming it came in on a low tide and that global sea level was about 0.5 m (1.8 A) Sower 300 years ago.
APPENDIX 1.2 SMALLSCALE TSUNAMI TMlNDATION MAPS SHOWING CORE SAMPLE SITES
Figures t .9 , 1.10, and I. 1 I are, respectively, smaI1-scale illustrations of the notth, central. and southern parts of the tsunami hazard map of GMS-99. These maps also show the location of the core samples taken to study prehistoric tsunami deposits and prehistoric soils buried as a result oi~oseismic subsidence (see Appendix I, I and Chapter 3 fot discussions of the core data).

Core site with buried soils; no r s u m i sznd layers; datebase label
Cora site with buried soils; one or more tsunami sand layers; datzbase label
----...--.-....--++- Bwndzrjline between areas of extreme 2nd high risk from lsunami flooding.
Boundzry line bswreen areas of high a d mderale risk lrwn tsunami flooding.
----------- Boundwy line bzhveen areas ol rnodzrala md low risk from tsunami tiding.
Figare 1.9. Tslalarni hazard map of lhe Devils Lake-Lincoln C i q area.


SILETZ BAY: A PILOT INVESTTGATION OF COASTAL INUNDATION BY CASCADLA SUBDUCTION ZONE TSUNAMIS
Anthia M. Baptista, W i g Qi, and Edward P. Myem Ill Center for Coastal and Land-Margin Research
Oregon Graduate Institute of Sdence & Technology
INTRODUCTION The possibly devastating consequences of a tsunami generated in the Cascadia Subduction Zone (CSZ), immediately off the Pacific Northwest coast, is a cause of concern for communities in Oregon. Washington, southern British Columbia, and northem California. White scientific evidence of past large earthquakes and associated tsunamis has been the subject of controversy, the debate now centers on characteristics and impact rather than on whether those events occurred. For a summary paper of current understanding of past events, see Atwater and others, 1995.
While the need for them is incontrovertible, efforts to develop mitigation, preparedness, and emergency response strategies in the event of a future CSZ earthquake have been hampered by a lack of scientific understanding. In pmic- ulat, there is no current agreement on source mechanisms, and, to a lesser but significant extent, there are quwtions on whether existing methodologies properly simulate regional propagation and coastal inundation of tsunamis. The pmblern is campounddl by the fact that no CSZ tsunamis have occurred in historical times, harshly limiting rht abil- ity of researchers to validate their hypotheses and models.
From apractical perspective, scientific uncertainties regarding tsunami generation, propagation, and inundation come down to a single question: what limits of inundation should be considered?
In the present pilot study, we attempt to conciliate scientific uncertainty with practical needs of Oregon communities, by (a) developing a methdology for gcnmtion of tsunami inundation maps for Silen Bay, and (b) criticalty analyz- ing the associated shortcomings.
The meWoIogy adopted i n this study involves a regional analysis (performed under separate funding1) and a local analysis (which constitutes the cote of this project), Tfie regional analysis was used to deveIop waveforms at about 50 m of water depth, off the Siletz coast, which were then used to investigate local inundation. Both the regional and the' local analyses rely primarily on numerical modeling, but different models are used in each case.
REGIONAL ANALYSIS
This section is based on research conducted under separate OSG funding', emphasizing the regional propagation of CSZ tsunamis. Dctailcd reports of this research are in preparation. Here, wt provide only a brief summary of methds and results that will Ix used to define the local tsunami forcing scenarios.
REGIONAL PROPAGATION OF CSZ TSUNAMIS
Generation Mechanism Strong controversy exists on the characteristics of the potential source of CSZ tsunamis. There is general agreement
I. A. Baptista (PI), 'Tsunami Propagation and Run-up in the Oregon Coast", sponsored by Ortgon Sea Grant.

that the primary source is seismic in nature, but there is disagreement on the magnitudes involved. In particular, does the entire fault mpture simultaneously (in a single large [e.g., Mw-8.8) event), or rather in a series of smaller leg., Mw-81 events separated by months to yenrs?
Also, there am indications (Adarns, 1990) that submarine landslicks may have hen triggered by past earthquakes, potentially furthering the tsunami energy and impact. However, the characteristics o f these landslides are mostty unknown.
We have considered several different scenarios, all based on seismic sources onIy (i.e., no associated landslide). Three are referred here. The reference scenario was extracted from Whitmore (1993), and consists of a magnitude 8.8 earthquake extending over much of the CSZ, with associated bottom excitation generated through the deformation model of Ohda (1985; Table 2. I). The first alternative scenario was that adopted by DOGAMI for Quakex 94 (a state-wide preparedness exmist. that took place in 1994)- and cornsponds to a smaller magnitude (M-8.5) carth- quake (Table 2.1). The second alternative scenario represents an artificial extreme, with the same general shape as the sea floor deformation of Hyndman and Wang (1993) but with a lateral position shifted west.
TabIe 21: Parametem used to generate bottom deformations for the refemnce and first alternative sauree scenarios
Numerical Model for Regional Tsunami Propagatfon The numerical model for regional tsunami gopagation is h a t described by Myers and Baptista (19951, and brieff y reviewed in Appendix 2.1. The model is based on the finite element solution of the shallow water equations, written in continuity-wave quation form to minimize numerical oscillations. No wetting and drying is allowed, land bound- aries being treated as vertical waIls.
Validation We strangly believe in the notion of validating numerical models against field data. Unfortunately, hydrodynamic field data for CSZ tsunamis is not available. As an attempt to partially circumvent the problem. "validation" of the regional PNW tsunami model was designed to include three phases Paptista and others. 1995):
Application of the mdel to the simulation of regional tides, This phase was considered critical, even if tides are peridic (rather than free) waves, and have typically longer ptriods and smaller amplitudes than tsunamis. Indeed. if accurate tidai rnodeIing does not fully validate associated tsunami modeling. incorrect tidal modeling would strongly indicate a fundamental inability to properly simulate tsunamis. Results generally compare very favorably with tidal data from non-shore stations (F~gure T.I), outside specific regions where bathymecric infor- mation available to us is poor.
* Comparison of our tsunami simulations with independent simulations by Whitmwt (1993). bsdts h r n both models arc similar within a few tens of percent, in most regions along the coast. While the generally good agree- ment between the two models is reassuring, this again provides only limited validation (neither model is com- pared against actual field data).
Application of the m d e l to the simdation of the I964 Alaska tsunami. This phase is in progress, and will consti- tute the k t opportunity to compare rndcl results with actual hydrodynamic tsunami data for the Oregon coast.
In addition, Myers and Baptista (1995) discuss limitations of the aappIication of tbe same numerical model to the 1993


Hokkaido Nansei-Oki tsunami. The model tends to under-predict observed run-ups, which is pastially due to its inability te describe inundation, and to the relatively coarse available bathymetry. However. inherent loss of energy is also identified, acharacteristic that may be common to all models based on shallow water equations, and that is cur- rently being investigated in more detail.
%le we do not consider the regional PNW tsunami model to be fully validated at this time, there is a large enough base of confidence on the model to use it to define local tsunami forcing for Siletz Bay, within the (large) uncenain- ties of this shrdy,
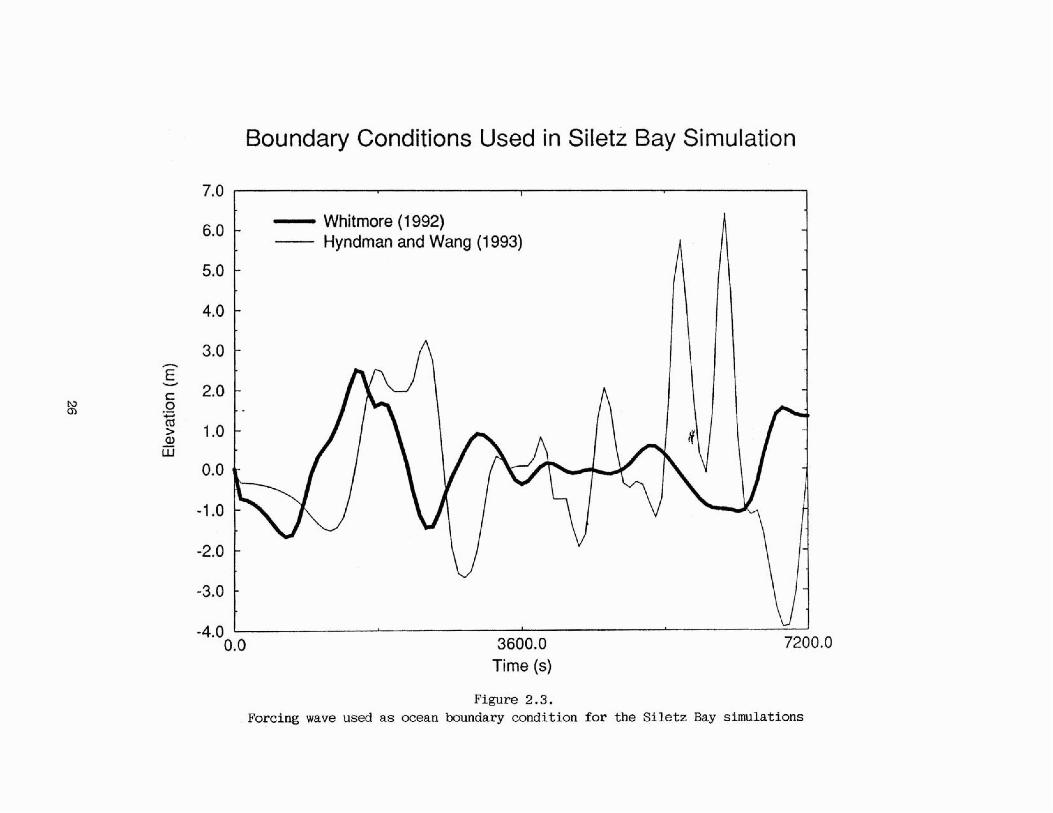
Regional Patterns and Tsunami Wave Heights st 50 m Depth off SUetz Bay Regional: patterns of maximum wave heights at the "shore" are shown in Figm 2.2, for the three generation scenarios described earlier. Wave patterns obtained (for the reference and second alternative scenarios) at the ocean boundary of the local inundation model, a b u t 50 m of water depth off the Siletz cmt, are shown in Figure 2.3. We observe in b ~ h figures the much Iarger wave heights generated by Scenario 3.
INUNDATION MODELING The modeling of coastal inundation is a complex exercise, whether the modeling is associated with tsunamis or with other long-wavw (e.g.. tides and storm surges). Modeling tsunami inundation in Siletz Bay poses an additional chal- lenge: the lack of appropriate data f w calibration and validation.
Desirable procedures for calibration and validation would involve as reference both (a) modeling of the wetting and drying of the bay due to tides, with comparison against field observations; and (b) modeling of inundation due to the 1964 Alaska tsunami, with comparison with field evidence. Unfwtunately, neither approach was feasible in the con- textofthis study:
approach (a), which is technicaIly feasible and potentialIy very valuable, requires a field program that, while rel- atively modest. was beyond the available funding;
approach (b) is technically unfeasible, because the signal of the 1964 tsunami was too smalI in Silea Bay,
Table 2.2: Definition of sensitivity tuns
Run
0
1 -
Whitmore (Ax2, Pxt) 50 m"kl -
Whitmore (Ax1 , Pxl ) 50 m'/2s'1
6 MHHW 1 m Whitmore (Axl, Px2) SQ m7/2s'1
7 MHHW I m Whitmore (Axl, Pxl) 25 m1/2s'1
8 MHHW 1 rn Whitmore (Axj, Pxl) 75 rn1I2s-'
Initial Sea Level
MSC
MS t
Subsidence
I m
I rn
Forcing wavea
Whitmore (Ax1 , Pxt )
Whitmore (Ax2, Pxl)
Chezy Coefficient (c)
50 m1/2s'1
50 rn112s'1

---- M 8-5 Earthquake {Qrmakex) - M 8.8 Earthquake ol Whitmore (1 992)
o Westward-Displaced Hyndrnan and Wang (1 993)
41 42 43 44 45 46 47 48 h g r e e s North tatltude
Boundary Conditions Used in Siletz Bay Simulation
Figure 2.3. Forcing wave used as mean boundary condition for the Siletz Bay simulations

a Ax and d denote the multiplying factors forthe *amplitude" and *period" of the forcing wave, mspectively. All waves were calculated with the regional PNW tsunami model, using source scenarios from either Whit- mom (1993) or a laterally displaced Hyndman and Wang (1993).
While we cannot fully circumvent the limitations imposed by the lack of data, we have attempted to minimize such limitations by performing a sensitivity analysis for critical parameters. Table 2.2 summarizes the asmiated simuia- tions, where the following factors were varied
* forcing waveform at the ocean boundary of the local inundation model; while the waveform shown in Figure 2.3 for the Whitmore (1993) source scenario was used as reference, its amplitude and pwicd were in a number of casts modified by simple multiplication: also, En one case we used as forcing the waveform shown in the same figum for the laterally displaced Hyndrnan and Wang scenario.
- sea level at the time of the earthquake;
* entent of land subsidence;
friction pmeterization.
NUMERICAL MODEL The m d c l chosen for the inundation simulations is a version of SWAN (Mader, 1988). The algorithm is publishbd in the open literamre, and has been used by its author and others in a number of previous tsunami inundation studies.
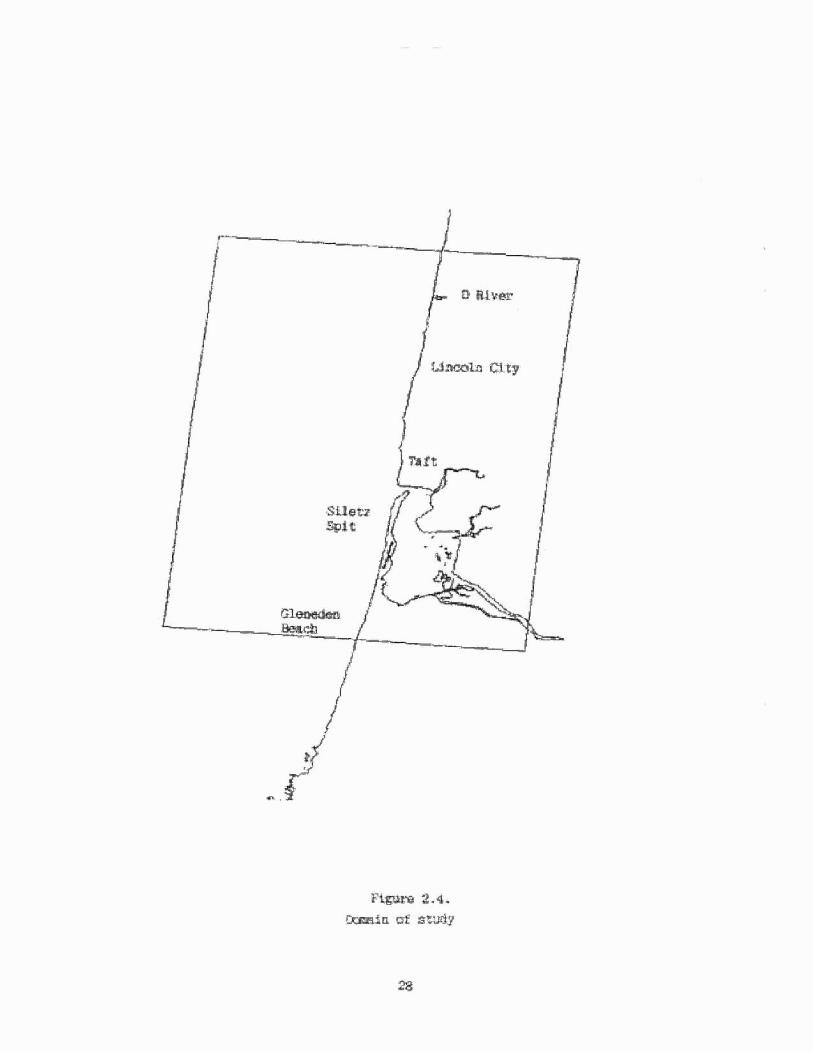
SWAN solves the shallow water equations using a finitedifference algorithm. In the present application, a grid of 40x40m was used to discretize the domain shown in Figure 2.4. Topo-hydrography was partially obtained from digi- tal elevation maps generated by aerial photography, cornpltmcnted in deeper water with N O M O S balhymetric data. Time steps of the order of 0.25 seconds were adopted for stability reasons.
ANALYSES OF RESUITS
W t i v i t p tn Friction
Friction is a key empirical parameter for modeling flow in general and inundation in particular. In SWAN, friction is parametrized through a domain-wide constant Chezy coefficient. We varied this cmfficient from 10 and 25 mlns" (the latter value suggested as typicd by Mader (1988)) to 50 and 75 mlns", values more typical of tidal applications in deeper waters). Of these values, the former corresponds to higher friction, i.e., larger resistance to in~ndation.
Results (Figures. 2.5 and 2.6) show only moderate sensitivity to friction, but the extent of inundation and the niaxi- mum wave heights decrease if friction is increased substantially (Chezy coeficient of 25 rn'"s-I).
While the recommendation of Mader (1988) Bears weight due to his considerable experience, we will argue that both the characteristics of the site (with an estuarine environment that shelters Taft and Cutler City from ditect impact of the 'tsunami wave) and, more importantly in the absence of field data, safety considerations require the use of a parametrization based on low friction. Furthermore, we will show that sensitivity to fiction is largely outweigftod by sensitivity to the forcing waveform. Hence. we will adopt a C h t y of 50 ml's-"or the rest of this study.


. t F w P q r k Bay m a .
Meters

Chezy coefficient 25 Chezy coefficient 50 Chezy coefficient 75
Sensitivity ta the frictlan pmu@trfratlan. hetmt~ w w water depth, w ~ t h l n SLlatz My, o r ( 1 I , ( h ) -?-?and ( c ) C - F ~ r n ? s - ~

The sensitivity of the inundation to the arnpZitude of the forcing wave was tested first by including a multiplicative "safety factor" between 2 and 4. Doubling the wave height is certainly justified because of the demonstrated inability, in recent tsunamis, of numerical models of regional propagation to fully represent observed data. The factor 4 was considered for consistency with the NOAA approach to Crescent City (where a I0 m amplitude wave was used as forcing).
Ksdts show, not surprisingly, that maximum amplitudes in the bay are extremely sensitive to this variation (Figure 2.7). Sensitivity of the limits of inundation (Figure 2.8) to the multiplying factor is significant up to a certain thresh- old (around 2), but less significant beyond that (mostly because of prevailing sharp topographic slopes). As a warning note, this lessened sensitivity applies only to the limits of inundation, not to the associated maximum amplitudes (Figure 2.7) and current velocities (not shown).
~orn~arimns of the impact of the reference forcing wave with an amplification of 4 with the forcing wave generated from the laterally displaced Hyndman and Wang scenario are shown in Figure 2.9. Results are strikingly similar with regard to maximum wave heights.
Sensitivity tn Other Factors Sensitivity to the prevailing level of the water (due to tides, storm surges, etc.) at the time of the tsunami and due to seismic subsidence. were grouped into the same analysis. The depth of the water in the bay, dative to MSL, was cor- rected by either 1 m, 1.3 m, or 2.3 meters. A comparison of the first and third cases is shown in Figure 2.10.
Sensitivity to numerical parameters (grid resolution, time step, etc) were also performed, but wilt not be shown here.
INUNDArnON SCENARIOS Based on the results ofthe sensitivity analysis, we defined three inundation scenarios for planning purposes:
Scenario SI: Referents forring wave, with initial W e r IeveE at MSL + I m Assumes that a large CSZ arthquake oceumd r n d . 8 1 , associated with a local subsidence of the order of Im. and that h e background water level remained during the duration af the tsunami close to MSL (i.e., very low coefficient tide). No safety factors are inbuduced. Planners should consider that inundated regions are at extremely high risk for any large CSZ earthquake.
Scmario S2: Rdemce fomlrtg wave amplijied by a fmtor qf2, with initial water level at MHHW + I rn Assumts that a large CSZ eanhquake occurred (Mw=8.8), associated with a local subsidence of the order of Im, and that the background water level remained during the duration of the tsunami c l ~ s e to MHHW. Moderate safety factors were included to account for uncertainty. Hanners should assume that the inundated regions ktween S I and S2 are at high rkk.
S c e ~ r i o 53: Rderencefol~ing wave amplified by a factor of 4, with initial water !eve1 at MHHW Assumes that a large CSZ earthquake occurred (Mw=8.8) with no local subsidence and that the background water Ievel remained during the duration of the tsunami close to MHI-IW. Large safety factors were included to account for uncertainty. Planners should assume that inundated regions between S2 and S3 are at moderate risk.
Inundation fines, defining the mnsition bbetween the parts of the domain that were ever wet and those that were always dry, were used by Priest et a!. (1995) to produce the final inundation maps.
CONCLUSIONS AND RECOMMENDATIONS Our investigation provides qualified insight on the potentid characteristics of local coastal inundation from a CSZ tsunami. In particular:
Open mast

Depth
%mtivfty to tbe forcirtg wave. lkxhm mvm high- rrsrsus mter depth, wi th in Sllutz Bay, fos dFffermt hmpliiiEnSioa factom for tba tefemce mwfonnc (a) d; ( b f xZ; ( c ) x4.
.- - 7,'s ;*I -. , ,,,-- . :+: : *><--, - .L -= q ,. L,CJL*. ,. . * ,- :, ,,, L . ' - I*.
. - L - -A-;.
Meters
F-Lg.zre 2,.8a. SansLtirl,tg to the farcimg wave. Irbw nE r~ximum wise h i g h t s Ln t%the 9FlmLe my krm, for the taLlcnrFng forcing w w r s wanarCo XI.


F m 2 . k . Ssnaltiafty to the forclog ram. Map of mrfmum mtw Migbta i n tb Sllefx $np gtea, for the fo l lwing f m i n g raTm 6ceni~Lo x4
37

WhRm~re;A x 4 - Hyncirnan and Wan9

0.0 -6.0 -4.0 -2.0 0.0 2.0 4.0
Depth (m) Figure 2.10.
Sensitivity to t he initial water level. Maximum wave htights versus water depth, within Siletz Bay, for i n i t i a l levels at (a) MSL+1 m; and (b) MSb2.3 rn.
CSZ tsunamis are expected to result in significant wave heights at the coast throughout the study area. For a M=8.8 CSZ eanhquake, wave heights at the coast should be assumed to be of no I a s than 4-6 m above the pre- vaiUng sea level. T h i s range is consistent with not only our simulations in this investigation, but also with regional tsunami simulations made elsewhere (Myers and Bapfista, 1995; Whitmore, 1993).
Siletz Bay SiIetz Spit is an important protection mechanism for Siletz Bay. If the spit is not extensively overtopped (Sce- nario S 11, inundation and damage within the bay will be relatively localized. However, if a significant extent of the spit near the mouth of the estuary is overtopped, inundation will likely be generalized and severe. In this case, inundation is asentiakly limited only when the incoming wave reaches regions of sharp topographic dopes. Because of this, the similarity of the horizontal extents for some of the tsunami scenarios analyzed in this work is misleading: similar horizontal extents do not in any way imply similar wave heights and similar flow velocities.
It has to be recognized that the inundation maps derived in this investigation reflect significant uncertainties and tim- itations, due to the fallowing key factors:
unceminty in the characteristics of the himer CSZ earthquaker;
possibility of associated IandsFIdes;
lack of data to calibrate the tsunami models:
inhmnt Imitations of the numerical models2.
In addition, the limited budget and scope of this project were constraining with regard to aspects that are technically achievable. In particular, we used a single inundation model ( w k prudence recommends a crass-check with an independent model, such as Beck and Baptists, 19951, and we had no resources to deploy instrumentation to monitor tidal propagation in the tidal fiats (hence, losing the opportunity to obtain field data that are achievable and vahable for partiaI validation).
Givcn the uncertainties and limitations discussed above, we recommend that the inundation maps derived in this investigation be used only for:
emergency planning;
preparedness through community education; and
emergency mpx.
We consider the maps unsuitable for any other purposes. including but not mhicted to mandatory land-use planning and establishing insurance policies andlor rates.
REFERENCES Adams, J., 19W, Paleoscismeicity of the Cascadia Subduction Zone: evidence from turbidites off the Oregon-Wash-
ington margin: Tectonics. v. 9. p. 569-583.
1. A more recent investigation into CSZ source parameters (Rjest, in preparation) has increased our under- standing of this factor. However. uncertainties remain, and the new investigation d m not invalidate our conclusions.
2. The regional CSZ tsunami made! used tu dtfine thc incident wave off Siltn! Bay has now k e n refind (Myers and others, in prepamtien), in particular by accounting for inundation. The new investigation does not invalidate the conclusions of the present study

Atwater, B.F.. Nelson. A.R.. Clague, J.J.. Carver, G.A.. Yamaguchi, D.K., Bobowsky, P.T., Bourgeois, J., Darienzo. M.E., Grant, W.C., Hemphill-Haley, E.. Kelsey, H.M..Jacoby, GG.., Nishenko, S.P., Palmer, SP,, Peterson, C.D., and Reinhan. M.A.. 1995, Summary of coastal geologic evidence for past great emhquakes at the Cascdia Sub- duction Zone: Earthquake Spectra. v. 11, no. 1, p. 1-1 8.
Baptisfa. A.M., Myers, E.. Qi, M., Beck, B., Priest G.R., and Peterson, C.D., 1985, Tsunami propagation and inunda- tion fram Cascadia Subduction Zone earthquakes: tools and approaches: IAPSO, Hawaii. August 1995 (absaact).
Beck, B.. and Baptista, A.M., 1995, Accuracy and conservation properties of a 2D inundation model: IAPSO. Hawaii. August 1995 (abstract).
Mader, C.L., 1988, Numerical modeling af water waves: University of California h s s . Myers, E.P., Baptism, A.M., and Priest, G.R., in prepantion, Finite element modeling of hypothetical Cascadia Sub-
duction Zone tsunamis. Myers. E.P.. and Baptista, A.M., 1995, Finite element mdeling of the July 12, 1993 Hokkaido Nansei-OK tsunami:
Pure and Applied Geophysics, v. 144, no. 3/4. p 107Q- 1 102. Hyndrnan. R.D., and Wang, EC. 1993, Thermal constraints on the zone of major thrust earthquake failure: the Casca-
dia Subduction Zone: Journal of Geophysical Research. v. 98, no. B2, p. 2039-2060. Okada, Y.. 1995, Surface defmation due to shear and tensile faults in a half-space: Bulletin of the SeismologicaF
Society of America, v. 75, no. 4, p. 1 135-1 154. Riest, G.R., in preparation, Explanation of mapping methods and use of the tsunami hazards maps of the Oregon
Coast; Oregon Department of Geology and Mineral Industries. Open-File Report, 0-95-63. Priest. G.R.. Baptisra. A.M.. Qi, M., and Peterson, C.D., 1995, Tsunami hazard map of the Sifetz Bay area, LincoIn
County, Oregon: DOGAM Technical Report. Savage, J.C.. 1983, A dislocation model of strain accumulation and rebase at a subduction zone: Journal of Geophys-
ical Research, v. 88, p. 4984-4996. Whitmore, P.M., 1993, Expected tsunami amplitudes and currents along the Nwfh American coast for Cascadia Sub-
duction Z one earthquakes: Natural Hazards, v. 8, p. 59-73.
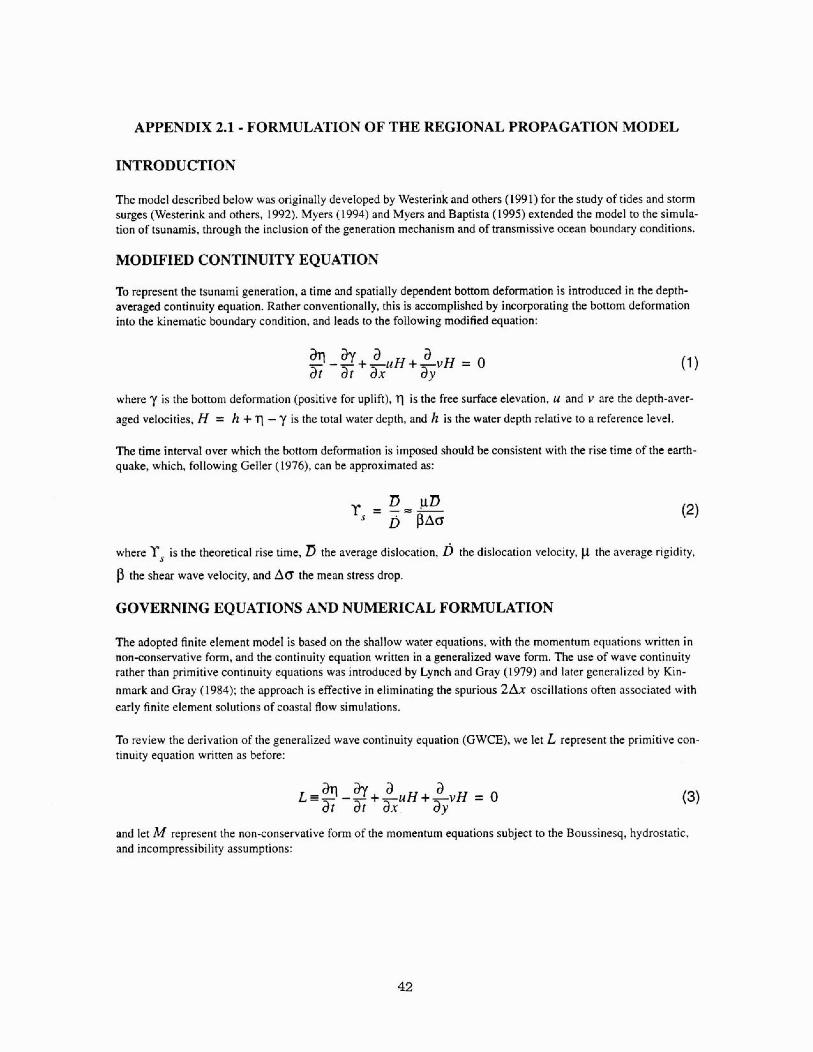
APPENDIX 2.1 FORMULATION OF THE REGIONAL PROPAGATION MODEL
INTRODUCTION
The model described below was originally deveIoped by Westerink and others (1991) for the study of tides and storm surges (Westerink and others, 1W2). Myes (1994) and Myers and Baptista (1995) extended the model to the sirnula- tion of tsunamis, through the inclusion of the generation mechanism and of transmissive ocean boundary conditions,
MODIFIED CONTINUITY EQUATION
To represent the tsunami generation. a time and spatially dependent bottom deformation is intmduced in the depth- averaged continuity equation. Rather conventionally. this is accomplished by incorporating the bottom deformation into the kinematic boundary condition, and leads to the following modified equation:
where y is the bottom deformation (positive for uplift), r( is the free surface elevation, u and v are the depth-aver-
aged velocities. H = h + 7 - y is the total water depth, and h is the water depth relative to a reference level.
The time interval over which the bocrom deformation is imposed should be consistent with the rise time of the earth- quake, which, following Geller (1976), can be approximated as:
when rS is the thewetical rise time, the average dislocation. D the dislocation velocity, the average rigidity,
p the shear wave velocity, and AD the mean stress drop.
GOVERNING EQUATIONS AND NUMERICAL FORMULATION
The adopted finite element model is based on the shallow water equations, with the momentum equations written in non-conservative form, and the continuity quation written in a generalized wave form. The use of wave continuity nth- than primitive continuity equations was introduced by Lynch and Gray (1979) and Eater generalized by Kin- nmark and Gray (1984): the approach is effective in eliminating the spurious 2dr oscillations often associated with early finite element solutions of coastal flow simulations.
To review the derivation of the generalized wave continuity equation (GWCE), we let L represent the primitive con- tinuity equation written as before:
and let M represent the non-conservative form of the momentum equations subject to the Boussinesq, hydrostatic, and incompressibility assumptions:
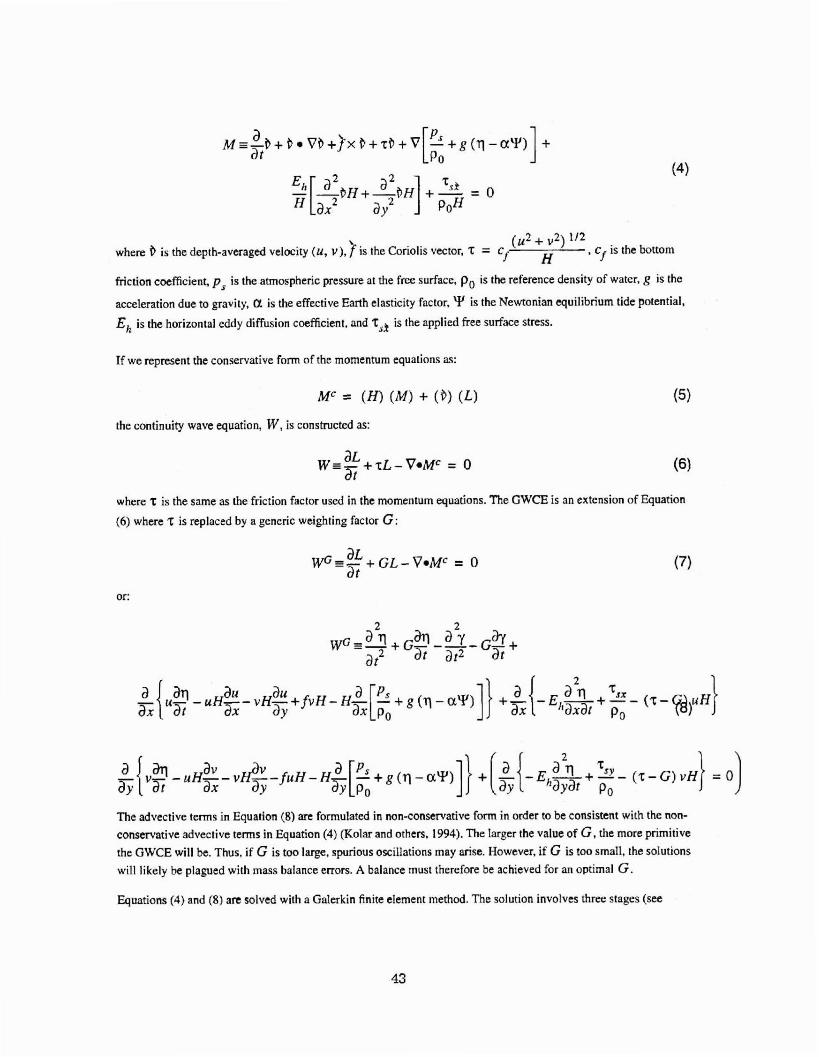
where b is the depth-averaged velacity (u, v ) , f is the Coriolis vector, T = cf (u2 4- v2) I r2
H , cf is the bottom
friction coefficient, p, is the atmospheric pressure at the free surface. Po is the reference density of water. g i s the
acceleration due to gravity, is the effective Earth elasticity factor, Is the Newtonian equilibrium tide potential,
Eh is the horizontal eddy diffusion coefficient, and T,* is the applied free surface stress.
If we represent the conservative form of the momentum equations as:
MC = CrJ) (MS + I*) IL)
the continuity wave equation, W, is constnrcted as:
where T is the same as the friction factor used in the momentum equations. The GWCE is an exension of Equation
(6) where T is replaced by a generic weighting factor G:
or:
The advcctivt terms in Equation (8) are formulated in non-conservative form in order to be consistent with the non-
conservative adveetive terns in Equation (4) (Kolar and others, 1994). The Iargcr the value of G , the more primitive the GWCE will k. Thus, if G i s too I q e , spurious miIIations may arise. However, if G i s too small, the solutions will tikely be plagued with mass balance e m . A balance must therefore be achieved for an optimal G.
Equations (4) and (8) are solved with a Galerkin finite etemcnt method. The solution involves three stages (see

Luettich and others, 1941, and Westerink and others. 1992, for details): first, symmetrical weak weighted residual statements are developed for the GWCE and primitive momentum equations; second, the equations are time-dis- cretized, with either two or t h m time-Ievel schemes applied selectively to different terms within each equation; finally, the finite element rnethd is implemented, by expanding the variables over h e a r triangular elements. devel- oping discrete equations on an elemental level, assembling global systems of equations, and enforcing boundary con- ditions.
BOUNDARY CONDITIONS
The original model alIows for the specification at the boundaries of either elevations (enforced in the discrete GWCE equation) or normal velocities (enforced in the discrete momentum equations). We have added the ability to specify imnsmissivc boundary conditions. enforced in the discrete GWCE equation.
Transmissive boundary conditions are imposed by first backtracking from the boundary node In the direction ofthe incoming wave and then interpolating the elevation from the previous time step at that spatial location. The incident angle of she incoming wave is approximated as,
The wave is backtracked a distance,
in the direction prtscrikl by 0 . Once h e backtracked positions (Xinr, Yi,,) are known, the elevation fmm the
previous time step may bc inttrpolahd from the appropriate element. The new elevation at the boundary node may then bE set equal to this interpolated old elevation, thus allowing the wave m leave the domain of interest. The trans-
missive boundary condition should only be imposed if $ * h > 0 and if the velocities are not relatively small com- p a d to what is expected for a patticular simulation.
Geller, R.J., 1976, ScaIing reiation~ for mhquake source parameters and magnitudes: Bulletin of the Seismological Society of America, v. 66, no. 5, p. 1501- 1523.
Kinnmark, I.PX., and Gray, W.G.. 1984, An implicit wave equation model for h e shallow water equations: Advances in Water Resources, v. 7, p. 2- 14.
Kolar, R.L., Westerink, J.J.. Canttkin. M.E., and Blain, C.A., 1994, Aspects of nonlinear simulations using shdlow water models based on the wave continuity equation: Computers and Fluids, v. 23, no. 3, p. 523-538.
Luettich, R.A.. Westerink. J.J., and Scheffner. N.W., 1991, ADCIRC: an advanced three-dimensional circulation model for shelves, coasts, and estuaries: Dept. of the Army, U.S. Army Corps of Engineers, Washington, D.C.
Lynch. D.R, and Gray, W.G.. 1974, A wave equation mode1 for finite element tidal computations: Computers and Fluids. Y. 7, no. 3, p. 207-228.
Myers. E.P., 1994, Numerical modeling of tsunamis with applications to the Sea of Japan and the Pacific Northwest: M.Sc. thesis. Department of Environmental Science and Engineering, Oregon Graduate Institute of Science tk Technology. Portland, OR.
Westerink, JJ., Luettirh, R.Z. Baptists, A.M., Scheffncr, N.W.. and Farm, 1992,. Tide and storm surge predic- tions using a finite eItment model: ASCE Journal of Hydraulic Engineering, v. 118, no. 10, p. 1373-1390.
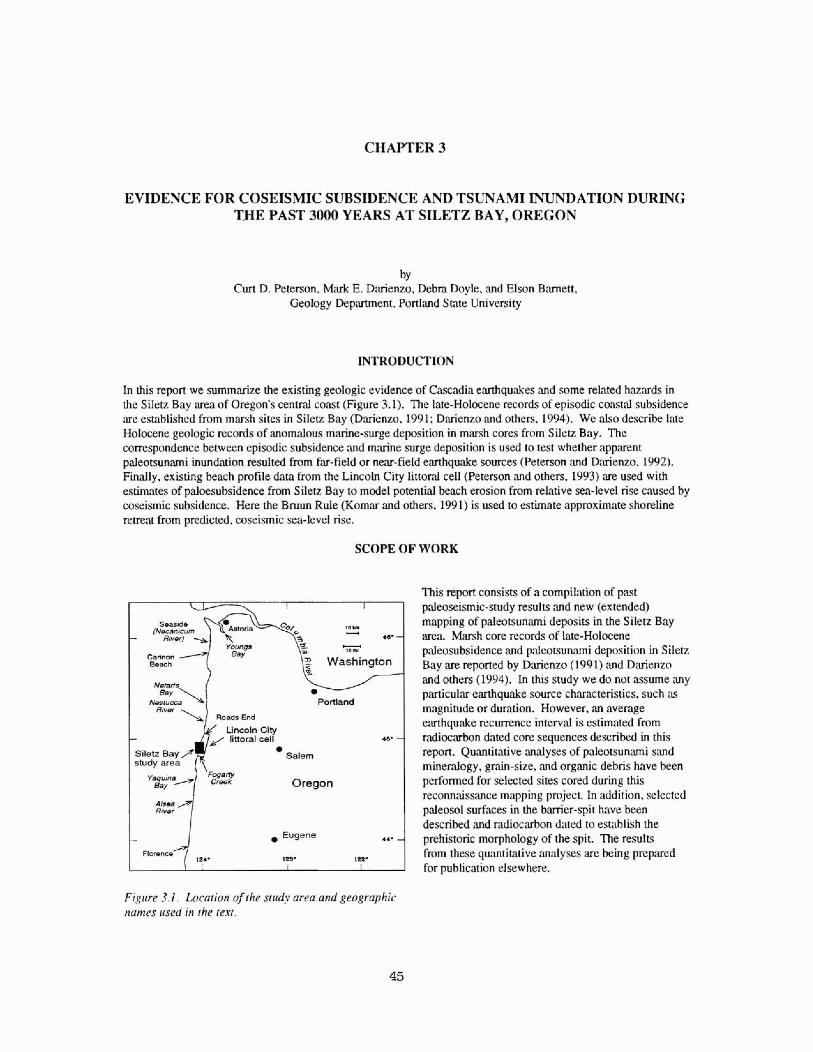
CHAFTER 3
EVIDENCE FOR COSEISMIC SUBSTDENCE AND TSUNAMI INUNDATION DURING THF: PAST 3000 YEARS AT SILETZ RAY, OREGON
Iby Curl D. Peterson. Mark E. Dwienzo, Debra Doyle. and Elson B ~ n e t t .
Geology Department. Portland St.itte University
In this report we summarize the existing geologic evidence of Cascdia earthquakes and some rehted hm,uds in the Siletz Bay ma of Oregon's central coast (Figure 3.1). The late-Holocene records of episodic coastal subsidence mire established from marsh sites in Silek Bay (Dximzo. 199 1: Darienzo and others. 1994). We also describe late Holocene geologic records uf momalous marine-surge deposition in m,mh cores fmm Silea Bay. The correspondence between episodic subsidence md maine .surge deposition is used to test whether apparent pdeotsunmi inundation resulted from far-field or near-fi eId earthquake sources (Petersan md Daienzo. 1992). Findly, existing beach profile data from the Lincoln City littonl cell (Peterson and orhers. 1993) me used with estimates of pdoesubsidence from Silen Bay to model potenlid bench erosion from rehtive sen-level rise caused by coscismic subsidence. Here the Bruun Rule (Kornar and others. 1991) is used ta estimate approximate shoreline wmnl from predicted, coseismic sea-level rise.
SCOPE OF WORK
This report consists of a compilation of past pdeoseismic-study resuIrs and new (extended) mapping of pkmtsunmi deposits in the SiIetz Bay m a . Mtmh mre records of late-Holocene pnleosubsidencc and pnlrotsun,uni deposition in Siletz Bay me reported by Darienzo ( 1991 ) ,and Darienzo md others (1994). In this study we do not nssume any p,uticul,u eanhquake source characteristics. such as magnitude or duration. However, .m average errrthquake recurrence interval is estimated from radi0c;lrhon dnted core sequences described in this repon. Quantitative mdyses of paleotsunani sand minedogy. gnin-size. and organic debris have been perFwmed for setected sites cored during this reconnaissance mapping projecl. In addition. selected paleosol surfaces in the barrier-spit have been described ,and ndiocmhan d:~td to establish the prehistoric morphology of the spit. The results from these quimti~live m:dyses itre being prepitred for puhlicntian elsewhere.
arrprr p Rwor
-
Fi-~ltre 3.1. Location of rhe strrdv area and geographic nurnes usrd it1 the rp.yt.
. Eugene 44. - F l m e
I p 3 . lek 1 I

Earthquake related hazards of post-subsidence flooding and beach erosion in Siletz Bay me based on estimates of coseismic vertical displacement implied hy peat development (pdeotidal indicator) in mmh cores (Table I . I). Verificatian of the peat development with tidal indicator macrofossils (tree roots and plant rhyzornes) and with tidal indicator microfossils {diatoms) has been performed in Nems Bay IDarienzo and Peterson. 1940). The application of these pdeotidal indicators to infer small amounts of coseismic displacement (less than one meter) on the central Oregon coast has been reported previoudy (Peterson and Darienzo, 1992). Additional data (unpublished) en regional coastal subsidence associated with h e last Cascadia dislocation labour 300 yean BP.) is used to verify local subsidence estimates from the Siletz Bay core sites.
TABLE 3.1. WETLAND SElTNGS, ELEVATTOHS M D PEAT ABUNDANCE IN CEfrrTRAt OREGON RAYS
Mhsh Setlings Elevation Percent Percent Core Log In Central Oregon (m) Wr'L* peaty Organics Key
Visual** LOT***
ForestJShrub 2.0 2 0.25 >80% ~50% Pea4T1~:e Roots High Marsh 1.5 * 0.25 50-8096 20-50s Muddy Peat Transitional Marsh 2.25 rt 0.25 20-50% 10-20% Peaty Mud Low Marsh 0.75 * 0.25 520% -10% Slightly Pea@ Mud Colonizing Marsh/ 0.5 * 0.25 1-5% ~ 5 % Rootad Mud or Mud Mud Flat
* Meters above Mean Tidal Level (MIL). Note: that there is significant overlap of marsh setting elevations shown in this regional compilation, Marsh settings at individual marsh sites typically show less variability in tidal elevation. The marsh settings, tidal elevations, petcent peaty and percent organics used in this table are compiled from data from several central Oregon bays including Y aquina Bay (Dkenzo and Peterson, 1990; Daricnzo, 2 99 1; Petmon mid Darienzo, 1992). ** Visual estimate of peaty material as percentage of core surface area *** Organic weight fraction from Loss On Ignizi.tion (LOO.
FIELD STUDY METHODS
A total of 51 core sites have ken logged in late-Holocene marsh deposits of Siletz Bay (Figm 3.2; Table 3.2). The smategy of core site selection was based on tracing the landward h i t of apparent deposition of anomalous sand-sheets capping abruptly buried marsh surfaces. Hand coring by gouge cores (25 cm diameter) was used for remaissance surveying of marsh and sand capping lnym (SCL) stratigraphy. Representative sites were vibn- cored (7.5 cm diameter) for radiocarbon dating of peaty layers (Darienzo. 199 1). Core depths of one to w e d meters were limited by either refusal, or termination of peaty deposits in basal sands or barren mud. Recovered corm were logged to the n m t centimeter for lithology, contact relations, pdeotidal-level indicators, and SCL thickness (Darienzo, 199 1). Marsh cores were taken in high marsh -to spruce wetland settings, 1.5 f 0.5 rn above mean tidal level (MTL). Some of the sites have been surveyed into MTL (Darienzo, I99 1 ) but for this teport all site elevations are estirnared from point elevation dam and 1.5 m (5 ft) topogrphic contours on the 1 :4R00 scale onhophotographic h e map (Table 3.2). Errors in the contours are about f 0.8 m (2.5 ft); emrs in the point elevation data are f 0.4 rn (1.25 ft). The exaemely Iow relief of the marsh sites and densiry of point elevation data Jlowed vertical conml for nearly all sites ro approach i0.4 rn (1 -25 ft). Differences berwwn geodetic mean sea level assumed for the base maps and local mean sea level does not exceed 0.45 rn (15 ft). so total root mean square error on most elevation measurements is about f 0.6 rn (2.Q ft).

H
Tsunami sand present
0 Tsunami sand absent
I) Tsunami sand absent in some holes
X > 30' elevation on Salishan S
Figure 3.2. Location of core sircs. See the tsarnami hazard map for detaited localions and topograpkv.
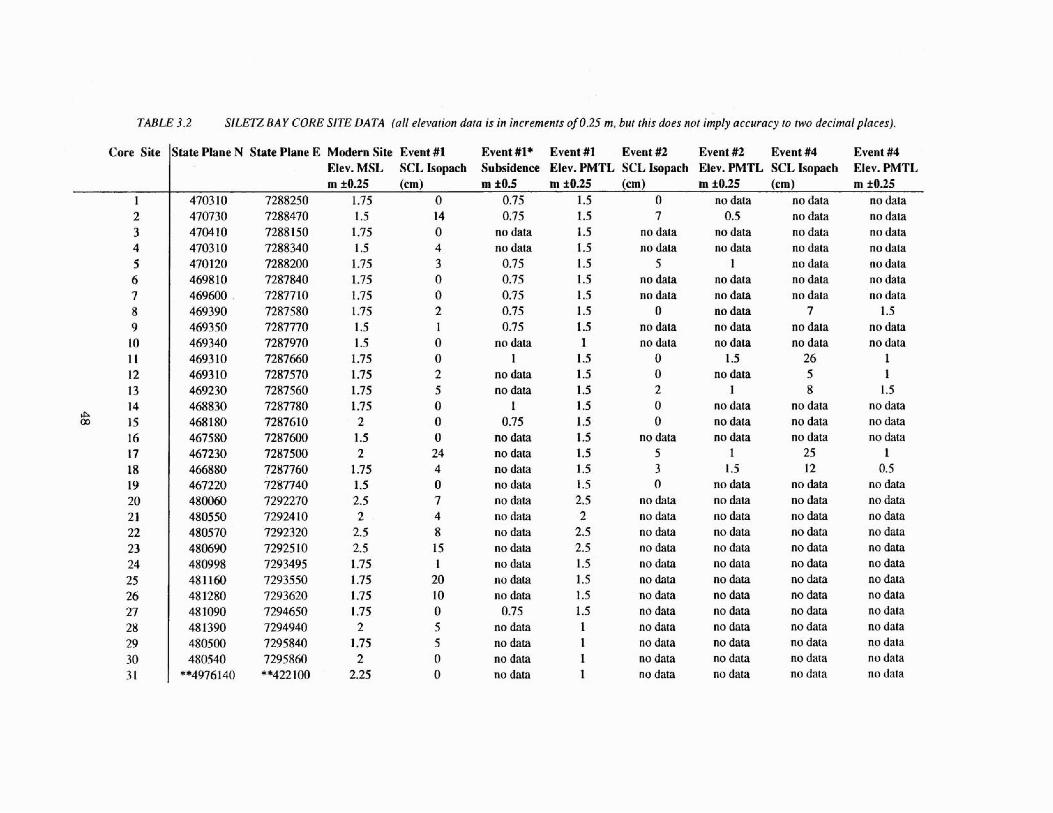
TABLE 3.2 SILEIZ BA Y CORE SITE DATA (all elevafion dara is in increments of025 m, but this does nor imply accuracy to two decimal places).
Core Site State Ptane N State Ptane E Modern Site Event #I Elev. MSI, SCI. Jsop~lch rn k0.25 (m)
4703 10 7288250 1.75 0 470730 7288470 1.5 14 4704 10 7288 3 50 1.75 0 4703 10 7288340 1.5 4 470120 7288200 1.75 3 46981 0 7287840 1.75 0 469600 72877 10 1.75 0 469390 7287,480 1.75 2 469350 7287770 1.5 1 469340 7287970 1.5 0 4693 10 7287660 1-75 0 469310 7287570 1.75 2 469230 7287560 1.75 5 468830 7287780 1.75 0 468 180 7287610 2 0 467580 728760 1.5 0 467230 7287500 2 24 466880 7287760 1.75 4 467220 7287740 1.5 0 480060 7292270 2.5 7 480550 72924 10 2 4 480570 7292320 2.5 8 480690 72925 I0 2-5 15 480998 3293495 1.75 1 481160 7293550 1.75 20 48 1TBO 7293620 1.75 10 481090 7294650 1.75 0 481390 7294940 2 5 4805 01) 7295840 1 -75 5 480540 7295860 2 0
**4976140 **422 100. 2.25 0
Event #I* Event #I Event #2 Event #2 Event #4 Subsidence Blev. PMTL SCL lsopach Elev. PMTL SCL Jsopach m i O . 5 m i025 (cm) m i0.25 (cm)
0.75 1.5 0 no dara no data 0.75 1.5 7 0.5 no data
no data 1.5 no data no data no data no data 1.5 no data no data no data 0.75 1.5 5 1 no data 0.75 1.5 no data no data no data 0.75 1.5 no data no data no data 0.75 1.5 0 no data 7 0.75 1.5 no data no data no data
no data 1 no dam no dam no data I 1.5 0 1.5 26
no data 1.5 0 no data 5 no data T ,S 2 I 8
I P .5 0 no data no data 0.75 1.5 0 no data no data
no data 1.5 no data no data no data no dam 1.5 5 I 25 no dam 1.5 3 1.5 12 no data 1.5 0 no data no data no data 2.5 no data no data no data no data 2 no data no data no data no dab 2.5 no data no data no data no data 2.5 no data no data no dam no data 1.5 no data no data no data no data 1.5 no data no data no data no data 1.5 no data no data no dara
0.75 1 .S no data no data no data no data 1 no data no data no data no data 1 no data no data no data no data I no data no data no data no data 1 no data no data no data
Event #4 Eler. PMTL rn f 035
no data no data no data no dala no data no data no data
1.5 no data no data
1 1
1.5 no data no data no data
1 0.5
no data no data no data no dala no data no data no dala no data no data no dora no data no data no data

Core Site State Plane N State Plane E Modern Event #l Event #I** Event #l Event #2 Event #2 Event #4 Site* Elev. MSL SCL bpacb! Subsidence Elev. PMTL SCL Xsopxh Elev. PMTL SCL Lsopacb m f025 (em) rn k0.5 m *025 (cm) m f035 (cm)
***4976140 ***422100 2.25 0 no data 1 no data no data no data 4764 10 72925 10 2 0 0.5 1.5 no data no data no data 473590 7295500 1.5 0 0.75 1.5 0 no data no data 475450 7295400 1.75 5 no data 0.5 no data no data no data 476090 7295850 2 2 no data 1 no data no data no data 476390 7296070 2 0 no data 1.5 no datlt no data no data 470900 7293400 1.5 no data 0.75 1.5 5 1 no data 4681 SO 7294M-10 1.75 0 no data 1 no data no data no data 465310 7292850 1.25 0 no data 1 no data no data no data 465240 7292970 1.5 0 no data 1 no data no data no data 465 T 57 7292990 1.75 0 no data 1 no data no data no data 465440 7293600 1-23 0 no dam 1 no data no dam no h t a 466220 72945 I0 1.5 0 0.35 1.5 no data no data no data 466050 72941 80 1.25 0 no data 1 no data no data no data 46566Q 7295580 1.5 0 no data 1 0 no data 20 465270 7295690 1.5 0 no data 1 no data no data no data 465460 7296590 1.35 5 no data 1.5 5 1.5 no data 464&50 7296250 1.5 0 0.5 1.5 0 no data 7 464450 7296240 1.25 0 0.25 1 no data no data no data 463590 7299120 2 0 no data 1.5 no data no data no data
***4970 150 ***423920 2 0 no data 1 no data no data no data
Event #4
Elev. PMTL m i0.25
no data no data no data no data no data no data no data no daFa no data no data no data no data no data no data
I no data no data
T no data no data no data
* Modem Site Elevation is taken from averaged pasm surface, or 0.5 m below vegetation surface in high marsh as shown the orthophotographic base base map ** Data from sekcted cores that do not include palmtidal indicators such as barren tidal flat muds or forest soils with no well defmd upper or lower elevation
limit.. *** UTM coordinates (used for sites immediately east of the study area for easy reference to USGS quadrangles)
Abbrevia~ions M S L M e a n Sea Level PMTkPaleo-mean tidal level

MARSH CORING RESULTS
SALISHAN SPIT CORE SITES
Cme logs from 51 sites in SiIefz Bay are shown m A p p d i x 3.1. and corresponding radioarbon dates arc in Appendix 3.2. The cores were examined for the p w n c e of abruptly buried marsh surfaces and anomalous sand capping layers (SCLs). Beginning with the Siletz B y hack-barrier (SaIishan Spit) shes SB 1-SB 19 there are 16 marsh core sites showing evidence of at least one subsidence event at mughty 0.5 rn depth subsurface. Radiocarbon d m (SB17) suggest hat this latest Holocene subsidence event at the western end of Siletz Bay corresponds to the last Cascadia dislocation event (31X) calendric years ago: Darienzo md others, 1994). PcnomaPous sand layers (1-15 cm thick) cap this buried peaty horizon in ten of the 19 core sites. Sites SB8. SBII. SB 12, SB 13, and SR18 also have sand w muddy sand layers a h v e the last subsidence event. possibly representing marine surge ovmash or dune slipface advance, mt amiated with l ~ a l coseismic subsidence. Additional coring is needed to estabIish the origin of these young (possibly historic) sandy layers.
Nine of the back-bwrier marsh sites bave two or more recorded subsidence events denoted by buried paty horizons (Appendix 3.1). Sites SBI 1 and SB 17 bave four to five buried peats each, Upcm siti ions include peaty mud to slightly peaty mud. sIightly p a y mud to roote4bmen mud. and p a y mud to 'barren mud. These msitions indicate a range of 0.5 to 1.0 rn submergence (Table C. 1). The Fourth buried peaty horizon in site SB 17 (subsurfam depth of 220 cm) has a n d i m u k n age of about 1,700 Radiocarbon Years Before Present ( R U B .P. or ''C yr B.P.).
An anomalous sandy layer (2-5 crn thick) occurs within peaty horizons at about 75 crn subsurface deph in con: sites S B2, SB5, and SB 17. Additional core sites at the eastern margin of rhe bay also record this anomalws sandy layer, which is not associated with a local pdmsubsidence event. The thickwt S C L (up to 25 ern thick) found in deep marsh sites SB 1 I, SB 17, and SB 18 occurs at ahuut 1.5 rn depth subsurface. The pat underlying this unusually thick SCL has a docarbon date of 1.500 RCY BS. at site SB17.
7he dis~butions of cores with SCLs appear to correspond t~ locations either (1) just landward a€ low p a s s in the southern end of the barrier spit or (2) along the bay margins of the northemost back-bmier marsh (Figure 3.2: see tsunami hazard map). These disaihutions argue for two origins of marine surge deposition, including localized barrier-spit overtopping from h e wwt (sites SB 17, and sites SB8, SB 12 and SB 13) and bay shoreline deposition frorn the east (sites SB2, SB4 and SB5). SCL deposition is absent along the bay side of the back-barrier marsh south of site SB5. This SCL pinchout ro the south implies surge attenuation with increasing distance from either the tidal inlet andlor from the river-tidal channels to the northeast. Additional work i s needed to test for possible SCL deposision along the southem bay shorelmes. which are presently diked and filled.
SCHOONER CREEK CORE Sll'1ES
A toml of eleven marsh cores (SB20-SB311 have been taken from wetlands in back of the Taft Elementary and Intermediate Schools. and along Schooner Creek (Figure 3.2: Appendin 3.1). One anomalous sand horizon (210 cm thick) is comlated hy relative depth (about 0.5 m subsusface) among the Taft care sites (SB20-SB23). This anomalous sand layer occurs in wedand (forest) soils that are younger than 1.100 RCT B.P. These Taft wetland sites are separated from the bay mouth shoreline to the west by an eolian bay-bawier shoreline (present elevation +35 m MSL). The anomalous sandy laympinches-out to the northeast of site SB23, indicating a marine surge origin from the west. over the bay-shore barrier.
By comparison, ScJts are associated with a buried peaty hwizon correlated by depth (about 0.7 cm subsurface) in Schooner Creek marsh sites SB24-SB26, and SB28-SB29 (Appendix 3.1). This SCL mches a maximum t h i c h s s of about 20 cm at a pint bar site Sl325, where it overlies a peaty horizon dated at about 600 RCT BP. This SCL is derived from a marine surge which propagated up Schooner Creek frorn i ts confluence with the main channel at !he bay mouth. The SCLs dong Schooner Creek upstream of the sewage treatment plant (see ponds on Plate 3.1) decrease in thiclatess with distance away from the present channeI (sites SB27-SB28. and SB29-SB30).
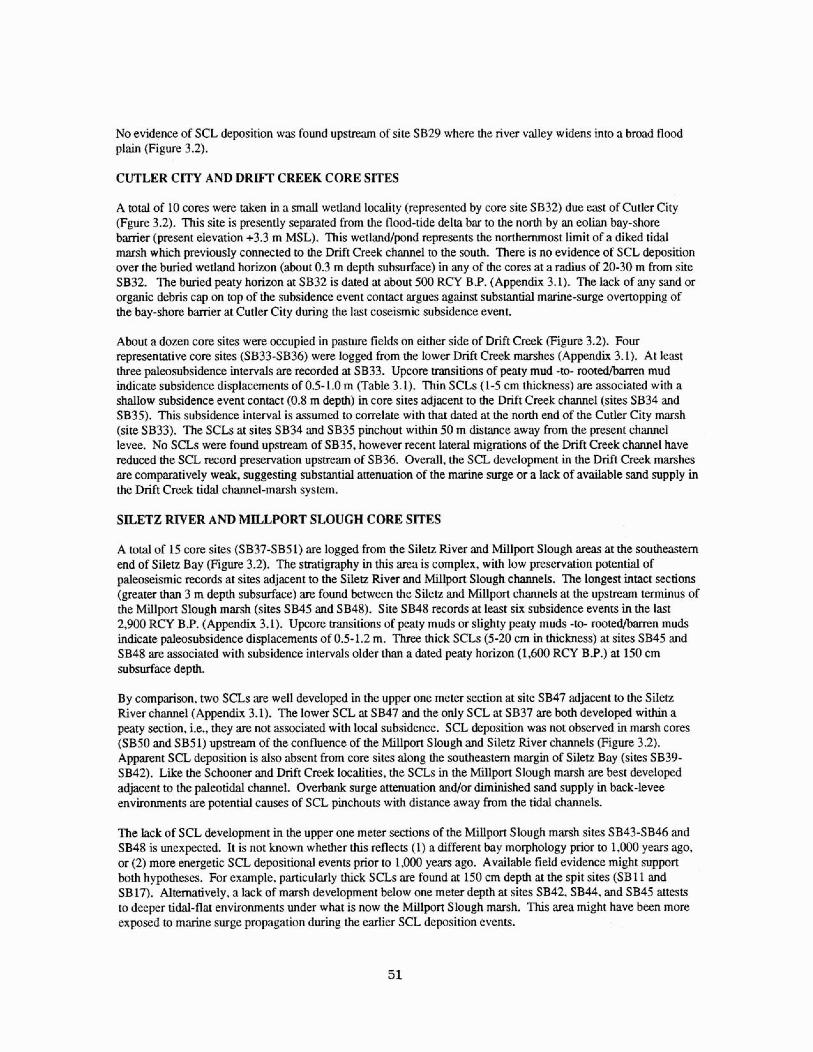
No evidence of SCL deposition was found upstream of site SB29 where the river valley widens into a h a d flood plain (Figure 3.2).
CUTLER ClTY AND DRlFT CREEK CORE SlTES
A total of 10 cores were taken in a small wetland Iocality (represented by core site SB32) due east of Cutler City (Fgore 3.2). This site is presenrky separated from the flood-tide delta bar to the nonh by an eolian bay-shore bamer (present elevation +3.3 m MSC). This wetlandpnd represents the notthemmost Eimit of a diked tidal marsh which previously connected to the Drift Creek channel to the south. There is no evidence of SCL deposition over the buried wetland horizon (about 0.3 m depth subsurface) in any of the wres at a d k u s of 20-30 m f m site SB32. The buried paty horizon at 5832 i s dated at about 500 RCY BP. (Appendix 3.1). The lack of any sand or organic debris cap on top of tfie subsidence event contact argues against suhtantial marine-surge overtopping of the bay-shore barrier at Cutter City during the last coseismic subsidence event
Abut a dozen core sites were occupied in pasture fields on either side of Drift Creek figure 3.2). Four representative core sites (SB33-SB36) were logged from the tower Drift Creek marshes (Appendix 3.1). At least three paleosubsidence intends are recorded at SB33. Upcore muwitions of pwty mud -to- rooredbarren mud indicate subsidence dispiacernents of 0.5-1.0 rn (Table 3.1). Thifi SCLs (1-5 cm thichess) m associated with a shallow subsidence event contact (0.8 m depth) in core sites adjacent to the Drift Creek channeI (sites SB34 and SB35). This subsidence inma1 is assumed to cmlate with that dated at slte north end of the Cutler City marsh {site SSB33). The SCLs at sites SB34 and SB35 pinchout within 50 rn distance away fm the present channel levee. No SCLs were found upstream of SB35, however recent lateral migration^, of the Drift Creek channel have reduced the SCL record preservation upstream of SB36. Overall, the S C L development m the Drift Creek marshes are compara'tively weak, suggesting subsmtiaI aenuation of [he marine surge or a lack of available sand supply in the Drift Creek tidal channel-marsh system.
SILETZ RTVER A N D TMILLPORT SLOUGH CORE SlTES
A total of 15 core sites (SB37-SBS 1) are logged from the Silea River and Millport Slough areas at the sou theastern end of Siletz Bay (Figure 3.2). The smtignphy in this area is complex. with low preservation potential of paleoseismic records at siks adjacent to the Siletz River and mllpon Slough channels. The longest intact sections (greatet than 3 m depth subsurface) are found between the Siletz and MilIport channels at the upstream terminus of the Millport Slough marsh (sites SB45 and SB48). Site SB48 records at least six subsidence events in the last 2.900 RCY B.P. (Appendix 3.1). Upcore msitions of peaty muds or slighty peaty muds -to- m W a m n muds indicate ppaleosubsidence dispIacernents of 0.5- 1.2 m. Three thick S C t s (5-20 cm in thickness) at sites SB45 and SB48 are associated with subsidence intends older than a dated p t y horizon (1,W RCY BP.) at 150 crn subsurface depth.
By comparison. two SCLs are well developed in the upper one meter section at site 3047 adjacent to the SiIetz River channel (Appendix 3.1). The lower SCL at SB47 and zhe only SCL at SB37 are both developed within a peaty section, i.e., they are not associated with local subsidence. S I X deposition was not observed in marsh cores (SB50 and SB5 1) upstream of rhe confluence of the Millpon Slough and Siletz River channels (Figure 3.2). Apparent S C L deposition is also absent from core sites along the southeastem margin of Sileltz Bay (siks SB39- SB42). Like the Schooner and Drift Creek Iocalities, the SCLs in the Millport Slough rmysh are best developed adjacent to the paleotidd channel. Overbank surge attenuaion and/or diminished m d supply in back-levee environments are potentid causes of SCL pinchouts with distance away from the tidal channels.
71he lack of SCL development in the upper one meter sections of the Millpon Slough marsh sites SB43-SB46 and SB48 is unexpected, It is not hown whether this reflects ( 1 ) a different bay morphology prim to 1,000 years ago, or (2) more energetic SCL depositional events prior to 1.000 years ago. Available field evidence might support both hypotheses. For example, particularly thick SCLs are found at 150 cm depth at the spit sites (SB 11 and SB 17). Alternatively, a lack of marsh development below one meter depth at sites 5842, SB44. and SB45 attests to deeper tidal-flat environments under what is now the Millport Slough marsh. This area might have been more exposed n marine surge propagation d w h g the earlier SCL deposition events.

T h e core sites 9339-SB41 Figure 3.23 were taken at the foot of a debris flow chute along the southastern margin of Millport Slough marsh. At l a ~ t two debris flow events zue shown in the cotes (Appendix 3.1). The debris flows arc separated by two subsidence intenraIs in SB41 and by one mbsidence interval in SB39, The bottom contacca of these debris flow deposits are not associated with pay horizons. Therefore, i t is not possjhlc to show any combtion between paleomhsidence and debris flow deposition at these core sites. Additional work is needed to test potential correspondence hetween debris flow deposition (uplmd land sliding) and coseismic subsidence of marsh surfaces in SiIetz Bay.
DISCUSSION
EARTHQUAKE RECURRENCE INTERY AL
The subsidence events and associated marine surge (SCL) deposition recorded in tile SiIetz Bay marsh cotes are interpreted to represent na-field t s m i g e n i c dislocations of the Cascndia megattrrust (Darienzo. 199 1: Darimo and others. 1994). The paleosubsidence and tsunami deposition slratigraphy a~ sites SB 17 and SB48 are interpreted as follows: event #1 subsidence and tsunami inundation at core depths of about 0.5 m subsurface (at 300 years B.P.); event #2 tsunami inundation with no subsidence at 0.75- 1 m core. depths; event #3 subsidence with no observed tsunami deposition at 1-1.25 m core depths (younger than 1.300 RCY B.P.): event #4 subsidence and tsunami inundation at I5 rn core depths (younger rhan 1.600 R C I BP.); event #5 subsidence md tsunami inundation (younger than 1,800 RCY B.P.); event #6 subsidence at about 2.5 rn core depth. and event #7 subsidence with tsunami inundation at abut 3.0 rn core depth (younger than 2.800 RCY B.P.).
Although event #2 was nor associated with local subsidence in Silea Bay, it appears to have caused subsidence in Yaquina. and AIsea Bays to the south (Darienzo and Pemson, 1994). From the standpoint of tsunami runup and potential shaking in Silea Bay. this event should probably be included in estimates of average recurrence intervals between events in the Lincoln City rvea. T~erefore, in Siletz Bay a total of seven events are recorded rough1 y between 2,800 and 300 years. This is equivalent to six recurrence intervals in 2,500 years or an average recurrence inlerral of about 400 years between earthquake events. The actud recurrence irttesvals between specific events c m o t be resolved by c a n - 1 4 dating, but might vary by several hundred gms from the average. The East Cascadia earrhquake event recorded along the northem Oregon coast occurred about 300 years ago (Darienzo and others, 1994).
ESTIMATES OF COSEBMIC SUBSIDENCE IN StLETZ BAY
The subsidence aspects of the Cascadia ehquakes are probably the least life-threatening of the earthquake hazards. However, post-subsidence bay flooding and ocean beach erosion might last for decades after a Cascadia earthquake. The persistent flocding and beach erosion could impact bay circulation md marsh habitat, &ahage syskms and roads, and the stability of sea cliffs and beach foredunes (Peterson and Priest, 199 1).
Measures of past coseismic subsidence displacements in SiIetz Bay can be used to estimate furure coseismic subsidence hwards for the bay and adsent coastlines. Estimates of vertical dispkement (sea-level rise) corresponding to the last several subsidence events are based on upcore aansitions of paleotidal indicators (Table 3.1) as discussed in !he Results sections. Paleosubsidence estimates range from 0.5 to 1.0 meters for core sites along the SdEshan Spit, Schooner Creek, Drift Creek, and the Millport Slough. These estimates do not include event #2 which did not produce apparent subsidence In Siletz Bay. Based on h e Siletz Bay ccol data, a potential coseismic subsidence of 0.75M.25 rn should he expected for the next Cascadia dislocation event. - Recently, there has been some specdation that the subsidence events recorded in Silerz Bay are possibly produced by local faults or folds that might exist d y within the bay Y w , pen. corn., 1994). To test this hypothesis we compare the estimated subsidence asswiated with the last (youngest) subsidence event from several northem Oregon sites (Table 3.3). A plot of estimated subsidence versus site distance from the wench shows a clear trend of increasing subsidence with increasing distance from the wench in northern Oregon (Figure 3.3).
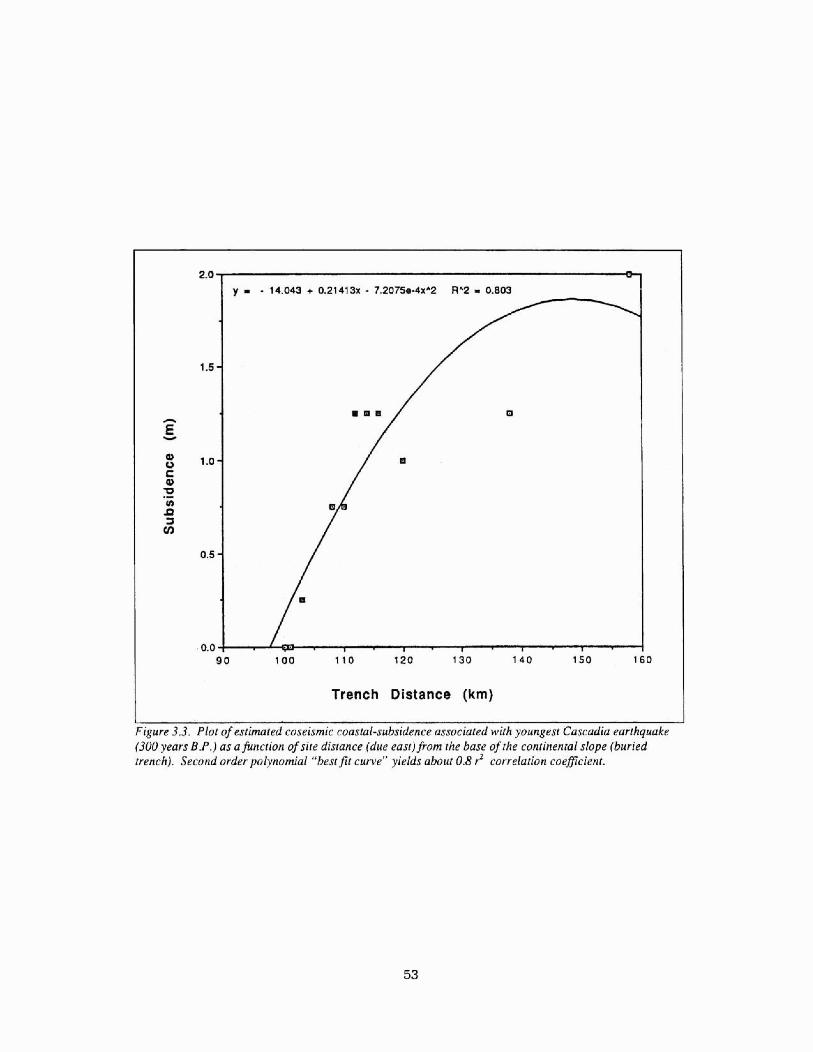
I Trench Distance (km)
I I Figure 3.3. Plot of estimated coseisrnic caastakubsidence associaled with youngest Cascadia earthquake (300 years B.P.) as afunction of sire dislance (due east)from the base of rhe conrinenzal slope (buried mnch). Second order polynomial "'Best fi curve" yields about 0.8 r2 correiation coeficient.
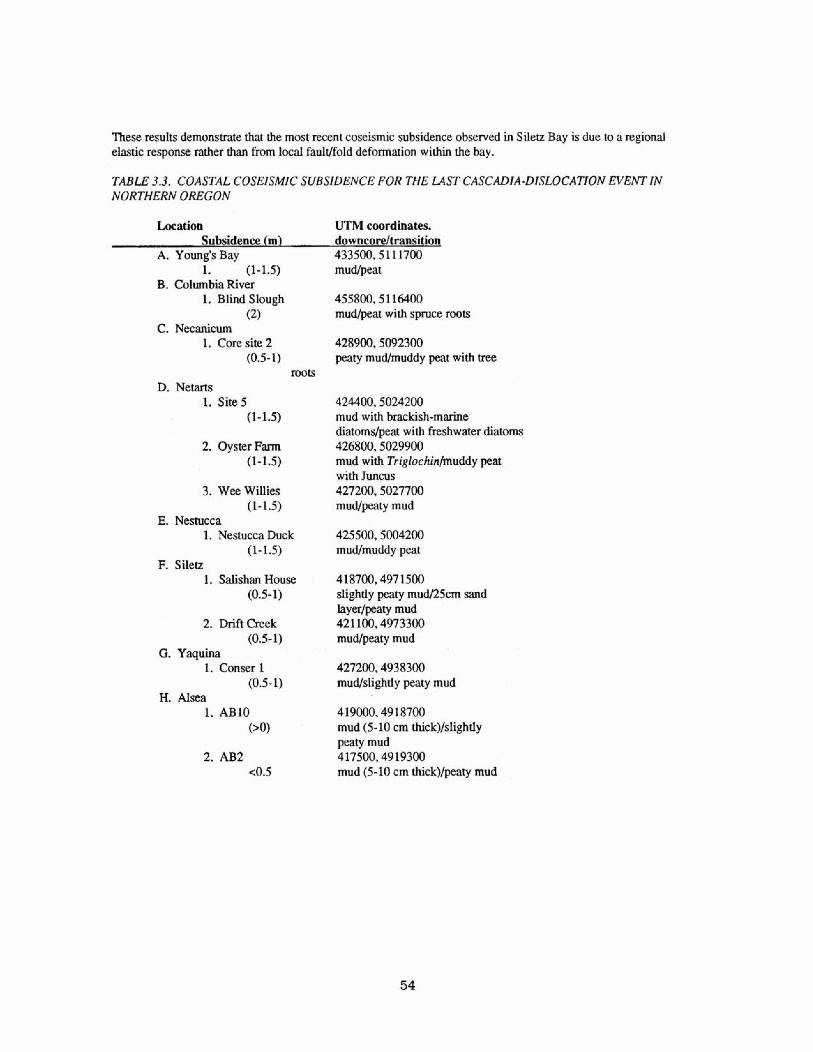
These resuIts demonstrate fiat the most recent coseismic subsidence ohserved in Siletz Bay is due to a regional elastic respoflse rather than from local faulrlfold deformation wilhin the bay.
TABLE 3.3. COASTAL COSEISMIC SUBS!DENCE FOR THE LAST CASCADIA-DISLBCATlON EVENT lhr NORTHERN OREGON
h a t i o n Subsidence tml
A. Young's Bay 1. (1-1.5)
B. Columbia Rivw 1. Blind Slough
(2) C. N&cm
1. Coresite2 (0.5-1)
mots D. N e m s
1. Site 5 (1-1.5)
3. Wee Willies (1-1.5)
E. Nestucca 1. Nesmca Duck
(1-1-5) F. Silea
1. Safishan House (0.5-2)
2. Drift Creek (0.5- 1)
G. Yaquina 1. Conser 1
(0.5-1) H. Alsea
1. ABlO (9)
UTM coordinates.
455800.51 16400 mudtpeat with spruce roots
428900.5092300 peaty mudlmuddy peat with Uee
424400,5024200 mud with brackish-marine diatomslpeat with Freshwater diatoms 426800,5029900 mud with Tsiglochinhuddy pea with Juncus 427200.5027700 mud/peaty mud
rf25500,5004200 mudlmuddy pmt
418700,497 1500 slightly p t y mud125cm sand layerlpeav mud 421 100.4973300 mudpeaty mud
427200,4938300 mud,sli ghtly peaty mud
4 19000.49 18700 mud (5- 10 m thick)lslighdy P r y l-nud 4 17500.49 I9300 mud (5-10 cm thidc)/peaty mud
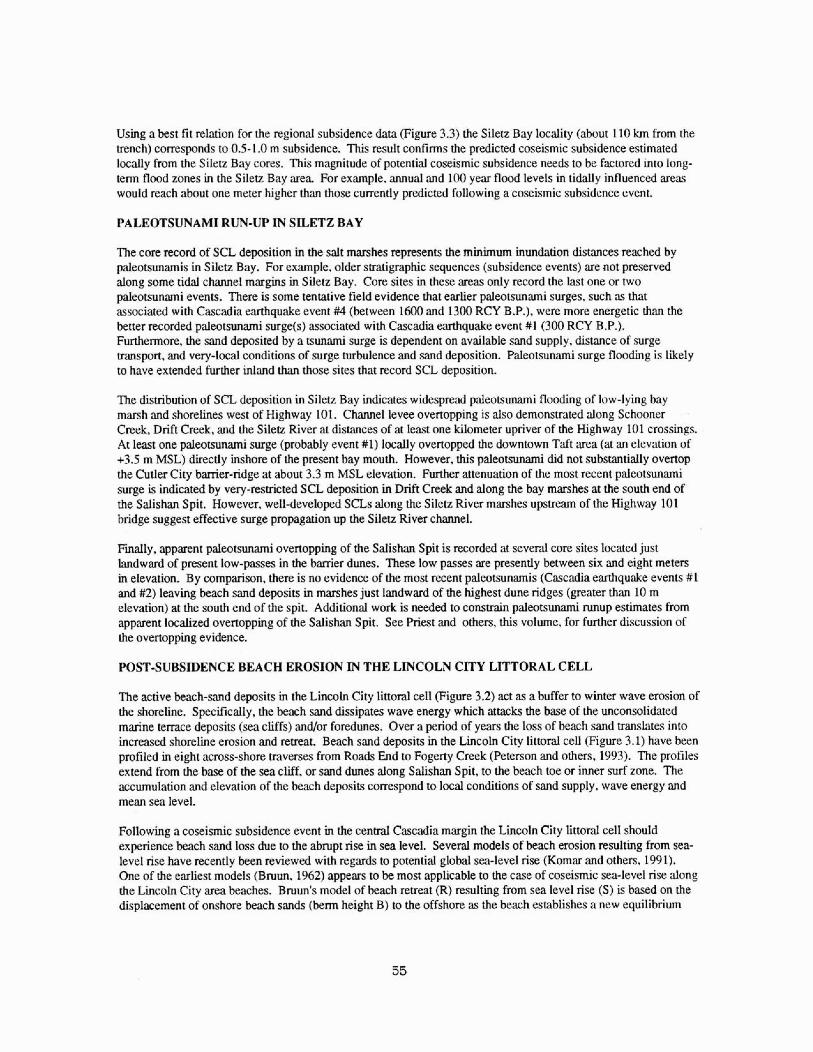
Using a best fit relation for the regional subsidence data (Figure 3.3) the Siletz Bay locality (about 110 km from the wench) corresponds to 05-1.0 m subsidence. This result confirms the predicred coseismic subsidence estimated t~cally from the Slletz Bay cores. This magnitude of potential coseismic subsidence n e d s to be factored inlo Iong- term flood zones in the Siletz Bay ma For example. annual md 100 year flood levets in tidally influenced area? would reach abut one maer higher than those currently predicted fullowing a coseismic subsidence event.
PALEOTSUNAMI RUN-UP IN SILETZ BAY
The core record of SCL deposition in the salt marshes represents the minimum inundation distances reached by paleotsunamis in Siletl. Bay. For example. older stntigraphic sequence (subsidence events) are not preserved along some tidal channel margins in Silen Bay. Core sites in 'these areas only record the last one or two palmtsunami events. There i s some tentative field evidence that earlier paleuksunmi surges. such ai mat associated with Cascadia earthquake event #4 (between 1600 md 1300 RCY B.P.). were more energetic than the better recorded paleotsunami surge@) associated wirh Cmadia earthquake event #1 (300 RCY B.P.). Furthermore. the sand deposited by a tsunami surge is dependent on available sand supply, distance of surge wmsport, and very-Iocal conditions of surge turbulence and m d deposition. Paleotsunami surge flooding is likely to have extended further inland than hose sites that record SCL deposition.
The dismibution of SCL deposition in SiIetz Bay indicates widespread ppaleotsunami flooding of low-lying bay marsh and shorelines west of Highway 101. Chmel levee overtopping is aIso demonstrated dong Schooner Creek. Drift Creek, and the Siletz River at distances of at least one kilometer upriver of the Highway 101 crossings. At least one paleommi surge (probably event #1) locally overtopped the downtown Taft area [at an elevation of +3.5 m MSL) directly inshore of h e present bay mouth. However, this palmtsunami did not substantidly overtop the Cutler City barrier-ridge at about 3.3 m MSL elevation, Funher attenuation of the most recent pdeotsunami surge is indicated by very-restricted S C L deposition in Drift Creek and along the bay marshes at the south end of the Salishan Spit. However, well-deveI-d SCLs along the Siletz River marshes upsueam of the Bghway 101 bridge suggest effectfve surge propagation up the SiIerz River channel.
Finally, apparent paleotsunami overtopping of the S dishan Spit is recorded at several c m sites located just landward of present low-passes in h e barrier dunes. These low passes are prasenly between six and eight meters in elevation By comparison, there is no evidence of the most recent paleomnamis (Cascadia earthquake events # I and #2) leaving beach sand deposits in marshes just Imdward of the highest dune ridges (greater than 10 m elevation) at the south end of the spit. Additional work is needed to constrain palmtsunami runup estimates from apparent localized overtopping of the S a l i s h Spit. See Priest and others, this volume, for further discussion of the overtopping evidence.
POST-SUBSIDENCE BEACH EROSION IN THE LINCOLN CFTY LITTORAL CELL
The active beach-md deposits m the Lincoln City littoral cell (Figure 3.2) a a as a buffer to winter wave erosion of the shoretine. Specifically, the beach sand dissipates wave energy which attacks the base of the unconsolidated marine terrace deposits (sea cIiffs) andlor foredunes. Over a perid of years the loss of beach sand translates into increased shoreline erosion and remat, Beach sand deposits in the Lincoln City littoral cell (Figure 3. I) have been profiled in eight across-shore traverses from Roads End to Fogerty Creek (Peterson and others. 1993). The profiles extend from the base of the sea cliff, or sand dunes along Salishan Spit. to the beach toe or inner surf zone. The mumulation and elevation of the beach deposits cornpond to local conditions of sand supply, wave energy and mean sm level.
Following a coseismic subsidence event in the tend Cmcdia margin the Lincoln City littoral cell should experience beach sand loss due to the abmpt rise in sea level. Several mdels of beach erosion resulting from sea- level rise have recently been reviewed with regards to potential global se;l-level rise (Komar and others. 1991). One of the earliest modeIs (Bmun, 1962) appears to be most applicable to the case of coscismic sen-level rise along the Lincoln City area beaches. Bmunk model of beach remat (R) resulting from sea level rise (3) is based on the displacement of onshore beach sands (berm height B) to the offshore as the beach establishes a new equilibrium

profile. The beach m d is displaced over the profile length (L) to the offshore to a maximum water depth of m d displace~nent (h). The relation is thus R={ L/(B+h)) S.
For his analysis we use a sen-level rise of 0.75 rn md a maximum water depth 15 m helow sea level (Peterson and Burris. E991). Bmch backshore height% arc Mken :kt the half-w~by poht hetween the mid-beach race :md the hack edge of the k1cch. This point generally corresponds to the hnckshore just ldmdwml of h e summer benn. The profile length (:tbout one kilometer) is measured from the beach h'xkshure out to the 15 rn wake1 depth on NOAA bathymetric charts. Estimated beach retrent from a 0.75 rn coseismic subsidence event in the Lincoln City cell is on the or& of 40-45 meters (Table 3.4). Summer b c k s h o ~ widths in the littoral cell presently range from 20 to 70 meters. Additional work is needed to establish the sensitivity of the Bmun model to variable input panmeters for the Lincoln City Iittod cell. Potenrid net sand loss from the Lincoln City cell. around Ca%.lde Head or into Siletz Bay. i s not considered in this dmuldysis. hut could increase the estimates of local Mach rem?t (Ko~nar and others. 1991).
TABLE 3.4. ESTIMATED BEACH RETREAT {all nrrmbers are in meters; R=[LJ(B+h)]S, wA@re R = retreat. L= profile length, B = beach berm height, h = maximum wlrrer depflr of sand dispIacement = 15 m, at~d S = scu level rise from coseismic slrhsidencc = 0.75 m. Nore rhar a sarbsidenrrte of 1 m, assumed for fsunami run-up scenarios 1 and 2 would yieM rerreors 25 percent larger than rhore listed hew).
Sacklh8lt BEACH MTLio
UTM . 49B50rn 499 1000 4971310 497d480 4969550 4966500 4965700 4965480
Reveal 45.83 4 6 70 45 45 44.03 39 94 44.57 13.33 59.77
UTM R L B S to barn (m) WIDTH (m) 15 rn Espfh * 1 aoo 498111KI A 6 70 f058 5 2.00 0 75 5~ 5D 130 1000 m7'1310 as45 1036.2 z l o 0 75 36 20 T 74 m a 4974660 44 03 la62 5 3 ID 0 7 5 62 50 167 1000
4959550 39 94 1038.5 4 50 075 38 50 16 1000
49865lM 44 57 1069 77 3.00 0 75 69 7 6 147 1000
4W57DO 43 33 1022 58 z 70 o 75 22 57 55 1 ma 4E5860 39.77 1050 55 5 00 1) 75 60.55 128 1000
The potential beach retrmts (estimated above) and the corresponding hackshore widths of the present beaches are plotted as a function of location (UThQ in Figure 3.4. FolIowing a coseismic subsidence event of 0.75 m the
Lincoln City Cell
I E f igure 3.4. Plots of estimated bcach retreat (meters) from 0.75 m coseismic subsidence atld width (rnerers) of modern beach hockshore (10 seosonni berm) at eighl be0r.h profile sires in the Lit~colt~ C i p lirtorol cell, from Forere Creek ( WTM-N 4964000) to Roads End (UTM-N 4986000): (see Figure 3.2 for littoral cell locarbn 1.
enming kwh erosion is estimated to remove most of the smnmer beach backshore buffer. No kach hackshnre

buffer is expected to survive during winter months of high wave energy and sensod sand m p o r l to the offshore. Due to assumed global sea-level rise of about 2 mm per year during ihe last 300-year interseismic period the Lincoln City sea cliffs would experience a net 0.5 rn rise in sea level from the previous (coseismic) high-sea-level stand. Wave-attack undermining of present terrace sea cliffs. fmdunes and shoreline protection structures would be expected to grealy accelerate shoreline retreat md slope hilures in the Lincoln City littoral cell.
ACKNOWLEDGMENTS
This study was funded in pan through contract from rhe Oregon Department of Geology and Mineral Industries (see achowIedgments section of Priest and others, this volume. for funding sources). Additional suppart was provided by Otegon Sea Grant #NA36RG045 1.
REFERENCES
E m , P., 1962, Sea level a, a cause of shore erosion: Journal of Warewnys and Harbors Division. Amer. Society of Civil Engineers. v. 88:. p. 1 17-130.
Darimzo, M.E.. 1991, La.& Holocene pdeoseismicity dong the northern Oregon coast: unpublished PhD. Thesis, Portland State University. 168 p.
Darienzo, ME., and Peterson, C.D., 1990, Episodic t e c t o ~ c subsidence of late-Holocene salt marsh sequences in Netarts Bay, Oregon, Central Cascadia Matgin, USA.: Tectonics, v. 9. p. 1-22.
Darienzo, MH.. Peterson. C.D., and Clough. C.. 1994. Suatigraphic evidence for great suMuction zone earthguakes at four estuaries in northern Oregon: Journal of Coastal Research, v. 10, p. 850-876.
Kornar, P.D.. Lanfredi. N., Baba, M.. D m , R.G., Dyer. K.. Hedy, T., lbe, A.C.. herwindt. H.J.. and. Thorn. I3.C. 199 1. The response of beaches to sea-level changes: a review of predictive models: Journal of Coasml Reearch. v. 7, p. 895-921.
Peterson, C.D., and Burris, W,K,, 1993, Evduatim of littod sediment composition and volume. Cms Bay- Umpqua littoral subcell, Oregon: Repon, to U.S. Army Corps of Engineers. Portland District, Ponland. Oregon. 20 p.
Peterson, C.D. and Darienzo, M.E., 1992, Discrimimtion of flood, s t m and tectonic subsidence events in coastal marsh records of Alsea Bay, C e n d Cascadia Margin, USA: U.S. Geological Survey Open-File Report, OF9 1 4 4 1-C, 53 p.
Peterson. C.D., Darienzo ME., B m , S.F.. and Burris, K.. 1993. F ~ d d trip guide to Cascadia paleoseismic evidence dong the northern Oregon coast: Evidence of subduction zone seismicity In the cenld Cmadia margin. Oregon Geology, v. 55, p. 99-1 14.
Peterson, C.D.. Darienzo, M.E.. Hamilton, D., Pettit, D.J.. Yeager, R,K, Jackson, P.L., Rosenfeld. C.L., and Terich, T.A.. 1994, Cmadia beach-shoreline dam base, Pacific Nonhwesr Region. USA: Oregon Depariment of Geology and Mined Indusaies. Open-Fie Report 0-94-2.29 p.. and 3 digital database Files.
Peterson, C.D., and Priest G.R, 1991. Initiative for the focus of a coastal geology program on catastrophic coastal hazards in the Cascndia margin of the U.S. Pacific Northwest in Good, J,W,, and Ridlington, S.S., eds., Coastal nit tud hazards. science. engineering and public policy: Oregon Sea Gmt ORES U-B-92-00 1, Corvalii. Oregon, p. 33-38.

KEY
Peat
Muddytosandypeat
..‘. f Peaty mud to sand
Slightly peaty mud to sand
I.'.;: . . ,. .. .. -,'.:,:,., Rooted mud to sand
Slightly rooted to barren mud
Sliqhtly rooted to barren sand
Tsunami deposit
Debris flow
a abrupt contact g gradual contact sl sand laminae
tri triglochin rhizomes
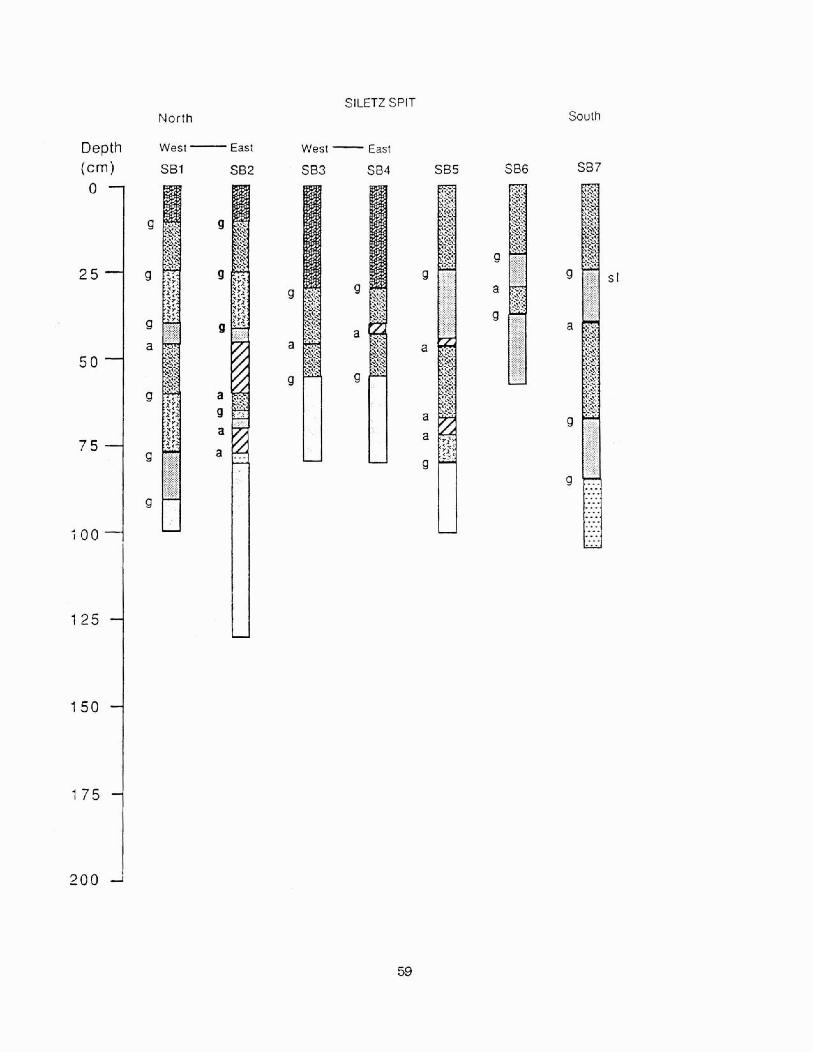
North SILETZ SPIT
South
Depth west- East West - East
(cm) SB1 SB2 SB3 S84 SBS SB6 S87


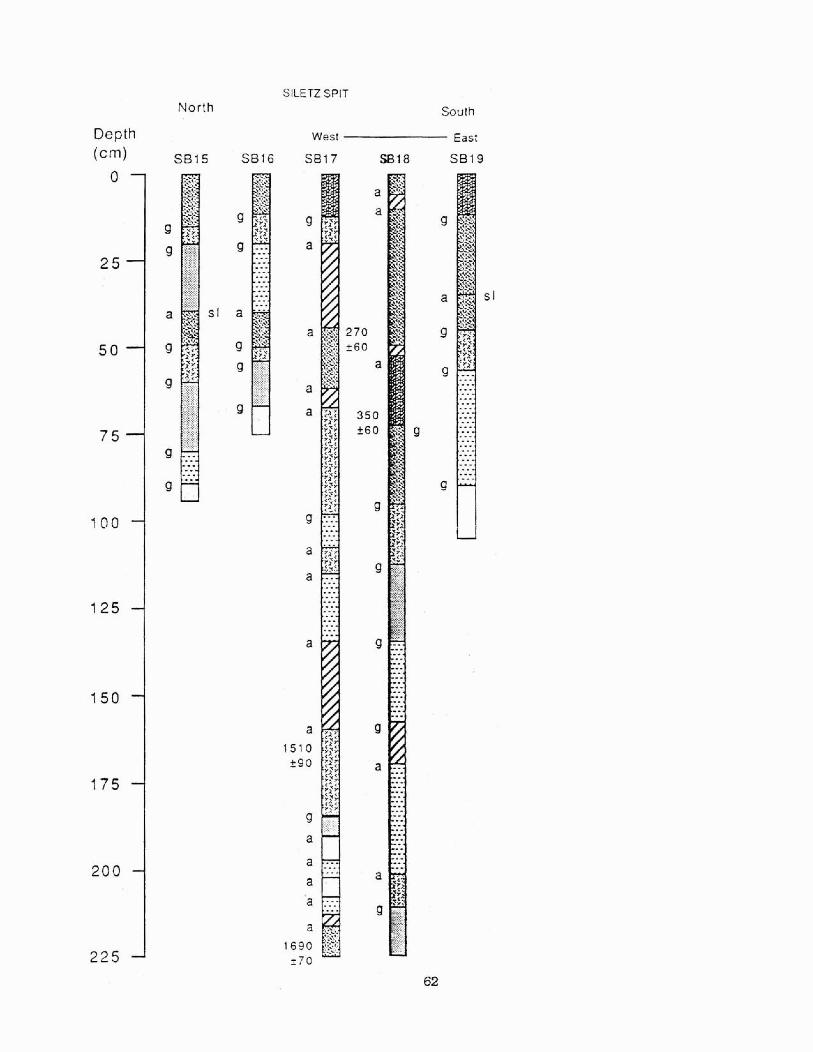
SILETZ SPIT North South
Depth West East
(cm) SB15 S B t 6 SBIJ S 8 l S SB19
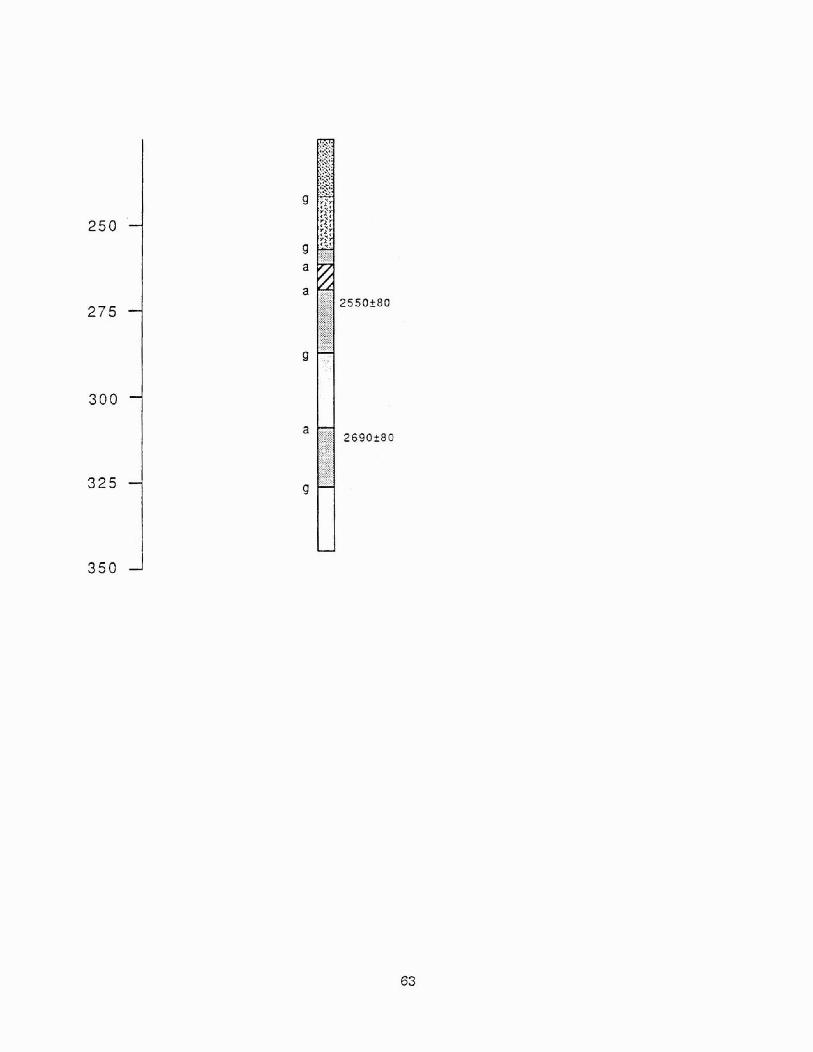

Depth (cm)
Central
7 S023
Ceniral
5824 SB25 5826 S027
KEY
Peat
Muddy to sandy peal
Slightly peaty mud tosand
Rooted mud lo sand
Slightly rooted lo barren mud
Slightly rooted to barren sand
Tsunami deposit
Debris flow
a abrupt contact g gradual confact sl sand laminae
tri triglochin rhizomes

Depth : c m
DRIFT CREEK West East
Peat
Muddy to sandy peat
Peaty mud to sand
Slightly peaty mud to sand
Rooted mud to sand
Slightly rooted to barren mud Slightly rooted to barren sand
Tsunami deposit
Debris flow
abrupt contact gradual contact sand laminae
Triglochln rhizome
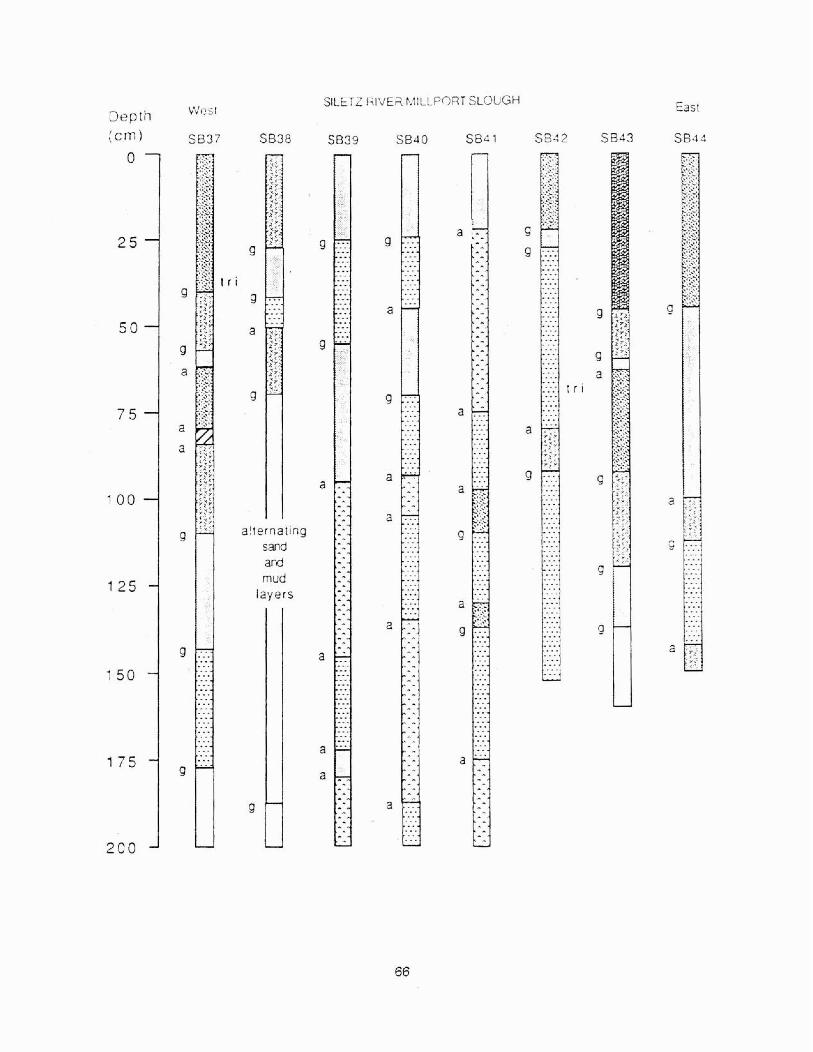
Depth w f ? ~ t SILETZ RIVER leltLLBr)'lT SLOUGH
;cm) S837 SB38 3339 SBJO SBd 1 S 3 2 2 SB43
a!ternating sand and mud
layers

Depth I c m j
West
SB45
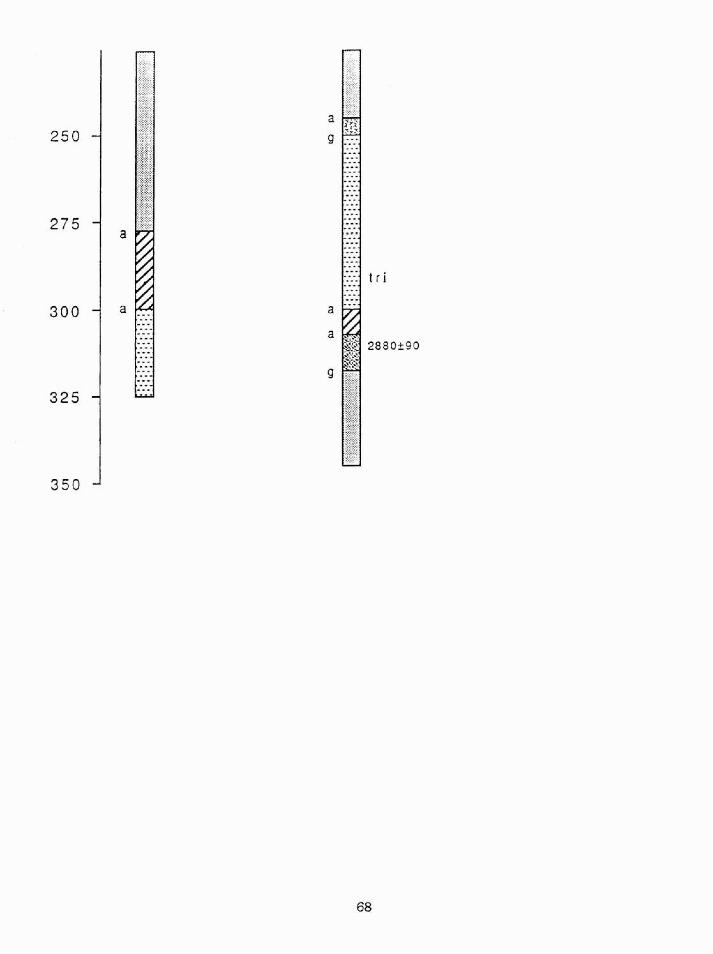
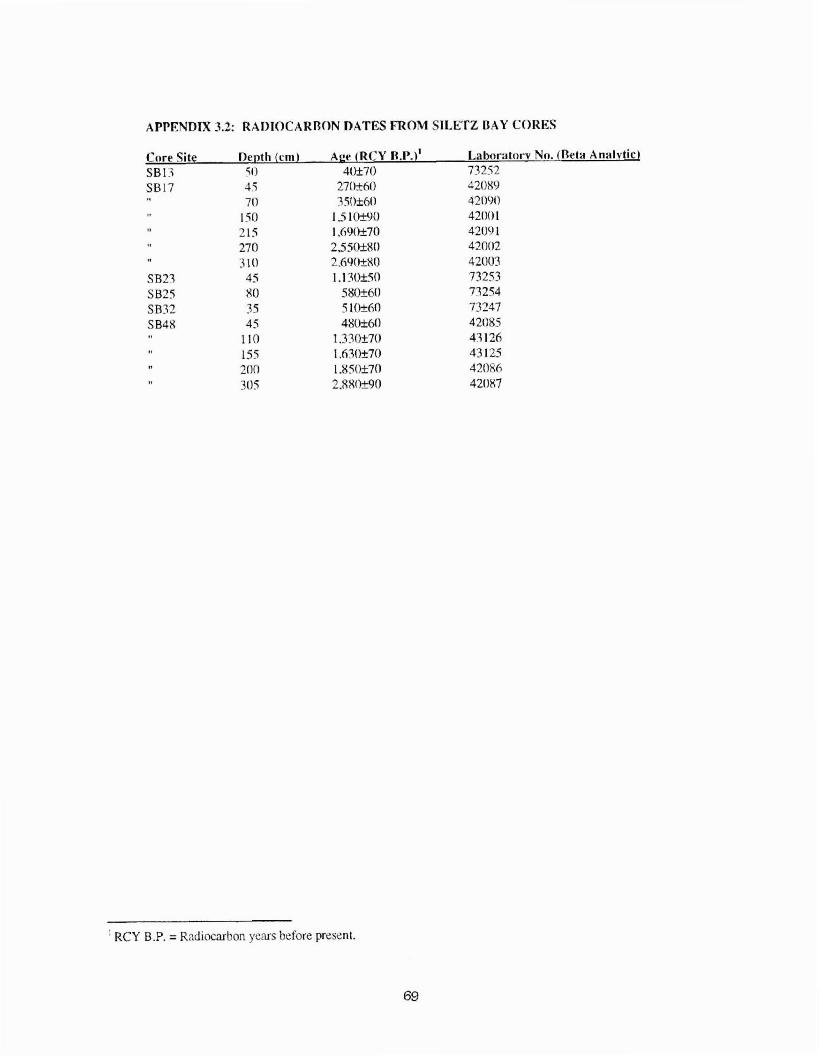
APPENDIX 3.2: RADIOCARDON DATES FROM SII-ETZ DAY CORES
Core Site nenth (cm) A E ~ (RCY R.P.)' Lalmratnrv Nn. ( M a AnaSvticl S B l 3 5 0 4of70 73252
' RCY B.P. = Radiocarbon years before present.