Embed Size (px)
Citation preview
THE JOURNAL OF BIOLOGICAL CHEMISTRY Vol. 256, No. 15, Issue of August 10, pp. 7756-7763, 1981 Printed Ln U.S.A.
The Relation of pH and Oxidation-Reduction Potential to the Association State of the Ferredoxin Ferredoxin:NADP+ Reductase Complex*
(Received for publication, March 9, 1981)
Christopher J. Batie and Henry Kamin From the Department of Biochemistry, Duke University Medical Center, Durham, North Carolina 27710
The interaction between spinach ferredoxin and fer- redoxin:NADP+ reductase was studied by varying pH and oxidation-reduction state. The Kd of the oxidized ferredoxin*ferredoxin:NADP+ reductase complex in- creases with increasing pH in the range from pH 6 to pH 8; the K d is pH-independent above pH 9. These data are interpreted as showing 1 proton binding/complex at neutral pH. The extent of association of the complex was also varied by manipulation of salt concentration, and of concentration of the individual proteins. In- creased association accompanied a negative shift in potential of ferredoxin relative to that of ferredoxin: NADP’ reductase. Oxidation-reduction titrations showed that the oxidation-reduction potential of fer- redoxin is reduced to above -510 mV when in complex with ferredoxin:NADP+ reductase, a change of about -90 mV; the potential of ferredoxin:NADP’ reductase is changed little (no more than +20 mV). Conversely, these data also showed that the oxidation-reduction state of ferredoxin strongly affected its association with the flavoprotein, increasing the Kd at least IO-fold on reduction of ferredoxin.
Iron-sulfur proteins serve as electron donors in a variety of systems, interacting with flavoproteins, hemoproteins, and other iron-sulfur proteins, or with iron-sulfur moieties of more complex electron transport enzymes. In green plants, the iron- sulfur protein, ferredoxin, is normally reduced by photosystem I (1,2); two systems which serve to transfer the low potential electrons of reduced Fd’ (Em(Fd) = -420 mV) to the metabolic pathways of the chloroplast are the NADP+ reductase and the assimilatory nitrite and sulfite reductases. Thus, ferre- doxin can donate electrons 1) to the flavoprotein, ferredoxin: NADP’ reductase, which reduces NADP’ to NADPH, which in turn serves as a source of reducing equivalents in the general reductive metabolism of the chloroplast (3,4); and 2) presumably via Fe&* groupings to the assimilatory enzymes, nitrite reductase and sulfite reductase, which catalyze the conversion of nitrite to ammonia and sulfite to sulfide. In both of these 6-electron assimilatory reductions, a novel heme, siroheme (5 , 6), serves as the substrate-binding site; a closely interacting iron-sulfur moiety (7) probably accepts electrons
This work was supported by National Science Foundation Grant PCM-7924877 and National Institutes of Health Grant GM-21226. The costs of publication of this article were defrayed in part by the payment of page charges. This article must therefore be hereby marked “aduertisernent” in accordance with 18 U.S.C. Section 1734 solely to indicate this fact.
’ The abbreviations used are: Fd, spinach ferredoxin; FNR, ferre- doxin:NADP’ reductase; Tris, tris(hydroxymethy1)aminomethane; Tricine, N-tris[hydroxymethyI]methylglycine.
from ferredoxin and transfers them via the heme to the substrate (8).
Our laboratory has long been interested in electron transfer between iron-sulfur centers and other oxidation-reduction- active groups, and we have reported detailed studies of the interaction between the flavin, iron-sulfur protein, and he- moprotein moieties of the adrenal mitochondrial steroid hy- droxylation system (9-17): in the latter, electrons from NADPH are channeled by a flavoprotein (adrenodoxin reduc- tase) and an iron-sulfur protein (adrenodoxin) to a reaction- specific cytochrome P-450. Many features of the mechanism of electron transfer from pyridine nucleotide to cytochrome P-450 in the adrenal systems depend for their mechanism on close interaction, sometimes with complex formation, between the flavoprotein and the iron-sulfur protein (12, 16, 17). The dissociation constants of these complexes vary with the oxi- dation-reduction states of the oxidation-reduction-active com- ponents; there is thus an interplay between the association constants of the two enzymes and the oxidation-reduction potentials of the system (10).
In the case of chloroplast NADP’ reduction, the system is formally analogous to the adrenal system in that it also comprises NADPH, a mono-FAD flavoprotein, and an acidic Fez!&* protein. The systems differ in the oxidation-reduction potentials of their components, the plant system being much more negative in potential (10, 18, 19), and in the thermody- namically favored and biological direction of electron flow: in the adrenal, electrons flow from metabolism to NADPH to the iron-sulfur protein; in the plant, electrons flow from pho- tosystem I, through ferredoxin to the flavin, to NADPH.
Our laboratory has initiated a study of the plant FNR-Fd system in the light of the work on the adrenal adrenodoxin- adrenodoxin reductase system. The present report deals with the oxidation-reduction states and the oxidation-reduction potentials of the flavin and iron-sulfur components, and with the effects of these parameters upon the association of the flavoprotein with the iron-sulfur protein.
EXPERIMENTAL PROCEDURES
Materials NADPH and NADP’ were obtained from P-L Biochemicals, benzyl
viologen and methyl viologen were from Sigma, neutral red was from Pfaltz and Bauer, and quinhydrone was from Eastman Chemicals.
Methods Enzyme Purification-Ferredoxin and ferred0xin:NADP‘ reduc-
tase were purified from spinach along with nitrite reductase, using the procedure reported for the latter enzyme (20). Ferredoxin from 2 bushels of spinach (12-18 kg) was collected on a 2-liter bed of DE52 cellulose (10 mM Tris, pH 8.0, 0.2 M NaCl), which did not retain the nitrite and NADP+ reductases. The dark brown layer was scraped off, resuspended in the same buffer, and poured into a column. The
7756
Ferredoxin. Ferredoxin: NADP' Reductase Complex 7757
ferredoxin was then eluted with 1 M NaC1,30 mM Tris, pH 8.0, into a small (30-100 ml) concentrated fraction. After dialysis versus 0.2 M NaC1, 30 mM Tris, pH 8.0, the ferredoxin was applied to a DE52 column (2.5 x 75 cm) equilibrated with the same buffer, washed with at least 2 volumes of buffer, and then eluted with 0.26 M NaC1,30 mM Tris, pH 8.0. Fractions with a ratio of Arm to A276 > 0.4 were pooled and then concentrated using an Amicon DM5 or YM5 membrane. On occasion, this column step needed to be repeated for some or all of the ferredoxin (21). The concentrated ferredoxin was then applied to a Sephadex G-50 column (2.5 X 50 cm) equilibrated with 1 M NaCl, 30 mM Tris, pH 8. We find that ferredoxin can be stored at 4 "C for several weeks in this buffer with little denaturation as measured by loss of absorbance at 420 nm. Fractions with a ratio of A4m to Am > 0.46 were used for spectrophotometric experiments, pure ferredoxin having a ratio of 0.49 (21).
Ferredoxin:NADP+ reductase separates from nitrite reductase at the fnst DEAE-cellulose column in the nitrite reductase purification scheme (20), eluting in 0.1 M NaCl, 10 mM Tris, pH 8.0. Fractions containing NADPH:ferricyanide reductase activity were pooled and applied to a column (2.5 X 40 cm) of reactive blue Sepharose equili- brated with the same buffer. The column was washed with 0.2 M NaC1, 30 mM Tris, pH 8.0. The flavoprotein was eluted with a salt gradient from 0.2 to 0.35 M (or occasionally 0.4 M) NaC1, all buffered with 30 mM Tris, pH 8.0. Fractions with a ratio of A4:* to A280 > 0.12 (0.13 for pure enzyme (22)) and a ratio of AG+, to Am > 4 (our purest samples had a ratio of 5.5) were used for spectrophotometric experi- ments. Other fractions were further purified using a Fd-Sepharose affinity column made and used as reported by Shin and Oshino (22).
Spectrophotometric data were obtained using a Varian 219 record- ing UV-visible spectrophotometer. pH was measured with a Radi- ometer 26 pH meter and a Radiometer 2322c combination electrode. Electropotential measurements used the same meter, a Radiometer K401 calomel electrode, and either a gold or a platinum electrode from Radiometer. Argon gas was purchased from Linde, and for most work, residual 0 2 was removed and the gas was wetted by a gas train consisting of an activated Cu column and a gas bubbler containing a buffered solution of methyl viologen reduced with deazaflavin-EDTA- light.
Assay-Absorbances at selected wavelengths used to determine the concentrations of pure solutions were: ferredoxin, e420 = 9,700 M" em" (21); ferredoxin:NADP' reductase, € 4 ~ 5 ~ = 10,400 M" cm" (23,24); methyl viologen, EW = 14,000 M" cm" (25); benzyl viologen, e m = 7,000 M" cm-l (18); neutral red, €450 = 14,800 M-' cm" (as determined by titration uersus standardized dithionite); 5-deazaflavin, e:~,s = 11,500 M" cm" (26). The NADPH:ferricyanide reductase activity was used to assay for ferredoxin:NADP' reductase activity (27) with the modification that 50 p~ NADPH was used in the assay mixture, instead of an NADPH-regenerating system.
Oxidation-Reduction Titrations-Solutions used in oxidation-re- duction titrations were made anaerobic by repeated flushing of a sealed cuvette with 02-free air. Dithionite solutions for reductive titrations were prepared by weighing NazS204 int.0 the side arm of a Thunberg tube. When standardization was necessary, the dithionite solution was titrated into an anaerobic solution of FMN (e% - d& = 11,580 M" cm"). An aliquot of buffer sufficient to give a final concentration of 1 mM dithionite was added to the tube, and either bubbled with Ar for 20 min, or repetitively evacuated and flushed with Ar. When the buffer was essentially anaerobic, it was tipped into the solid dithionite. We generally added KOH in a 4:1 molar ratio of KOH to dithionite, an amount sufficient to stabilize the pH when titrating lightly buffered protein solutions. During oxidation-reduc- tion titrations (other than photoreductions) additions were made through a rubber septum, using a 5O-pl gas-tight Hamilton syringe. The sealed cuvette was kept under positive pressure with Ar gas.
When using the light-deazaflavin-EDTA system of Massey and Hemmerich (28) as a source of reducing equivalents, a 201 molar excess of enzyme:deazaflavin was maintained. The cuvette was sealed and then immersed in ice-cold water while illuminated with a 500- Watt slide projector. With either dithionite or deazaflavin as reduc- tant, the spectrum was repetitively scanned until stable. Equilibration was slow (about 30 min) when dithionite was used in the absence of methyl viologen or other mediators; only about 5 min was required to obtain stable spectra after illumination, dithionite plus methyl violo- gen, or addition of ferricyanide.
Oxidative titrations used approximately 1 mM K3Fe(CN)6 solutions as oxidant. Ferricyanide was made up in 10 mM Tricine, pH 9, made anaerobic as previously noted, and titrated into the solution until 90% of completion of oxidation. The cuvette was then opened and mixed
with air, and a fully oxidized spectrum was recorded. The initial oxidized spectrum was compared with that of the final spectrum after reduction and reoxidation to test for loss of ferredoxin; reduced ferredoxin is fairly labile (29). Only titrations from which at least 85% of the ferredoxin was recovered were analyzed.
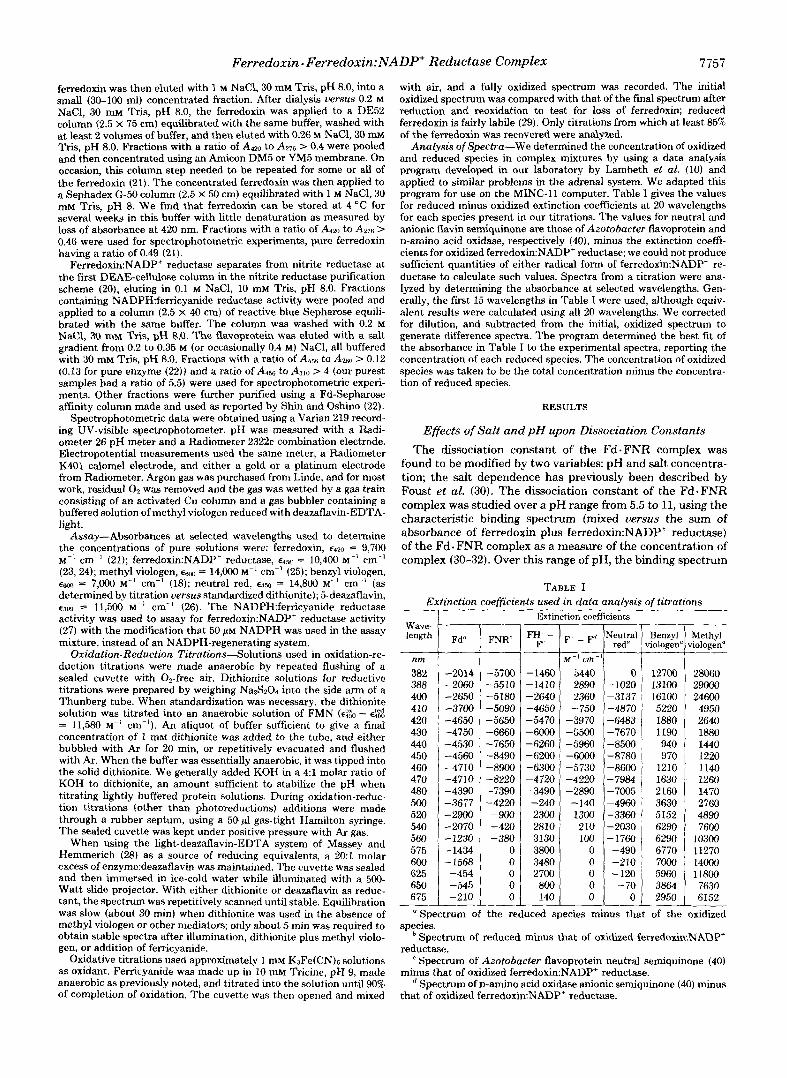
Analysis of Spectra-We determined the concentration of oxidized and reduced species in complex mixtures by using a data analysis program developed in our laboratory by Lambeth et al. (IO) and applied to similar problems in the adrenal system. We adapted this program for use on the MINC-11 computer. Table I gives the values for reduced minus oxidized extinction coefficients at 20 wavelengths for each species present in our titrations. The values for neutral and anionic flavin semiquinone are those of Azotobacter flavoprotein and D-amino acid oxidase, respectively (40), minus the extinction coeff- cients for oxidized ferredoxin:NADP' reductase; we could not produce sufficient quantities of either radical form of ferredoxin:NADP' re- ductase to calculate such values. Spectra from a titration were ana- lyzed by determining the absorbance at selected wavelengths. Gen- erally, the first 15 wavelengths in Table I were used, although equiv- alent results were calculated using all 20 wavelengths. We corrected for dilution, and subtracted from the initial, oxidized spectrum to generate difference spectra. The program determined the best fit of the absorbance in Table I to the experimental spectra, reporting the concentration of each reduced species. The concentration of oxidized species was taken to be the total concentration minus the concentra- tion of reduced species.
RESULTS
Effects of Salt and pH upon Dissociation Constants The dissociation constant of the FdSFNR complex was
found to be modified by two variables: pH and salt concentra- tion; the salt dependence has previously been described by Foust et al. (30). The dissociation constant of the Fd-FNR complex was studied over a pH range from 5.5 to 11, using the characteristic binding spectrum (mixed uersus the sum of absorbance of ferredoxin plus ferredoxin:NADP+ reductase) of the Fd. FNR complex as a measure of the concentration of complex (30-32). Over this range of pH, the binding spectrum
TABLE I Extinction coefficients used in data analysis oftitrations
Wave- length
nm 382 388 400 410 420 430 440 450 460 4 70 480 500 520 540 560 575 600 625 650 675
T Exti]
- a Spectrum a
species.
Fd" __ -2014 -2060 -2650 -3700 -4650 -4750 -4530 -4560 -4710 -4710 -4390 -3677 -2900 -2070 -1230 -1434 - 1568 -454 -545 -210
FNRh __
-5700 -5510 -5180 -5090 -5650 -6660 - 7650 -8490 -8900 -8220 -7390 -4220 -900 -420 -380
0 0 0 0 0
the re
FH' - F "
-1460 -1410 -2640 -4650 -5470 -6000 -6260 -6200 -6300 -4720 -3490 - 240 2300 2810 3130 3800 3480 2700 800 140 __
:ion coefficients
-5960 -8500 , 940 970
1210 1630 2 160 3630 5152 6290 6290 6770 7000 5960 3864 2950
iologen" Methyl
28060 29000 24600 4950 2640 1880 1440 1220 1140 1260 1470 2760 4890 7600
10300 11270 14000 11800 7630 6152 1 L L
uced species minus that of the oxidized
Spectrum of reduced minus that of oxidized ferredoxitxNADP'
Spectrum of Azotobacter flavoprotein neutral semiquinone (40)
,I Spectrum of D-amino acid oxidase anionic semiquinone (40) minus
reductase.
minus that of oxidized ferredoxin:NADP' reductase.
that of oxidized ferredoxin:NADP' reductase.

7758 Ferredoxin. Ferredoxin: NADP' Reductase Complex
did not change in shape; the ratio of extinction coefficients at 420,465, and 540 nm did not change appreciably with pH.
The relation of K d to pH and salt concentration was studied by measuring absorbance changes while titrating NaCl ("salt titrations") into a fiied concentration of ferredoxin plus fer- redoxin:NADP+ reductase, and by titrating ferredoxin into ferredoxin:NADP+ reductase solutions ("ferredoxin titra- tions'') at several salt concentrations. These two procedures, each performed at several pH levels, were:
Salt Titrations-A solution of 2 M NaCl (see the legend to Fig. 1) was titrated into 1:l mixtures of ferredoxin and ferre- doxin:NADP' reductase originally at p = 0.01 M. At pH values lower than 8 and at the concentrations used, nearly all ferre- doxin:NADP+ reductase is in complex at p = 0.01; Kd values were calculated from the decrease in AA of mixing as salt was added, using the difference between absorbance at 460 and 420 nm or the difference between that at 460 and 540 nm. At pH greater than 8, where K d is relatively high, the maximum AA for association was established by extrapolation of data points from ferredoxin titrations (see below). This maximum AA was found to be essentially identical (within 10%) with the AA at lower pH values and low salt concentrations, conditions favoring complex formation. Independent measurements showed that the spectrum of oxidized ferredoxin and oxidized ferredoxin:NADP+ reductase did not change as pH was varied from 6 to 11, or as salt was added in the range 0.001-0.5 M NaC1. Thus, within these ranges, changes in absorbance can be ascribed uniquely to changes in the concentration of Fd. FNR complex, and not to changes in the absorbance of either component of the complex.
Ferredoxin Titrations-Ferredoxin was titrated into refer- ence and sample cells until it was in >%fold molar excess to ferredoxin:NADP+ reductase. Extrapolations to infinite fer- redoxin concentration gave the values for the difference ex- tinction coefficients (455 M" cm" for AA4m - AAm and 1790 M" cm" for - A A % O ) previously mentioned; extrapo-
\ \ I I I I -7- pH 7.5 A NOCI tltrotlon-
\ '\\ 0 0 Fd tifrot~on
pH 5.5 b\ -6 -
Y D
0
- - 5 - - 4 - \, 1 -
A
I I I I .I .2 . 3 .4
fl FIG. 1. Binding of ferredoxin and ferredoxin:NADP+ reduc-
tase as a function of ionic strength. All titrations used 20 pM ferred0xin:NADP' reductase in 10 mM Tris buffer. The difference between the absorbance at 465 nm and that at 420 nm in the binding spectrum was used as a measure of complex formation. All used 4 cuvettes, 2 on the reference side, 2 on the sample side. Those marked with solid symbols were titrated by adding equal quantities of ferre- doxin and ferredoxin:NADP' reductase to the sample and reference cells. The 2 electron carriers were added to the same cell on the sample side, and to different cells on the reference side. Spectra were taken initially and after each addition of 2 M NaCl to all cells. Kd values were calculated assuming complete association in the initial spectrum. The points marked by open symbols were obtained by balancing the front cells with approximately 20 p~ ferredoxin:NADP' reductase and the rear cells with buffer, then titrating in equal amounts of 700 p~ ferredoxin to the front sample and rear reference cells, mixing, and taking spectra after each addition. We extrapolated to infinite ferredoxin concentration to obtain the maximal change in absorbance. Kd values were obtained by fitting the theoretical curve to the experimental points.
lated absorbances were independent of salt concentration and pH. A computer program was used to calculate the best fit between the data from ferredoxin titrations and the theoreti- cal curve predicted by the Kd. Best fit was considered to be the K d which gave the least sum of squared error.
Fig. 1 presents the Kd values obtained by titrations with NaCl and ferredoxin, carried out at pH 7.5 and 8.5. As previ- ously described, salt addition was found to increase the Kd; Fig. 1 shows that Kd is ako larger at the higher pH. K d values obtained by ferredoxin titration gave excellent agreement with those obtained by NaCl titration (Fig. 1, open versus solid points).
Fig. 2 shows the relationship between pH and pKd of the Fd . FNR complex. Each point (3 different buffers; see legend) was obtained from a series of lines obtained as in Fig. 1, by NaCl and/or ferredoxin titrations at the indicated pH (Fig. 2), using the K d values obtained at 90 mM salt concentration. It is apparent that Kd increases ( p K d decreases) with increasing pH. For pH values between 6.5 and 8.5, plotting pKd versus 4 gave straight and parallel lines, but this may be fortuitous, as small variations in the value for maximal AA (100% binding) will markedly affect the value calculated for Kd at low ionic strength.
An increase in K d with increasing pH can be explained most easily by the binding of a proton when ferredoxin and ferre- doxin:NADP+ reductase form a complex. We can fit these data to a theoretical line derived from this model; we assume that one of the proteins has an ionizable group which is affected by complex formation, described by Equation 1, derived from the relationships shown below (Pr designates protein and L designates ligand):
Kdl = [PrH'][L]/[PrH'.L] Ka = [Pr ] [L] / [Pr .L]
K, = [Pr][H']/[PrH'] K', = [Pr.L][H']/[PrH'*L]
Kd (measured) = K d 2 X (1 + [ H + ] / K J / [ I + [H'I/K'd (1)
where Kd2 is the limiting dissociation constant approached at high pH, K, is the ionization constant for the free protein, and K', is the ionization constant for that group in the protein. protein complex. We find the best fit to the data using K d 2 = 60 p ~ , pK, = 6.0, and pK, = 8.2. These data predict that the fully protonated form should have a dissociation constant ( & I ) of about 0.4 p ~ . If more than one proton were bound, the absolute value of the slope would be greater than 1 between pH 6 and pH 9, and a good fit could not be obtained using Equation 1. As Kd (measured) decreases with increasing
I I I
7.0 - PKd.ba,,c. =4.25 - pKa ~ 6 . 0
1
-
6 7 8 9 1 0 PH
FIG. 2. Variation in Kd with pH. All points were derived from lines obtained as in Fig. 1 at the point of 4 = 0.3, with the excep- tion that subsequent calculations used a difference extinction Coeffi- cient of 473 M-' cm" for the difference in absorbance between 464 and 418 nm to calculate Kd values. Buffers used were: 10 m sodium phosphate buffer (0); 10 m potassium carbonate buffer (0); Or 10
%cine (m). All buffers had an initial ionic strength of 0.03 M. The curve was calculated assuming a group which is protonated with a p ~ , of 6.0 in uncomplexed protein and a pK'a of 8.2 in the Fd- FNR complex, limiting Kd in basic conditions Of 56 pM.

pH, we can conclude that at intermediate pH values, a proton is taken up when ferredoxin and ferredoxin:NADP' reductase form a complex; at pH greater than 8.5, the proteins are no longer protonated and the strength of the complex is no longer pH-dependent.
Oxidation-Reduction Titrations of Fd FNR Mixtures The previous data describe the properties of the fully oxi-
dized Fd.FNR complex. If reduction alters the Kd, then the oxidation-reduction behavior of one or both proteins must change. Our laboratory has studied analogous relationships in the adrenal system; these studies have established that the E, of adrenodoxin becomes more negative when bound to adrenodoxin reductase, indicating that the reduced adreno- doxin binds the flavoprotein with less affinity than does oxi- dized adrenodoxin (10).
Preliminary experiments indicated that fully reduced and semiquinone forms of ferredoxin:NADP' reductase did indeed form complexes with reduced ferredoxin. Thus, the paramag- netic probe, dysprosium, when chelated by either o-phenan- throline or EDTA, was found to broaden and relax the EPR signals of reduced ferredoxin and ferredoxin:NADP+ reduc- tase neutral semiquinone. Each protein was substantially shielded when the other was added under conditions favoring complex formation. Addition of NaCl could restore the Dy3+ effect.
We investigated the possibility that these reduced com- plexes might differ in & from the oxidized complex by carry- ing out oxidation-reduction titrations of 1:l mixtures of ferre- doxin and ferredoxin:NADP+ reductase, changing salt or pro- tein concentration to vary the degree of association of ferre- doxin and ferredoxin:NADP+ reductase. We plotted the frac- tion of reduced ferredoxin uersus 30 log([FNRo,]/[FNR,,~]) to measure E,,,(Fd) - E,(FNR).
t 1
1 I I I I 400 500 600
Wavelength (nm)
FIG. 3. Photoreduction of 1:l Fd:FNR at high ionic strength. A 1-ml reaction mixture containing 36.6 WM ferredoxin:NADP' reduc- tase, 36.6 PM ferredoxin, 1 m~ EDTA, and 1.5 p~ deazaflavin in 100 mM potassium carbonate buffer, 0.19 M NaCl, p = 0.3 M, pH 9.0, was evacuated and regassed with Ar 7 times to make the solution anaer- obic. The mixture was mixed with the gas after each exchange to equilibrate the gas with any dissolved gases. The mixture was illu- minated for periods of 5 min by a 500-Watt slide projector at 12 inches; during illumination, the anaerobic cuvette was immersed in ice water to keep it cool. Spectra were taken before illumination and after each period of illumination. Following complete reduction, the cuvette was opened and allowed to reoxidize. The spectrum of the reoxidized mixture was recorded to check for the retention of intact ferredoxin and ferredoxin:NADP' reductase.
I I I I 1
I I I J 400 500 600
Wavelength (nm)
FIG. 4. Photoreduction of Fd*FNR complex. A 1-ml reaction mixture of 36.7 PM ferredoxiwNADP' reductase, 35.3 PM ferredoxin, 10 mM glycine, pH 9.0, 10 m~ EDTA, 1.5 PM 5-deazaflavin was rendered anaerobic and reduced in the same manner as described in the legend to Fig. 3. &rue 1 was recorded before illumination, and each successive curue was recorded after illumination for increasing periods of time.
We first titrated 1:1 mixtures of oxidized ferredoxin and ferredoxin:NADP+ reductase at low and at high ionic strengths, using three reduction systems: light-deazaflavin- EDTA (photoreduction), dithionite, and dithionite-methyl viologen. Figs. 3 and 4 show the spectra from two such titrations, photoreducing the electron carriers. Fig. 3 displays spectra from several time points in a photoreduction at p = 0.3 M, where the Fd - FNR complex is completely dissociated. Both proteins can be reduced fully, and the E,,, values are similar: bleaching occurs both at long wavelengths (>500 nm), where ferredoxin is the primary chromophore, and in the region between 400 and 480 nm, where ferredoxin:NADP+ reductase is bleached on reduction.
Fig. 4 shows some of the spectra from a similar photoreduc- tion of 1:l Fd-FNR, but in 10 mM buffer, pH 9. Under these conditions (Kd = 0.2 PM), the oxidized proteins are >95% associated in the Fd . FNR complex. The intermediate spectra are markedly different from those recorded at high ionic strength (Fig. 3). Thus, spectrum 5 (Fig. 4) resembles that of the sum of oxidized ferredoxin plus reduced ferredoxin: NADPC reductase; it is clear that the difference between the midpoint potentials of the two proteins has markedly in- creased under those conditions of ionic strength which favor association.
The spectra shown in Figs. 3 and 4 were analyzed for the concentrations of the oxidation-reduction forms of the com- ponents by the method of Lambeth et al. (10) (see also under "Methods"). Fig. 5 shows the results of a series of such analyses, plotting the percentage of reduced ferredoxin uersus 30 log([FNRox]/[FNRI.ed]). Such a plot allows calculation of the separation of the midpoint potentials of ferredoxin and ferredoxin:NADP' reductase. For p = 0.3 M (if we assume that the two proteins are fully dissociated in all oxidation-reduction states, and that ferredoxin:NADP' reductase obeys simple Nernstein n = 2 behavior), we find that ferredoxin has an E,,, 20 mV positive to that of ferredoxin:NADP+ reductase, a finding compatible with earlier studies (19). In this case, the curve for ferredoxin deviates somewhat from the predicted n = 1 curve; the plotted data (Fig. 5, dashed line) fit an n = 1.4

7760 Ferredoxin Ferredoxin:NADP' Reductase Complex
FIG. 5. Relative potentials of ferredoxin and ferredoxin: NADP+ reductase at 2 salt concentrations. The spectra from Figs. 3 and 4 were analyzed using all 20 wavelengths of Table I to yield concentrations of oxidized and reduced enzymes. 0, p = 0.3, data from Fig. 3; 0, p = 0.011, data from Fig. 4.
curve better, an observation we do not attempt to explain. A t low ionic strength, where the Fd FNR complex is essen-
tially fully associated, the spectra (from Fig. 4) gave the titration curve shown in open circles in Fig. 5. In this case, the ferredoxin titration fits an n = 1 curve better, but is shifted considerably to the negative of the ferredoxin:NADP' reduc- tase potential. The curve drawn through the data points is that predicted for an E, of bound ferredoxin 70 mV negative to the E,,, of bound ferredoxin:NADP' reductase. Reduced titration using dithionite and methyl viologen as well as black- titrations using ferricyanide as oxidant gave values for E,,,(Fd) - E,(FNR) between -70 and -80 mV.
We also varied the association of ferredoxin and ferredoxin: NADP' reductase in oxidation-reduction titrations by using different concentrations of the 1:l Fd-FNR mixture. We car- ried out 5 reductive titrations of 1:l Fd:FNR at concentrations from 1 to 50 PM (each) using dithionite and methyl viologen as reductants. We found that E,,,(Fd) - E,(FNR) changed from +15 mV at 1 p~ (a concentration at which 65% of the proteins are associated) to about -60 mV at 50 p~ (complete association of the oxidized proteins). At higher concentrations, the data deviated from ideality; too much ferredoxin was reduced at high potential compared to the point at which it was 50% reduced. In this experiment, as before, E,(Fd) - E,(FNR) is more negative when the electron carriers are more associated.
The changes in E,(Fd) - E,(FNR) observed with varying association could be explained as: 1) a negative change in the E,,, of ferredoxin, 2) a positive change in the E,,, of ferredoxin: NADP' reductase, or 3) both a negative change in ferredoxin potential and a positive change in ferredoxin:NADP' reduc- tase potential (a combiriation of the above). The following treatment attempts to distinguish among these possibilities.
The possible complexes between oxidized and reduced fer- redoxin and ferredoxin:NADP+ reductase are shown in Equa- tions 2-5. We neglect states with the semiquinone form of ferredoxin:NADP' reductase, as it was a minor species at equilibrium in all experiments.
Kdl = [Fdox][FNRox]/[Fdox.FNRoxI (2)
K ~ L = [Fd,,d][FNR,,]/[Fd~..d.FNR,,] (3)
Kd.3 [Fd,,,][FNR~..d]/[Fd~~d.FNR,,dI (4)
Kd4 = [Fdw.][FNRred]/[Fdm.FNRred) (5)
For case 1 (a change of E,(Fd) to a more negative value when bound to FNR), the Kd varies only with the oxidation- reduction state of ferredoxin (& = Kd3 > Kdl = Kd4). In such a system, the midpoint potential would vary with uncom- plexed ferredoxin:NADP' reductase concentration [FNR] as
in Equation 6:
E , app = E,(Fd) + (RT/F)ln (6)
((1 + [FNR]/&d/(l + [FNR]/&d)
If this explanation were correct, then, at saturating ferredoxin: NADP' reductase, this equation would collapse to Equation 7:
E , .,p(Fd) = E,(Fd) + (RT/F)ln(&/&d (7)
Equation 7 predicts an n = 1 titration curve displaced 60 log(Kdl/Kdl) mV from that of free ferredoxin.
If E, .pp(Fd) - E,(Fd) = -70 mV, then Kd "reduced" ( K a , Kd3) is at least 15 times Kd "oxidized' (&, Kd4). This predicts that reduced ferredoxin would be less associated with ferre- doxin:NADP' reductase than oxidized ferredoxin, and that E,(Fd) - E,(FNR) should become more negative as the concentration of protein is increased, until that concentration is much greater than the largest Kd. Such an interpretation is compatible with the data supporting case 1.
An equivalent treatment for case 2 (a positive change in E,(FNR) reveals that KdOx (Kdl, K d 2 ) would be about 215 times Kd red (Kd3, Kd4). This would predict a large change at 1 p ~ , where nearly all reduced ferredoxin:NADP' reductase and 65% of the oxidized ferredoxin:NADP' reductase would be complexed to ferredoxin. The data are inconsistent with this interpretation; the change observed in Fig. 5 cannot be attributed to a change in the potential of FNR alone. A small contribution to the total change by ferredoxin:NADP' reduc- tase as in case 3 cannot be ruled out.
We then carried out preliminary experiments using oxida- tion-reduction-active dyes or excess ferredoxin:NADP+ reduc- tase as indicators of E h (see Equation 9), to provide independ- ent measures of the effect of complexation upon the oxidation- reduction behavior of each of the two enzymes. We f i s t used neutral red as oxidation-reduction indicator (E,,, = -440 mV at pH 9 (33), confirmed by potentiometric titration). Titration of each protein separately with neutral red gave E,(Fd) = -430 mV and E,(FNR) = -445 mV. When we titrated a mixture of ferredoxin and ferredoxin:NADP+ reductase with neutral red as the oxidation-reduction indicator using spectral analysis to quantify the oxidation-reduction states of each component, the E , of ferredoxin:NADP' reductase was indis- tinguishable from that measured in the absence of ferredoxin. In complex, the potential of ferredoxin was changed by -75 mV to -505 mV. Use of methyl viologen gave similar results. In each case, the potential at which ferredoxin is largely reduced is subject to considerable error; only a small portion of the indicator remained oxidized through these points.
A different approach was to titrate a 10:l mixture of ferre- doxin:NADP' reductase and ferredoxin using the excess free ferredoxin:NADP' reductase as a oxidation-reduction indica- tor. Here also, we found that the potential of ferredoxin in complex was about 75 mV lower in potential than the sum of the complexed and the free ferredoxin:NADP' reductase. The data in this experiment deviated from a Nerstian line as described earlier, so we considered possible contributions to the Kd from the oxidation-reduction state of ferredoxin: NADP' reductase in constructing a simulated line which would fit the data. Using Equations 2-5 and the Nernst equation, we substitute into Equation 8:
to derive Equation 9, which describes the percentage of fer- redoxin reduction as a function of the dissociation constants, the oxidation-reduction potentials of free ferredoxin and fer- red0xin:NADP' reductase, and the concentration of free fer-

Ferredoxin. Ferredoxin: NADPi Reductase Complex 7761
red0xin:NADP' reductase, oxidized and reduced. [FNRm] [FNRred]
X "-i ~~ [FNR,,] K d l + [FNRred] (9'
K d 3 K d z
where E,, = E,(FNR) + 30 log([FNROx]/[FNR~~ed]). Using Equation 9 and considering the concentration of
bound ferredoxin:NADP' reductase to be negligible, we can simulate oxidation-reduction titrations. By varying the values for Kd2, Kd3, and Kd4, we fit the predicted titration curve to the data. We used KdI = 0.2 pM, K d 2 = 4 pM, Kd3 = 20 ELM, and Kd4 = 0.4 PM. Kd, we determined by the methods of Fig. 1. Using that value for Kdl, reasonable fits to the data can be made of Kd3 between 5 and 20 p ~ ; Kd2,2-4 pM; and Kd4, 0.1- 0.4 p ~ . In all cases, Kd3 must be about 4 times greater than Kd2, and Kd2 in turn must be at least 10-fold greater than or Kd4. Other arrangements of values predict differently shaped curves. When we simulated the titration curve for bound ferredoxin:NADP' reductase using Kd values which give a good fit for the ferredoxin reduction, that curve varied little from that of free ferredoxin:NADP' reductase.
Potentiometric Titration of Ferredoxin and Ferredoxin: NADP' reductase
We also made simultaneous spectrophotometric and elec- tropotential measurements during titrations of ferredoxin: NADP' reductase and ferredoxin, first each protein sepa- rately, then in complex. Titrations were carried out in a Dutton cell (34), and benzyl viologen and methyl viologen in a ratio of 1:l:lO to enzyme were used as mediators. The system used was calibrated against systems of known potential: quin- hydrone, benzyl viologen, and ferricyanide. Separate titrations of ferredoxin and ferredoxin:NADP' reductase showed similar E , values: E,(Fd) (pH 8.4) = -420 mV, and E,(FNR) (pH 8.4) = -442 mV. Each titration conformed to an n = 1 and n = 2 titration curve, respectively.
We then titrated a L1.3 mixture of ferredoxin and ferre- doxin:NADP' reductase with both dithionite and ferricyanide (Fig. 6). Benzyl viologen and methyl viologen, the mediators, were present at a ratio of 1 : l O to ferredoxin:NADP' reductase. The data from Fig. 6 support the conclusions of the prelimi- nary experiments. A marked negative potential shift is evi- dent, about 90 mV (corresponding to at least a 30-fold change in Kd values), but a small change (about +20 mV) is also seen in the potential of ferred0xin:NADP' reductase. The data points for percentage of reduced ferredoxin:NADP+ reductase in the reductive experiment best fit an n = 1.8 curve. This might indicate some dependence of K d on the oxidation-re- duction state of ferredoxin:NADP' reductase but a smaller one; about 4-5-fold.
We cannot calculate a ratio of Kd values for oxidized and reduced complexes with much confidence from Fig. 6, since the reduced ferredoxin was probably not entirely associated with ferredoxin:NADP+ reductase; nevertheless, from a poten- tial change of -90 mV, we can calculate that reduced ferre- doxin would form a complex with ferredoxin:NADP' reduc- tase with a K d at least 30 times that of the oxidized ferredoxin, giving a Kd red of at least 6 p ~ , a value indicating some dissociation under our experimental conditions. If we assume some dissociation, the values of Kd2 and Kd3 could easily be 50-100 times that of Kd,.
As observed earlier, the data points for ferredoxin reduction varied significantly from a Nerstian n = 1 curve; a small amount of ferredoxin was reduced (-6%) at a potential of -380 mV, and the concentration of reduced ferredoxin de- creased as ferredoxin:NADP' reductase was reduced. After
Eh h v )
FIG. 6. Potentiometric titration of FdeFNR. Oxidative and re- ductive titrations were carried out in a Dutton cell using platinum and calomel electrodes to measure E,,. A 5-ml stirred solution of 10 mM Tricine, pH 8.4, 22.5 p~ ferredoxin:NADP' reductase, 17 p~ ferredoxin, 1.5 p~ benzyl viologen, and 1.5 PM methyl viologen was flushed with Ar for 20 min. For reductive titration, the solution was titrated with dithionite, and the spectra were recorded when the indicated potential stabilized after each addition. The percentage of reduced ferredoxin:NADP+ reductase (0) and that of reduced ferre- doxin (0) were calculated using the first 19 wavelengths of Table I. For oxidative titration, after full reduction, the solution was back- titrated with ferricyanide, using the protocol above to give values for percentage of reduced ferredoxin:NADP' reductase (.) and reduced ferredoxin (0).
nearly complete reduction of ferredoxin:NADP' reductase, reduction of ferredoxin proceeded to completion. The reduc- tion of ferredoxin at very low potential followed a curve steeper than that predicted by a simple n = 1 curve, but ferredoxin was 50% reduced at a potential about 90 mV more negative than in the titration of ferredoxin alone. Back-titra- tion with ferricyanide reversed the sequence. These data confirm the conclusions drawn earlier; in complex, ferredoxin is more negative than the uncomplexed ferredoxin, and thus serves as a stronger reductant for ferredoxin:NADP' reduc- tase, and reduced ferredoxin dissociates more readily from ferredoxin:NADP' reductase than does oxidized ferredoxin.
DISCUSSION
We find that the strength of the 1:l complex between ferredoxin and ferredoxin:NADP+ reductase is affected not only by salt concentration (30), but also by pH and the oxidation-reduction state of the proteins. Upon formation of the Fd.FNR complex, ferredoxin becomes at least 90 mV more negative in potential, and the K d of the FNR. reduced Fd complex is at least 30 times the Kd of the oxidized Fd. FNR complex; ferredoxin:NADP+ reductase may also change in potential, but to a lesser degree, perhaps 20 mV positive. The variation of the dissociation constant of the oxidized proteins with pH suggests the existence of a group on either ferredoxin or ferredoxin:NADP' reductase with a pK, of about 6 on the free protein. Protonation of this group seems to favor complexation; the pK, of this group appears to be about 8 when the two proteins form a complex. The slope of the line in Fig. 2, which is never more than -1, shows that only one group is protonated per complex, if two or more residues were protonated on formation of the protein-protein complex, the slope should be nearly -2 at pH 7.
Foust et al. (30) reported a similar variation of Kd with pH (larger Kd at higher pH) in the analogous 1:l complex between the 1-electron carrier, flavodoxin, and ferredoxin:NADP' re- ductase (30). As ferredoxin:NADP' reductase forms pH-sen- sitive complexes with 2 different small electron carriers, the same group on ferredoxin:NADP' reductase may be involved
7762 Ferredoxin - Ferredoxin:NADP+ Reductase Complex
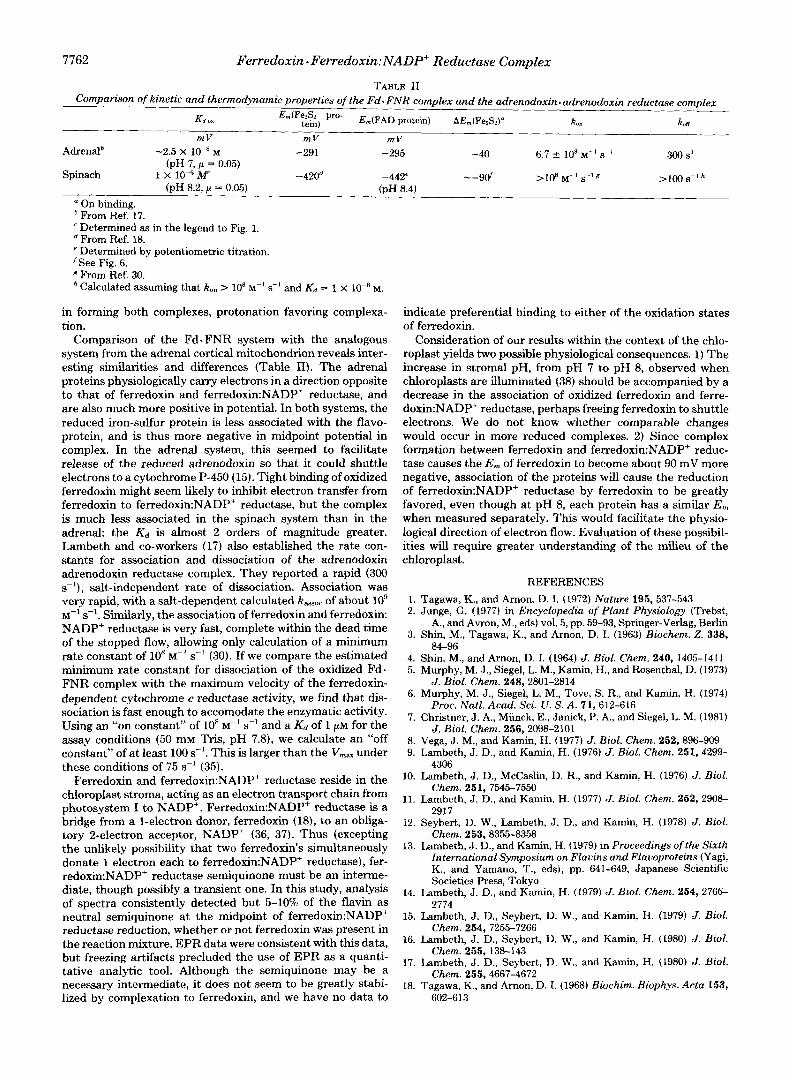
TABLE I1
Adrenalb -2.5 X M -291 -295 -40 6.7 2 10' M" S-' 300 s'
Spinach 1 x 10⁻⁶ iw -420d -442' (pH 7, p = 0.05)
(pH 8.2, p = 0.05) (PH 8.4) - -9d >lo8 M" S" ' >loo SKI
On binding. * From Ref.-17.
Determined as in the legend to Fig. 1. From Ref. 18.
'See Fig. 6. e Determined by potentiometric titration.
From Ref. 30. Calculated assuming that k,, > 10' M" s-' and Kd = 1 x 10"j M.
in forming both complexes, protonation favoring complexa- tion.
Comparison of the Fd-FNR system with the analogous system from the adrenal cortical mitochondrion reveals inter- esting similarities and differences (Table 11). The adrenal proteins physiologically carry electrons in a direction opposite to that of ferredoxin and ferred0xin:NADP' reductase, and are also much more positive in potential. In both systems, the reduced iron-sulfur protein is less associated with the flavo- protein, and is thus more negative in midpoint potential in complex. In the adrenal system, this seemed to facilitate release of the reduced adrenodoxin so that it could shuttle electrons to a cytochrome P-450 (15). Tight binding of oxidized ferredoxin might seem likely to inhibit electron transfer from ferredoxin to ferredoxin:NADP+ reductase, but the complex is much less associated in the spinach system than in the adrenal: the K d is almost 2 orders of magnitude greater. Lambeth and co-workers (17) also established the rate con- stants for association and dissociation of the adrenodoxin adrenodoxin reductase complex. They reported a rapid (300 s-I), salt-independent rate of dissociation. Association was very rapid, with a salt-dependent calculated k,,,,, of about loy "1 s-l . Similarly, the association of ferredoxin and ferredoxin: NADP+ reductase is very fast, complete within the dead time of the stopped flow, allowing only calculation of a minimum rate constant of 10' M" s-' (30). If we compare the estimated minimum rate constant for dissociation of the oxidized Fd. FNR complex with the maximum velocity of the ferredoxin- dependent cytochrome c reductase activity, we find that dis- sociation is fast enough to accomodate the enzymatic activity. Using an "on constant" of 10' M" s-l and a K d of 1 pM for the assay conditions (50 mM Tris, pH 7.8), we calculate an "off constant" of at least 100 s-'. This is larger than the V,,, under these conditions of 75 s-' (35).
Ferredoxin and ferredoxin:NADP' reductase reside in the chloroplast stroma, acting as an electron transport chain from photosystem I to NADP'. Ferredoxin:NADP+ reductase is a bridge from a 1-electron donor, ferredoxin (18), to an obliga- tory 2-electron acceptor, NADP' (36, 37). Thus (excepting the unlikely possibility that two ferredoxin's simultaneously donate 1 electron each to ferredoxin:NADP' reductase), fer- redoxin:NADP' reductase semiquinone must be an interme- diate, though possibly a transient one. In this study, analysis of spectra consistently detected but 5-10% of the flavin as neutral semiquinone at the midpoint of ferredoxin:NADP' reductase reduction, whether or not ferredoxin was present in the reaction mixture. EPR data were consistent with this data, but freezing artifacts precluded the use of EPR as a quanti- tative analytic tool. Although the semiquinone may be a necessary intermediate, it does not seem to be greatly stabi- lized by complexation to ferredoxin, and we have no data to
indicate preferential binding to either of the oxidation states of ferredoxin.
Consideration of our results within the context of the chlo- roplast yields two possible physiological consequences. 1) The increase in stromal pH, from pH 7 to pH 8, observed when chloroplasts are illuminated (38) should be accompanied by a decrease in the association of oxidized ferredoxin and ferre- doxin:NADP+ reductase, perhaps freeing ferredoxin to shuttle electrons. We do not know whether comparable changes would occur in more reduced complexes. 2) Since complex formation between ferredoxin and ferredoxin:NADP+ reduc- tase causes the E, of ferredoxin to become about 90 mV more negative, association of the proteins will cause the reduction of ferredoxin:NADP' reductase by ferredoxin to be greatly favored, even though at pH 8, each protein has a similar E , when measured separately. This would facilitate the physio- logical direction of electron flow. Evaluation of these possibil- ities will require greater understanding of the milieu of the chloroplast.
REFERENCES 1. 2.
3.
4. 5.
6.
7.
8. 9.
10.
11.
12.
13.
14.
15.
16.
17.
18.
Tagawa, K., and Arnon, D. I. (1972) Nature 195, 537-543 Junge, G . (1977) in Encyclopedia of Plant Physiology (Trebst,
A., and Avron, M., eds) vol. 5, pp. 59-93, Springer-Verlag, Berlin Shin, M., Tagawa, K., and Arnon, D. I. (1963) Biochem. 2. 338,
Shin, M., and Arnon, D. I. (1964) J. Biol. Chem. 240, 1405-1411 Murphy, M. J., Siegel, L. M., Kamin, H., and Rosenthal, D. (1973)
Murphy, M. J., Siegel, L. M., Tove, S. R., and Kamin, H. (1974)
Christner, J. A., Miinck, E., Janick, P. A., and Siegel, L. M. (1981)
Vega, J . M., and Kamin, H. (1977) J. Biol. Chem. 252,896-909 Lambeth, J. D., and Kamin, H. (1976) J. Biol. Chem. 251,4299-
4306 Lambeth, J. D., McCaslin, D. R., and Kamin, H. (1976) J. Biol.
Chem. 251, 7545-7550 Lambeth, J. D., and Kamin, H. (1977) J. Biol. Chem. 252, 2908-
2917 Seybert, D. W., Lambeth, J. D., and Kamin, H. (1978) J. Biol.
Chem. 253,8355-8358 Lambeth, J . D., and Kamin, H. (1979) in Proceedings ofthe Sixth
International Symposium on Flavins and Flavoproteins (Yagi, K., and Yamano, T., eds), pp. 641-649, Japanese Scientific
Lambeth, J. D., and Kamin, H. (1979) J. Biol. Chem. 254, 2766- Societies Press, Tokyo
2774 Lambeth, J. D., Seybert, D. W., and Kamin, H. (1979) J. Biol.
Chem. 254,7255-7266 Lambeth, J. D., Seybert, D. W., and Kamin, H. (1980) J. Biol.
Chem. 255,138-143 Lambeth, J. D., Seybert, D. W., and Kamin, H. (1980) J. Biol.
Chem. 255,4667-4672 Tagawa, K., and Amon, D. I. (1968) Biochim. Biophys. Acta 153,
84-96
J. Biol. Chem. 248,2801-2814
Proc. Natl. Acad. Sei. U. S. A. 71, 612-616
J. Biol. Chem. 256,2098-2101
602-613

Ferredoxin, Ferredoxin:NADP+ Reductase Complex 7763
19. Kierns, J . J., and Wang, J. H. (1972) J. Biol. Chem. 247, 7374- 7382
20. Lancaster, J. R., Batie, C. J., Kamin, H., and Knaff, D. B. (1981) in Methods in Chloroplast Molecular Biology (Edelmans, M., Halleck, K. B., and Chua, N.-H., eds) Elsevier, Amsterdam, in press
21. Buchanan, B. B., and Arnon, D. I. (1971) Methods Enzymol23A,
22. Shin, M., and Oshino, R. (1978) J. Biochem. (Tokyo) 83,357-361 23. Hasumi, H., and Nakamura, S. (1978) J. Biochem. (Tokyo) 84,
24. Sheriff, S., Teller, D. C. , and Herriott, J. R. (1980) Arch. Biochem.
25. Mayhew, S. G., Abels, R., and Plantenkamp, R.(1977) Biochem.
26. Spencer, R., Fisher, J., and Walsh, C. (1976) Biochemistry 15,
27. Zanetti, G. , and Curti, B. (1980) Methods Enzymol. 69, 250-255 28. Massey, V., and Hemmerich, P. (1978) Biochemistry 17,9-I7
413-440
707-717
Biophys. 205,499-502
Biophys. Res. Commun. 77, 1397-1403
1043-1053
29. Hosein, B. H. (1973) Ph.D. dissertation, University of Michigan 30. Foust. G. P., Mayhew, S. G., and Massey, V. (1969) J. Biol. Chem.
244,964-970 31. Nelson, N., and Neumann, J. (1969) J. Biol. Chem. 244, 1932-
1936
Commun. 33, 38-42
Systems, Williams & Wilkins, Baltimore
32. Shin, M., and San Pietro, A. (1968) Biochem. Biophys. Res.
33. Clark, W. M. (1960) Oxidation-Reduction Potentials of Organic
3 4 . Dutton, R. L. (1978) Methods Enzymol. 54,411-435 35. Forti, G., and Sturani, E. (1968) Eur. J. Biochem. 3,461-472 36. Farrington, J. A., Land, E. J., and Swallow, A. J. (1980) Biochim.
37. Anderson, R. F. (1980) Biochim. Biophys. Acta 590, 277-281 38. Werdan, K., Heldt, H. W., and Milovancev, M. (1975) Biochim.
39. Deleted in proof 40. Massey, V., and Palmer, G . (1966) Biochemistry 5,3181-3189
Biophys. Acta 590,273-276
Biophys. Acta 396,276-292