Embed Size (px)
Citation preview
Prepared for Otis College of Art and Design by the Los Angeles County Economic Development Corporation. 2018
blue 3115
Pantone Blue072
pantone3955
401000
pantone381
cool grey 10
Light cool grey
2018 2018
SECONDARY TREATMENT FOR DATE WHEN USEDFOR EBLASTS
2018
of theLOS ANGELES REGION and theSTATE OF CALIFORNIA
THANK YOU
REPORT SPONSORS
MEDIA PARTNERS
of theLOS ANGELES REGIONand theSTATE OF CALIFORNIA
May 2018
Prepared for Otis College of Art and Design by theINSTITUTE FOR APPLIED ECONOMICS Los Angeles County Economic Development Corporation
2018
blue 3115
Pantone Blue072
pantone3955
401000
pantone381
cool grey 10
Light cool grey
2018 2018
SECONDARY TREATMENT FOR DATE WHEN USEDFOR EBLASTS
2018
PREPARED AND RESEARCHED BY:
Somjita Mitra, Ph.D. Director
Tyler LaferriereResearch Analyst
Eric Hayes Research Analyst
Shannon Sedgwick Senior Economist
ABOUT THE INSTITUTE FOR APPLIED ECONOMICS
The LAEDC Institute for Applied Economics spe-cializes in objective and unbiased economic and public policy research in order to foster informed decision-making and guide strategic planning. In addition to commissioned research and analysis, the Institute conducts foundational research to ensure LAEDC’s many programs for economic de-velopment are on target. The Institute focuses on economic impact studies, regional industry, and cluster analysis and issue studies, particularly in workforce development and labor market analysis. Every reasonable effort has been made to ensure that the data contained herein reflect the most accurate and timely information possible and they are believed to be reliable. The report is provided solely for informational purposes and is not to be construed as providing advice, recommendations, endorsements, representations, or warranties of any kind whatsoever.
© 2018 Los Angeles County Economic Development Corporation. All rights reserved.
Los Angeles County Economic Development Corporation 444 S. Flower Street, 37th Floor Los Angeles, CA 90071Tel: 213-622-4300, 888-4-LAEDC-1 Fax: 213-622-7100www.LAEDC.org [email protected]
PROJECT MANAGED BY: Christine LeaheyDirector of Stategic Partnerships
Laura Park Marketing Coordinator
Ryan Senese Online Experience
StartnershipDesign and Production
Sean Yoon Design and Production
Hector TorresDesign and Production
ABOUT OTIS COLLEGE OF ART AND DESIGN
Established in 1918, Otis College of Art and Design offers undergraduate and graduate degrees in a wide variety of visual and applied arts, media, and design. Core programs in liberal arts, busi-ness practices, and community-driven projects support the College’s mission to prepare diverse students to enrich our world through their creativ-ity, skill, and vision. The renowned Creative Action program has been recognized by the Carnegie Foundation for Community Engagement, and the Otis Report on the Creative Economy is a powerful advocacy tool for creative industries. The College serves the Greater Los Angeles Area through compelling public programming, as well as year-round Continuing Education courses for all ages. More information is available at www.otis.edu.
Otis College of Art and Design9045 Lincoln BoulevardLos Angeles, CA 90045
Prepared for Otis College of Art and Design by the INSTITUTE FOR APPLIED ECONOMICS Los Angeles County Economic Development Corporation
Version published on Saturday, April 28, 2018www.otis.edu/otisreport
REPORT CONTENTS
Introduction: Welcome to the 2018 Otis Report on the Creative Economy by Bruce W. Ferguson, President, Otis College of Art and Design 6
1. Executive Summary 10 2. What is the Creative Economy? 15 3. National and Global Economic Context 16 4. Creative Industry Trends 18 5. Economic Contribution of the Creative Industries 28 6. Looking Ahead: The Creative Economy in 2021 30 7. Industry Snapshots 33 8. Occupations in the Creative Economy 56 9. Nonprofit Sector of the Creative Economy 63 10. Arts Education 69 11. California Regional Snapshots 76 12. How To Use This Report 93 13. Statistical Appendix 94
Addendum: Commentaries 113
www.otis.edu/otisreport 5
2018 Otis Report on the Creative Economy of the Los Angeles Region and the State of California6 www.otis.edu/otisreport
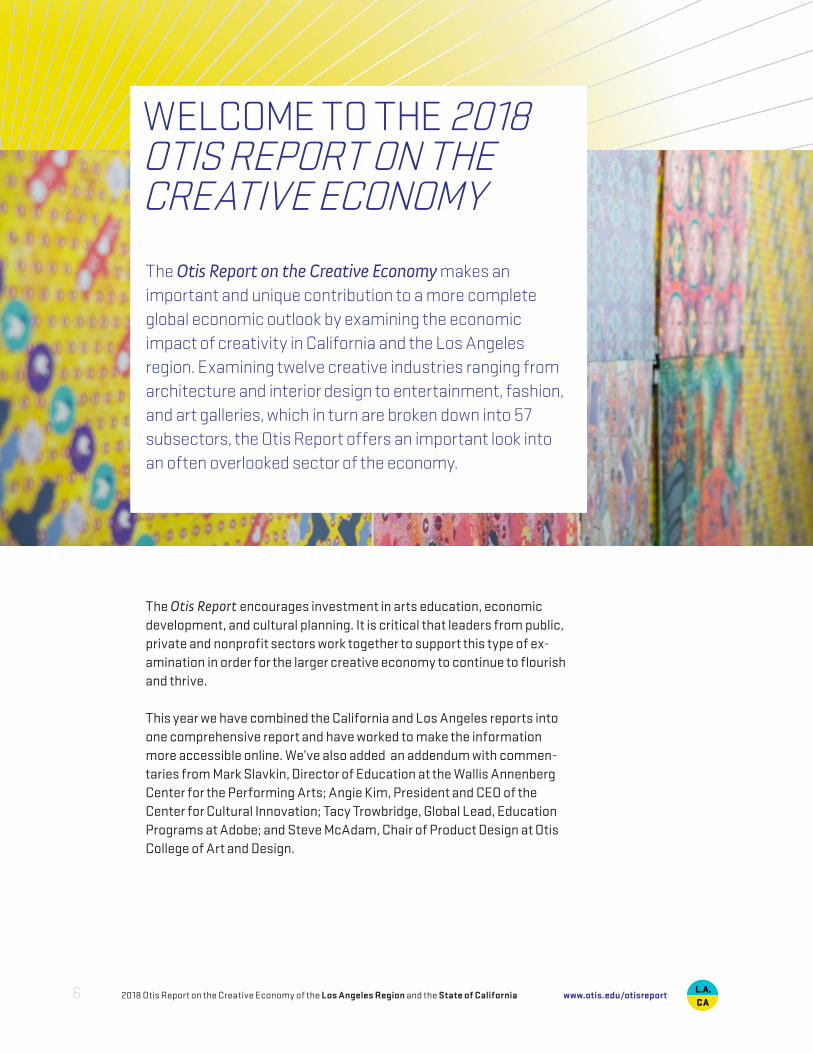
WELCOME TO THE 2018 OTIS REPORT ON THE CREATIVE ECONOMY
The Otis Report on the Creative Economy makes an important and unique contribution to a more complete global economic outlook by examining the economic impact of creativity in California and the Los Angeles region. Examining twelve creative industries ranging from architecture and interior design to entertainment, fashion, and art galleries, which in turn are broken down into 57 subsectors, the Otis Report offers an important look into an often overlooked sector of the economy.
The Otis Report encourages investment in arts education, economic development, and cultural planning. It is critical that leaders from public, private and nonprofit sectors work together to support this type of ex-amination in order for the larger creative economy to continue to flourish and thrive.
This year we have combined the California and Los Angeles reports into one comprehensive report and have worked to make the information more accessible online. We’ve also added an addendum with commen-taries from Mark Slavkin, Director of Education at the Wallis Annenberg Center for the Performing Arts; Angie Kim, President and CEO of the Center for Cultural Innovation; Tacy Trowbridge, Global Lead, Education Programs at Adobe; and Steve McAdam, Chair of Product Design at Otis College of Art and Design.
2018 Otis Report on the Creative Economy of the Los Angeles Region and the State of California 7www.otis.edu/otisreport
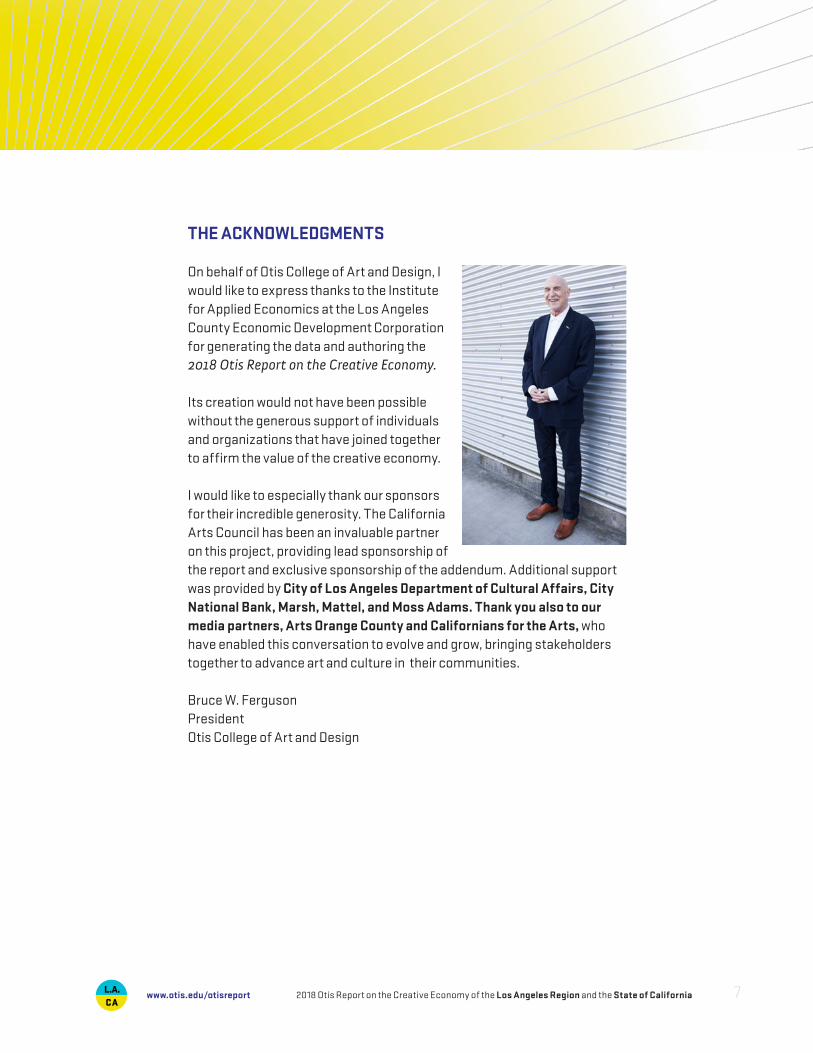
THE ACKNOWLEDGMENTS
On behalf of Otis College of Art and Design, I would like to express thanks to the Institute for Applied Economics at the Los Angeles County Economic Development Corporation for generating the data and authoring the 2018 Otis Report on the Creative Economy.
Its creation would not have been possible without the generous support of individuals and organizations that have joined together to affirm the value of the creative economy.
I would like to especially thank our sponsors for their incredible generosity. The California Arts Council has been an invaluable partner on this project, providing lead sponsorship of the report and exclusive sponsorship of the addendum. Additional support was provided by City of Los Angeles Department of Cultural Affairs, City National Bank, Marsh, Mattel, and Moss Adams. Thank you also to our media partners, Arts Orange County and Californians for the Arts, who have enabled this conversation to evolve and grow, bringing stakeholders together to advance art and culture in their communities.
Bruce W. FergusonPresidentOtis College of Art and Design
2018 Otis Report on the Creative Economy of the Los Angeles Region and the State of California8 www.otis.edu/otisreport
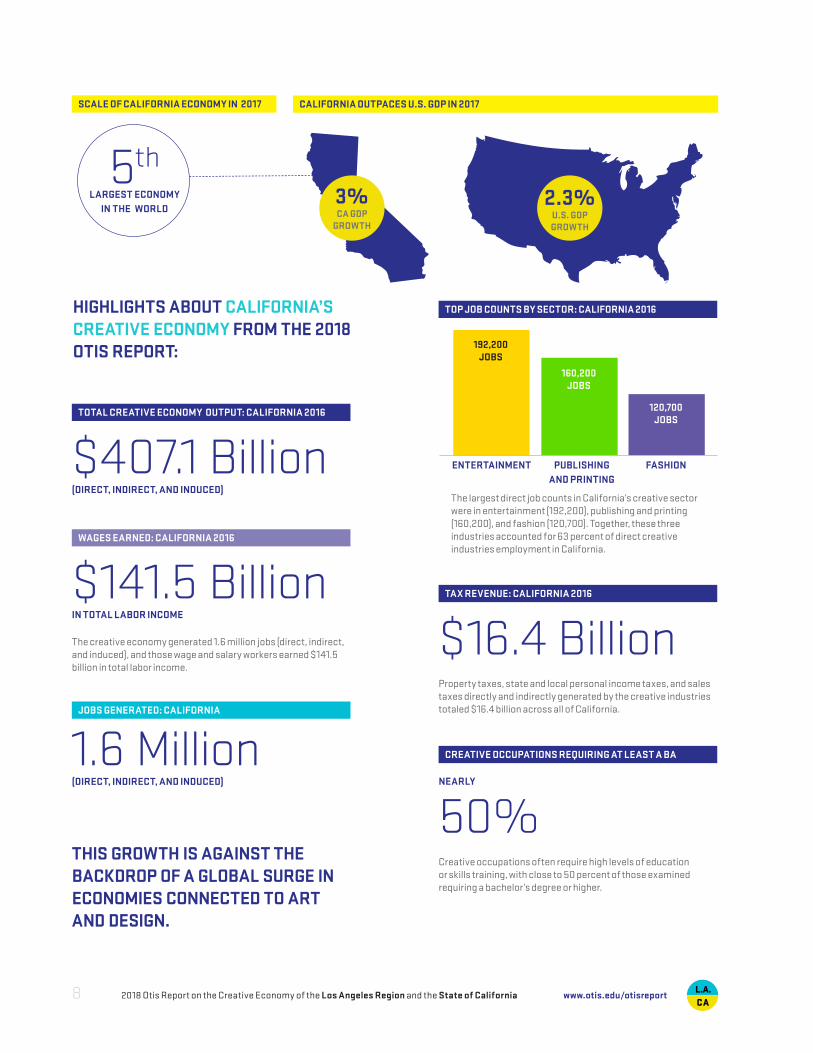
$141.5 BillionIN TOTAL LABOR INCOME
The creative economy generated 1.6 million jobs (direct, indirect, and induced), and those wage and salary workers earned $141.5 billion in total labor income.
TOTAL CREATIVE ECONOMY OUTPUT: CALIFORNIA 2016
$407.1 Billion(DIRECT, INDIRECT, AND INDUCED)
TAX REVENUE: CALIFORNIA 2016
$16.4 BillionProperty taxes, state and local personal income taxes, and sales taxes directly and indirectly generated by the creative industries totaled $16.4 billion across all of California.
CREATIVE OCCUPATIONS REQUIRING AT LEAST A BA
NEARLY
50%Creative occupations often require high levels of education or skills training, with close to 50 percent of those examined requiring a bachelor’s degree or higher.
ENTERTAINMENT PUBLISHING AND PRINTING
FASHION
192,200JOBS
160,200JOBS
120,700JOBS
TOP JOB COUNTS BY SECTOR: CALIFORNIA 2016
The largest direct job counts in California’s creative sector were in entertainment (192,200), publishing and printing (160,200), and fashion (120,700). Together, these three industries accounted for 63 percent of direct creative industries employment in California.
HIGHLIGHTS ABOUT CALIFORNIA’S CREATIVE ECONOMY FROM THE 2018 OTIS REPORT:
THIS GROWTH IS AGAINST THE BACKDROP OF A GLOBAL SURGE IN ECONOMIES CONNECTED TO ART AND DESIGN.
WAGES EARNED: CALIFORNIA 2016
1.6 Million(DIRECT, INDIRECT, AND INDUCED)
JOBS GENERATED: CALIFORNIA
SCALE OF CALIFORNIA ECONOMY IN 2017
5th LARGEST ECONOMY
IN THE WORLD
CALIFORNIA OUTPACES U.S. GDP IN 2017
3%CA GDP
GROWTH
2.3%U.S. GDPGROWTH
METRO AREA CREATIVE SHARE – 2016
2018 Otis Report on the Creative Economy of the Los Angeles Region and the State of California 9www.otis.edu/otisreport
8.8%LOS ANGELES
6.8%SEATTLE
6.3%NEW YORK
792,600 Jobs(DIRECT, INDIRECT, AND INDUCED)
$59.6 BillionIN TOTAL LABOR INCOME (DIRECT, INDIRECT, AND INDUCED)
Wage and salary workers earned $59.6 billion in total labor income.
ENTERTAINMENT FASHION PUBLISHING AND PRINTING
164,400JOBS
96,700JOBS
46,500JOBS
WAGES EARNED: LA REGION – 2016
TOTAL CREATIVE ECONOMY OUTPUT: LA REGION – 2016
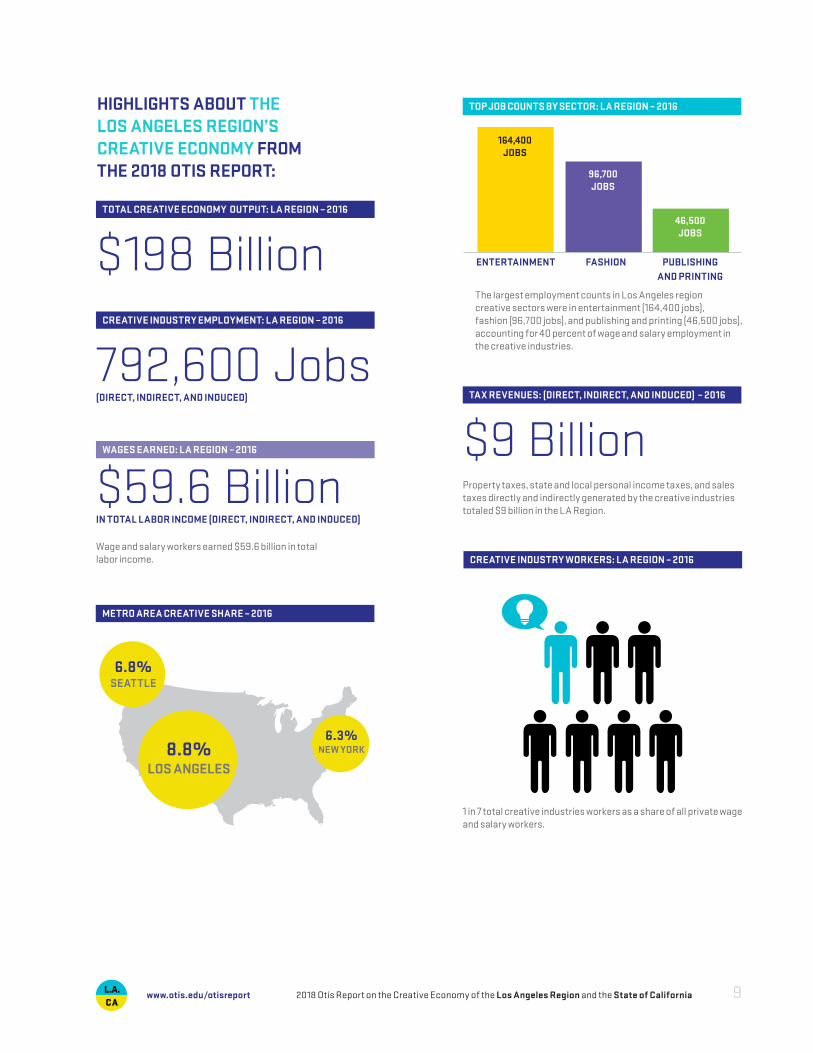
$198 Billion
TAX REVENUES: (DIRECT, INDIRECT, AND INDUCED) – 2016
$9 BillionProperty taxes, state and local personal income taxes, and sales taxes directly and indirectly generated by the creative industries totaled $9 billion in the LA Region.
1 in 7 total creative industries workers as a share of all private wage and salary workers.
CREATIVE INDUSTRY EMPLOYMENT: LA REGION – 2016
CREATIVE INDUSTRY WORKERS: LA REGION – 2016
TOP JOB COUNTS BY SECTOR: LA REGION – 2016
The largest employment counts in Los Angeles region creative sectors were in entertainment (164,400 jobs), fashion (96,700 jobs), and publishing and printing (46,500 jobs), accounting for 40 percent of wage and salary employment in the creative industries.
HIGHLIGHTS ABOUT THE LOS ANGELES REGION’S CREATIVE ECONOMY FROM THE 2018 OTIS REPORT:
9
EXECUTIVE SUMMARY
1
“There is no doubt that creativity is the most important human resource of all. Without creativity, there would be no progress and we would be forever repeating the same patterns.” — Edward de Bono
2018 Otis Report on the Creative Economy of the Los Angeles Region and the State of California10 www.otis.edu/otisreport
INTRODUCTION
The creative economy is a crucial component of the Los Angeles region and California economies. As such, it is necessary to understand the size and contribution of creativity to the overall economic health of the region and state. Examining the changes over time also yields necessary data to focus development efforts and deploy necessary support services. This report seeks to provide the necessary information to bolster the traditional bulwarks of the creative economy while also supporting nascent creative industries to develop a dynamic and thriving creative sector that will be a key driver of economic growth over the next few years.
The Otis College of Art and Design commissioned this report to analyze and quantify the importance of the creative economy both to the Los Angeles region as well as the state of California.
WHAT THE NUMBERS SAY
The creative industries of the Los Angeles region (Los Angeles and Orange Counties) turned out another solid performance in 2016 (latest data available for most government industry and employment data sources) in terms of employment, labor income, and output. Over the five-year period covered in this report (2011 —2016), direct wage and salary employment1 in the region’s creative industries increased by 21,800 jobs to 457,400. Total labor income in the creative industries of the Los Angeles region amounted to $59.6 billion in 2016.
In addition to wage and salary employment, growth in the creative industries is also driven by talented self-employed individuals. In 2015 (latest data available), there were 179,200 self-employed persons working in the creative industries of the Los Angeles region earning revenues of $8.5 billion.
While direct job counts in the creative industries in the Los Angeles region were notable, they were just one part of a much larger employment effect. Direct employees are those who work for a firm in one of the designated creative industries. Indirect jobs are created when firms in these industries make purchases from their suppliers and vendors. Additional induced jobs are generated when direct and indirect workers spend their wages on consumer goods and services. This means that every job within the creative industries supports or sustains a number of jobs in the region that are outside the creative sector.
1 Wage and salary employment refers to workers on a firm’s payroll as opposed to workers who are self-employed.
2018 Otis Report on the Creative Economy of the Los Angeles Region and the State of California 11www.otis.edu/otisreport
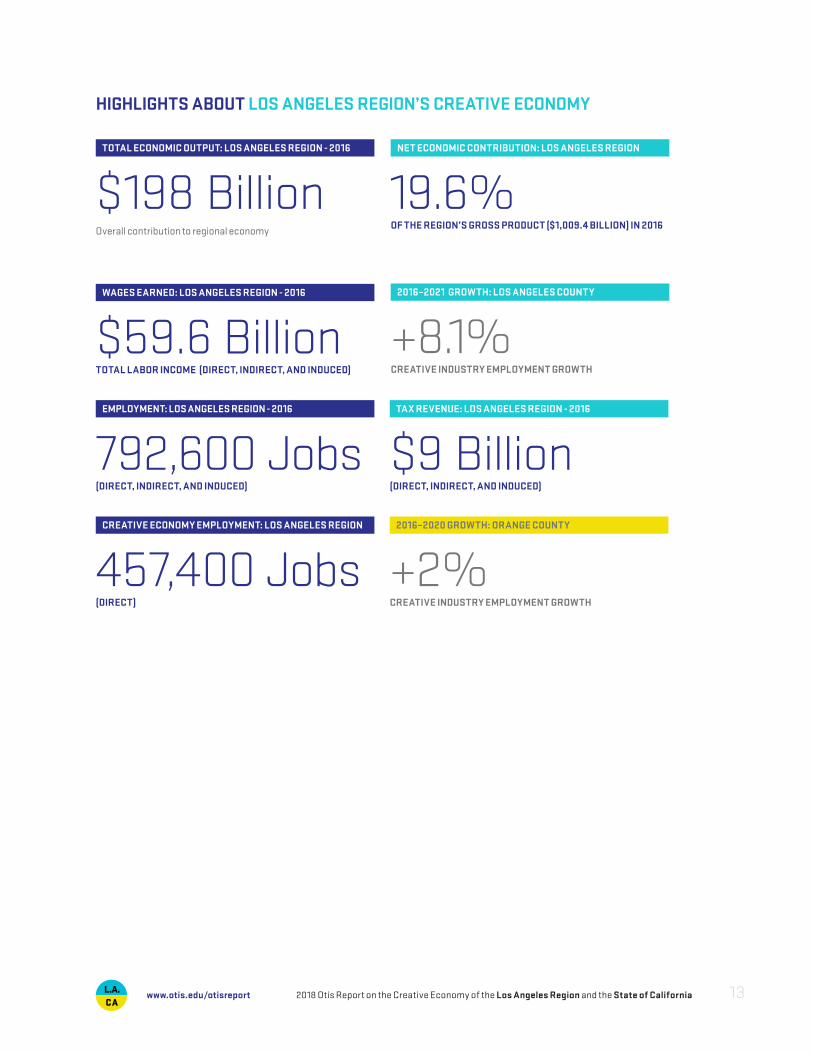
Direct, indirect, and induced employment in the creative industries of the Los Angeles region totaled 792,600 jobs in 2016, up from 759,000 in 2015. The labor income earned by these workers was $59.6 billion. Activity in the creative sector triggers not only jobs and spending, but it also generates tax revenues for state and local government that help fund local services like education and public safety. Property taxes and state and local personal income and sales taxes generated directly and indirectly by the creative industries were $9.0 billion across the region in 2015.
The creative industries of Los Angeles and Orange Counties also generated $198 billion in economic output. Of that, $123 billion was value-added (corporate profits and labor income). This net economic contribution was the equivalent of 12.2 percent of the region’s gross product in 2016, down from a share of 12.7 percent in 2015, an indication that the contribution of the creative industries to the regional economy is perhaps slowing relative to other industries.
As long as the national economy continues to expand, growth is also expected to continue in the Los Angeles region. The Los Angeles Economic Development Corporation (LAEDC) projects employment growth in the creative industries of Los Angeles County.
The creative industries make a significant contribution to employment and economic growth in the Los Angeles region. They also foster innovation and encourage spillover effects that create opportunities for other industries. The region’s creative industries help move the economy forward by attracting investment, tourism, consumer spending, and by generating tax revenues. In our postindustrial society, activities based on creativity and culture are an essential component of a robust economy.
TOTAL LABOR INCOME: CALIFORNIA
TOTAL ECONOMIC OUTPUT: CALIFORNIA TAX REVENUE: CALIFORNIA
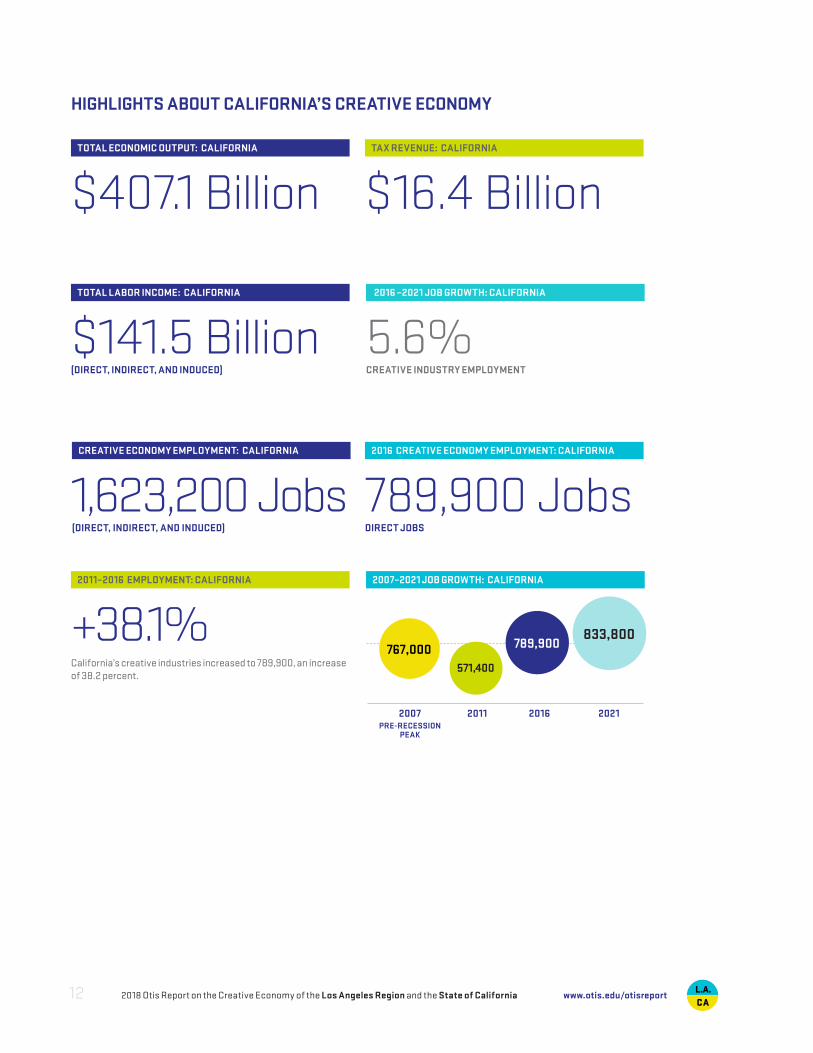
$141.5 Billion(DIRECT, INDIRECT, AND INDUCED)
$407.1 Billion $16.4 Billion
HIGHLIGHTS ABOUT CALIFORNIA’S CREATIVE ECONOMY
2018 Otis Report on the Creative Economy of the Los Angeles Region and the State of California12 www.otis.edu/otisreport
2011–2016 EMPLOYMENT: CALIFORNIA
+38.1%California’s creative industries increased to 789,900, an increase of 38.2 percent.
CREATIVE ECONOMY EMPLOYMENT: CALIFORNIA
1,623,200 Jobs (DIRECT, INDIRECT, AND INDUCED)
2016 –2021 JOB GROWTH: CALIFORNIA
5.6%CREATIVE INDUSTRY EMPLOYMENT
2016 CREATIVE ECONOMY EMPLOYMENT: CALIFORNIA
789,900 JobsDIRECT JOBS
2007 PRE-RECESSION
PEAK
2011 2016 2021
767,000 789,900833,800
571,400
2007–2021 JOB GROWTH: CALIFORNIA
WAGES EARNED: LOS ANGELES REGION - 2016
TOTAL ECONOMIC OUTPUT: LOS ANGELES REGION - 2016 NET ECONOMIC CONTRIBUTION: LOS ANGELES REGION - 2016
TAX REVENUE: LOS ANGELES REGION - 2016
$59.6 BillionTOTAL LABOR INCOME (DIRECT, INDIRECT, AND INDUCED)
$198 BillionOverall contribution to regional economy
19.6%OF THE REGION’S GROSS PRODUCT ($1,009.4 BILLION) IN 2016
EMPLOYMENT: LOS ANGELES REGION - 2016
792,600 Jobs(DIRECT, INDIRECT, AND INDUCED)
2016–2021 GROWTH: LOS ANGELES COUNTY
+8.1%CREATIVE INDUSTRY EMPLOYMENT GROWTH
2016–2020 GROWTH: ORANGE COUNTY
+2%CREATIVE INDUSTRY EMPLOYMENT GROWTH
$9 Billion(DIRECT, INDIRECT, AND INDUCED)
HIGHLIGHTS ABOUT LOS ANGELES REGION’S CREATIVE ECONOMY
2018 Otis Report on the Creative Economy of the Los Angeles Region and the State of California 13www.otis.edu/otisreport
CREATIVE ECONOMY EMPLOYMENT: LOS ANGELES REGION
457,400 Jobs(DIRECT)
2016 EMPLOYMENT Los Angeles County
Orange County LA/OC Region
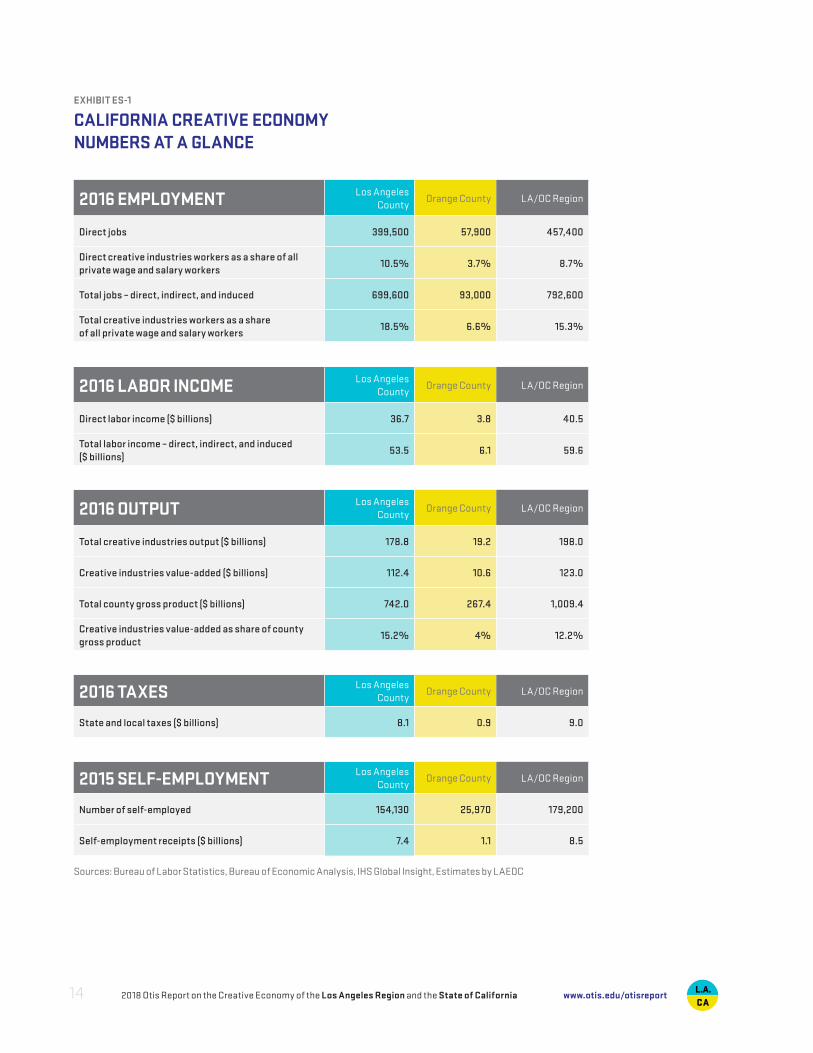
Direct jobs 399,500 57,900 457,400
Direct creative industries workers as a share of all private wage and salary workers
10.5% 3.7% 8.7%
Total jobs – direct, indirect, and induced 699,600 93,000 792,600
Total creative industries workers as a share of all private wage and salary workers
18.5% 6.6% 15.3%
2016 LABOR INCOME Los Angeles County
Orange County LA/OC Region
Direct labor income ($ billions) 36.7 3.8 40.5
Total labor income – direct, indirect, and induced ($ billions)
53.5 6.1 59.6
2016 OUTPUT Los Angeles County
Orange County LA/OC Region
Total creative industries output ($ billions) 178.8 19.2 198.0
Creative industries value-added ($ billions) 112.4 10.6 123.0
Total county gross product ($ billions) 742.0 267.4 1,009.4
Creative industries value-added as share of county gross product
15.2% 4% 12.2%
2016 TAXES Los Angeles County
Orange County LA/OC Region
State and local taxes ($ billions) 8.1 0.9 9.0
2015 SELF-EMPLOYMENT Los Angeles County
Orange County LA/OC Region
Number of self-employed 154,130 25,970 179,200
Self-employment receipts ($ billions) 7.4 1.1 8.5
Sources: Bureau of Labor Statistics, Bureau of Economic Analysis, IHS Global Insight, Estimates by LAEDC
EXHIBIT ES-1
CALIFORNIA CREATIVE ECONOMY NUMBERS AT A GLANCE
2018 Otis Report on the Creative Economy of the Los Angeles Region and the State of California14 www.otis.edu/otisreport
2018 Otis Report on the Creative Economy of the Los Angeles Region and the State of California 15www.otis.edu/otisreport
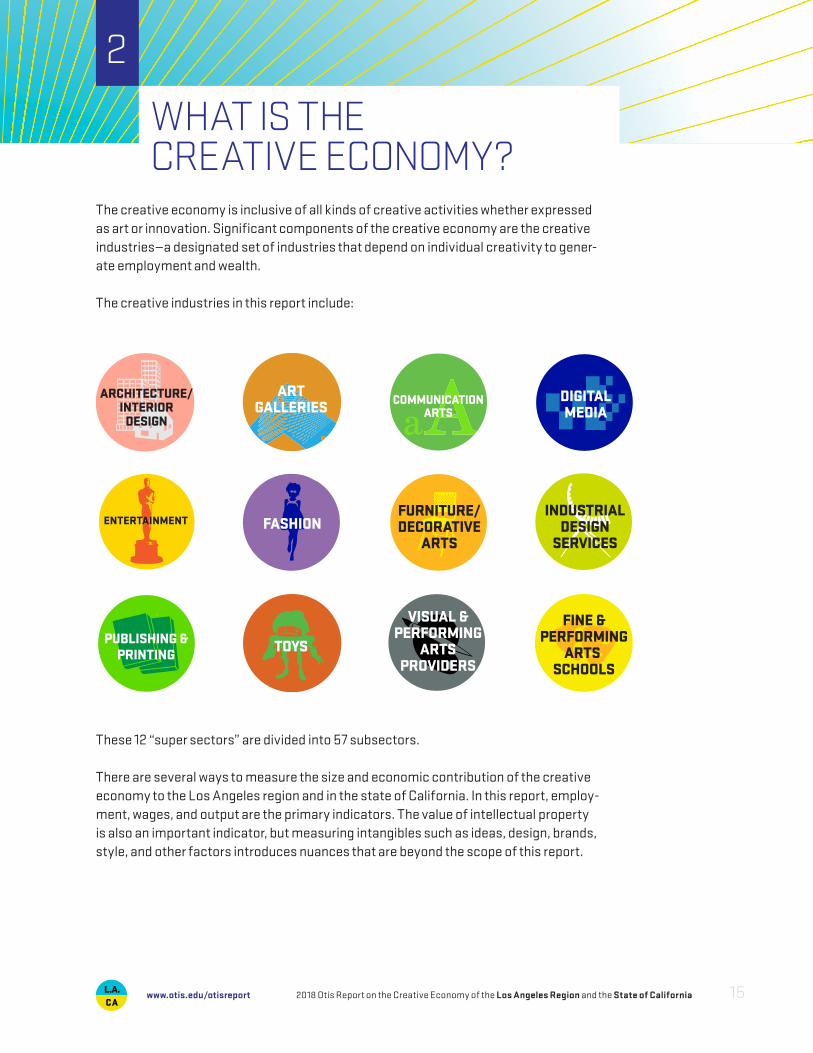
The creative economy is inclusive of all kinds of creative activities whether expressed as art or innovation. Significant components of the creative economy are the creative industries—a designated set of industries that depend on individual creativity to gener-ate employment and wealth.
The creative industries in this report include:
WHAT IS THE CREATIVE ECONOMY?
2
These 12 “super sectors” are divided into 57 subsectors.
There are several ways to measure the size and economic contribution of the creative economy to the Los Angeles region and in the state of California. In this report, employ-ment, wages, and output are the primary indicators. The value of intellectual property is also an important indicator, but measuring intangibles such as ideas, design, brands, style, and other factors introduces nuances that are beyond the scope of this report.
The growth and vitality of the creative economy in both the Los Angeles region and in California is bolstered by the trends in the national economy.
In 2017, U.S. economic growth grew by 2.3 percent after more anemic growth of 1.9 percent in 2016. Our economic fundamentals remain strong and LAEDC expects the national GDP to grow modestly over the next 18 to 24 months. We anticipate economic growth to continue at 2.3 percent in 2018 and 2.1 percent in 2019.
The passage of the Tax Cut and Jobs Act is intended to boost after-tax incomes of consumers. Combined with buoyant consumer confidence from low unemployment and moderately rising wages, we expect to see a 1.8 percent growth in consumer spending in 2018 and 2.3 percent growth in 2019.
Employment growth has continued nationwide and we have fallen below the 5.0 percent unemployment threshold considered “full employment”—in essence, anyone who wants a job has one. Unemployment is expected to decrease from the current rate of 4.4 percent to 3.9 percent by the end of 2019. We forecast the country will add 2.37 million jobs in 2018 and an additional 2.28 million jobs in 2019.
Increasing business and investor confidence resulted in rebound in business investment by 4.7 percent in 2017. Nonresidential investment is forecast to grow by 3.3 percent in 2018 and 2.3 percent in 2019. American companies have participated in stock buyback and have distributed employee bonuses as a result of the Tax Cuts and Job Act’s lowered corporate tax rate and the one-time discounted repatriation rate. It is likely, however, that interest rates will rise in the near future resulting in increased credit costs. Companies will need to balance having more cash available due to the tax cuts with higher borrowing costs.
While the residential housing market boomed during most of the economic recovery after the Great Recession, new national housing supply, as measured by growth in real residential construction, fell in 2017 due to lack of demand from affordability-constrained Millennials and the changing occupational composition of the economy. Subsequently, new residential housing construction is expected to be anemic over 2018 and 2019 with only 0.02 percent growth. However, the nature of housing developments are changing: multifamily unit construction is outpacing single-family unit construction, especially in dense urban areas.
The consumer price index (CPI), which is the most widely used measure of inflation, exceeded the benchmark of 2.0 percent in 2017. LAEDC predicts that the continued trend of Federal Reserve Bank interest rate hikes will continue through 2019 with three hikes in 2018.
NATIONAL AND GLOBAL ECONOMIC CONTEXT
3
2018 Otis Report on the Creative Economy of the Los Angeles Region and the State of California16 www.otis.edu/otisreport
Wages have not seen the same recovery post-recession as other economic indicators. However, the tightening labor market means that we do anticipate moderate wage growth. The employment cost index (ECI), which measures all employment costs including wages and benefits, has been rising recently by 2.2 percent in 2016 and 2.5 percent in 2017. LAEDC anticipates that ECI will continue to increase by 2.4 percent in 2018 and 2.3 percent in 2019.
California has continued to outpace the nation in both economic growth and job creation over the past few years. Almost all of California’s major industry sectors added jobs in 2017 and will do so again over the next 18 to 24 months. California’s unemployment rate fell to 4.8 percent in December. While California may be the cliché “Golden State,” some parts of the state are not sharing in the economic recovery. Three of the state’s 58 counties had unemployment rates higher than 10 percent, and Imperial and Colusa Counties had unemployment rates of 17.9 percent and 17.3 percent, respectively.
What does this mean for the creative industries in the Los Angeles region? The creative industries are subject to the same market forces as any other industry. Rising employment and higher wages will benefit sectors that rely on consumer spending, including art galleries, fashion, entertainment, toys, the visual and performing arts, and digital media. Likewise, improvements in the housing market will boost activity for architectural firms and interior designers and increase demand for furniture and the decorative arts. Moreover, a significant amount of the local creative output is exported, so the improving fortunes of the region’s major trading partners will also stimulate growth.
The region’s creative sector does face some challenges, however. For example, demand for “Hollywood” movies remain strong worldwide, but countries such as China and India have invested heavily in their domestic entertainment industries, increasing global competition for products produced in the Los Angeles region. Moreover, the continued race to the bottom for state film tax credits might syphon some film studios from the Los Angeles basin, especially as the film support industries mature in other localities. Some of the creative industries, especially those with a large manufacturing component (fashion, toys, publishing) will continue to see declines in employment due to increased automation, new technologies, and a reliance on cheaper labor outside the region. On the other hand, digital media and associated sectors should see continued advances in output if not employment, as well. Finally, the new Tax Cuts and Jobs Act combined with the administration’s new tariffs on steel and aluminum naturally implicate all industries directly or indirectly.
The economic expansion should remain on track, if modestly, for the near term barring any unexpected economic events. Although subject to the ebb and flow of the economy, the creative industries of the Los Angeles region form a nexus of culture, business, and technology that will continue to encourage innovation and economic growth throughout the region.
2018 Otis Report on the Creative Economy of the Los Angeles Region and the State of California 17www.otis.edu/otisreport
EMPLOYMENT
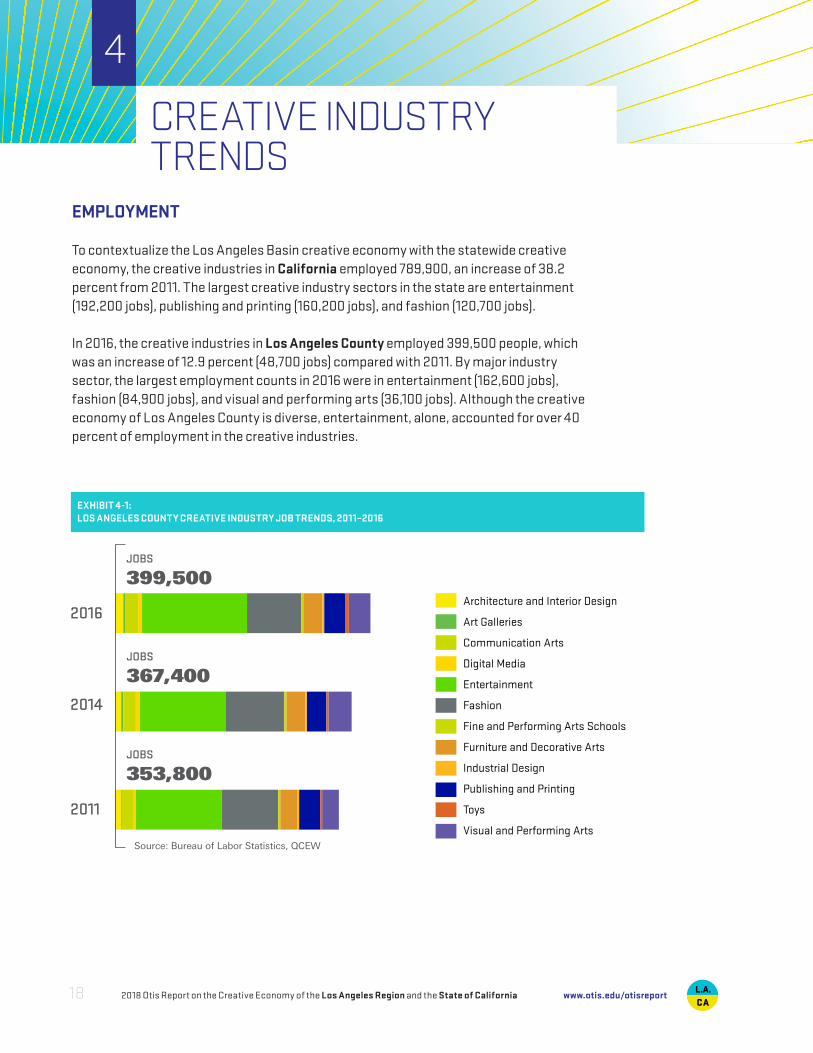
To contextualize the Los Angeles Basin creative economy with the statewide creative economy, the creative industries in California employed 789,900, an increase of 38.2 percent from 2011. The largest creative industry sectors in the state are entertainment (192,200 jobs), publishing and printing (160,200 jobs), and fashion (120,700 jobs).
In 2016, the creative industries in Los Angeles County employed 399,500 people, which was an increase of 12.9 percent (48,700 jobs) compared with 2011. By major industry sector, the largest employment counts in 2016 were in entertainment (162,600 jobs), fashion (84,900 jobs), and visual and performing arts (36,100 jobs). Although the creative economy of Los Angeles County is diverse, entertainment, alone, accounted for over 40 percent of employment in the creative industries.
Architecture and Interior Design
Art Galleries
Communication Arts
Digital Media
Entertainment
Fashion
Fine and Performing Arts Schools
Furniture and Decorative Arts
Industrial Design
Publishing and Printing
Toys
Visual and Performing Arts
2016
2014
2011
JOBS
399,500
JOBS
367,400
JOBS
353,800
Source: Bureau of Labor Statistics, QCEW
EXHIBIT 4-1:LOS ANGELES COUNTY CREATIVE INDUSTRY JOB TRENDS, 2011–2016
CREATIVE INDUSTRY TRENDS
4
2018 Otis Report on the Creative Economy of the Los Angeles Region and the State of California18 www.otis.edu/otisreport
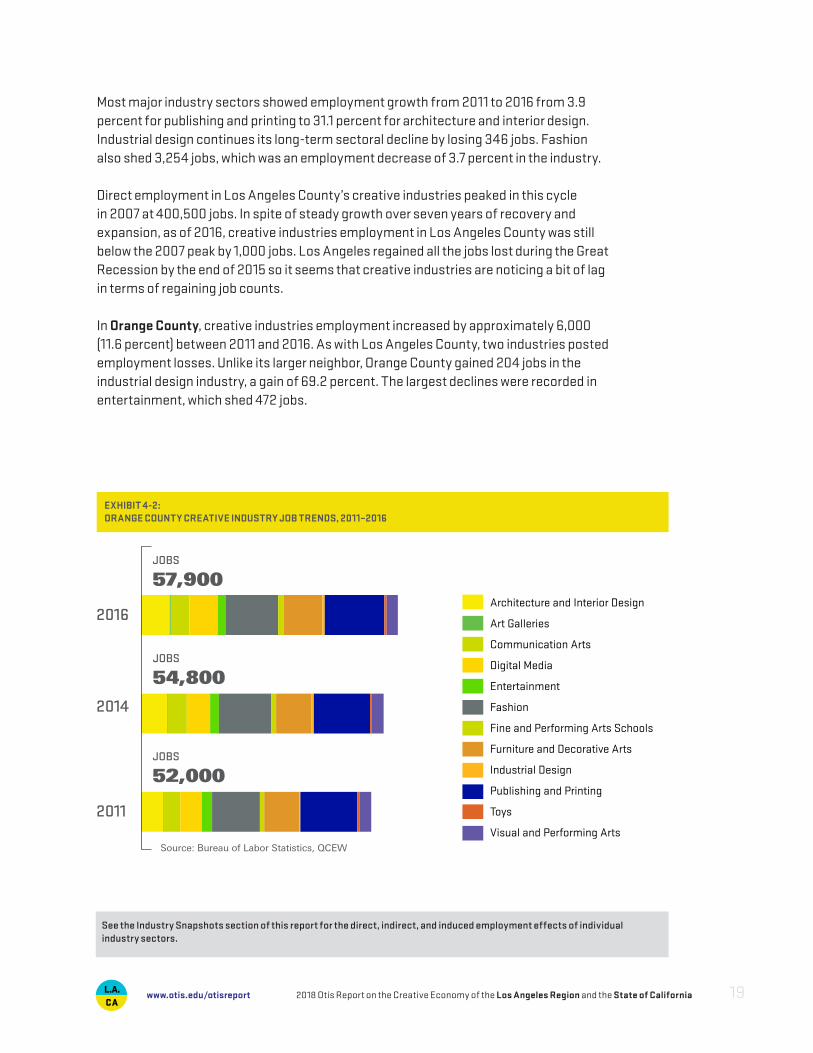
Most major industry sectors showed employment growth from 2011 to 2016 from 3.9 percent for publishing and printing to 31.1 percent for architecture and interior design. Industrial design continues its long-term sectoral decline by losing 346 jobs. Fashion also shed 3,254 jobs, which was an employment decrease of 3.7 percent in the industry.
Direct employment in Los Angeles County’s creative industries peaked in this cycle in 2007 at 400,500 jobs. In spite of steady growth over seven years of recovery and expansion, as of 2016, creative industries employment in Los Angeles County was still below the 2007 peak by 1,000 jobs. Los Angeles regained all the jobs lost during the Great Recession by the end of 2015 so it seems that creative industries are noticing a bit of lag in terms of regaining job counts.
In Orange County, creative industries employment increased by approximately 6,000 (11.6 percent) between 2011 and 2016. As with Los Angeles County, two industries posted employment losses. Unlike its larger neighbor, Orange County gained 204 jobs in the industrial design industry, a gain of 69.2 percent. The largest declines were recorded in entertainment, which shed 472 jobs.
Architecture and Interior Design
Art Galleries
Communication Arts
Digital Media
Entertainment
Fashion
Fine and Performing Arts Schools
Furniture and Decorative Arts
Industrial Design
Publishing and Printing
Toys
Visual and Performing Arts
2016
2014
2011
JOBS
57,900
JOBS
54,800
JOBS
52,000
Source: Bureau of Labor Statistics, QCEW
EXHIBIT 4-2: ORANGE COUNTY CREATIVE INDUSTRY JOB TRENDS, 2011–2016
See the Industry Snapshots section of this report for the direct, indirect, and induced employment effects of individual industry sectors.
2018 Otis Report on the Creative Economy of the Los Angeles Region and the State of California 19www.otis.edu/otisreport
LABOR INCOME
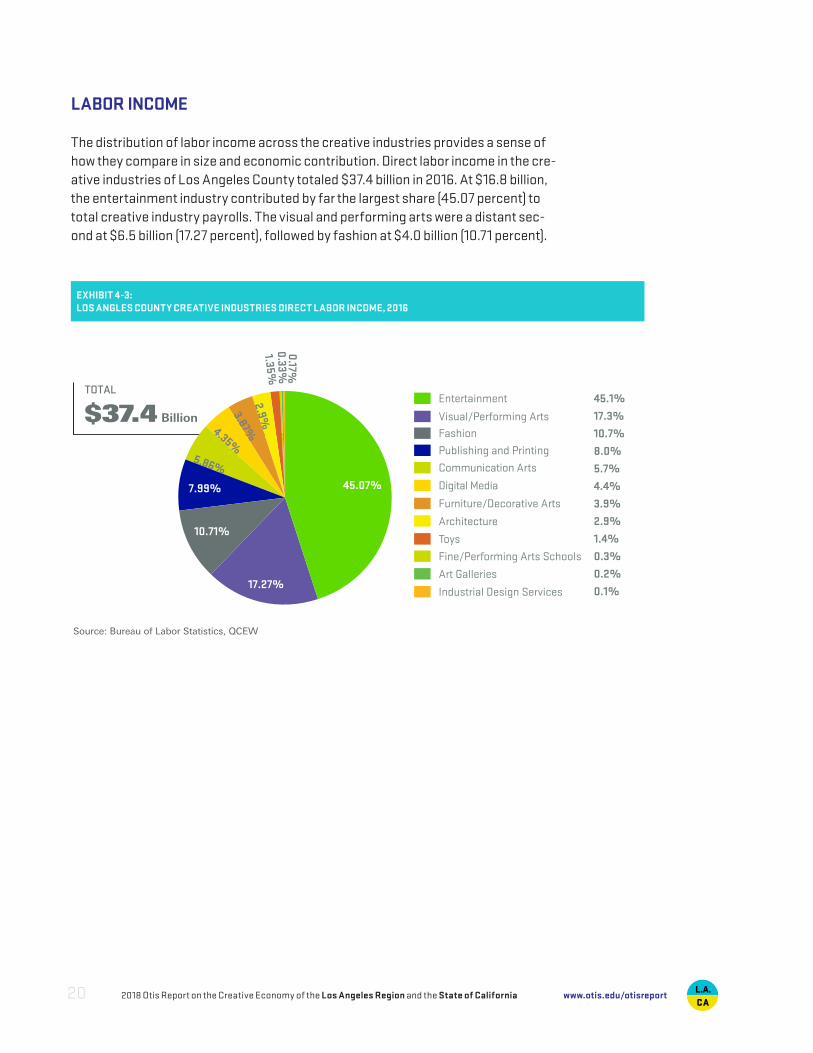
The distribution of labor income across the creative industries provides a sense of how they compare in size and economic contribution. Direct labor income in the cre-ative industries of Los Angeles County totaled $37.4 billion in 2016. At $16.8 billion, the entertainment industry contributed by far the largest share (45.07 percent) to total creative industry payrolls. The visual and performing arts were a distant sec-ond at $6.5 billion (17.27 percent), followed by fashion at $4.0 billion (10.71 percent).
TOTAL
$37.4 Billion
Publishing and Printing
45.1%
17.3%
10.7%
8.0%
5.7%
4.4%
3.9%
2.9%
1.4%
0.3%
0.2%
0.1%
Entertainment
Digital Media
Visual/Performing Arts Fashion
Communication Arts
Furniture/Decorative Arts
Architecture
Toys
Fine/Performing Arts Schools
Industrial Design Services
Art Galleries
2.9%1.35%
0.33%0.17%
45.07%
17.27%
10.71%
7.99%
5.86%
4.35%
3.87%
Source: Bureau of Labor Statistics, QCEW
EXHIBIT 4-3: LOS ANGLES COUNTY CREATIVE INDUSTRIES DIRECT LABOR INCOME, 2016
2018 Otis Report on the Creative Economy of the Los Angeles Region and the State of California20 www.otis.edu/otisreport
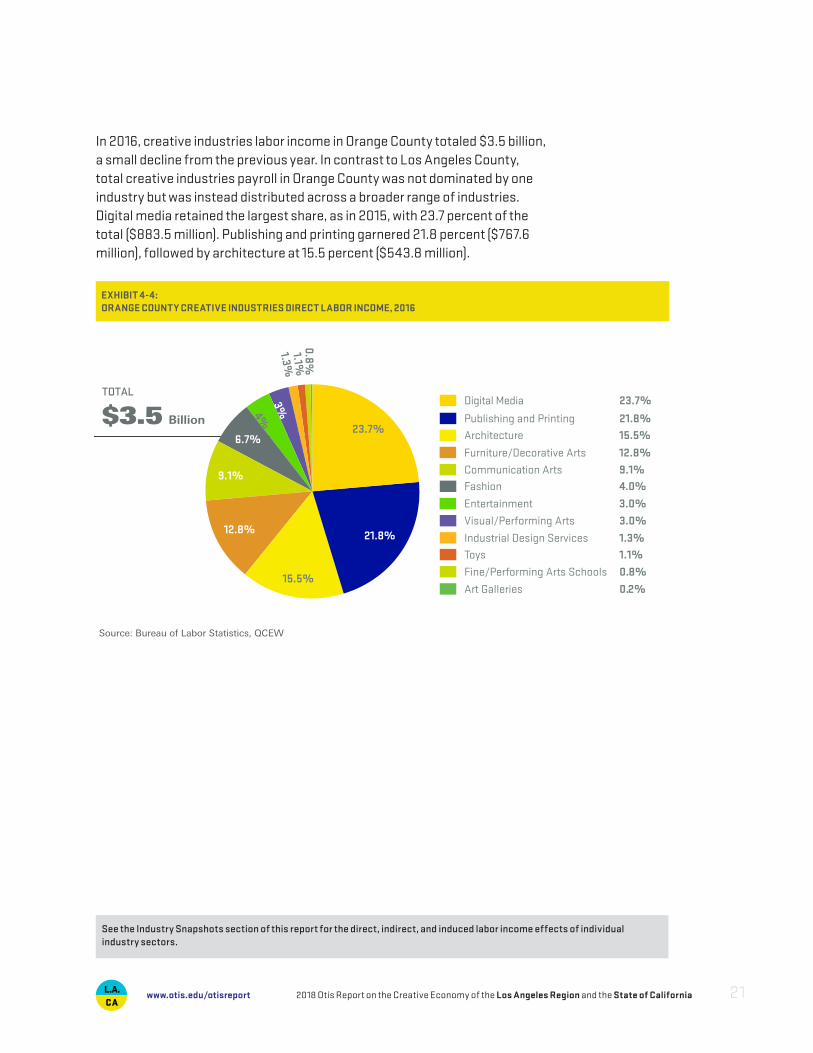
TOTAL
$3.5 Billion 21.8% Publishing and Printing
3.0% Entertainment
23.7% Digital Media
3.0% Visual/Performing Arts
15.5% Architecture
4.0% Fashion9.1% Communication Arts
12.8% Furniture/Decorative Arts
1.1% Toys
0.8% Fine/Performing Arts Schools
1.3% Industrial Design Services
0.2% Art Galleries
23.7%
21.8%
15.5%
12.8%
9.1%
6.7%
4%3%
0.8%1.1%1.3%
Source: Bureau of Labor Statistics, QCEW
EXHIBIT 4-4: ORANGE COUNTY CREATIVE INDUSTRIES DIRECT LABOR INCOME, 2016
In 2016, creative industries labor income in Orange County totaled $3.5 billion, a small decline from the previous year. In contrast to Los Angeles County, total creative industries payroll in Orange County was not dominated by one industry but was instead distributed across a broader range of industries. Digital media retained the largest share, as in 2015, with 23.7 percent of the total ($883.5 million). Publishing and printing garnered 21.8 percent ($767.6 million), followed by architecture at 15.5 percent ($543.8 million).
See the Industry Snapshots section of this report for the direct, indirect, and induced labor income effects of individual industry sectors.
2018 Otis Report on the Creative Economy of the Los Angeles Region and the State of California 21www.otis.edu/otisreport
COUNTING THE SELF-EMPLOYED
A significant share of those working in creative industries opt for self-employment. Despite their importance to the creative economy, their activities are not captured in the federal and state employment data used to develop most of the job numbers in this report. The Internal Revenue Service (IRS), however, does collect data on people who are classified as nonemployer firms. These are firms consisting of one person with revenues but no additional employees. The latest nonemployer data from the IRS is for tax year 2015. It is important to note that some individuals may work on the payroll of an employer and be self-employed as well, so the two data sets (Quarterly Census of Employment and Wages, QCEW, and nonemployer statistics) are not additive.
In 2015 there were 154,129 creative nonemployer firms in Los Angeles County and an additional 25,967 firms in Orange County. Over the five-year period from 2010 through 2015, creative self-employment in Los Angeles County increased at an average annual rate of 4 percent (27,161 jobs in total) and by 3.2 percent (3,786 jobs) in Orange County.
Visual and performing arts providers continue to make up the largest sector of nonem-ployer firms, particularly the subsector of independent artists, writers, and performers. Many self-employed individuals also appeared in the communication arts sector as freelance graphic artists and commercial or portrait photographers.
Revenues earned by nonemployer firms in Los Angeles reached $7.4 billion in 2015 with 48.0 percent of that total generated by independent artists, writers, and performers. Since 2009, revenues have increased at an average annual rate of 5.1 percent. In Orange County, revenues climbed to $1.0 billion, increasing at an average annual rate of just over 4.5 percent between 2009 and 2015.
In certain sectors, self-employment is more common than wage and salary employ-ment (Exhibit 4.6). In the visual and performing arts, there were over 2.3 self-employed persons in Los Angeles County for every salaried worker. In Orange County, the ratio was even more striking at nearly four to one. The communication arts also had a high number of self-employed workers relative to salaried employees: In 2015, there were 0.6 self-employed persons in Los Angeles County for every salaried employee, while in Orange County there were two single-person firms for each salaried worker.
2018 Otis Report on the Creative Economy of the Los Angeles Region and the State of California22 www.otis.edu/otisreport
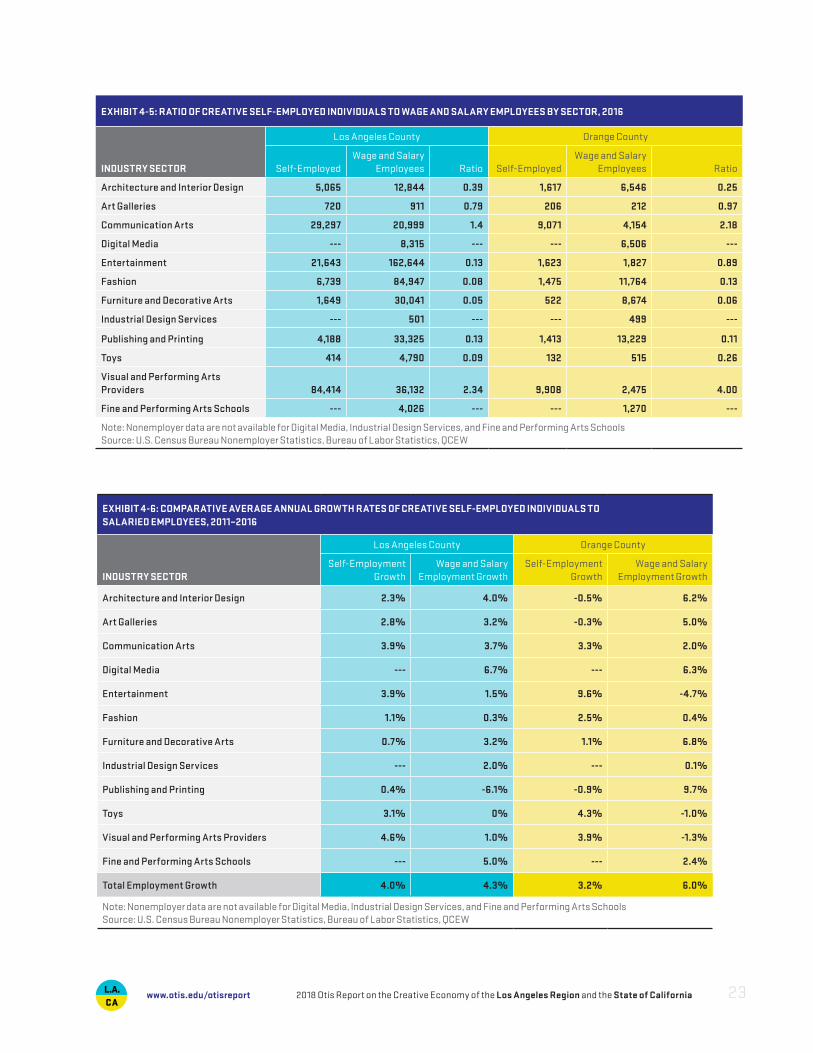
EXHIBIT 4-5: RATIO OF CREATIVE SELF-EMPLOYED INDIVIDUALS TO WAGE AND SALARY EMPLOYEES BY SECTOR, 2016
INDUSTRY SECTOR
Los Angeles County Orange County
Self-EmployedWage and Salary
Employees Ratio Self-EmployedWage and Salary
Employees Ratio
Architecture and Interior Design 5,065 12,844 0.39 1,617 6,546 0.25
Art Galleries 720 911 0.79 206 212 0.97
Communication Arts 29,297 20,999 1.4 9,071 4,154 2.18
Digital Media --- 8,315 --- --- 6,506 ---
Entertainment 21,643 162,644 0.13 1,623 1,827 0.89
Fashion 6,739 84,947 0.08 1,475 11,764 0.13
Furniture and Decorative Arts 1,649 30,041 0.05 522 8,674 0.06
Industrial Design Services --- 501 --- --- 499 ---
Publishing and Printing 4,188 33,325 0.13 1,413 13,229 0.11
Toys 414 4,790 0.09 132 515 0.26
Visual and Performing Arts Providers 84,414 36,132 2.34 9,908 2,475 4.00
Fine and Performing Arts Schools --- 4,026 --- --- 1,270 ---
Note: Nonemployer data are not available for Digital Media, Industrial Design Services, and Fine and Performing Arts SchoolsSource: U.S. Census Bureau Nonemployer Statistics, Bureau of Labor Statistics, QCEW
2018 Otis Report on the Creative Economy of the Los Angeles Region and the State of California 23www.otis.edu/otisreport
EXHIBIT 4-6: COMPARATIVE AVERAGE ANNUAL GROWTH RATES OF CREATIVE SELF-EMPLOYED INDIVIDUALS TOSALARIED EMPLOYEES, 2011–2016
INDUSTRY SECTOR
Los Angeles County Orange County
Self-Employment Growth
Wage and Salary Employment Growth
Self-Employment Growth
Wage and Salary Employment Growth
Architecture and Interior Design 2.3% 4.0% -0.5% 6.2%
Art Galleries 2.8% 3.2% -0.3% 5.0%
Communication Arts 3.9% 3.7% 3.3% 2.0%
Digital Media --- 6.7% --- 6.3%
Entertainment 3.9% 1.5% 9.6% -4.7%
Fashion 1.1% 0.3% 2.5% 0.4%
Furniture and Decorative Arts 0.7% 3.2% 1.1% 6.8%
Industrial Design Services --- 2.0% --- 0.1%
Publishing and Printing 0.4% -6.1% -0.9% 9.7%
Toys 3.1% 0% 4.3% -1.0%
Visual and Performing Arts Providers 4.6% 1.0% 3.9% -1.3%
Fine and Performing Arts Schools --- 5.0% --- 2.4%
Total Employment Growth 4.0% 4.3% 3.2% 6.0%
Note: Nonemployer data are not available for Digital Media, Industrial Design Services, and Fine and Performing Arts SchoolsSource: U.S. Census Bureau Nonemployer Statistics, Bureau of Labor Statistics, QCEW
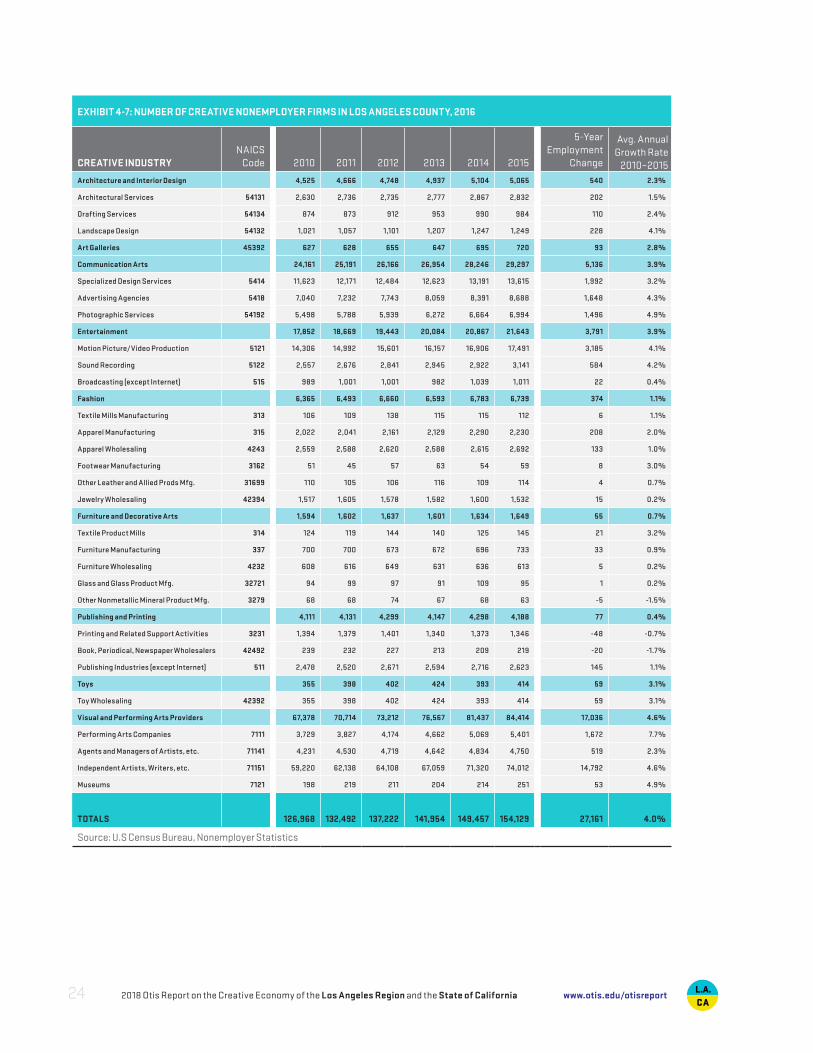
EXHIBIT 4-7: NUMBER OF CREATIVE NONEMPLOYER FIRMS IN LOS ANGELES COUNTY, 2016
CREATIVE INDUSTRYNAICS
Code 2010 2011 2012 2013 2014 2015
5-Year Employment
Change
Avg. Annual Growth Rate
2010–2015Architecture and Interior Design 4,525 4,666 4,748 4,937 5,104 5,065 540 2.3%
Architectural Services 54131 2,630 2,736 2,735 2,777 2,867 2,832 202 1.5%
Drafting Services 54134 874 873 912 953 990 984 110 2.4%
Landscape Design 54132 1,021 1,057 1,101 1,207 1,247 1,249 228 4.1%
Art Galleries 45392 627 628 655 647 695 720 93 2.8%
Communication Arts 24,161 25,191 26,166 26,954 28,246 29,297 5,136 3.9%
Specialized Design Services 5414 11,623 12,171 12,484 12,623 13,191 13,615 1,992 3.2%
Advertising Agencies 5418 7,040 7,232 7,743 8,059 8,391 8,688 1,648 4.3%
Photographic Services 54192 5,498 5,788 5,939 6,272 6,664 6,994 1,496 4.9%
Entertainment 17,852 18,669 19,443 20,084 20,867 21,643 3,791 3.9%
Motion Picture/Video Production 5121 14,306 14,992 15,601 16,157 16,906 17,491 3,185 4.1%
Sound Recording 5122 2,557 2,676 2,841 2,945 2,922 3,141 584 4.2%
Broadcasting (except Internet) 515 989 1,001 1,001 982 1,039 1,011 22 0.4%
Fashion 6,365 6,493 6,660 6,593 6,783 6,739 374 1.1%
Textile Mills Manufacturing 313 106 109 138 115 115 112 6 1.1%
Apparel Manufacturing 315 2,022 2,041 2,161 2,129 2,290 2,230 208 2.0%
Apparel Wholesaling 4243 2,559 2,588 2,620 2,588 2,615 2,692 133 1.0%
Footwear Manufacturing 3162 51 45 57 63 54 59 8 3.0%
Other Leather and Allied Prods Mfg. 31699 110 105 106 116 109 114 4 0.7%
Jewelry Wholesaling 42394 1,517 1,605 1,578 1,582 1,600 1,532 15 0.2%
Furniture and Decorative Arts 1,594 1,602 1,637 1,601 1,634 1,649 55 0.7%
Textile Product Mills 314 124 119 144 140 125 145 21 3.2%
Furniture Manufacturing 337 700 700 673 672 696 733 33 0.9%
Furniture Wholesaling 4232 608 616 649 631 636 613 5 0.2%
Glass and Glass Product Mfg. 32721 94 99 97 91 109 95 1 0.2%
Other Nonmetallic Mineral Product Mfg. 3279 68 68 74 67 68 63 -5 -1.5%
Publishing and Printing 4,111 4,131 4,299 4,147 4,298 4,188 77 0.4%
Printing and Related Support Activities 3231 1,394 1,379 1,401 1,340 1,373 1,346 -48 -0.7%
Book, Periodical, Newspaper Wholesalers 42492 239 232 227 213 209 219 -20 -1.7%
Publishing Industries (except Internet) 511 2,478 2,520 2,671 2,594 2,716 2,623 145 1.1%
Toys 355 398 402 424 393 414 59 3.1%
Toy Wholesaling 42392 355 398 402 424 393 414 59 3.1%
Visual and Performing Arts Providers 67,378 70,714 73,212 76,567 81,437 84,414 17,036 4.6%
Performing Arts Companies 7111 3,729 3,827 4,174 4,662 5,069 5,401 1,672 7.7%
Agents and Managers of Artists, etc. 71141 4,231 4,530 4,719 4,642 4,834 4,750 519 2.3%
Independent Artists, Writers, etc. 71151 59,220 62,138 64,108 67,059 71,320 74,012 14,792 4.6%
Museums 7121 198 219 211 204 214 251 53 4.9%
TOTALS 126,968 132,492 137,222 141,954 149,457 154,129 27,161 4.0%
Source: U.S Census Bureau, Nonemployer Statistics
2018 Otis Report on the Creative Economy of the Los Angeles Region and the State of California24 www.otis.edu/otisreport
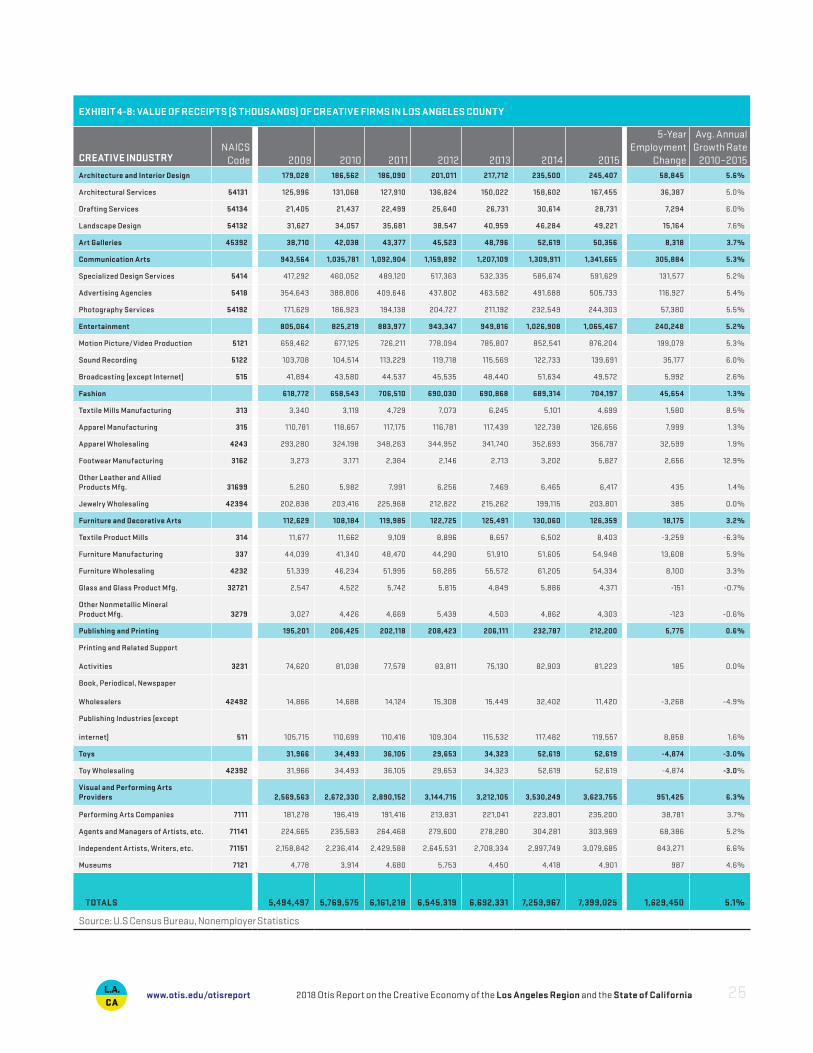
EXHIBIT 4-8: VALUE OF RECEIPTS ($ THOUSANDS) OF CREATIVE FIRMS IN LOS ANGELES COUNTY
CREATIVE INDUSTRYNAICS
Code 2009 2010 2011 2012 2013 2014 2015
5-Year Employment
Change
Avg. Annual Growth Rate
2010–2015Architecture and Interior Design 179,028 186,562 186,090 201,011 217,712 235,500 245,407 58,845 5.6%
Architectural Services 54131 125,996 131,068 127,910 136,824 150,022 158,602 167,455 36,387 5.0%
Drafting Services 54134 21,405 21,437 22,499 25,640 26,731 30,614 28,731 7,294 6.0%
Landscape Design 54132 31,627 34,057 35,681 38,547 40,959 46,284 49,221 15,164 7.6%
Art Galleries 45392 38,710 42,038 43,377 45,523 48,796 52,619 50,356 8,318 3.7%
Communication Arts 943,564 1,035,781 1,092,904 1,159,892 1,207,109 1,309,911 1,341,665 305,884 5.3%
Specialized Design Services 5414 417,292 460,052 489,120 517,363 532,335 585,674 591,629 131,577 5.2%
Advertising Agencies 5418 354,643 388,806 409,646 437,802 463,582 491,688 505,733 116,927 5.4%
Photography Services 54192 171,629 186,923 194,138 204,727 211,192 232,549 244,303 57,380 5.5%
Entertainment 805,064 825,219 883,977 943,347 949,816 1,026,908 1,065,467 240,248 5.2%
Motion Picture/Video Production 5121 659,462 677,125 726,211 778,094 785,807 852,541 876,204 199,079 5.3%
Sound Recording 5122 103,708 104,514 113,229 119,718 115,569 122,733 139,691 35,177 6.0%
Broadcasting (except Internet) 515 41,894 43,580 44,537 45,535 48,440 51,634 49,572 5,992 2.6%
Fashion 618,772 658,543 706,510 690,030 690,868 689,314 704,197 45,654 1.3%
Textile Mills Manufacturing 313 3,340 3,119 4,729 7,073 6,245 5,101 4,699 1,580 8.5%
Apparel Manufacturing 315 110,781 118,657 117,175 116,781 117,439 122,738 126,656 7,999 1.3%
Apparel Wholesaling 4243 293,280 324,198 348,263 344,952 341,740 352,693 356,797 32,599 1.9%
Footwear Manufacturing 3162 3,273 3,171 2,384 2,146 2,713 3,202 5,827 2,656 12.9%
Other Leather and Allied Products Mfg. 31699 5,260 5,982 7,991 6,256 7,469 6,465 6,417 435 1.4%
Jewelry Wholesaling 42394 202,838 203,416 225,968 212,822 215,262 199,115 203,801 385 0.0%
Furniture and Decorative Arts 112,629 108,184 119,985 122,725 125,491 130,060 126,359 18,175 3.2%
Textile Product Mills 314 11,677 11,662 9,109 8,896 8,657 6,502 8,403 -3,259 -6.3%
Furniture Manufacturing 337 44,039 41,340 48,470 44,290 51,910 51,605 54,948 13,608 5.9%
Furniture Wholesaling 4232 51,339 46,234 51,995 58,285 55,572 61,205 54,334 8,100 3.3%
Glass and Glass Product Mfg. 32721 2,547 4,522 5,742 5,815 4,849 5,886 4,371 -151 -0.7%
Other Nonmetallic Mineral Product Mfg. 3279 3,027 4,426 4,669 5,439 4,503 4,862 4,303 -123 -0.6%
Publishing and Printing 195,201 206,425 202,118 208,423 206,111 232,787 212,200 5,775 0.6%
Printing and Related Support
Activities 3231 74,620 81,038 77,578 83,811 75,130 82,903 81,223 185 0.0%
Book, Periodical, Newspaper
Wholesalers 42492 14,866 14,688 14,124 15,308 15,449 32,402 11,420 -3,268 -4.9%
Publishing Industries (except
internet) 511 105,715 110,699 110,416 109,304 115,532 117,482 119,557 8,858 1.6%
Toys 31,966 34,493 36,105 29,653 34,323 52,619 52,619 -4,874 -3.0%
Toy Wholesaling 42392 31,966 34,493 36,105 29,653 34,323 52,619 52,619 -4,874 -3.0%
Visual and Performing Arts Providers 2,569,563 2,672,330 2,890,152 3,144,715 3,212,105 3,530,249 3,623,755 951,425 6.3%
Performing Arts Companies 7111 181,278 196,419 191,416 213,831 221,041 223,801 235,200 38,781 3.7%
Agents and Managers of Artists, etc. 71141 224,665 235,583 264,468 279,600 278,280 304,281 303,969 68,386 5.2%
Independent Artists, Writers, etc. 71151 2,158,842 2,236,414 2,429,588 2,645,531 2,708,334 2,997,749 3,079,685 843,271 6.6%
Museums 7121 4,778 3,914 4,680 5,753 4,450 4,418 4,901 987 4.6%
TOTALS 5,494,497 5,769,575 6,161,218 6,545,319 6,692,331 7,259,967 7,399,025 1,629,450 5.1%
Source: U.S Census Bureau, Nonemployer Statistics
2018 Otis Report on the Creative Economy of the Los Angeles Region and the State of California 25www.otis.edu/otisreport
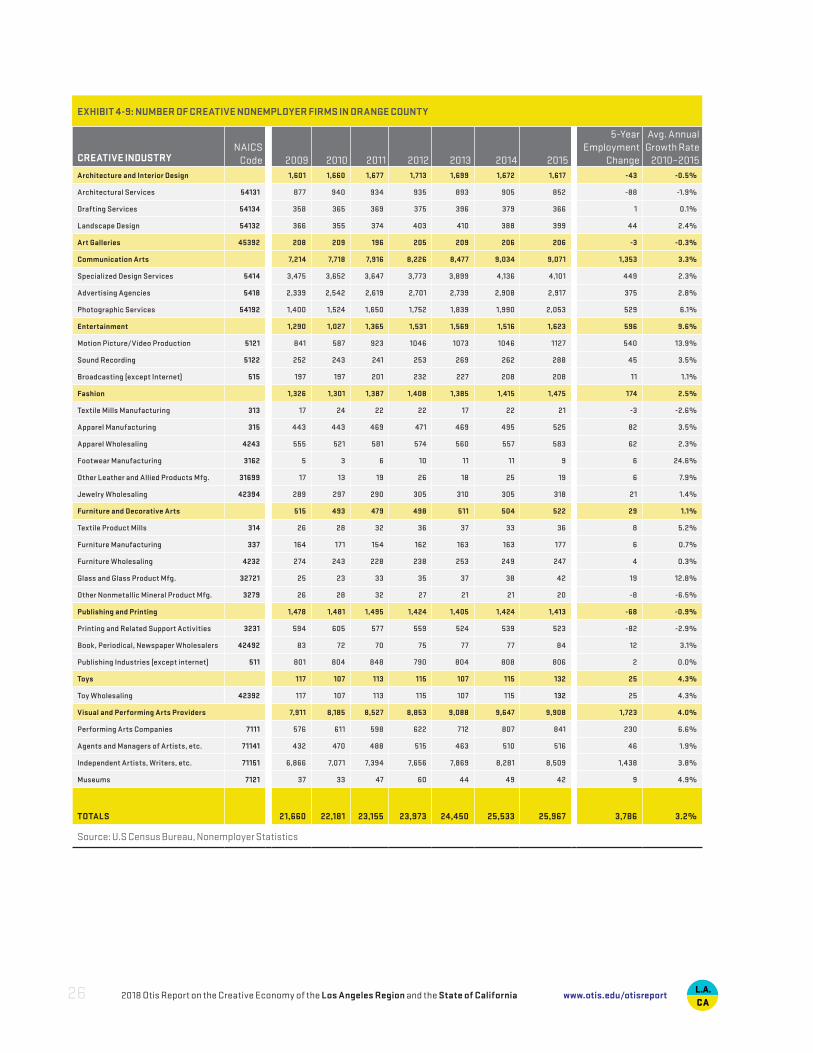
EXHIBIT 4-9: NUMBER OF CREATIVE NONEMPLOYER FIRMS IN ORANGE COUNTY
CREATIVE INDUSTRYNAICS
Code 2009 2010 2011 2012 2013 2014 2015
5-Year Employment
Change
Avg. Annual Growth Rate
2010–2015Architecture and Interior Design 1,601 1,660 1,677 1,713 1,699 1,672 1,617 -43 -0.5%
Architectural Services 54131 877 940 934 935 893 905 852 -88 -1.9%
Drafting Services 54134 358 365 369 375 396 379 366 1 0.1%
Landscape Design 54132 366 355 374 403 410 388 399 44 2.4%
Art Galleries 45392 208 209 196 205 209 206 206 -3 -0.3%
Communication Arts 7,214 7,718 7,916 8,226 8,477 9,034 9,071 1,353 3.3%
Specialized Design Services 5414 3,475 3,652 3,647 3,773 3,899 4,136 4,101 449 2.3%
Advertising Agencies 5418 2,339 2,542 2,619 2,701 2,739 2,908 2,917 375 2.8%
Photographic Services 54192 1,400 1,524 1,650 1,752 1,839 1,990 2,053 529 6.1%
Entertainment 1,290 1,027 1,365 1,531 1,569 1,516 1,623 596 9.6%
Motion Picture/Video Production 5121 841 587 923 1046 1073 1046 1127 540 13.9%
Sound Recording 5122 252 243 241 253 269 262 288 45 3.5%
Broadcasting (except Internet) 515 197 197 201 232 227 208 208 11 1.1%
Fashion 1,326 1,301 1,387 1,408 1,385 1,415 1,475 174 2.5%
Textile Mills Manufacturing 313 17 24 22 22 17 22 21 -3 -2.6%
Apparel Manufacturing 315 443 443 469 471 469 495 525 82 3.5%
Apparel Wholesaling 4243 555 521 581 574 560 557 583 62 2.3%
Footwear Manufacturing 3162 5 3 6 10 11 11 9 6 24.6%
Other Leather and Allied Products Mfg. 31699 17 13 19 26 18 25 19 6 7.9%
Jewelry Wholesaling 42394 289 297 290 305 310 305 318 21 1.4%
Furniture and Decorative Arts 515 493 479 498 511 504 522 29 1.1%
Textile Product Mills 314 26 28 32 36 37 33 36 8 5.2%
Furniture Manufacturing 337 164 171 154 162 163 163 177 6 0.7%
Furniture Wholesaling 4232 274 243 228 238 253 249 247 4 0.3%
Glass and Glass Product Mfg. 32721 25 23 33 35 37 38 42 19 12.8%
Other Nonmetallic Mineral Product Mfg. 3279 26 28 32 27 21 21 20 -8 -6.5%
Publishing and Printing 1,478 1,481 1,495 1,424 1,405 1,424 1,413 -68 -0.9%
Printing and Related Support Activities 3231 594 605 577 559 524 539 523 -82 -2.9%
Book, Periodical, Newspaper Wholesalers 42492 83 72 70 75 77 77 84 12 3.1%
Publishing Industries (except internet) 511 801 804 848 790 804 808 806 2 0.0%
Toys 117 107 113 115 107 115 132 25 4.3%
Toy Wholesaling 42392 117 107 113 115 107 115 132 25 4.3%
Visual and Performing Arts Providers 7,911 8,185 8,527 8,853 9,088 9,647 9,908 1,723 4.0%
Performing Arts Companies 7111 576 611 598 622 712 807 841 230 6.6%
Agents and Managers of Artists, etc. 71141 432 470 488 515 463 510 516 46 1.9%
Independent Artists, Writers, etc. 71151 6,866 7,071 7,394 7,656 7,869 8,281 8,509 1,438 3.8%
Museums 7121 37 33 47 60 44 49 42 9 4.9%
TOTALS 21,660 22,181 23,155 23,973 24,450 25,533 25,967 3,786 3.2%
Source: U.S Census Bureau, Nonemployer Statistics
2018 Otis Report on the Creative Economy of the Los Angeles Region and the State of California26 www.otis.edu/otisreport
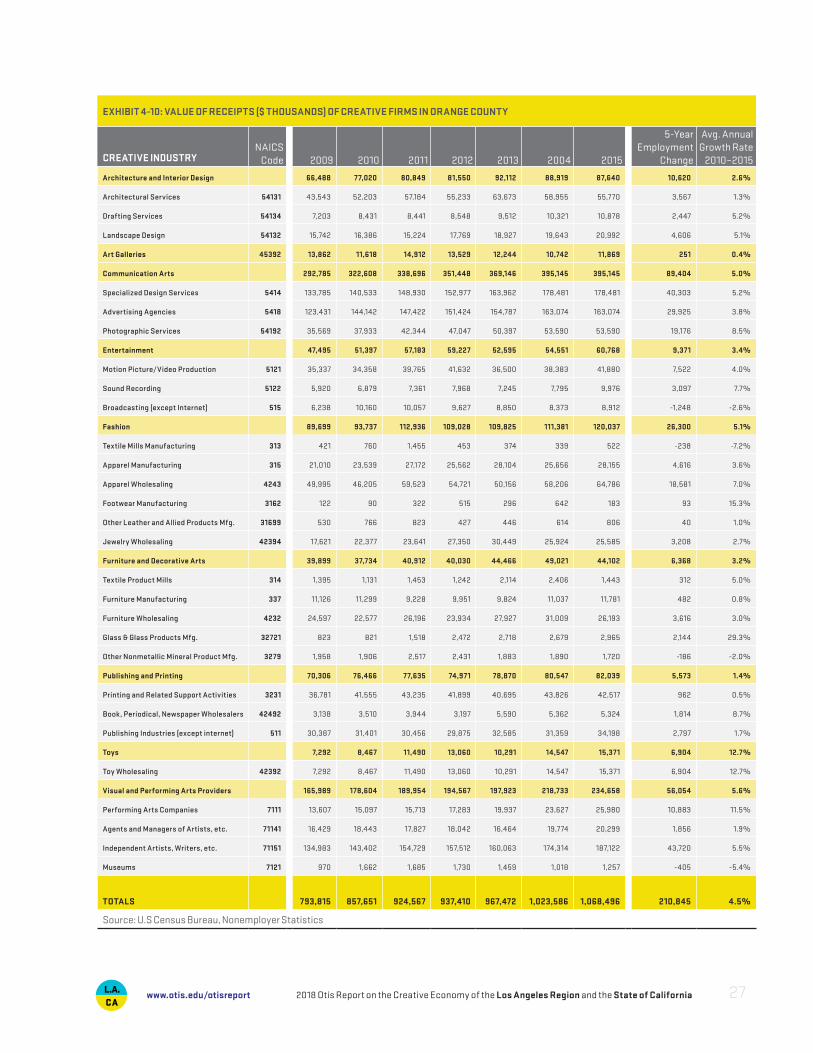
EXHIBIT 4-10: VALUE OF RECEIPTS ($ THOUSANDS) OF CREATIVE FIRMS IN ORANGE COUNTY
CREATIVE INDUSTRYNAICS
Code 2009 2010 2011 2012 2013 2004 2015
5-Year Employment
Change
Avg. Annual Growth Rate
2010–2015
Architecture and Interior Design 66,488 77,020 80,849 81,550 92,112 88,919 87,640 10,620 2.6%
Architectural Services 54131 43,543 52,203 57,184 55,233 63,673 58,955 55,770 3,567 1.3%
Drafting Services 54134 7,203 8,431 8,441 8,548 9,512 10,321 10,878 2,447 5.2%
Landscape Design 54132 15,742 16,386 15,224 17,769 18,927 19,643 20,992 4,606 5.1%
Art Galleries 45392 13,862 11,618 14,912 13,529 12,244 10,742 11,869 251 0.4%
Communication Arts 292,785 322,608 338,696 351,448 369,146 395,145 395,145 89,404 5.0%
Specialized Design Services 5414 133,785 140,533 148,930 152,977 163,962 178,481 178,481 40,303 5.2%
Advertising Agencies 5418 123,431 144,142 147,422 151,424 154,787 163,074 163,074 29,925 3.8%
Photographic Services 54192 35,569 37,933 42,344 47,047 50,397 53,590 53,590 19,176 8.5%
Entertainment 47,495 51,397 57,183 59,227 52,595 54,551 60,768 9,371 3.4%
Motion Picture/Video Production 5121 35,337 34,358 39,765 41,632 36,500 38,383 41,880 7,522 4.0%
Sound Recording 5122 5,920 6,879 7,361 7,968 7,245 7,795 9,976 3,097 7.7%
Broadcasting (except Internet) 515 6,238 10,160 10,057 9,627 8,850 8,373 8,912 -1,248 -2.6%
Fashion 89,699 93,737 112,936 109,028 109,825 111,381 120,037 26,300 5.1%
Textile Mills Manufacturing 313 421 760 1,455 453 374 339 522 -238 -7.2%
Apparel Manufacturing 315 21,010 23,539 27,172 25,562 28,104 25,656 28,155 4,616 3.6%
Apparel Wholesaling 4243 49,995 46,205 59,523 54,721 50,156 58,206 64,786 18,581 7.0%
Footwear Manufacturing 3162 122 90 322 515 296 642 183 93 15.3%
Other Leather and Allied Products Mfg. 31699 530 766 823 427 446 614 806 40 1.0%
Jewelry Wholesaling 42394 17,621 22,377 23,641 27,350 30,449 25,924 25,585 3,208 2.7%
Furniture and Decorative Arts 39,899 37,734 40,912 40,030 44,466 49,021 44,102 6,368 3.2%
Textile Product Mills 314 1,395 1,131 1,453 1,242 2,114 2,406 1,443 312 5.0%
Furniture Manufacturing 337 11,126 11,299 9,228 9,951 9,824 11,037 11,781 482 0.8%
Furniture Wholesaling 4232 24,597 22,577 26,196 23,934 27,927 31,009 26,193 3,616 3.0%
Glass & Glass Products Mfg. 32721 823 821 1,518 2,472 2,718 2,679 2,965 2,144 29.3%
Other Nonmetallic Mineral Product Mfg. 3279 1,958 1,906 2,517 2,431 1,883 1,890 1,720 -186 -2.0%
Publishing and Printing 70,306 76,466 77,635 74,971 78,870 80,547 82,039 5,573 1.4%
Printing and Related Support Activities 3231 36,781 41,555 43,235 41,899 40,695 43,826 42,517 962 0.5%
Book, Periodical, Newspaper Wholesalers 42492 3,138 3,510 3,944 3,197 5,590 5,362 5,324 1,814 8.7%
Publishing Industries (except internet) 511 30,387 31,401 30,456 29,875 32,585 31,359 34,198 2,797 1.7%
Toys 7,292 8,467 11,490 13,060 10,291 14,547 15,371 6,904 12.7%
Toy Wholesaling 42392 7,292 8,467 11,490 13,060 10,291 14,547 15,371 6,904 12.7%
Visual and Performing Arts Providers 165,989 178,604 189,954 194,567 197,923 218,733 234,658 56,054 5.6%
Performing Arts Companies 7111 13,607 15,097 15,713 17,283 19,937 23,627 25,980 10,883 11.5%
Agents and Managers of Artists, etc. 71141 16,429 18,443 17,827 18,042 16,464 19,774 20,299 1,856 1.9%
Independent Artists, Writers, etc. 71151 134,983 143,402 154,729 157,512 160,063 174,314 187,122 43,720 5.5%
Museums 7121 970 1,662 1,685 1,730 1,459 1,018 1,257 -405 -5.4%
TOTALS 793,815 857,651 924,567 937,410 967,472 1,023,586 1,068,496 210,845 4.5%
Source: U.S Census Bureau, Nonemployer Statistics
2018 Otis Report on the Creative Economy of the Los Angeles Region and the State of California 27www.otis.edu/otisreport
EMPLOYMENT AND WAGES
Direct job counts in the creative industries are notable in and of themselves. However, they support an even larger employment network through indirect and induced impacts. Direct employees are those who actually work within the creative industries. Indirect jobs are created when firms in these industries make purchases from their suppliers and ven-dors. Additional induced jobs are generated when the direct and indirect employees spend their wages on consumer goods and services. In essence, every creative economy job supports or sustains other jobs both in the Los Angeles region and the state as a whole.
The ripple effect is substantial, giving rise to job gains and increases in income across a wide range of industries throughout the regional economy.
TAX EFFECTS
Activity in the creative sectors triggers not only jobs and spending, but it also results in tax revenues for state and local government that help to fund local services such as edu-cation and public safety. As with jobs, there is a ripple effect with tax revenues because the initial direct effects give rise to indirect and induced effects. The LAEDC calculated tax effects attributable directly and indirectly to the creative industries, including prop-erty tax, state and local income tax, and sales tax revenues.
In the Los Angeles region, property taxes, state and local personal income taxes, and sales taxes generated by the creative industries were $9.0 billion in 2016. In the state, $16.4 billion in state and local tax monies can be attributed to the creative economy.
ECONOMIC CONTRIBUTION OF THE CREATIVE INDUSTRIES
5
2018 Otis Report on the Creative Economy of the Los Angeles Region and the State of California28 www.otis.edu/otisreport
THE ECONOMIC CONTRIBUTION OF THE CREATIVE INDUSTRIES
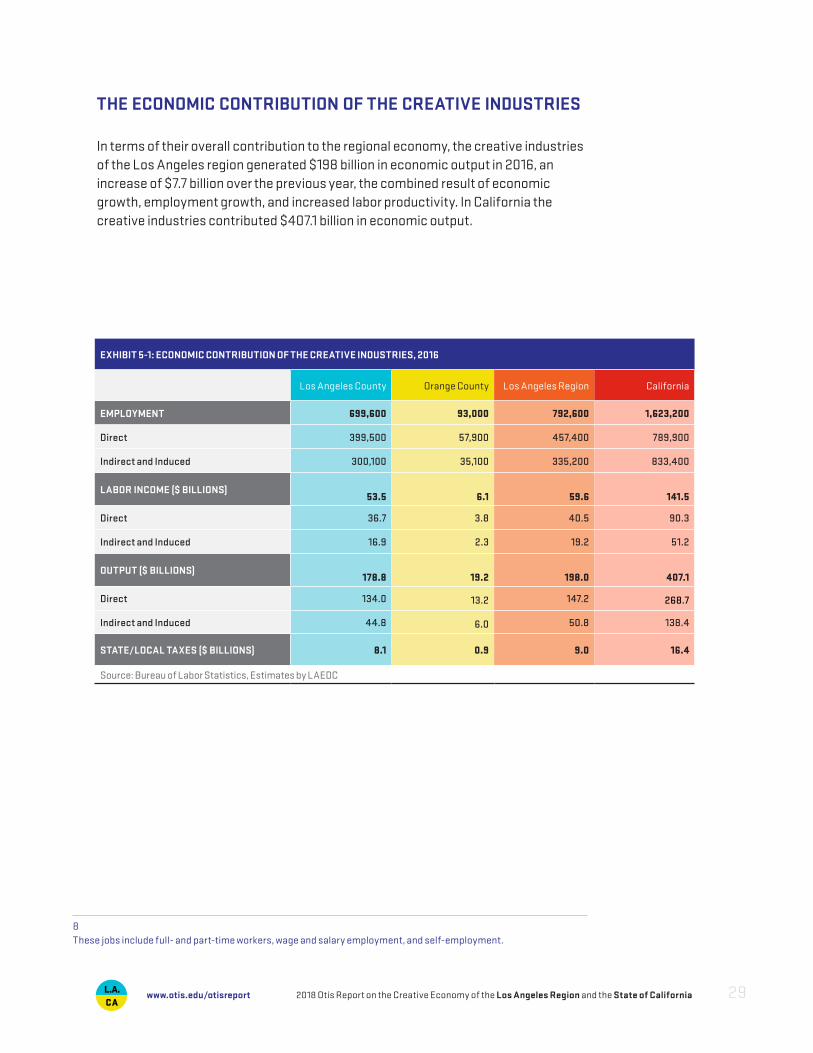
In terms of their overall contribution to the regional economy, the creative industries of the Los Angeles region generated $198 billion in economic output in 2016, an increase of $7.7 billion over the previous year, the combined result of economic growth, employment growth, and increased labor productivity. In California the creative industries contributed $407.1 billion in economic output.
8These jobs include full- and part-time workers, wage and salary employment, and self-employment.
EXHIBIT 5-1: ECONOMIC CONTRIBUTION OF THE CREATIVE INDUSTRIES, 2016
Los Angeles County Orange County Los Angeles Region California
EMPLOYMENT 699,600 93,000 792,600 1,623,200
Direct 399,500 57,900 457,400 789,900
Indirect and Induced 300,100 35,100 335,200 833,400
LABOR INCOME ($ BILLIONS)
53.5
6.1
59.6
141.5
Direct 36.7 3.8 40.5 90.3
Indirect and Induced 16.9 2.3 19.2 51.2
OUTPUT ($ BILLIONS)
178.8
19.2
198.0
407.1
Direct 134.0 13.2 147.2 268.7
Indirect and Induced 44.8 6.0 50.8 138.4
STATE/LOCAL TAXES ($ BILLIONS) 8.1 0.9 9.0 16.4
Source: Bureau of Labor Statistics, Estimates by LAEDC
2018 Otis Report on the Creative Economy of the Los Angeles Region and the State of California 29www.otis.edu/otisreport
Employment moves up and down with the business cycle, declining during recessions and growing again when the economy is expanding. The Los Angeles region recorded another year of employment growth in 2016 in step with the expansion of the national economy.
The LAEDC projects the state of California’s creative economy will grow by 5.6 per-cent between 2016 and 2021, translating into a 44,200 job increase over 5 years from 789,600 creative economy jobs in the state in 2016 to 833,800 creative economy jobs in 2021. Thus, the California creative economy is currently larger than the pre-reces-sion peak in 2007 of 767,00 jobs. The largest numeric gains are estimated to occur in publishing and printing (14,400 jobs), digital media (13,300 jobs), and entertainment (11,100).
Growth is anticipated across the entire set of creative industries, but the pace will vary by sector. The largest percentage gains will occur in industries with a strong technol-ogy component including entertainment, digital media, and communication arts. With its links to real estate and construction, architecture and interior design will also see robust growth. Stronger economic growth and higher household incomes will mean more workers are hired at art galleries and in the entertainment, furniture and decora-tive arts, and the visual and performing arts industries.
LOOKING AHEAD: THE CREATIVE ECONOMY IN 2021
6
2018 Otis Report on the Creative Economy of the Los Angeles Region and the State of California30 www.otis.edu/otisreport
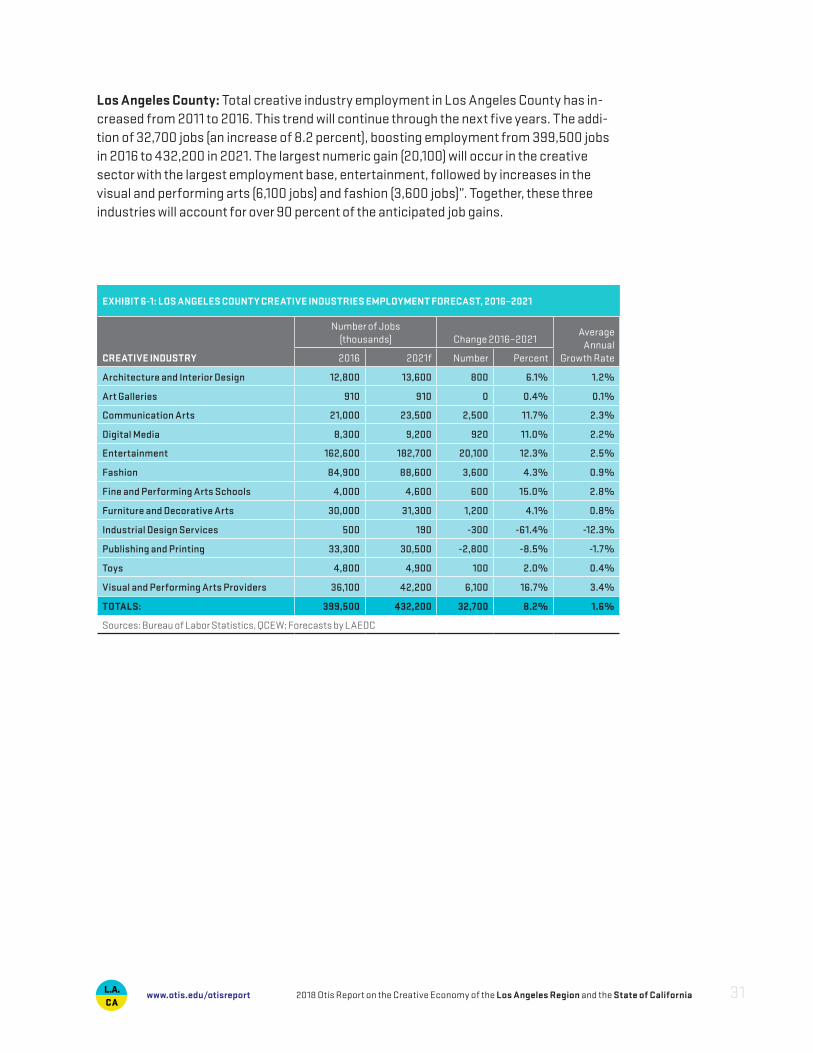
Los Angeles County: Total creative industry employment in Los Angeles County has in-creased from 2011 to 2016. This trend will continue through the next five years. The addi-tion of 32,700 jobs (an increase of 8.2 percent), boosting employment from 399,500 jobs in 2016 to 432,200 in 2021. The largest numeric gain (20,100) will occur in the creative sector with the largest employment base, entertainment, followed by increases in the visual and performing arts (6,100 jobs) and fashion (3,600 jobs)”. Together, these three industries will account for over 90 percent of the anticipated job gains.
EXHIBIT 6-1: LOS ANGELES COUNTY CREATIVE INDUSTRIES EMPLOYMENT FORECAST, 2016–2021
CREATIVE INDUSTRY
Number of Jobs(thousands) Change 2016–2021
Average Annual
Growth Rate2016 2021f Number Percent
Architecture and Interior Design 12,800 13,600 800 6.1% 1.2%
Art Galleries 910 910 0 0.4% 0.1%
Communication Arts 21,000 23,500 2,500 11.7% 2.3%
Digital Media 8,300 9,200 920 11.0% 2.2%
Entertainment 162,600 182,700 20,100 12.3% 2.5%
Fashion 84,900 88,600 3,600 4.3% 0.9%
Fine and Performing Arts Schools 4,000 4,600 600 15.0% 2.8%
Furniture and Decorative Arts 30,000 31,300 1,200 4.1% 0.8%
Industrial Design Services 500 190 -300 -61.4% -12.3%
Publishing and Printing 33,300 30,500 -2,800 -8.5% -1.7%
Toys 4,800 4,900 100 2.0% 0.4%
Visual and Performing Arts Providers 36,100 42,200 6,100 16.7% 3.4%
TOTALS: 399,500 432,200 32,700 8.2% 1.6%
Sources: Bureau of Labor Statistics, QCEW; Forecasts by LAEDC
2018 Otis Report on the Creative Economy of the Los Angeles Region and the State of California 31www.otis.edu/otisreport
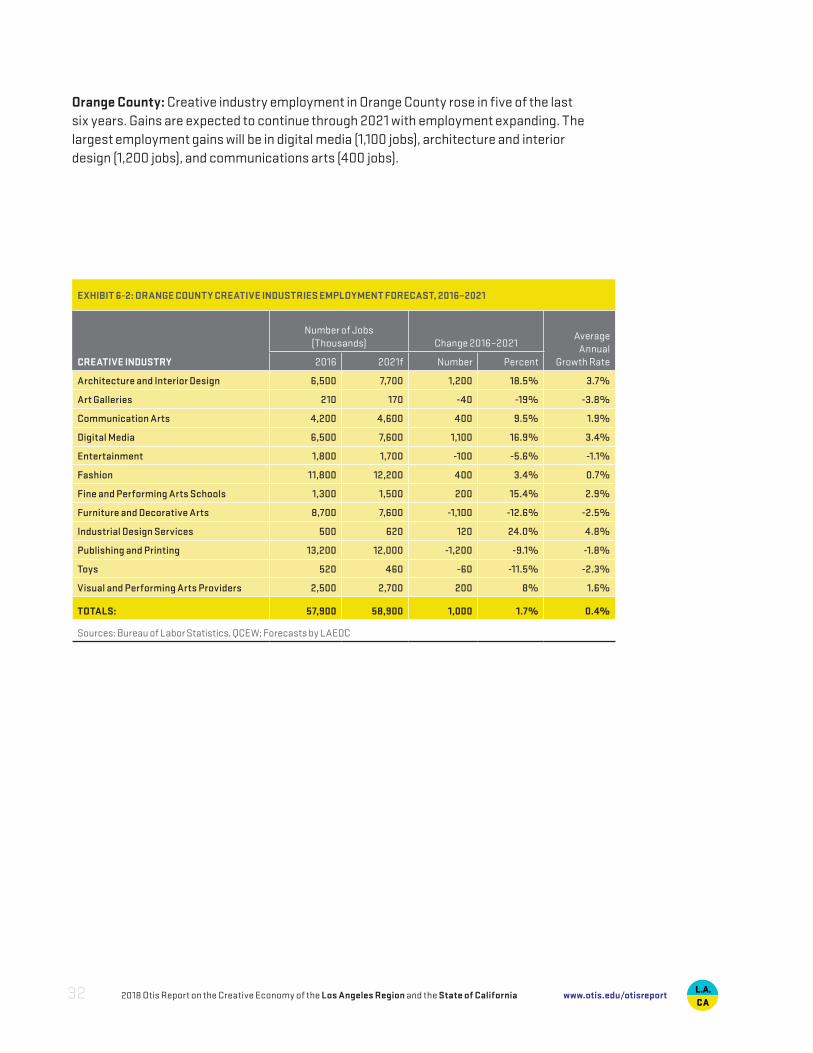
Orange County: Creative industry employment in Orange County rose in five of the last six years. Gains are expected to continue through 2021 with employment expanding. The largest employment gains will be in digital media (1,100 jobs), architecture and interior design (1,200 jobs), and communications arts (400 jobs).
EXHIBIT 6-2: ORANGE COUNTY CREATIVE INDUSTRIES EMPLOYMENT FORECAST, 2016–2021
CREATIVE INDUSTRY
Number of Jobs(Thousands) Change 2016–2021
Average Annual
Growth Rate2016 2021f Number Percent
Architecture and Interior Design 6,500 7,700 1,200 18.5% 3.7%
Art Galleries 210 170 -40 -19% -3.8%
Communication Arts 4,200 4,600 400 9.5% 1.9%
Digital Media 6,500 7,600 1,100 16.9% 3.4%
Entertainment 1,800 1,700 -100 -5.6% -1.1%
Fashion 11,800 12,200 400 3.4% 0.7%
Fine and Performing Arts Schools 1,300 1,500 200 15.4% 2.9%
Furniture and Decorative Arts 8,700 7,600 -1,100 -12.6% -2.5%
Industrial Design Services 500 620 120 24.0% 4.8%
Publishing and Printing 13,200 12,000 -1,200 -9.1% -1.8%
Toys 520 460 -60 -11.5% -2.3%
Visual and Performing Arts Providers 2,500 2,700 200 8% 1.6%
TOTALS: 57,900 58,900 1,000 1.7% 0.4%
Sources: Bureau of Labor Statistics, QCEW; Forecasts by LAEDC
2018 Otis Report on the Creative Economy of the Los Angeles Region and the State of California32 www.otis.edu/otisreport
INDUSTRY SNAPSHOTS
7
2018 Otis Report on the Creative Economy of the Los Angeles Region and the State of California 33www.otis.edu/otisreport
The North American Industry Classification system (NAICS ) classifies business establishments for the purpose of collecting, analyzing, and publishing statistical data related to the U.S. economy. The NAICS industry codes define establishments based on the activities in which they are primarily engaged.
LA INDUSTRYSNAPSHOTS
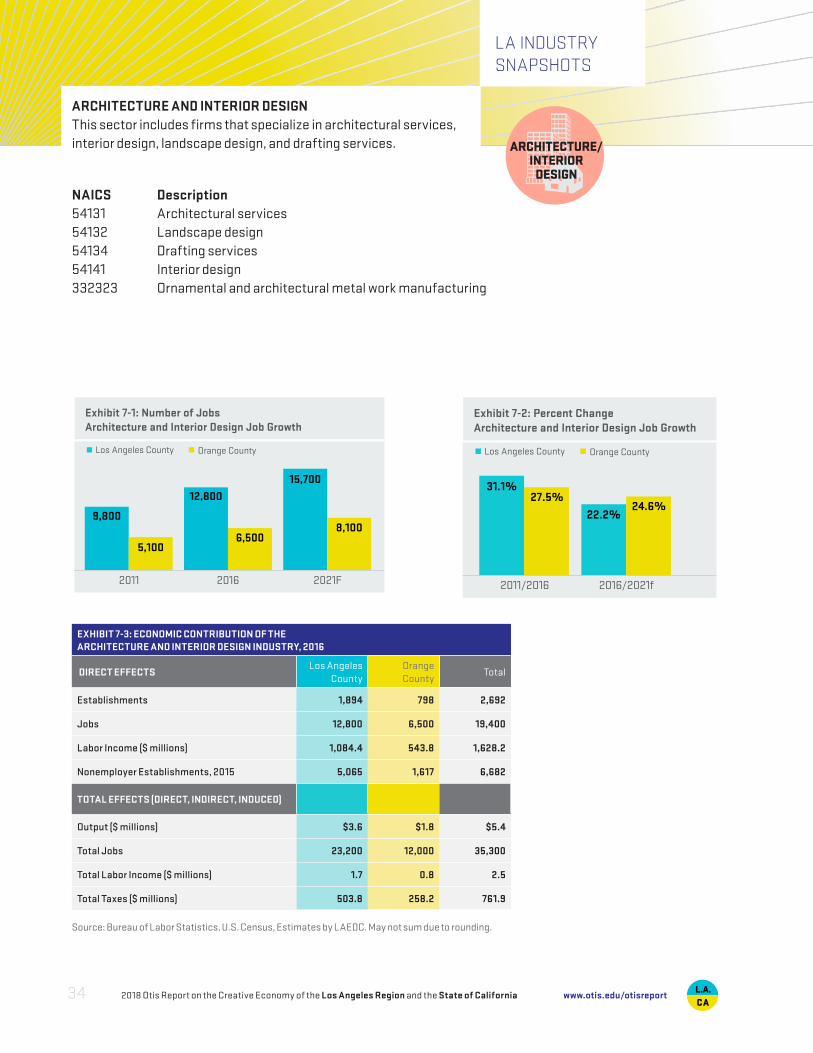
ARCHITECTURE AND INTERIOR DESIGNThis sector includes firms that specialize in architectural services, interior design, landscape design, and drafting services.
NAICS Description54131 Architectural services54132 Landscape design54134 Drafting services54141 Interior design332323 Ornamental and architectural metal work manufacturing
EXHIBIT 7-3: ECONOMIC CONTRIBUTION OF THE ARCHITECTURE AND INTERIOR DESIGN INDUSTRY, 2016
DIRECT EFFECTSLos Angeles
CountyOrange County
Total
Establishments 1,894 798 2,692
Jobs 12,800 6,500 19,400
Labor Income ($ millions) 1,084.4 543.8 1,628.2
Nonemployer Establishments, 2015 5,065 1,617 6,682
TOTAL EFFECTS (DIRECT, INDIRECT, INDUCED)
Output ($ millions) $3.6 $1.8 $5.4
Total Jobs 23,200 12,000 35,300
Total Labor Income ($ millions) 1.7 0.8 2.5
Total Taxes ($ millions) 503.8 258.2 761.9
Source: Bureau of Labor Statistics, U.S. Census, Estimates by LAEDC. May not sum due to rounding.
2011 2016 2021F
9,800
5,100
15,700
12,800
6,5008,100
Exhibit 7-1: Number of JobsArchitecture and Interior Design Job Growth
Los Angeles County Orange County
2011/2016 2016/2021f
31.1%27.5%
22.2%24.6%
Exhibit 7-2: Percent ChangeArchitecture and Interior Design Job Growth
Los Angeles County Orange County
2018 Otis Report on the Creative Economy of the Los Angeles Region and the State of California34 www.otis.edu/otisreport
LA INDUSTRYSNAPSHOTS
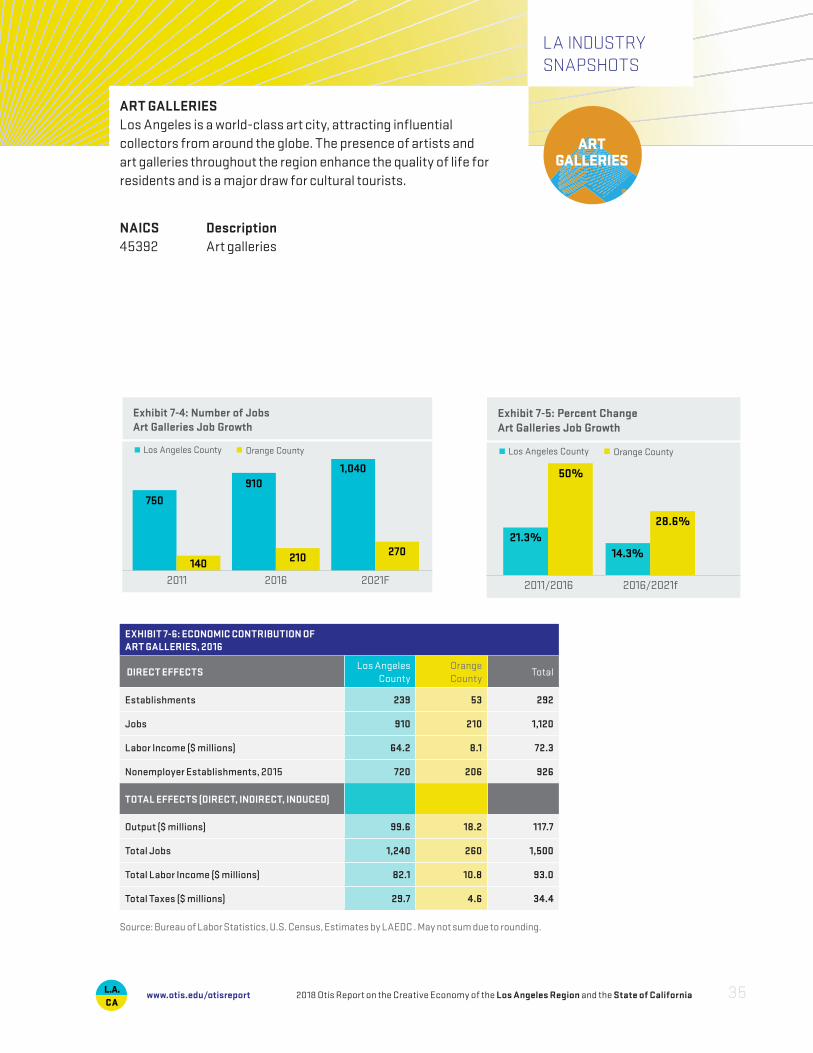
ART GALLERIESLos Angeles is a world-class art city, attracting influential collectors from around the globe. The presence of artists and art galleries throughout the region enhance the quality of life for residents and is a major draw for cultural tourists.
NAICS Description45392 Art galleries
EXHIBIT 7-6: ECONOMIC CONTRIBUTION OF ART GALLERIES, 2016
DIRECT EFFECTSLos Angeles
CountyOrange County
Total
Establishments 239 53 292
Jobs 910 210 1,120
Labor Income ($ millions) 64.2 8.1 72.3
Nonemployer Establishments, 2015 720 206 926
TOTAL EFFECTS (DIRECT, INDIRECT, INDUCED)
Output ($ millions) 99.6 18.2 117.7
Total Jobs 1,240 260 1,500
Total Labor Income ($ millions) 82.1 10.8 93.0
Total Taxes ($ millions) 29.7 4.6 34.4
Source: Bureau of Labor Statistics, U.S. Census, Estimates by LAEDC . May not sum due to rounding.
Los Angeles County Orange County
2011 2016 2021F
750
140
1,040910
210 270
Exhibit 7-4: Number of JobsArt Galleries Job Growth
2011/2016 2016/2021f
21.3%
50%
14.3%
28.6%
Exhibit 7-5: Percent ChangeArt Galleries Job Growth
Los Angeles County Orange County
2018 Otis Report on the Creative Economy of the Los Angeles Region and the State of California 35www.otis.edu/otisreport
LA INDUSTRYSNAPSHOTS
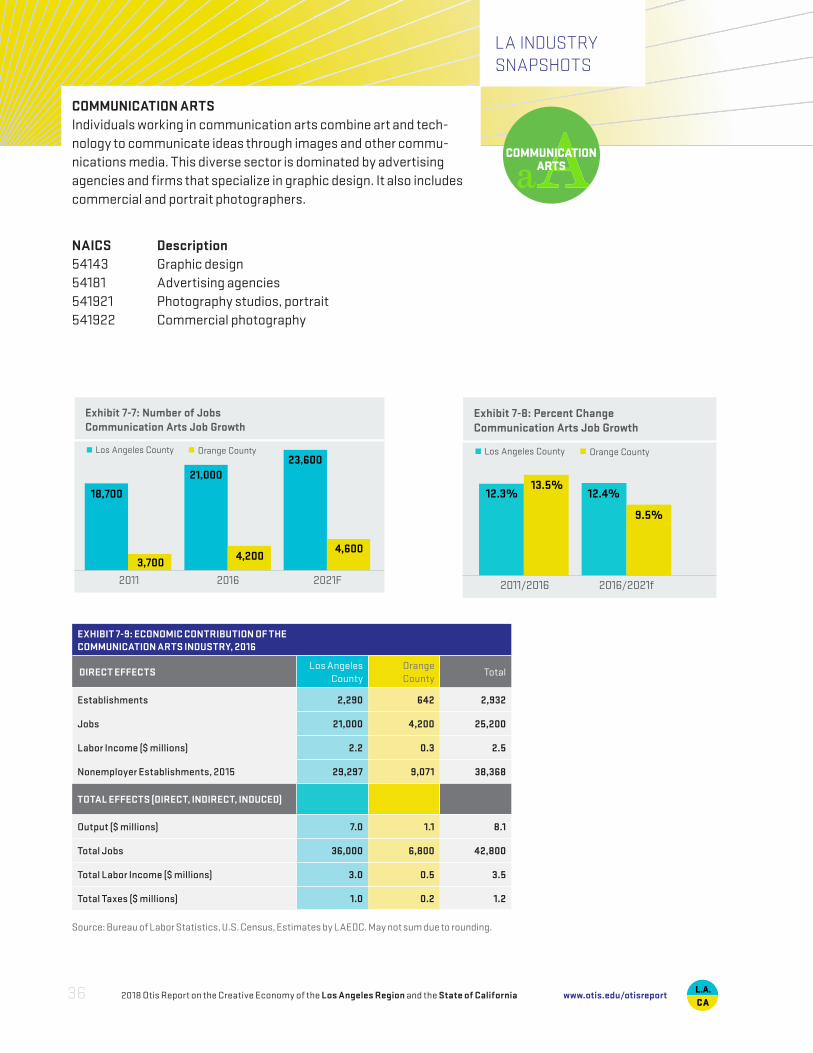
COMMUNICATION ARTSIndividuals working in communication arts combine art and tech-nology to communicate ideas through images and other commu-nications media. This diverse sector is dominated by advertising agencies and firms that specialize in graphic design. It also includes commercial and portrait photographers.
NAICS Description54143 Graphic design54181 Advertising agencies541921 Photography studios, portrait541922 Commercial photography
EXHIBIT 7-9: ECONOMIC CONTRIBUTION OF THECOMMUNICATION ARTS INDUSTRY, 2016
DIRECT EFFECTSLos Angeles
CountyOrange County
Total
Establishments 2,290 642 2,932
Jobs 21,000 4,200 25,200
Labor Income ($ millions) 2.2 0.3 2.5
Nonemployer Establishments, 2015 29,297 9,071 38,368
TOTAL EFFECTS (DIRECT, INDIRECT, INDUCED)
Output ($ millions) 7.0 1.1 8.1
Total Jobs 36,000 6,800 42,800
Total Labor Income ($ millions) 3.0 0.5 3.5
Total Taxes ($ millions) 1.0 0.2 1.2
Source: Bureau of Labor Statistics, U.S. Census, Estimates by LAEDC. May not sum due to rounding.
Los Angeles County Orange County
2011 2016 2021F
18,700
3,700
23,60021,000
4,2004,600
Exhibit 7-7: Number of JobsCommunication Arts Job Growth
2011/2016 2016/2021f
12.3%13.5%
12.4%
9.5%
Exhibit 7-8: Percent ChangeCommunication Arts Job Growth
Los Angeles County Orange County
2018 Otis Report on the Creative Economy of the Los Angeles Region and the State of California36 www.otis.edu/otisreport
LA INDUSTRYSNAPSHOTS
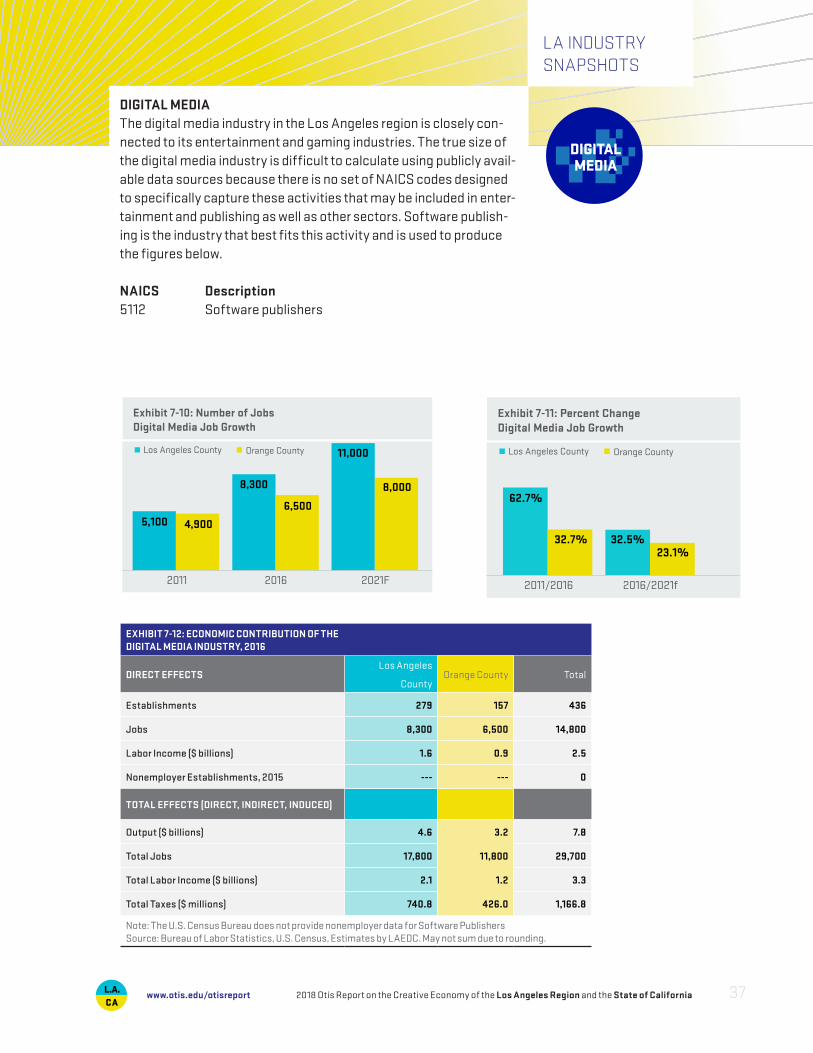
DIGITAL MEDIAThe digital media industry in the Los Angeles region is closely con-nected to its entertainment and gaming industries. The true size of the digital media industry is difficult to calculate using publicly avail-able data sources because there is no set of NAICS codes designed to specifically capture these activities that may be included in enter-tainment and publishing as well as other sectors. Software publish-ing is the industry that best fits this activity and is used to produce the figures below.
NAICS Description5112 Software publishers
EXHIBIT 7-12: ECONOMIC CONTRIBUTION OF THE DIGITAL MEDIA INDUSTRY, 2016
DIRECT EFFECTSLos Angeles
County Orange County Total
Establishments 279 157 436
Jobs 8,300 6,500 14,800
Labor Income ($ billions) 1.6 0.9 2.5
Nonemployer Establishments, 2015 --- --- 0
TOTAL EFFECTS (DIRECT, INDIRECT, INDUCED)
Output ($ billions) 4.6 3.2 7.8
Total Jobs 17,800 11,800 29,700
Total Labor Income ($ billions) 2.1 1.2 3.3
Total Taxes ($ millions) 740.8 426.0 1,166.8
Note: The U.S. Census Bureau does not provide nonemployer data for Software PublishersSource: Bureau of Labor Statistics, U.S. Census, Estimates by LAEDC. May not sum due to rounding.
Los Angeles County Orange County
2011 2016 2021F
5,100 4,900
11,000
8,300
6,500
8,000
Exhibit 7-10: Number of JobsDigital Media Job Growth
2011/2016 2016/2021f
62.7%
32.7% 32.5%23.1%
Exhibit 7-11: Percent ChangeDigital Media Job Growth
Los Angeles County Orange County
2018 Otis Report on the Creative Economy of the Los Angeles Region and the State of California 37www.otis.edu/otisreport
LA INDUSTRYSNAPSHOTS
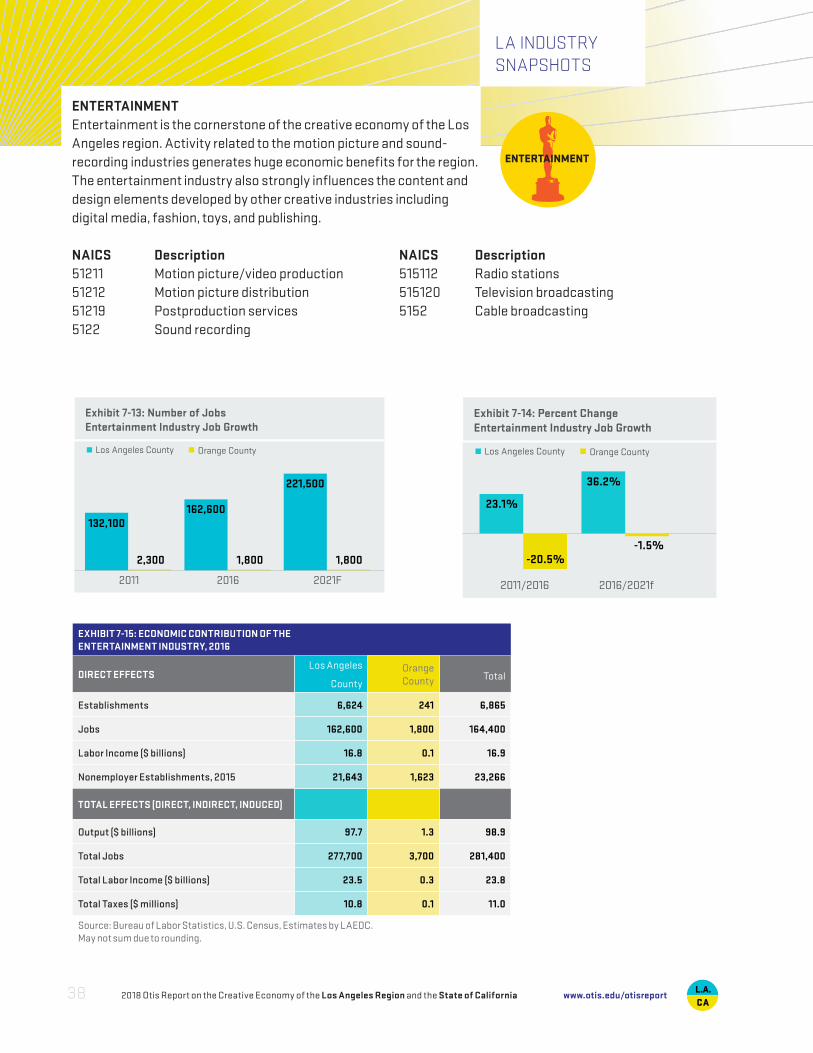
ENTERTAINMENTEntertainment is the cornerstone of the creative economy of the Los Angeles region. Activity related to the motion picture and sound- recording industries generates huge economic benefits for the region. The entertainment industry also strongly influences the content and design elements developed by other creative industries including digital media, fashion, toys, and publishing.
NAICS Description NAICS Description51211 Motion picture/video production 515112 Radio stations51212 Motion picture distribution 515120 Television broadcasting51219 Postproduction services 5152 Cable broadcasting5122 Sound recording
EXHIBIT 7-15: ECONOMIC CONTRIBUTION OF THE ENTERTAINMENT INDUSTRY, 2016
DIRECT EFFECTSLos Angeles
County Orange County Total
Establishments 6,624 241 6,865
Jobs 162,600 1,800 164,400
Labor Income ($ billions) 16.8 0.1 16.9
Nonemployer Establishments, 2015 21,643 1,623 23,266
TOTAL EFFECTS (DIRECT, INDIRECT, INDUCED)
Output ($ billions) 97.7 1.3 98.9
Total Jobs 277,700 3,700 281,400
Total Labor Income ($ billions) 23.5 0.3 23.8
Total Taxes ($ millions) 10.8 0.1 11.0
Source: Bureau of Labor Statistics, U.S. Census, Estimates by LAEDC. May not sum due to rounding.
Los Angeles County Orange County
2011 2016 2021F
132,100
2,300
221,500
162,600
1,800 1,800
Exhibit 7-13: Number of JobsEntertainment Industry Job Growth
2011/2016 2016/2021f
23.1%
-20.5%
36.2%
-1.5%
Exhibit 7-14: Percent ChangeEntertainment Industry Job Growth
Los Angeles County Orange County
2018 Otis Report on the Creative Economy of the Los Angeles Region and the State of California38 www.otis.edu/otisreport
LA INDUSTRYSNAPSHOTS
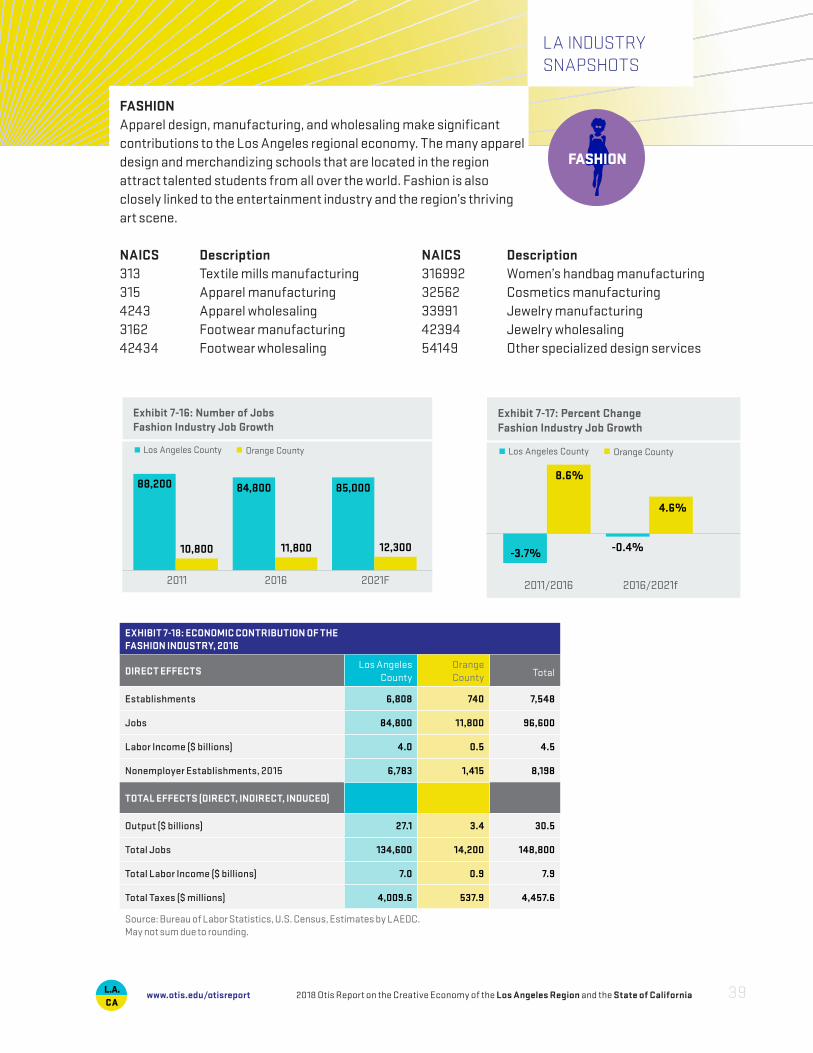
FASHIONApparel design, manufacturing, and wholesaling make significant contributions to the Los Angeles regional economy. The many apparel design and merchandizing schools that are located in the region attract talented students from all over the world. Fashion is also closely linked to the entertainment industry and the region’s thriving art scene.
NAICS Description NAICS Description313 Textile mills manufacturing 316992 Women’s handbag manufacturing315 Apparel manufacturing 32562 Cosmetics manufacturing4243 Apparel wholesaling 33991 Jewelry manufacturing3162 Footwear manufacturing 42394 Jewelry wholesaling42434 Footwear wholesaling 54149 Other specialized design services
EXHIBIT 7-18: ECONOMIC CONTRIBUTION OF THE FASHION INDUSTRY, 2016
DIRECT EFFECTSLos Angeles
County Orange County Total
Establishments 6,808 740 7,548
Jobs 84,800 11,800 96,600
Labor Income ($ billions) 4.0 0.5 4.5
Nonemployer Establishments, 2015 6,783 1,415 8,198
TOTAL EFFECTS (DIRECT, INDIRECT, INDUCED)
Output ($ billions) 27.1 3.4 30.5
Total Jobs 134,600 14,200 148,800
Total Labor Income ($ billions) 7.0 0.9 7.9
Total Taxes ($ millions) 4,009.6 537.9 4,457.6
Source: Bureau of Labor Statistics, U.S. Census, Estimates by LAEDC. May not sum due to rounding.
Los Angeles County Orange County
2011 2016 2021F
88,200
10,800
85,00084,800
11,800 12,300
Exhibit 7-16: Number of JobsFashion Industry Job Growth
2011/2016 2016/2021f
-3.7%
8.6%
-0.4%
4.6%
Exhibit 7-17: Percent ChangeFashion Industry Job Growth
Los Angeles County Orange County
2018 Otis Report on the Creative Economy of the Los Angeles Region and the State of California 39www.otis.edu/otisreport
LA INDUSTRYSNAPSHOTS
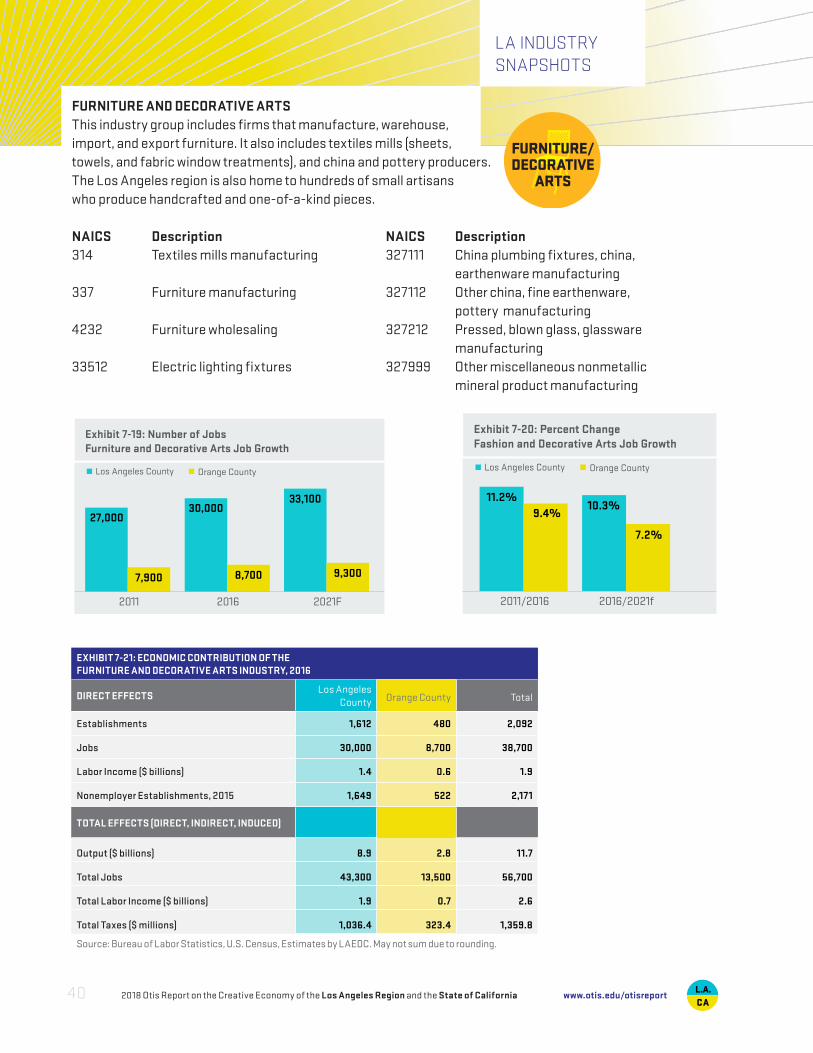
FURNITURE AND DECORATIVE ARTSThis industry group includes firms that manufacture, warehouse, import, and export furniture. It also includes textiles mills (sheets, towels, and fabric window treatments), and china and pottery producers. The Los Angeles region is also home to hundreds of small artisans who produce handcrafted and one-of-a-kind pieces.
NAICS Description NAICS Description314 Textiles mills manufacturing 327111 China plumbing fixtures, china, earthenware manufacturing337 Furniture manufacturing 327112 Other china, fine earthenware, pottery manufacturing4232 Furniture wholesaling 327212 Pressed, blown glass, glassware manufacturing33512 Electric lighting fixtures 327999 Other miscellaneous nonmetallic mineral product manufacturing
EXHIBIT 7-21: ECONOMIC CONTRIBUTION OF THE FURNITURE AND DECORATIVE ARTS INDUSTRY, 2016
DIRECT EFFECTSLos Angeles
County Orange County Total
Establishments 1,612 480 2,092
Jobs 30,000 8,700 38,700
Labor Income ($ billions) 1.4 0.6 1.9
Nonemployer Establishments, 2015 1,649 522 2,171
TOTAL EFFECTS (DIRECT, INDIRECT, INDUCED)
Output ($ billions) 8.9 2.8 11.7
Total Jobs 43,300 13,500 56,700
Total Labor Income ($ billions) 1.9 0.7 2.6
Total Taxes ($ millions) 1,036.4 323.4 1,359.8
Source: Bureau of Labor Statistics, U.S. Census, Estimates by LAEDC. May not sum due to rounding.
Los Angeles County Orange County
2011 2016 2021F
27,000
7,900
33,10030,000
8,700 9,300
Exhibit 7-19: Number of JobsFurniture and Decorative Arts Job Growth
2011/2016 2016/2021f
11.2%9.4%
10.3%
7.2%
Exhibit 7-20: Percent ChangeFashion and Decorative Arts Job Growth
Los Angeles County Orange County
2018 Otis Report on the Creative Economy of the Los Angeles Region and the State of California40 www.otis.edu/otisreport
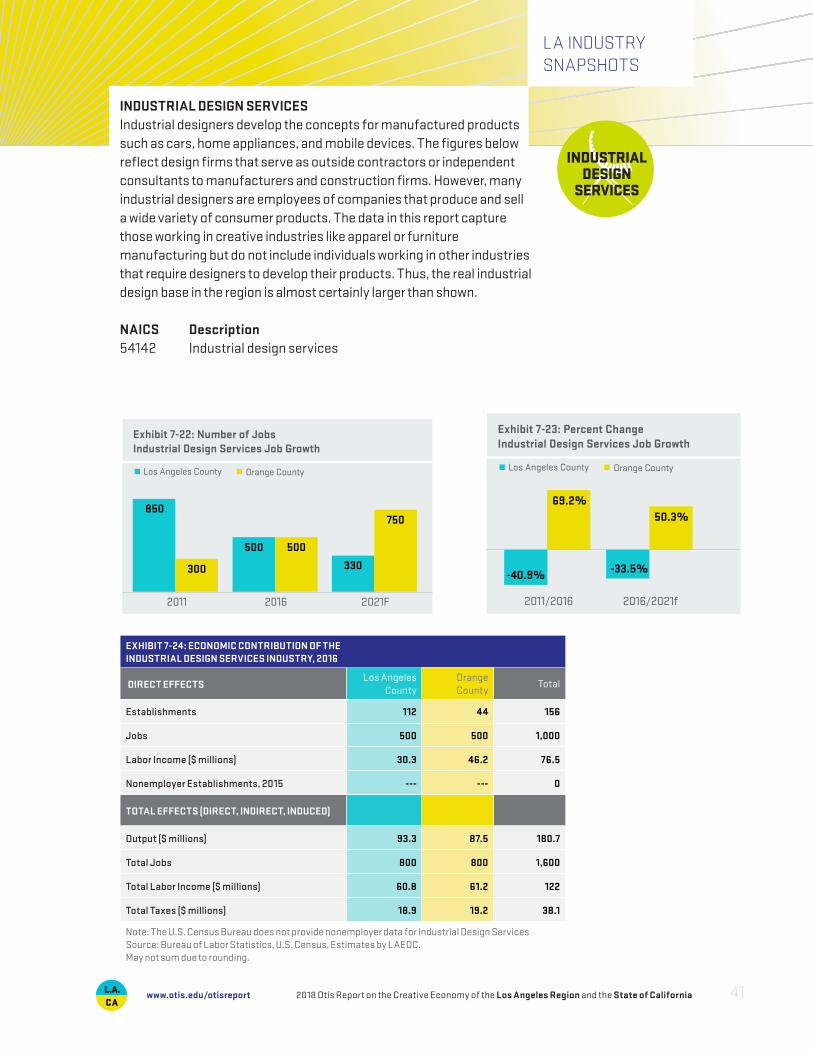
INDUSTRIAL DESIGN SERVICESIndustrial designers develop the concepts for manufactured products such as cars, home appliances, and mobile devices. The figures below reflect design firms that serve as outside contractors or independent consultants to manufacturers and construction firms. However, many industrial designers are employees of companies that produce and sell a wide variety of consumer products. The data in this report capture those working in creative industries like apparel or furniture manufacturing but do not include individuals working in other industries that require designers to develop their products. Thus, the real industrial design base in the region is almost certainly larger than shown.
NAICS Description54142 Industrial design services
EXHIBIT 7-24: ECONOMIC CONTRIBUTION OF THE INDUSTRIAL DESIGN SERVICES INDUSTRY, 2016
DIRECT EFFECTSLos Angeles
CountyOrange County
Total
Establishments 112 44 156
Jobs 500 500 1,000
Labor Income ($ millions) 30.3 46.2 76.5
Nonemployer Establishments, 2015 --- --- 0
TOTAL EFFECTS (DIRECT, INDIRECT, INDUCED)
Output ($ millions) 93.3 87.5 180.7
Total Jobs 800 800 1,600
Total Labor Income ($ millions) 60.8 61.2 122
Total Taxes ($ millions) 18.9 19.2 38.1
Note: The U.S. Census Bureau does not provide nonemployer data for Industrial Design ServicesSource: Bureau of Labor Statistics, U.S. Census, Estimates by LAEDC. May not sum due to rounding.
Los Angeles County Orange County
2011 2016 2021F
850
300 330
500 500
750
Exhibit 7-22: Number of JobsIndustrial Design Services Job Growth
2011/2016 2016/2021f
-40.9%
69.2%
-33.5%
50.3%
Exhibit 7-23: Percent ChangeIndustrial Design Services Job Growth
Los Angeles County Orange County
LA INDUSTRYSNAPSHOTS
2018 Otis Report on the Creative Economy of the Los Angeles Region and the State of California 41www.otis.edu/otisreport
LA INDUSTRYSNAPSHOTS
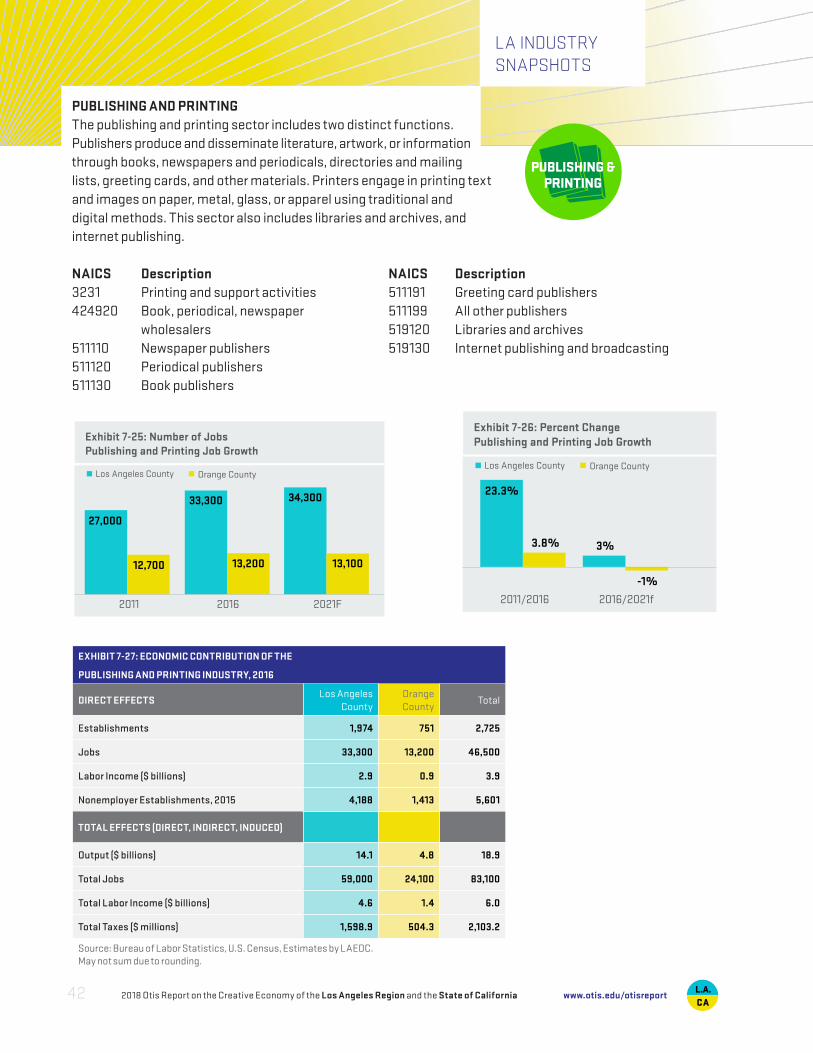
PUBLISHING AND PRINTINGThe publishing and printing sector includes two distinct functions. Publishers produce and disseminate literature, artwork, or information through books, newspapers and periodicals, directories and mailing lists, greeting cards, and other materials. Printers engage in printing text and images on paper, metal, glass, or apparel using traditional and digital methods. This sector also includes libraries and archives, and internet publishing.
NAICS Description NAICS Description3231 Printing and support activities 511191 Greeting card publishers424920 Book, periodical, newspaper 511199 All other publishers wholesalers 519120 Libraries and archives511110 Newspaper publishers 519130 Internet publishing and broadcasting511120 Periodical publishers 511130 Book publishers
EXHIBIT 7-27: ECONOMIC CONTRIBUTION OF THE
PUBLISHING AND PRINTING INDUSTRY, 2016
DIRECT EFFECTS Los Angeles
CountyOrange County
Total
Establishments 1,974 751 2,725
Jobs 33,300 13,200 46,500
Labor Income ($ billions) 2.9 0.9 3.9
Nonemployer Establishments, 2015 4,188 1,413 5,601
TOTAL EFFECTS (DIRECT, INDIRECT, INDUCED)
Output ($ billions) 14.1 4.8 18.9
Total Jobs 59,000 24,100 83,100
Total Labor Income ($ billions) 4.6 1.4 6.0
Total Taxes ($ millions) 1,598.9 504.3 2,103.2
Source: Bureau of Labor Statistics, U.S. Census, Estimates by LAEDC. May not sum due to rounding.
Los Angeles County Orange County
2011 2016 2021F
27,000
12,700
34,30033,300
13,200 13,100
Exhibit 7-25: Number of JobsPublishing and Printing Job Growth
2011/2016 2016/2021f
23.3%
3.8% 3%
-1%
Exhibit 7-26: Percent ChangePublishing and Printing Job Growth
Los Angeles County Orange County
2018 Otis Report on the Creative Economy of the Los Angeles Region and the State of California42 www.otis.edu/otisreport
LA INDUSTRYSNAPSHOTS
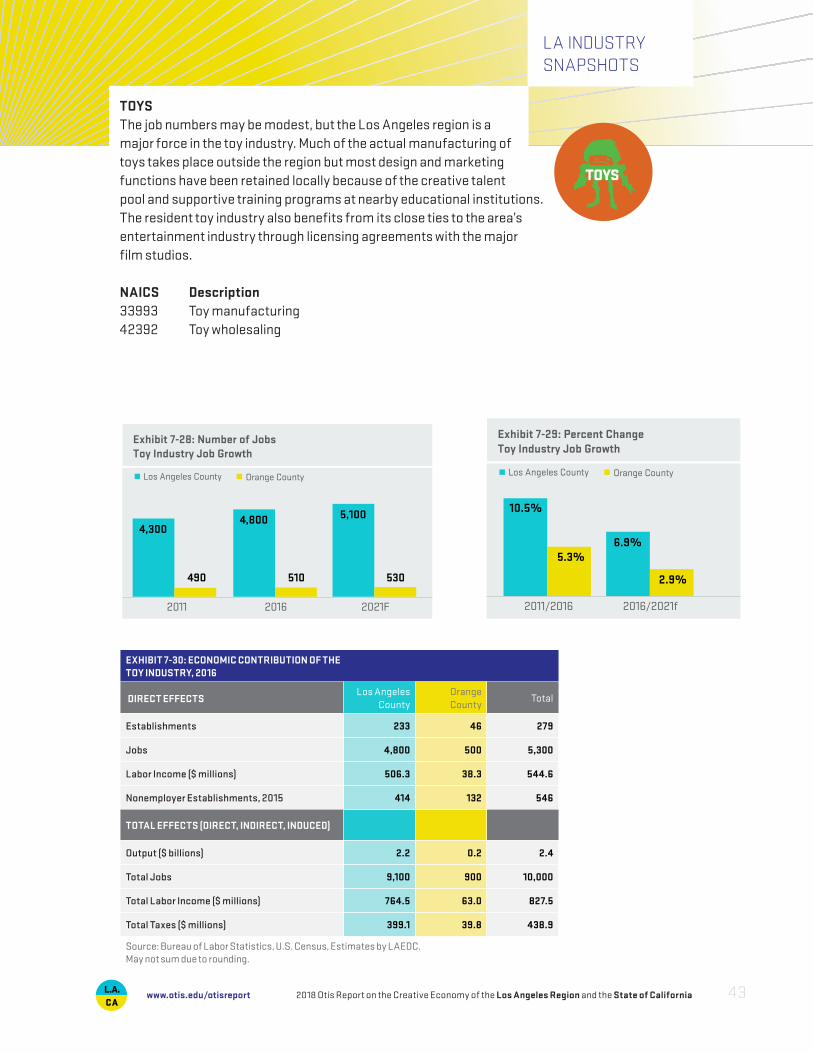
TOYSThe job numbers may be modest, but the Los Angeles region is a major force in the toy industry. Much of the actual manufacturing of toys takes place outside the region but most design and marketing functions have been retained locally because of the creative talent pool and supportive training programs at nearby educational institutions. The resident toy industry also benefits from its close ties to the area’s entertainment industry through licensing agreements with the major film studios.
NAICS Description33993 Toy manufacturing42392 Toy wholesaling
EXHIBIT 7-30: ECONOMIC CONTRIBUTION OF THE TOY INDUSTRY, 2016
DIRECT EFFECTSLos Angeles
CountyOrange County
Total
Establishments 233 46 279
Jobs 4,800 500 5,300
Labor Income ($ millions) 506.3 38.3 544.6
Nonemployer Establishments, 2015 414 132 546
TOTAL EFFECTS (DIRECT, INDIRECT, INDUCED)
Output ($ billions) 2.2 0.2 2.4
Total Jobs 9,100 900 10,000
Total Labor Income ($ millions) 764.5 63.0 827.5
Total Taxes ($ millions) 399.1 39.8 438.9
Source: Bureau of Labor Statistics, U.S. Census, Estimates by LAEDC. May not sum due to rounding.
Los Angeles County Orange County
2011 2016 2021F
4,300
490
5,1004,800
510 530
Exhibit 7-28: Number of JobsToy Industry Job Growth
2011/2016 2016/2021f
10.5%
5.3%6.9%
2.9%
Exhibit 7-29: Percent ChangeToy Industry Job Growth
Los Angeles County Orange County
2018 Otis Report on the Creative Economy of the Los Angeles Region and the State of California 43www.otis.edu/otisreport
LA INDUSTRYSNAPSHOTS
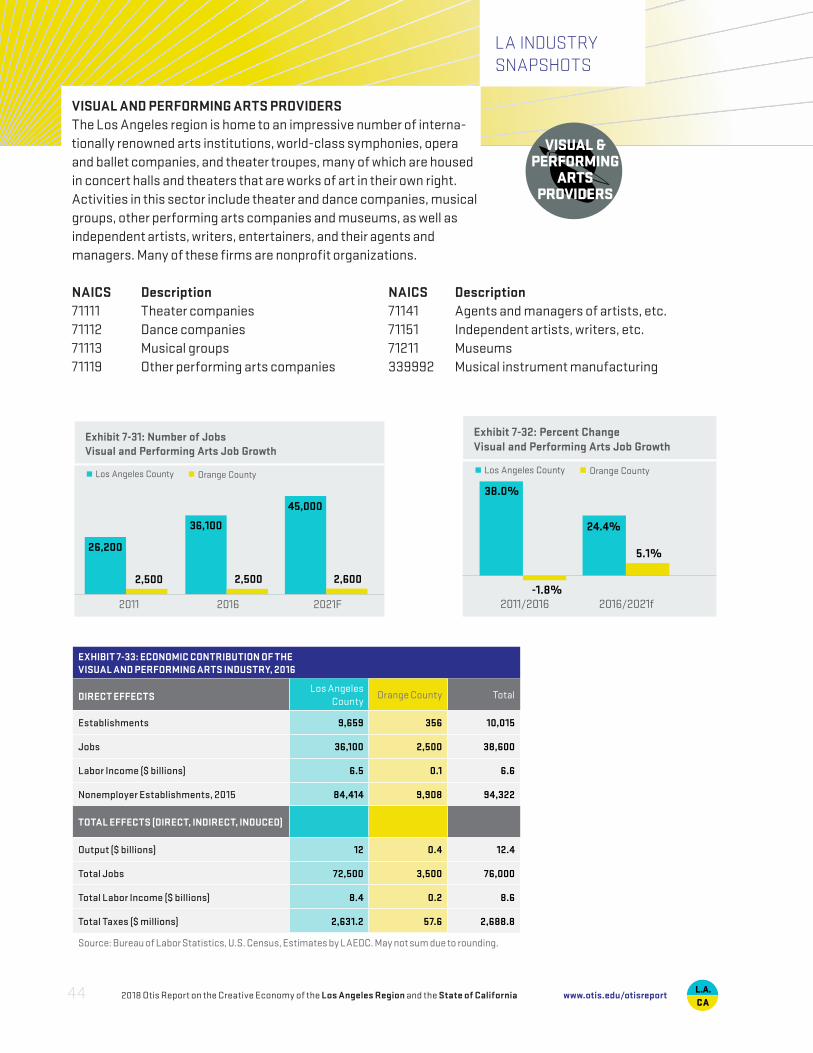
VISUAL AND PERFORMING ARTS PROVIDERSThe Los Angeles region is home to an impressive number of interna- tionally renowned arts institutions, world-class symphonies, opera and ballet companies, and theater troupes, many of which are housed in concert halls and theaters that are works of art in their own right. Activities in this sector include theater and dance companies, musical groups, other performing arts companies and museums, as well as independent artists, writers, entertainers, and their agents and managers. Many of these firms are nonprofit organizations.
NAICS Description NAICS Description71111 Theater companies 71141 Agents and managers of artists, etc.71112 Dance companies 71151 Independent artists, writers, etc.71113 Musical groups 71211 Museums71119 Other performing arts companies 339992 Musical instrument manufacturing
EXHIBIT 7-33: ECONOMIC CONTRIBUTION OF THE VISUAL AND PERFORMING ARTS INDUSTRY, 2016
DIRECT EFFECTS Los Angeles County
Orange County Total
Establishments 9,659 356 10,015
Jobs 36,100 2,500 38,600
Labor Income ($ billions) 6.5 0.1 6.6
Nonemployer Establishments, 2015 84,414 9,908 94,322
TOTAL EFFECTS (DIRECT, INDIRECT, INDUCED)
Output ($ billions) 12 0.4 12.4
Total Jobs 72,500 3,500 76,000
Total Labor Income ($ billions) 8.4 0.2 8.6
Total Taxes ($ millions) 2,631.2 57.6 2,688.8
Source: Bureau of Labor Statistics, U.S. Census, Estimates by LAEDC. May not sum due to rounding.
Los Angeles County Orange County
2011 2016 2021F
26,200
2,500
45,000
36,100
2,500 2,600
Exhibit 7-31: Number of JobsVisual and Performing Arts Job Growth
2011/2016 2016/2021f
38.0%
-1.8%
24.4%
5.1%
Exhibit 7-32: Percent ChangeVisual and Performing Arts Job Growth
Los Angeles County Orange County
2018 Otis Report on the Creative Economy of the Los Angeles Region and the State of California44 www.otis.edu/otisreport
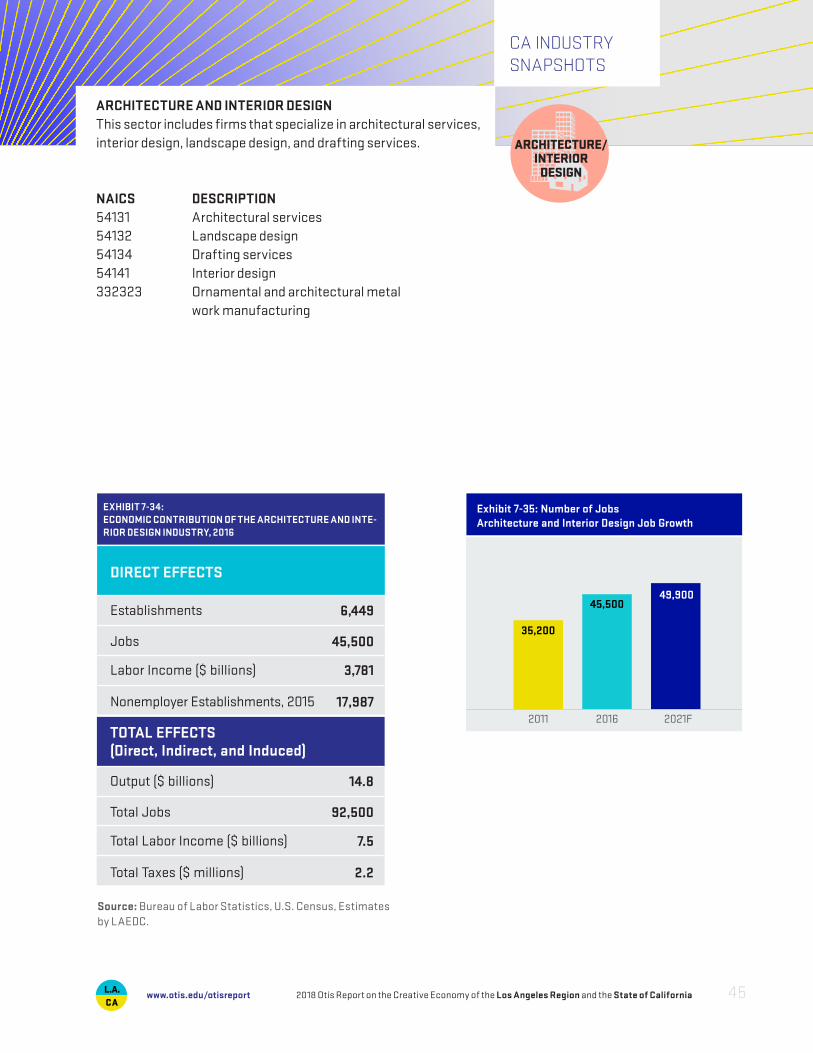
CA INDUSTRYSNAPSHOTS
ARCHITECTURE AND INTERIOR DESIGNThis sector includes firms that specialize in architectural services, interior design, landscape design, and drafting services.
NAICS DESCRIPTION54131 Architectural services 54132 Landscape design54134 Drafting services54141 Interior design332323 Ornamental and architectural metal work manufacturing
Establishments
Jobs
Labor Income ($ billions)
Nonemployer Establishments, 2015
DIRECT EFFECTS
6,449
45,500
3,781
17,987
Output ($ billions)
Total Jobs
Total Labor Income ($ billions)
Total Taxes ($ millions)
TOTAL EFFECTS (Direct, Indirect, and Induced)
14.8
92,500
7.5
2.2
EXHIBIT 7-34: ECONOMIC CONTRIBUTION OF THE ARCHITECTURE AND INTE-RIOR DESIGN INDUSTRY, 2016
Source: Bureau of Labor Statistics, U.S. Census, Estimates by LAEDC.
2011 2016 2021F
35,200
45,50049,900
Exhibit 7-35: Number of JobsArchitecture and Interior Design Job Growth
2018 Otis Report on the Creative Economy of the Los Angeles Region and the State of California 45www.otis.edu/otisreport
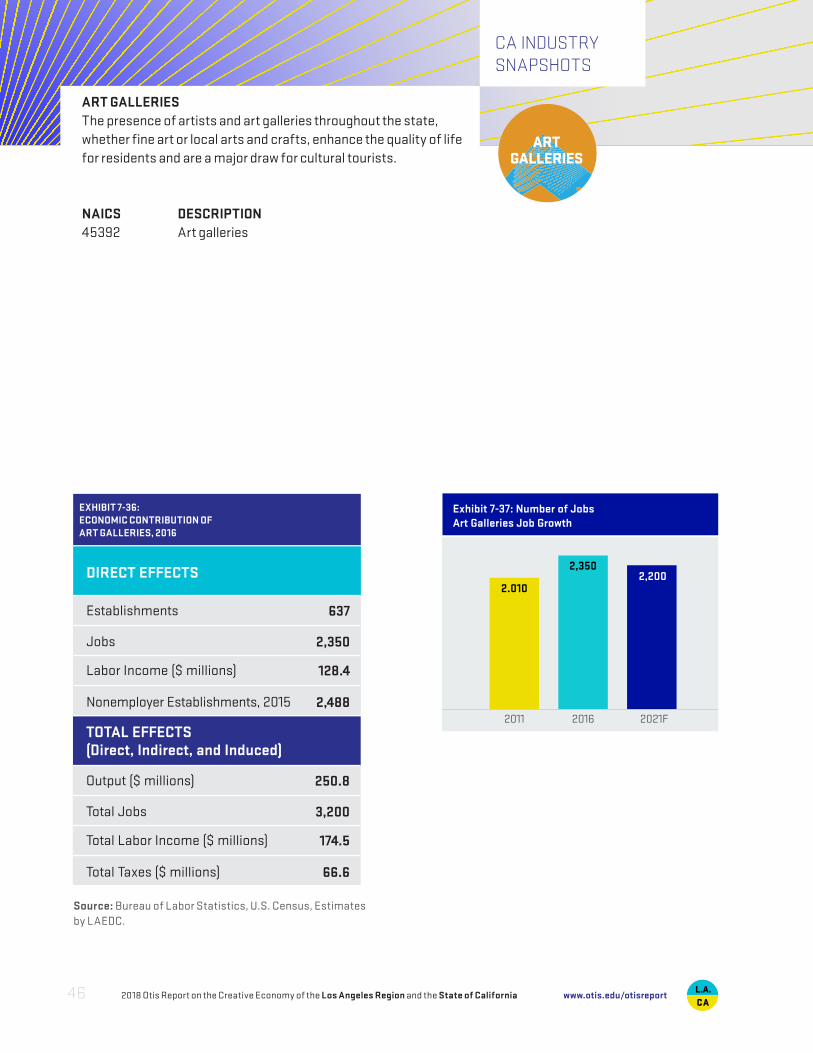
CA INDUSTRYSNAPSHOTS
ART GALLERIESThe presence of artists and art galleries throughout the state, whether fine art or local arts and crafts, enhance the quality of life for residents and are a major draw for cultural tourists.
NAICS DESCRIPTION45392 Art galleries
Establishments
Jobs
Labor Income ($ millions)
Nonemployer Establishments, 2015
DIRECT EFFECTS
637
2,350
128.4
2,488
Output ($ millions)
Total Jobs
Total Labor Income ($ millions)
Total Taxes ($ millions)
TOTAL EFFECTS (Direct, Indirect, and Induced)
250.8
3,200
174.5
66.6
Source: Bureau of Labor Statistics, U.S. Census, Estimates by LAEDC.
EXHIBIT 7-36: ECONOMIC CONTRIBUTION OF ART GALLERIES, 2016
2011 2016 2021F
2.010
2,3502,200
Exhibit 7-37: Number of JobsArt Galleries Job Growth
2018 Otis Report on the Creative Economy of the Los Angeles Region and the State of California46 www.otis.edu/otisreport
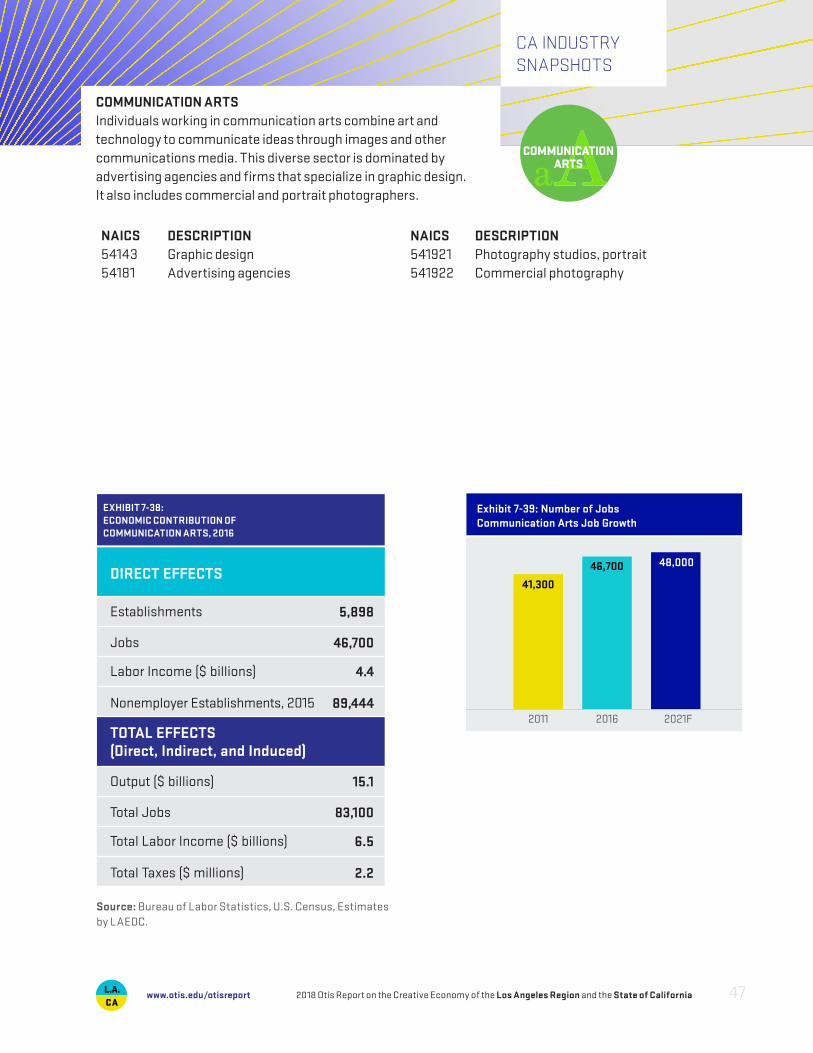
INDUSTRY SNAPSHOTS
CA INDUSTRYSNAPSHOTS
COMMUNICATION ARTS Individuals working in communication arts combine art and technology to communicate ideas through images and other communications media. This diverse sector is dominated by advertising agencies and firms that specialize in graphic design. It also includes commercial and portrait photographers.
NAICS 5414354181
DESCRIPTIONGraphic designAdvertising agencies
NAICS541921541922
DESCRIPTIONPhotography studios, portraitCommercial photography
Establishments
Jobs
Labor Income ($ billions)
Nonemployer Establishments, 2015
DIRECT EFFECTS
5,898
46,700
4.4
89,444
Output ($ billions)
Total Jobs
Total Labor Income ($ billions)
Total Taxes ($ millions)
TOTAL EFFECTS (Direct, Indirect, and Induced)
15.1
83,100
6.5
2.2
Source: Bureau of Labor Statistics, U.S. Census, Estimates by LAEDC.
EXHIBIT 7-38: ECONOMIC CONTRIBUTION OF COMMUNICATION ARTS, 2016
2011 2016 2021F
41,300
46,700 48,000
Exhibit 7-39: Number of JobsCommunication Arts Job Growth
2018 Otis Report on the Creative Economy of the Los Angeles Region and the State of California 47www.otis.edu/otisreport
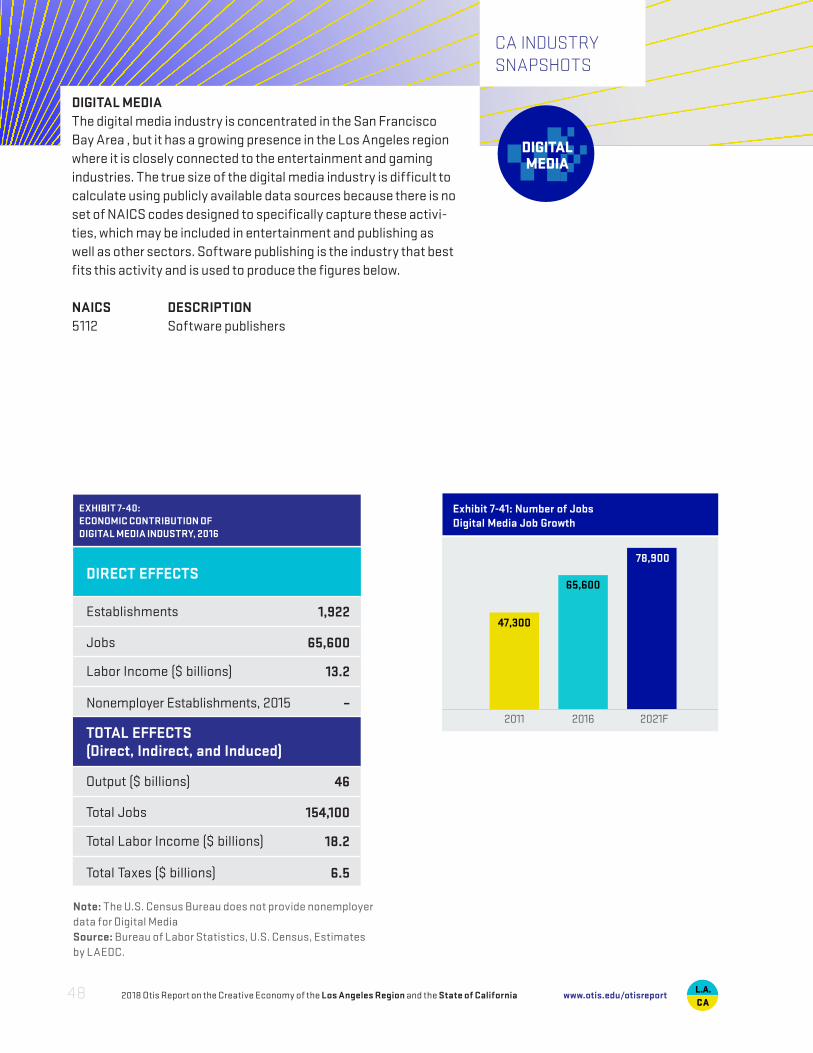
Establishments
Jobs
Labor Income ($ billions)
Nonemployer Establishments, 2015
DIRECT EFFECTS
1,922
65,600
13.2
–
Output ($ billions)
Total Jobs
Total Labor Income ($ billions)
Total Taxes ($ billions)
TOTAL EFFECTS (Direct, Indirect, and Induced)
46
154,100
18.2
6.5
Note: The U.S. Census Bureau does not provide nonemployer data for Digital MediaSource: Bureau of Labor Statistics, U.S. Census, Estimates by LAEDC.
EXHIBIT 7-40: ECONOMIC CONTRIBUTION OF DIGITAL MEDIA INDUSTRY, 2016
CA INDUSTRYSNAPSHOTS
DIGITAL MEDIAThe digital media industry is concentrated in the San Francisco Bay Area , but it has a growing presence in the Los Angeles region where it is closely connected to the entertainment and gaming industries. The true size of the digital media industry is difficult to calculate using publicly available data sources because there is no set of NAICS codes designed to specifically capture these activi-ties, which may be included in entertainment and publishing as well as other sectors. Software publishing is the industry that best fits this activity and is used to produce the figures below.
NAICS DESCRIPTION5112 Software publishers
2011 2016 2021F
47,300
65,600
78,900
Exhibit 7-41: Number of JobsDigital Media Job Growth
2018 Otis Report on the Creative Economy of the Los Angeles Region and the State of California48 www.otis.edu/otisreport

Establishments
Jobs
Labor Income ($ billions)
Nonemployer Establishments, 2015
DIRECT EFFECTS
8,612
192,200
20.0
32,895
Output ($ billions)
Total Jobs
Total Labor Income ($ billions)
Total Taxes ($ billions)
TOTAL EFFECTS (Direct, Indirect, and Induced)
124.56
367,400
30.5
13.2
Source: Bureau of Labor Statistics, U.S. Census, Estimates by LAEDC.
EXHIBIT 7-42: ECONOMIC CONTRIBUTION OF ENTERTAINMENT INDUSTRY, 2016
INDUSTRY SNAPSHOTS
CA INDUSTRYSNAPSHOTS
ENTERTAINMENTEntertainment is the cornerstone of the creative economy of the Los Angeles region, but activity related to the industry can be found throughout the state. The motion picture and sound-recording industry generates huge economic benefits for California and strongly influences the content and design elements developed by other creative industries including digital media, fashion, toys, and publishing.
NAICS 51211
212
51219
5122
DESCRIPTION
Motion picture/video production
Motion picture distribution
Post production services
Sound recording
NAICS
515112
515120
5152
DESCRIPTION
Radio stations
Television broadcasting
Cable broadcasting
2011 2016 2021F
168,400192,200
203,300
Exhibit 7-43: Number of JobsEntertainment Job Growth
2018 Otis Report on the Creative Economy of the Los Angeles Region and the State of California 49www.otis.edu/otisreport
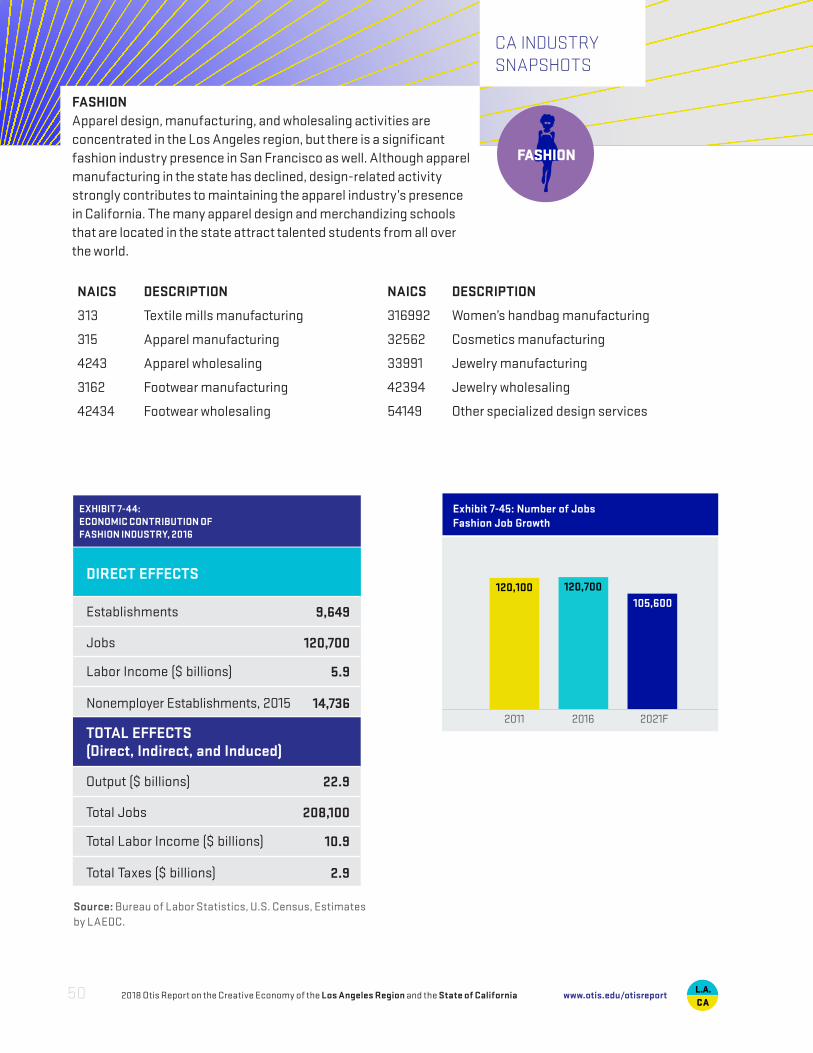
CA INDUSTRYSNAPSHOTS
FASHION Apparel design, manufacturing, and wholesaling activities are concentrated in the Los Angeles region, but there is a significant fashion industry presence in San Francisco as well. Although apparel manufacturing in the state has declined, design-related activity strongly contributes to maintaining the apparel industry’s presence in California. The many apparel design and merchandizing schools that are located in the state attract talented students from all over the world.
NAICS
313
315
4243
3162
42434
DESCRIPTION
Textile mills manufacturing
Apparel manufacturing
Apparel wholesaling
Footwear manufacturing
Footwear wholesaling
NAICS
316992
32562
33991
42394
54149
DESCRIPTION
Women’s handbag manufacturing
Cosmetics manufacturing
Jewelry manufacturing
Jewelry wholesaling
Other specialized design services
Establishments
Jobs
Labor Income ($ billions)
Nonemployer Establishments, 2015
DIRECT EFFECTS
9,649
120,700
5.9
14,736
Output ($ billions)
Total Jobs
Total Labor Income ($ billions)
Total Taxes ($ billions)
TOTAL EFFECTS (Direct, Indirect, and Induced)
22.9
208,100
10.9
2.9
Source: Bureau of Labor Statistics, U.S. Census, Estimates by LAEDC.
EXHIBIT 7-44: ECONOMIC CONTRIBUTION OF FASHION INDUSTRY, 2016
2011 2016 2021F
120,100 120,700105,600
Exhibit 7-45: Number of JobsFashion Job Growth
2018 Otis Report on the Creative Economy of the Los Angeles Region and the State of California50 www.otis.edu/otisreport
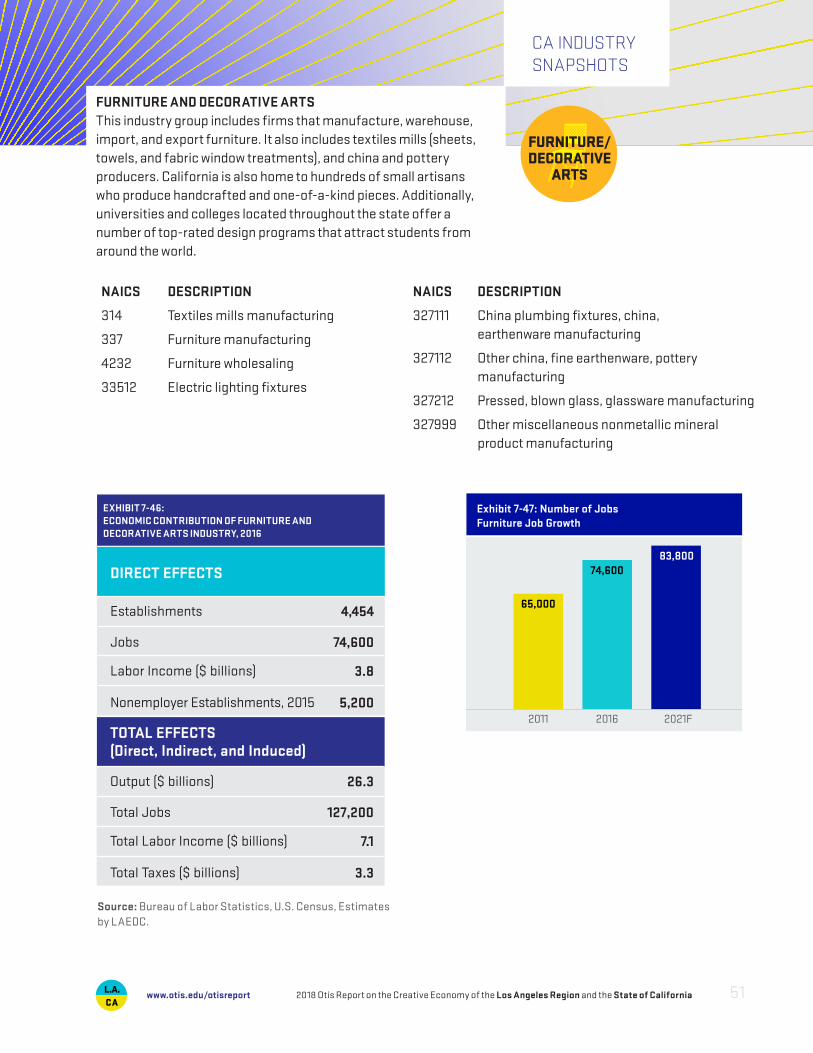
INDUSTRY SNAPSHOTS
FURNITURE AND DECORATIVE ARTSThis industry group includes firms that manufacture, warehouse, import, and export furniture. It also includes textiles mills (sheets, towels, and fabric window treatments), and china and pottery producers. California is also home to hundreds of small artisans who produce handcrafted and one-of-a-kind pieces. Additionally, universities and colleges located throughout the state offer a number of top-rated design programs that attract students from around the world.
NAICS
314
337
4232
33512
DESCRIPTION
Textiles mills manufacturing
Furniture manufacturing
Furniture wholesaling
Electric lighting fixtures
NAICS
327111
327112
327212
327999
DESCRIPTION
China plumbing fixtures, china, earthenware manufacturing
Other china, fine earthenware, pottery manufacturing
Pressed, blown glass, glassware manufacturing
Other miscellaneous nonmetallic mineral product manufacturing
Establishments
Jobs
Labor Income ($ billions)
Nonemployer Establishments, 2015
DIRECT EFFECTS
4,454
74,600
3.8
5,200
Output ($ billions)
Total Jobs
Total Labor Income ($ billions)
Total Taxes ($ billions)
TOTAL EFFECTS (Direct, Indirect, and Induced)
26.3
127,200
7.1
3.3
Source: Bureau of Labor Statistics, U.S. Census, Estimates by LAEDC.
EXHIBIT 7-46: ECONOMIC CONTRIBUTION OF FURNITURE AND DECORATIVE ARTS INDUSTRY, 2016
CA INDUSTRYSNAPSHOTS
2011 2016 2021F
65,000
74,60083,800
Exhibit 7-47: Number of JobsFurniture Job Growth
2018 Otis Report on the Creative Economy of the Los Angeles Region and the State of California 51www.otis.edu/otisreport
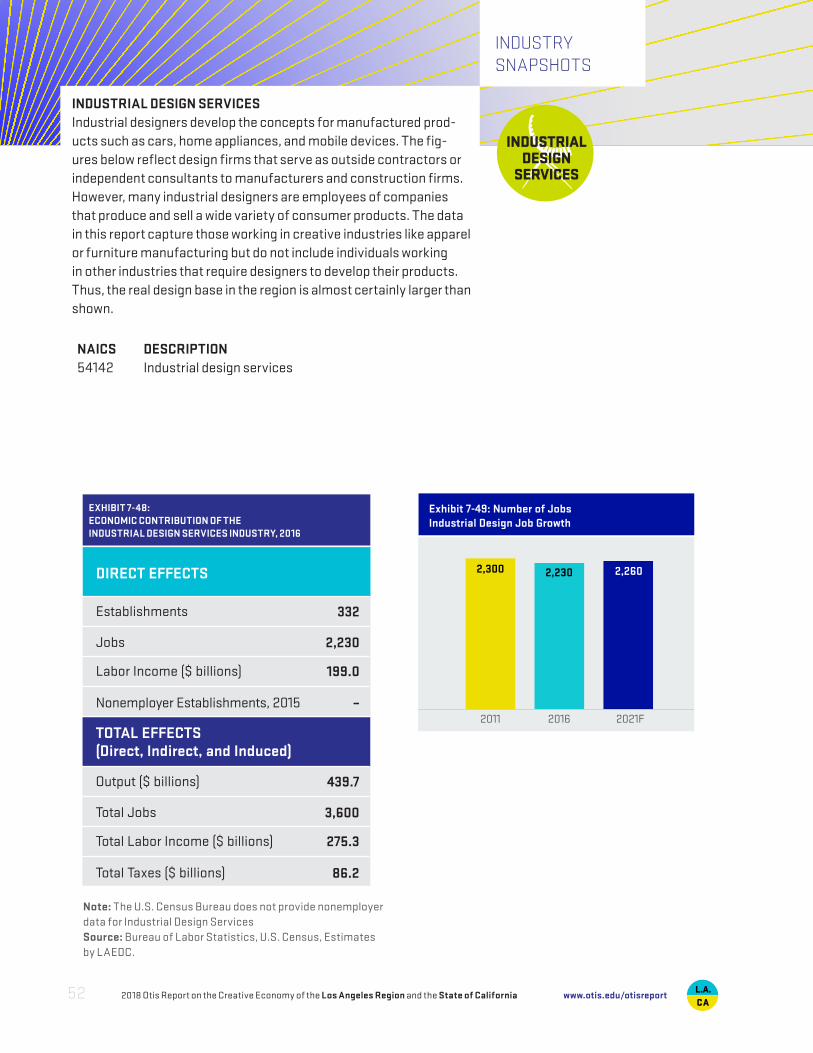
Establishments
Jobs
Labor Income ($ billions)
Nonemployer Establishments, 2015
DIRECT EFFECTS
332
2,230
199.0
–
Output ($ billions)
Total Jobs
Total Labor Income ($ billions)
Total Taxes ($ billions)
TOTAL EFFECTS (Direct, Indirect, and Induced)
439.7
3,600
275.3
86.2
Note: The U.S. Census Bureau does not provide nonemployer data for Industrial Design ServicesSource: Bureau of Labor Statistics, U.S. Census, Estimates by LAEDC.
EXHIBIT 7-48: ECONOMIC CONTRIBUTION OF THEINDUSTRIAL DESIGN SERVICES INDUSTRY, 2016
INDUSTRYSNAPSHOTS
INDUSTRIAL DESIGN SERVICESIndustrial designers develop the concepts for manufactured prod-ucts such as cars, home appliances, and mobile devices. The fig-ures below reflect design firms that serve as outside contractors or independent consultants to manufacturers and construction firms. However, many industrial designers are employees of companies that produce and sell a wide variety of consumer products. The data in this report capture those working in creative industries like apparel or furniture manufacturing but do not include individuals working in other industries that require designers to develop their products. Thus, the real design base in the region is almost certainly larger than shown.
NAICS 54142
DESCRIPTIONIndustrial design services
2011 2016 2021F
2,300 2,230 2,260
Exhibit 7-49: Number of JobsIndustrial Design Job Growth
2018 Otis Report on the Creative Economy of the Los Angeles Region and the State of California52 www.otis.edu/otisreport

CA INDUSTRYSNAPSHOTS
PUBLISHING AND PRINTING The traditional publishing and printing sector includes two distinct functions. Publishers produce and disseminate literature, artwork, or information through books, newspapers and periodicals, directories and mailing lists, greeting cards, and other materials. Printers engage in printing text and images on paper, metal, glass, and apparel using traditional and digital methods. This sector also includes libraries and archives, and Internet publishing.
NAICS
3231
424920
511110
511120
511130
DESCRIPTION
Printing and support activities
Book, periodical, newspaper wholesalers
Newspaper publishers
Periodical publishers
Book publishers
NAICS
511191
511199
519120
519130
DESCRIPTION
Greeting card publishers
All other publishers
Libraries and archives
Internet publishing and broadcasting
Establishments
Jobs
Labor Income ($ billions)
Nonemployer Establishments, 2015
DIRECT EFFECTS
7,059
160,200
30.5
15,192
Output ($ billions)
Total Jobs
Total Labor Income ($ billions)
Total Taxes ($ billions)
TOTAL EFFECTS (Direct, Indirect, and Induced)
135.7
516,400
51.7
16.9
Source: Bureau of Labor Statistics, U.S. Census, Estimates by LAEDC.
EXHIBIT 7-50: ECONOMIC CONTRIBUTION OF THEPUBLISHING AND PRINTING INDUSTRY, 2016
2011 2016 2021F
122,000
160,200174,600
Exhibit 7-51: Number of JobsPublishing and Printing Job Growth
2018 Otis Report on the Creative Economy of the Los Angeles Region and the State of California 53www.otis.edu/otisreport
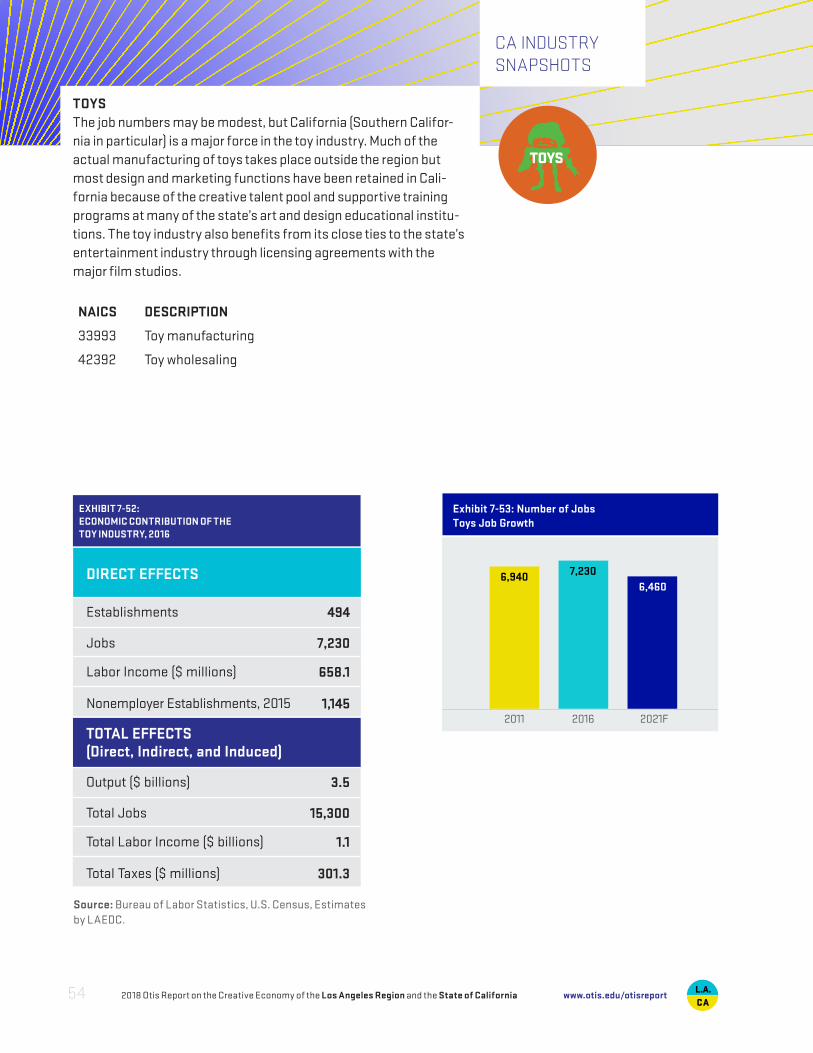
Establishments
Jobs
Labor Income ($ millions)
Nonemployer Establishments, 2015
DIRECT EFFECTS
494
7,230
658.1
1,145
Output ($ billions)
Total Jobs
Total Labor Income ($ billions)
Total Taxes ($ millions)
TOTAL EFFECTS (Direct, Indirect, and Induced)
3.5
15,300
1.1
301.3
Source: Bureau of Labor Statistics, U.S. Census, Estimates by LAEDC.
CA INDUSTRYSNAPSHOTS
TOYSThe job numbers may be modest, but California (Southern Califor-nia in particular) is a major force in the toy industry. Much of the actual manufacturing of toys takes place outside the region but most design and marketing functions have been retained in Cali-fornia because of the creative talent pool and supportive training programs at many of the state’s art and design educational institu-tions. The toy industry also benefits from its close ties to the state’s entertainment industry through licensing agreements with the major film studios.
NAICS
33993
42392
DESCRIPTION
Toy manufacturing
Toy wholesaling
EXHIBIT 7-52: ECONOMIC CONTRIBUTION OF THETOY INDUSTRY, 2016
2011 2016 2021F
6,940 7,2306,460
Exhibit 7-53: Number of JobsToys Job Growth
2018 Otis Report on the Creative Economy of the Los Angeles Region and the State of California54 www.otis.edu/otisreport
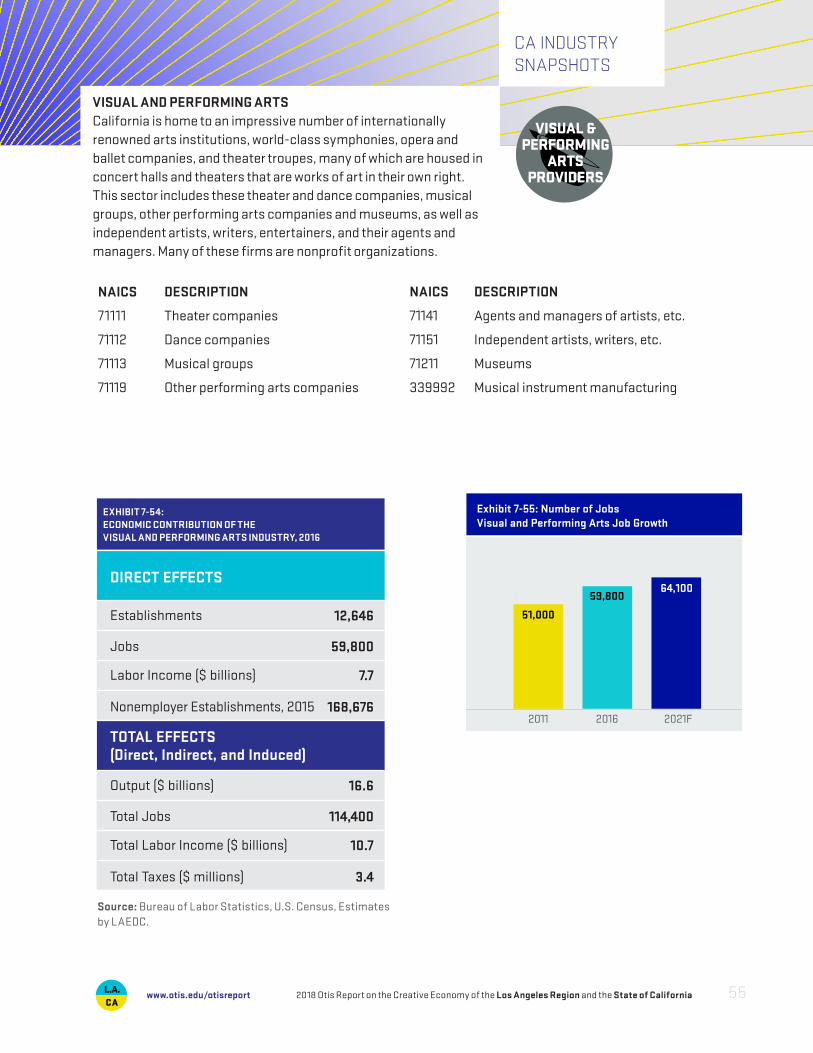
CA INDUSTRYSNAPSHOTS
Establishments
Jobs
Labor Income ($ billions)
Nonemployer Establishments, 2015
DIRECT EFFECTS
12,646
59,800
7.7
168,676
Output ($ billions)
Total Jobs
Total Labor Income ($ billions)
Total Taxes ($ millions)
TOTAL EFFECTS (Direct, Indirect, and Induced)
16.6
114,400
10.7
3.4
Source: Bureau of Labor Statistics, U.S. Census, Estimates by LAEDC.
VISUAL AND PERFORMING ARTS California is home to an impressive number of internationally renowned arts institutions, world-class symphonies, opera and ballet companies, and theater troupes, many of which are housed in concert halls and theaters that are works of art in their own right. This sector includes these theater and dance companies, musical groups, other performing arts companies and museums, as well as independent artists, writers, entertainers, and their agents and managers. Many of these firms are nonprofit organizations.
NAICS
71111
71112
71113
71119
DESCRIPTION
Theater companies
Dance companies
Musical groups
Other performing arts companies
NAICS
71141
71151
71211
339992
DESCRIPTION
Agents and managers of artists, etc.
Independent artists, writers, etc.
Museums
Musical instrument manufacturing
EXHIBIT 7-54: ECONOMIC CONTRIBUTION OF THEVISUAL AND PERFORMING ARTS INDUSTRY, 2016
2011 2016 2021F
51,000
59,80064,100
Exhibit 7-55: Number of JobsVisual and Performing Arts Job Growth
2018 Otis Report on the Creative Economy of the Los Angeles Region and the State of California 55www.otis.edu/otisreport
EMPLOYMENT
Employment in the creative economy involves either those who work in a creative industry or those who work in creative occupations. Creative occupations produce and distribute cultural, consumer, and commercial goods and services. This section examines the creative occupations component of the creative economy. Many of these occupations are found within the creative industries, but they are also present in significant numbers in industries that are outside the designated creative sector. The Bureau of Labor Statistics gathers data pertaining to occupations that make it possible to identify and measure creative occupations throughout the economy. It can also shed light on the extent to which creative industries employ people in func-tions outside of creative occupations. The occupational data used in this report are based on the Standard Occupational Classification (SOC) system. Of the 820 detailed occupational codes listed in the SOC system, 775 were included in the data set for this report, and of those, 76 have been identified as creative.
These 76 creative occupations can be found across a wide array of organizational functions. For example, within the major group, management occupations, creative occupations include advertising, marketing, and public relations managers. In techni-cal fields, there are software developers and architects, and in production-related fields, there are tailors, cabinet makers, and engravers. One may find a marketing manager or graphic designer working in any number of industries, those identified as creative or otherwise. This illustrates the fact that creative people are often found outside of what we typically think of as the creative sectors of the economy.
In 2016, there were 242,500 workers in Los Angeles County employed in a creative occupation and 62,020 in Orange County. This represents 5.7 percent of total occupa-tion-based employment in Los Angeles County and 3.3 percent in Orange County. In both counties, the largest share of individuals employed in creative occupations worked in art, design, entertainment, and media: 61 percent in Los Angeles County and 35 percent in Orange County for a total of 156,500 workers. Across both counties, 43,000 people worked in computer and mathematical occupations, many of whom spend their days creating animated characters for film and TV or designing video games. The next largest group of creative workers in the region were employed in education, training, and library occupations (21,400).
OCCUPATIONS IN THE CREATIVE ECONOMY
8
2018 Otis Report on the Creative Economy of the Los Angeles Region and the State of California56 www.otis.edu/otisreport
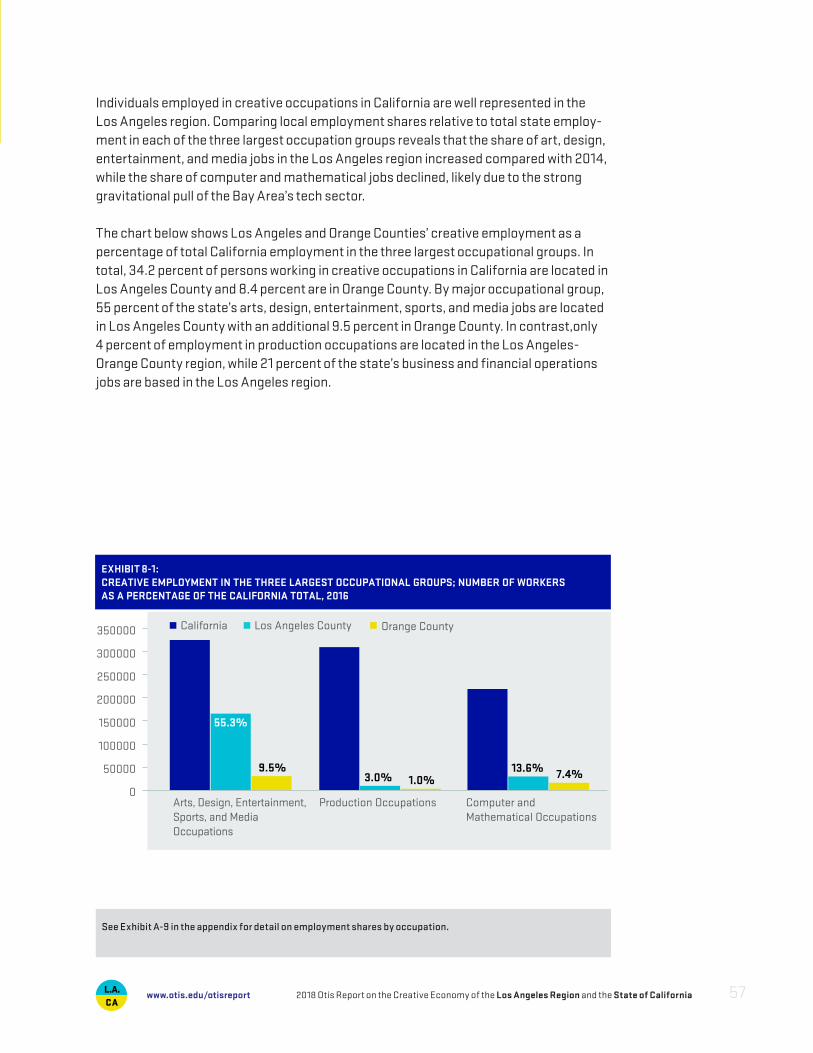
Individuals employed in creative occupations in California are well represented in the Los Angeles region. Comparing local employment shares relative to total state employ-ment in each of the three largest occupation groups reveals that the share of art, design, entertainment, and media jobs in the Los Angeles region increased compared with 2014, while the share of computer and mathematical jobs declined, likely due to the strong gravitational pull of the Bay Area’s tech sector.
The chart below shows Los Angeles and Orange Counties’ creative employment as a percentage of total California employment in the three largest occupational groups. In total, 34.2 percent of persons working in creative occupations in California are located in Los Angeles County and 8.4 percent are in Orange County. By major occupational group, 55 percent of the state’s arts, design, entertainment, sports, and media jobs are located in Los Angeles County with an additional 9.5 percent in Orange County. In contrast,only 4 percent of employment in production occupations are located in the Los Angeles-Orange County region, while 21 percent of the state’s business and financial operations jobs are based in the Los Angeles region.
Los Angeles CountyCalifornia Orange County
Arts, Design, Entertainment, Sports, and Media Occupations
Production Occupations Computer and Mathematical Occupations
55.3%
9.5%3.0%
13.6%1.0% 7.4%
EXHIBIT 8-1:CREATIVE EMPLOYMENT IN THE THREE LARGEST OCCUPATIONAL GROUPS; NUMBER OF WORKERS AS A PERCENTAGE OF THE CALIFORNIA TOTAL, 2016
0
50000
100000
150000
200000
250000
300000
350000
See Exhibit A-9 in the appendix for detail on employment shares by occupation.
2018 Otis Report on the Creative Economy of the Los Angeles Region and the State of California 57www.otis.edu/otisreport
That numerous creative occupations may be found across so many industries sug-gests the importance of creativity throughout the economy as a highly valued at-tribute essential to the success of many kinds of firms and business activities. The further implication is that it is in the region’s economic interest to maintain, nurture, and grow its deep pool of creative talent.
HOW MUCH DO MULTIMEDIA WORKERS EARN?
It is now widely established that creativity is a highly valued and recognized profes-sional attribute. Along with the ability to collaborate with coworkers and to commu-nicate effectively, creativity is a sought-after quality in a prospective employee. The salaries received by many creative individuals working in the Los Angeles region bear this out.
In Los Angeles County and Orange County, in 2016, the creative occupation receiv-ing the highest annual median wage was applications software developers, earning $111,128 and $107,151 respectively.
The median wage across all occupations in Los Angeles County was $38,224 in 2016. Out of the 76 creative occupations analyzed in this report, 64 had a median annual wage greater than the county-wide median (wage data for four occupations were unavailable). In Orange County, the median wage across all occupations was slightly higher at $40,949 with 55 creative occupations exceeding that threshold (wage data for seven occupations were unavailable).
The occupations listed in the following charts and tables were selected because they align closely with the creative industries defined in this report. Between 2015 and 2016, there was a great deal of variation in median annual wage growth, but compared with last year, more occupations are showing wage gains. Overall, the median annual wage across all occupations increased by 0.7 percent after rising by 1.2 percent in 2015.
Throughout the current economic expansion, the lack of wage growth across many industries and occupations has been a concern. Lingering slack in the labor mar-kets (low labor force participation, underemployment) has acted as a check on wage growth. Now that the economy is at full employment, several measures of income growth indicate more workers can expect to see a bump in their paychecks. Compe-tition among firms for skilled employees in tightening labor markets means higher wages. Also, minimum-wage laws are also increasing wages for low-skilled workers.
2018 Otis Report on the Creative Economy of the Los Angeles Region and the State of California58 www.otis.edu/otisreport
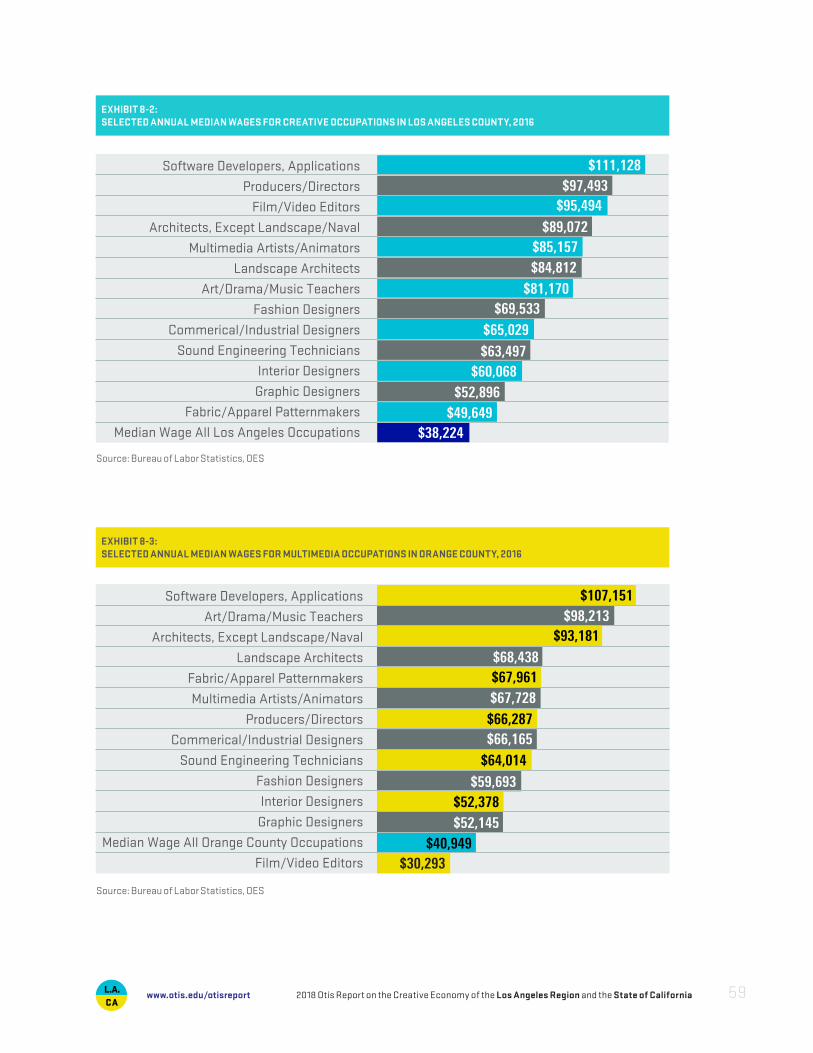
Software Developers, Applications
Producers/Directors
Film/Video Editors
Architects, Except Landscape/Naval
Multimedia Artists/Animators
Landscape Architects
Art/Drama/Music Teachers
Fashion Designers
Commerical/Industrial Designers
Sound Engineering Technicians
Interior Designers
Graphic Designers
Fabric/Apparel Patternmakers
Median Wage All Los Angeles Occupations
$95,494$97,493
$111,128
$85,157
$81,170
$65,029
$60,068$52,896
$49,649$38,224
$89,072
$84,812
$69,533
$63,497
Software Developers, Applications
Art/Drama/Music Teachers
Architects, Except Landscape/Naval
Landscape Architects
Fabric/Apparel Patternmakers
Multimedia Artists/Animators
Producers/Directors
Commerical/Industrial Designers
Sound Engineering Technicians
Fashion Designers
Interior Designers
Graphic Designers
Median Wage All Orange County Occupations
Film/Video Editors
$93,181$98,213
$107,151
$67,961
$66,287
$64,014
$52,378$52,145
$40,949$30,293
$68,438
$67,728
$66,165
$59,693
EXHIBIT 8-2: SELECTED ANNUAL MEDIAN WAGES FOR CREATIVE OCCUPATIONS IN LOS ANGELES COUNTY, 2016
EXHIBIT 8-3: SELECTED ANNUAL MEDIAN WAGES FOR MULTIMEDIA OCCUPATIONS IN ORANGE COUNTY, 2016
Source: Bureau of Labor Statistics, OES
Source: Bureau of Labor Statistics, OES
2018 Otis Report on the Creative Economy of the Los Angeles Region and the State of California 59www.otis.edu/otisreport
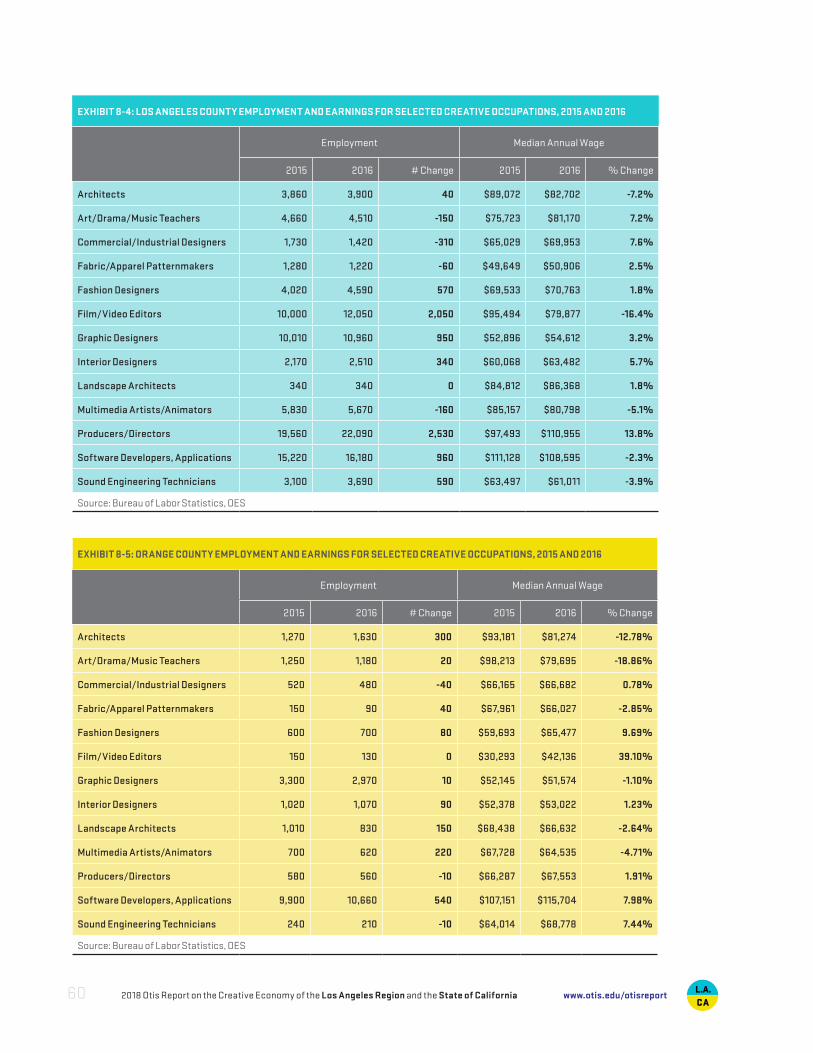
EXHIBIT 8-4: LOS ANGELES COUNTY EMPLOYMENT AND EARNINGS FOR SELECTED CREATIVE OCCUPATIONS, 2015 AND 2016
Employment Median Annual Wage
2015 2016 # Change 2015 2016 % Change
Architects 3,860 3,900 40 $89,072 $82,702 -7.2%
Art/Drama/Music Teachers 4,660 4,510 -150 $75,723 $81,170 7.2%
Commercial/Industrial Designers 1,730 1,420 -310 $65,029 $69,953 7.6%
Fabric/Apparel Patternmakers 1,280 1,220 -60 $49,649 $50,906 2.5%
Fashion Designers 4,020 4,590 570 $69,533 $70,763 1.8%
Film/Video Editors 10,000 12,050 2,050 $95,494 $79,877 -16.4%
Graphic Designers 10,010 10,960 950 $52,896 $54,612 3.2%
Interior Designers 2,170 2,510 340 $60,068 $63,482 5.7%
Landscape Architects 340 340 0 $84,812 $86,368 1.8%
Multimedia Artists/Animators 5,830 5,670 -160 $85,157 $80,798 -5.1%
Producers/Directors 19,560 22,090 2,530 $97,493 $110,955 13.8%
Software Developers, Applications 15,220 16,180 960 $111,128 $108,595 -2.3%
Sound Engineering Technicians 3,100 3,690 590 $63,497 $61,011 -3.9%
Source: Bureau of Labor Statistics, OES
EXHIBIT 8-5: ORANGE COUNTY EMPLOYMENT AND EARNINGS FOR SELECTED CREATIVE OCCUPATIONS, 2015 AND 2016
Employment Median Annual Wage
2015 2016 # Change 2015 2016 % Change
Architects 1,270 1,630 300 $93,181 $81,274 -12.78%
Art/Drama/Music Teachers 1,250 1,180 20 $98,213 $79,695 -18.86%
Commercial/Industrial Designers 520 480 -40 $66,165 $66,682 0.78%
Fabric/Apparel Patternmakers 150 90 40 $67,961 $66,027 -2.85%
Fashion Designers 600 700 80 $59,693 $65,477 9.69%
Film/Video Editors 150 130 0 $30,293 $42,136 39.10%
Graphic Designers 3,300 2,970 10 $52,145 $51,574 -1.10%
Interior Designers 1,020 1,070 90 $52,378 $53,022 1.23%
Landscape Architects 1,010 830 150 $68,438 $66,632 -2.64%
Multimedia Artists/Animators 700 620 220 $67,728 $64,535 -4.71%
Producers/Directors 580 560 -10 $66,287 $67,553 1.91%
Software Developers, Applications 9,900 10,660 540 $107,151 $115,704 7.98%
Sound Engineering Technicians 240 210 -10 $64,014 $68,778 7.44%
Source: Bureau of Labor Statistics, OES
2018 Otis Report on the Creative Economy of the Los Angeles Region and the State of California60 www.otis.edu/otisreport
The tables below show employment and median wage changes for selected creative occupations in 2016 compared with 2015. There are many reasons why some of these occupations may have suffered a decline in wages. The first is a shift from wage and salary employment to independent contractors. Some of these occupations may also be concentrated in industries that are declining or are in the process of transforming through technological changes. Declining wages can also be attributable to broader economic trends such as a lack of new home building, decreasing demand for landscape architects. Another factor that reflects trends in the labor markets at large is that more people in creative occupations may be working part-time, which would cause a decline in median annual wage.
LOCATION QUOTIENTS IN THE LOS ANGELES REGION
A location quotient (LQ) can be used to quantify the concentration of a particular indus-try, industry cluster, occupation, or demographic group in a region compared with the nation. It reveals what makes a region unique.
An LQ of 1.0 for an occupation means that a region has the same (or average) concentra-tion of that occupation in comparison to the nation. If the LQ of an occupation is above 1.0, the region has a higher-than-average concentration of that occupation. Higher-than-average LQs for a given occupation or industry suggest a competitive advantage for that region compared to other regions in the country.
As indicated in the figures below, the Los Angeles region has high LQs in many creative occupations. In fact, the ten occupations in Los Angeles County with the highest LQs are all creative occupations. Orange County’s profile was quite different, where only one of the top 10 occupations by LQ was creative: landscape architects. The highest LQs in Orange County were for occupations in the construction trades and technology.
2018 Otis Report on the Creative Economy of the Los Angeles Region and the State of California 61www.otis.edu/otisreport
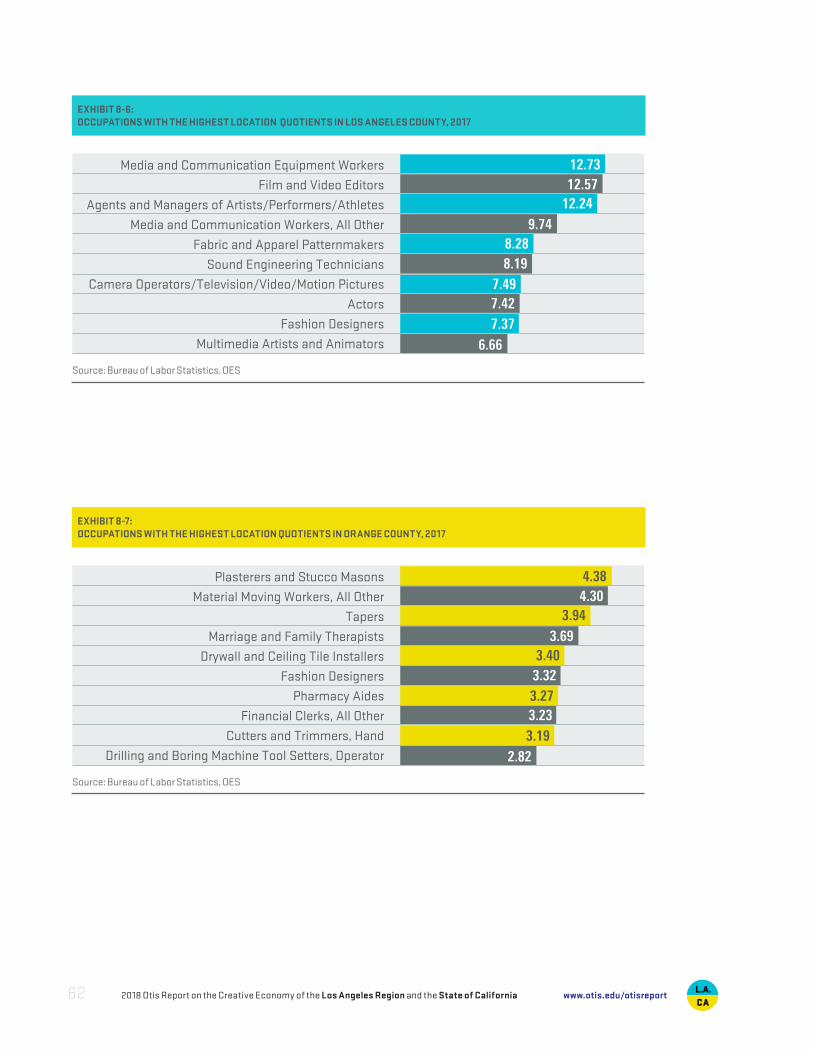
3.944.304.38
3.40
3.27
3.19
3.69
3.32
3.23
2.82
Plasterers and Stucco Masons
Material Moving Workers, All Other
Tapers
Marriage and Family Therapists
Drywall and Ceiling Tile Installers
Fashion Designers
Pharmacy Aides
Financial Clerks, All Other
Cutters and Trimmers, Hand
Drilling and Boring Machine Tool Setters, Operator
EXHIBIT 8-7: OCCUPATIONS WITH THE HIGHEST LOCATION QUOTIENTS IN ORANGE COUNTY, 2017
Source: Bureau of Labor Statistics, OES
12.2412.5712.73
8.28
7.49
7.37
9.74
8.19
7.42
6.66
Media and Communication Equipment Workers
Film and Video Editors
Agents and Managers of Artists/Performers/Athletes
Media and Communication Workers, All Other
Fabric and Apparel Patternmakers
Sound Engineering Technicians
Camera Operators/Television/Video/Motion Pictures
Actors
Fashion Designers
Multimedia Artists and Animators
EXHIBIT 8-6: OCCUPATIONS WITH THE HIGHEST LOCATION QUOTIENTS IN LOS ANGELES COUNTY, 2017
Source: Bureau of Labor Statistics, OES
2018 Otis Report on the Creative Economy of the Los Angeles Region and the State of California62 www.otis.edu/otisreport
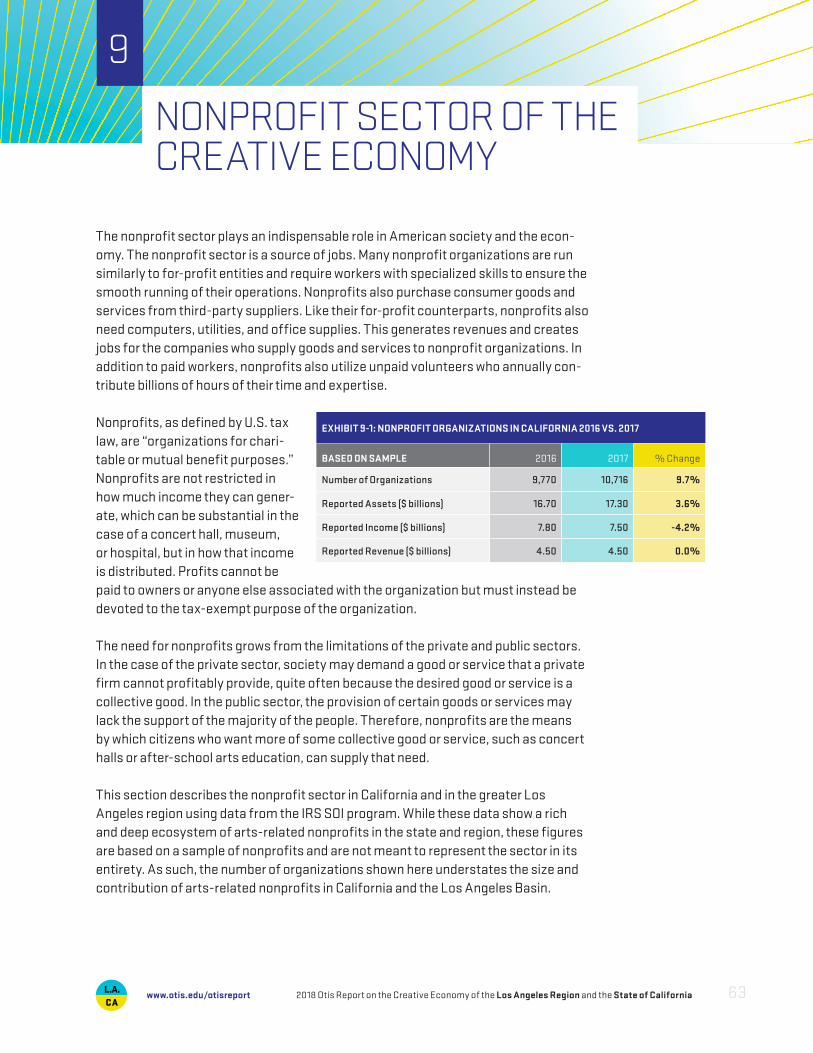
The nonprofit sector plays an indispensable role in American society and the econ-omy. The nonprofit sector is a source of jobs. Many nonprofit organizations are run similarly to for-profit entities and require workers with specialized skills to ensure the smooth running of their operations. Nonprofits also purchase consumer goods and services from third-party suppliers. Like their for-profit counterparts, nonprofits also need computers, utilities, and office supplies. This generates revenues and creates jobs for the companies who supply goods and services to nonprofit organizations. In addition to paid workers, nonprofits also utilize unpaid volunteers who annually con-tribute billions of hours of their time and expertise.
Nonprofits, as defined by U.S. tax law, are “organizations for chari-table or mutual benefit purposes.” Nonprofits are not restricted in how much income they can gener-ate, which can be substantial in the case of a concert hall, museum, or hospital, but in how that income is distributed. Profits cannot be paid to owners or anyone else associated with the organization but must instead be devoted to the tax-exempt purpose of the organization.
The need for nonprofits grows from the limitations of the private and public sectors. In the case of the private sector, society may demand a good or service that a private firm cannot profitably provide, quite often because the desired good or service is a collective good. In the public sector, the provision of certain goods or services may lack the support of the majority of the people. Therefore, nonprofits are the means by which citizens who want more of some collective good or service, such as concert halls or after-school arts education, can supply that need.
This section describes the nonprofit sector in California and in the greater Los Angeles region using data from the IRS SOI program. While these data show a rich and deep ecosystem of arts-related nonprofits in the state and region, these figures are based on a sample of nonprofits and are not meant to represent the sector in its entirety. As such, the number of organizations shown here understates the size and contribution of arts-related nonprofits in California and the Los Angeles Basin.
NONPROFIT SECTOR OF THE CREATIVE ECONOMY
9
EXHIBIT 9-1: NONPROFIT ORGANIZATIONS IN CALIFORNIA 2016 VS. 2017
BASED ON SAMPLE 2016 2017 % Change
Number of Organizations 9,770 10,716 9.7%
Reported Assets ($ billions) 16.70 17.30 3.6%
Reported Income ($ billions) 7.80 7.50 -4.2%
Reported Revenue ($ billions) 4.50 4.50 0.0%
2018 Otis Report on the Creative Economy of the Los Angeles Region and the State of California 63www.otis.edu/otisreport
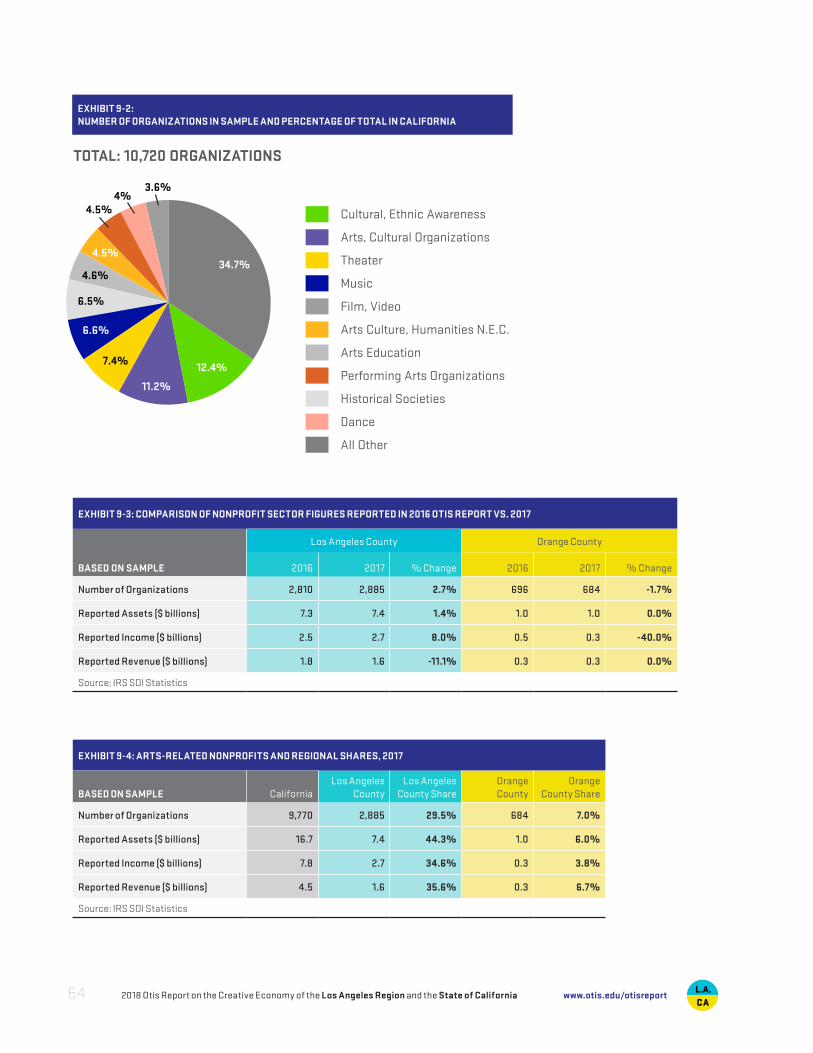
Cultural, Ethnic Awareness
Arts, Cultural Organizations
Theater
Music
Film, Video
Arts Culture, Humanities N.E.C.
Arts Education
Performing Arts Organizations
Historical Societies
Dance
All Other
34.7%
12.4%
11.2%
7.4%
6.6%
6.5%
4.6%
4.5%
4%4.5%
3.6%
TOTAL: 10,720 ORGANIZATIONS
EXHIBIT 9-2: NUMBER OF ORGANIZATIONS IN SAMPLE AND PERCENTAGE OF TOTAL IN CALIFORNIA
EXHIBIT 9-3: COMPARISON OF NONPROFIT SECTOR FIGURES REPORTED IN 2016 OTIS REPORT VS. 2017
BASED ON SAMPLE
Los Angeles County Orange County
2016 2017 % Change 2016 2017 % Change
Number of Organizations 2,810 2,885 2.7% 696 684 -1.7%
Reported Assets ($ billions) 7.3 7.4 1.4% 1.0 1.0 0.0%
Reported Income ($ billions) 2.5 2.7 8.0% 0.5 0.3 -40.0%
Reported Revenue ($ billions) 1.8 1.6 -11.1% 0.3 0.3 0.0%
Source: IRS SOI Statistics
EXHIBIT 9-4: ARTS-RELATED NONPROFITS AND REGIONAL SHARES, 2017
BASED ON SAMPLE CaliforniaLos Angeles
CountyLos Angeles
County ShareOrange County
Orange County Share
Number of Organizations 9,770 2,885 29.5% 684 7.0%
Reported Assets ($ billions) 16.7 7.4 44.3% 1.0 6.0%
Reported Income ($ billions) 7.8 2.7 34.6% 0.3 3.8%
Reported Revenue ($ billions) 4.5 1.6 35.6% 0.3 6.7%
Source: IRS SOI Statistics
2018 Otis Report on the Creative Economy of the Los Angeles Region and the State of California64 www.otis.edu/otisreport
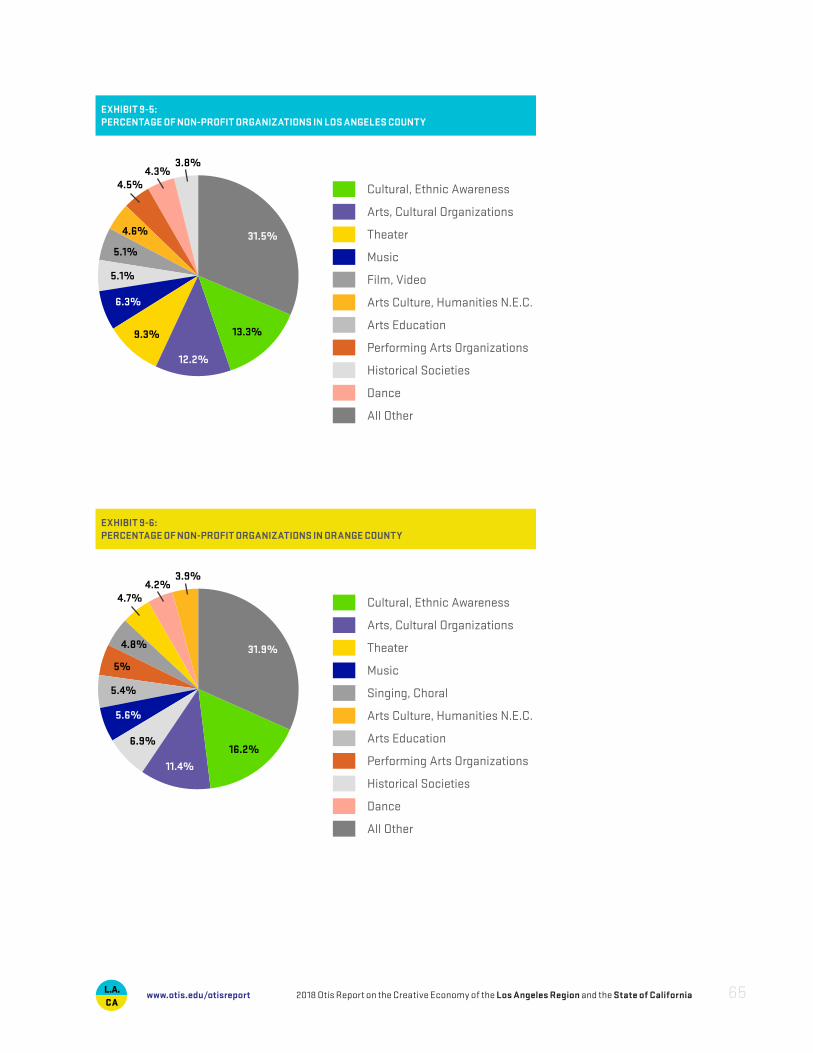
Cultural, Ethnic Awareness
Arts, Cultural Organizations
Theater
Music
Film, Video
Arts Culture, Humanities N.E.C.
Arts Education
Performing Arts Organizations
Historical Societies
Dance
All Other
31.5%
13.3%
12.2%
9.3%
6.3%
5.1%
5.1%
4.6%
4.3%4.5%
3.8%
EXHIBIT 9-5: PERCENTAGE OF NON-PROFIT ORGANIZATIONS IN LOS ANGELES COUNTY
Cultural, Ethnic Awareness
Arts, Cultural Organizations
Theater
Music
Singing, Choral
Arts Culture, Humanities N.E.C.
Arts Education
Performing Arts Organizations
Historical Societies
Dance
All Other
31.9%
16.2%
11.4%
6.9%
5.6%
5.4%
5%
4.8%
4.2%4.7%
3.9%
EXHIBIT 9-6: PERCENTAGE OF NON-PROFIT ORGANIZATIONS IN ORANGE COUNTY
2018 Otis Report on the Creative Economy of the Los Angeles Region and the State of California 65www.otis.edu/otisreport
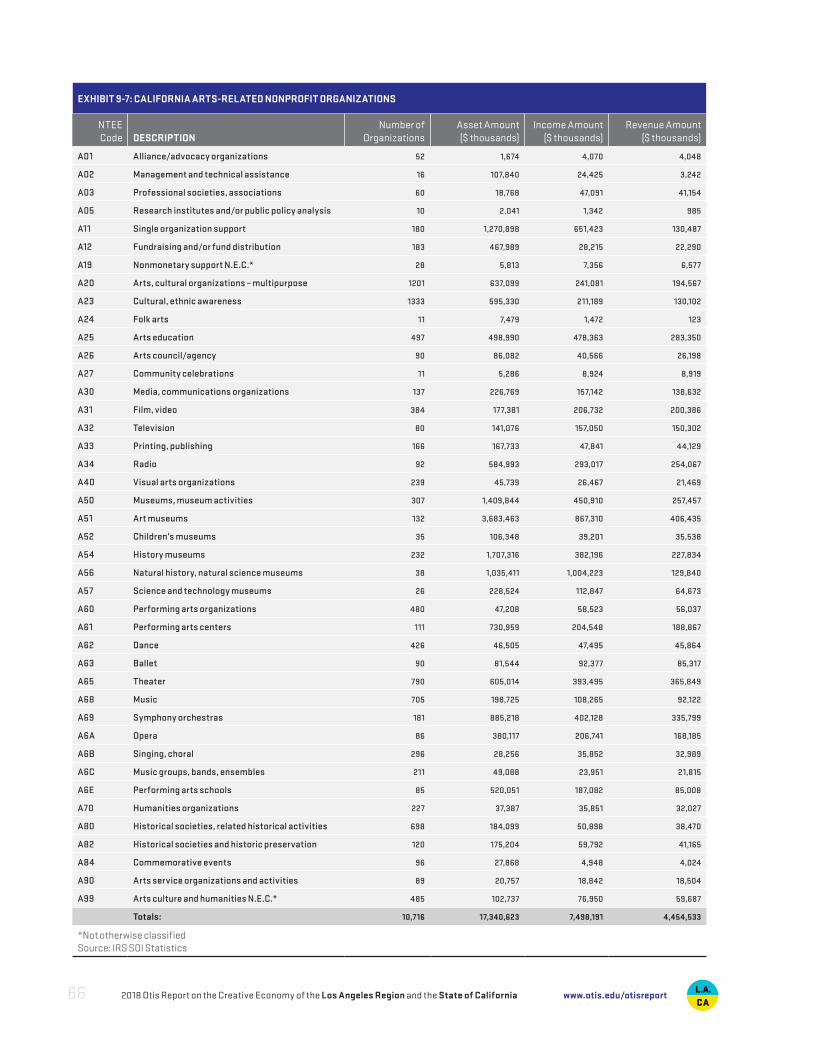
EXHIBIT 9-7: CALIFORNIA ARTS-RELATED NONPROFIT ORGANIZATIONS
NTEE Code DESCRIPTION
Number of Organizations
Asset Amount($ thousands)
Income Amount ($ thousands)
Revenue Amount ($ thousands)
A01 Alliance/advocacy organizations 52 1,674 4,070 4,048
A02 Management and technical assistance 16 107,840 24,425 3,242
A03 Professional societies, associations 60 18,768 47,091 41,154
A05 Research institutes and/or public policy analysis 10 2,041 1,342 985
A11 Single organization support 180 1,270,898 651,423 130,487
A12 Fundraising and/or fund distribution 183 467,989 28,215 22,290
A19 Nonmonetary support N.E.C.* 28 5,813 7,356 6,577
A20 Arts, cultural organizations – multipurpose 1201 637,099 241,081 194,567
A23 Cultural, ethnic awareness 1333 595,330 211,189 130,102
A24 Folk arts 11 7,479 1,472 123
A25 Arts education 497 498,990 478,363 283,350
A26 Arts council/agency 90 86,082 40,566 26,198
A27 Community celebrations 11 5,286 8,924 8,919
A30 Media, communications organizations 137 226,769 157,142 138,632
A31 Film, video 384 177,381 206,732 200,386
A32 Television 80 141,076 157,050 150,302
A33 Printing, publishing 166 167,733 47,841 44,129
A34 Radio 92 584,993 293,017 254,067
A40 Visual arts organizations 239 45,739 26,467 21,469
A50 Museums, museum activities 307 1,409,844 450,910 257,457
A51 Art museums 132 3,683,463 867,310 406,435
A52 Children’s museums 35 106,348 39,201 35,538
A54 History museums 232 1,707,316 382,196 227,834
A56 Natural history, natural science museums 38 1,035,411 1,004,223 129,840
A57 Science and technology museums 26 228,524 112,847 64,673
A60 Performing arts organizations 480 47,208 58,523 56,037
A61 Performing arts centers 111 730,959 204,548 188,867
A62 Dance 426 46,505 47,495 45,864
A63 Ballet 90 81,544 92,377 85,317
A65 Theater 790 605,014 393,495 365,849
A68 Music 705 198,725 108,265 92,122
A69 Symphony orchestras 181 885,218 402,128 335,799
A6A Opera 86 380,117 206,741 168,185
A6B Singing, choral 296 28,256 35,852 32,989
A6C Music groups, bands, ensembles 211 49,088 23,951 21,815
A6E Performing arts schools 85 520,051 187,082 85,008
A70 Humanities organizations 227 37,387 35,851 32,027
A80 Historical societies, related historical activities 698 184,099 50,898 38,470
A82 Historical societies and historic preservation 120 175,204 59,792 41,165
A84 Commemorative events 96 27,868 4,948 4,024
A90 Arts service organizations and activities 89 20,757 18,842 18,504
A99 Arts culture and humanities N.E.C.* 485 102,737 76,950 59,687
Totals: 10,716 17,340,623 7,498,191 4,454,533
*Not otherwise classifiedSource: IRS SOI Statistics
2018 Otis Report on the Creative Economy of the Los Angeles Region and the State of California66 www.otis.edu/otisreport
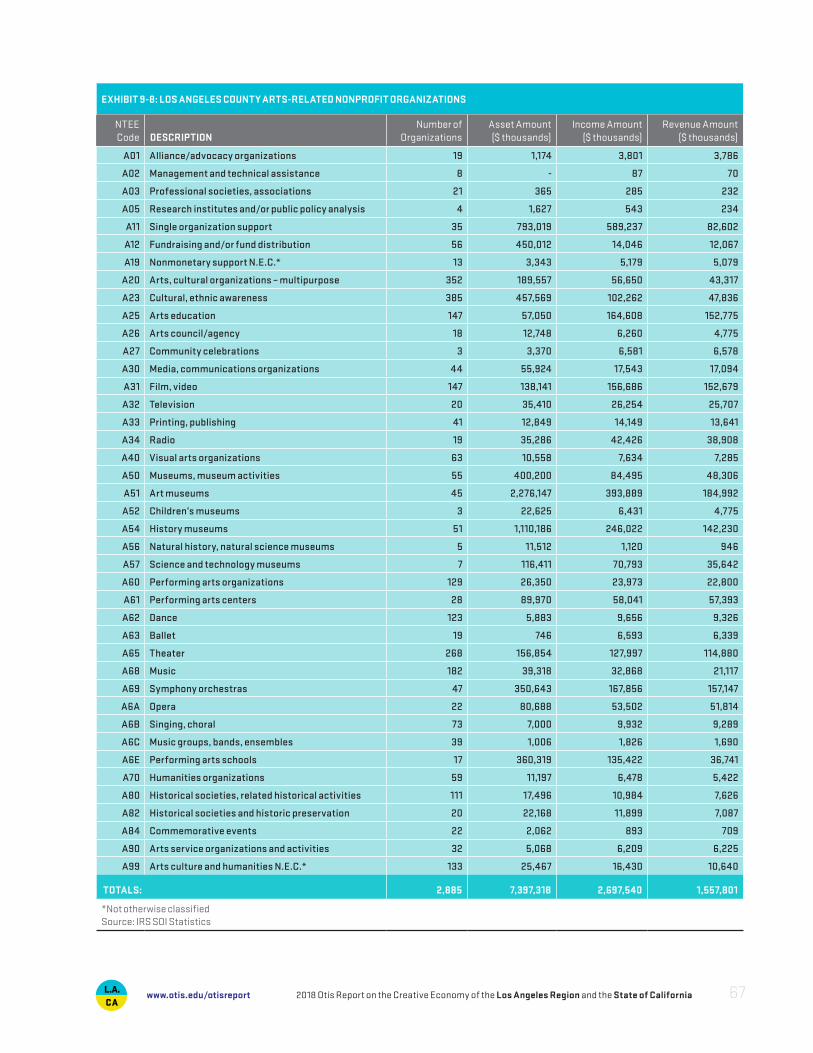
EXHIBIT 9-8: LOS ANGELES COUNTY ARTS-RELATED NONPROFIT ORGANIZATIONS
NTEE Code DESCRIPTION
Number of Organizations
Asset Amount($ thousands)
Income Amount ($ thousands)
Revenue Amount ($ thousands)
A01 Alliance/advocacy organizations 19 1,174 3,801 3,786
A02 Management and technical assistance 8 - 87 70
A03 Professional societies, associations 21 365 285 232
A05 Research institutes and/or public policy analysis 4 1,627 543 234
A11 Single organization support 35 793,019 589,237 82,602
A12 Fundraising and/or fund distribution 56 450,012 14,046 12,067
A19 Nonmonetary support N.E.C.* 13 3,343 5,179 5,079
A20 Arts, cultural organizations – multipurpose 352 189,557 56,650 43,317
A23 Cultural, ethnic awareness 385 457,569 102,262 47,836
A25 Arts education 147 57,050 164,608 152,775
A26 Arts council/agency 18 12,748 6,260 4,775
A27 Community celebrations 3 3,370 6,581 6,578
A30 Media, communications organizations 44 55,924 17,543 17,094
A31 Film, video 147 138,141 156,686 152,679
A32 Television 20 35,410 26,254 25,707
A33 Printing, publishing 41 12,849 14,149 13,641
A34 Radio 19 35,286 42,426 38,908
A40 Visual arts organizations 63 10,558 7,634 7,285
A50 Museums, museum activities 55 400,200 84,495 48,306
A51 Art museums 45 2,276,147 393,889 184,992
A52 Children’s museums 3 22,625 6,431 4,775
A54 History museums 51 1,110,186 246,022 142,230
A56 Natural history, natural science museums 5 11,512 1,120 946
A57 Science and technology museums 7 116,411 70,793 35,642
A60 Performing arts organizations 129 26,350 23,973 22,800
A61 Performing arts centers 28 89,970 58,041 57,393
A62 Dance 123 5,883 9,656 9,326
A63 Ballet 19 746 6,593 6,339
A65 Theater 268 156,854 127,997 114,880
A68 Music 182 39,318 32,868 21,117
A69 Symphony orchestras 47 350,643 167,856 157,147
A6A Opera 22 80,688 53,502 51,814
A6B Singing, choral 73 7,000 9,932 9,289
A6C Music groups, bands, ensembles 39 1,006 1,826 1,690
A6E Performing arts schools 17 360,319 135,422 36,741
A70 Humanities organizations 59 11,197 6,478 5,422
A80 Historical societies, related historical activities 111 17,496 10,984 7,626
A82 Historical societies and historic preservation 20 22,168 11,899 7,087
A84 Commemorative events 22 2,062 893 709
A90 Arts service organizations and activities 32 5,068 6,209 6,225
A99 Arts culture and humanities N.E.C.* 133 25,467 16,430 10,640
TOTALS: 2,885 7,397,318 2,697,540 1,557,801
*Not otherwise classifiedSource: IRS SOI Statistics
2018 Otis Report on the Creative Economy of the Los Angeles Region and the State of California 67www.otis.edu/otisreport
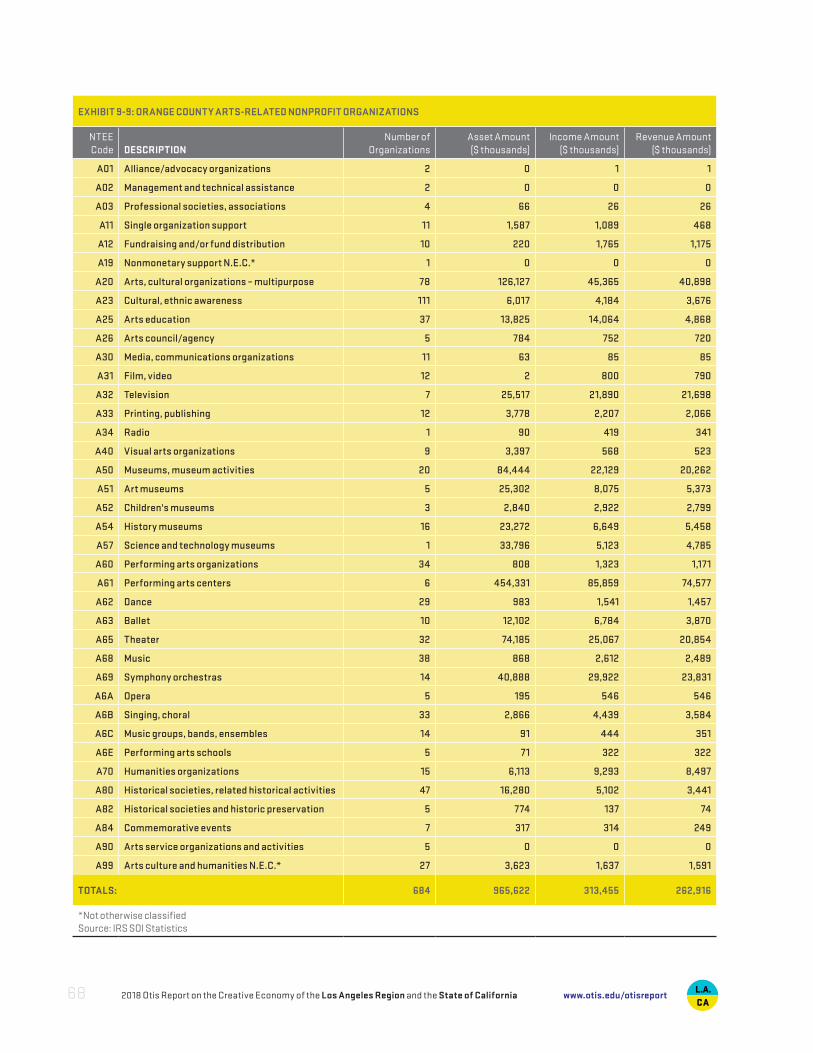
EXHIBIT 9-9: ORANGE COUNTY ARTS-RELATED NONPROFIT ORGANIZATIONS
NTEE Code DESCRIPTION
Number of Organizations
Asset Amount($ thousands)
Income Amount ($ thousands)
Revenue Amount ($ thousands)
A01 Alliance/advocacy organizations 2 0 1 1
A02 Management and technical assistance 2 0 0 0
A03 Professional societies, associations 4 66 26 26
A11 Single organization support 11 1,587 1,089 468
A12 Fundraising and/or fund distribution 10 220 1,765 1,175
A19 Nonmonetary support N.E.C.* 1 0 0 0
A20 Arts, cultural organizations – multipurpose 78 126,127 45,365 40,898
A23 Cultural, ethnic awareness 111 6,017 4,184 3,676
A25 Arts education 37 13,825 14,064 4,868
A26 Arts council/agency 5 784 752 720
A30 Media, communications organizations 11 63 85 85
A31 Film, video 12 2 800 790
A32 Television 7 25,517 21,890 21,698
A33 Printing, publishing 12 3,778 2,207 2,066
A34 Radio 1 90 419 341
A40 Visual arts organizations 9 3,397 568 523
A50 Museums, museum activities 20 84,444 22,129 20,262
A51 Art museums 5 25,302 8,075 5,373
A52 Children's museums 3 2,840 2,922 2,799
A54 History museums 16 23,272 6,649 5,458
A57 Science and technology museums 1 33,796 5,123 4,785
A60 Performing arts organizations 34 808 1,323 1,171
A61 Performing arts centers 6 454,331 85,859 74,577
A62 Dance 29 983 1,541 1,457
A63 Ballet 10 12,102 6,784 3,870
A65 Theater 32 74,185 25,067 20,854
A68 Music 38 868 2,612 2,489
A69 Symphony orchestras 14 40,888 29,922 23,831
A6A Opera 5 195 546 546
A6B Singing, choral 33 2,866 4,439 3,584
A6C Music groups, bands, ensembles 14 91 444 351
A6E Performing arts schools 5 71 322 322
A70 Humanities organizations 15 6,113 9,293 8,497
A80 Historical societies, related historical activities 47 16,280 5,102 3,441
A82 Historical societies and historic preservation 5 774 137 74
A84 Commemorative events 7 317 314 249
A90 Arts service organizations and activities 5 0 0 0
A99 Arts culture and humanities N.E.C.* 27 3,623 1,637 1,591
TOTALS: 684 965,622 313,455 262,916
*Not otherwise classifiedSource: IRS SOI Statistics
2018 Otis Report on the Creative Economy of the Los Angeles Region and the State of California68 www.otis.edu/otisreport
Education in the arts is a necessary part of preparing students to meet the de-mands of the twenty-first century workplace. Decades of research show strong and consistent links (although research has not yet established causal proof) between high-quality arts education and a wide range of impressive educational outcomes. Among these are increased student engagement, improved attendance, focused attention, heightened educational aspirations, and development of habits of mind such problem solving, critical and creative thinking, dealing with complexity, and integration of multiple skill sets. The arts are also linked to the development of social competencies including collaboration and team work skills, social tolerance, and self-confidence.3
The California Department of Education tracks student enrollment in course subject areas. These data provide a count of students enrolled in arts-related courses in K–12 schools from year-to-year and the number of classes that meet UC/CSU entrance requirements but does not provide information pertaining to outcomes or the level of arts integration in California schools. The data are also limited in that they were collected on a single day in the fall of the academic year. Courses that are only offered later in the year are not included. Also, course enrollment totals may duplicate counts of students (a single student may be enrolled in more than one creative course and should not be mistaken as an official enrollment figure.)
ARTS EDUCATION
10
3Reinvesting in Arts Education, President’s Committee on the Arts and Humanities (May 2011).
2018 Otis Report on the Creative Economy of the Los Angeles Region and the State of California 69www.otis.edu/otisreport
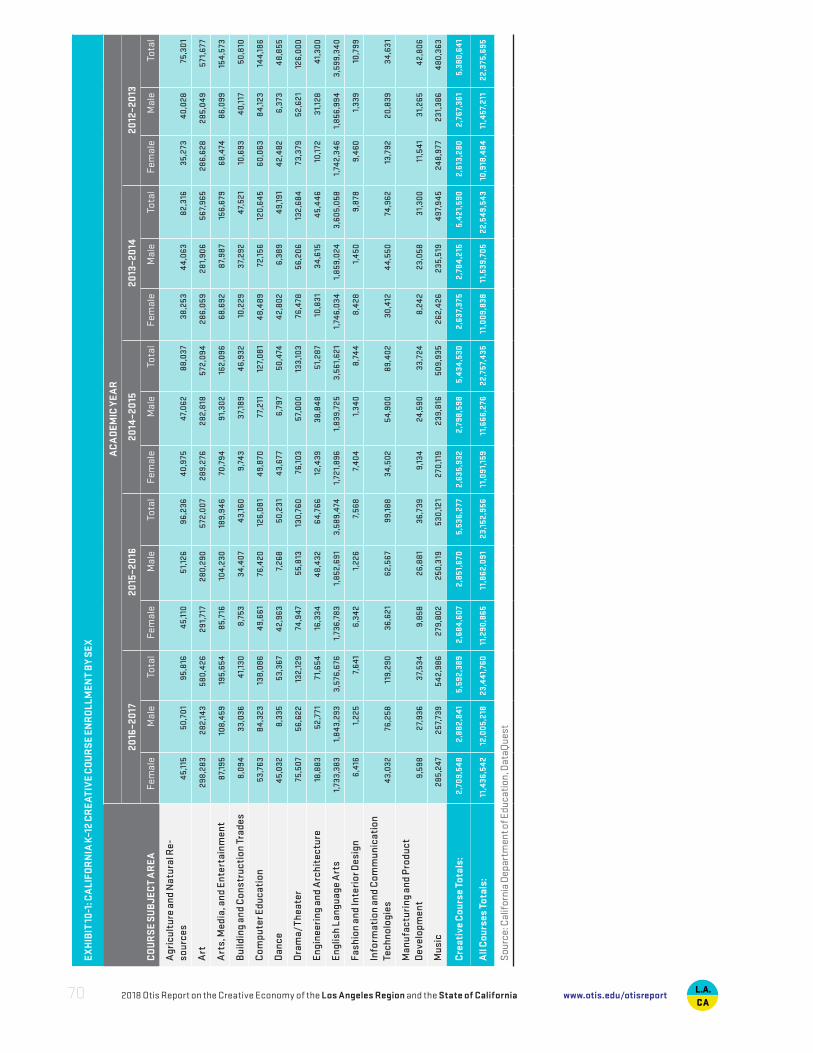
EX
HIB
IT 10
-1: C
ALI
FOR
NIA
K–1
2 C
RE
ATI
VE
CO
UR
SE
ENR
OLL
MEN
T B
Y S
EX
AC
AD
EMIC
YE
AR
CO
UR
SE
SU
BJE
CT
AR
EA
2016
–20
1720
15–2
016
2014
–20
1520
13–2
014
2012
–20
13
Fem
ale
Mal
eTo
tal
Fem
ale
Mal
eTo
tal
Fem
ale
Mal
eTo
tal
Fem
ale
Mal
eTo
tal
Fem
ale
Mal
eTo
tal
Agr
icul
ture
and
Nat
ural
Re-
sour
ces
45,
115
50,
701
95,
816
4
5,11
0 5
1,12
6 9
6,23
6 4
0,9
75
47,
062
88,
037
3
8,25
3 4
4,06
3 8
2,31
6 3
5,27
3 4
0,02
8 7
5,30
1
Art
298
,28
3 2
82,1
43
580
,426
2
91,
717
280
,290
5
72,0
07
289
,276
2
82,8
18
572
,09
4 2
86,0
59
28
1,90
6 5
67,
965
286
,628
2
85,0
49
571
,677
Art
s, M
edia
, and
Ent
erta
inm
ent
87,
195
108,
459
19
5,65
4 8
5,71
6 10
4,23
0 18
9,9
46
70,
794
91,
302
162,
096
68,
692
87,
987
156,
679
6
8,47
4 8
6,09
9 15
4,57
3
Bui
ldin
g an
d C
onst
ruct
ion
Trad
es 8
,09
4 3
3,0
36
41,
130
8,7
53
34,
40
7 4
3,16
0 9
,74
3 3
7,18
9 4
6,93
2 10
,229
3
7,29
2 4
7,52
1 10
,693
4
0,11
7 5
0,8
10
Com
pute
r Edu
cati
on 5
3,76
3 8
4,32
3 13
8,08
6 4
9,66
1 7
6,4
20
126,
081
49,
870
7
7,21
1 12
7,08
1 4
8,4
89
72,
156
120,
64
5 6
0,06
3 8
4,12
3 14
4,18
6
Dan
ce 4
5,0
32
8,3
35
53,
367
42,
963
7,26
8 5
0,23
1 4
3,6
77
6,7
97
50,
474
42,
802
6,3
89
49,
191
42,
482
6
,373
4
8,85
5
Dra
ma/
Thea
ter
75,
507
56,
622
132,
129
74,
947
5
5,8
13
130,
760
76,
103
57,
000
133,
103
76,
478
56,
206
132,
684
73,
379
52,
621
126,
000
Engi
neer
ing
and
Arc
hite
ctur
e 18
,88
3 5
2,77
1 7
1,65
4 16
,334
4
8,4
32
64,
766
12,4
39
38,
84
8 5
1,28
7 10
,831
3
4,6
15
45,
44
6 10
,172
3
1,12
8 4
1,30
0
Engl
ish
Lang
uage
Art
s 1,
733,
383
1,8
43,
293
3,5
76,6
76
1,73
6,78
3 1,
852,
691
3,5
89,4
74
1,72
1,89
6 1,
839
,725
3
,56
1,62
1 1,
746,
034
1,
859,
024
3,6
05,0
58
1,74
2,34
6 1,
856,
994
3,5
99,3
40
Fash
ion
and
Inte
rior
Des
ign
6,4
16
1,22
5 7,
641
6
,34
2 1,
226
7,56
8 7,
40
4 1,
340
8,7
44
8,4
28
1,4
50
9,8
78
9,4
60
1,33
9 10
,799
Info
rmat
ion
and
Com
mun
icat
ion
Tech
nolo
gies
43,
032
7
6,25
8 11
9,29
0 3
6,62
1 6
2,56
7 9
9,18
8 3
4,50
2 5
4,90
0 8
9,4
02
30,
412
44,
550
74,
962
13,7
92
20,
839
3
4,63
1
Man
ufac
turi
ng a
nd P
rodu
ct
Dev
elop
men
t 9
,598
2
7,93
6 3
7,53
4 9
,858
2
6,88
1 3
6,73
9 9
,134
2
4,59
0 3
3,72
4 8
,24
2 2
3,05
8 3
1,30
0 11
,541
3
1,26
5 4
2,80
6
Mus
ic 2
85,2
47
257
,739
5
42,
986
279
,802
2
50,3
19
530
,121
2
70,1
19
239
,816
5
09,9
35
262
,426
2
35,5
19
49
7,9
45
24
8,9
77
231
,386
4
80,3
63
Cre
ativ
e C
ours
e To
tals
: 2
,709
,548
2
,882
,841
5
,592
,389
2
,68
4,60
7 2
,851
,670
5
,536
,277
2,
635,
932
2,7
98,5
98
5,4
34,5
30
2,6
37,3
75
2,7
84,
215
5,4
21,5
90
2,6
13,2
80
2,7
67,
361
5,3
80,6
41
All
Cou
rses
Tot
als:
11,4
36,5
42
12,0
05,2
18
23,4
41,7
60
11,2
90,8
65
11,8
62,0
91
23,
152,
956
11,0
91,
159
11,
666,
276
22,7
57,4
35
11,0
09,8
38
11,5
39,7
05
22,5
49,5
43
10,9
18,4
84
11,4
57,2
11
22,
375,
695
Sour
ce: C
alif
orni
a D
epar
tmen
t of E
duca
tion,
Dat
aQue
st
2018 Otis Report on the Creative Economy of the Los Angeles Region and the State of California70 www.otis.edu/otisreport

EX
HIB
IT 10
-2: C
ALI
FOR
NIA
K–1
2 C
RE
ATI
VE
CO
UR
SES
MEE
TIN
G U
C/C
SU
REQ
UIR
EMEN
TS
A
CA
DEM
IC Y
EA
R
CO
UR
SE
SU
BJE
CT
AR
EA
2016
–20
1720
15–2
016
2014
–20
1520
13–2
014
2012
–20
13
#C
lass
es
Cla
sses
M
eeti
ng
UC
/CS
U
Req
uire
men
ts#
Cla
sses
Cla
sses
M
eeti
ng
UC
/CS
U
Req
uire
men
ts#
Cla
sses
Cla
sses
M
eeti
ng
UC
/CS
U
Req
uire
men
ts#
Cla
sses
Cla
sses
M
eeti
ng
UC
/CS
U
Req
uire
men
ts#
Cla
sses
Cla
sses
M
eeti
ng
UC
/CS
U
Req
uire
men
ts
Agr
icul
ture
and
Nat
ural
Res
ourc
es 4
,80
3 1,
975
4
,714
1,
857
4,1
76
1,51
9 4
,015
1,
342
3,6
95
1,16
4
Art
30,
599
18,9
11
28,
771
17,7
35
28,
466
17
,722
2
8,35
2 17
,499
2
8,33
8 16
,818
Art
s, M
edia
, and
Ent
erta
inm
ent
8,8
25
5,6
96
8,5
85
4,9
29
7,06
8 3
,828
6
,680
3
,360
6
,552
3
,232
Bui
ldin
g an
d C
onst
ruct
ion
Trad
es 2
,347
13
8 2
,375
4
4 2
,385
16
2
,317
14
2
,50
3 2
1
Com
pute
r Edu
cati
on 6
,473
1,
275
6,1
65
941
6
,214
8
05
5,6
92
558
6
,74
4 5
91
Dan
ce 2
,295
1,
307
2,0
06
1,19
8 2
,038
1,
175
1,98
8 1,
081
1,95
4 1,
102
Dra
ma/
Thea
ter
6,1
03
3,4
64
6,0
49
3,6
11
5,8
16
3,3
36
5,5
07
3,1
69
5,2
41
3,0
17
Engi
neer
ing
and
Arc
hite
ctur
e 3
,04
9 1,
712
2,9
10
1,41
9 2
,171
1,
008
1,9
49
796
1,
868
571
Engl
ish
Lang
uage
Art
s 18
7,0
75
88,
561
176,
357
80,
534
175,
798
77,
932
175,
44
2 7
6,85
7 17
5,57
1 7
6,90
0
Fash
ion
and
Inte
rior
Des
ign
700
11
7 7
56
94
731
6
0 7
57
61
74
0 6
0
Info
rmat
ion
and
Com
mun
icat
ion
Tech
nolo
gies
6,4
47
1,57
6 5
,186
9
55
4,3
48
611
3
,64
3 3
62
1,66
4 17
1
Man
ufac
turi
ng a
nd P
rodu
ct D
evel
opm
ent
1,92
8 2
58
1,85
7 2
03
1,69
9 10
0 1,
531
84
2,0
62
24
4
Mus
ic 2
0,00
9 7,
361
19,2
46
7,13
4 18
,586
6
,789
17
,641
6
,423
17
,358
6
,44
6
Cre
ativ
e C
ours
e To
tals
: 2
80,6
53
132,
351
26
4,9
77
120,
654
259
,496
1
14,9
01
255
,514
11
1,60
6 2
54,2
90
110
,337
All
Cou
rses
Tot
als:
1,15
0,27
1 3
73,3
66
1,0
76,4
79
345
,66
4 1,
056,
050
332
,392
1,
028,
919
3
24,5
09
1,02
4,90
6 3
22,1
91
Sour
ce: C
alif
orni
a D
epar
tmen
t of E
duca
tion,
Dat
aQue
st
2018 Otis Report on the Creative Economy of the Los Angeles Region and the State of California 71www.otis.edu/otisreport
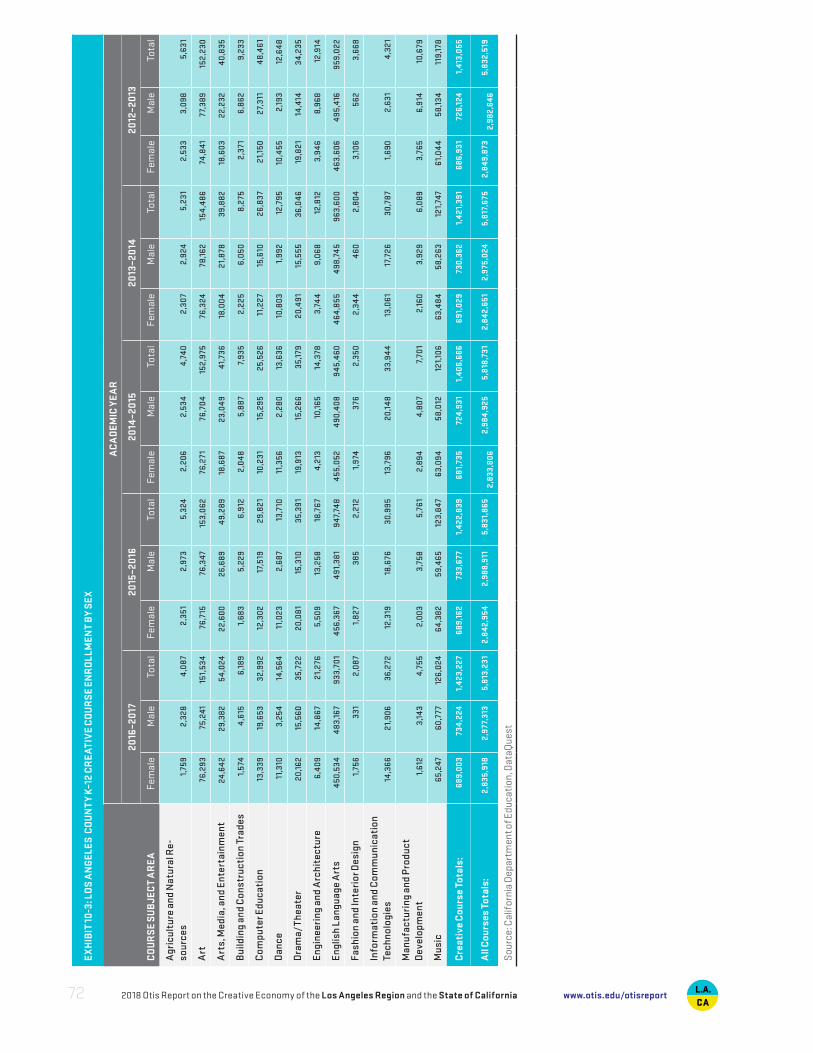
EX
HIB
IT 10
-3: L
OS
AN
GEL
ES C
OU
NT
Y K–
12 C
RE
ATI
VE
CO
UR
SE
ENR
OLL
MEN
T B
Y S
EX
AC
AD
EMIC
YE
AR
CO
UR
SE
SU
BJE
CT
AR
EA
2016
–20
1720
15–2
016
2014
–20
1520
13–2
014
2012
–20
13
Fem
ale
Mal
eTo
tal
Fem
ale
Mal
eTo
tal
Fem
ale
Mal
eTo
tal
Fem
ale
Mal
eTo
tal
Fem
ale
Mal
eTo
tal
Agr
icul
ture
and
Nat
ural
Re-
sour
ces
1,75
9 2
,328
4
,08
7 2
,351
2
,973
5
,324
2
,206
2
,534
4
,74
0 2
,30
7 2
,924
5
,231
2
,533
3
,098
5
,631
Art
76,
293
75,
241
151,
534
76,
715
76,
347
153,
062
76,
271
76,
704
152,
975
7
6,32
4 7
8,16
2 15
4,4
86
74,
841
7
7,38
9 15
2,23
0
Art
s, M
edia
, and
Ent
erta
inm
ent
24,
64
2 2
9,38
2 5
4,02
4 2
2,60
0 2
6,68
9 4
9,28
9 18
,68
7 2
3,0
49
41,
736
18,0
04
21,
878
3
9,88
2 18
,60
3 2
2,23
2 4
0,8
35
Bui
ldin
g an
d C
onst
ruct
ion
Trad
es 1,
574
4,6
15
6,1
89
1,68
3 5
,229
6
,912
2
,04
8 5
,88
7 7,
935
2,2
25
6,0
50
8,2
75
2,3
71
6,8
62
9,2
33
Com
pute
r Edu
cati
on 13
,339
19
,653
3
2,99
2 12
,302
17
,519
2
9,82
1 10
,231
15
,295
2
5,52
6 11
,227
15
,610
2
6,8
37
21,
150
27,
311
48,
46
1
Dan
ce 11
,310
3
,254
14
,56
4 11
,023
2
,68
7 13
,710
11
,356
2
,280
13
,636
10
,80
3 1,
992
12,7
95
10,4
55
2,1
93
12,6
48
Dra
ma/
Thea
ter
20,
162
15,5
60
35,
722
20,
081
15,3
10
35,
391
19,9
13
15,2
66
35,
179
20,
49
1 15
,555
3
6,0
46
19,8
21
14,4
14
34,
235
Engi
neer
ing
and
Arc
hite
ctur
e 6
,409
14
,86
7 2
1,27
6 5
,509
13
,258
18
,76
7 4
,213
10
,165
14
,378
3
,74
4 9
,068
12
,812
3
,94
6 8
,968
12
,914
Engl
ish
Lang
uage
Art
s 4
50,5
34
48
3,16
7 9
33,7
01
456
,36
7 4
91,
381
947
,74
8 4
55,0
52
490
,408
9
45,
460
4
64,
855
498
,74
5 9
63,6
00
463
,606
4
95,4
16
959
,022
Fash
ion
and
Inte
rior
Des
ign
1,75
6 3
31
2,0
87
1,82
7 3
85
2,2
12
1,9
74
376
2
,350
2
,34
4 4
60
2,8
04
3,1
06
562
3
,668
Info
rmat
ion
and
Com
mun
icat
ion
Tech
nolo
gies
14,3
66
21,
906
36,
272
12,3
19
18,6
76
30,
995
13,7
96
20,
148
33,
94
4 13
,06
1 17
,726
3
0,78
7 1,
690
2,6
31
4,3
21
Man
ufac
turi
ng a
nd P
rodu
ct
Dev
elop
men
t 1,
612
3
,14
3 4
,755
2
,00
3 3
,758
5
,76
1 2
,89
4 4
,80
7 7,
701
2,1
60
3,9
29
6,0
89
3,7
65
6,9
14
10,6
79
Mus
ic 6
5,24
7 6
0,77
7 12
6,02
4 6
4,38
2 5
9,4
65
123,
847
6
3,09
4 5
8,0
12
121,
106
63,
48
4 5
8,26
3 12
1,74
7 6
1,0
44
58,
134
119,
178
Cre
ativ
e C
ours
e To
tals
: 6
89,0
03
734
,224
1,
423,
227
689
,162
7
33,6
77
1,42
2,8
39
68
1,73
5 7
24,9
31
1,40
6,66
6 6
91,
029
730
,362
1,
421,
391
686
,931
7
26,1
24
1,41
3,05
5
All
Cou
rses
Tot
als:
2,8
35,9
18
2,9
77,3
13
5,8
13,2
31
2,8
42,9
54
2,9
88,9
11
5,8
31,8
65
2,
833,
806
2,9
84,
925
5,8
18,7
31
2,8
42,6
51
2,9
75,0
24
5,8
17,6
75
2,8
49,8
73
2,
982,
646
5,8
32,5
19
Sour
ce: C
alif
orni
a D
epar
tmen
t of E
duca
tion,
Dat
aQue
st
2018 Otis Report on the Creative Economy of the Los Angeles Region and the State of California72 www.otis.edu/otisreport

EX
HIB
IT 10
-4: L
OS
AN
GEL
ES C
OU
NT
Y K–
12 C
RE
ATI
VE
CO
UR
SES
MEE
TIN
G U
C/C
SU
REQ
UIR
EMEN
TS
A
CA
DEM
IC Y
EA
R
CO
UR
SE
SU
BJE
CT
AR
EA
2016
–20
1720
15–2
016
2014
–20
1520
13–2
014
2012
–20
13
#C
lass
es
Cla
sses
M
eeti
ng
UC
/CS
U
Req
uire
men
ts#
Cla
sses
Cla
sses
M
eeti
ng
UC
/CS
U
Req
uire
men
ts#
Cla
sses
Cla
sses
M
eeti
ng
UC
/CS
U
Req
uire
men
ts#
Cla
sses
Cla
sses
M
eeti
ng
UC
/CS
U
Req
uire
men
ts#
Cla
sses
Cla
sses
M
eeti
ng
UC
/CS
U
Req
uire
men
ts
Agr
icul
ture
and
Nat
ural
Res
ourc
es 2
21
60
251
7
6 2
36
65
260
5
6 2
47
53
Art
8,0
60
5,2
91
7,34
9 5
,002
7,
577
5,1
05
7,37
5 5
,079
7,
136
4,5
73
Art
s, M
edia
, and
Ent
erta
inm
ent
2,2
14
1,4
90
2,1
05
1,23
0 1,
706
888
1,
64
2 7
19
1,6
49
759
Bui
ldin
g an
d C
onst
ruct
ion
Trad
es 3
19
35
352
-
379
-
372
-
40
3 6
Com
pute
r Edu
cati
on 1,
44
6 4
56
1,25
7 3
02
1,14
3 2
08
1,08
1 14
3 2
,106
2
50
Dan
ce 6
18
276
5
25
279
5
12
24
4 4
96
219
4
82
200
Dra
ma/
Thea
ter
1,80
3 1,
147
1,88
1 1,
304
1,58
9 1,
007
1,51
4 9
08
1,36
5 7
83
Engi
neer
ing
and
Arc
hite
ctur
e 8
64
511
8
66
454
5
52
314
4
85
247
4
82
166
Engl
ish
Lang
uage
Art
s 5
2,68
6 2
7,55
1 4
8,62
7 2
5,11
3 5
0,72
4 2
5,35
6 5
0,22
1 2
5,24
1 4
9,27
6 2
5,6
12
Fash
ion
and
Inte
rior
Des
ign
142
24
175
13
138
5
178
4
175
7
Info
rmat
ion
and
Com
mun
icat
ion
Tech
nolo
gies
1,75
6 4
17
1,51
6 3
62
1,54
5 2
73
1,39
3 16
7 16
8 2
6
Man
ufac
turi
ng a
nd P
rodu
ct D
evel
opm
ent
214
6
7 2
38
47
321
2
3 2
57
11
392
4
6
Mus
ic 4
,40
7 1,
811
4
,078
1,
819
4
,027
1,
697
3,9
63
1,65
9 3
,88
3 1,
64
8
Cre
ativ
e C
ours
e To
tals
: 7
4,75
0 3
9,13
6 6
9,22
0 3
6,00
1 7
0,4
49
35,
185
69,
237
34,
453
67,
764
34,
129
All
Cou
rses
Tot
als:
28
1,17
4 10
7,70
1 2
68,4
44
101,
845
2
73,5
83
101,
200
268
,462
9
9,21
3 2
67,
309
97,
694
Sour
ce: C
alif
orni
a D
epar
tmen
t of E
duca
tion,
Dat
aQue
st
2018 Otis Report on the Creative Economy of the Los Angeles Region and the State of California 73www.otis.edu/otisreport
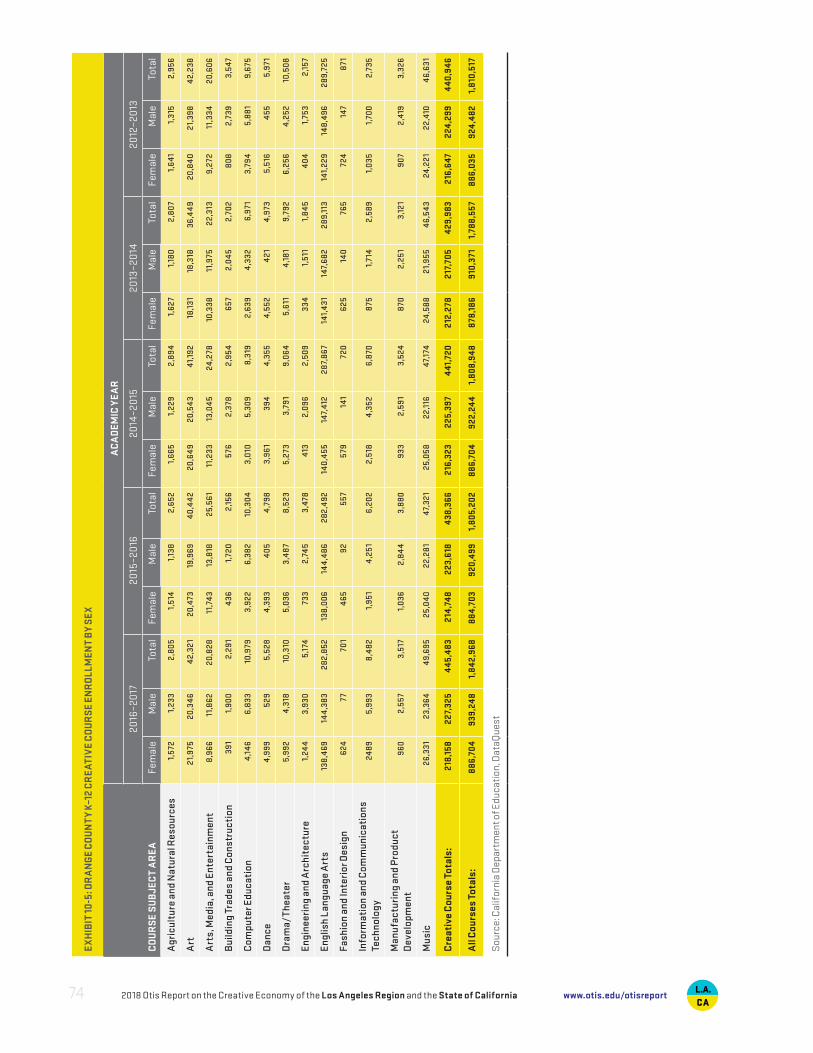
EX
HIB
IT 10
-5: O
RA
NG
E C
OU
NT
Y K–
12 C
RE
ATI
VE
CO
UR
SE
ENR
OLL
MEN
T B
Y S
EX
A
CA
DEM
IC Y
EA
R
CO
UR
SE
SU
BJE
CT
AR
EA
2016
–20
1720
15–2
016
2014
–20
1520
13–2
014
2012
–20
13
Fem
ale
Mal
eTo
tal
Fem
ale
Mal
eTo
tal
Fem
ale
Mal
eTo
tal
Fem
ale
Mal
eTo
tal
Fem
ale
Mal
eTo
tal
Agr
icul
ture
and
Nat
ural
Res
ourc
es1,
572
1,23
32,
805
1,51
4 1,
138
2,6
52
1,66
5 1,
229
2,8
94
1,62
7 1,
180
2,8
07
1,6
41
1,31
5 2
,956
Art
21,9
7520
,34
64
2,32
1 2
0,47
3 19
,969
4
0,4
42
20,
64
9 2
0,54
3 4
1,19
2 18
,131
18
,318
3
6,4
49
20,
84
0 2
1,39
8 4
2,23
8
Art
s, M
edia
, and
Ent
erta
inm
ent
8,96
611
,862
20,8
28 11
,74
3 13
,818
2
5,56
1 11
,233
13
,04
5 2
4,27
8 10
,338
11
,975
2
2,31
3 9
,272
11
,334
2
0,60
6
Bui
ldin
g Tr
ades
and
Con
stru
ctio
n39
11,
900
2,29
1 4
36
1,72
0 2
,156
5
76
2,3
78
2,9
54
657
2
,04
5 2
,702
8
08
2,7
39
3,5
47
Com
pute
r Edu
cati
on4,
146
6,8
3310
,979
3,9
22
6,3
82
10,3
04
3,0
10
5,3
09
8,3
19
2,6
39
4,3
32
6,9
71
3,7
94
5,8
81
9,6
75
Dan
ce4,
999
529
5,52
8 4
,393
4
05
4,7
98
3,9
61
39
4 4
,355
4
,552
4
21
4,9
73
5,5
16
455
5
,971
Dra
ma/
Thea
ter
5,99
24,
318
10,3
10 5
,036
3
,48
7 8
,523
5
,273
3
,79
1 9
,06
4 5
,611
4
,18
1 9
,792
6
,256
4
,252
10
,508
Engi
neer
ing
and
Arc
hite
ctur
e1,
244
3,93
05,
174
733
2
,74
5 3
,478
4
13
2,0
96
2,5
09
334
1,
511
1,8
45
40
4 1,
753
2,1
57
Engl
ish
Lang
uage
Art
s13
8,4
6914
4,38
328
2,85
2 13
8,00
6 14
4,4
86
282
,492
14
0,4
55
147,
412
28
7,86
7 14
1,4
31
147,
682
289
,113
14
1,22
9 14
8,4
96
289
,725
Fash
ion
and
Inte
rior
Des
ign
624
7770
1 4
65
92
557
5
79
141
720
6
25
140
765
7
24
147
871
Info
rmat
ion
and
Com
mun
icat
ions
Te
chno
logy
2489
5,99
38,
482
1,95
1 4
,251
6
,202
2
,518
4
,352
6
,870
8
75
1,71
4 2
,589
1,
035
1,
700
2,7
35
Man
ufac
turi
ng a
nd P
rodu
ct
Dev
elop
men
t96
02,
557
3,51
7 1,
036
2
,84
4 3
,880
9
33
2,5
91
3,5
24
870
2
,251
3
,121
9
07
2,4
19
3,3
26
Mus
ic 2
6,33
1 2
3,36
4 4
9,69
5 2
5,0
40
22,
281
47,
321
25,
058
22,
116
47,
174
24,
588
21,
955
46,
543
24,
221
22,
410
46,
631
Cre
ativ
e C
ours
e To
tals
: 2
18,1
58
227
,325
4
45,4
83
214
,748
2
23,6
18
438
,366
2
16,3
23
225
,39
7 4
41,7
20
212
,278
2
17,7
05
429
,983
2
16,6
47
224
,299
4
40,9
46
All
Cou
rses
Tot
als:
886,
704
939
,248
1,
842
,968
8
84,
703
920
,499
1,
805,
202
886,
704
922,
244
1,80
8,9
488
78,1
869
10,3
711,
788,
557
886
,035
9
24,4
82
1,8
10,5
17
Sour
ce: C
alif
orni
a D
epar
tmen
t of E
duca
tion,
Dat
aQue
st
2018 Otis Report on the Creative Economy of the Los Angeles Region and the State of California74 www.otis.edu/otisreport
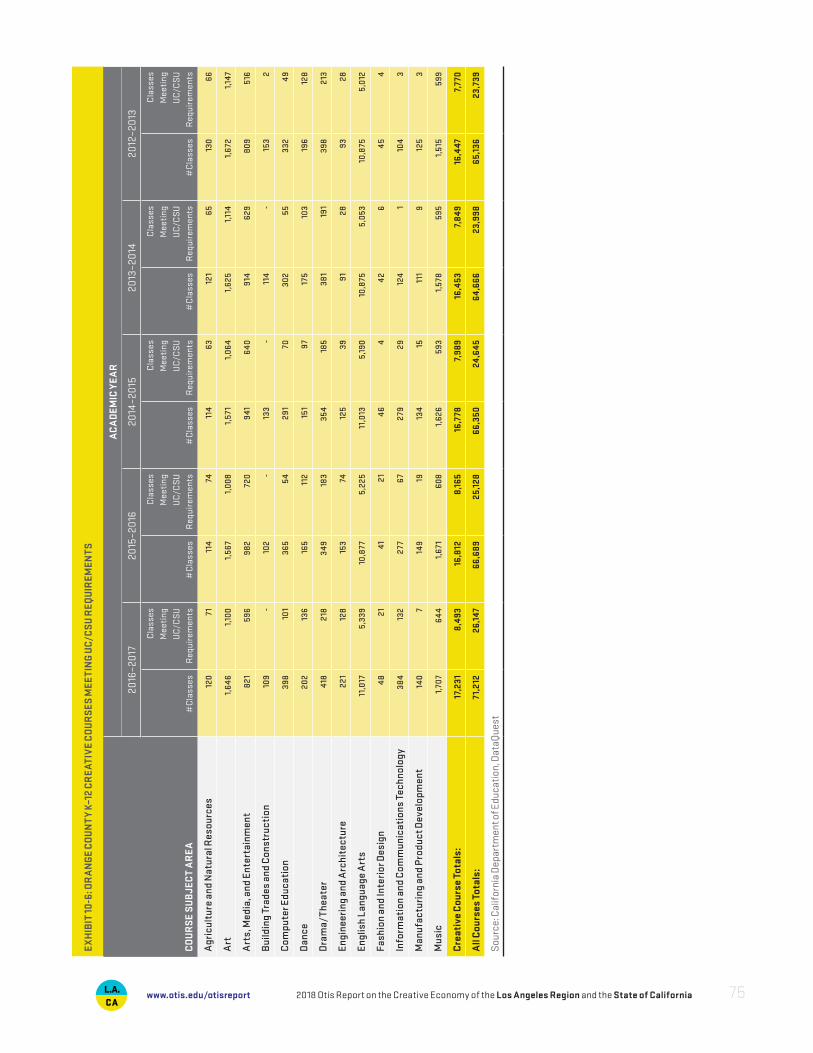
EX
HIB
IT 10
-6: O
RA
NG
E C
OU
NT
Y K–
12 C
RE
ATI
VE
CO
UR
SES
MEE
TIN
G U
C/C
SU
REQ
UIR
EMEN
TS
A
CA
DEM
IC Y
EA
R
CO
UR
SE
SU
BJE
CT
AR
EA
2016
–20
1720
15–2
016
2014
–20
1520
13–2
014
2012
–20
13
#C
lass
es
Cla
sses
M
eeti
ng
UC
/CS
U
Req
uire
men
ts#
Cla
sses
Cla
sses
M
eeti
ng
UC
/CS
U
Req
uire
men
ts#
Cla
sses
Cla
sses
M
eeti
ng
UC
/CS
U
Req
uire
men
ts#
Cla
sses
Cla
sses
M
eeti
ng
UC
/CS
U
Req
uire
men
ts#
Cla
sses
Cla
sses
M
eeti
ng
UC
/CS
U
Req
uire
men
ts
Agr
icul
ture
and
Nat
ural
Res
ourc
es12
0 71
11
4 74
11
4 63
12
1 65
13
0 66
Art
1,6
46
1,10
0 1,
567
1,00
8 1,
571
1,06
4 1,
625
1,11
4 1,
672
1,
147
Art
s, M
edia
, and
Ent
erta
inm
ent
821
596
982
720
941
6
40
914
62
9 80
9 51
6
Bui
ldin
g Tr
ades
and
Con
stru
ctio
n10
9 -
102
- 13
3 -
114
- 15
3 2
Com
pute
r Edu
cati
on39
8 10
1 36
5 54
29
1 70
30
2 55
33
2 4
9
Dan
ce20
2 13
6 16
5 11
2 15
1 9
7 17
5 10
3 19
6 12
8
Dra
ma/
Thea
ter
418
218
349
183
354
185
381
191
398
213
Engi
neer
ing
and
Arc
hite
ctur
e22
1 12
8 15
3 74
12
5 39
9
1 28
93
28
Engl
ish
Lang
uage
Art
s11
,017
5,
339
10,8
77
5,22
5 11
,013
5,
190
10,8
75
5,05
3 10
,875
5,
012
Fash
ion
and
Inte
rior
Des
ign
48
21
41
21
46
4 4
2 6
45
4
Info
rmat
ion
and
Com
mun
icat
ions
Tec
hnol
ogy
384
132
277
67
279
29
124
1 10
4 3
Man
ufac
turi
ng a
nd P
rodu
ct D
evel
opm
ent
140
7 14
9 19
13
4 15
11
1 9
125
3
Mus
ic1,
707
64
4 1,
671
60
8 1,
626
593
1,57
8 59
5 1,
515
599
Cre
ativ
e C
ours
e To
tals
: 17
,231
8
,493
16
,812
8
,165
16
,778
7,
989
16,4
53
7,8
49
16,4
47
7,77
0
All
Cou
rses
Tot
als:
71,
212
26,
147
66,
689
25,
128
66,
350
24,
645
6
4,66
6 2
3,99
8 6
5,13
6 2
3,73
9
Sour
ce: C
alif
orni
a D
epar
tmen
t of E
duca
tion,
Dat
aQue
st
2018 Otis Report on the Creative Economy of the Los Angeles Region and the State of California 75www.otis.edu/otisreport
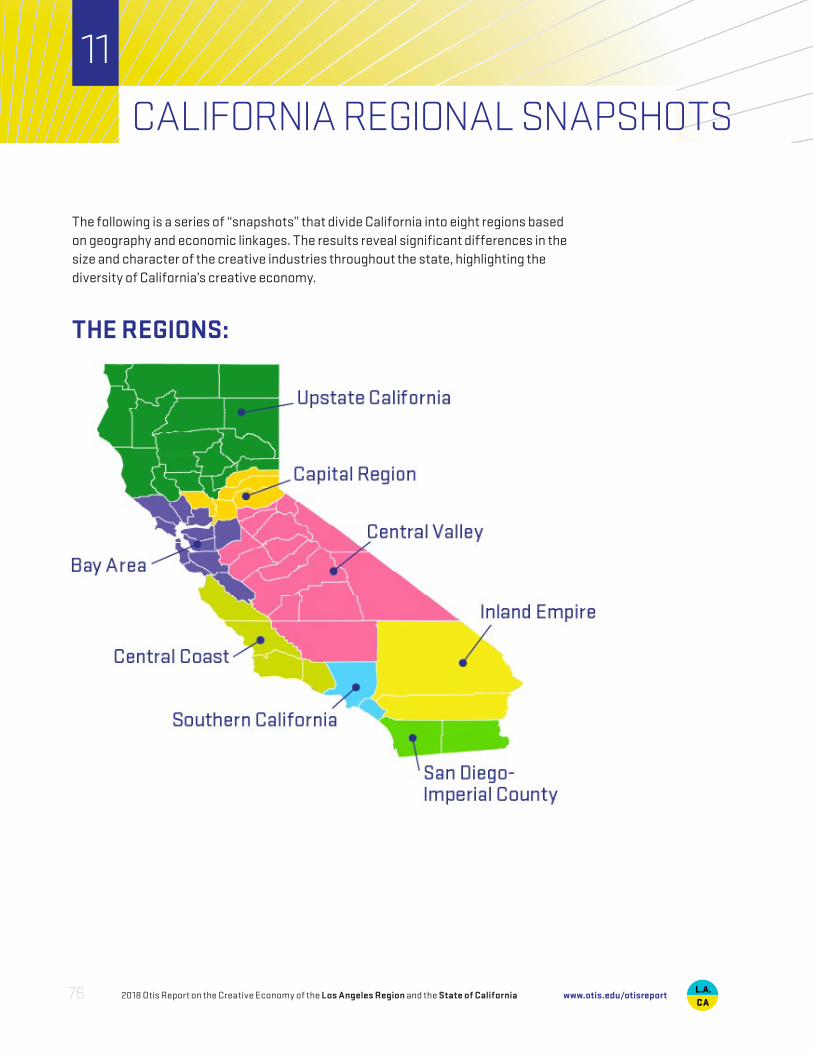
The following is a series of “snapshots” that divide California into eight regions based on geography and economic linkages. The results reveal significant differences in the size and character of the creative industries throughout the state, highlighting the diversity of California’s creative economy.
THE REGIONS:
CALIFORNIA REGIONAL SNAPSHOTS
11
2018 Otis Report on the Creative Economy of the Los Angeles Region and the State of California76 www.otis.edu/otisreport
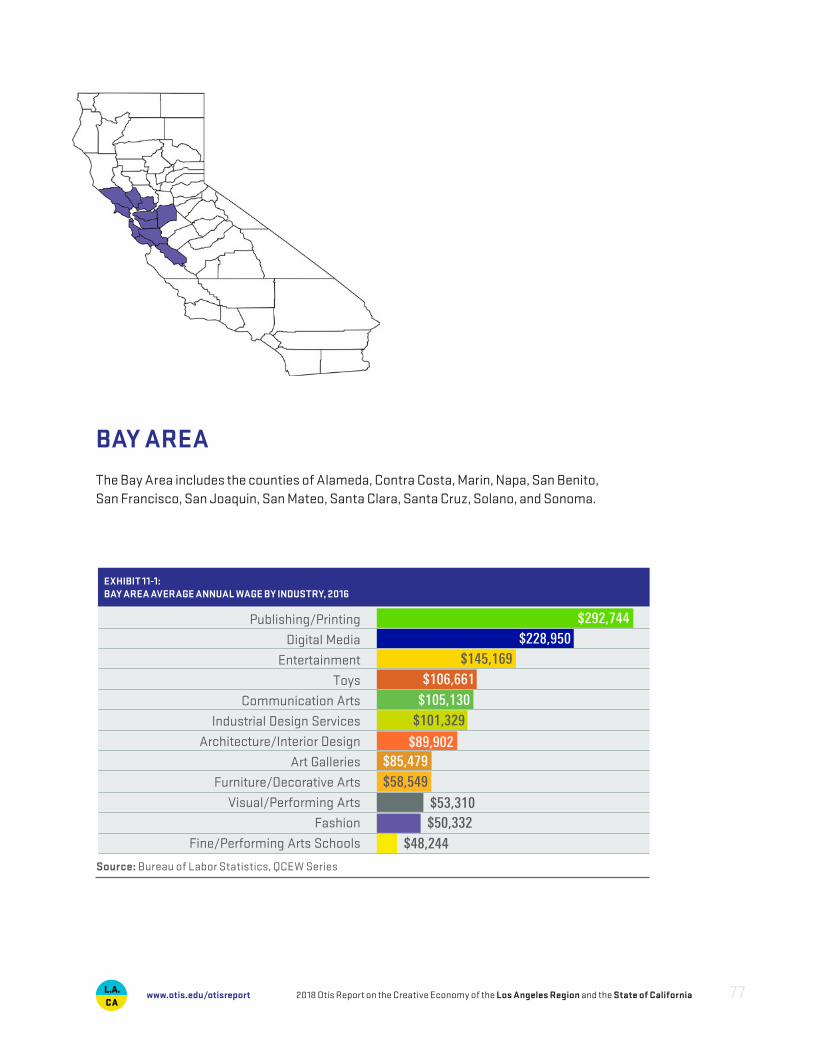
BAY AREAThe Bay Area includes the counties of Alameda, Contra Costa, Marin, Napa, San Benito, San Francisco, San Joaquin, San Mateo, Santa Clara, Santa Cruz, Solano, and Sonoma.
$145,169$228,950
$292,744
$105,130
$89,902
$58,549
$50,332$48,244
$106,661
$101,329
$85,479
$53,310
Publishing/Printing
Digital Media
Entertainment
Toys
Communication Arts
Industrial Design Services
Architecture/Interior Design
Art Galleries
Furniture/Decorative Arts
Visual/Performing Arts
Fashion
Fine/Performing Arts Schools
EXHIBIT 11-1: BAY AREA AVERAGE ANNUAL WAGE BY INDUSTRY, 2016
Source: Bureau of Labor Statistics, QCEW Series
2018 Otis Report on the Creative Economy of the Los Angeles Region and the State of California 77www.otis.edu/otisreport

EXHIBIT 11-2:CHANGE IN JOBS FROM 2011 TO 2016 IN THE BAY AREA, 2016
INDUSTRY SECTOR
NUMBER OF JOBS 2011–2016 CHANGE
2011 2016 Number Percent
Architecture and Interior Design 10,600 14,200 3,600 34.0%
Art Galleries 400 400 0 0.0%
Communication Arts 9,800 11,800 2,000 20.4%
Digital Media 29,000 40,400 11,400 39.3%
Entertainment 7,900 8,600 700 8.9%
Fashion 6,400 7,600 1,200 18.8%
Furniture and Decorative Arts 8,800 13,000 4,200 47.7%
Industrial Design Services 700 600 -100 -14.3%
Publishing and Printing 44,100 83,400 39,300 89.1%
Toys 500 700 200 40.0%
Visual and Performing Arts Providers 8,500 8,600 100 1.2%
Fine and Performing Arts Schools 2,800 3,700 900 32.1%
Totals: 129,500 193,000 63,500 49.0%
EXHIBIT 11-3:BAY AREA NONEMPLOYER FIRMS, 2015
INDUSTRY SECTOR
FIRMS
REVENUE
($ THOUSANDS)
Architecture and Interior Design 5,277 315,548
Art Galleries 727 57,542
Communication Arts 25,450 1,150,554
Entertainment 5,048 201,164
Fashion 2,463 147,784
Furniture and Decorative Arts 1,090 75,327
Publishing and Printing 4,573 196,009
Toys 255 13,558
Visual and Performing Arts Providers 37,600 966,913
2018 Otis Report on the Creative Economy of the Los Angeles Region and the State of California78 www.otis.edu/otisreport
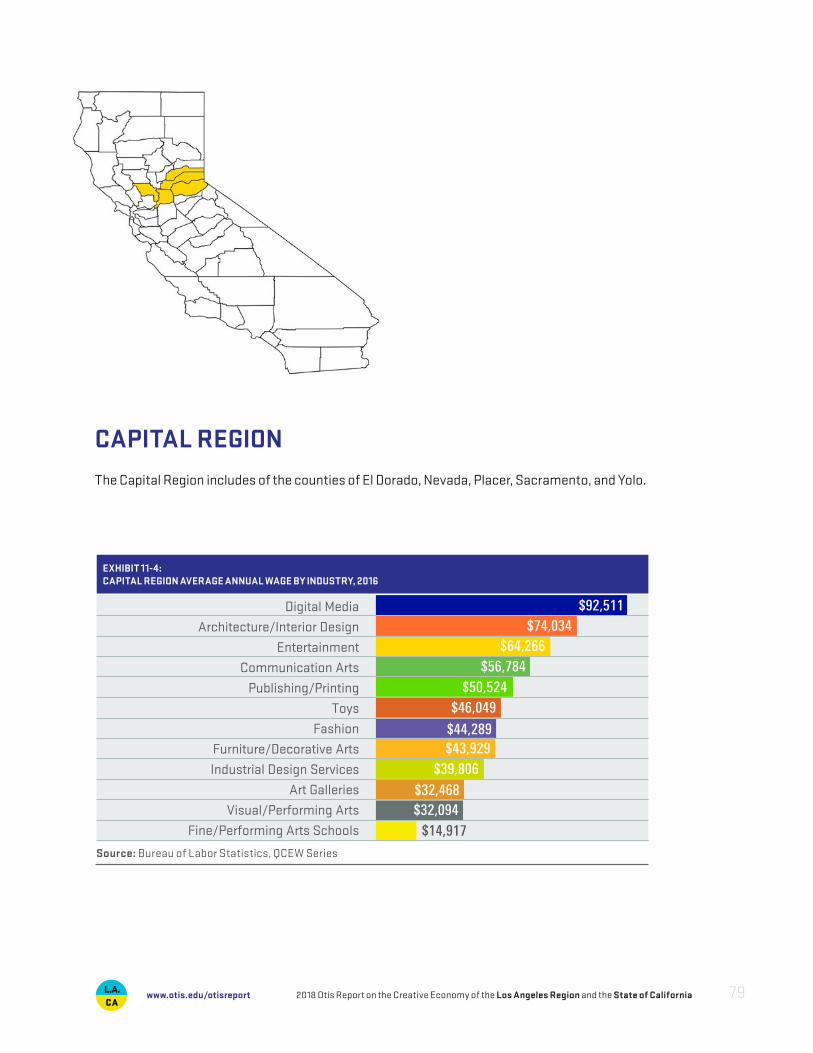
CAPITAL REGIONThe Capital Region includes of the counties of El Dorado, Nevada, Placer, Sacramento, and Yolo.
$64,266 $74,034
$92,511
$50,524
$44,289
$39,806
$32,094$14,917
$56,784
$46,049
$43,929
$32,468
Digital Media
Architecture/Interior Design
Entertainment
Communication Arts
Publishing/Printing
Toys
Fashion
Furniture/Decorative Arts
Industrial Design Services
Art Galleries
Visual/Performing Arts
Fine/Performing Arts Schools
EXHIBIT 11-4: CAPITAL REGION AVERAGE ANNUAL WAGE BY INDUSTRY, 2016
Source: Bureau of Labor Statistics, QCEW Series
2018 Otis Report on the Creative Economy of the Los Angeles Region and the State of California 79www.otis.edu/otisreport
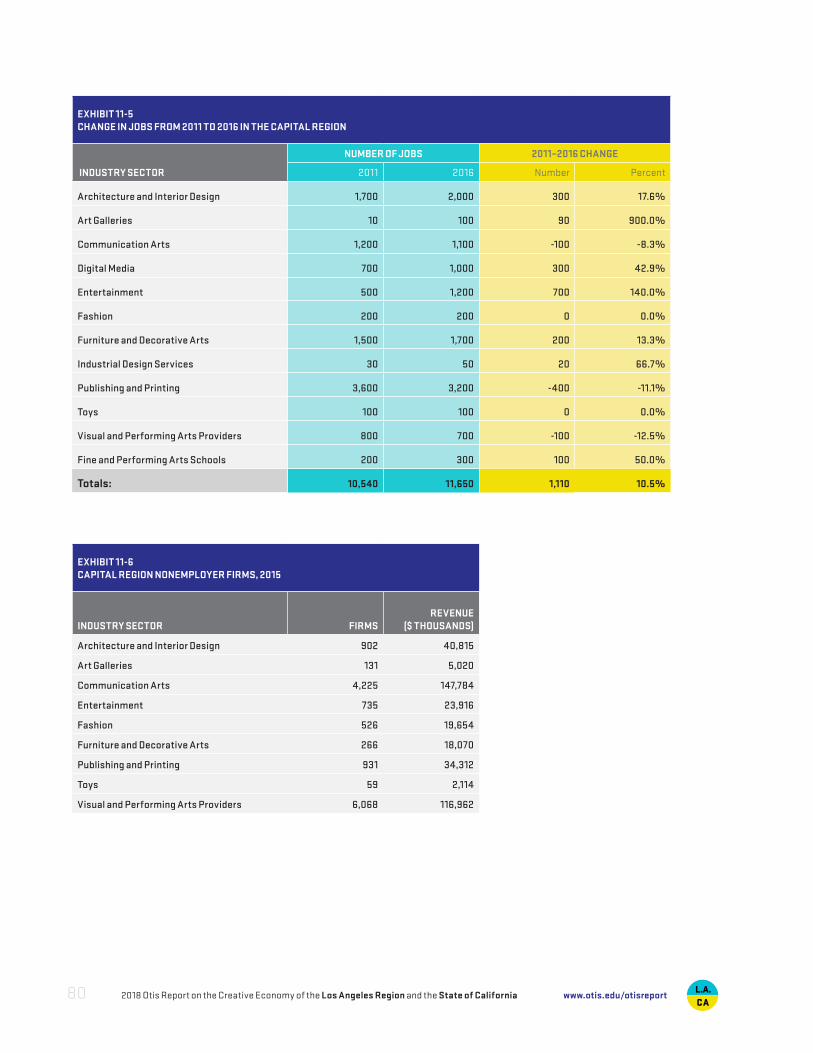
EXHIBIT 11-5CHANGE IN JOBS FROM 2011 TO 2016 IN THE CAPITAL REGION
INDUSTRY SECTOR
NUMBER OF JOBS 2011–2016 CHANGE
2011 2016 Number Percent
Architecture and Interior Design 1,700 2,000 300 17.6%
Art Galleries 10 100 90 900.0%
Communication Arts 1,200 1,100 -100 -8.3%
Digital Media 700 1,000 300 42.9%
Entertainment 500 1,200 700 140.0%
Fashion 200 200 0 0.0%
Furniture and Decorative Arts 1,500 1,700 200 13.3%
Industrial Design Services 30 50 20 66.7%
Publishing and Printing 3,600 3,200 -400 -11.1%
Toys 100 100 0 0.0%
Visual and Performing Arts Providers 800 700 -100 -12.5%
Fine and Performing Arts Schools 200 300 100 50.0%
Totals: 10,540 11,650 1,110 10.5%
EXHIBIT 11-6CAPITAL REGION NONEMPLOYER FIRMS, 2015
INDUSTRY SECTOR
FIRMS
REVENUE
($ THOUSANDS)
Architecture and Interior Design 902 40,815
Art Galleries 131 5,020
Communication Arts 4,225 147,784
Entertainment 735 23,916
Fashion 526 19,654
Furniture and Decorative Arts 266 18,070
Publishing and Printing 931 34,312
Toys 59 2,114
Visual and Performing Arts Providers 6,068 116,962
2018 Otis Report on the Creative Economy of the Los Angeles Region and the State of California80 www.otis.edu/otisreport
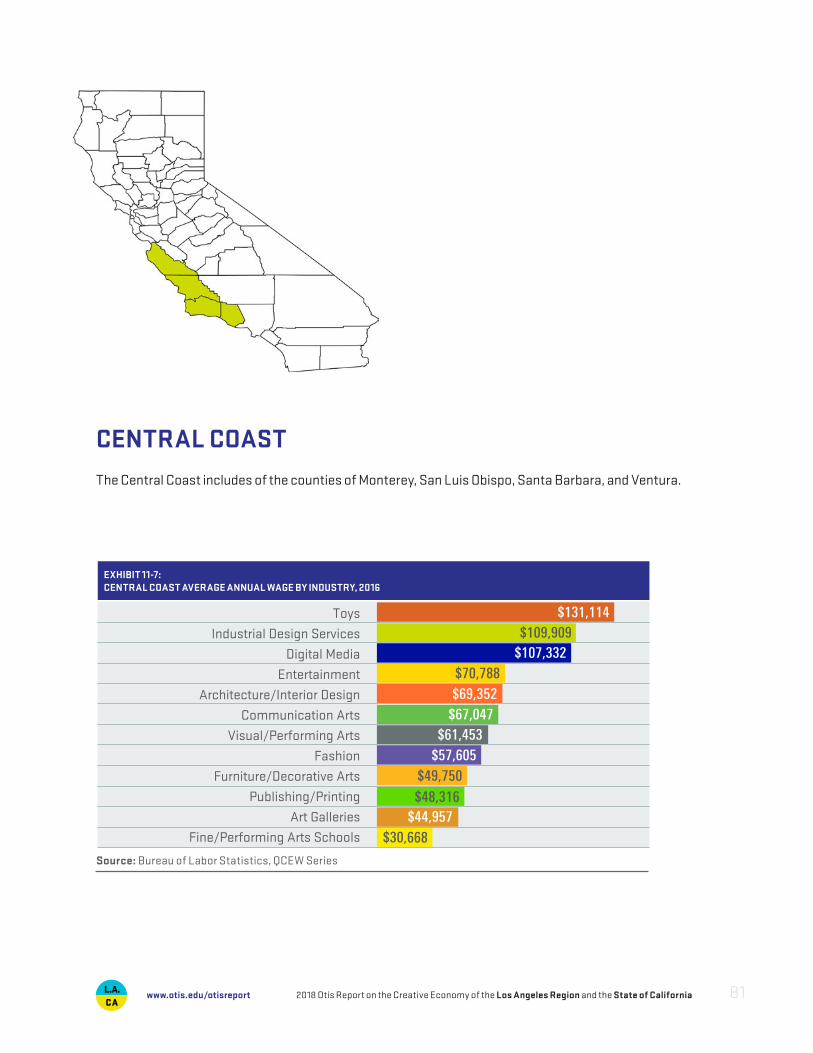
CENTRAL COASTThe Central Coast includes of the counties of Monterey, San Luis Obispo, Santa Barbara, and Ventura.
$107,332 $109,909
$131,114
$69,352
$61,453
$49,750
$44,957 $30,668
$70,788
$67,047
$57,605
$48,316
Toys
Industrial Design Services
Digital Media
Entertainment
Architecture/Interior Design
Communication Arts
Visual/Performing Arts
Fashion
Furniture/Decorative Arts
Publishing/Printing
Art Galleries
Fine/Performing Arts Schools
EXHIBIT 11-7: CENTRAL COAST AVERAGE ANNUAL WAGE BY INDUSTRY, 2016
Source: Bureau of Labor Statistics, QCEW Series
2018 Otis Report on the Creative Economy of the Los Angeles Region and the State of California 81www.otis.edu/otisreport

EXHIBIT 11-8CHANGE IN JOBS FROM 2011 TO 2016 IN THE CENTRAL COAST
INDUSTRY SECTOR
NUMBER OF JOBS 2011–2016 CHANGE
2011 2016 Number Percent
Architecture and Interior Design 1,100 1,500 400 36.4%
Art Galleries 100 100 0 0.0%
Communication Arts 900 900 0 0.0%
Digital Media 1,600 2,600 1,000 62.5%
Entertainment 1,100 900 -200 -18.2%
Fashion 1,100 1,200 100 9.1%
Furniture and Decorative Arts 1,700 1,700 0 0.0%
Industrial Design Services 100 200 100 100.0%
Publishing and Printing 4,300 2,700 -1,600 -37.2%
Toys 100 200 100 100.0%
Visual and Performing Arts Providers 1,300 1,500 200 15.4%
Fine and Performing Arts Schools 500 400 -100 -20.0%
Totals: 13,900 13,900 0 0.0%
EXHIBIT 11-9CENTRAL COAST NONEMPLOYER FIRMS, 2015
INDUSTRY SECTOR
FIRMS
REVENUE
($ THOUSANDS)
Architecture and Interior Design 1,164 60,436
Art Galleries 207 11,811
Communication Arts 4,671 195,282
Entertainment 1,183 50,104
Fashion 638 30,541
Furniture and Decorative Arts 257 13,691
Publishing and Printing 893 39,701
Toys 54 5,315
Visual and Performing Arts Providers 7,284 187,624
2018 Otis Report on the Creative Economy of the Los Angeles Region and the State of California82 www.otis.edu/otisreport
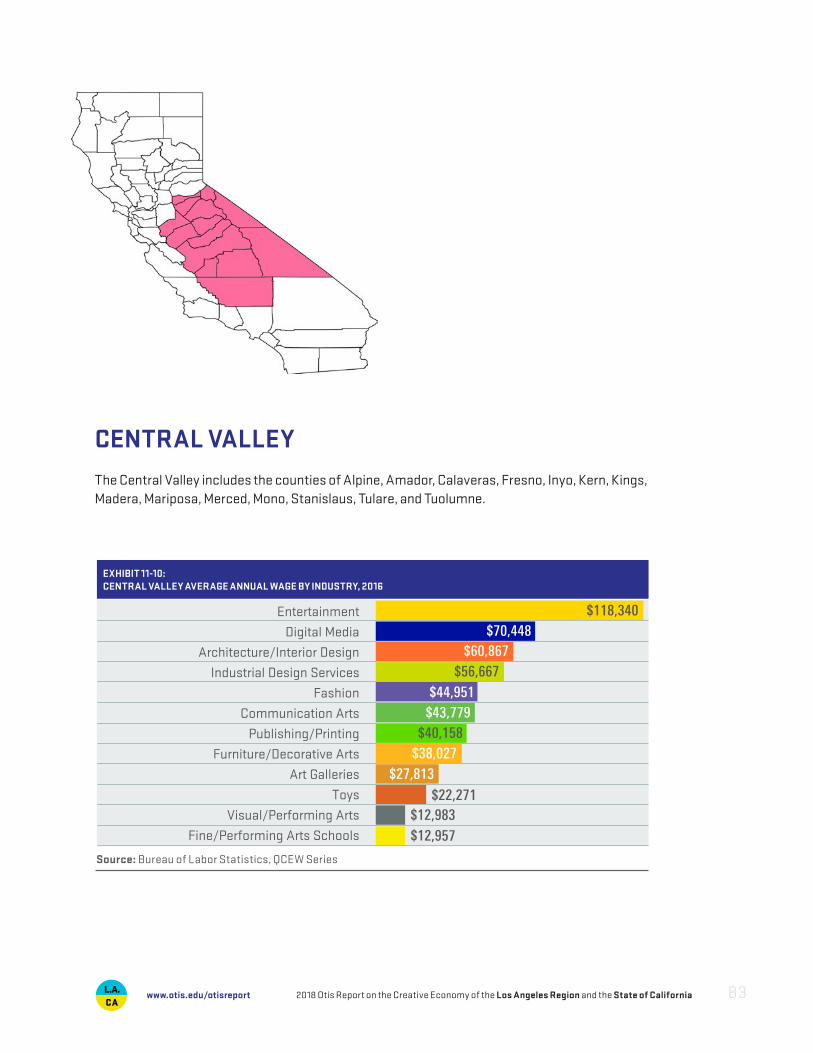
CENTRAL VALLEYThe Central Valley includes the counties of Alpine, Amador, Calaveras, Fresno, Inyo, Kern, Kings, Madera, Mariposa, Merced, Mono, Stanislaus, Tulare, and Tuolumne.
$60,867$70,448
$118,340
$44,951
$40,158
$27,813
$12,983$12,957
$56,667
$43,779
$38,027
$22,271
Entertainment
Digital Media
Architecture/Interior Design
Industrial Design Services
Fashion
Communication Arts
Publishing/Printing
Furniture/Decorative Arts
Art Galleries
Toys
Visual/Performing Arts
Fine/Performing Arts Schools
EXHIBIT 11-10: CENTRAL VALLEY AVERAGE ANNUAL WAGE BY INDUSTRY, 2016
Source: Bureau of Labor Statistics, QCEW Series
2018 Otis Report on the Creative Economy of the Los Angeles Region and the State of California 83www.otis.edu/otisreport

EXHIBIT 11-11CHANGE IN JOBS FROM 2011 TO 2016 IN THE CENTRAL VALLEY
INDUSTRY SECTOR
NUMBER OF JOBS (THOUSANDS) 2011–2016 CHANGE
2011 2016 Number Percent
Architecture and Interior Design 900 1,000 100 11.1%
Art Galleries 50 30 -20 -40.0%
Communication Arts 800 400 -400 -50.0%
Digital Media 40 200 160 400.0%
Entertainment 1,100 1,300 200 18.2%
Fashion 600 500 -100 -16.7%
Furniture and Decorative Arts 1,200 1,400 200 16.7%
Industrial Design Services 60 50 -10 -16.7%
Publishing and Printing 2,700 1,800 -900 -33.3%
Toys 100 100 0 0.0%
Visual and Performing Arts Providers 300 400 100 33.3%
Fine and Performing Arts Schools 300 500 200 66.7%
Totals: 8,150 7,680 -470 -5.8%
EXHIBIT 11-12CENTRAL VALLEY NONEMPLOYER FIRMS, 2015
INDUSTRY SECTOR
FIRMS
REVENUE
($ THOUSANDS)
Architecture and Interior Design 1,860 83,971
Art Galleries 215 14,016
Communication Arts 7,373 258,462
Entertainment 1,550 55,128
Fashion 891 39,785
Furniture and Decorative Arts 410 25,706
Publishing and Printing 1,517 57,806
Toys 108 4,767
Visual and Performing Arts Providers 12,261 250,134
2018 Otis Report on the Creative Economy of the Los Angeles Region and the State of California84 www.otis.edu/otisreport
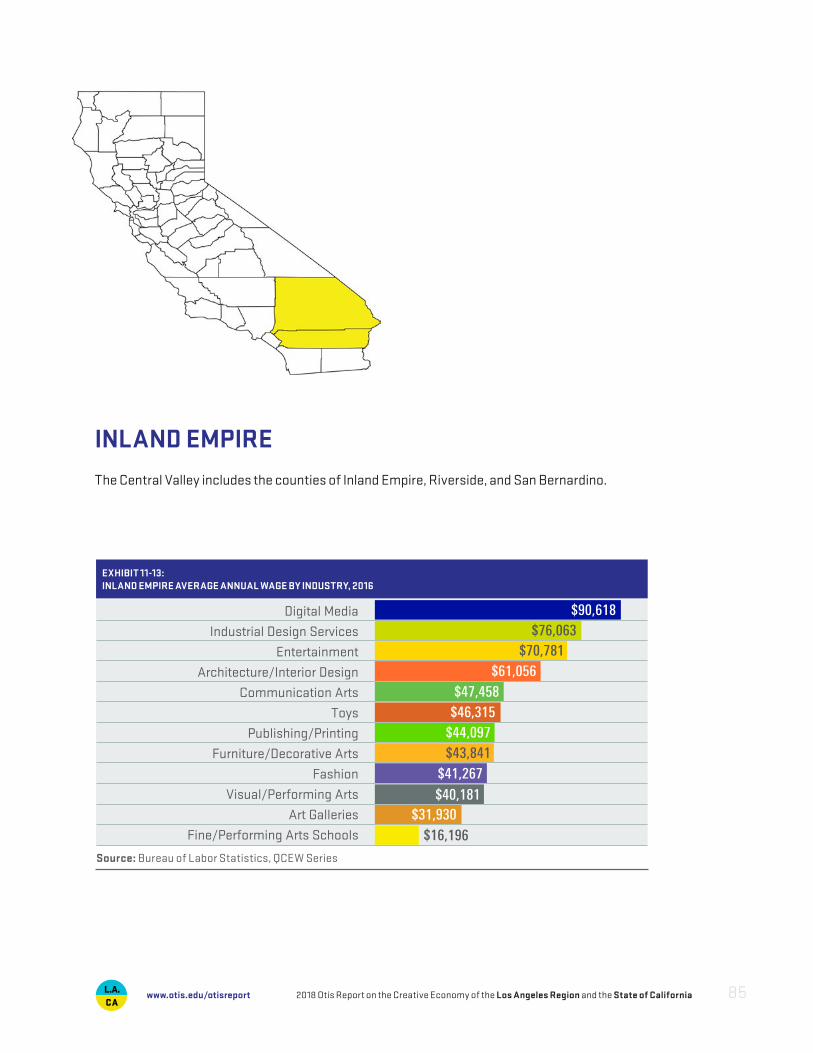
INLAND EMPIREThe Central Valley includes the counties of Inland Empire, Riverside, and San Bernardino.
$70,781$76,063
$90,618
$47,458
$44,097
$41,267
$31,930$16,196
$61,056
$46,315
$43,841
$40,181
Digital Media
Industrial Design Services
Entertainment
Architecture/Interior Design
Communication Arts
Toys
Publishing/Printing
Furniture/Decorative Arts
Fashion
Visual/Performing Arts
Art Galleries
Fine/Performing Arts Schools
EXHIBIT 11-13: INLAND EMPIRE AVERAGE ANNUAL WAGE BY INDUSTRY, 2016
Source: Bureau of Labor Statistics, QCEW Series
2018 Otis Report on the Creative Economy of the Los Angeles Region and the State of California 85www.otis.edu/otisreport

EXHIBIT 11-13:CHANGE IN JOBS FROM 2011 TO 2016 IN THE INLAND EMPIRE
INDUSTRY SECTOR
NUMBER OF JOBS 2011–2016 CHANGE
2011 2016 Number Percent
Architecture and Interior Design 1,400 1,900 500 35.7%
Art Galleries 60 40 -20 -33.3%
Communication Arts 1,500 1,300 -200 -13.3%
Digital Media 100 300 200 200.0%
Entertainment 1,500 900 -600 -40.0%
Fashion 2,900 4,300 1,400 48.3%
Furniture and Decorative Arts 7,700 9,300 1,600 20.8%
Industrial Design Services 70 100 30 42.9%
Publishing and Printing 3,700 3,600 -100 -2.7%
Toys 200 400 200 100.0%
Visual and Performing Arts Providers 1,700 1,700 0 0.0%
Fine and Performing Arts Schools 100 200 100 100.0%
Totals : 20,930 24,040 3,110 15.0%
EXHIBIT 11-14:INLAND EMPIRE NONEMPLOYER FIRMS, 2015
INDUSTRY SECTOR
FIRMS
REVENUE
($ THOUSANDS)
Architecture and Interior Design 1,473 57,405
Art Galleries 154 6,709
Communication Arts 5,412 188,421
Entertainment 922 26,406
Fashion 1,142 51,884
Furniture and Decorative Arts 551 38,226
Publishing and Printing 1,078 46,368
Toys 140 8,116
Visual and Performing Arts Providers 8,022 167,755
2018 Otis Report on the Creative Economy of the Los Angeles Region and the State of California86 www.otis.edu/otisreport
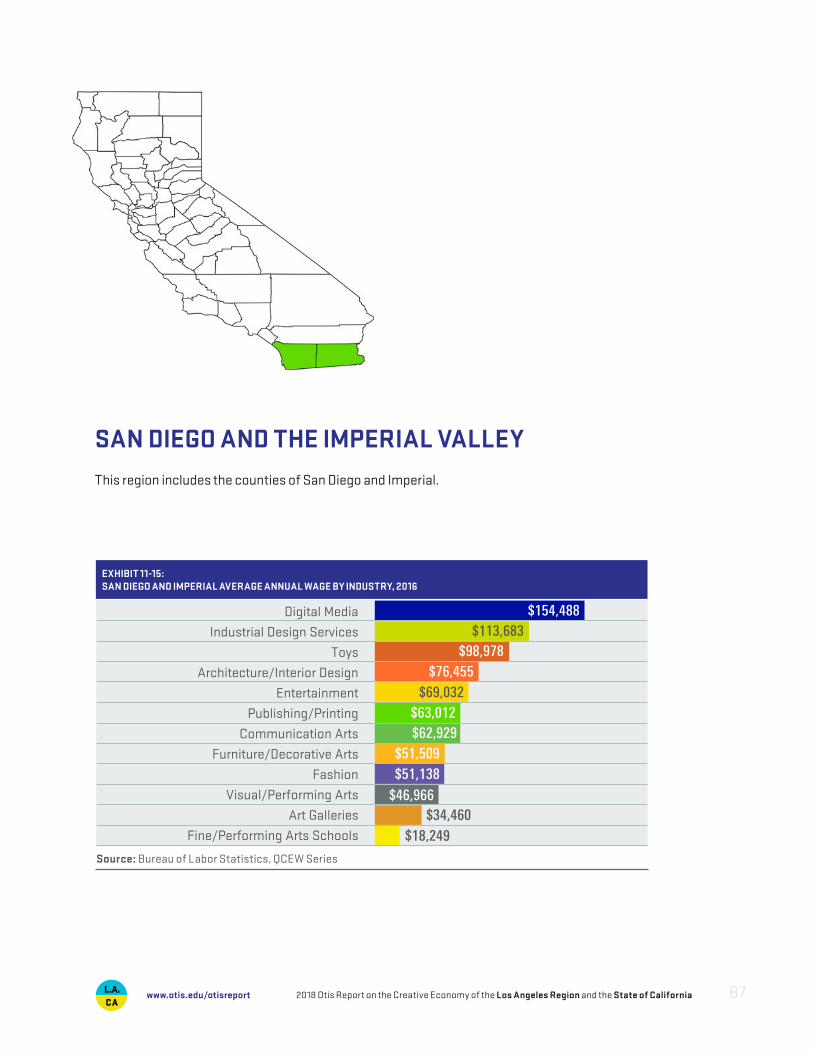
SAN DIEGO AND THE IMPERIAL VALLEYThis region includes the counties of San Diego and Imperial.
$98,978 $113,683
$154,488
$69,032
$62,929
$51,138
$34,460$18,249
$76,455
$63,012
$51,509
$46,966
Digital Media
Industrial Design Services
Toys
Architecture/Interior Design
Entertainment
Publishing/Printing
Communication Arts
Furniture/Decorative Arts
Fashion
Visual/Performing Arts
Art Galleries
Fine/Performing Arts Schools
EXHIBIT 11-15: SAN DIEGO AND IMPERIAL AVERAGE ANNUAL WAGE BY INDUSTRY, 2016
Source: Bureau of Labor Statistics, QCEW Series
2018 Otis Report on the Creative Economy of the Los Angeles Region and the State of California 87www.otis.edu/otisreport

EXHIBIT 11-16:CHANGE IN JOBS FROM 2011 TO 2016 IN SAN DIEGO AND THE IMPERIAL VALLEY
INDUSTRY SECTOR
NUMBER OF JOBS 2011–2016 CHANGE
2011 2016 Number Percent
Architecture and Interior Design 3,200 4,100 900 28.1%
Art Galleries 200 200 0 0.0%
Communication Arts 2,300 2,700 400 17.4%
Digital Media 4,200 4,000 -200 -4.8%
Entertainment 2,000 2,100 100 5.0%
Fashion 3,700 4,100 400 10.8%
Furniture and Decorative Arts 3,400 3,800 400 11.8%
Industrial Design Services 2000 200 0 0.0%
Publishing and Printing 7,900 7,100 -800 -10.1%
Toys 300 300 0 0.0%
Visual and Performing Arts Providers 3,900 3,800 -100 2.6%
Fine and Performing Arts Schools 600 900 300 50.0%
Totals: 31,900 33,300 1,400 4.4%
EXHIBIT 11-17:SAN DIEGO AND IMPERIAL VALLEY NONEMPLOYER FIRMS, 2015
INDUSTRY SECTOR
FIRMS
REVENUE
($ THOUSANDS)
Architecture and Interior Design 1,586 70,731
Art Galleries 207 12,027
Communication Arts 8,494 336,015
Entertainment 1,320 44,526
Fashion 1,045 63,149
Furniture and Decorative Arts 418 23,730
Publishing and Printing 1,314 61,836
Toys 91 5,831
Visual and Performing Arts Providers 10,850 229,242
2018 Otis Report on the Creative Economy of the Los Angeles Region and the State of California88 www.otis.edu/otisreport
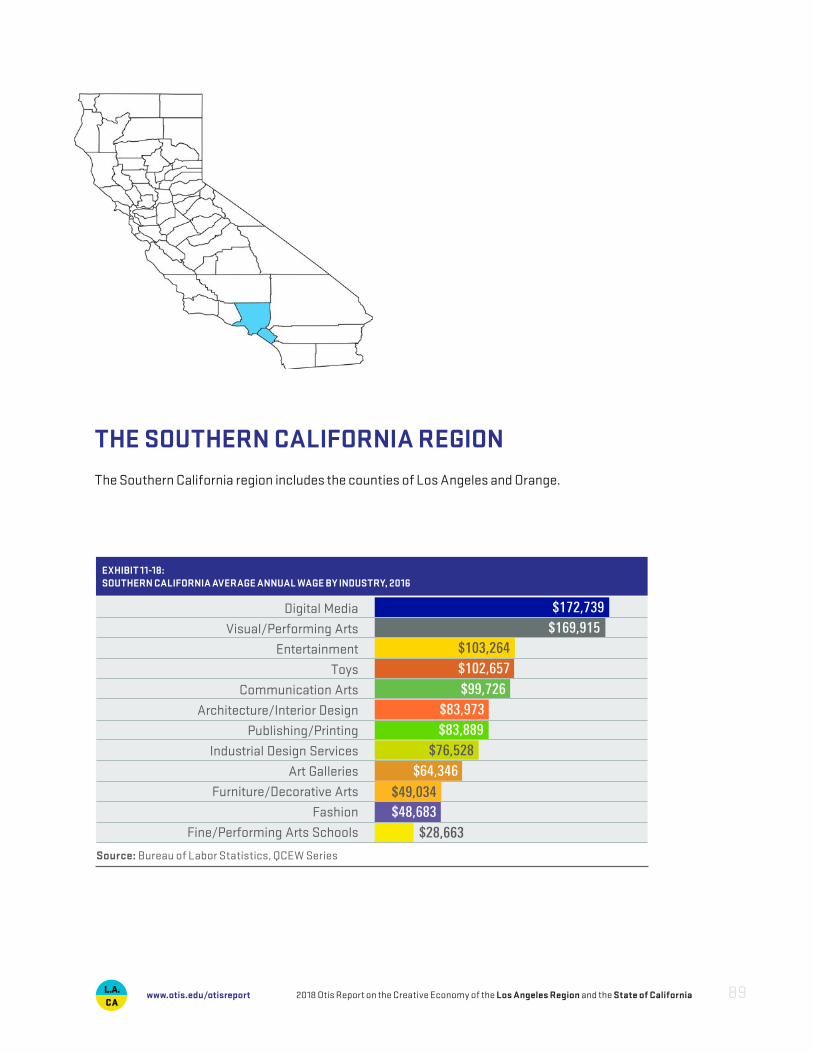
THE SOUTHERN CALIFORNIA REGIONThe Southern California region includes the counties of Los Angeles and Orange.
$103,264$169,915$172,739
$99,726
$83,889
$64,346
$48,683$28,663
$102,657
$83,973
$76,528
$49,034
Digital Media
Visual/Performing Arts
Entertainment
Toys
Communication Arts
Architecture/Interior Design
Publishing/Printing
Industrial Design Services
Art Galleries
Furniture/Decorative Arts
Fashion
Fine/Performing Arts Schools
EXHIBIT 11-18: SOUTHERN CALIFORNIA AVERAGE ANNUAL WAGE BY INDUSTRY, 2016
Source: Bureau of Labor Statistics, QCEW Series
2018 Otis Report on the Creative Economy of the Los Angeles Region and the State of California 89www.otis.edu/otisreport

EXHIBIT 11-19:CHANGE IN JOBS FROM 2011 TO 2016 IN SOUTHERN CALIFORNIA
INDUSTRY SECTOR
NUMBER OF JOBS 2011–2016 CHANGE
2011 2016 Number Percent
Architecture and Interior Design 14,800 19,400 4,600 31.1%
Art Galleries 900 1,100 200 22.2%
Communication Arts 22,400 25,200 2,800 12.5%
Digital Media 10,000 14,800 4,800 48.0%
Entertainment 143,900 164,500 20,600 14.3%
Fashion 99,000 96,700 -2,300 -2.3%
Furniture and Decorative Arts 34,900 38,700 3,800 10.9%
Industrial Design Services 1,100 1,000 -100 -9.1%
Publishing and Printing 44,800 46,600 1,800 4.0%
Toys 4,800 5,300 500 10.4%
Visual and Performing Arts Providers 28,700 38,600 9,900 34.5%
Fine and Performing Arts Schools 4,300 5,300 1,000 23.3%
Totals: 409,600 457,200 47,600 11.6%
EXHIBIT 11-20:SOUTHERN CALIFORNIA NONEMPLOYER FIRMS, 2015
INDUSTRY SECTOR
FIRMS
REVENUE
($ THOUSANDS)
Architecture and Interior Design 6,682 333,047
Art Galleries 926 62,225
Communication Arts 38,368 1,753,677
Entertainment 23,266 1,126,235
Fashion 8,214 824,234
Furniture and Decorative Arts 2,171 170,461
Publishing and Printing 5,601 294,239
Toys 546 44,990
Visual and Performing Arts Providers 94,322 3,858,413
2018 Otis Report on the Creative Economy of the Los Angeles Region and the State of California90 www.otis.edu/otisreport
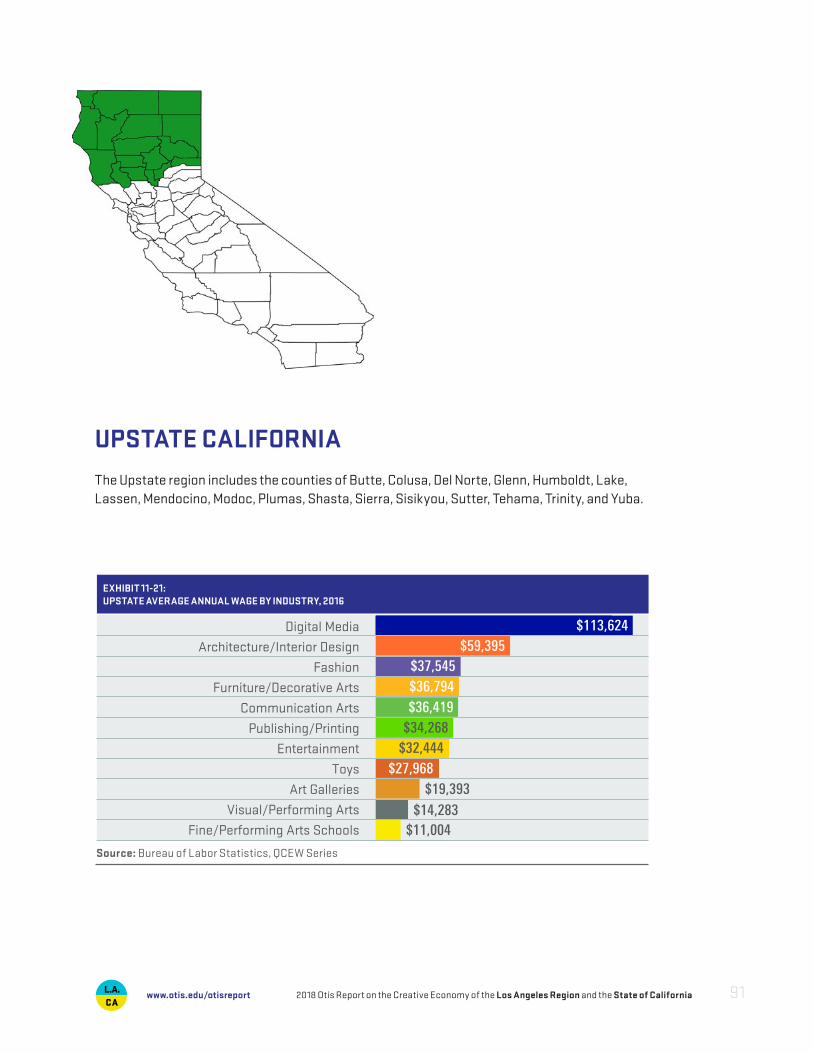
UPSTATE CALIFORNIAThe Upstate region includes the counties of Butte, Colusa, Del Norte, Glenn, Humboldt, Lake, Lassen, Mendocino, Modoc, Plumas, Shasta, Sierra, Sisikyou, Sutter, Tehama, Trinity, and Yuba.
$37,545 $59,395
$113,624
$36,419
$32,444
$19,393
$11,004
$36,794
$34,268
$27,968
$14,283
Digital Media
Architecture/Interior Design
Fashion
Furniture/Decorative Arts
Communication Arts
Publishing/Printing
Entertainment
Toys
Art Galleries
Visual/Performing Arts
Fine/Performing Arts Schools
EXHIBIT 11-21: UPSTATE AVERAGE ANNUAL WAGE BY INDUSTRY, 2016
Source: Bureau of Labor Statistics, QCEW Series
2018 Otis Report on the Creative Economy of the Los Angeles Region and the State of California 91www.otis.edu/otisreport

EXHIBIT 11-22:CHANGE IN JOBS FROM 2011 TO 2016 IN UPSTATE CALIFORNIA
INDUSTRY SECTOR
NUMBER OF JOBS 2011–2016 CHANGE
2011 2016 Number Percent
Architecture and Interior Design 200 200 0 0.0%
Art Galleries 30 20 -10 -33.3%
Communication Arts 100 200 100 100.0%
Digital Media 200 300 100 50.0%
Entertainment 200 500 300 150.0%
Fashion 300 400 100 33.3%
Furniture and Decorative Arts 300 400 100 33.3%
Industrial Design Services 0 0 0 0.0%
Publishing and Printing 300 500 200 66.7%
Toys 100 100 0 0.0%
Visual and Performing Arts Providers 60 100 40 67.0%
Fine and Performing Arts Schools 100 100 0 0.0%
Totals: 1,890 2,820 930 49%
EXHIBIT 11-23:UPSTATE NONEMPLOYER FIRMS, 2015
INDUSTRY SECTOR
FIRMS
REVENUE
($ THOUSANDS)
Architecture and Interior Design 390 15,528
Art Galleries 76 2,051
Communication Arts 1,297 36,864
Entertainment 210 5,201
Fashion 289 10,425
Furniture and Decorative Arts 195 6,063
Publishing and Printing 348 13,561
Toys 18 405
Visual and Performing Arts Providers 2,565 42,801
2018 Otis Report on the Creative Economy of the Los Angeles Region and the State of California92 www.otis.edu/otisreport
HOW TO USE THIS REPORT
12
• To understand the size and contribution of the creative industries to the region’s economy and how it has changed over time is essential to enabling greater regional coordination of resources and services to support those industries. This could include local or statewide policies that support the creative industries infrastructure and improve access to financial investment and business support programs and in turn, ensure the sustainability for the arts and cultural assets.
• To justify increased emphasis on creative economy career paths through technical and university institutions.
• To leverage the creative industries to increase the competitiveness of other businesses where innovation in design and aesthetic content are critical to market share.
• To develop strategies for attracting and retaining creative talent.• To develop marketing and branding to promote creative assets both to
businesses and as cultural tourism.• To develop a support and networking structure that includes convening
leadership and building collaborative connections across industries.
Otis College of Art and Design, a critical component of the creative economy, commissioned this report to analyze and quantify the importance of the creative economy.
2018 Otis Report on the Creative Economy of the Los Angeles Region and the State of California 93www.otis.edu/otisreport
STATISTICAL APPENDIX
13
NOTES ON METHODOLOGY AND DATA
In 2007, Otis College of Art and Design commissioned the LAEDC to undertake the first comprehensive analysis of the creative economy in the Los Angeles region and evalu-ate its contribution to the overall regional economy. The Otis Report on the Creative Economy of the Los Angeles Region has been produced every year since then.
In 2013, the research methodology utilized in this report was changed in three ways. The first two changes involved revisions in the definition of the creative economy. First, additional subsectors within the creative industries were added to the existing creative industries. Second, a new sector was added: publishing and printing. Both of these changes better align the creative industry definitions used in this research with the definitions that are increasingly being adopted elsewhere in the literature. The cre-ative sectors or industries in this report encompass the following twelve categories:
• Architecture and interior design• Art galleries• Arts education• Communication arts• Digital media• Entertainment• Fashion• Furniture and decorative arts• Industrial design services• Publishing and printing• Toys• Visual and performing arts
The third change relates to data used in the contribution analysis portion of this study. In a departure from previous years, beginning in 2013, the IMPLAN model was utilized to assess the economic contribution of the creative industries to the overall economy. In conceptual terms, economic contribution analysis evaluates the ripple effect of a specific economic activity throughout the rest of the economy. Contribution analysis captures the direct impact as well as the indirect and induced impacts of that activity on employment, output, and taxes.
2018 Otis Report on the Creative Economy of the Los Angeles Region and the State of California94 www.otis.edu/otisreport
Additionally, the contribution analysis began using employment and payroll data from the QCEW, rather than the estimated sales, shipments, and revenues that were based on data from the Economic Census.
The data collected for this report includes employment, establishments, payroll, and other measures of creative activity in the Los Angeles region and California at large. These data come from the following sources:
• U.S. Bureau of the Census• U.S. Bureau of Labor Statistics (BLS)• U.S. Bureau of Economic Analysis (BEA)• California Employment Development Department (EDD)• California Department of Education• Internal Revenue Service (IRS)
Much of the industry-level information in this report comes directly from the Bureau of Labor Statistics’ QCEW Series. These data are based on unemployment tax pay-ments that all firms with employees are required to make into the state unemploy-ment insurance fund. Because the coverage is so comprehensive, this is the best available source for employment and wage information.
Because the definitions used in this study were expanded and because the methodol-ogy for calculating the economic contribution has been altered from previous years, the figures contained in this report and those after 2013 are not directly comparable to the studies conducted by Otis and the LAEDC in the years prior to these changes.
2018 Otis Report on the Creative Economy of the Los Angeles Region and the State of California 95www.otis.edu/otisreport
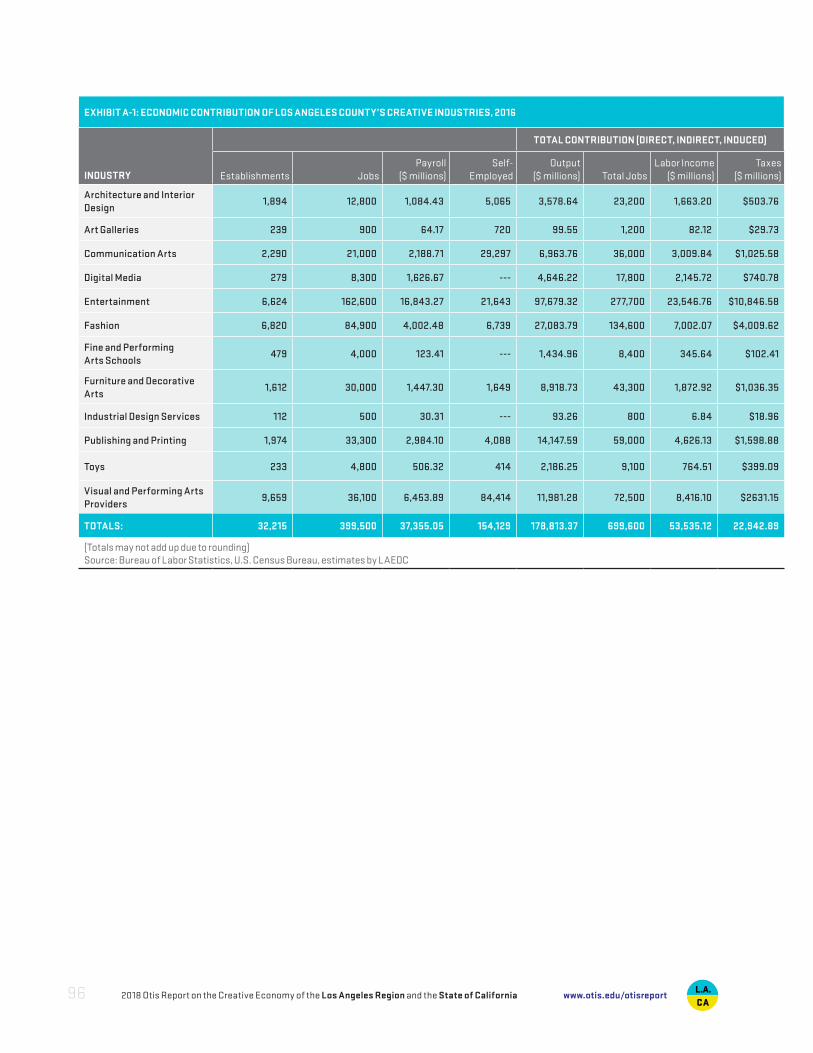
EXHIBIT A-1: ECONOMIC CONTRIBUTION OF LOS ANGELES COUNTY’S CREATIVE INDUSTRIES, 2016
INDUSTRY
TOTAL CONTRIBUTION (DIRECT, INDIRECT, INDUCED)
Establishments JobsPayroll
($ millions)Self-
EmployedOutput
($ millions) Total JobsLabor Income
($ millions)Taxes
($ millions)
Architecture and Interior Design
1,894 12,800 1,084.43 5,065 3,578.64 23,200 1,663.20 $503.76
Art Galleries 239 900 64.17 720 99.55 1,200 82.12 $29.73
Communication Arts 2,290 21,000 2,188.71 29,297 6,963.76 36,000 3,009.84 $1,025.58
Digital Media 279 8,300 1,626.67 --- 4,646.22 17,800 2,145.72 $740.78
Entertainment 6,624 162,600 16,843.27 21,643 97,679.32 277,700 23,546.76 $10,846.58
Fashion 6,820 84,900 4,002.48 6,739 27,083.79 134,600 7,002.07 $4,009.62
Fine and Performing Arts Schools
479 4,000 123.41 --- 1,434.96 8,400 345.64 $102.41
Furniture and Decorative Arts
1,612 30,000 1,447.30 1,649 8,918.73 43,300 1,872.92 $1,036.35
Industrial Design Services 112 500 30.31 --- 93.26 800 6.84 $18.96
Publishing and Printing 1,974 33,300 2,984.10 4,088 14,147.59 59,000 4,626.13 $1,598.88
Toys 233 4,800 506.32 414 2,186.25 9,100 764.51 $399.09
Visual and Performing Arts Providers
9,659 36,100 6,453.89 84,414 11,981.28 72,500 8,416.10 $2631.15
TOTALS: 32,215 399,500 37,355.05 154,129 178,813.37 699,600 53,535.12 22,942.89
(Totals may not add up due to rounding) Source: Bureau of Labor Statistics, U.S. Census Bureau, estimates by LAEDC
2018 Otis Report on the Creative Economy of the Los Angeles Region and the State of California96 www.otis.edu/otisreport
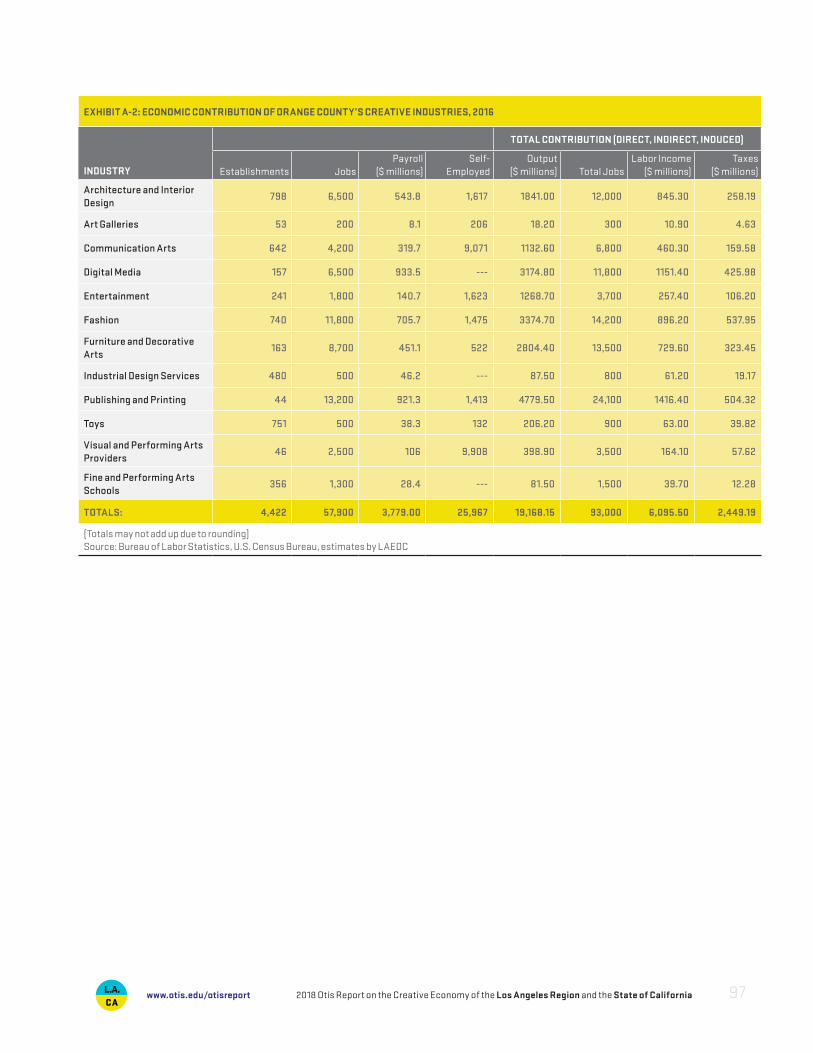
EXHIBIT A-2: ECONOMIC CONTRIBUTION OF ORANGE COUNTY’S CREATIVE INDUSTRIES, 2016
INDUSTRY
TOTAL CONTRIBUTION (DIRECT, INDIRECT, INDUCED)
Establishments JobsPayroll
($ millions)Self-
EmployedOutput
($ millions) Total JobsLabor Income
($ millions)Taxes
($ millions)
Architecture and Interior Design
798 6,500 543.8 1,617 1841.00 12,000 845.30 258.19
Art Galleries 53 200 8.1 206 18.20 300 10.90 4.63
Communication Arts 642 4,200 319.7 9,071 1132.60 6,800 460.30 159.58
Digital Media 157 6,500 933.5 --- 3174.80 11,800 1151.40 425.98
Entertainment 241 1,800 140.7 1,623 1268.70 3,700 257.40 106.20
Fashion 740 11,800 705.7 1,475 3374.70 14,200 896.20 537.95
Furniture and Decorative Arts
163 8,700 451.1 522 2804.40 13,500 729.60 323.45
Industrial Design Services 480 500 46.2 --- 87.50 800 61.20 19.17
Publishing and Printing 44 13,200 921.3 1,413 4779.50 24,100 1416.40 504.32
Toys 751 500 38.3 132 206.20 900 63.00 39.82
Visual and Performing Arts Providers
46 2,500 106 9,908 398.90 3,500 164.10 57.62
Fine and Performing Arts Schools
356 1,300 28.4 --- 81.50 1,500 39.70 12.28
TOTALS: 4,422 57,900 3,779.00 25,967 19,168.15 93,000 6,095.50 2,449.19
(Totals may not add up due to rounding)Source: Bureau of Labor Statistics, U.S. Census Bureau, estimates by LAEDC
EXHIBIT A-1: ECONOMIC CONTRIBUTION OF LOS ANGELES COUNTY’S CREATIVE INDUSTRIES, 2016
INDUSTRY
TOTAL CONTRIBUTION (DIRECT, INDIRECT, INDUCED)
Establishments JobsPayroll
($ millions)Self-
EmployedOutput
($ millions) Total JobsLabor Income
($ millions)Taxes
($ millions)
Architecture and Interior Design
1,894 12,800 1,084.43 5,065 3,578.64 23,200 1,663.20 $503.76
Art Galleries 239 900 64.17 720 99.55 1,200 82.12 $29.73
Communication Arts 2,290 21,000 2,188.71 29,297 6,963.76 36,000 3,009.84 $1,025.58
Digital Media 279 8,300 1,626.67 --- 4,646.22 17,800 2,145.72 $740.78
Entertainment 6,624 162,600 16,843.27 21,643 97,679.32 277,700 23,546.76 $10,846.58
Fashion 6,820 84,900 4,002.48 6,739 27,083.79 134,600 7,002.07 $4,009.62
Fine and Performing Arts Schools
479 4,000 123.41 --- 1,434.96 8,400 345.64 $102.41
Furniture and Decorative Arts
1,612 30,000 1,447.30 1,649 8,918.73 43,300 1,872.92 $1,036.35
Industrial Design Services 112 500 30.31 --- 93.26 800 6.84 $18.96
Publishing and Printing 1,974 33,300 2,984.10 4,088 14,147.59 59,000 4,626.13 $1,598.88
Toys 233 4,800 506.32 414 2,186.25 9,100 764.51 $399.09
Visual and Performing Arts Providers
9,659 36,100 6,453.89 84,414 11,981.28 72,500 8,416.10 $2631.15
TOTALS: 32,215 399,500 37,355.05 154,129 178,813.37 699,600 53,535.12 22,942.89
(Totals may not add up due to rounding) Source: Bureau of Labor Statistics, U.S. Census Bureau, estimates by LAEDC
2018 Otis Report on the Creative Economy of the Los Angeles Region and the State of California 97www.otis.edu/otisreport
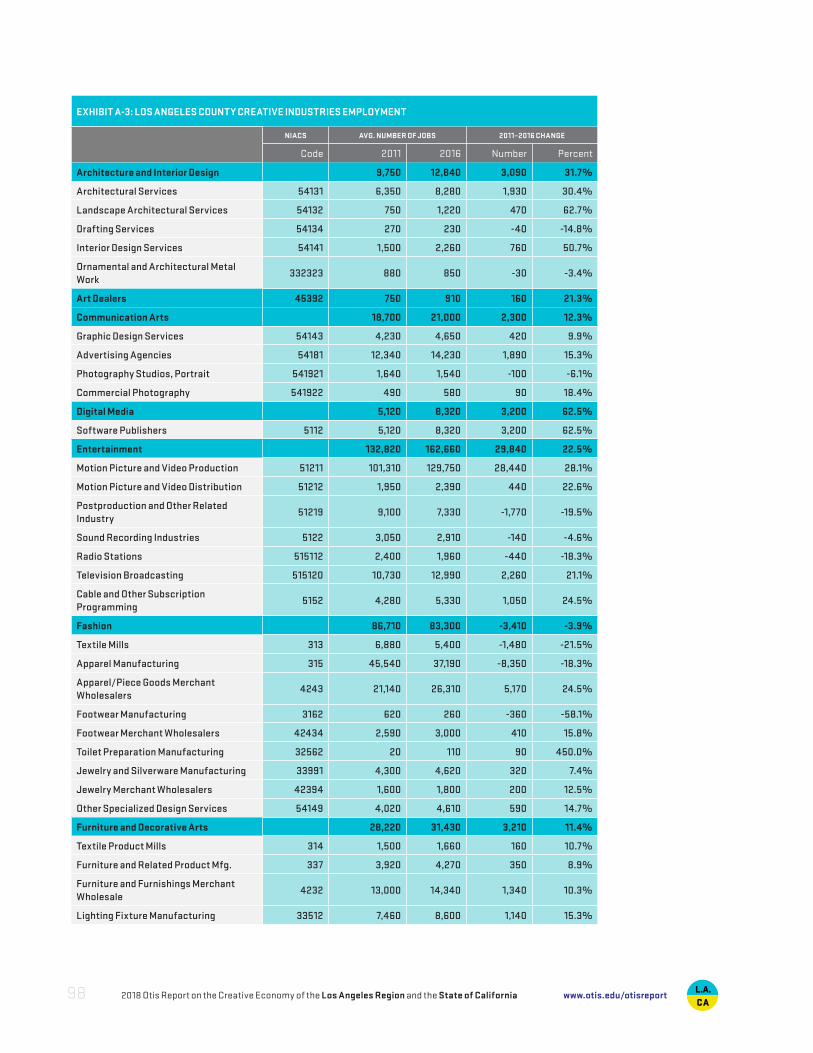
EXHIBIT A-3: LOS ANGELES COUNTY CREATIVE INDUSTRIES EMPLOYMENT
NIACS AVG. NUMBER OF JOBS 2011–2016 CHANGE
Code 2011 2016 Number Percent
Architecture and Interior Design 9,750 12,840 3,090 31.7%
Architectural Services 54131 6,350 8,280 1,930 30.4%
Landscape Architectural Services 54132 750 1,220 470 62.7%
Drafting Services 54134 270 230 -40 -14.8%
Interior Design Services 54141 1,500 2,260 760 50.7%
Ornamental and Architectural Metal Work
332323 880 850 -30 -3.4%
Art Dealers 45392 750 910 160 21.3%
Communication Arts 18,700 21,000 2,300 12.3%
Graphic Design Services 54143 4,230 4,650 420 9.9%
Advertising Agencies 54181 12,340 14,230 1,890 15.3%
Photography Studios, Portrait 541921 1,640 1,540 -100 -6.1%
Commercial Photography 541922 490 580 90 18.4%
Digital Media 5,120 8,320 3,200 62.5%
Software Publishers 5112 5,120 8,320 3,200 62.5%
Entertainment 132,820 162,660 29,840 22.5%
Motion Picture and Video Production 51211 101,310 129,750 28,440 28.1%
Motion Picture and Video Distribution 51212 1,950 2,390 440 22.6%
Postproduction and Other Related Industry
51219 9,100 7,330 -1,770 -19.5%
Sound Recording Industries 5122 3,050 2,910 -140 -4.6%
Radio Stations 515112 2,400 1,960 -440 -18.3%
Television Broadcasting 515120 10,730 12,990 2,260 21.1%
Cable and Other SubscriptionProgramming
5152 4,280 5,330 1,050 24.5%
Fashion 86,710 83,300 -3,410 -3.9%
Textile Mills 313 6,880 5,400 -1,480 -21.5%
Apparel Manufacturing 315 45,540 37,190 -8,350 -18.3%
Apparel/Piece Goods Merchant Wholesalers
4243 21,140 26,310 5,170 24.5%
Footwear Manufacturing 3162 620 260 -360 -58.1%
Footwear Merchant Wholesalers 42434 2,590 3,000 410 15.8%
Toilet Preparation Manufacturing 32562 20 110 90 450.0%
Jewelry and Silverware Manufacturing 33991 4,300 4,620 320 7.4%
Jewelry Merchant Wholesalers 42394 1,600 1,800 200 12.5%
Other Specialized Design Services 54149 4,020 4,610 590 14.7%
Furniture and Decorative Arts 28,220 31,430 3,210 11.4%
Textile Product Mills 314 1,500 1,660 160 10.7%
Furniture and Related Product Mfg. 337 3,920 4,270 350 8.9%
Furniture and Furnishings Merchant Wholesale
4232 13,000 14,340 1,340 10.3%
Lighting Fixture Manufacturing 33512 7,460 8,600 1,140 15.3%
2018 Otis Report on the Creative Economy of the Los Angeles Region and the State of California98 www.otis.edu/otisreport
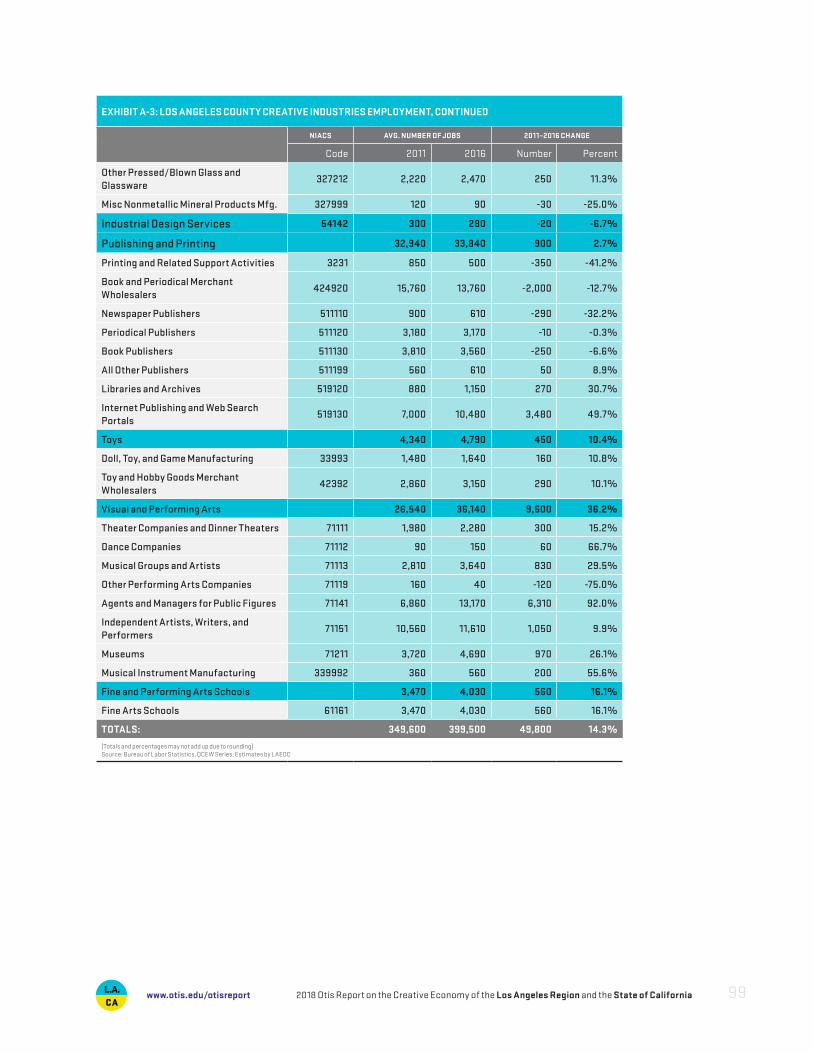
EXHIBIT A-3: LOS ANGELES COUNTY CREATIVE INDUSTRIES EMPLOYMENT, CONTINUED
NIACS AVG. NUMBER OF JOBS 2011–2016 CHANGE
Code 2011 2016 Number Percent
Other Pressed/Blown Glass and Glassware
327212 2,220 2,470 250 11.3%
Misc Nonmetallic Mineral Products Mfg. 327999 120 90 -30 -25.0%
Industrial Design Services 54142 300 280 -20 -6.7%
Publishing and Printing 32,940 33,840 900 2.7%
Printing and Related Support Activities 3231 850 500 -350 -41.2%
Book and Periodical Merchant Wholesalers
424920 15,760 13,760 -2,000 -12.7%
Newspaper Publishers 511110 900 610 -290 -32.2%
Periodical Publishers 511120 3,180 3,170 -10 -0.3%
Book Publishers 511130 3,810 3,560 -250 -6.6%
All Other Publishers 511199 560 610 50 8.9%
Libraries and Archives 519120 880 1,150 270 30.7%
Internet Publishing and Web Search Portals
519130 7,000 10,480 3,480 49.7%
Toys 4,340 4,790 450 10.4%
Doll, Toy, and Game Manufacturing 33993 1,480 1,640 160 10.8%
Toy and Hobby Goods Merchant Wholesalers
42392 2,860 3,150 290 10.1%
Visual and Performing Arts 26,540 36,140 9,600 36.2%
Theater Companies and Dinner Theaters 71111 1,980 2,280 300 15.2%
Dance Companies 71112 90 150 60 66.7%
Musical Groups and Artists 71113 2,810 3,640 830 29.5%
Other Performing Arts Companies 71119 160 40 -120 -75.0%
Agents and Managers for Public Figures 71141 6,860 13,170 6,310 92.0%
Independent Artists, Writers, and Performers
71151 10,560 11,610 1,050 9.9%
Museums 71211 3,720 4,690 970 26.1%
Musical Instrument Manufacturing 339992 360 560 200 55.6%
Fine and Performing Arts Schools 3,470 4,030 560 16.1%
Fine Arts Schools 61161 3,470 4,030 560 16.1%
TOTALS: 349,600 399,500 49,800 14.3%
(Totals and percentages may not add up due to rounding)Source: Bureau of Labor Statistics, QCEW Series; Estimates by LAEDC
2018 Otis Report on the Creative Economy of the Los Angeles Region and the State of California 99www.otis.edu/otisreport
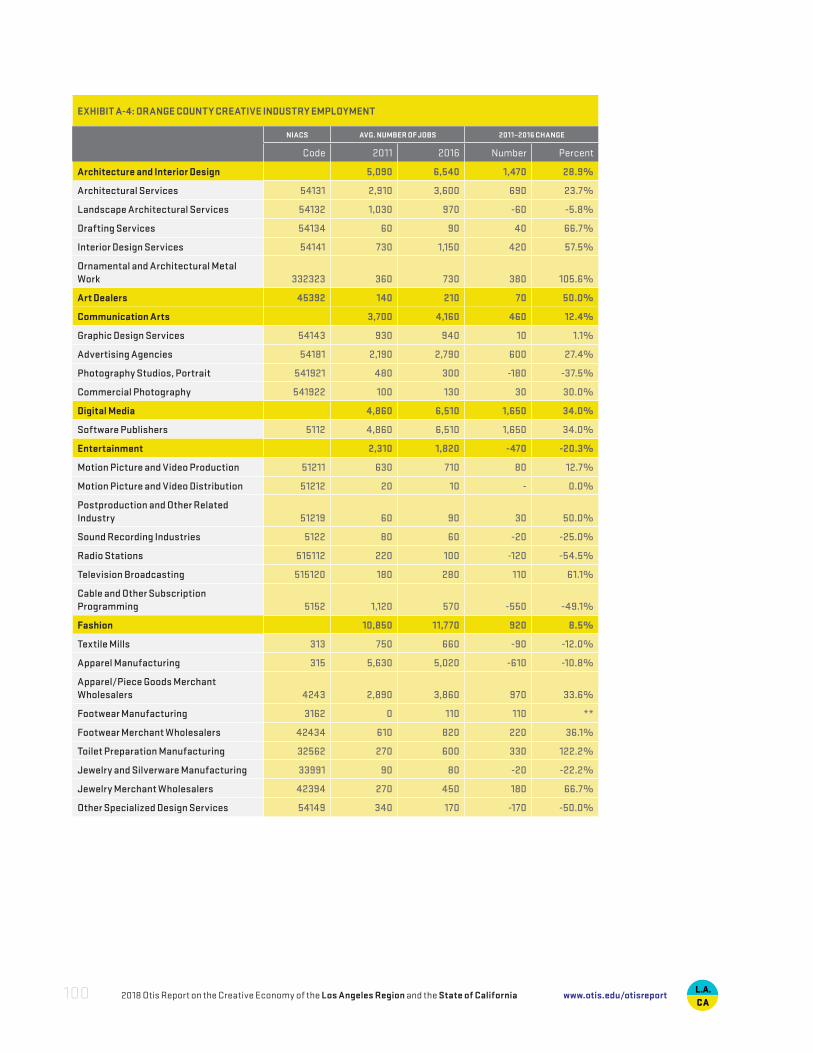
EXHIBIT A-4: ORANGE COUNTY CREATIVE INDUSTRY EMPLOYMENT
NIACS AVG. NUMBER OF JOBS 2011–2016 CHANGE
Code 2011 2016 Number Percent
Architecture and Interior Design 5,090 6,540 1,470 28.9%
Architectural Services 54131 2,910 3,600 690 23.7%
Landscape Architectural Services 54132 1,030 970 -60 -5.8%
Drafting Services 54134 60 90 40 66.7%
Interior Design Services 54141 730 1,150 420 57.5%
Ornamental and Architectural Metal Work 332323 360 730 380 105.6%
Art Dealers 45392 140 210 70 50.0%
Communication Arts 3,700 4,160 460 12.4%
Graphic Design Services 54143 930 940 10 1.1%
Advertising Agencies 54181 2,190 2,790 600 27.4%
Photography Studios, Portrait 541921 480 300 -180 -37.5%
Commercial Photography 541922 100 130 30 30.0%
Digital Media 4,860 6,510 1,650 34.0%
Software Publishers 5112 4,860 6,510 1,650 34.0%
Entertainment 2,310 1,820 -470 -20.3%
Motion Picture and Video Production 51211 630 710 80 12.7%
Motion Picture and Video Distribution 51212 20 10 - 0.0%
Postproduction and Other Related Industry 51219 60 90 30 50.0%
Sound Recording Industries 5122 80 60 -20 -25.0%
Radio Stations 515112 220 100 -120 -54.5%
Television Broadcasting 515120 180 280 110 61.1%
Cable and Other Subscription Programming 5152 1,120 570 -550 -49.1%
Fashion 10,850 11,770 920 8.5%
Textile Mills 313 750 660 -90 -12.0%
Apparel Manufacturing 315 5,630 5,020 -610 -10.8%
Apparel/Piece Goods Merchant Wholesalers 4243 2,890 3,860 970 33.6%
Footwear Manufacturing 3162 0 110 110 **
Footwear Merchant Wholesalers 42434 610 820 220 36.1%
Toilet Preparation Manufacturing 32562 270 600 330 122.2%
Jewelry and Silverware Manufacturing 33991 90 80 -20 -22.2%
Jewelry Merchant Wholesalers 42394 270 450 180 66.7%
Other Specialized Design Services 54149 340 170 -170 -50.0%
2018 Otis Report on the Creative Economy of the Los Angeles Region and the State of California100 www.otis.edu/otisreport
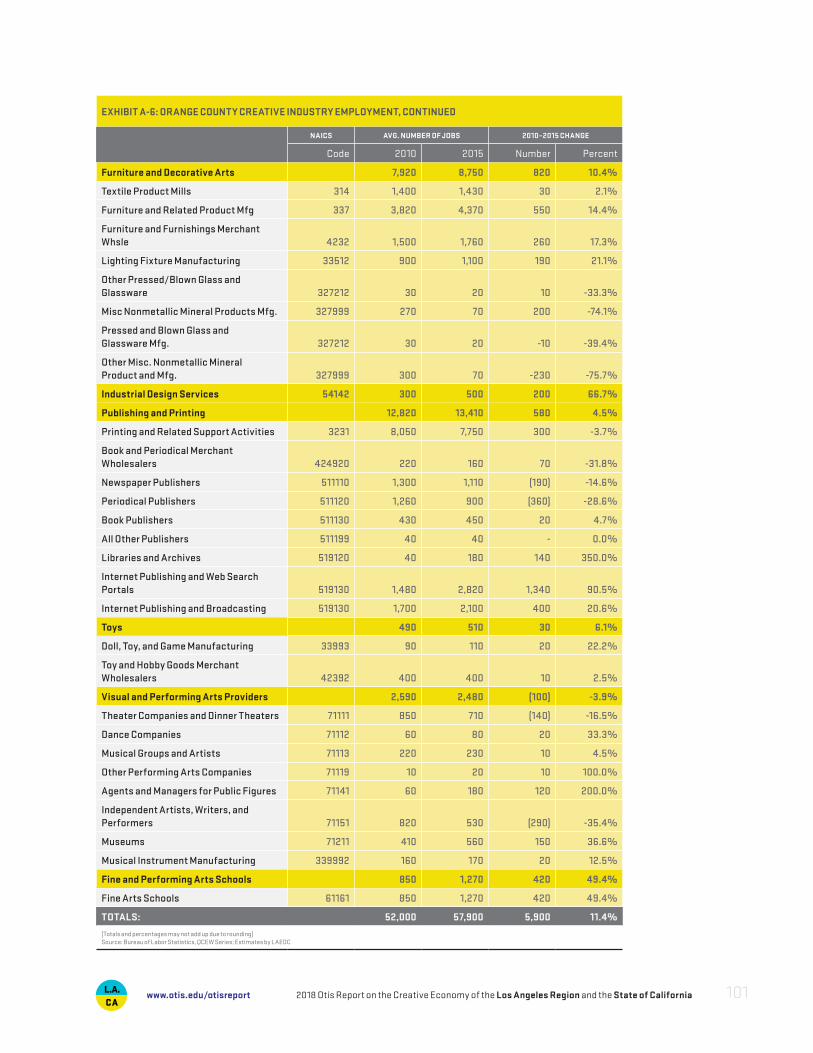
EXHIBIT A-6: ORANGE COUNTY CREATIVE INDUSTRY EMPLOYMENT, CONTINUED
NAICS AVG. NUMBER OF JOBS 2010–2015 CHANGE
Code 2010 2015 Number Percent
Furniture and Decorative Arts 7,920 8,750 820 10.4%
Textile Product Mills 314 1,400 1,430 30 2.1%
Furniture and Related Product Mfg 337 3,820 4,370 550 14.4%
Furniture and Furnishings Merchant Whsle 4232 1,500 1,760 260 17.3%
Lighting Fixture Manufacturing 33512 900 1,100 190 21.1%
Other Pressed/Blown Glass and Glassware 327212 30 20 10 -33.3%
Misc Nonmetallic Mineral Products Mfg. 327999 270 70 200 -74.1%
Pressed and Blown Glass and Glassware Mfg. 327212 30 20 -10 -39.4%
Other Misc. Nonmetallic Mineral Product and Mfg. 327999 300 70 -230 -75.7%
Industrial Design Services 54142 300 500 200 66.7%
Publishing and Printing 12,820 13,410 580 4.5%
Printing and Related Support Activities 3231 8,050 7,750 300 -3.7%
Book and Periodical Merchant Wholesalers 424920 220 160 70 -31.8%
Newspaper Publishers 511110 1,300 1,110 (190) -14.6%
Periodical Publishers 511120 1,260 900 (360) -28.6%
Book Publishers 511130 430 450 20 4.7%
All Other Publishers 511199 40 40 - 0.0%
Libraries and Archives 519120 40 180 140 350.0%
Internet Publishing and Web Search Portals 519130 1,480 2,820 1,340 90.5%
Internet Publishing and Broadcasting 519130 1,700 2,100 400 20.6%
Toys 490 510 30 6.1%
Doll, Toy, and Game Manufacturing 33993 90 110 20 22.2%
Toy and Hobby Goods Merchant Wholesalers 42392 400 400 10 2.5%
Visual and Performing Arts Providers 2,590 2,480 (100) -3.9%
Theater Companies and Dinner Theaters 71111 850 710 (140) -16.5%
Dance Companies 71112 60 80 20 33.3%
Musical Groups and Artists 71113 220 230 10 4.5%
Other Performing Arts Companies 71119 10 20 10 100.0%
Agents and Managers for Public Figures 71141 60 180 120 200.0%
Independent Artists, Writers, and Performers 71151 820 530 (290) -35.4%
Museums 71211 410 560 150 36.6%
Musical Instrument Manufacturing 339992 160 170 20 12.5%
Fine and Performing Arts Schools 850 1,270 420 49.4%
Fine Arts Schools 61161 850 1,270 420 49.4%
TOTALS: 52,000 57,900 5,900 11.4%
(Totals and percentages may not add up due to rounding)Source: Bureau of Labor Statistics, QCEW Series; Estimates by LAEDC
2018 Otis Report on the Creative Economy of the Los Angeles Region and the State of California 101www.otis.edu/otisreport
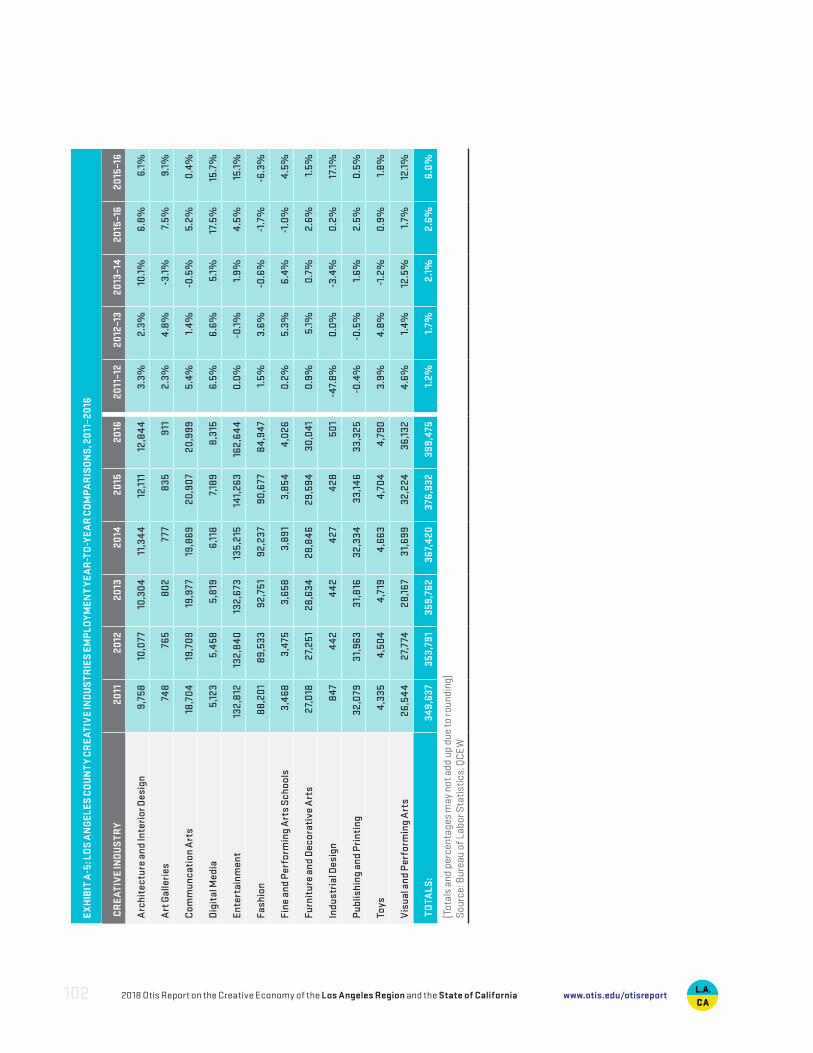
EX
HIB
IT A
-5: L
OS
AN
GEL
ES C
OU
NT
Y C
RE
ATI
VE
IND
US
TRIE
S EM
PLO
YMEN
T YE
AR
-TO
-YE
AR
CO
MPA
RIS
ON
S, 2
011
–20
16
CR
EA
TIV
E IN
DU
STR
Y20
1120
1220
1320
1420
1520
1620
11–1
220
12–1
320
13–1
420
15–1
620
15–1
6
Arc
hite
ctur
e an
d In
teri
or D
esig
n 9
,758
10
,077
10
,30
4 11
,34
4 12
,111
12
,84
4 3.
3%2.
3%10
.1%
6.8%
6.1%
Art
Gal
leri
es 7
48
765
8
02
777
8
35
911
2.
3%4.
8%-3
.1%
7.5%
9.1%
Com
mun
cati
on A
rts
18,7
04
19,7
09
19,9
77
19,8
69
20,
907
20,
999
5.4%
1.4%
-0.5
%5.
2%0.
4%
Dig
ital
Med
ia 5
,123
5,4
58
5,8
19
6,1
18
7,18
9 8
,315
6.
5%6.
6%5.
1%17
.5%
15.7
%
Ente
rtai
nmen
t 13
2,8
12
132,
840
13
2,67
3 13
5,21
5 14
1,26
3 16
2,64
4 0.
0%-0
.1%
1.9%
4.5%
15.1
%
Fash
ion
88,
201
89,
533
92,
751
92,
237
90,
677
84,
947
1.5%
3.6%
-0.6
%-1
.7%
-6.3
%
Fine
and
Per
form
ing
Art
s S
choo
ls 3
,468
3
,475
3
,658
3
,89
1 3
,854
4
,026
0.
2%5.
3%6.
4%-1
.0%
4.5%
Furn
itur
e an
d D
ecor
ativ
e A
rts
27,
018
2
7,25
1 2
8,63
4 2
8,8
46
29,
594
30,
041
0.
9%5.
1%0.
7%2.
6%1.
5%
Indu
stri
al D
esig
n 8
47
44
2 4
42
427
4
28
50
1 -4
7.8%
0.0%
-3.4
%0.
2%17
.1%
Pub
lishi
ng a
nd P
rint
ing
32,
079
3
1,96
3 3
1,8
16
32,
334
33,
146
33,
325
-0.4
%-0
.5%
1.6%
2.5%
0.5%
Toys
4,3
35
4,5
04
4,7
19
4,6
63
4,7
04
4,7
90
3.9%
4.8%
-1.2
%0.
9%1.
8%
Vis
ual a
nd P
erfo
rmin
g A
rts
26,
544
27,
774
28,
167
31,
699
32,
224
36,
132
4.6%
1.4%
12.5
%1.
7%12
.1%
TO
TALS
: 3
49,6
37
353
,791
3
59,7
62
367
,420
3
76,9
32
399
,475
1.
2%1.
7%2.
1%2.
6%6.
0%
(Tot
als
and
perc
enta
ges
may
not
add
up
due
to ro
undi
ng)
Sour
ce: B
urea
u of
Lab
or S
tatis
tics,
QC
EW
2018 Otis Report on the Creative Economy of the Los Angeles Region and the State of California102 www.otis.edu/otisreport
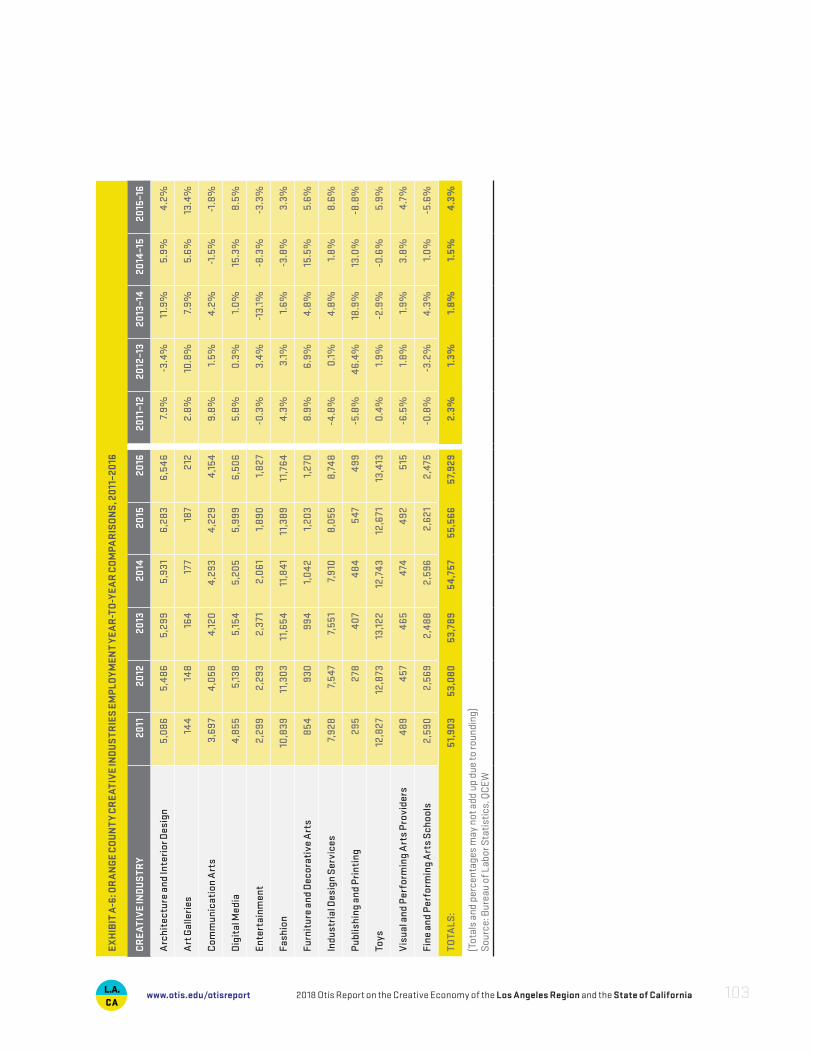
EX
HIB
IT A
-6: O
RA
NG
E C
OU
NT
Y C
RE
ATI
VE
IND
US
TRIE
S EM
PLO
YMEN
T YE
AR
-TO
-YE
AR
CO
MPA
RIS
ON
S, 2
011
–20
16
CR
EA
TIV
E IN
DU
STR
Y20
1120
1220
1320
1420
1520
1620
11–1
220
12–1
320
13–1
420
14–1
520
15–1
6
Arc
hite
ctur
e an
d In
teri
or D
esig
n 5
,086
5
,486
5
,299
5
,931
6
,283
6
,546
7.
9%-3
.4%
11.9
%5.
9%4.
2%
Art
Gal
leri
es 14
4 14
8 16
4 17
7 18
7 2
12
2.8%
10.8
%7.
9%5.
6%13
.4%
Com
mun
icat
ion
Art
s 3
,697
4
,058
4
,120
4,2
93
4,2
29
4,15
4 9.
8%1.
5%4.
2%-1
.5%
-1.8
%
Dig
ital
Med
ia 4
,855
5
,138
5,15
4 5
,205
5
,999
6
,506
5.
8%0.
3%1.
0%15
.3%
8.5%
Ente
rtai
nmen
t 2
,299
2
,293
2
,371
2
,06
1 1,
890
1,82
7 -0
.3%
3.4%
-13.
1%-8
.3%
-3.3
%
Fash
ion
10,8
39
11,3
03
11,6
54
11,8
41
11,3
89
11,7
64
4.3%
3.1%
1.6%
-3.8
%3.
3%
Furn
itur
e an
d D
ecor
ativ
e A
rts
854
9
30
994
1,
04
2 1,
203
1,27
0 8.
9%6.
9%4.
8%15
.5%
5.6%
Indu
stri
al D
esig
n S
ervi
ces
7,92
8 7,
547
7,55
1 7,
910
8
,055
8
,748
-4
.8%
0.1%
4.8%
1.8%
8.6%
Pub
lishi
ng a
nd P
rint
ing
295
2
78
40
7 4
84
547
4
99
-5.8
%46
.4%
18.9
%13
.0%
-8.8
%
Toys
12,8
27
12,8
73
13,12
2 12
,74
3 12
,671
13
,413
0.
4%1.
9%-2
.9%
-0.6
%5.
9%
Vis
ual a
nd P
erfo
rmin
g A
rts
Pro
vide
rs 4
89
457
4
65
474
4
92
515
-6
.5%
1.8%
1.9%
3.8%
4.7%
Fine
and
Per
form
ing
Art
s S
choo
ls 2
,590
2
,569
2
,488
2
,596
2
,621
2
,475
-0
.8%
-3.2
%4.
3%1.
0%-5
.6%
TOTA
LS:
51,
903
53,
080
53,
789
54,
757
55,
566
57,
929
2.3%
1.3%
1.8%
1.5%
4.3%
(Tot
als
and
perc
enta
ges
may
not
add
up
due
to ro
undi
ng)
Sour
ce: B
urea
u of
Lab
or S
tatis
tics,
QC
EW
2018 Otis Report on the Creative Economy of the Los Angeles Region and the State of California 103www.otis.edu/otisreport
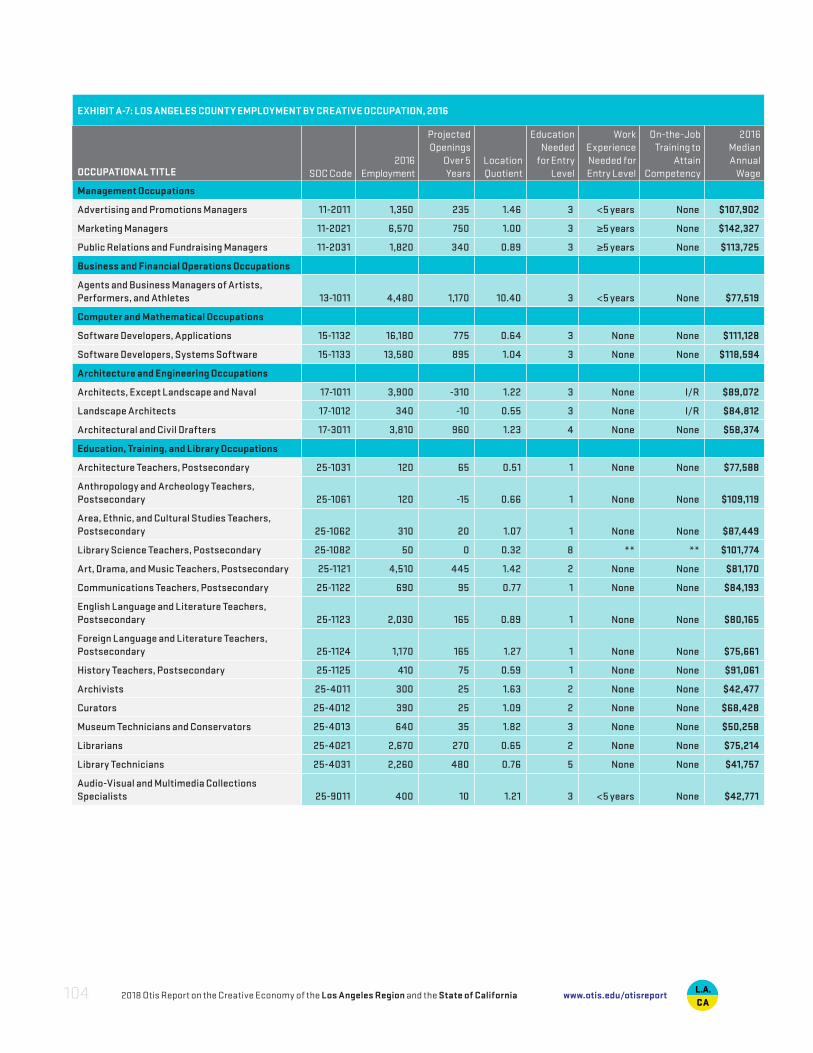
EXHIBIT A-7: LOS ANGELES COUNTY EMPLOYMENT BY CREATIVE OCCUPATION, 2016
OCCUPATIONAL TITLE SOC Code2016
Employment
Projected Openings
Over 5 Years
Location Quotient
Education Needed
for Entry Level
Work Experience Needed for Entry Level
On-the-Job Training to
Attain Competency
2016 Median Annual
Wage
Management Occupations
Advertising and Promotions Managers 11-2011 1,350 235 1.46 3 <5 years None $107,902
Marketing Managers 11-2021 6,570 750 1.00 3 ≥5 years None $142,327
Public Relations and Fundraising Managers 11-2031 1,820 340 0.89 3 ≥5 years None $113,725
Business and Financial Operations Occupations
Agents and Business Managers of Artists, Performers, and Athletes 13-1011 4,480 1,170 10.40 3 <5 years None $77,519
Computer and Mathematical Occupations
Software Developers, Applications 15-1132 16,180 775 0.64 3 None None $111,128
Software Developers, Systems Software 15-1133 13,580 895 1.04 3 None None $118,594
Architecture and Engineering Occupations
Architects, Except Landscape and Naval 17-1011 3,900 -310 1.22 3 None I/R $89,072
Landscape Architects 17-1012 340 -10 0.55 3 None I/R $84,812
Architectural and Civil Drafters 17-3011 3,810 960 1.23 4 None None $58,374
Education, Training, and Library Occupations
Architecture Teachers, Postsecondary 25-1031 120 65 0.51 1 None None $77,588
Anthropology and Archeology Teachers, Postsecondary 25-1061 120 -15 0.66 1 None None $109,119
Area, Ethnic, and Cultural Studies Teachers, Postsecondary 25-1062 310 20 1.07 1 None None $87,449
Library Science Teachers, Postsecondary 25-1082 50 0 0.32 8 ** ** $101,774
Art, Drama, and Music Teachers, Postsecondary 25-1121 4,510 445 1.42 2 None None $81,170
Communications Teachers, Postsecondary 25-1122 690 95 0.77 1 None None $84,193
English Language and Literature Teachers, Postsecondary 25-1123 2,030 165 0.89 1 None None $80,165
Foreign Language and Literature Teachers, Postsecondary 25-1124 1,170 165 1.27 1 None None $75,661
History Teachers, Postsecondary 25-1125 410 75 0.59 1 None None $91,061
Archivists 25-4011 300 25 1.63 2 None None $42,477
Curators 25-4012 390 25 1.09 2 None None $68,428
Museum Technicians and Conservators 25-4013 640 35 1.82 3 None None $50,258
Librarians 25-4021 2,670 270 0.65 2 None None $75,214
Library Technicians 25-4031 2,260 480 0.76 5 None None $41,757
Audio-Visual and Multimedia Collections Specialists 25-9011 400 10 1.21 3 <5 years None $42,771
2018 Otis Report on the Creative Economy of the Los Angeles Region and the State of California104 www.otis.edu/otisreport
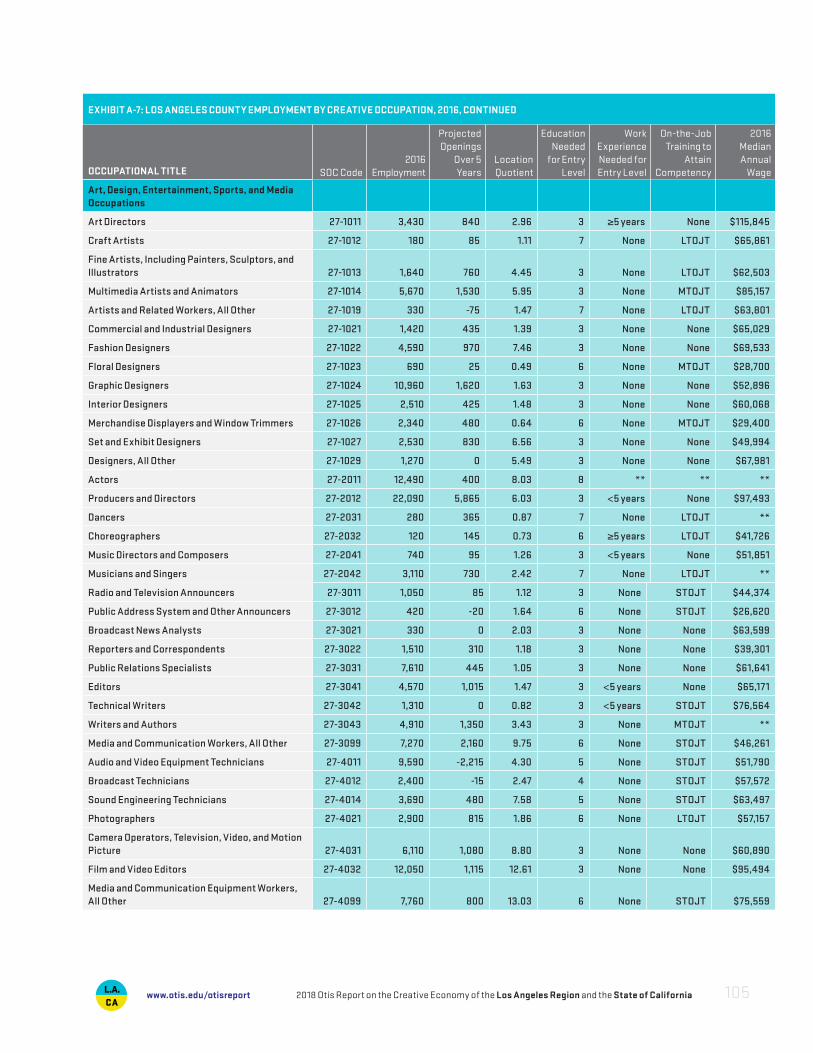
EXHIBIT A-7: LOS ANGELES COUNTY EMPLOYMENT BY CREATIVE OCCUPATION, 2016, CONTINUED
OCCUPATIONAL TITLE SOC Code2016
Employment
Projected Openings
Over 5 Years
Location Quotient
Education Needed
for Entry Level
Work Experience Needed for Entry Level
On-the-Job Training to
Attain Competency
2016 Median Annual
Wage
Art, Design, Entertainment, Sports, and Media Occupations
Art Directors 27-1011 3,430 840 2.96 3 ≥5 years None $115,845
Craft Artists 27-1012 180 85 1.11 7 None LTOJT $65,861
Fine Artists, Including Painters, Sculptors, and Illustrators 27-1013 1,640 760 4.45 3 None LTOJT $62,503
Multimedia Artists and Animators 27-1014 5,670 1,530 5.95 3 None MTOJT $85,157
Artists and Related Workers, All Other 27-1019 330 -75 1.47 7 None LTOJT $63,801
Commercial and Industrial Designers 27-1021 1,420 435 1.39 3 None None $65,029
Fashion Designers 27-1022 4,590 970 7.46 3 None None $69,533
Floral Designers 27-1023 690 25 0.49 6 None MTOJT $28,700
Graphic Designers 27-1024 10,960 1,620 1.63 3 None None $52,896
Interior Designers 27-1025 2,510 425 1.48 3 None None $60,068
Merchandise Displayers and Window Trimmers 27-1026 2,340 480 0.64 6 None MTOJT $29,400
Set and Exhibit Designers 27-1027 2,530 830 6.56 3 None None $49,994
Designers, All Other 27-1029 1,270 0 5.49 3 None None $67,981
Actors 27-2011 12,490 400 8.03 8 ** ** **
Producers and Directors 27-2012 22,090 5,865 6.03 3 <5 years None $97,493
Dancers 27-2031 280 365 0.87 7 None LTOJT **
Choreographers 27-2032 120 145 0.73 6 ≥5 years LTOJT $41,726
Music Directors and Composers 27-2041 740 95 1.26 3 <5 years None $51,851
Musicians and Singers 27-2042 3,110 730 2.42 7 None LTOJT **
Radio and Television Announcers 27-3011 1,050 85 1.12 3 None STOJT $44,374
Public Address System and Other Announcers 27-3012 420 -20 1.64 6 None STOJT $26,620
Broadcast News Analysts 27-3021 330 0 2.03 3 None None $63,599
Reporters and Correspondents 27-3022 1,510 310 1.18 3 None None $39,301
Public Relations Specialists 27-3031 7,610 445 1.05 3 None None $61,641
Editors 27-3041 4,570 1,015 1.47 3 <5 years None $65,171
Technical Writers 27-3042 1,310 0 0.82 3 <5 years STOJT $76,564
Writers and Authors 27-3043 4,910 1,350 3.43 3 None MTOJT **
Media and Communication Workers, All Other 27-3099 7,270 2,160 9.75 6 None STOJT $46,261
Audio and Video Equipment Technicians 27-4011 9,590 -2,215 4.30 5 None STOJT $51,790
Broadcast Technicians 27-4012 2,400 -15 2.47 4 None STOJT $57,572
Sound Engineering Technicians 27-4014 3,690 480 7.58 5 None STOJT $63,497
Photographers 27-4021 2,900 815 1.86 6 None LTOJT $57,157
Camera Operators, Television, Video, and Motion Picture 27-4031 6,110 1,080 8.80 3 None None $60,890
Film and Video Editors 27-4032 12,050 1,115 12.61 3 None None $95,494
Media and Communication Equipment Workers, All Other 27-4099 7,760 800 13.03 6 None STOJT $75,559
2018 Otis Report on the Creative Economy of the Los Angeles Region and the State of California 105www.otis.edu/otisreport
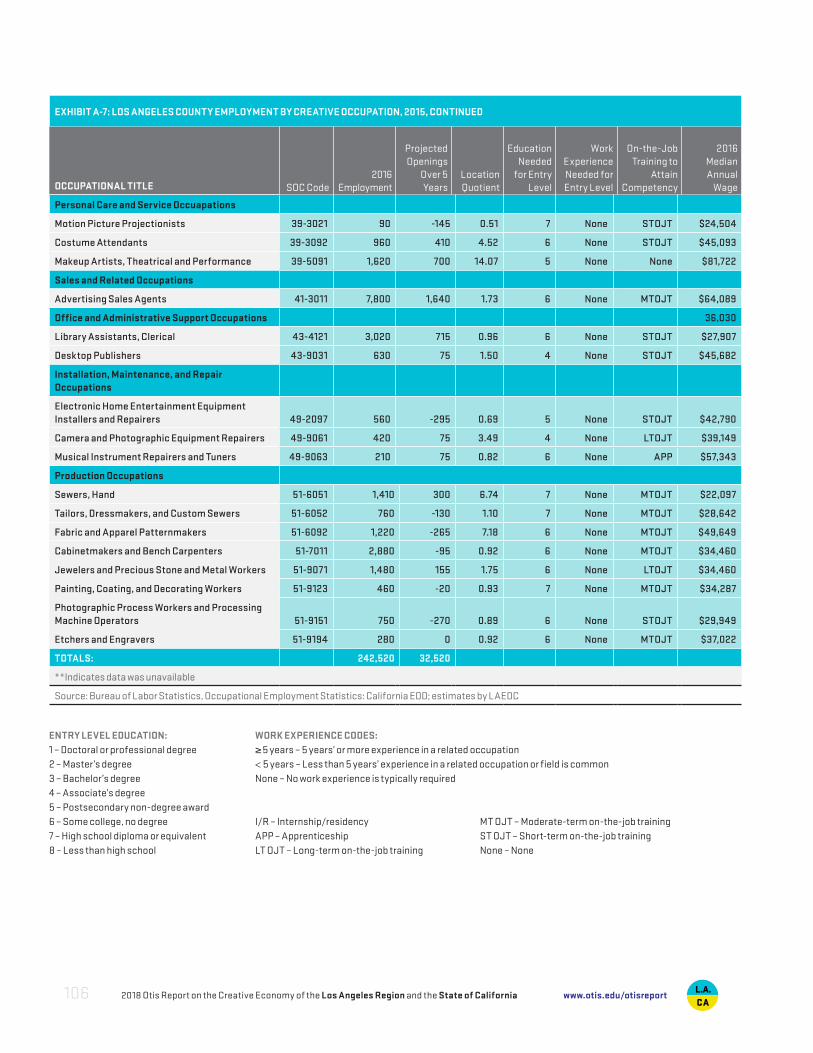
EXHIBIT A-7: LOS ANGELES COUNTY EMPLOYMENT BY CREATIVE OCCUPATION, 2015, CONTINUED
OCCUPATIONAL TITLE SOC Code2016
Employment
Projected Openings
Over 5 Years
Location Quotient
Education Needed
for Entry Level
Work Experience Needed for Entry Level
On-the-Job Training to
Attain Competency
2016 Median Annual
Wage
Personal Care and Service Occuapations
Motion Picture Projectionists 39-3021 90 -145 0.51 7 None STOJT $24,504
Costume Attendants 39-3092 960 410 4.52 6 None STOJT $45,093
Makeup Artists, Theatrical and Performance 39-5091 1,620 700 14.07 5 None None $81,722
Sales and Related Occupations
Advertising Sales Agents 41-3011 7,800 1,640 1.73 6 None MTOJT $64,089
Office and Administrative Support Occupations 36,030
Library Assistants, Clerical 43-4121 3,020 715 0.96 6 None STOJT $27,907
Desktop Publishers 43-9031 630 75 1.50 4 None STOJT $45,682
Installation, Maintenance, and Repair Occupations
Electronic Home Entertainment Equipment Installers and Repairers 49-2097 560 -295 0.69 5 None STOJT $42,790
Camera and Photographic Equipment Repairers 49-9061 420 75 3.49 4 None LTOJT $39,149
Musical Instrument Repairers and Tuners 49-9063 210 75 0.82 6 None APP $57,343
Production Occupations
Sewers, Hand 51-6051 1,410 300 6.74 7 None MTOJT $22,097
Tailors, Dressmakers, and Custom Sewers 51-6052 760 -130 1.10 7 None MTOJT $28,642
Fabric and Apparel Patternmakers 51-6092 1,220 -265 7.18 6 None MTOJT $49,649
Cabinetmakers and Bench Carpenters 51-7011 2,880 -95 0.92 6 None MTOJT $34,460
Jewelers and Precious Stone and Metal Workers 51-9071 1,480 155 1.75 6 None LTOJT $34,460
Painting, Coating, and Decorating Workers 51-9123 460 -20 0.93 7 None MTOJT $34,287
Photographic Process Workers and Processing Machine Operators 51-9151 750 -270 0.89 6 None STOJT $29,949
Etchers and Engravers 51-9194 280 0 0.92 6 None MTOJT $37,022
TOTALS: 242,520 32,520
**Indicates data was unavailable
Source: Bureau of Labor Statistics, Occupational Employment Statistics: California EDD; estimates by LAEDC
ENTRY LEVEL EDUCATION: WORK EXPERIENCE CODES:1 – Doctoral or professional degree ≥ 5 years – 5 years’ or more experience in a related occupation 2 – Master’s degree < 5 years – Less than 5 years’ experience in a related occupation or field is common 3 – Bachelor’s degree None – No work experience is typically required4 – Associate’s degree5 – Postsecondary non-degree award On-the-Job Training:6 – Some college, no degree I/R – Internship/residency MT OJT – Moderate-term on-the-job training7 – High school diploma or equivalent APP – Apprenticeship ST OJT – Short-term on-the-job training8 – Less than high school LT OJT – Long-term on-the-job training None – None
2018 Otis Report on the Creative Economy of the Los Angeles Region and the State of California106 www.otis.edu/otisreport
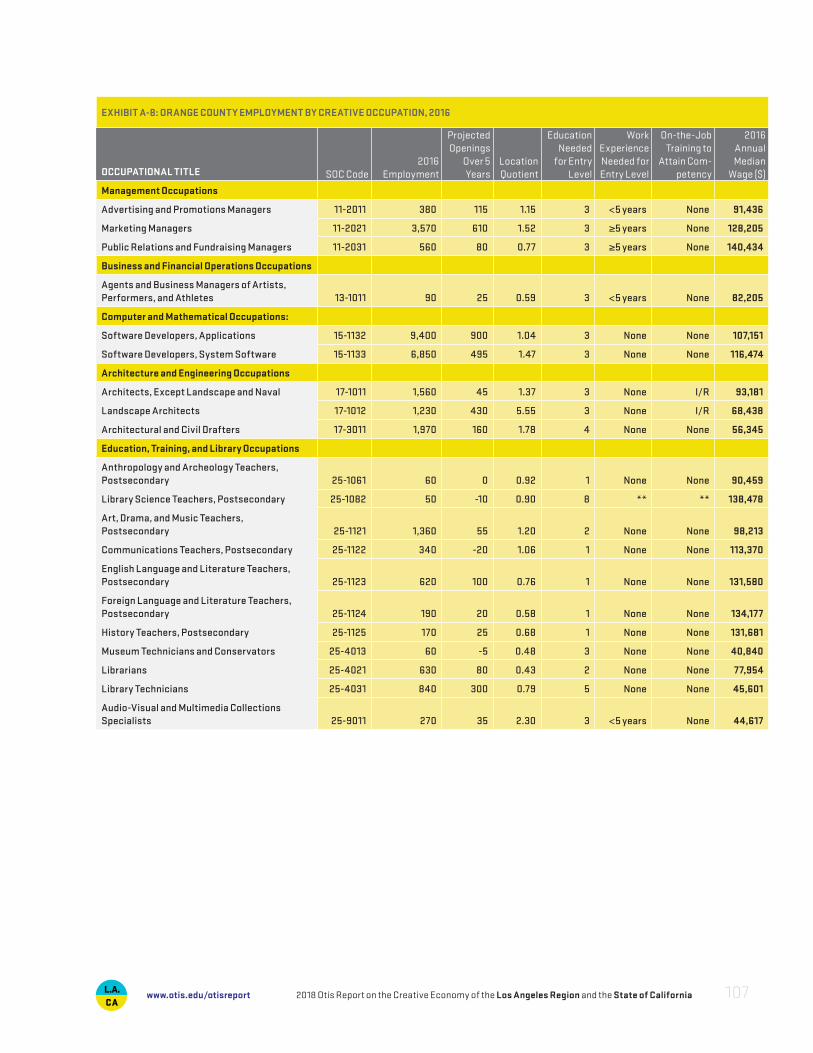
EXHIBIT A-8: ORANGE COUNTY EMPLOYMENT BY CREATIVE OCCUPATION, 2016
OCCUPATIONAL TITLE SOC Code2016
Employment
Projected Openings
Over 5 Years
Location Quotient
Education Needed
for Entry Level
Work Experience Needed for Entry Level
On-the-Job Training to
Attain Com-petency
2016 Annual Median
Wage ($)
Management Occupations
Advertising and Promotions Managers 11-2011 380 115 1.15 3 <5 years None 91,436
Marketing Managers 11-2021 3,570 610 1.52 3 ≥5 years None 128,205
Public Relations and Fundraising Managers 11-2031 560 80 0.77 3 ≥5 years None 140,434
Business and Financial Operations Occupations
Agents and Business Managers of Artists, Performers, and Athletes 13-1011 90 25 0.59 3 <5 years None 82,205
Computer and Mathematical Occupations:
Software Developers, Applications 15-1132 9,400 900 1.04 3 None None 107,151
Software Developers, System Software 15-1133 6,850 495 1.47 3 None None 116,474
Architecture and Engineering Occupations
Architects, Except Landscape and Naval 17-1011 1,560 45 1.37 3 None I/R 93,181
Landscape Architects 17-1012 1,230 430 5.55 3 None I/R 68,438
Architectural and Civil Drafters 17-3011 1,970 160 1.78 4 None None 56,345
Education, Training, and Library Occupations
Anthropology and Archeology Teachers, Postsecondary 25-1061 60 0 0.92 1 None None 90,459
Library Science Teachers, Postsecondary 25-1082 50 -10 0.90 8 ** ** 138,478
Art, Drama, and Music Teachers, Postsecondary 25-1121 1,360 55 1.20 2 None None 98,213
Communications Teachers, Postsecondary 25-1122 340 -20 1.06 1 None None 113,370
English Language and Literature Teachers, Postsecondary 25-1123 620 100 0.76 1 None None 131,580
Foreign Language and Literature Teachers, Postsecondary 25-1124 190 20 0.58 1 None None 134,177
History Teachers, Postsecondary 25-1125 170 25 0.68 1 None None 131,681
Museum Technicians and Conservators 25-4013 60 -5 0.48 3 None None 40,840
Librarians 25-4021 630 80 0.43 2 None None 77,954
Library Technicians 25-4031 840 300 0.79 5 None None 45,601
Audio-Visual and Multimedia Collections Specialists 25-9011 270 35 2.30 3 <5 years None 44,617
2018 Otis Report on the Creative Economy of the Los Angeles Region and the State of California 107www.otis.edu/otisreport
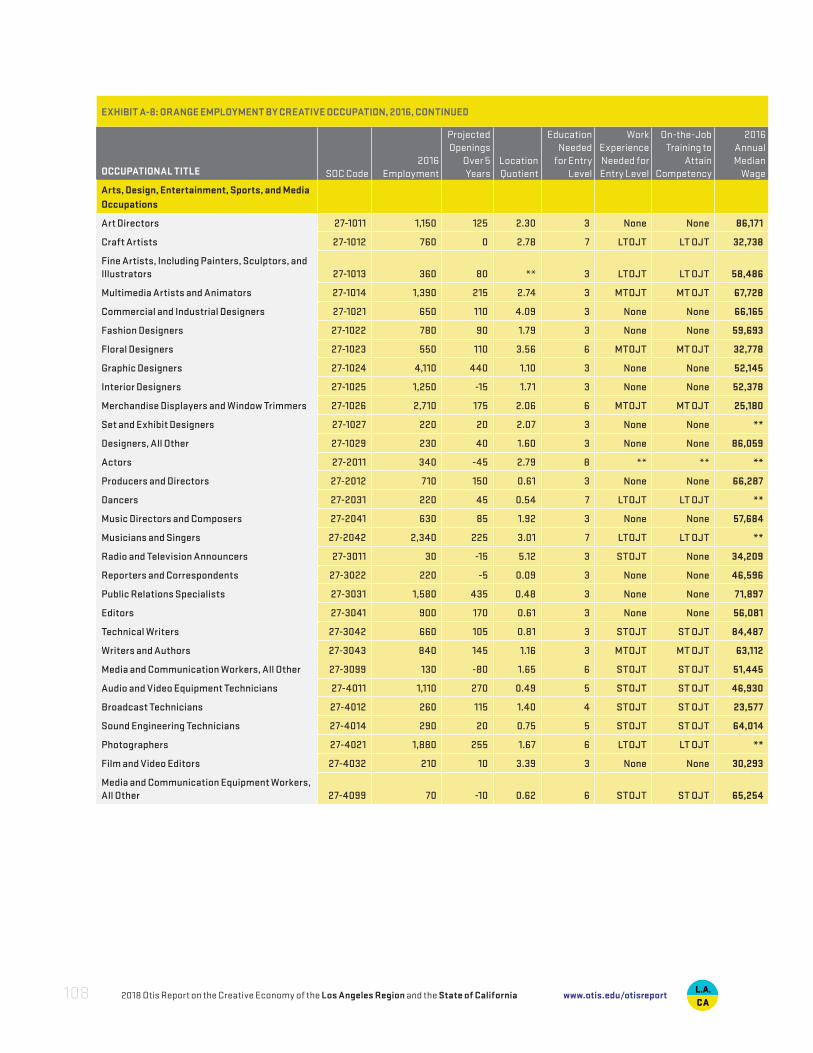
EXHIBIT A-8: ORANGE EMPLOYMENT BY CREATIVE OCCUPATION, 2016, CONTINUED
OCCUPATIONAL TITLE SOC Code2016
Employment
Projected Openings
Over 5 Years
Location Quotient
Education Needed
for Entry Level
Work Experience Needed for Entry Level
On-the-Job Training to
Attain Competency
2016 Annual Median
Wage
Arts, Design, Entertainment, Sports, and Media Occupations
Art Directors 27-1011 1,150 125 2.30 3 None None 86,171
Craft Artists 27-1012 760 0 2.78 7 LTOJT LT OJT 32,738
Fine Artists, Including Painters, Sculptors, and Illustrators 27-1013 360 80 ** 3 LTOJT LT OJT 58,486
Multimedia Artists and Animators 27-1014 1,390 215 2.74 3 MTOJT MT OJT 67,728
Commercial and Industrial Designers 27-1021 650 110 4.09 3 None None 66,165
Fashion Designers 27-1022 780 90 1.79 3 None None 59,693
Floral Designers 27-1023 550 110 3.56 6 MTOJT MT OJT 32,778
Graphic Designers 27-1024 4,110 440 1.10 3 None None 52,145
Interior Designers 27-1025 1,250 -15 1.71 3 None None 52,378
Merchandise Displayers and Window Trimmers 27-1026 2,710 175 2.06 6 MTOJT MT OJT 25,180
Set and Exhibit Designers 27-1027 220 20 2.07 3 None None **
Designers, All Other 27-1029 230 40 1.60 3 None None 86,059
Actors 27-2011 340 -45 2.79 8 ** ** **
Producers and Directors 27-2012 710 150 0.61 3 None None 66,287
Dancers 27-2031 220 45 0.54 7 LTOJT LT OJT **
Music Directors and Composers 27-2041 630 85 1.92 3 None None 57,684
Musicians and Singers 27-2042 2,340 225 3.01 7 LTOJT LT OJT **
Radio and Television Announcers 27-3011 30 -15 5.12 3 STOJT None 34,209
Reporters and Correspondents 27-3022 220 -5 0.09 3 None None 46,596
Public Relations Specialists 27-3031 1,580 435 0.48 3 None None 71,897
Editors 27-3041 900 170 0.61 3 None None 56,081
Technical Writers 27-3042 660 105 0.81 3 STOJT ST OJT 84,487
Writers and Authors 27-3043 840 145 1.16 3 MTOJT MT OJT 63,112
Media and Communication Workers, All Other 27-3099 130 -80 1.65 6 STOJT ST OJT 51,445
Audio and Video Equipment Technicians 27-4011 1,110 270 0.49 5 STOJT ST OJT 46,930
Broadcast Technicians 27-4012 260 115 1.40 4 STOJT ST OJT 23,577
Sound Engineering Technicians 27-4014 290 20 0.75 5 STOJT ST OJT 64,014
Photographers 27-4021 1,880 255 1.67 6 LTOJT LT OJT **
Film and Video Editors 27-4032 210 10 3.39 3 None None 30,293
Media and Communication Equipment Workers, All Other 27-4099 70 -10 0.62 6 STOJT ST OJT 65,254
2018 Otis Report on the Creative Economy of the Los Angeles Region and the State of California108 www.otis.edu/otisreport
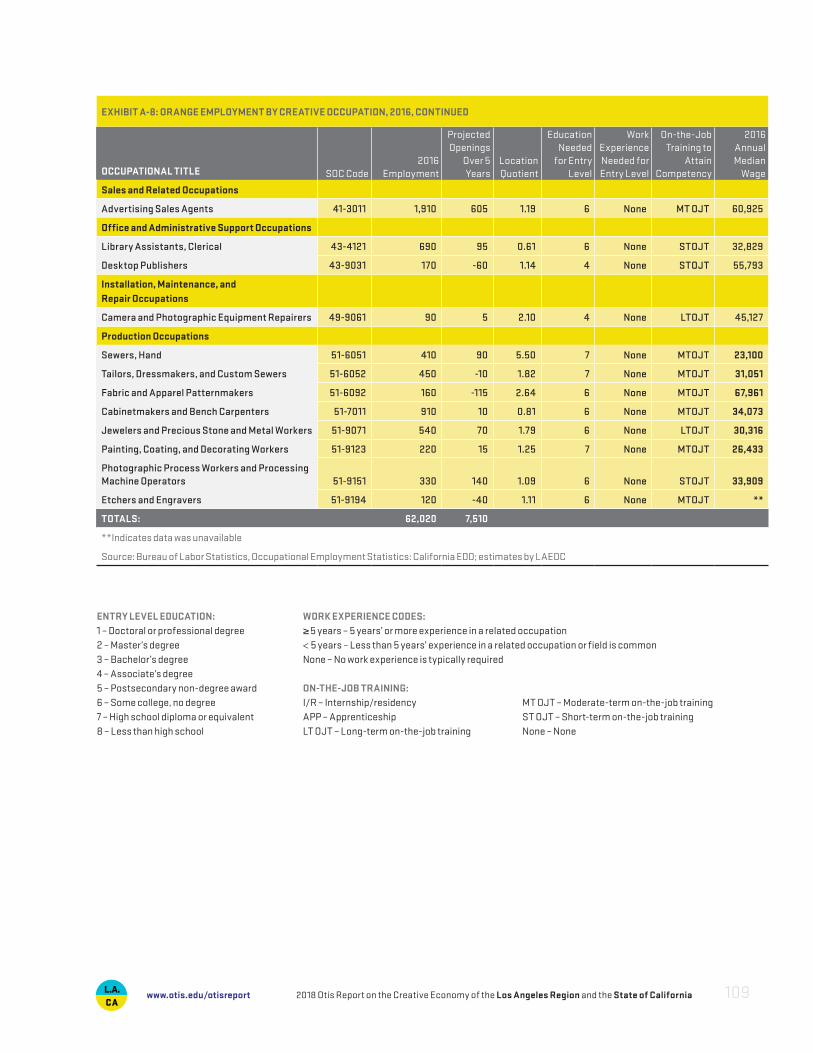
EXHIBIT A-8: ORANGE EMPLOYMENT BY CREATIVE OCCUPATION, 2016, CONTINUED
OCCUPATIONAL TITLE SOC Code2016
Employment
Projected Openings
Over 5 Years
Location Quotient
Education Needed
for Entry Level
Work Experience Needed for Entry Level
On-the-Job Training to
Attain Competency
2016 Annual Median
Wage
Sales and Related Occupations
Advertising Sales Agents 41-3011 1,910 605 1.19 6 None MT OJT 60,925
Office and Administrative Support Occupations
Library Assistants, Clerical 43-4121 690 95 0.61 6 None STOJT 32,829
Desktop Publishers 43-9031 170 -60 1.14 4 None STOJT 55,793
Installation, Maintenance, and Repair Occupations
Camera and Photographic Equipment Repairers 49-9061 90 5 2.10 4 None LTOJT 45,127
Production Occupations
Sewers, Hand 51-6051 410 90 5.50 7 None MTOJT 23,100
Tailors, Dressmakers, and Custom Sewers 51-6052 450 -10 1.82 7 None MTOJT 31,051
Fabric and Apparel Patternmakers 51-6092 160 -115 2.64 6 None MTOJT 67,961
Cabinetmakers and Bench Carpenters 51-7011 910 10 0.81 6 None MTOJT 34,073
Jewelers and Precious Stone and Metal Workers 51-9071 540 70 1.79 6 None LTOJT 30,316
Painting, Coating, and Decorating Workers 51-9123 220 15 1.25 7 None MTOJT 26,433
Photographic Process Workers and Processing Machine Operators 51-9151 330 140 1.09 6 None STOJT 33,909
Etchers and Engravers 51-9194 120 -40 1.11 6 None MTOJT **
TOTALS: 62,020 7,510
**Indicates data was unavailable
Source: Bureau of Labor Statistics, Occupational Employment Statistics: California EDD; estimates by LAEDC
ENTRY LEVEL EDUCATION: WORK EXPERIENCE CODES:1 – Doctoral or professional degree ≥ 5 years – 5 years’ or more experience in a related occupation 2 – Master’s degree < 5 years – Less than 5 years’ experience in a related occupation or field is common 3 – Bachelor’s degree None – No work experience is typically required 4 – Associate’s degree5 – Postsecondary non-degree award ON-THE-JOB TRAINING:6 – Some college, no degree I/R – Internship/residency MT OJT – Moderate-term on-the-job training7 – High school diploma or equivalent APP – Apprenticeship ST OJT – Short-term on-the-job training8 – Less than high school LT OJT – Long-term on-the-job training None – None
EXHIBIT A-8: ORANGE EMPLOYMENT BY CREATIVE OCCUPATION, 2016, CONTINUED
OCCUPATIONAL TITLE SOC Code2016
Employment
Projected Openings
Over 5 Years
Location Quotient
Education Needed
for Entry Level
Work Experience Needed for Entry Level
On-the-Job Training to
Attain Competency
2016 Annual Median
Wage
Arts, Design, Entertainment, Sports, and Media Occupations
Art Directors 27-1011 1,150 125 2.30 3 None None 86,171
Craft Artists 27-1012 760 0 2.78 7 LTOJT LT OJT 32,738
Fine Artists, Including Painters, Sculptors, and Illustrators 27-1013 360 80 ** 3 LTOJT LT OJT 58,486
Multimedia Artists and Animators 27-1014 1,390 215 2.74 3 MTOJT MT OJT 67,728
Commercial and Industrial Designers 27-1021 650 110 4.09 3 None None 66,165
Fashion Designers 27-1022 780 90 1.79 3 None None 59,693
Floral Designers 27-1023 550 110 3.56 6 MTOJT MT OJT 32,778
Graphic Designers 27-1024 4,110 440 1.10 3 None None 52,145
Interior Designers 27-1025 1,250 -15 1.71 3 None None 52,378
Merchandise Displayers and Window Trimmers 27-1026 2,710 175 2.06 6 MTOJT MT OJT 25,180
Set and Exhibit Designers 27-1027 220 20 2.07 3 None None **
Designers, All Other 27-1029 230 40 1.60 3 None None 86,059
Actors 27-2011 340 -45 2.79 8 ** ** **
Producers and Directors 27-2012 710 150 0.61 3 None None 66,287
Dancers 27-2031 220 45 0.54 7 LTOJT LT OJT **
Music Directors and Composers 27-2041 630 85 1.92 3 None None 57,684
Musicians and Singers 27-2042 2,340 225 3.01 7 LTOJT LT OJT **
Radio and Television Announcers 27-3011 30 -15 5.12 3 STOJT None 34,209
Reporters and Correspondents 27-3022 220 -5 0.09 3 None None 46,596
Public Relations Specialists 27-3031 1,580 435 0.48 3 None None 71,897
Editors 27-3041 900 170 0.61 3 None None 56,081
Technical Writers 27-3042 660 105 0.81 3 STOJT ST OJT 84,487
Writers and Authors 27-3043 840 145 1.16 3 MTOJT MT OJT 63,112
Media and Communication Workers, All Other 27-3099 130 -80 1.65 6 STOJT ST OJT 51,445
Audio and Video Equipment Technicians 27-4011 1,110 270 0.49 5 STOJT ST OJT 46,930
Broadcast Technicians 27-4012 260 115 1.40 4 STOJT ST OJT 23,577
Sound Engineering Technicians 27-4014 290 20 0.75 5 STOJT ST OJT 64,014
Photographers 27-4021 1,880 255 1.67 6 LTOJT LT OJT **
Film and Video Editors 27-4032 210 10 3.39 3 None None 30,293
Media and Communication Equipment Workers, All Other 27-4099 70 -10 0.62 6 STOJT ST OJT 65,254
2018 Otis Report on the Creative Economy of the Los Angeles Region and the State of California 109www.otis.edu/otisreport
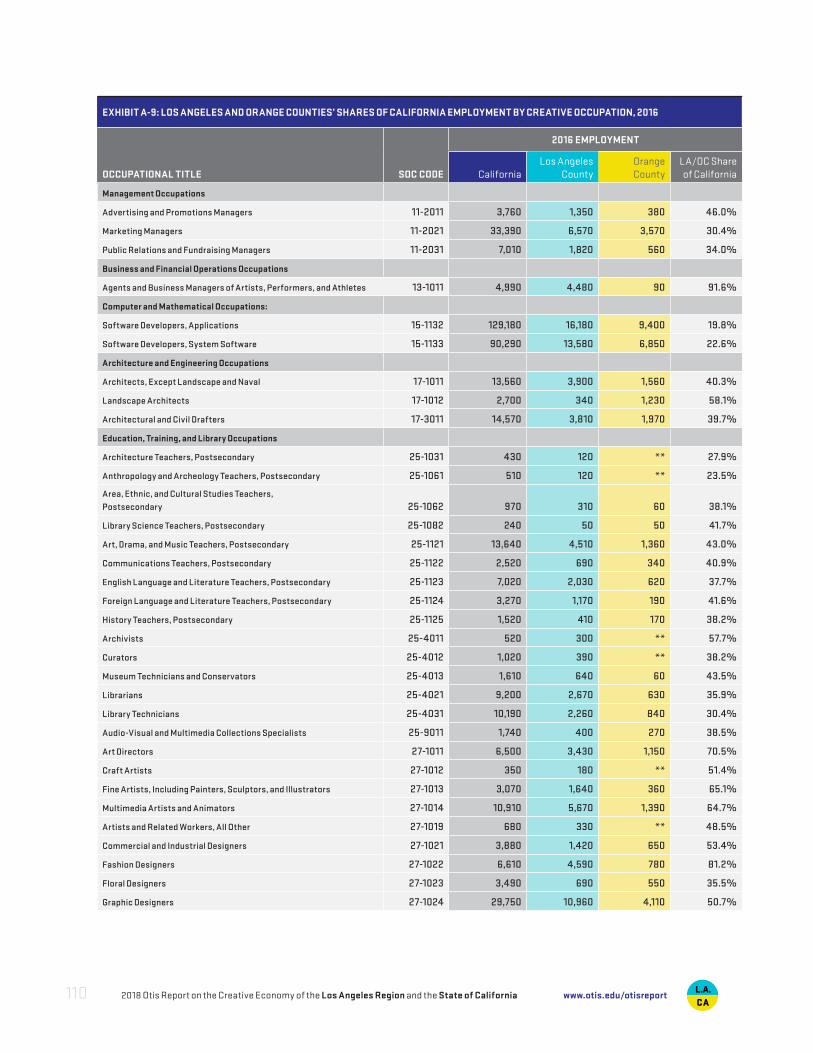
EXHIBIT A-9: LOS ANGELES AND ORANGE COUNTIES’ SHARES OF CALIFORNIA EMPLOYMENT BY CREATIVE OCCUPATION, 2016
OCCUPATIONAL TITLE SOC CODE
2016 EMPLOYMENT
CaliforniaLos Angeles
CountyOrange County
LA/OC Share of California
Management Occupations
Advertising and Promotions Managers 11-2011 3,760 1,350 380 46.0%
Marketing Managers 11-2021 33,390 6,570 3,570 30.4%
Public Relations and Fundraising Managers 11-2031 7,010 1,820 560 34.0%
Business and Financial Operations Occupations
Agents and Business Managers of Artists, Performers, and Athletes 13-1011 4,990 4,480 90 91.6%
Computer and Mathematical Occupations:
Software Developers, Applications 15-1132 129,180 16,180 9,400 19.8%
Software Developers, System Software 15-1133 90,290 13,580 6,850 22.6%
Architecture and Engineering Occupations
Architects, Except Landscape and Naval 17-1011 13,560 3,900 1,560 40.3%
Landscape Architects 17-1012 2,700 340 1,230 58.1%
Architectural and Civil Drafters 17-3011 14,570 3,810 1,970 39.7%
Education, Training, and Library Occupations
Architecture Teachers, Postsecondary 25-1031 430 120 ** 27.9%
Anthropology and Archeology Teachers, Postsecondary 25-1061 510 120 ** 23.5%
Area, Ethnic, and Cultural Studies Teachers, Postsecondary 25-1062 970 310 60 38.1%
Library Science Teachers, Postsecondary 25-1082 240 50 50 41.7%
Art, Drama, and Music Teachers, Postsecondary 25-1121 13,640 4,510 1,360 43.0%
Communications Teachers, Postsecondary 25-1122 2,520 690 340 40.9%
English Language and Literature Teachers, Postsecondary 25-1123 7,020 2,030 620 37.7%
Foreign Language and Literature Teachers, Postsecondary 25-1124 3,270 1,170 190 41.6%
History Teachers, Postsecondary 25-1125 1,520 410 170 38.2%
Archivists 25-4011 520 300 ** 57.7%
Curators 25-4012 1,020 390 ** 38.2%
Museum Technicians and Conservators 25-4013 1,610 640 60 43.5%
Librarians 25-4021 9,200 2,670 630 35.9%
Library Technicians 25-4031 10,190 2,260 840 30.4%
Audio-Visual and Multimedia Collections Specialists 25-9011 1,740 400 270 38.5%
Art Directors 27-1011 6,500 3,430 1,150 70.5%
Craft Artists 27-1012 350 180 ** 51.4%
Fine Artists, Including Painters, Sculptors, and Illustrators 27-1013 3,070 1,640 360 65.1%
Multimedia Artists and Animators 27-1014 10,910 5,670 1,390 64.7%
Artists and Related Workers, All Other 27-1019 680 330 ** 48.5%
Commercial and Industrial Designers 27-1021 3,880 1,420 650 53.4%
Fashion Designers 27-1022 6,610 4,590 780 81.2%
Floral Designers 27-1023 3,490 690 550 35.5%
Graphic Designers 27-1024 29,750 10,960 4,110 50.7%
2018 Otis Report on the Creative Economy of the Los Angeles Region and the State of California110 www.otis.edu/otisreport
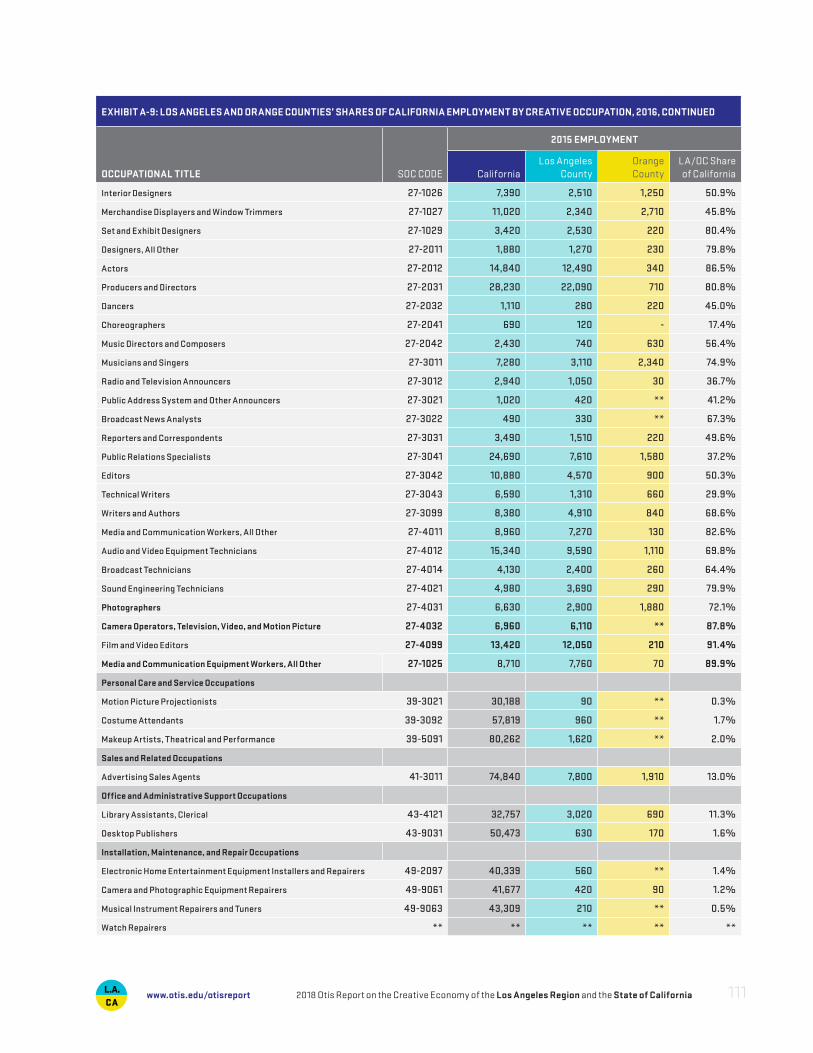
EXHIBIT A-9: LOS ANGELES AND ORANGE COUNTIES’ SHARES OF CALIFORNIA EMPLOYMENT BY CREATIVE OCCUPATION, 2016, CONTINUED
OCCUPATIONAL TITLE SOC CODE
2015 EMPLOYMENT
CaliforniaLos Angeles
CountyOrange County
LA/OC Share of California
Interior Designers 27-1026 7,390 2,510 1,250 50.9%
Merchandise Displayers and Window Trimmers 27-1027 11,020 2,340 2,710 45.8%
Set and Exhibit Designers 27-1029 3,420 2,530 220 80.4%
Designers, All Other 27-2011 1,880 1,270 230 79.8%
Actors 27-2012 14,840 12,490 340 86.5%
Producers and Directors 27-2031 28,230 22,090 710 80.8%
Dancers 27-2032 1,110 280 220 45.0%
Choreographers 27-2041 690 120 - 17.4%
Music Directors and Composers 27-2042 2,430 740 630 56.4%
Musicians and Singers 27-3011 7,280 3,110 2,340 74.9%
Radio and Television Announcers 27-3012 2,940 1,050 30 36.7%
Public Address System and Other Announcers 27-3021 1,020 420 ** 41.2%
Broadcast News Analysts 27-3022 490 330 ** 67.3%
Reporters and Correspondents 27-3031 3,490 1,510 220 49.6%
Public Relations Specialists 27-3041 24,690 7,610 1,580 37.2%
Editors 27-3042 10,880 4,570 900 50.3%
Technical Writers 27-3043 6,590 1,310 660 29.9%
Writers and Authors 27-3099 8,380 4,910 840 68.6%
Media and Communication Workers, All Other 27-4011 8,960 7,270 130 82.6%
Audio and Video Equipment Technicians 27-4012 15,340 9,590 1,110 69.8%
Broadcast Technicians 27-4014 4,130 2,400 260 64.4%
Sound Engineering Technicians 27-4021 4,980 3,690 290 79.9%
Photographers 27-4031 6,630 2,900 1,880 72.1%
Camera Operators, Television, Video, and Motion Picture 27-4032 6,960 6,110 ** 87.8%
Film and Video Editors 27-4099 13,420 12,050 210 91.4%
Media and Communication Equipment Workers, All Other 27-1025 8,710 7,760 70 89.9%
Personal Care and Service Occupations
Motion Picture Projectionists 39-3021 30,188 90 ** 0.3%
Costume Attendants 39-3092 57,819 960 ** 1.7%
Makeup Artists, Theatrical and Performance 39-5091 80,262 1,620 ** 2.0%
Sales and Related Occupations
Advertising Sales Agents 41-3011 74,840 7,800 1,910 13.0%
Office and Administrative Support Occupations
Library Assistants, Clerical 43-4121 32,757 3,020 690 11.3%
Desktop Publishers 43-9031 50,473 630 170 1.6%
Installation, Maintenance, and Repair Occupations
Electronic Home Entertainment Equipment Installers and Repairers 49-2097 40,339 560 ** 1.4%
Camera and Photographic Equipment Repairers 49-9061 41,677 420 90 1.2%
Musical Instrument Repairers and Tuners 49-9063 43,309 210 ** 0.5%
Watch Repairers ** ** ** ** **
EXHIBIT A-9: LOS ANGELES AND ORANGE COUNTIES’ SHARES OF CALIFORNIA EMPLOYMENT BY CREATIVE OCCUPATION, 2016
OCCUPATIONAL TITLE SOC CODE
2016 EMPLOYMENT
CaliforniaLos Angeles
CountyOrange County
LA/OC Share of California
Management Occupations
Advertising and Promotions Managers 11-2011 3,760 1,350 380 46.0%
Marketing Managers 11-2021 33,390 6,570 3,570 30.4%
Public Relations and Fundraising Managers 11-2031 7,010 1,820 560 34.0%
Business and Financial Operations Occupations
Agents and Business Managers of Artists, Performers, and Athletes 13-1011 4,990 4,480 90 91.6%
Computer and Mathematical Occupations:
Software Developers, Applications 15-1132 129,180 16,180 9,400 19.8%
Software Developers, System Software 15-1133 90,290 13,580 6,850 22.6%
Architecture and Engineering Occupations
Architects, Except Landscape and Naval 17-1011 13,560 3,900 1,560 40.3%
Landscape Architects 17-1012 2,700 340 1,230 58.1%
Architectural and Civil Drafters 17-3011 14,570 3,810 1,970 39.7%
Education, Training, and Library Occupations
Architecture Teachers, Postsecondary 25-1031 430 120 ** 27.9%
Anthropology and Archeology Teachers, Postsecondary 25-1061 510 120 ** 23.5%
Area, Ethnic, and Cultural Studies Teachers, Postsecondary 25-1062 970 310 60 38.1%
Library Science Teachers, Postsecondary 25-1082 240 50 50 41.7%
Art, Drama, and Music Teachers, Postsecondary 25-1121 13,640 4,510 1,360 43.0%
Communications Teachers, Postsecondary 25-1122 2,520 690 340 40.9%
English Language and Literature Teachers, Postsecondary 25-1123 7,020 2,030 620 37.7%
Foreign Language and Literature Teachers, Postsecondary 25-1124 3,270 1,170 190 41.6%
History Teachers, Postsecondary 25-1125 1,520 410 170 38.2%
Archivists 25-4011 520 300 ** 57.7%
Curators 25-4012 1,020 390 ** 38.2%
Museum Technicians and Conservators 25-4013 1,610 640 60 43.5%
Librarians 25-4021 9,200 2,670 630 35.9%
Library Technicians 25-4031 10,190 2,260 840 30.4%
Audio-Visual and Multimedia Collections Specialists 25-9011 1,740 400 270 38.5%
Art Directors 27-1011 6,500 3,430 1,150 70.5%
Craft Artists 27-1012 350 180 ** 51.4%
Fine Artists, Including Painters, Sculptors, and Illustrators 27-1013 3,070 1,640 360 65.1%
Multimedia Artists and Animators 27-1014 10,910 5,670 1,390 64.7%
Artists and Related Workers, All Other 27-1019 680 330 ** 48.5%
Commercial and Industrial Designers 27-1021 3,880 1,420 650 53.4%
Fashion Designers 27-1022 6,610 4,590 780 81.2%
Floral Designers 27-1023 3,490 690 550 35.5%
Graphic Designers 27-1024 29,750 10,960 4,110 50.7%
2018 Otis Report on the Creative Economy of the Los Angeles Region and the State of California 111www.otis.edu/otisreport
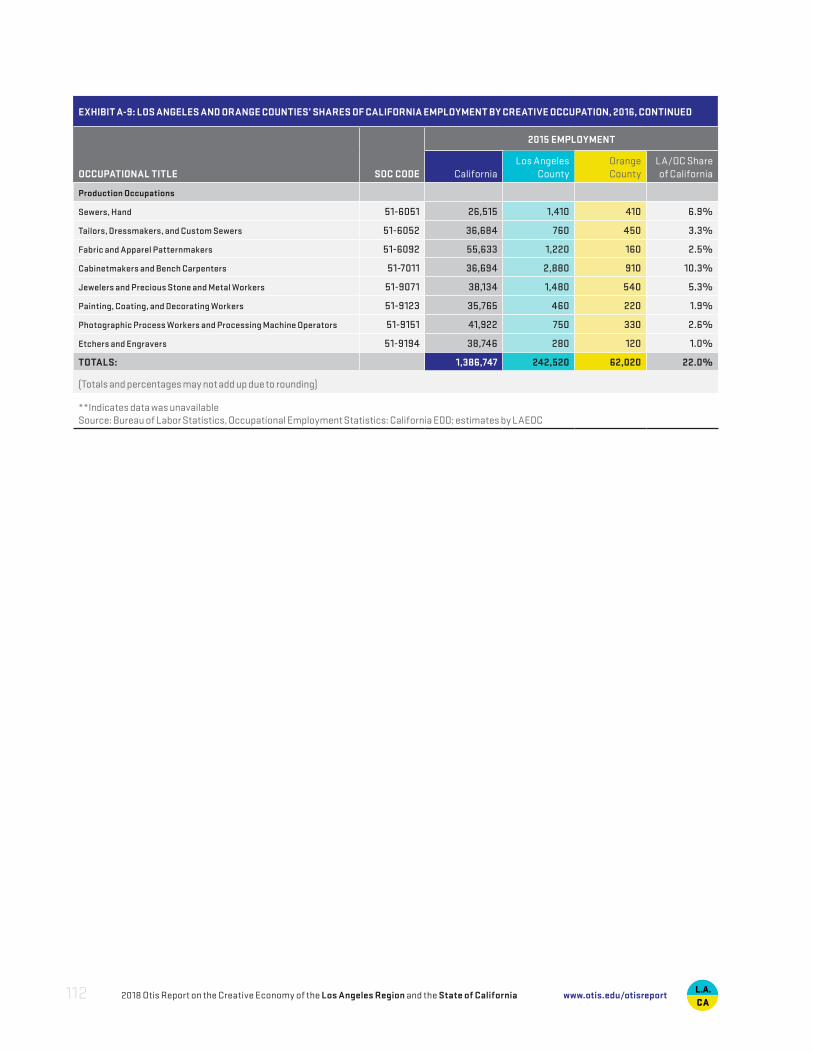
EXHIBIT A-9: LOS ANGELES AND ORANGE COUNTIES’ SHARES OF CALIFORNIA EMPLOYMENT BY CREATIVE OCCUPATION, 2016, CONTINUED
OCCUPATIONAL TITLE SOC CODE
2015 EMPLOYMENT
CaliforniaLos Angeles
CountyOrange County
LA/OC Share of California
Production Occupations
Sewers, Hand 51-6051 26,515 1,410 410 6.9%
Tailors, Dressmakers, and Custom Sewers 51-6052 36,684 760 450 3.3%
Fabric and Apparel Patternmakers 51-6092 55,633 1,220 160 2.5%
Cabinetmakers and Bench Carpenters 51-7011 36,694 2,880 910 10.3%
Jewelers and Precious Stone and Metal Workers 51-9071 38,134 1,480 540 5.3%
Painting, Coating, and Decorating Workers 51-9123 35,765 460 220 1.9%
Photographic Process Workers and Processing Machine Operators 51-9151 41,922 750 330 2.6%
Etchers and Engravers 51-9194 38,746 280 120 1.0%
TOTALS: 1,386,747 242,520 62,020 22.0%
(Totals and percentages may not add up due to rounding)
**Indicates data was unavailable Source: Bureau of Labor Statistics, Occupational Employment Statistics: California EDD; estimates by LAEDC
2018 Otis Report on the Creative Economy of the Los Angeles Region and the State of California112 www.otis.edu/otisreport
2018 Otis Report on the Creative Economy of the Los Angeles Region and the State of California 113www.otis.edu/otisreport
COMMENTARIESANGIE KIM 114President and CEO, Center for Cultural Innovation
STEVE MCADAM 117Chair of Product Design, Otis College of Art and Design
MARK SLAVKIN 120Director of Education, Wallis Annenberg Center for the Performing Arts
TACY TROWBRIDGE 124Global Lead for Education Programs, Adobe Systems
Funding for this Addendum provided by
ADDENDUM

2018 Otis Report on the Creative Economy of the Los Angeles Region and the State of California114 www.otis.edu/otisreport
COMMENTARIES
ANGIE KIM, CENTER FOR CULTURAL INNOVATION Center for Cultural Innovation’s (CCI’s) entire purpose is to support individuals in the arts—fine artists, community-based practitioners, cultural workers, creative entre-preneurs, and nonprofit arts professionals. However, we’re spending a large amount of time meeting with people outside of the arts. This is because arts workers, cultural producers, and creative entrepreneurs are having more and more opportunities to bridge the conventional nonprofit/for-profit divide, mostly because of generational attitudinal changes, demographic shifts, and technological advances. Instead of feel-ing saddled by inherited structures, we’re seeing how people are thinking and acting differently in order to affect change. Over the past three years, CCI has researched generational attitudinal changes in the arts. What we see is that millennials want to have both financial sustainability and meaningfulness. They don’t see the two as being divided between professional and personal activities, as in the past. Millennials have already influenced corporate cultures to offer employees values-based benefits, such as social-impact alignment, time for volunteering, equity-ownership, and environmentally friendly business practices. In many ways, nonprofit em-ployers can satisfy millennial’s desire for meaningful work, but this sector has lagged behind in offering better financial sustainability models. Why aren’t nonprofits also thinking about how to better align with environmentally friendly practices, better benefits, or cooperative ownership for its workers? To help artists work in that highly desirable space of both financial sus-tainability and meaningfulness, CCI has supported artists’ social-impact for-profit enterprises; introduced them to benefit and social purpose corporate structures and shared-equity ownership models; and helped them understand how to use technologi-cal platforms to become self-sufficient. New regulations and tools are now available for artists to become more independent and productive, and we need to do more to support their venture into these uncharted territories.
“Arts workers, cultural producers, and creative entrepreneurs are having more and more opportunities to bridge the conventional nonprofit/for-profit divide, mostly because of generational attitudinal changes, demographic shifts, and technological advances.” — Angie Kim
2018 Otis Report on the Creative Economy of the Los Angeles Region and the State of California 115www.otis.edu/otisreport
Because of demographic shifts, people of color are finally ascending to leadership roles. This has fundamentally changed, for the better, priorities, values, and objectives of the arts field. It used to be that the term “artist” only meant studio-based, academically and classically trained, professionalized practitioners. Now, the term “artist” has expanded to be that plus those who are self-taught, those with unconventional mediums (we’ve supported artists whose mediums are sausages, tortillas, and hair—not all the same art-ist!), or those who are engaged politically and socially. By opening the proverbial studio “box,” it’s finally starting to be acceptable for artists to blend their personal and political identity with their artistic one (although we still have a ways to go). Technology has taken each of these influential change factors to scale. One of the most compelling explanations I’ve heard of the impact of technology is that it shifts power to the individual. Artists can use crowdfunding platforms to appeal directly to investors and supporters in ways that are faster, more direct, and more toward artists’ various ambitions than traditional sources of support. Neither institutional philanthropy nor crowdfunding is perfect, but the availability of both should be celebrated.
In addition, technology enables artists to skip over expensive middlemen—producers, agents, gallerists—to go straight to fans, followers, consumers, supporters, and backers anywhere around the world. Today, creatives entrepreneurs, artists, and cultural workers use technologically enabled platforms to move out of expensive cities to lower cost-of-living, higher quality-of-life communities; quit their day jobs; and become fully financially sustained through their online storefronts. Technology has realized a level of mission fulfillment that many brick-and-mortar artist-support institutions have long dreamed of (CCI included).
Combining technological possibilities with the values and priorities of millennials and those who have been marginalized has led to a pursuit of alternatives to extractive-based capitalism, in which too few get wealthy on the backs of people and the planet. This is across all sectors. We’re seeing alternative models of giving, which have less to do with institutional philanthropy, that ask, “How can everyone within a community become self-sufficient?” This is a shift from privileging elite institutions as sources of opportunities to empowering those at the individual-community level to circulate wealth, resources, and assets on their own terms. Clearly, this shift in financial and non-profit economics hasn’t yet been fully realized, but there is growing momentum for this as both millennials and those who have been marginalized are setting the priorities for this country.
In the wake of such change, art schools have a new opportunity to rethink their business model, social purpose, and training curriculum. For example, there is unprecedented market demand for people looking to artists to be social problem solvers. Also, busi-nesses of Silicon Valley are saying, “We really value creatives.” We’re in this really amaz-ing moment when it’s no longer as necessary to talk about validating creativity as we did in the last part of the 20th century. When I sit down with people working on low-wage workers’ rights, health care, poverty, economic development, or democracy, they pretty much uniformly agree that artists—their ability to capture hearts and minds—is what they need for their causes.
2018 Otis Report on the Creative Economy of the Los Angeles Region and the State of California116 www.otis.edu/otisreport
Yet, many art schools lag behind in preparing and connecting artists with the ideas, people, and tools to step into these new opportunities. Fine arts students, not only those in creative entrepreneurship programs, should be trained in business practices, which all artists need for financial independence. Also, while art school classes that integrate content of governance, democracy, and social issues are on the rise, their scope and depth are not expanding fast enough for more graduates to be knowledgeable and experts in driving change when they step into society. Moreover, in this moment when there is significant money and demand for artist-driven platform enterprises, too few art schools are introducing students to the very networks they’ll need to take their social im-pact ideas to scale. There’s a general acknowledgement in this country that 20th century experiments of capitalism, institution-building, and training have run their course. All this indicates that this is the moment for artists—agitators, critics, imaginers, designers, and articulators—yet academically based professionalization of artists too often falls short in supporting artists’ revolutionary potential. Society needs art schools to affect a creative work force that is empowered with artistic and social knowledge, key relation-ships, and financial assets. Generating pipelines of artists who are indebted, siloed, and unsustainable in their practice is a drag on individual, family, and social resources, and it’s one of the arts sector’s social justice problems.
Otis College is one of the bright spots when it comes to preparing artists for this century. An example of this is its leadership in producing the Otis Report that demonstrates that the intersection of the arts and economy matters to a healthy community. When CCI staff goes around the country, people cite the Otis Report as a model to emulate. It’s the 10th anniversary of the Otis Report, and the need for this report has not diminished. Because of its regularity, it’s a way to not only understand the contemporaneous land-scape but also to understand how the arts sectors are changing in significant ways. A suggestion I would make is to be sure that arts workers, of diverse types, who are outside of formalized institutional structures be counted, as artists working in the margins are growing in number. Artist cooperatives or their platform-based entities might be good data souces. All research endeavors, especially going forward, will need to work harder to capture and understand a diversifying range of individual arts-labor behavior. In this change moment, it’s important to pay attention to the activities happening at the mar-gins because those tell the story of what the upcoming decades will look like and what we should be doing now to set the future up for success.
Angie Kim is the President and CEO of the Center for Cultural Innovation in Los Angeles, CA.
2018 Otis Report on the Creative Economy of the Los Angeles Region and the State of California 117www.otis.edu/otisreport
COMMENTARIES
STEVE MCADAM, OTIS COLLEGE OF ART AND DESIGN Most students coming into school today are unaware of their own individual creative pro-cess: how it works, what stimulates it, what sets it in motion, or how to express it. Creativ-ity is a key success driver in the creative economy, and students that come out of higher education need to know how to engage their creativity, how to manage their individual creative process, and how to apply it to whatever endeavor they are involved in. A study was done a few years ago by the Industrial Design Society (IDSA) that asked Fortune 500 companies for the key attributes they were looking for in college graduates. Highest on the list was to be creative, to be able to foster creativity, to continually come up with ideas, and to be self-inspired. Training young creatives in these skills is the biggest challenge facing higher education institutions as it demands rethinking our educational models. The gifted creative students in our department have a will to create and learn un-like other students, and they inspire creativity in each other. Unfortunately, higher education lags behind in creating the educational environments that help nurture creative thinking in all students. The common educational model is a like a funnel: Diverse students start at the top and as they move down they all develop the same skills and compete for the same jobs. Consequently, they are ill prepared to adapt their skills and thinking to tackle new design challenges or fulfill the needs of a chang-ing industry.
A more effective model is broader in which students come into a program with interests outside the dis-cipline. Students share with each other and integrate with a wide variety of multidisciplinary skills, content, philosophies, and perspectives. Unique ideas, novel thinking, and creativity emerge from this integrated environment. This educational model provides students with the building blocks to think differently through exploration, experimentation, integration, and discovery, which fosters curiosity and triggers the creative process. What I would like to see in higher education is a change in focus from an outcome-driven industry-directed vocation to allowing students to develop their own individual affinities and integrate those interests with multidisciplinary skills. This educational approach produces creative thinkers and innovative makers who are adaptable and can apply a wide range of skills to solve complex problems of our inte-grated world, propelling the creative economy.
“What I would like to see in higher education is a change in focus from an outcome-driven industry-directed vocation to allowing students to develop their own individual affinities and integrate those interests with multidisciplinary skills.” — Steve McAdam
2018 Otis Report on the Creative Economy of the Los Angeles Region and the State of California118 www.otis.edu/otisreport
The ascendancy of innovative technology continues to fuel economic growth and elevate the value of creativity from being merely a positive trait to a highly sought after asset. Higher education will need to play an even greater role in preparing creative talent by developing adaptive curriculum that keeps pace with expectations of employers, which often shift before a student completes a four-year degree. In this environment of the creative economy, where multidisciplinary teams are increasingly used in the devel-opment of products, services, and experiences, the designer is becoming more like a film director who tells his or her production team—the camera person, sound person, lighting, makeup, wardrobe, special effects, actors and actresses, and so on—the vision for the movie and how the story is to be told. Similarly, the designer will articulate the idea, the product, the functionality, and its value. So designers have to learn how to communicate, to persuade, and articulate their ideas in compelling ways to gain adoption for them. In order to do that, students need to use critical thinking and creativity to understand the idea, and how to really see it, because if they don’t see it, they can’t say it.
The industries of the creative economy are blending and integrating to become new enti-ties with new business models and markets. We want to make sure students understand that learning is a lifelong process, and if they have the cognitive and non-cognitive skills necessary, and most importantly the critical thinking and creativity, they will be to thrive and survive. The role of higher education is to train this new breed of designer that will be able to fulfil the jobs of today and the emerging jobs of tomorrow. If higher education plays its part, designers will be able to adapt to the creative economy as it changes and will more likely sustain a career path.
Hiring managers are telling us that the most important trait they are looking for in new hires is evidence of creativity and critical thinking. Next, they want good integrators that are able to integrate information, science, technology, materials, and processes from industries and sources. Third, they want great communicators in 2D and 3D, writing and presenting, and the ability to influence people and get them excited about an idea. Fi-nally, hiring managers aren’t interested in students capable of making cool stuff without knowing why. They want to see if students know how to combine their creativity with design thinking, business strategy, and entrepreneurship to drive those ideas to the mar-ket. In our program we’ve come to realize that it is important to partner with each student in assessing what they are really good at and what they are not so good at, and be able to know how to outsource those skills to someone else who can do it better than they can. The school experience should help students identify and explain their unique skill sets. If students can do that much, there is a wide variety of career paths available to them and their confidence starts to build. The Greeks emphasized the productive use of one’s free time as a means to recharge and stimulate creativity. And our physical body was built to stay in motion so the muscles don’t atrophy and become dysfunctional. Similarly, the brain and creativity have to be stimulated, and curiosity plays a key role in engaging our creativity. The use of free time
2018 Otis Report on the Creative Economy of the Los Angeles Region and the State of California 119www.otis.edu/otisreport
to place our attention on something other than our work makes us more receptive to new things. When we see something out of the ordinary, or that disrupts what we know, it trig-gers our curiosity to investigate and gain more insight into what it is and what its potential may be. These creative excursions disrupt the normal way we see something and can produce ideas that lead to profound innovations.
The word innovation itself means to disrupt tradition, to change tradition into something new, and that means you have to put aside routine thinking. The reason personnel in many companies and institutions begin to struggle with maintaining a high level of creative and innovative thinking is that the corporate environment and its activities lack diversity and stimulation, resulting in predictable routines and outcomes. The day-to-day routine with individuals at companies and institutions slowly becomes the embalming fluid of creativ-ity. So to keep creativity continuously developing we need to keep providing it with new experiences and disruptive thinking that leads to new insights and ideas. For example, here at Otis in our clay studio, we have two executives (one from Sketchers Shoes and the other from SpaceX) taking a clay class at night after work. One would imagine both of these individuals have very little time to do anything but work given the success of each company. But they go into the clay class because the clay allows them to diffuse the pres-sures of the job, frees up their mind, and gets them back into a free-thinking space. That is, they are using their free time creatively and productively. Many years ago, I was working on a television series for KCET called The Living Legends, and one of the people we interviewed was Jonas Salk, who was married to Francoise Gilot, who shared two children with Pablo Picasso. While with Picasso, they lived in a building that had a courtyard in the middle with a fountain, surrounded by rooms. Some of the rooms were studios each having a different type of discipline: one for painting, one for sculpting, and another for metal arts, and so on. Each day Picasso would get up and after breakfast go to one of the studios and work. He would stay in there a few hours, or maybe a day, and then he would move to the next studio, the next discipline. This constant chang-ing of the discipline, the environment, the materials, processes, and engagement is an example of the creative process constantly being challenged and exercised. Creative thinking is a capability we all have, but creative geniuses of the world continually exercise their creativity, which stimulates their will to create and develop. If we all do the same, the creative economy will expand into a creative community.
Steve McAdam is the Department Chair of Product Design at Otis College of Art and Design in Los Angeles, CA.
2018 Otis Report on the Creative Economy of the Los Angeles Region and the State of California120 www.otis.edu/otisreport
COMMENTARIES
MARK SLAVKIN, WALLIS ANNENBERG CENTER FOR THE PERFORMING ARTS I work a lot with schools, as well as in a performing arts center. It’s striking the extent to which many educators are not mindful of the term creative economy. There are many and diverse jobs in this sector, and we have to revamp the way that we teach in order to help students get those jobs. There are “Career Technical Education” programs and “Career Pathways” that schools are developing that include arts, media, and entertainment academies. But they’re often not thinking that we need to completely transform the way schools work nor promote different kinds of talent, thinking, and learning. Our schools are locked in an antiquated model. It’s not just the creative economy, but the entire economy, that demands a different set of talents and skills, and I’m worried that we’re not doing enough to cultivate that. We have a kind of fact- and memorization-based school system that assumes the ability to memorize and “spit back” information is the top skill that people need to succeed. And in fact, every kid holding a cell phone in their hands makes the need for rote memoriza-tion obsolete. Knowing what year World War I began isn’t actually the key skill for their future success. Rather they should address the question, “Why did World War I happen? And how might it have been avoided?” To me, that’s a much more important question to think about. And yet, the system that we have and the way that standardized testing works tends to give priority to the memorization, to the idea that there is one right answer, and you just need to find it or be taught it. I think that we are grooming good test takers, but I don’t know any employer in any sector looking for good test takers. Everybody wants people who are creative, can solve difficult problems, and form collaborations with oth-ers, but schools give too little opportunity for kids to learn and practice those skills. Technical skills are changing so fast that if you were to gear up to teach computer cod-ing, a certain design software, or digital animation, in five years it could all be gone, and there could be a whole new set of tools. I think the bigger skill is the ability to adapt, to learn how to learn, how to solve things where there is no proven way of doing it. Those skills are definitely harder to test for. Schools will need to function differently in every discipline to cultivate people who are comfortable with constant change and uncertainty: people who have a certain confidence about solving and overcoming problems. That’s the most im-portant thing, more than any technical skill. We need solutions and scale for those skills in our education systems, which are going to reach almost two million kids, not just the great teacher who works with 30 kids.

2018 Otis Report on the Creative Economy of the Los Angeles Region and the State of California 121www.otis.edu/otisreport
The number one thing we are looking for in people who work with us is a deep, passionate commitment to whatever the field is. It’s always surprising to me the number of people who apply for jobs willy-nilly, without knowing why or demonstrating any real passion for it. Those applicants write a generic cover letter: “I’m interested in the job. Thank you.” But why? Why this job? Why is it important? Why are you passionate about it? Why our company? Why our business? Cultivating passion is very important. I think it goes back to kids don’t know what they don’t know. There is a need for more career exposure pro-grams, internships, and job shadowing opportunities—things that let young people know that there is a world out there that they’ve never even thought of. The other thing we’re looking for is effective communication skills. Can you communi-cate well in a group? In a meeting? In a rehearsal? In a planning session? Do you have thoughtful ideas and are you articulate about it? Those are fundamental skills and yet kids are given too little opportunity to cultivate their own ideas and their own opinions in school, because it’s always about trying to find out what the one right answer is. How do you practice being collaborative with people who are different than you? We say that col-laboration is important, but where do kids learn that in school? If the teacher is telling you, “Shh… be quiet. Do not talk to anybody else. Do not share with anybody else. You work by yourself,” then that’s the opposite of collabora-tion, as opposed to every assignment where you are working in a group and you’ve got to overcome your differences and talk it through and figure it out. The idea of collaboration involves a certain degree of risk and a certain degree of poten-tial conflict. A lot of teachers are very leery about that and want their classrooms to be quiet and the kids very orderly and just sitting and listening. To change the mindset, we have to have teachers say, “You’re going to work in teams of four or five. And you’re going to talk, and it’s going to get loud. And there are going to be disputes.” Kids don’t always get along but that’s the exact work that is needed to develop those skills. They’ve got to have that experience and it’s not always easy and there can be a “log jam” or disputes. If one kid is going to be bossy and one kid is going to be intimidated, they have to learn to sort it out. That is where those skills are learned. If we deny them those opportunities, and then throw them out into the work world, we shouldn’t be surprised to find that they have trouble managing conflict or dealing with disagreements. If a student doesn’t see the perfect job out there, it is so much easier today than it would have been 25 years ago to say, “I’m going to make it myself. I’m going to develop my own business. My own website. My own new model.” It’s more likely that you’re going to do a
“I am a big believer that life is going to be kind of a zig-zag and not a straight line. That will be your whole life. The world is changing so rapidly it would be a mistake to tie yourself to just one career path.” — Mark Slavkin
2018 Otis Report on the Creative Economy of the Los Angeles Region and the State of California122 www.otis.edu/otisreport
whole bunch of different things, and point A will lead you to point B and point C that you hadn’t even thought about when you were in school. The big idea is knowing how to learn and adapt, versus the pressure that young people feel sometimes to pick the one right job. The benefit of being in an art college is from getting the immersive experience and the opportunity to explore different kinds of ideas and career pathways, without being trapped in one direction. I am a big believer that life is going to be kind of a zig-zag and not a straight line. That will be your whole life. The world is changing so rapidly it would be a mistake to tie yourself to just one career path. Be a great collaborator, love to learn, love to solve new problems, and work with others to do it. I think that those are the skills that serve people really well. Technology is going to change; the software is going to change. What’s hot today won’t be hot in five years. An industry that we think is booming in LA could be gone or a new thing emerges. Do what you love; do what you are passionate about. Try that. Start with whatever sounds good and if that is not great for you, find something else. At one point in my career, I had an opportunity and I was hemming and hawing: “Is it the right fit?” I met with a friend of mine, and he said matter-of-factly, “If it doesn’t work out, you’ll do something else.” I needed to hear that. If it doesn’t work, do something else. That’s where internships become so important. Everything that happens in school is great, but students need to maximize the chance to be off campus, in some professional setting. What are the problems they are dealing with in the industry? Even at the middle and high school levels, those internship opportunities are so important. I would love to see schooling become something that is more fluid between being in a traditional school building and being in the workplace. That means getting more employers to embrace having young people around, supporting classes, apprenticeships, or internships on their sites, so that kids start to get excited about those possibilities early and are motivated to be in school so they can get into that industry. One thing college students working in a creative field hear is “What are you going to do with that? That sure sounds fun, but are you going to get a real job?” But in fact, I think the possibilities are almost endless. There are articles that come out saying, “Google needs liberal arts majors,” and “The Arts degree is the new MBA.” But there is still that stigma in general that devalues the arts and humanities. We need to combat that. To combat that, you have to have training as an artist, have a portfolio. Having the skills is important. There’s not a shortcut to that. But it’s not enough. It’s also having interper-sonal skills in order to communicate and translate ideas, to convince others, to navigate, and compete. That mix of art skills and vision and aesthetic sensibility with interpersonal skills, to me, is the “secret sauce.” It can’t just be the stereotype of the introverted artist

2018 Otis Report on the Creative Economy of the Los Angeles Region and the State of California 123www.otis.edu/otisreport
who is just in their own head, who makes interesting work but can’t navigate the world. Nor should it be that somebody who is a great talker and very charismatic and compel-ling create work that isn’t very exciting. There’s no substitute for real-world internship work as experience to develop skills and that confidence. It’s hard to mimic that same growth in an academic setting, where it doesn’t feel real, and not everybody is going to have a chance to participate. The internship piece is critical. I don’t think that there is one “magic” thing: “If only you do X, you’ll be successful.” I think it’s simpler than that. Having passion about some-thing, wanting to make a difference, and being able to communicate effectively and work well with others will ultimately help people rise and be successful.
Mark Slavkin is the Director of Education for the Wallis Annenberg Center for the Performing Arts in Beverly Hills, California.
2018 Otis Report on the Creative Economy of the Los Angeles Region and the State of California124 www.otis.edu/otisreport
COMMENTARIES
TACY TROWBRIDGE, ADOBE SYSTEMS At Adobe, we know creativity will be critical for students as they enter a world beyond formal education. As we develop creative tools for the future, we want to make it easy for creators to stay focused on their ideas, to make those ideas a reality, and to impact and shape their worlds. For example, we are embedding learning into tools and rede-signing the initial experience and reducing friction in workflows and experimenting with new technologies.
Young creators need more than just technical skills and tools. They also need soft skills like communication and creative problem solving. They need to know how to keep learning in a rapidly changing world. Having the right tools matters, but helping students prepare for creative futures goes far beyond products.
The Adobe Design Achievement Awards are focused on launching the careers of emerging creatives. This program high-lights young talent and helps students build their professional networks. Any student who enters is eligible for men-torship and a portfolio review. Last year, we matched every student who asked for a mentor with somebody in their area of interest. We also connect these students to each other globally and give them a chance to see work from around the world and across media. We support an incredibly active Slack channel for students interested in both sharing their work and connecting with expertise. These experiences help them build a rich network they can continue to learn from.
Project 1324 is a new Adobe initiative supporting a global community of emerging creatives who use their creativity to inspire, shift perspectives and make an impact. By participating in creative challenges with partners like Sundance, TEDxTeen, and arts organizations, young creatives increase their visibility, reach, and impact. Creative challenges address important topics like reducing stigma around mental health or finding voice through community journalism. What I love about Project 1324 is that it provides opportunities for young creators to take action, to learn new skills and to find their voice - all while building their portfolios and exploring passions.
“Young creators need more than just technical skills and tools. They also need soft skills like communication and creative problem solving. They need to know how to keep learning in a rapidly changing world. ” — Tacy Trowbridge
2018 Otis Report on the Creative Economy of the Los Angeles Region and the State of California 125www.otis.edu/otisreport
To learn more about this coming generation of creators, we conducted and published a research study, Gen Z in the Classroom: Creating the Future. We surveyed both Gen Z students (born from the mid-1990s through the early 2000s) and their teachers. Gen Z stu-dents described themselves as smart, creative, and hardworking. They saw themselves as more creative than previous generations. What they described is essentially a remix culture—they can build on what others have done. It is easy for them to find examples as the world of ideas is on their phones. They can quickly see what others have done, build a new prototype, and create an illustration to describe it. They expected examples at their fingertips, rapid feedback, and the ability to build things quickly and easily. Additionally, they saw technology as a critical part being creativity and creative solving problems.
They were both nervous and excited about their futures which makes sense given the transformations taking place in the global economy, in industries, and in the nature of work. Their future jobs and entire careers may not even exist yet. 42% of Gen Z students felt what they learned outside of the classroom will be more important to their future careers than what they learned inside the classroom. Whether through internships or as-signments that link to real world experiences, I see education creating more and more of these opportunities for students. Gen Z students reported learning best through creativ-ity and thought there wasn’t enough of it in their classrooms. Their teachers agreed and felt strongly that these students learned best by doing, by making, by creating, and that there weren’t enough opportunities for this kind of experience in traditional classrooms. We also see Gen Z youth host YouTube channels, take action on social issues, and run side projects outside of school.
When Gen Z students want to know how to do something or to learn, they look online for a video or seek out expertise in their social networks. They teach themselves to do all sorts of things. Many students follow a traditional design school path and before entering creative fields. But there are also students who are largely self-taught - through YouTube, through hack-a-thons, through taking on side projects, and by following designers they admire and studying their work. We need to recognize that the world is changing very quickly and this generation appears able to adapt, and they are doing it on their own. Gen Z is growing up on social media but even a five-year age difference reveals the use of different platforms and different uses of media. The youngest students focus on Insta-gram and on video platforms. They grow up creating, publishing, and commenting on con-tent which is shaping the way they approach creativity. They are learning to communicate using a mix of new media with a heavy focus on video and digital media. Employers, educators and the coming generation agree that creativity and creative problem solving skills are critical for future success. As a society, we have significant challenges to address and face an increasingly rapid pace of change. While technology alone is not the answer, it plays a key role and can place powerful tools in the hands of young creators.
Tacy Trowbridge is the Global Lead for Education Programs at Adobe Systems.
Download the full report, view highlights from the creative economy launch event, and learn more about other resources at www.otis.edu/otisreport