Embed Size (px)
Citation preview


City of Tshwane
2016/21 IDP
May 2016
“The culmination of the first decade of game-changing of Tshwane Vision 2055”
21

Table of Contents
PREAMBLE: 2016/21 INTEGRATED DEVELOPMENT PLAN ............................................ 3
1. INTRODUCTION, CONTEXT AND OVERVIEW ........................................................... 4
2. SITUATIONAL ANALYSIS .......................................................................................... 13
3. STRATEGIC CONTEXT ............................................................................................. 43
4. GOVERNANCE AND INSTITUTIONAL ARRANGEMENTS ..................................... 154
5. INTER-GOVERNMENTAL ALIGNMENT .................................................................. 167
6. COMMUNITY PARTICIPATION ............................................................................... 184
7. SPATIAL DEVELOPMENT FRAMEWORK (Summary) ............................................ 200
8. CAPITAL INVESTMENT FRAMEWORK .................................................................. 218
9. PERFORMANCE MANAGEMENT ........................................................................... 260
10. CITY OF TSHWANE PERFORMANCE SCORECARD FOR 2016 – 2021 ............ 274
11. FINANCIAL PLAN .................................................................................................. 286
22

PREAMBLE: 2016/21 INTEGRATED DEVELOPMENT PLAN
The 2016/21 IDP presented in this document is significant for the City in two ways. First, the document is fourth IDP that the City has developed since the establishment of local government in terms of the Local Government: Municipal Local Government Structures Act (Act No. 117 of 1998). Second, this IDP provides a concrete plan towards realising the “first decade of game changing” as captured in the Tshwane Vision 2055 through outcomes based planning. The development of this IDP has taken into consideration a number of factors: legislated and contextual and among these is the input gathered from extensive public participation processes facilitated by the City.
This IDP is developed on the foundation of the achievements of the previous terms of office and a sterling record of service delivery of the City which has been achieved through coordinated governance, accountability and putting the citizenry first. The IDP still seeks to ensure that in the development trajectory of the City:
A people centred development is achieved and engagement with communities to foster participation is achieved;
Delivery of basic services in an efficient and effective manner is sustained;
Good governance and accountability is strengthened and improved;
Sound financial management towards improved delivery on the mandate of the City is realised; and
Ensuring that the City is adequately skilled by building capabilities within the administrative structures of the City.
The IDP presented here in, provides a solid plan that is linked to the financial capabilities of the City as detailed in the 2016/19 MTREF and has carefully been drafted to achieve spatial integration. This IDP document is also supported by the 2016/17 Service Delivery and Budget Implementation Plan (SDBIP) which will be presented to Council in June 2016 and will be monitored throughout the term of office through quarterly and annual reports as legislated.
As we work towards consolidating our position as the only Capital of South Africa, It is hoped that you share the same Vision for our Capital and will partner with the City towards making it “ liveable, resilient and inclusive.”
23

1. INTRODUCTION, CONTEXT AND OVERVIEW
Introduction
The Local Government: Municipal Systems Act, 2000 (Act 32 of 2000) states that each municipal council must, within a prescribed period after the start of its elected term, adopt a single, inclusive and strategic plan for the development of the municipality which –
(a) links, integrates and coordinates plans and takes into account proposals for the development of the municipality;
(b) aligns the resources and capacity of the municipality with the implementation of the plan; and
(c) forms the policy framework and general basis on which annual budgets must be based.
In line with the Local Government: Municipal Systems Act, 2000 (Act 32 of 2000) (MSA) and the Local Government: Municipal Finance Management Act, 2003 (Act 56 of 2003) (MFMA), the City of Tshwane has developed the five-year IDP for 2016–2021 too which is supported by the 2016/17 Service Delivery Budget and Implementation Plan, the Medium-Term Revenue and Expenditure Framework for the 2016–2019 financial years, as well as departmental business plans that capture their core operations and enable institutional performance monitoring. All the plans presented are premised on the principles and Outcomes of Tshwane Vision 2055 as adopted by Council in 2013.
The diagram below demonstrates that Tshwane Vision 2055 is the compass document for all City of Tshwane work. This plan has guided this five-year Integrated Development Plan.
Figure 1.1: Relationship between City of Tshwane plans
Tshwane Vision 2055
IDP and Budget
2016/17
Business or implementation
plans of departments and
entities
Service Delivery and Budget
Implementation Plan (SDBIP)
24

Strategic focus of the 2016–2021 IDP
The 2016–2021 term of office will conclude the first decade of game-changing for the City of Tshwane as per Tshwane Vision 2055, which reads as follows:
In 2055, Tshwane is liveable, resilient and inclusive and its citizens enjoy a high quality of life, have access to social, economic and enhanced political freedoms and
are partners in the development of the African capital city of excellence.
Tshwane Vision 2055 sets a long-term development agenda to guide all future initiatives of the City. The long-term vision of the City has identified the following desired outcomes for 2055:
Outcome 1: A resilient and resource-efficient city; Outcome 2: A growing economy that is inclusive, diversified and competitive; Outcome 3: Quality infrastructure development that supports liveable communities; Outcome 4: An equitable city that supports happiness, social cohesion, safety and
healthy citizens; Outcome 5: An African capital city that promotes excellence and innovative
government solutions; and Outcome 6: South Africa’s capital city with an activist citizenry that is engaging,
aware of their rights and presents themselves as partners in tackling societal challenges.
With the above outcomes in mind, the City needs to ensure that it diligently implements the proposed strategic actions as contained in Tshwane Vision 2055. For this reason, it is proposed that the theme for this IDP and all the work that will be carried out in this term of office be:
The culmination of the first decade of game-changing of Tshwane Vision 2055
This theme emphasises the need for the City to implement its development agenda in line with the six outcomes of the Tshwane Vision 2055. Through the implementation of its operational business plans as well as the SDBIP, the following strategic objectives are sought to be achieved:
1. Providing sustainable services infrastructure and human settlements; 2. Promoting shared economic growth and job creation; 3. Ensuring sustainable, safer communities and integrated social development; 4. Promoting good governance and an active citizenry; 5. Improving financial sustainability; and 6. Continuing institutional development, transformation and innovation.
The emphasis on Tshwane Vision 2055 in the 2016–2021 IDP brings about a shift in the strategic planning processes of the City whereby emphasis is on the outcomes and desired impact as opposed to the previous emphasis on the outputs and activities. The desired impact, as identified in this document, needs to be supported by understanding the context and developing implementation strategies, proposed programmes and actions upfront. This shift, as discussed, can be summarised in the diagram below:
25

Figure 1.2: Change in strategic focus for the IDP
To achieve the above, the following considerations have been made towards the development of the IDP:
Budget allocation to outcomes is based on weighting and prioritisation; Outcomes have one or more programme associated with it; Departments propose projects that will assist in achieving programme goals; Projects are prioritised based on their impact and benefits; Project budgets are allocated to departments responsible for its delivery; As means of achieving monitoring and improvements, departments not winning any
projects are evaluated for constraints and challenges; and Delivery agreements or interdepartmental partnerships are required for projects that
need to be delivered by more than one department.
The above proposed logic to strategic planning was started in the development of this IDP and will continue to be employed as the term of office proceeds.
Process followed towards the development of the 2016–2021 IDP
The process followed in the development of the 2016–2021 IDP document is in line with the legislative requirements of both the Municipal Systems Act, 2000 (Act 32 of 2000) and the Municipal Financial Management Act, 2003 (Act 56 of 2003). Furthermore, the process has allowed for a streamlined strategic process to be achieved as outlined in the section above. The summary of the strategic planning process is as per the diagram below:
26

Figure 1.3: Strategic process towards the development of the 2016–2021 IDP
The above-mentioned strategic planning process has been internally focused and has allowed for rigorous strategic planning discussion among the administration and the political principles. The identified programmes, together with their measured outcomes, have been agreed upon.
As part of the development of the document, the City have engage with all the relevant stakeholders to solicit views and inputs into the City’s plan for the 2016–21 term of office. The engagement processes that follow were embarked upon toward the development of this document.
Mayoral Lekgotla I: Setting of strategic agenda
The Mayoral Committee convened a lekgotla meeting in August 2015 where the agenda for the 2016–2021 financial year was set. The lekgotla made a resolution on the approach to develop the IDP and thus set a strategic path towards the strategic planning for the new term of office.
Strategic planning towards outcomes-based planning
Between September 2015 and February 2016, the City’s departments, led by nominated Strategic Executive Directors, held sessions for each of the six Tshwane Vision 2055 outcomes with an intention to achieve the following:
To engage in a strategic discussion based on the identified Tshwane Vision 2055 outcomes;
To develop an understanding of current development trends that may influence the development proposals for the implementation of actions/programmes/projects for 2016–2021. These need to include economic, political, environmental and social factors;
To develop strategic proposals and implement action/programmes/projects for inclusion in the 2016–2021 IDP;
To align the 2016–2021 proposals to other outcomes of Tshwane Vision 2055; To set out a phased approach to the identified actions/programmes/projects with
clear budgetary requirements; To identify risks that the City may face in implementing the identified
action/programmes/projects and develop mitigating measures for these; To identify institutional arrangements that will facilitate the achievements of the
Tshwane Vision 2055 outcomes;
27

To consolidate the discussions into the Outcome Strategy, input into the 2016/17 IDP Discussion Document and ultimately the Outcome Plan as outlined in the sections below; and
To communicate the outputs outlined in the aforementioned list to the City Manager’s Forum and the Lekgotla in March.
Intergovernmental engagement
In February 2016, the City engaged with its provincial counterparts, as per the IDP July-to-July Road Map of the Provincial Department of Cooperative Governance and Traditional Affairs and the approved IDP process plan. The objectives of the discussions were to –
solicit progress on the provincial projects for 2015/16 financial year; provide a platform for provincial departments to articulate their priorities for the
2016/17 financial year; and address issues of dependency and ensure alignment with provincial and national
counterparts. This engagement has resulted in preliminary comments from Provincial and National Departments on the draft IDP and those have been factored in to the final document. Business plan development process
Following the discussion of Lekgotla, the provincial discussions and the strategic planning discussions on the outcomes-based planning processes in January 2016, all departments and municipal entities prepared and submitted the proposals for implementation in 2016–2021 with an emphasis on the 2016/17 financial year in preparation for the Budget Steering Committee meetings which was held in February 2016. These proposals were aimed at effecting the resolutions of the lekgotla of August 2015 in preparation for the development of the 2016–2021 IDP and to show alignment with the outcomes-based work that the departments have been undertaking.
The business plans were assessed by the Budget Steering Committee that was established in line with section 21(1) of the Municipal Financial Management Act, 2003 (Act 56 of 2003). The recommendations of the Budget Steering Committee were submitted to the Mayoral Lekgotla of February 2016, at which the final budget determination was provided. This was the basis for development of this IDP together with the IDP scorecard as contained herein.
Mid-year review and adjustment budget
The mid-year performance report, together with the 2015/16 SDBIP adjustments, was submitted to the Council in February 2016. These confirmed the advances made in implementing the 2015/16 IDP during the first half of the financial year as well as deliverables for the 2016/17 financial year. This information was used to establish the baseline during the 2016–2021 planning cycle.
28

Mayoral Lekgotla II: Priorities and budget confirmation
In March 2016, the Executive Mayor convened a Budget Lekgotla which achieved the following, amongst others:
Considered the development progress in line with the key service delivery streams for the City with an emphasis of addressing the Auditor-General’s findings for 2014/15;
Considered a summative evaluation of the work done by the City since the 2011/2012 financial year as an input into the development proposal for the 2016–2021 term of office;
Engaged on the six outcome strategies as discussed and developed by management in order to develop the 2016–2021 IDP;
Considered the financial position of the City and made recommendations on how work moving forward could be funded; and
Considered the spatial implications of the City’s proposed projects for spatial justice.
The Lekgotla agreed on the following proposed priority areas for the upcoming term of office:
Embarking on an aggressive implementation of strategy – ‘consolidating the people’s capital’;
Mainstreaming the City’s pilot projects into programmes of the City that are funded. These include the Tshepo 10 000 programme and the Kuka Maoto approach towards addressing urban management, as well as the accelerated formalisation programme of Re Aga Tshwane;
Continuing to strengthen the financial position of the City through liquidity improvement: tilting the scale of expenditure to revenue towards financial resilience and to be able to fund future plans of the City;
Escalating the implementation of catalytic projects: o West Capital o Caledonian o BPO Park o Power stations
Urgently implementing the accelerated urban management model and realign functions between the regions and departments as proposed;
Replicating successful township revitalisation programmes in the City and developing an approach toward township development;
Reducing non-revenue water and electricity; Temba and Rooiwal Water Treatment Plant and Reservoir upgrade to be completed
within agreed timeframes; and Achieving the implementation of TRT infrastructure and increasing ridership.
To complement the above, the City is still committed to inclusive economic development and job creation, poverty alleviation, sustainable environmental development and promoting safety to the residents. This IDP revision document provides details in terms of quantifiable plans on how the above will be achieved.
IDP Public Participation
Post the tabling of the draft 2016/21 IDP to Council in March, the draft IDP document together with the 2016/19 MTREF and the municipal tariffs were presented to the
29

communities through various platforms including the ward councillor facilitated meetings and stakeholder engagements. These engagements allowed the City an opportunity to understand first, whether the proposals contained in the draft document were accepted by the stakeholders and second to develop a repository of community needs that needed to be responded to in the final IDP document. This document later contains a summary of these community needs per region and has been finalised to respond to the emerging needs of the people of Tshwane.
Chapter overview
This section briefly overviews the content of each chapter of this IDP. As stated above, consideration has been made to ensure that the document is in line with Chapter 5 of the Municipal Systems Act, 2000 (Act 32 of 2000) regarding the process of developing the IDP and its content.
Introduction, Context and Overview: This chapter places the IDP in context and positions it as the first IDP for the 2016–2021 term of office. The chapter emphasises the role of Tshwane Vision 2055 as a strategic guiding document for developing the plans and implementation in 2016–2021. The process for developing the IDP is also captured in this chapter, with the six strategic objectives as adopted in 2013/14 still being the guiding principles for the next term of office. The chapter concludes by summarising the contents of each of the chapters in the 2016–2021 IDP review.
Situational Analysis: This chapter reflects on the developmental progress made in the City and allows for a realistic view of the developmental challenges that the City is confronted with. Much of the information contained in this chapter is based on statistical information from Statistics SA and updates have been provided with sources such as the IHS Global Insight data for 2016. The overall development in the City is in accordance with the table below:
Total population 2015 Percentage growth
3 152 162 3,1%
Percentage of people with functional literacy (15 years and older)
Population groups Percentage
Asian 94,8%
Coloured 95,5%
White 98,8%
African 88,8%
Total 91,2%
Total number of people employed Formal Informal
982 866 140 843
Total : 1 123 709
Unemployment rate 21,1%
HDX by population group 0,71
Gini coefficient 0,64
Total number of people living below the poverty line 478 533
People with access to basic services Service Percentage
Sanitation 78,37%
Waste management to formal households
77%
30

Water 80,73%
Electricity 79,81%
Informal settlements with rudimentary services
100%
Strategic context: This chapter highlights the strategic pillars that guide the development plans for 2016–2021. The chapter takes into consideration the changing development trends as well as some of the commitments that have been made which affect the City.
This chapter also seeks to align the City of Tshwane’s planned proposals with the Performance Management Framework by making proposals on impact, outcome, input and output indicators. These will be contained in the various documents of the City.
This chapter also introduces the key programmes that will be implemented for each of the six Tshwane Vision 2055 outcomes. These contribute directly to the outcome-based plans that was developed and presented to management and the Lekgotla.
Governance and Institutional Arrangements: This chapter articulates the broad governance and institutional framework of the City and links this to the City’s governance model. Furthermore, it outlines some of the key administrative transformation areas that have made it possible to implement the model within the legislative context. The chapter seeks to communicate the separation of power model in the City and to provide information regarding other institutional arrangements that will improve accountability.
Intergovernmental Alignment: Intergovernmental relations (IGR) refers to the complex and interdependent relations among the national, provincial and local spheres of government, as well as the coordination of public policies among these three spheres. In essence, this means that the governance, administrative and fiscal arrangements operating at the interface between national, provincial and local governments must be managed to promote the effective delivery of services.
This chapter aims to reflect the City’s continuous strengthening of intergovernmental relations. It also reflects on the State of the Nation and State of the Province addresses and addresses the MEC: Provincial Government’s comments on the 2015/16 IDP. The input of the MEC is used to improve and strengthen processes moving forward.
Community Participation: This chapter examines the City’s participatory planning processes for developing this document and beyond. A high-level summary of the progress made against the 2013/14 community issues is provided and forms the backdrop of the following summary of established community priorities:
New infrastructure provision and existing infrastructure maintenance (water, sanitation, roads, storm water and electricity);
Housing provision and the upgrading of informal settlements; Provision of social amenities / infrastructure (sport and recreational facilities, parks,
clinics and libraries) and accompanying programmes; Economic development and job creation; and Safety and security.
The chapter concludes by summarising the public participation processes that were followed after the submission of the 2016/17 document to the Council. These inputs have been used to finalise the IDP document.
31

Spatial Development Framework (Summary): This chapter outlines high-level interventions of the metropolitan spatial development framework and capital investment programmes into the City’s settlement restructuring agenda. It sets out the spatial restructuring elements of the City together with the key capital projects to support these.
Performance Management: This chapter highlights performance management structures of the City that will ensure delivery against the planned deliverables for the 2016-2021 term of office. The chapter seeks to communicate some of the key monitoring and evaluation structures and systems that will be used in monitoring and evaluating of the work that is done by the City.
City of Tshwane Performance Scorecard for 2016–2021: This chapter highlights some of the key performance measures to implement Tshwane Vision 2055. The scorecard is framed to give effect to the programmes that the Mayoral Committee agreed on in support of the Tshwane Vision 2055 outcomes as outlined in the strategic context chapter.
Financial Plan: The final chapter outlines the focus of the medium-term budget expenditure framework (MTREF) in terms of allocating resources to implement this revised IDP. It also presents the tariffs proposed for 2016/17.
32

13
2. SITUATIONAL ANALYSIS
Introduction
This chapter presents the City of Tshwane in its context as the Capital City of South Africa and discusses the socio-economic development status of Tshwane. The information in this chapter come from the following sources:
Census 2011 by Statistics South Africa: A principal means of collecting basic population and housing statistics required for social and economic development, policy interventions and their implementation and evaluation. South Africa has conducted three censuses (1996, 2001 and 2011). Census 2011 was the third census to be conducted since the democratic elections in 1994. A number of population and household attributes were measured and a variety of indicators generated. These will provide Tshwane-specific profile results on all census topics: demographics, migration, education, general health and functioning, labour force, mortality and households;
Statistics SA: Quarterly Labour Force Survey, Quarter 4, 2015: A household-based sample survey conducted by Statistics South Africa (Stats SA). It collects data on the labour market activities of individuals aged 15 years and older who live in South Africa. However, this report only covers the labour market activities of persons aged 15 to 64 years;
IHS Global Insight (2016): An independent service provider with whom the City has a service-level agreement to provide the City with socio-economic data on a regular basis. This is generated through various models and allows the City to have a view of socio-economic development in Tshwane. This source of information has allowed the City to compare the changes over a number of years and it has been utilised with regard to recent IDP reviews; and
City of Tshwane Social Facility Planning Using Accessibility Analysis Project report: 2015/16: The study was conducted by the Built Environment Unit of the Council for Scientific and Industrial Research (CSIR). The project sought to identify those areas across all the regions where the supply and demand for facilities is not balanced in terms of the current facility supply and the current population distribution, while also taking service provision standards into account. The study also provides recommendations of where interventions should be targeted.
City of Tshwane in context Globally, cities are the driving force for economic development and social progress. In the South African context it is at the level of local government that the actual realisation of the rights enshrined in the Constitution and the achievement of the
33

14
desired South Africa, as contained in the National Development Plan (NDP) (a national strategic document towards 2030), is achieved.
According to Turok (2012), cities have consistently outpaced the rest of the country in terms of economic and employment growth. This is because they tend to be more productive in terms of the value of the goods and services they generate and the efficiency with which they are produced. According to the World Bank (2009), this partly reflects the ‘agglomeration economies’ that benefit large concentrations of economic activity, including matching business requirements for labour, premises and other resources, sharing infrastructure, services and information, and mutual learning between firms and other institutions. This implies that city-regions will have an even more relevant role as engines of economic growth and social cohesion. Tshwane, like other capital cities around the globe, is a major contributor to national growth and development. Tshwane’s economy will have to grow massively if it is to fulfil the NDP targets to eliminate poverty.
Tshwane is home to a range of higher-value functions such as corporate headquarters, financial and business services and manufacturing, and high-order public services, such as national departments, universities and major hospitals. To be more specific, Tshwane accommodates more than 30 companies listed on the Johannesburg Stock Exchange (JSE), national government departments and three universities. It hosts 134 foreign embassies and missions, which gives it the largest concentration of diplomatic and foreign missions in the world after Washington DC in the USA.
A key milestone in the history of Tshwane was the amalgamation of 13 smaller municipalities on 5 December 2000 to form the City of Tshwane Metropolitan Municipality. This amalgamation was not simply an exercise in spatial integration; more importantly, it was a deliberate step to develop an integrated economic base to deepen socio-economic transformation.
As part of the continued commitment of the South African government to improve service delivery and ensure economic growth for all its citizens, the Municipal Demarcation Board resolved to re-determine the boundaries of the Metsweding District Municipality (which consisted of the Nokeng tsa Taemane and Kungwini Local Municipalities) and the City of Tshwane Metropolitan Municipality so that they would form a new single metropolitan municipality effective from 18 May 2011. Today, Tshwane covers just more than 33% of the total land area of Gauteng’s 19 055 square kilometres and it has seven administrative regions, 105 wards and 210 councillors.
Tshwane is the largest of the three metros in Gauteng in terms of geographic space. It occupies 6 345 square kilometres, which makes it the third-largest municipality in the world. Although this offers opportunities for a vast number of land uses and development, it poses challenges in terms of infrastructure development for basic services such as water, sanitation, electricity and social facilities. Due to the vastness of the area, urban sprawl is also a concern and puts a huge burden on infrastructure provision.
34

15
To position and brand the new City of Tshwane, a new slogan was adopted – “Igniting excellence”. This shows that the City maintains its commitment to improve the quality of life of all residents while advancing Tshwane’s competitiveness and marketability across the globe. Tshwane is the Capital City of the Republic of South Africa.
Figure 2.1: Location of Tshwane Metropolitan Municipality
Demographics
The population of Gauteng totals 13.1 million which is 24.4% of South Africa’s total population of 53.7 million. Tshwane makes up more than 3.1 million of the total provincial population. The map above depicts the location of Tshwane in Gauteng. As already alluded to above, Tshwane is divided into seven administrative regions, with the population per region is as follows: Region 1 (old North West) with 867 548, Region 2 (old North West) with 359 715, Region 3 (old Central Western) with 649 831, Region 4 (old Southern) with 409 831, Region 5 (Nokeng tsa Taemane) with 98 504, Region 6 (old Eastern) with 641 388 and Region 7 (old Kungwini) with 125 998.
Table 2.1: Tshwane population distribution by planning region
Region Percentage of the population
1 27.5% 2 11.4% 3 20.6% 4 13.0% 5 3.1% 6 20.3% 7 4.0%
35

16
Source: IHS Global Insight (2016)
Thus Regions 1, 6 and 3 have the highest population concentrations. The overall population growth for the City of Tshwane between 1996 and 2014 was 2.9%.
Table 2.2: Population comparison across municipalities in Gauteng
Name Area (km²) Population 20131
Population 2014
Johannesburg 1 648 4 716 564 4 786 431 Ekurhuleni 1 928 3 299 497 3 371 728 Tshwane 6 357 3 125 607 3 152 162 Sedibeng 4 185 939 453 963 953 West Rand 4 095 833 696 839 905
Source: IHS Global Insight (2016)
Tshwane’s more than 3.1 million residents (marginal increase from 3 125 607 in 2013 to 3 152 162 in 2014) are distributed over seven planning regions that the City of Tshwane instituted to improve service delivery to residents. The operationalisation of this regional model aims to improve coordination and alignment of services rendered to residents and stakeholders of Tshwane.
The following map reflects the seven planning regions, which are responsible for functions such as health services, waste management, library services, sport, recreation and culture, horticulture, customer care and cemeteries.
1STATSSA http://beta2.statssa.gov.za/publications/P0302/District_Council_projection_by_sex_and_age_(2002-2014).zip downloaded on 2014/02/05 12h28
36

17
Figure 2.2: City of Tshwane seven planning regions
37

18
Population Dynamics
The City of Tshwane continues to be a diverse and culturally vibrant capital city. In 2011, the total population of Tshwane was 2.9 million. It has since increased to just less than 3.2 million in 2014. For the period 2011–2014, Tshwane’s population grew by 280 246. Figure 2.2 provides an overview of how the total population in Tshwane has been changing over the 2011–2014 period. As indicated in the figure, the total population of the city has been increasing at a declining rate. In 2011 the growth rate was determined to be 3.4%, which has since decreased to 3.1% in 2014. This may indicate that either the birth rate or immigration to the city has declined.
Figure 2.2: Tshwane’s population and population growth, 2011–2014
Source: IHS Global Insight (2016)
Figure 2.3 indicates the total population in Tshwane disaggregated by Tshwane’s seven regions. As indicated in the figure, Region 1 has the largest population in Tshwane, accounting for approximately 28% of the total population. Regions 5 and 7 are the least populated regions in Tshwane, accounting respectively for approximately 3.1% and 4% of the total population. The large concentration of economic opportunities in Region 4, primarily in the financial and professional services sectors, is a potential justification for the large population growth percentage in comparison with the six other regions in Tshwane.
2011 2012 2013 2014
Population 2 871 915 2 964 916 3 058 493 3 152 161
Population growth rate 3.4% 3.2% 3.2% 3.1%
2.9%
3.0%
3.0%
3.1%
3.1%
3.2%
3.2%
3.3%
3.3%
3.4%
3.4%
2 700 000
2 750 000
2 800 000
2 850 000
2 900 000
2 950 000
3 000 000
3 050 000
3 100 000
3 150 000
3 200 000
Po
pu
lati
on
gro
wth
rat
e
Po
pu
lati
on
38

19
Figure 2.3: Tshwane’s population by region, 2014
Source: IHS Global Insight (2016)
Figure 2.4 reveals the demographic breakdown of the City of Tshwane in percentages. The largest population group in Tshwane is African and it accounts for approximately 77.6% of the population. This is followed by the white population group, which accounts for approximately 18.4% and the coloured population group, which accounts for approximately 2.03%. The smallest population group is the Asian population group, which accounts for only 1.89% of Tshwane’s population.
Figure 2.4: Percentage contribution of population groups to Tshwane’s total population, 2011–2014
Source: IHS Global Insight (2016)
The overall population growth rates in Tshwane, as reflected in Figure 2.5, are disaggregated by population groups. As indicated in the figure, the fastest-growing population group in Tshwane is the Asian community, peaking at 7.1% growth per annum in 2008; the growth rate has shown a declining trend since 2008, but it still remains the fastest-growing population group. The second-fastest growing population group is the African group which, on average, grew at a rate of 3.8% per
Region 1 Region 2 Region 3 Region 4 Region 5 Region 6 Region 7
Total population 867 548 359 715 649 831 409 176 98 504 641 388 125 998
0
100 000
200 000
300 000
400 000
500 000
600 000
700 000
800 000
900 000
1 000 000
Po
pu
lati
on
2011 2012 2013 2014
Asian 1.79% 1.83% 1.86% 1.89%
Coloured 2.05% 2.05% 2.04% 2.03%
White 20.05% 19.47% 18.91% 18.38%
African 76.11% 76.65% 77.18% 77.69%
0.00%10.00%20.00%30.00%40.00%50.00%60.00%70.00%80.00%90.00%
100.00%
39

20
year. Interestingly, the white population group recorded negative growth for the period 1997–2005 and only regained a positive growth trajectory (though marginal) from 2006 to 2014.
Figure 2.5: Population growth rate by population group, 1997–2014
Source: IHS Global Insight (2016)
The 2014 population pyramid for the City of Tshwane is reflected in Figure 2.6. As indicated in the figure, there is a youth bulge in Tshwane’s population profile; this is likely due to the large student population in the city, which results from the large concentration of institutions of higher education. Approximately 61% of Tshwane’s population is younger than 35, with 35% being between the ages of 15 to 34. Senior residents (65+ age group) of Tshwane only account for approximately 6% of the total population. On average, the gender breakdown is evenly distributed across all age bands, as illustrated in the figure.
1997 1998 1999 2000 2001 2002 2003 2004 2005 2006 2007 2008 2009 2010 2011 2012 2013 2014
African 3.9% 3.8% 3.7% 3.6% 3.8% 3.8% 3.8% 3.6% 3.6% 3.8% 3.9% 4.2% 3.8% 4.2% 4.1% 4.0% 3.9% 3.7%
White -0.9% -0.8% -0.7% -0.6% -0.6% -0.5% -0.4% -0.5% 0.0% 0.2% 0.4% 0.3% 0.5% 0.3% 0.3% 0.3% 0.2% 0.2%
Coloured 4.1% 3.9% 3.8% 3.8% 4.4% 4.3% 4.3% 4.2% 4.2% 4.1% 3.9% 3.2% 3.2% 3.2% 3.2% 3.0% 2.9% 2.7%
Asian 0.8% 1.3% 1.6% 2.1% 1.8% 2.3% 2.9% 3.3% 3.6% 4.4% 5.8% 7.1% 7.0% 6.3% 5.7% 5.3% 5.1% 4.9%
Total 2.4% 2.4% 2.4% 2.4% 2.5% 2.7% 2.7% 2.6% 2.7% 2.9% 3.1% 3.4% 3.1% 3.4% 3.4% 3.2% 3.2% 3.1%
-2.0%
0.0%
2.0%
4.0%
6.0%
8.0%
40
21
Figure 2.6: Tshwane’s population pyramid
Source: IHS Global Insight (2016)
Education
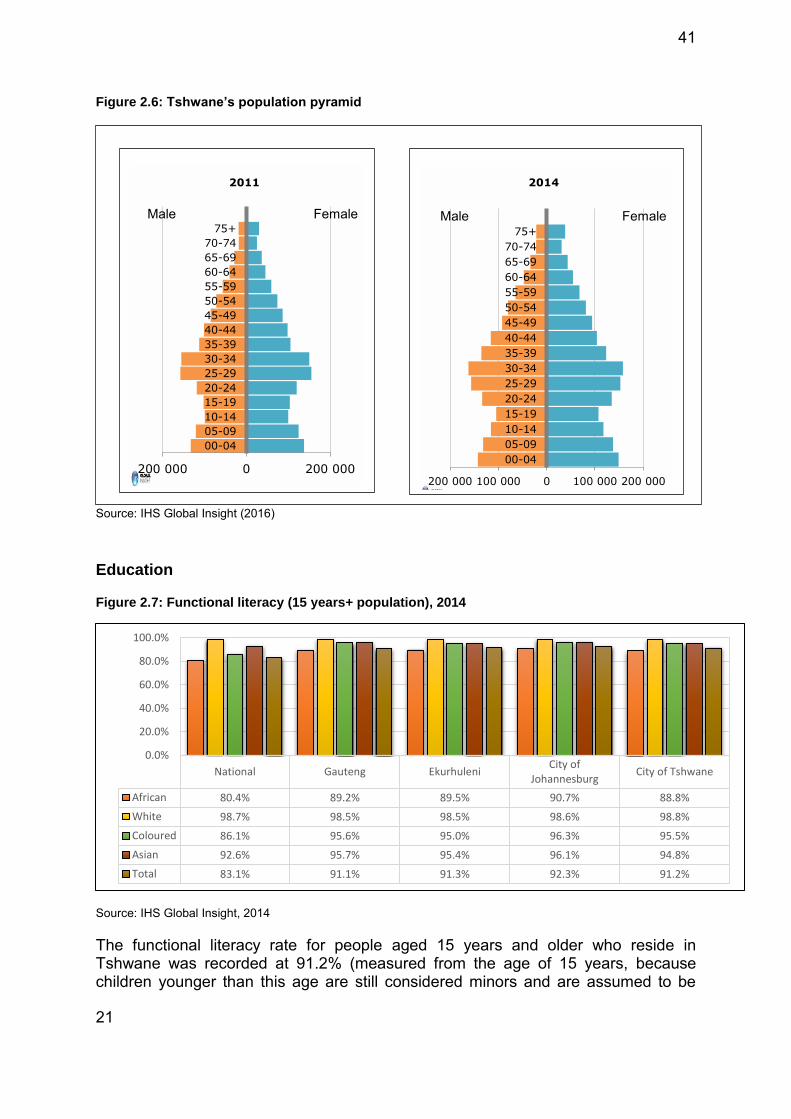
Figure 2.7: Functional literacy (15 years+ population), 2014
Source: IHS Global Insight, 2014
The functional literacy rate for people aged 15 years and older who reside in Tshwane was recorded at 91.2% (measured from the age of 15 years, because children younger than this age are still considered minors and are assumed to be
National Gauteng EkurhuleniCity of
JohannesburgCity of Tshwane
African 80.4% 89.2% 89.5% 90.7% 88.8%
White 98.7% 98.5% 98.5% 98.6% 98.8%
Coloured 86.1% 95.6% 95.0% 96.3% 95.5%
Asian 92.6% 95.7% 95.4% 96.1% 94.8%
Total 83.1% 91.1% 91.3% 92.3% 91.2%
0.0%
20.0%
40.0%
60.0%
80.0%
100.0%
200 000 0 200 000
00-04
05-09
10-14
15-19
20-24
25-29
30-34
35-39
40-44
45-49
50-54
55-59
60-64
65-69
70-74
75+
2011
Male Female
200 000 100 000 0 100 000 200 000
00-04
05-09
10-14
15-19
20-24
25-29
30-34
35-39
40-44
45-49
50-54
55-59
60-64
65-69
70-74
75+
2014
Male Female
41

22
attaining their ‘basic education’ as per the standards of the Department of Education, in line with international labour law). The African population group’s functional literacy level continues to be the lowest among all other population groups in South Africa, Gauteng and in all three metropolitan municipalities in Gauteng. South Africa’s historical legacy of systematic social injustice has gravely fragmented social balances in the country and this explains the lower literacy among the African population.
Figure 2.8: Highest levels of schooling for the population aged 20 years and older in Tshwane
Source: IHS Global Insight (2016)
Tshwane, being South Africa’s Capital City with the largest concentration of higher education institutions in the country, boasts a relatively better educated population than other metropolitan municipalities in South Africa. As indicated in Figure 2.8, the percentage of persons with no schooling or Grade 2 represents a marginally small part of the city’s population, at approximately 3.9% in 2014. Tshwane has a large concentration of persons with matric and post-matric qualifications, which is currently recorded at 57.3%.
0.0%
5.0%
10.0%
15.0%
20.0%
25.0%
30.0%
35.0%
40.0%
2011 2012 2013 2014
Grade 0-2 Grade 3-6 Grade 7-9
Grade 10-11 Certificate / diploma without matric Matric only
Post Matric Qualifications Total
42

23
Figure 2.9: Tshwane’s level of schooling profile by region, 2014
43

24
Figure 2.9 indicates the education profile of the City of Tshwane disaggregated by region. As indicated in the figure, on average 33% of the population in each region have attained a matric qualification. This holds with the finding that functional literacy levels in Tshwane are at levels higher than the national average and that of Gauteng. Furthermore, Region 4 has the highest concentration of post-matric qualifications, accounting for approximately 37%, while Region 1 has the lowest concentration, accounting for approximately 16% of the population. The fact that Region 4 consists of the more affluent areas in Tshwane, such as Centurion and Irene, while Region 1 is the opposite (though with a large concentration of agricultural holdings and industrial zones), justifies the two extreme ends highlighted in Figure 2.9.
The economy
The City of Tshwane is the fourth-biggest municipality in South Africa and the second-biggest in Gauteng in terms of gross value added by region, with gross value added of R243.4 billion. In 2014, the City of Tshwane contributed 25% to the provincial economy. Moreover, Tshwane accounted for 9% of South Africa’s economic growth, as compared to 15% for the City of Johannesburg. Furthermore, the economic output of Tshwane has expanded at an annual average of 4% per annum over the last five years, outstripping the national GDP growth average by at least one percentage point between 2010 and 2014. Overall no city in the Gauteng City Region outperformed the growth rates recorded by the City of Tshwane in the last five years.
Figure 2.10: Economic overview – GVA and GVA growth
Source: IHS Global Insight, 2016
Tshwane has a diversified economy, emerging as a vibrant economy with significant community services, finance and transport. Tshwane has a large government sector
0
50 000 000
100 000 000
150 000 000
200 000 000
250 000 000
300 000 000
350 000 000
400 000 000
450 000 000
500 000 000
2010 2011 2012 2013 2014
Constant 2010 prices (R1000)
Ekurhuleni City of Johannesburg City of Tshwane
0.0%
1.0%
2.0%
3.0%
4.0%
5.0%
6.0%
2010 2011 2012 2013 2014
Average annual growth (constant 2005 prices)
Ekurhuleni City of Johannesburg
City of Tshwane
44

25
(community services), reflecting the presence of national and provincial departments and parastatals. The sector recorded 34% contribution to Tshwane’s gross value added (GVA) in 2014. As depicted in Figure 2.11, the five main sectors in 2014 were community services (34.0%), finance (25.4%), transport (11.8%), trade (11%) and manufacturing (9.3%). Overall, the significant sectors of growth in Tshwane include government, social and personal services, construction, trade, transport and finance with the green economy, research, innovation and development. These represent crucial multi-dimensional and dynamic sectors of growth.
Figure 2.11: Contribution to GVA (constant 2010 prices)
Source: IHS Global Insight (2016)
Figure 2.12: GVA per capita, 2011 to 2014 (constant 2010 prices)
Source: IHS Global Insight (2016)
0.0%
5.0%
10.0%
15.0%
20.0%
25.0%
30.0%
35.0%
40.0%
2010 2010.5 2011 2011.5 2012 2012.5 2013 2013.5 2014 2014.5 2015
Agriculture Mining Manufacturing Electricity Construction Trade Transport Finance Community services
2011 2012 2013 2014
GVA per Capita 76 581 77 208 77 836 77 205
% Change (y/y) 2.0% 0.8% 0.8% -0.8%
-1.0%
-0.5%
0.0%
0.5%
1.0%
1.5%
2.0%
2.5%
75 800
76 000
76 200
76 400
76 600
76 800
77 000
77 200
77 400
77 600
77 800
78 000
% C
han
ge (
y/y)
GV
A p
er C
apit
a
45

26
Figure 2.13: Proportion of Tshwane GVA-R by region, 2011 and 2014
Source: IHS Global Insight, 2015
Source: IHS Global Insight, 2015
Figure 2.13 summarises the GVA and contribution by all regions in Tshwane; this figure further illustrates the change in GVA contribution in 2011 and 2014. It can be noted from the figure that the regional contribution to Tshwane’s GVA only changed marginally over the period. Region 3 is still relatively dominant in Tshwane in terms of GVA contribution with a 32% contribution, although this has fallen from 34.3% from 2014. Region 6 is the second-largest contributor at 23%; this contrition has not changed over the last ten years. Region 5 (old Nokeng tsa Taemane) and Region 7 (old Kungwini) are the regions with the lowest contributions to Tshwane’s economy; the regions contributed 2% and 3% respectively.
Tress index
The tress index is an economic indicator that measures the level of concentration or diversification in an economy. The closer the index is to 100, the more concentrated the economy is. Comparing the four years reviewed, concentration in Tshwane increased from 56.98 in 2011 to 55.11 in 2013 and 57.59 in 2013 (see Figure 2.14).
46

27
Figure 2.14: Tshwane’s tress index, 2011–2014
Source: IHS Global Insight (2016)
Labour
The employment level in Tshwane increased from about 1,02 million people in 2011 to 1,12 million in 2014; a slight increase from 1,08 million in 2013. An average growth rate of 2.9% was seen. As can be expected, formal employment constituted the largest proportion, seeing a steady increase after the 2007/08 global financial crisis.
Figure 2.15 indicates the growth in total employment in Tshwane disaggregated by formal and informal sector. Formal employment is employment that is registered in some way. This employment can take place in a business, in the public sector or in a non-governmental organisation (NGO). A person in formal employment can be self-employed, an employer, an employee or a working family member. On the other hand, informal employment is not registered – a person in informal employment can be employed, self-employed, an employee or a working family member in the informal sector.
The City has, through its own job creation initiatives, facilitated the creation of more than 120 000 jobs as at June 2015.
2011 2012 2013 2014
Series1 56.98 56.76 57.69 57.59
56.20
56.40
56.60
56.80
57.00
57.20
57.40
57.60
57.80
47

28
Figure 2.15: Employment in Tshwane, formal and informal sector, 2011–2014
Source: IHS Global Insight (2016)
The percentage change in employment in Tshwane has been unstable, more so in the mining sector, which recorded a change of -3% in 2011 to 22% in 2012 and -1% in 2013. This can be attributed to the labour market tension in the mining sector following the 2012 platinum mining strike. The agriculture sector performed well from 2011 to 2012, with the percentage change in employment in the sector increasing from 11% in 2011 to 16% in 2012. This performance was short-lived, however, as the percentage change decreased to 0% in 2013, which resulted in a 1.8% decline in average employment (year on year) over the 2007–2010 period. Tshwane did, however, experience gains (in absolute terms) in overall employment between 2011 and 2014: 99 173 new formal employment have been recorded. The overall employment in the city increased from 1.02 million people in employment to 1.12 million in 2014. Figure 2.16 indicates the performance of Tshwane’s total employment (year on year) per sector.
2011 2012 2013 2014
Formal 883 693 920 798 951 070 982 866
Informal 134 725 135 812 138 206 140 843
CoT Total 1 018 418 1 056 610 1 089 276 1 123 709
CoT percentage change 1.6% 3.8% 3.1% 3.2%
0.0%
0.5%
1.0%
1.5%
2.0%
2.5%
3.0%
3.5%
4.0%
0
200 000
400 000
600 000
800 000
1 000 000
1 200 000
48

29
Figure 2.16: Tshwane’s year-on-year percentage change of total employment by industry (official definition), 2011–2014
Source: IHS Global Insight (2013)
Figure 2.16 indicates how total employment disaggregated by economic sectors has been performing over the period 2005–2014. As indicated in the figure, the City of Tshwane recorded average growth in employment of approximately 3.3% over the reviewed period. It should be noted that employment growth saw a drastic decline over the global financial crisis period; in 2007 South Africa recorded a 4.4% year-on-year employment growth, which declined to 0,6% during the crisis. Tshwane has been no exception as its year-on-year employment growth declined from 6.2% in 2007 to 0.01% in 2010. Tshwane’s informal employment sector was hit hardest by the recession period, compared with the formal sector, sustaining a negative average growth rate of 2.1%, compared with a 2.2% average year-on-year percentage change in formal sector employment.
-10.0%
-5.0%
0.0%
5.0%
10.0%
15.0%
20.0%
25.0%
30.0%
35.0%
2005 2006 2007 2008 2009 2010 2011 2012 2013 2014
Agriculture Mining Manufacturing Electricity
Construction Trade Transport Finance
Community services Households Total
49

30
Figure 2.17: Total employment per region, formal and informal sector, 2011–2014
Source: IHS Global Insight (2016)
Unemployment rate
The unemployment rate in Tshwane declined. In 2011, the unemployment rate was 21.6% and it improved slightly to 21.1% in 2014. The unemployment rate, disaggregated by population group, also saw some improvement over the reviewed period. The African population recorded an improvement from 26.1% to 25.1%, the white population a decrease from 6.4% to 6.2%, the Asian population remained unchanged at 4.3% and the coloured population improved slightly from 20.3% to 19.9%. Figure 2.18 indicates the changes over the 2011–2014 period.
Figure 2.18: Unemployment rate (official definition) by population group, 2011–2014
Region 1 Region 2 Region 3 Region 4 Region 5 Region 6 Region 7
2011 150 288 60 586 420 134 180 245 13 402 164 181 29 582
2012 154 041 60 515 435 168 193 080 13 744 169 483 30 579
2013 155 899 61 857 444 612 205 429 14 153 175 943 31 383
2014 154 851 62 691 452 355 223 465 14 664 183 446 32 237
0
50 000
100 000
150 000
200 000
250 000
300 000
350 000
400 000
450 000
500 000
Tota
l Em
plo
ymen
t
African White Coloured Asian Total
2011 26.1% 6.4% 20.3% 4.3% 21.6%
2012 26.0% 6.3% 20.7% 3.8% 21.6%
2013 25.5% 6.3% 20.4% 3.9% 21.3%
2014 25.1% 6.2% 19.9% 4.3% 21.1%
0.0%
5.0%
10.0%
15.0%
20.0%
25.0%
30.0%
UN
emp
loym
ent
Rat
e
50

31
Source: IHS Global Insight (2016)
Figure 2.19: Unemployment rate (official definition) by population group, 2011–2014
Source: IHS Global Insight (2016)
Social welfare indicators
Tshwane experienced some improvement in some of its social welfare indicators, i.e. the Human Development Index (HDI) and poverty rate. However, inequality in Tshwane seems to have worsened since 1996. Figure 2.20 indicates the performance of Tshwane’s social welfare indicators for the period 1996–2013.
Figure 2.20: Performance on key welfare indicators in Tshwane, 1996–2014
Source: IHS Global Insight (2016)
Region 1 Region 2 Region 3 Region 4 Region 5 Region 6 Region 7
2011 30.6% 26.3% 20.0% 11.3% 22.0% 18.4% 19.2%
2012 30.1% 26.5% 20.8% 11.2% 23.2% 18.5% 21.0%
2013 29.7% 26.2% 20.9% 11.1% 24.2% 18.3% 22.6%
2014 29.3% 26.2% 21.2% 11.0% 25.4% 18.3% 24.3%
0.0%
5.0%
10.0%
15.0%
20.0%
25.0%
30.0%
35.0%
Un
emp
loym
ent
Rat
e
0.00
0.10
0.20
0.30
0.40
0.50
0.60
0.70
0.80
0
100 000
200 000
300 000
400 000
500 000
600 000
1996 1997 1998 1999 2000 2001 2002 2003 2004 2005 2006 2007 2008 2009 2010 2011 2012 2013 2014
Poverty HDI Gini
51

32
Social welfare is qualified by the HDI, the Gini coefficient and people living in poverty.
Human Development Index (HDI): The HDI is a composite relative index used to compare human development across population groups or regions. HDI is the combination of three basic dimensions of human development:
A long and healthy life ; Knowledge; and A decent standard of living.
A long and healthy life is typically measured using life expectancy at birth. Knowledge is typically measured using adult literacy and/or the combination of enrolment in primary, secondary and tertiary institutions. A decent standard of living is typically measured using the gross domestic product (GDP) per capita. The HDI is valued between 0 and 1, with 0 indicating no human development and 1 indicating a very high level of human development.
Figure 2.21 indicates changes in the HDI disaggregated by population group over the 2011–2014 period. As indicated in the figure, the HDI across the white, black and Asian population improved, while the HDI of the coloured population remained unchanged.
Figure 2.21: Tshwane Human Development Index by population group, 2011–2014
Source: IHS Global Insight (2016)
African White Coloured Asian Total
2011 0.62 0.88 0.71 0.79 0.70
2012 0.63 0.88 0.72 0.79 0.70
2013 0.63 0.89 0.72 0.80 0.71
2014 0.63 0.89 0.71 0.80 0.71
0.00
0.10
0.20
0.30
0.40
0.50
0.60
0.70
0.80
0.90
1.00
HD
I
52

33
Figure 2.22: Tshwane Gini coefficient by population group, 2011–2014
Source: IHS Global Insight (2016)
Gini coefficient: The Gini coefficient is a summary statistic of income inequality which varies from 0 to 1. If the Gini coefficient is equal to 0, it means that incomes are distributed in a perfectly equal manner, indicating a low variance between high- and low-income earners in the population. If the Gini coefficient is equal to 1, income is completely unequal, with one individual in the population earning income, while everyone else earns nothing. As indicated in Figure 2.22, the Gini coefficient in Tshwane worsened slightly over the 2011–2014 period. However, it remained unchanged for the African, coloured and Asian population. Only the white population’s Gini coefficient worsened over the reviewed period, but contributed to an overall average Gini coefficient outlook in Tshwane.
People living in poverty
The number of people living in poverty is the number of people living in households that have an income which is less than the poverty income.
The poverty income is defined as the minimum monthly income needed to sustain a household and varies according to the size of that household. The larger the household, the larger the income required to keep its members out of poverty. This measure allows for economies of scale in larger households.
Figure 2.23 indicates the number of people in Tshwane living below the poverty line, disaggregated by population group. As indicated in the figure, the number of these people increased. This is also evident from the increase in the number of indigent people registered as such on an annual basis. As one would expect, the African population had the largest proportion of people living below the poverty line.
African White Coloured Asian Total
2011 0.60 0.42 0.54 0.47 0.63
2012 0.61 0.43 0.55 0.48 0.63
2013 0.60 0.42 0.55 0.48 0.64
2014 0.60 0.42 0.54 0.47 0.64
0.00
0.10
0.20
0.30
0.40
0.50
0.60
0.70
Gin
i co
effi
cien
t
53

34
Figure 2.23: People living below the poverty line in Tshwane by population group, 2011–2014
Source: IHS Global Insight (2016)
To reduce deprivation and poverty, the City is channelling resources in a balanced manner to areas where people are living below the poverty line. Evidence of this is the allocation of capital funding for social infrastructure to deprived areas in order to ensure that all settlements have access to basic and social services. This will be continued and intensified so that ultimately the poor rise on the ladder of prosperity and become self-sufficient
Figure 2.24: People living below the poverty line in Tshwane by region, 2011–2014
Figure 2.24 depicts the number of people living below poverty line within the regions in Tshwane. Regions 1 and 3 had the highest number of people living in poverty; this is partly attributed to the high concentration of residents, thus indicating that a significant number of the population have low levels of education, high
African White Coloured Asian Total
2011 375 323 355 3 366 270 379 315
2012 415 133 458 3 695 308 419 594
2013 447 838 484 4 009 332 452 664
2014 473 312 450 4 404 368 478 533
0
50 000
100 000
150 000
200 000
250 000
300 000
350 000
400 000
450 000
500 000
Region 1 Region 2 Region 3 Region 4 Region 5 Region 6 Region 7
2011 148 038 62 530 61 438 20 592 13 253 58 103 15 360
2012 159 801 66 940 70 110 25 495 15 354 64 731 17 163
2013 168 405 71 377 78 055 29 688 16 740 70 053 18 345
2014 176 844 75 462 83 371 32 673 17 204 73 583 19 395
0
20 000
40 000
60 000
80 000
100 000
120 000
140 000
160 000
180 000
200 000
54

35
unemployment, very low incomes and poor living standards. In view of the specialised nature of the industrial areas, there are limited job opportunities for unskilled labourers in the regions.
Access to basic services as at June 2015
The City has continuously focused on sustainable provision, expansion and maintenance of basic services through the IDP and its supporting programmes. In the past two years, including 2014/15, Tshwane has been a construction zone of big and small projects, such as Operation Reclaim, the A Re Yeng system, the free Wi-Fi project and Re Aga Tshwane. Various projects and programmes for developing new infrastructure and replacing and upgrading old infrastructure have also been implemented. All these confirmed the City’s commitment to changing Tshwane for the better on behalf of its residents.
The previous plans of the City included taking strides to ensure access to basic services and reporting on these aspects; the focus of this plan is to also relay progress on the targets set in 2011/16 IDP and to demonstrate how such progress has contributed to the development of Tshwane and its communities. The following is an overview of some of the initiatives that have been introduced and implemented during 2014/15 financial year:
Water, sanitation and waste management
At the beginning of the current term of Council in 2011, the City aimed increase the number of households in formal areas that have access to water through a metered connection. The target was, therefore, that by 2015/16, 78.77% of formal households would have access to water through a metered water connection. By the end of the 2014/15 financial year, it was reported that 80.73% of households (735 842 households) had access to a metered water connection. The City has also provided rudimentary water services in the form of Jojo tanks and water tankers to households living in informal areas. This therefore indicates that by the end of the 2014/15 financial year the City had achieved and exceeded the term’s target by 1.96%. This initiative is being continued in the 2015/16 financial year and beyond.
With regard to sanitation, the target set in 2011 was to give 77.67% of Tshwane households (707 990 households) access to waterborne sanitation. It was reported in 2014/15 that the percentage of households with access to waterborne sanitation had increased to 78.37% (714 403 households). Providing waterborne sanitation is still a priority for the City.
However, the City continuously faces land invasions, which place a burden on the roll-out of water and sanitation services to communities, which causes a backlog. Land invasions also impact on the facilitation of sustainable human settlements through the provision of sites, services and housing. Furthermore, certain major bulk service delivery projects have been compromised by communities who hamper the construction process.
55

36
With regard to non-revenue water (NRW), it has been noted that the components affecting NRW are varied and primarily related to matters such as metering, reactive and preventative maintenance, loss minimisation, retrofitting, water theft, effective meter reading and billing. Other secondary issues such as water quality, rehabilitation of water resources, social awareness, minimising pollution, etc are also considered to play an important role in management of water demand (and may therefore affect NRW). In an effort to reduce NRW, interventions have been put in place. These include continuous investigation of various factors leading to water loss and the implementation of initiatives to assist with the reduction of non-revenue water. In this instance, the City, together with Rand Water, has investigated and replaced outdated bulk water meters at a number of its bulk intake points. This has led to a new baseline of NRW, although the City has been able to reduce NRW with the aid of historically reported information.
The City has continued to provide improved delivery of its services in terms of waste removal. Concerted efforts have been made to ensure that adequate waste management facilities and infrastructure are provided. Since the beginning of the Council’s term, the City managed to replace 85 ℓ bins with 240 ℓ bins in all old townships. Weekly waste removal services is also provided to all formalised and proclaimed areas in Tshwane, and informal areas are receiving a rudimentary waste removal service through the collection of 85 ℓ bins, plastic bags, removal of communal skips and clearing of illegal dumping sites on a weekly basis or when required.
Electricity
The 2011 census results recorded that 88.6% of households had access to electricity. It would seem, as indicated by Census 2011, that Tshwane had one of the highest percentage of households with access to electricity for lighting. Although this seems to be a good achievement, this figure could have included households with illegal connections which were not accounted for in the City’s billing system. To ensure a sustainable electricity supply, the City has focused on investments in bulk infrastructure and network upgrading since 2011, thus ensuring an increase in access to households with electricity from 68.3% to 79.71% (726 630 households) by the end of the 2014/15 financial year. During 2014/15 alone, 9 152 new electricity connections were delivered in order to address electricity backlogs.
Furthermore, in the 2011–2016 IDP, the City committed to reduce non-revenue electricity (NRE) to 10% annually. The reduction of NRE has not been realised as targeted. NRE is due to electricity distribution losses which comprise technical and non-technical losses; it also results from the difference between electricity purchased and electricity sold. However, the City has introduced several initiatives to reduce non-technical losses, including the following:
Weekly cable operations to remove illegal connections; Daily meter audits; Normalisation of prepaid meters that are not buying electricity; Strengthening of network and refreshment; and Installation of tamper-proof boxes.
56

37
Roads, storm water and transportation services
The City faces public transport challenges as a result of inefficient land use practices of the past that perpetuated urban sprawl. Thus, most of the poor households are located far from economic opportunities.
The challenges regarding public transport centre on reliability, convenience and safety of public transport services, lack of coordinated and integrated public transport modes, as well as inadequate non-motorised transport facilities. These challenges are juxtaposed with an aging road network infrastructure and backlogs in terms of complete provision of roads, especially in the townships and rural areas of Tshwane.
To address the above, the City has delivered 30.7% of the backlog in roads by June 2015 and exceeded the target set for new roads to be constructed to address the backlog for roads for the term. This was supported by the provision of appropriate storm water drainage systems to contribute to the eradication of the backlog; 48.79% out of the total backlog for storm water against a target of 47.23% set for the term was achieved. The City has continued investing in expanding its road network, focusing specifically on reducing the roads and infrastructure backlogs.
Development of the TRT (Tshwane Rapid Transit) (A Re Yeng) system delivered 12.07 km of bus lanes in 2014/15; this included seven TRT stations, 61 feeder stops and the delivery of 30 diesel buses. The CBD–Hatfield route has been in operation for well over a year now and has contributed to addressing the public transport need. This is central to addressing the transport infrastructure backlog, and it is supplemented by the construction of non-motorised transport facilities, especially in the inner city.
TRT (Tshwane Rapid Transit) integration with other modes of transport
The TRT trunk network integrates with other modes of public transport at six key nodes: Kopanong, Wonderboom (Rainbow Junction), Pretoria Station, Belle Ombre, Hatfield and Denneboom. To improve the accessibility of non-motorised transport (NMT), the trunk and feeder network will also incorporate NMT infrastructure by means of bicycle lanes.
The TRT system is designed to comply with universal access design standards, thereby also benefiting persons with disabilities. Universal access infrastructure is installed in stations, feeder stops, buses and NMT infrastructure.
The intention of the TRT service is to replace all competing road-based public transport services within its corridor of operations. Affected existing operators will be compensated or incorporated into the bus operating entity (or entities) that will be responsible for TRT operations.
Housing and human settlement
Meeting the demand for housing remains one of the City’s biggest challenges, as is clear from the existence of informal settlements. The City has formalised 47 informal settlements by June 2015. Unfortunately, the immigration of people into the city and regular land invasions have negatively affected the rate of formalisation. Informal
57

38
settlements and informal dwellings are likely to continue to exist, because the “big city” is a magnet for internal and international migrants who seek education and job opportunities as well as access to health services.
To address the challenge of informal settlements and improve living conditions, the City has continued to provide rudimentary water and sanitation services to informal areas. During the 2014/15 year, 16 informal settlements have been formalised to meet proclamation requirements. A concerted effort has been made to provide alternative tenure options by means of community residential units and social housing. During the year under review, 48 community residential units were developed, totalling 289 community residential units since the initiative started in 2013/14. Although the implementation of this initiative has not gained full momentum, the City has put measures in place to ensure the programme stays on track and responds to housing need during the MTREF. Furthermore, 234.49 hectares of land was acquired for human settlement purposes; also, in an effort to provide security of tenure to residents, 3 821 title deeds were registered to new homeowners and 1 374 housing beneficiaries were allocated houses. The City is continuing the process to ensure that security of tenure remains a priority.
Shared economic growth and job creation
The City has made enormous strides in creating work opportunities for unemployed and unskilled Tshwane residents; specific focus was on the unemployed youth. The Expanded Public Works Programme (EPWP) and Tshepo 10 000 initiatives were the key vehicles used to address the challenges of unemployment and lack of economic opportunities in Tshwane. Through these targeted interventions, the City created short-term labour-intensive work opportunities and opportunities for small business development. The City initially committed to create 40 000 EPWP work opportunities for the period and had significantly exceeded that target.
The City committed to SMME and entrepreneurial support; this resulted in supporting 5 649 SMMEs during the 2014/15 financial year. This year also saw the City winning the best project Metropolitan and District/Local category with its Youth and Greening EPWP Project, called “Vat Alles”, at the National Department of Public Works’ Kamoso Awards. Since the start of the Council’s term, a total of 122 328 job opportunities were facilitated by the City. This was also supported by the facilitation of private sector investment of over R10 billion in developments. The City hopes to sustain the good work done in order to successfully deal with unemployment within its control.
Social development and security
Social cohesion and the safety of citizens in Tshwane are key objectives in the IDP. Over the current term, the City of Tshwane has developed and operationalised two new libraries and developed and upgraded a number of sport and recreational facilities, including the Giant Stadium. Thirteen additional parks were developed in line with the two parks per ward programme. As for safety and security, the City has started to expand metro policing by rolling out police operations and visibility in all
58
39
wards, thus executing about 2 950 policing initiatives to reduce crime and related incidents.
The implementation of the emergency services programmes has also contributed to a decline in safety incidents in Tshwane. The health status of residents has been improved by ensuring that all health facilities for which the City is responsible are providing PMTCT programmes. The City has also consistently achieved its target on immunisation of children younger than one year. Through the implementation of the City’s indigent policy, more poor households have been supported with free basic services and social support. This has contributed to an increase in the number of households on the City’s indigent register and thus calls for the City to employ strategic interventions to promote job creation.
The City has also done a detailed study to access the level of access of the population to community facilities such as schools, clinics, community halls and sports and recreational facilities. This study first, established the acceptable norms and standards for access to each of these facilities and then analysed access to these based on the concentration of population using travel time and distance. The results of this study showed that the majority of the population in the City has access to these facilities however it shed the following generic insights on the challenges faced re: the provision of community facilities: 1) there areas where the facility exists however these need to be expanded to increase its carrying capacity; 2) some areas where facilities do not exist, the City needs to consider employing an integrated approach to facilities development through the development of multi-purpose facilities to address land availability as well as to ensure economic efficiencies for households.
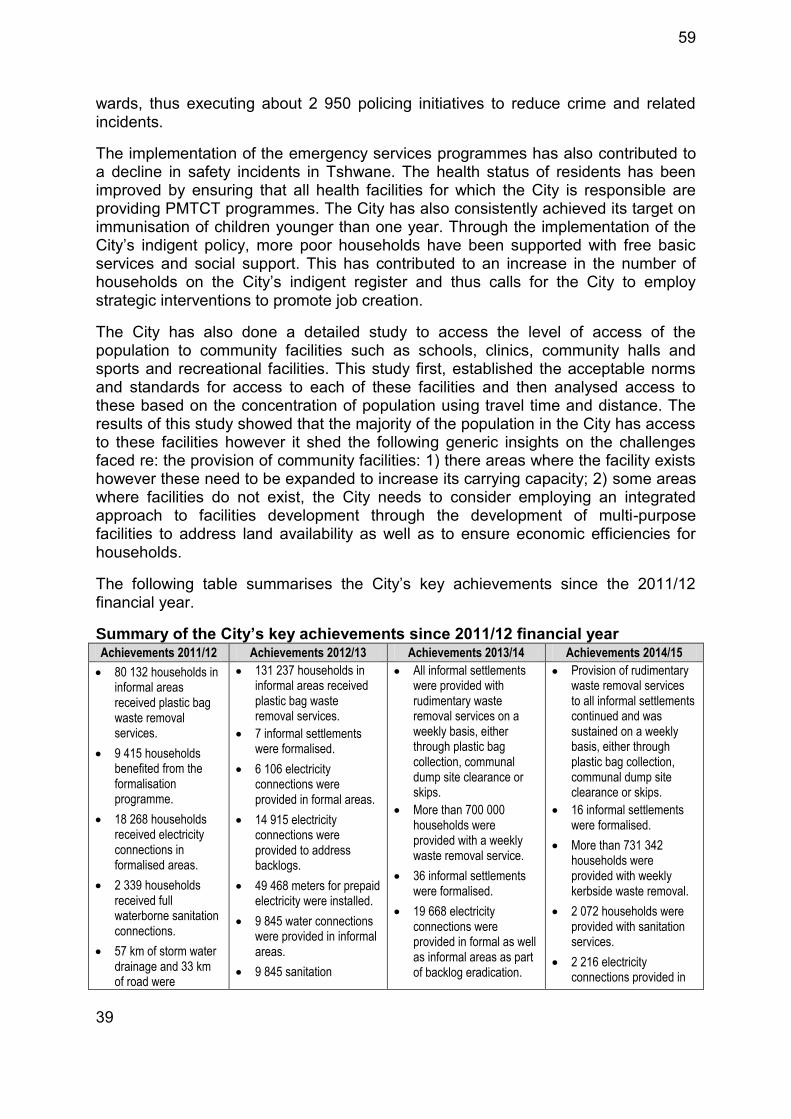
The following table summarises the City’s key achievements since the 2011/12 financial year.
Summary of the City’s key achievements since 2011/12 financial year Achievements 2011/12 Achievements 2012/13 Achievements 2013/14 Achievements 2014/15
80 132 households in informal areas received plastic bag waste removal services.
9 415 households benefited from the formalisation programme.
18 268 households received electricity connections in formalised areas.
2 339 households received full waterborne sanitation connections.
57 km of storm water drainage and 33 km of road were
131 237 households in informal areas received plastic bag waste removal services.
7 informal settlements were formalised.
6 106 electricity connections were provided in formal areas.
14 915 electricity connections were provided to address backlogs.
49 468 meters for prepaid electricity were installed.
9 845 water connections were provided in informal areas.
9 845 sanitation
All informal settlements were provided with rudimentary waste removal services on a weekly basis, either through plastic bag collection, communal dump site clearance or skips.
More than 700 000 households were provided with a weekly waste removal service.
36 informal settlements were formalised.
19 668 electricity connections were provided in formal as well as informal areas as part of backlog eradication.
Provision of rudimentary waste removal services to all informal settlements continued and was sustained on a weekly basis, either through plastic bag collection, communal dump site clearance or skips.
16 informal settlements were formalised.
More than 731 342 households were provided with weekly kerbside waste removal.
2 072 households were provided with sanitation services.
2 216 electricity connections provided in
59

40
Achievements 2011/12 Achievements 2012/13 Achievements 2013/14 Achievements 2014/15
provided. connections were provided in informal areas.
62 km of roads was developed.
71 km of storm water drainage was provided.
1 700 UDS sanitation devices were provided in Winterveld.
13 786 meters for prepaid electricity were installed as part of the security of revenue project.
14 292 households were connected to water.
1910 households were connected to sanitation services.
More than 71 km of roads were constructed.
Nearly 88 km of storm water drainage was constructed.
27 new parks were developed in line with the two-parks-per-ward programme.
formalised areas.
9 152 houses were provided with electricity to eradicate backlogs.
12.07 km of TRT bus-way lanes roads were constructed.
62,452 km of roads were provided in the proclaimed areas.
37 761 storm water drainage system were provided in the proclaimed areas.
16 informal settlements/township were formalised.
48 community residential units were developed.
23 397 jobs were created.
Applications were submitted to access the jobs fund. This is anticipated to assist with the job creation focus for the remainder of the five-year term.
20 386 EPWP job opportunities were created.
1 505 jobs were created.
R2 billion of investment in Tshwane was secured.
60 fresh produce entrepreneurs were supported.
32 524 income-earning opportunities were facilitated.
6 335 SMMEs were supported.
Investment in Tshwane to the value of more than R2 billion was facilitated.
44 516 new income-earning opportunities were facilitated.
5 649 SMMEs were supported by the City.
About R2.1 billion worth of investments was facilitated.
325 Tshepo 10 000 cooperatives were supported through mentorship/training in all 105 wards.
60

41
Achievements 2011/12 Achievements 2012/13 Achievements 2013/14 Achievements 2014/15
89 666 indigent households received access to free basic services (100 kWh electricity and 12 kℓ water).
1 307 indigent households were linked to exit interventions that provided work and training opportunities to indigent households, which supported the restoration of dignity to poor households.
98% of children were immunised.
The PMTCT programme was fully implemented.
10 454 newly registered indigent households received free basic services.
2 078 indigent households exited the indigent register due to the indigent support and exit programme.
All fixed clinics implemented the PMTCT programme.
91% of pregnant women were tested for HIV.
95% of children younger than 1 year were immunised.
Two library facilities were developed.
One sport facility was developed.
7 654 newly registered indigent households received free basic services.
2 370 indigent households exited the indigent register due to the indigent support and exit programme.
All fixed clinics implemented the PMTCT programme.
The Stanza Bopape Library was opened in Mamelodi and replaced the old library.
Upgrading of the Giant Stadium (20 000 seats) was completed.
About 4 653 ECD pupils benefited from the City’s annual ECD programme.
75,742% of children under 1 year of age were immunised.
2 435 indigent households exited the indigent register.
13 parks were developed in line with the two parks per ward programme.
The PMTCT programme was fully implemented.
Ward committee elections took place and ward committees were appointed.
Intensive outreach took place for the IDP and the development of Tshwane Vision 2055. Outreach was also planned for public input on the TGDS 2055.
A customer service environmental audit was completed in Regions 5 and 7 to improve customer care in those regions.
105 ward committees were trained in 20 training interventions.
All ward committees met as planned.
Training programmes were scheduled in all seven regions to train ward committees on identified core skills.
Online payment for traffic fines was made possible through the e-Tshwane portal.
100 km of a test broadband network was completed in various regions of the City.
The programme to provide free Wi-Fi, especially at tertiary education institutions, gained momentum.
Ward committees were formed in all 105 wards. However, due to court processes, ward committees were halted and suspended effective November 2014, due to the finalisation of the court processes declaring the election of the ward committees invalid. The Council took a resolution to have Transitional Ward-Based Consultative Forum meetings, which ensured a platform to reach the community while awaiting new elections of the ward committees.
A detailed account of the City’s performance for the 2014/15 financial year can be obtained in the City’s 2014/15 Annual Report.
Conclusion
The above reflects the City of Tshwane’s commitment to ensure that it delivers on the following priorities:
Building local economies to create more employment, decent work and sustainable livelihoods;
Improving the City’s services and broaden access to them;
61

42
Building more united, non-racial, integrated and safer communities; Promoting more active community participation; and Ensuring that the City becomes more effective, accountable and clean, and
that it works together with national and provincial government.
62

43
3. STRATEGIC CONTEXT
Introduction
This chapter highlights the strategic pillars that guide the development plans for the 2016–2021 term of office. One of these is the City’s commitment to align with national government outcomes as they relate to the local government, the Tshwane 2055 Strategy and its principles and outcomes.
The chapter will demonstrate how the City will ensure, through its programmes and projects that it works towards achieving the objectives of Tshwane Vision 2055.
The core strategic plans and planning instruments that drive the City’s strategic direction are indicated in the diagram below:
Figure 3.1: Strategic planning documents to support Vision 2055
Context
The 2016–2021 IDP review marks the first IDP for the 2016–2021 term of office. The IDP seeks to emphasise the work that the City will carry out over the next five years to deliver on the “First decade of game changing” for Tshwane Vision 2055. The 2011–2016 IDP term focused on delivering the basic functions of local government and in expanding access to these; the 2016–2021 term of office will continue this with added emphasis on doing so an integrated manner that will allow the City to achieve each of the outcomes. The development of this IDP was shaped by key events, including the following:
national commitments which have an impact on how the City delivers its services. These include the Sustainable Development Goals and the COP 21
63
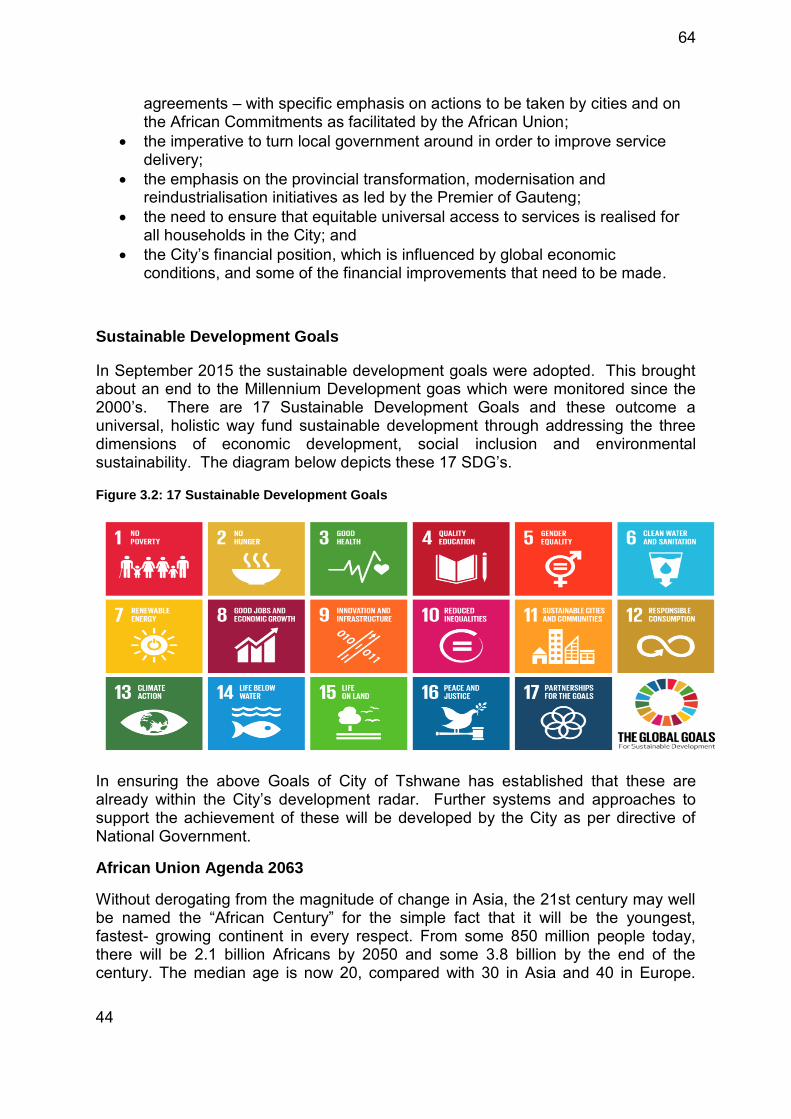
44
agreements – with specific emphasis on actions to be taken by cities and on the African Commitments as facilitated by the African Union;
the imperative to turn local government around in order to improve service delivery;
the emphasis on the provincial transformation, modernisation and reindustrialisation initiatives as led by the Premier of Gauteng;
the need to ensure that equitable universal access to services is realised for all households in the City; and
the City’s financial position, which is influenced by global economic conditions, and some of the financial improvements that need to be made.
Sustainable Development Goals
In September 2015 the sustainable development goals were adopted. This brought about an end to the Millennium Development goas which were monitored since the 2000’s. There are 17 Sustainable Development Goals and these outcome a universal, holistic way fund sustainable development through addressing the three dimensions of economic development, social inclusion and environmental sustainability. The diagram below depicts these 17 SDG’s.
Figure 3.2: 17 Sustainable Development Goals
In ensuring the above Goals of City of Tshwane has established that these are already within the City’s development radar. Further systems and approaches to support the achievement of these will be developed by the City as per directive of National Government.
African Union Agenda 2063
Without derogating from the magnitude of change in Asia, the 21st century may well be named the “African Century” for the simple fact that it will be the youngest, fastest- growing continent in every respect. From some 850 million people today, there will be 2.1 billion Africans by 2050 and some 3.8 billion by the end of the century. The median age is now 20, compared with 30 in Asia and 40 in Europe.
64
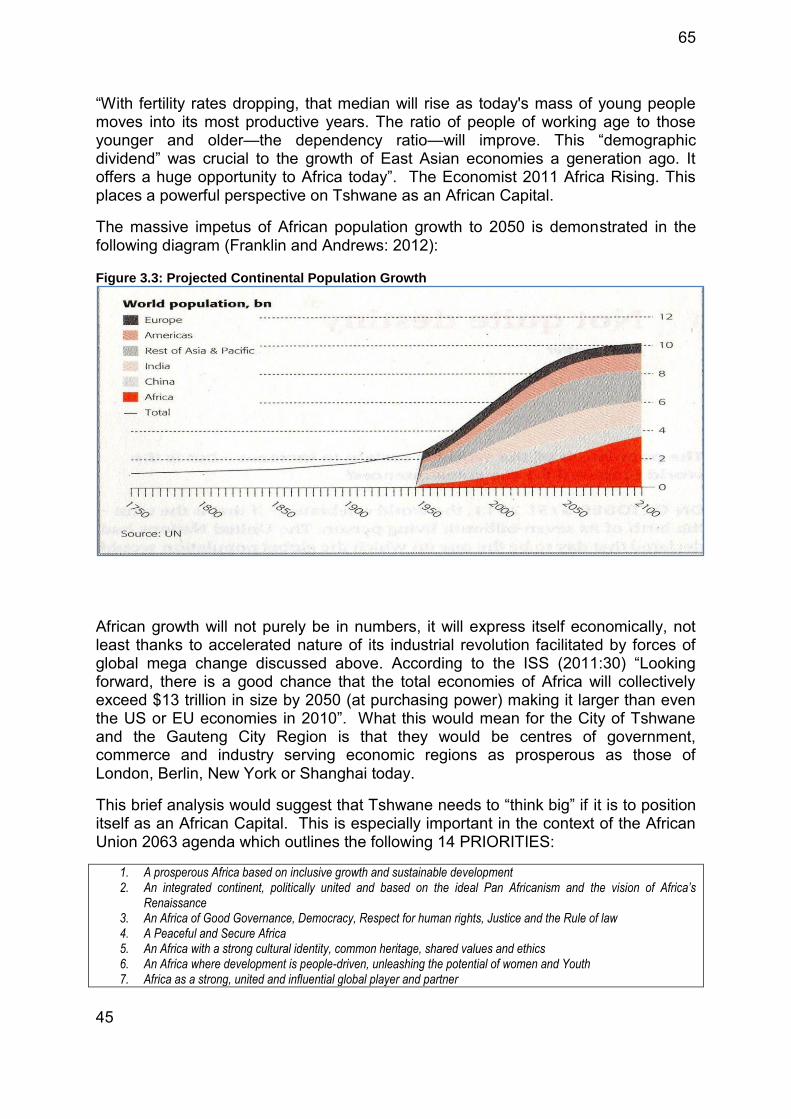
45
“With fertility rates dropping, that median will rise as today's mass of young people moves into its most productive years. The ratio of people of working age to those younger and older—the dependency ratio—will improve. This “demographic dividend” was crucial to the growth of East Asian economies a generation ago. It offers a huge opportunity to Africa today”. The Economist 2011 Africa Rising. This places a powerful perspective on Tshwane as an African Capital.
The massive impetus of African population growth to 2050 is demonstrated in the following diagram (Franklin and Andrews: 2012):
Figure 3.3: Projected Continental Population Growth
African growth will not purely be in numbers, it will express itself economically, not least thanks to accelerated nature of its industrial revolution facilitated by forces of global mega change discussed above. According to the ISS (2011:30) “Looking forward, there is a good chance that the total economies of Africa will collectively exceed $13 trillion in size by 2050 (at purchasing power) making it larger than even the US or EU economies in 2010”. What this would mean for the City of Tshwane and the Gauteng City Region is that they would be centres of government, commerce and industry serving economic regions as prosperous as those of London, Berlin, New York or Shanghai today.
This brief analysis would suggest that Tshwane needs to “think big” if it is to position itself as an African Capital. This is especially important in the context of the African Union 2063 agenda which outlines the following 14 PRIORITIES:
1. A prosperous Africa based on inclusive growth and sustainable development 2. An integrated continent, politically united and based on the ideal Pan Africanism and the vision of Africa’s
Renaissance 3. An Africa of Good Governance, Democracy, Respect for human rights, Justice and the Rule of law 4. A Peaceful and Secure Africa 5. An Africa with a strong cultural identity, common heritage, shared values and ethics 6. An Africa where development is people-driven, unleashing the potential of women and Youth 7. Africa as a strong, united and influential global player and partner
65

46
National Development Plan 2030
The overarching national development agenda to facilitate the transition to the AU Agenda 2063 and sustainable development goals (SDGs) is the NDP Vision 2030. Nationally, all of government must work to realise the objectives of the National Development Plan (NDP 2030). The NDP defines the destination the country wants to be at in 2030 and also identifies the roles different sectors of society need to play in reaching that goal. The Plan aims to ensure that all South Africans attain a decent standard of living through the elimination of poverty and reduction of inequality. The core elements of a decent standard of living identified in the Plan are:
Housing, water, electricity and sanitation; Safe and reliable public transport; Quality education and skills development; Safety and security; Quality health care; Social protection; Employment; Recreation and leisure; Clean environment; and Adequate nutrition.
Tshwane 2055 makes extensive reference to the 2030 National Development Plan (NDP) in the Tshwane Vision 2055 and the City is still committed to work in line with the aspiration of the Plan. However is that the NDP was excessively optimistic about South Africa’s growth prospects, at least in the short to medium term that its targets may well prove to be unattainable. According to the Mind the Gap report by senior KPMG economist Lullu Krugel (2015) the current South African infrastructure spending gap will amount to more than R297-billion between 2013/14 and 2015/16 which will steadily increase to more than R6-trillion for the period 2016/17 to 2029/30 if the NDP infrastructure spending target is to be met. According to Krugel, more than half of this capital will need to come from non-government sources and must be set against the backdrop of a highly constrained macro financial outlook2.
This has immense implications for City’s infrastructure investment programme and suggests that the City needs to seriously investigate non-traditional sources of infrastructure financing and service delivery models that do more with less. This needs to form a key element of Tshwane 2055 going forward.
A second area of importance to implementation of Tshwane Vision 2055 from the NDP perspective is Operation Phakisa, the implementation programme of the NDP. It is based on Big Fast Results Methodology (Malaysian government) and focuses on bringing key stakeholders from the public and private sectors, academia as well as civil society organisations together. The implementation of the plans are rigorously monitored and reported on and the City seeks to support this initiative through the alignment of its plans. 2https://www.kpmg.com/ZA/en/IssuesAndInsights/ArticlesPublications/General-Industries-Publications/Documents/Mind%20the%20gap.pdf
66

47
City-region integration imperatives
Gauteng government’s policy priorities and its medium to long term programme of radical socio-economic transformation emphasize the three themes of transformation, modernisation and re-industrialization (TMR). This is the provincial’s long term vision of building the Gauteng City Region (GCR) of a Metropolitan System of Governance. This is done to ensure that the provincial 2055 Growth and Development Strategy is achieved in line with the City-region’s vision which is:
“An integrated city-region, characterised by social cohesion and economic inclusion; the leading economy on the continent, underpinned by smart, sustainable and socio-economic development.”
The Development of the GCR is anchored on the TMR and its Ten Pillar programme:
Radical economic transformation Decisive spatial transformation Accelerating social transformation Transformation of the state and governance Modernisation of the public service Modernisation of the economy Modernization of human settlements Modernisation of public transport Re-industrialise Gauteng and south Africa Take a lead in Africa’s new industrial revolution
Having discussed the above, the diagram below summarised the contextual strategic issues on the implications for the City:
Figure 3.4: Summary of strategic context implications for the City
Development of the City of Tshwane IDP
The above considerations are factored into the development of the 2016–2021 IDP with its targets and the financial plan it contains. Further, the strategic emphasis of
The City needs to respond to the Mega change scenarios for
global population growth and recognise the
challenges this may bring re poverty,
unemployment and inequality
Need to employ new ways of driving
development through partnerships, community
-led development and promotion of safety nets
Needs to foster IGR especially in the context of the City-region and in contributiong towards the African Agenda
67

48
the term seeks conclusion on the short-term imperatives, while the key strategic interventions as identified and planned for the purpose of laying a foundation for the capital city that all would like to see in 2055. Conceptually, the evolvement of the IDP during the term is captured in the diagram below:
Figure 3.5: Conceptual evolution of the IDP since 2011
Tshwane Vision 2055 long-term strategic focus
The envisaged outcomes of Tshwane Vision 2055 were approved by the Council in 2013 as part of the long-term vision for the city. The approved outcomes are as follows:
Outcome 1: A resilient and resource-efficient city; Outcome 2: A growing economy that is inclusive, diversified and competitive; Outcome 3: Quality infrastructure development that supports liveable communities; Outcome 4: An equitable city that supports happiness, social cohesion, safety and healthy citizens; Outcome 5: An African capital city that promotes excellence and innovative governance solutions; and Outcome 6: South Africa’s capital city with an activist citizenry that is engaging, aware of their rights and presents themselves as partners in tackling societal challenges.
2013/14 IDP: Laying a
foundation towards
Tshwane Vision 2055
2016/21 IDP: The culmination of the first
decade of game-changing of Tshwane Vision 2055
2011/16 IDP” Consolidating on
the Gains of democracty and focusing on the
Basics
68

49
These are long-term outcomes that have been designed to incrementally measure the success of the City in the four “decades of game changing” as depicted in the diagram below:
Figure 3.6: Key milestones for the decades of game-changing
To implement Tshwane Vision 2055 in the current term of Council, the 2016–2021 IDP aligned the strategic objectives as approved by the Council to the six outcomes contained in Tshwane Vision 2055. These are still relevant and are used as building blocks for the development of service delivery and budget implementation plans for the term. The strategic objectives are as follows:
1. Provide sustainable services infrastructure and human settlements; 2. Promote shared economic growth; 3. Ensure sustainable, safer communities and integrated social development; 4. Promote good governance and an active citizenry; 5. Improve financial sustainability; and 6. Continue institutional development, transformation and innovation.
The Tshwane Vision 2055 outcomes and strategic actions as well as the IDP strategic objectives are used as the framers for the City’s identified long-term catalytic projects which were introduced during the 2011–2016 term of Council. They are the implementation tools of Tshwane Vision 2055, and have been recognised as the anchor that will keep the vision alive.
It should be noted that the City is still working on a process to develop the operational plans, and it is also developing systems and confirming monitoring and evaluation mechanisms for credible indicators which can be used to measure whether the planned indicators and targets will achieve the desired impact. This process will be concluded before the first review of the
By 2020
Consolidating the gains of democracy and tackling the
triple challenges of unemployment, poverty
and inequality
By 2030
Managing sustainable urban growth
By 2040
Transitioning towards sustainable urban form
and economy
By 2055 and beyond
Living a better and prosperous life
69

50
IDP and therefore the proposed success measures in the sections to follow are nominal.
70

51
OUTCOME 1: RESILIENT AND RESOURCE EFFICIENT CITY
Introduction
This outcome integrates the work of the City that take the strategic and practical lead on the City’s constitutional mandate to ensure the prevention of pollution and the conservation and sustainable use of natural resources for its residents.
This outcome is the City of Tshwane’s commitment to implement the principles enshrined in section 24 of the South African Constitution stating that “everyone has the right to an environment that is not harmful to their health or well-being and to have the environment protected for the benefit of current and future generations through reasonable legislative and other measures.
The City of Tshwane has committed to achieve this outcome through interventions of a ‘smart environment.’ The characteristics of a smart environment include the aesthetic nature of the City’s natural environment, pollution reduction and prevention interventions, natural resource conservation and sustainable resource use and management. Through the adoption and use of innovative strategies supported by appropriate technology, the City of Tshwane will be better placed to achieve environment sustainability in the remaking of the City where environmental sustainability is non-negotiable in achieving the City’s economic and social goals. Environmental sustainability is about the City improving the quality of life for its residents by protecting and preserving its natural resources. This requires the sustainable use of the City’s natural resources while retaining and improving the quality of the natural environment to ensure ‘green’ urban growth as well as address climate change.3
The management and use of water resources and waste water are central to this outcome. Initiatives which will ensure sustainable use of water as well as the minimisation and re-use of wastewater is part of the deliverable to achieve this outcome. This matter has been amplified by the recent drought experienced by the country which calls into action prudent water management whilst expanding access to clean water to all households.
The issues of transportation are also critical not only to move people from home to work but also recognising transport as a critical support mechanism to economic growth and liveability. Focus here should be on all modes of transportation including linking rail to road transport, facilitating road infrastructure development in economic hubs, and consolidation of the expressed multi-sphere government interest in the development of freight and logistics hub in the City. Further, formalisation of informal settlements and development of new townships means that the City not only has a task to build new roads but also to facilitate access to reliable and affordable transport in new and existing settlements of the City. This cannot be done outside the need to ensure that road infrastructure in existing settlements need to be maintained to maintain its quality.
3 Tshwane Vision 2055
71

52
Similarly, the need to supplement the existing energy sources that are utilised by business and households to reduce the carbon foot print of the City cannot be ignored. The current initiatives of the City to refurbish its existing power generation facilities and supplement the electricity generation with clean energy generation in the form of photovoltaic power generation and waste to energy are some of the positive steps that the City has undertaken towards achieving this outcome.
Vision 2055 also notes that infrastructure is the most common entry point to achieve prosperity in the City as it provides the foundation for growth. Therefore, prioritizing infrastructure is part of long – term economic development for any City to ensure sustainability of the various initiatives. The City therefore needs to develop comprehensive infrastructure plans for the first decade of game changing to ensure that the backlogs and infrastructure gaps are identified and costed and out of this concrete plans can be developed for the 2016/21 term of office.
The City has over the number of years increased access to waste removal services to formal as well as informal households. The management of the various landfill sites has also been prioritised and measures implemented to adhere to the various legislative requirements. Urbanisation and in migration of people to the city is adding pressure on the provision waste management services provided by the City. The current average lifespan of the City’s landfill sites compels the City to look into alternative ways of managing waste. Whilst it is recognised that waste generation will continue as long as households and businesses consume goods and products, the role of the City in managing waste responsibly cannot be overemphasised and therefore practical steps need to be put in place to ensure that waste to landfill is reduced whilst by-products of waste can be channelled towards economic opportunities.
Through this outcome, the City aims to achieve within the first decade of game changing, the following:
Sustainable water resource utilisation; Reducing the ecological footprint of the City and greening of the city ; Planning for low carbon infrastructure investment; Waste minimisation and management; Environmental protection through the development and implementation of
the new urbanism concept in parts of the city which is based on principles of environmental sustainability; and
Supporting the smart economy through infrastructure development and operations.
To do this, this outcome strategy proposes that the following programmes be implemented in the 2016/21 term of office:
Sustainable Waste Management Programme; Mobility; Energy Security; Water Saving Programme; Biodiversity and Greening; and
72

53
Infrastructure funding.
Whilst these programmes are amplified, the roll-out of basic services to households to reduce backlog is inherent and will thus be planned for in each of the programmes.
The following sections of this Outcome Strategy will look into detail the contextual factors for the outcome that need to be addressed. Reference on this will be from the Tshwane Vision 2055 Discussion Document and the approved Tshwane Vision 2055 long term strategy document. Further a reflection on what the City has done in line with the outcome and has summarised to reflect the interventions of the City in relation to other key strategic framers such as the National Development Plan, provincial initiatives, among others. This final section will then present proposed programmes that bridge the gap between what’s been done and what need to be done and provide a conceptual consolidation of existing programmes as it relates to the outcome. This will identify the dependencies and cross cutting issues that need to be considered toward achieving the intentions of the outcome.
Outcome 1: Context
The City has a Constitutional responsibility to ensure the protection of the environment whilst providing basic services to all the residents. Section 24 of the Constitution states that:
Everyone has the right-
(a) to an environment that is not harmful to their health or well-being; and (b) to have the environment protected, for the benefit of present and future
generations, through reasonable legislative and other measures that- (i) prevent pollution and ecological degradation; (ii) promote conservation; and (iii) Secure ecologically sustainable development and use of natural resources
while promoting justifiable economic and social development.
Further, Section 152 of the Constitution the objects of local government are:
“(a) to provide democratic and accountable government for local communities;
(b) to ensure the provision of services to communities in a sustainable manner;
(c) to promote social and economic development; (d) to promote a safe and healthy environment; and
73

54
(e) to encourage the involvement of communities and community organisations in the matters of local government.”
This section of the Outcome strategy discusses in themes the challenges that are faced by the city in relation to resilience and infrastructure provision. It later highlights what the City has done in support of the outcome. The response to the highlighted challenges is provided in detail later in the document when the proposed programmes are discussed.
Giving life through water management Water is necessary for life. It is the key resource for human health, prosperity and security. 71% of the City of Tshwane’s (CoT) potable water supply is from the Vaal River System and 29% is supplied from own sources. The next Vaal River Augmentation project, the Polihali Dam will only be able to contribute to the yield in 2021 and this means that the City will still rely on the Vaal Dam up until the end of the term. This is in the backdrop of the City that has already has most of its households accessing potable water.
In 2012, the then Department of Water Affairs issued a directive to reduce loses and urban demand by at least 15% by 2014 due to severely stressed Vaal River system source. The recent droughts that have been experienced by the country means that there needs to be an escalated approach to management of the water resources in the City. In 2015, the City of Tshwane and other municipalities instituted water restrictions in light of water scarcity. The Minister of Water and Sanitation outlined that there are short, medium and long term measures towards addressing and mitigating potential impacts of droughts. These include:
Implementation of drought operating, rules at all dams; Increase in water mix, especially ground water utilisation which could include
rain water harvesting, reuse of water, and packaged desolation plans; Proper infrastructure operation and maintenance with associated skills
development; Water conservation and demand management which needs to include
attending to water leaks; and Climate research and geo-hydrological monitoring.
Although the City of Tshwane has approved a program of augmenting of water supply from own sources, the City’s performance on water management is bleak as unaccounted for water has increased over the 2011/16 term of office. This is due among others to water theft and water losses as a result of aging infrastructure. Whilst these have an environmental impact, the financial impact can also not be ignored and therefore requires an integrated approach to water loss management.
Sanitation is also an important element in the management of the water resources of the City. The City of Tshwane has over the years achieved a green drop status for its sanitation services. Even with these accolades, there are challenges that are yet to be met. The first one is for sanitation infrastructure to meet growth in the City. With the increase in formalisation of informal settlements, it means that the new settlements will need to be connected to sewage systems that are reliable and will not negatively impact on the green drop status of the City. Second, investment in
74

55
maintenance and operations of the waste water treatment plans and it associated facilities is of similar importance. Adequate investment will ensure a clean environment and also assist in the management of the water resources of the City.
Towards Cradle-to-Cradle waste management. Although it has been reported in various publications that the City is the worst performing in terms of sustainable waste management, numbers to justify this cannot be verified as in the past the City had not the needed instruments and infrastructure to measure waste generated in the City. Much is currently being done to reverse this and it has included the fencing of landfill sites and installation of weighbridges to measure waste received at the landfill sites. With this project being completed, the City will now be in a position to measure waste generation trends accurately which will inform policy decision.
The City currently renders the waste management function through the Regional Services Offices whose task is to collect waste from the clients of the city and facilitate through third party waste collection. In the 2015/16 IDP it was reported that waste is collected weekly in all formal households with informal settlements also receiving a rudimentary form of waste collection.
Most of the waste generated ends up in the City-owned landfill sites. In 2015/16, the Department of Environmental Management Services alerted the Mayoral Committee on the possible closure of Onderstepoort land fill site by beginning of 2016/17 FY; the second largest city-owned site after Hannekom. In its report, the department alerted that the closure will result in the change on how waste is managed in the entire city. This means that the City needs to consider:
Relying on privately owned land fill sites which has its limits and cost implications;
Accelerating the waste minimisation initiatives to reduce waste to landfill sites; and
Be proactive in engaging with neighbouring municipalities in the development of the regional landfill site as this is the preferred route by the national Department of Environmental Affairs.
The points highlighted above demonstrate that as much as the City continues to collect waste from all its clients and informal settlements, there is a need to look at waste generation through is entire value chain, taking into consideration how waste generation trends change when households disposable incomes increase, how formalisation of settlement affect operations in terms of collection frequencies, how investment decisions affect sustainable waste management in terms of landfill sites, how possible reliance on private landfill sites can affect the budget and the budgeting decisions of the City. Of most importance is the fact that the state of waste infrastructure in the City compels the City to look at cradle-to-cradle approach. This means that the realisation of the finite resources of the City should move the City and its stakeholders to either generate less waste and with the less generated, less needs to reach landfill sites. This obviously requires a change in mind-set, policy and our planning and budgeting instruments.
75
56
Meeting energy needs of the Capital: more than 80% of households in the City have access to electricity. This has been achieve through partnership between the City and ESKOM. Much as most people have access to electricity, the energy mix of the City is not diverse. Heavy reliance on coal generated energy is detrimental to the environment and South Africa is signatory to a number of treaties that emphasise the need to look at alternative sources of energy. In support of this, the City has already implemented a number of projects including the development of a solar power plant in Rooiwal, piloting of a hydropower plant and roll out of solar water geysers in various townships of the City. Supplementary to this, is demand reduction initiatives are also explored by the City and this has included retrofitting of the buildings of the City as well as in public lighting infrastructure. Further, the City has well conceptualised its green economy approach with the East Capital identified as the core location for green investment which is hoped to alter the energy consumption and economic composition of the City.
Even with these initiatives, there is still a need to attend to the roll out of electricity infrastructure in strategic parts of the City including residential areas, economic and industrial hubs. This requires the City to keep the average age of its infrastructure at acceptable levels whilst it balances this with the roll-out of new infrastructure to meet the demand. Emphasis in the 2011/16 term of office has been on refurbishment of power plant and stations to reduce the average time of blackouts and to support growth. The investment in the Rooiwal power station is expected to yield results towards the middle of the 2016/21 term of office.
Supplementary to the above is the need to ensure that energy accounting is achieved. This can be done through electricity meter roll-out so as to monitor trends in electricity losses. The City is still committed to this initiative since it not only meet the sustainability initiatives but also supports sound financial management. Linked to this needs to be a drive to encourage the consumers to pay for electricity services whilst not compromising on the support of indigent households who access a fixed amount of electricity as a subsidy. In 2015/5 the mid-year performance results showed that the City was well in its way towards achieving the reduction in non-revenue electricity. This was achieved through meter roll-out, infrastructure investment and consumer awareness run by the City. These initiatives need to be continued.
Mobility to support socio-economic development: mobility supports both the social and the economic fibre of the cities. Movement of people and goods contributes towards the development of spaces and people and the investment attached to this is warranted. For efficient mass public transport to be achieved, higher densities supported by various transport modes need to be explored. The City of Tshwane has a policy position that supports density of human settlements which not only supports access to facilities but also reduces travel time between work, home and recreational facilities. Historic and current development practices have however worked against these objectives. The continuous sprawling of townships outside of the urban edge mean that efficient public transportation may not be achieved soon and it achieved will come at a social and financial cost. However, the rollout of Tshwane Rapid Transport system in the City is but one of the initiatives that seek to improve public transportation. The launch of Phase 1A of TRT
76

57
in 2014 demonstrated the City’s commitment in this regard. This has been supported by town planning standards regulating future development uses and densities along the TRT lines in a bid to increase densities and use of this mode of transport. Progress on Phase 2B is well underway and the City is working towards opening of this line soon and this will mean more people access reliable, safe and cost-effective service. Much to be heralded on this mode of transport is the fact that the City runs its fleet on carbon neutral gas which minimises the impact on the environment.
TRT is however not a silver-bullet to resolve public transport needs of the City. Most of the city’s population is still ferried by mini-taxis and some in certain residential areas are serviced by the Tshwane Bus Service and other independent bus companies. The variances in the frequency of service, pricing and reliability impacts on the user. It is therefore important that the City facilitates improvements in the road public services where it can. The City of Tshwane expanded its network for Tshwane Bus Service to Olivenhoutbosch, a settlement on the south-western parts of the City. Such expansions led by public demand are expected to continue however need to be informed by realistic conceptualisation of the bus services of the City supported by ideal operational and funding model for TBS to ensure that the service standards rendered are not compromised.
All of the road transport requires investment in road transport infrastructure. At the beginning of the 2011/16 term of office, about 2600 km of roads needed to be tarred and this was calculated as the backlog of the term. In addition to this, 1312 km of storm water needed to be developed. The City has done well towards reducing this backlog. Since 2011, 229 km of road have been constructed with more than 210 km of storm water infrastructure installed. This investment is a positive step towards settlement development however it has not met the rate at which new developments have taken place. The acceleration of settlement development through Re Aga Tshwane means that the City may have an even larger backlog in terms of roads and storm water as compared to the 2011 numbers. Prioritisation, alternative models of development and funding are therefore required to meet the need.
Integration of transportation modes and investment on infrastructure to support the development of freight and logistics is also as important. Continuous engagements and collaborations with PRASA and the national Department of Transport needs to be strengthened to ensure that the implementation of SIP7 objectives are realised. This is important since the City’s location is recognised as a significant transit route for movement of goods into and out of Gauteng Province. Similarly, urban development initiatives around the rail nodes as currently funded through the Neighbourhood Development Partnership Grant needs to be consolidated and clear targets and implementation measures need to be developed.
Protecting the green assets and building environmental resilience: the management of environmental assets of the city is important not only for liveability but also for environmental resilience. The approach to the management of these assets should allow for socio-economic transformation. This means that the City needs to invest its infrastructure and develop policies that promote natural defence against floods, droughts and maintain water quality, among others.
77

58
Key to achieving this is to ensure that the natural assets of the city are protected and where needed are protected through laws and responsible practice. Many of the urban management strategies of the City are in line with this objective. For an example, the protection of the urban edge through controlling urban sprawl is, but one of the many ways that this can be done. It is therefore important that development planning continues to support this and that where possible, additional green assets are created and protected. One of the ways of doing this is through clear policy development and monitoring of its implementation. The City, currently has a Biodiversity Strategy which seeks to guide the development and management of the green assets. In the 2016/21 term of office, it is important that development indices are developed and monitored to ensure that improvements in managing of the environment are achieved. This will also need to be supported by the quantification of the green spaces so that they can be managed.
TSHWANE VISION 2055: 1ST DECADE OF GAME CHANGING FOR OUTCOME 1
The importance of environmental resilience and sustainable infrastructure investment is key to the development of the City. The Tshwane Vision 2055 recognises that the environmental resources of the City are finite and therefore its goal is to manage its resources effectively to reduce impact on the environment. Through this Outcome, the City aims to achieve the following within the first decade of game changing:
Develop policies and regulatory environment to guide sustainable use of natural resources towards energy efficiency, sustainable water and waste management;
Development and implementation of a climate change strategy informed by the climate risk areas in the City;
Rollout energy and water accounting through metering; Develop and support the production of alternative energy sources; Adopt a cradle-to-cradle approach to waste management; Explore alternative energy generation as a contribution to the 400MWCCGT; Continue to invest and facilitate integrated transport solutions in the city that
are environmental friendly; and Strategically manage the environmental resources of the city.
The above commitments as contained in the Vision 2055, need to be translated into practical operational plans that can be measured, monitored and evaluated. To do this the medium term plans of the City as contained in the IDP and the annual plans in the SDBIP and departmental business plans will have to meet the transformative demands of the Tshwane Vision 2055.
Already, some of the work has been done by the City in line with this Outcome. The table below summarises the achievements of the City in line with Outcome 1 of the Tshwane Vision 2055.
78

59
Table 1.1: Summary of the City’s interventions for the Outcome
Tshwane 2055 Strategic Actions Assessment of the City’s Interventions: 2011/16
Waste management Multiple Waste Treatment and Recovery Facilities with transfer station
capacity being rolled out in different regions
City has expanded its waste collection threshold. All formal households
receive a weekly kerbside waste removal service.
Expansion of the waste management service has reached informal areas
and these receive a rudimentary service.
Buy-back centres have been established and there has been an increase
in the amount of waste that comes to these site. This has yielded
economic spinoffs for small scale recyclers and plans to expand this are in
place.
Investment in the upgrade of the landfill sites took off in 2015/16 financial
year with fencing and installation of weighbridges realized;
All of the city buildings have been installed with waste separation
infrastructure and this is being expanded to other public facilities owned by
the City
Energy provision and demand side management
The City is in a process of refurbishing the Rooiwal and Pretoria West
power stations towards improving its efficiencies and to expand its capacity
for energy generation
A solar power plant is being developed in Rooiwal
Roll-out of solar water geysers has reached a number of townships in the
city and this is planned for expansion in collaboration with ESKOM.
The City has completed the feasibility of a waste to energy and a waste
water to energy projects. These are expected to be developed in the
2016/21 term of office
The concept for the development of the green city in the East Capital has
been approved by the City and work towards funding and spatial planning
in this strategic node is underway
Open Space Planning Management of the city’s natural conservation areas has been ongoing
The development of the City of Tshwane Biodiversity Strategy during the
2011/16 term of office has cemented the City’s position in protection of
environmental areas.
Development approvals of the City have to a large extent been aligned to
the open space plans of the City and management of urban sprawl has
been utilized to support this
Carbon Neutral Infrastructure and Retrofitting
The City has procured carbon neutral busses powered by Concentrated
Natural Gas (CNG)during the 2011/16 term of office and plans are in place
to further expand this initiative
The introduction of electric vehicles into the city fleet commenced with a
procurement of 10 Nissan Leaf vehicles, processes are underway to install
solar powered charging infrastructure throughout the city to encourage
offtake by consumers and other institutions.
A programme to retrofit public lighting with energy efficient devises has
been put in place. Supplementary to this, some of the lighting in public
79

60
Tshwane 2055 Strategic Actions Assessment of the City’s Interventions: 2011/16
buildings have been retrofitted
Transit Oriented Development The Tshwane Rapid Transit system infrastructure between the CBD and
Hatfield has been operationalised. Phase 1B is well underway in line with
the project milestones
Density targets along the TRT routes have been set and monitoring
measures put in place in line with urban planning practices
Non-motorised transport infrastructure has been rolled out in the inner city
and various townships of the City through the NDPG and the City’s own
funding
Infrastructure Modelling and Investment
The launch of the Capital Investment Planning System in the City in 2014
has led to strategic and integrated investment
Built Environment Performance Planning takes place annually and has
sought to align investment to the desired spatial form of the City
PROPOSED PROGRAMMES FOR THE OUTCOME
This section presents the proposed programmes to respond to the outcome challenges and the Tshwane Vision 2055 aspirations as presented above. Each programme presented outlines the following:
Overall objective of the programme; Alignment of the programme to the Outcomes of the Vision; and Interdepartmental issues that need to be considered by the City in
implementing the programme.
80

61
For Outcome 1 the following programmes are proposed:
Programme 1: Sustainable waste management:
PROGRAMME 1: WASTE MANAGEMENT
The City have the responsibility to manage the waste generated in the city effectively. Pressing economic and social challenges have traditionally resulted in a
,
PROPOSED PROGRAMME AREAS FOR 2016/21 IDP
Sustainable Waste Management
Mobility Energy Security Water security
Biodiversity and Greening Infrastructure funding
Resilience for climate change
Political focus areas, new catalytic projects
.
Biodiversity and greening
This programme focuses on
improving biodiversity through the management
and safeguarding of important ecosystems and development of green open
spaces
Sustainable Waste Management
This programme focus on the sustainable
management of waste through its total value chain
Mobility
This programme focus on the
provision of the total spectrum of
transport facilities to provide universal access to public
transport
Energy Security This programme focuses
on investment in strategic energy infrastructure to
support households and economic development as well as improving the
energy mix
Water security This programme focus on
sustainable water management through
water provision, demand reduction and waste
water reuse
Infrastructure funding This programme seeks to
foster a culture of services payment and seek
alternative funding sources for infrastructure expansion
and reliable service provision
Strategic Objective 1: Providing sustainable service infrastructure and human settlements
81

62
trade-off with environmental protection. The City of Tshwane has prioritised environmental protection and conservation and explored various ways of creating new jobs and stimulating new industry to ensure a triple dividend on social, economic and environmental factors.
Furthermore, rising urban population within the City has led to increased demands on finite supplies of natural resources, particularly water and land. Thus, the combined population and economic growth has placed pressure on the City’s waste management infrastructure. Without inadequate recycling infrastructure this pressure is compounded due to the increased complexity of the waste stream.
The National Environmental Management Act, Act 107 of 1998 (NEMA) indicate that sustainable development requires the consideration of, amongst other factors:
“that waste is avoided, or where it cannot altogether be avoided, minimised and re-used or recycled where possible and otherwise disposed of in a responsible manner.” (Section 2(4) (a) (iv)).
In order to deal with these challenges and to improve the resilience and resource efficiency of the City, it has identified the following key focus areas in relation to the waste management programme. It focuses on ensuring sustainable cradle- to-cradle management of solid waste through investment in waste management infrastructure and assets, waste minimisation and re-use through producer awareness. This should lead to the reduction of waste to landfill sites and increase in the lifespan of landfill sites.
This will inter alia deal with the following programme initiatives through the implementation of the draft City of Tshwane Integrated Waste Management Plan:
The collection of data on waste characterisation to initiate and implement separation of waste at source into various categories. This will enable the city to recycle-, re-use as well as utilise for energy generation. This will contribute to the land area needed for airspace to dispose of and management of waste as well as contribute to creating a “smart
environment”; Producer awareness on separation, re-use and recycling of waste; Investment in infrastructure and equipment to support recycling of waste; Investment in infrastructure to generate energy from waste inclusive of
methane gas harvesting and usage; Retrofitting of municipal fleet to run on green energy (methane gas
utilisation); and Development of buy-back centres to support job creation and economic
development initiatives.
The following are some of the measures of success for the sustainable waste management programme:
82

63
MEASURES OF SUCCESS FOR THE PROGRAMME
1. Implementation of an integrated waste management plan
2. % reduction in waste tonnage to landfill sites
3. Increase in average lifespan of landfill sites
4. % of households separating waste at source
5. Nr of new buy-back centres developed
6. Nr of buy-back centres operational
7. % increase in revenue from buy-back centres
8. Nr of jobs created through buy-back centres
9. % increase in households receiving weekly kerbside waste removal services
10. Tonnage of Methane gas harvested from landfill sites
11. Nr of MW electricity harnessed from landfill sites through energy generation from waste
For the success of the programme to be achieved, the City needs to take into consideration the following actions emanating from the 5 other Outcomes of Tshwane Vision 2055:
Expand the rollout of waste management infrastructure to support the increase in number of formal households in the City in consideration of the road infrastructure development in the city;
Upscale the separation of waste at source in households and places of business. This needs to be supported by incentive strategies to ensure maximum participation which may have financial implications; and
Strategically consider the location and the funding of landfill sites in line with the spatial imperatives of the city and its financial envelope.
PROGRAMME 2: MOBILITY
Transport plays a critical role in meeting the City’s Strategic intent. An efficient transport system is one of the key enablers for enhancing productivity and delivering more sustainable economic growth. Enhancing the City’s transport infrastructure and service provision can help open up new markets, increase access to employment and help build a critical mass of business that can drive up competitiveness and deliver growth. The objective of this programme seeks therefore to improve mobility and connectivity through provision of integrated intermodal transport system which is safe and affordable to all.
This programme is necessitated by the fact that there is rapid growth in the urban population as well as the number of private vehicles which overwhelm the City, thus resulting in increased congestion, less mobility and poor air quality. The projected population growth for the City indicates that the current mobility challenges if not addressed prove to be disastrous for the City’s long term development. Therefore, reduction in the use of private vehicles and the increased use of public transport, supported by environments that encourage eco-mobility will give a multiplier effect to a reduced carbon footprint in the City.
83
64
Another key problem with the current transportation solutions are that they depend on oil-based fuels and this results in high levels of carbon emission. Environmentally – friendly methods of transportation that could replace traditional fossil-fuel cars and carbon emitting public and private transport vehicles are some of the ways to combat climate change. The City must therefore work towards changing the face of the modern transportation for the good of the environment by investing and implementing integrated yet sustainable and socially inclusive ways of local mobility, combining the use of non-motorised transport means such as; walking, cycling, traffic calming and wheeling with the use of public transport and light electric vehicles and solutions such as mono rail from renewable energy resources.
The City has through the Comprehensive Integrated Transport Plan which spells out the transport vision and mission. Specific set of goals and objectives have also been set for developing a monitoring system that will be used to evaluate progress in meeting the Tshwane vision 2055.
In line with the Tshwane Vision 2055 and the CITP goals this programme seeks to achieve the following:
Plan and develop a transport system that improves accessibility and mobility whilst enhancing social inclusion;
Provide a fully integrated public transport system; Develop a transport system that drives economic development; Improve the safety and security of the transport system; Develop a transport system that reflects the image of the city; Develop an efficient, effective, development orientated public transport
system that integrates land use and public transport plans; and Develop a transport system that is environmentally sustainable.
The following are some of the measures of success for the mobility programme:
MEASURES OF SUCCESS FOR THE PROGRAMME
1. TRT phases completed and operational
2. Km of strategic road network developed in identified nodes and zones
3. Km of roads provided to the required standard
4. Km of storm water drainage network provided
5. % Utilisation of TRT system
6. Review and implementation of ITP
7. Km of non-motorised transport developed
8. % of municipal fleet running on green energy
To achieve the above, the City needs to ensure the following during the 2016/21 term of office:
Working with other spheres of government, while also taking opportunities for public and private collaboration into account – because transport matters. The City is not an island, but is part of the GCR, with daily transport flows
84

65
that extend beyond municipal boundaries. The City must therefore align its transport planning with Gauteng provincial plans and those of surrounding municipalities;
Develop clear targets to reduce infrastructure backlogs; In collaboration with the national and SOE stakeholders, develop
implementation plans and monitoring frameworks towards freight and logistics management; and
Monitor the alignment of transport initiatives to the broader spatial transformation agenda of the City.
PORGRAMME 3: ENERGY SECURITY
Energy security focuses on investment in strategic energy infrastructure to support households and economic development as well as improving the energy mix. The South African primary energy supply at 67% is from coal, 19% from oil, 10% from solid biomass and waste, whilst nuclear and natural gas contribute 2% each, with hydro contributing less than 1%. The context of global energy futures is characterized by industrializing countries with increasing demand for energy to support infrastructure, transport and consumer demands. This is further exacerbated by the projected 40% increase in world population by 2050; as such the easily available oil and gas will not meet the growing energy demands going into the future.
Considering the above, during 2013 a report by the Energy Research Centre reflecting on several options towards a new power plan, presented significant growth in wind, and biomass as well as central solar PV and solar thermal generation going into year 2040. Therefore, an investigation and investment in alternative energy sources / greener energy sources by the City is highly essential. This will not only grow its share of renewal energy but also in the industrial activities supporting the green energy space.
The City has for the past five years focused on investment in bulk infrastructure and network upgrading by refurbishing the existing power stations, installation of smart meters to households to amongst others deal with unaccounted for revenue and ultimately maximize generating capacity of the City. To this end, through the above mechanisms and through on-going interventions, it is estimated that over and above the estimated 88.6% households which had access to electricity in 2011, the city has made an additional 58 957 connections to households in formal areas and in areas where backlog were identified. Furthermore, the City committed to reduce non-revenue electricity by 10% annually. This reduction has not being realized due to illegal electricity connections, thus threatening the City’s security of revenue.
The City is, through its long term development plan - Vision 2055, envisioned that the usage of energy by City and its residents will be coming from alternative renewable energy sources – such as methane gas extraction from landfills, energy from waste solutions, and a number of renewable energy sources (e.g. solar). It is also looks at optimal energy management solutions, including those that incorporate alternative energy, to be used when undertaking activities such as ‘retrofitting buildings’.
85

66
In order to deal with the above developments and to improve the resilience and resource efficiency of the City, it has been stated amongst the Strategic Actions of the first Decade of Change – by 2020, that focus should be on:
Continue with expansion of access to electricity to households; Refurbishment of the existing power stations; Increase energy savings through retrofitting; Develop and support the generation of alternative sources of energy; Upscale the rollout of solar water geysers throughout the City; and Maintain and upgrade electricity infrastructure.
The following are some of the measures of success for this programme:
MEASURES OF SUCCESS FOR THE PROGRAMME
1. Alternative energy solutions identified
2. Nr of alternative energy solutions implemented
3. % increase in MW electricity harnessed from landfill sites through landfill gas extraction
4. % completion of Rooiwal and Pretoria West power stations refurbishment to generate additional X Megawatt of electricity
5. Nr of MW electricity generated through Solar technology
6. Nr of waste to energy projects implemented
7. % Government building metered via smart meters
8. % of businesses with demand side smart metering
9. % of formal households connected to electricity via smart metering
10. Nr of informal settlements connected to electricity via smart metering
11. % reduction of non-revenue electricity
12. % municipal buildings retrofitted with integrated green technologies
13. Nr of solar geysers rolled out throughout the city
To achieve the above, the City needs to consider:
Development of a multi-year financial model to fund energy infrastructure investment;
Recommend infrastructure development in line with the CAPS prioritisation modelling to support spatial objectives of the City;
Develop and enforce spatial planning by-laws to encourage low carbon energy in all new developments;
Monitor systematically the progress of mega energy infrastructure programmes such as Rooiwal and Pretoria West Power Stations; and
Financially quantify the benefits of meter roll out and reflect this the City’s
financial statements.
PROGRAMME 4: WATER MANAGEMENT
Water is a finite resource that is essential for the sustenance of life and all its supporting structures. Therefore its availability in qualities which are fit-for-purpose
86

67
and adequate quantity, are fundamental to sustainable development using the three pillars of integrated water resources management - ecological requirements, economic efficiency and social equity. The pursuit of ‘sustainability’ has emerged in recent years as a broader framework for integrating the holistic management of specifically three urban water streams, namely, potable water, wastewater and storm water within the practice of urban design. Water management is linked to other elements of city development that include housing, health, waste, transport, land-use planning, parks and recreation, economic development, energy, and urban agriculture.
Services and the use of the water resource must be sustainable to ensure that we continue to make progress in providing access to water as well as the conservation thereof which will ensure that future generations continue to benefit from this progress. Whilst the emphasis has been on delivery, a greater emphasis must now be placed on sustainability of the resource. This should happen through conservation and demand management as well as the re-use thereof.
Within the City of Tshwane, the justifiable prioritisation of economic and social development needs has resulted in the unsustainable use of natural resources as well as environmental challenges such as pollution of water sources through inter alia general waste pollution, sewerage spillages and irresponsible use of chemicals etc. The wastage of water by consumers, loss of water through poorly maintained water infrastructure further contribute to the sustainability of the service.
This programme seeks to sustainable water management through water provision, demand reduction and waste water reuse.
In order to deal with the challenges raised above and to improve the resilience and resource efficiency of the City, it has identified the following key focus areas in relation to the water management programme. It focuses on ensuring sustainable management of water as a critical resource for human and socio economic-development. This should deal with the dealing with potable water, waste water and storm water.
The objective of the programme is to:
Achieve 15% reduction in conveyance losses through infrastructure refurbishment and maintenance;
Improved water accounting through metering and consumer education; Increase water access and reduction of sanitation backlogs; strengthen water demand management practices (education, harvesting, re-
use); Water and wastewater technologies investment programmes and incentives; Investigate, develop and implement alternative for sanitation methods,
especially those available for waterless or similar systems; and Maintain and improved the green and blue water status of the City’s water
and waste water.
87

68
The following are some of the measures of success for this programme:
MEASURES OF SUCCESS FOR THE PROGRAMME
1. Water and waste water management plan/strategy developed (Water harvesting, grey water re-use, waste water recycling)
2. Development and roll out of virtual water policy
3. % reduction in water demand
4. % reduction of non-revenue water
5. Refurbishment of waste water treatment works
6. % increase in bulk infrastructure (water and sanitation) network and supply to support new developments in identified nodes and zones
7. % households in formal areas provided with smart meters
8. Nr of informal settlements with bulk water meters
9. Achieve blue drop status for drinking water and green drop status for waste water
10. % of households with access to potable water
The following consideration points need to be highlighted:
That a multi-year infrastructure investment plan needs to be developed informed by the masterplan intelligence;
Infrastructure investment and reticulation needs to respond to projected settlement and household development in the city to support sustainable human settlements;
Rollout of water meters needs to be informed by an understanding of areas of high water losses to achieve maximum output; and
Quantify upfront the impact of water demand reduction on the City’s finances
and develop alternative funding streams to supplement the shortfall for future investment.
PROGRAMME 5: BIODIVERSITY AND GREENING
Biodiversity is the variation in living organisms, viewed within a given habitat, ecosystem or in the world as a whole. The concept is usually applied to the species diversity, although the notion of genetic biodiversity is applied to the variation in genes within an individual species. While most people think of rainforests as loci of great biodiversity, biomes such as oceans and grasslands are the likely repositories for even greater variation. Retention of diverse biota is important, since intact ecosystems are thought to be essential for provision of ecosystem services to humans, including maintenance of a diverse food bank, pollination, clean water,
88

69
flood control, pest control, waste decomposition, biomass energy resources and climate stability.4
It is therefore essential that biodiversity and the greening of the city be attended to in order to achieve the following:
Safeguarding of important ecosystem services that sustains human lives; Maintaining the ecological integrity of the City’s natural resources is critical if
the City and its inhabitants are to succeed in sustaining human and economic development;
Management of the increasing land use pressure on biodiversity; Safeguarding eco-tourism and key ecological infrastructure of CoT; and Mitigate against climate change impacts.
This programme seeks to ensure that the City’s ecological assets are preserved and that the CO² footprint of the City is reduced. This will inter alia deal with the following programme initiatives:
Climate change strategy and implementation plan developed informed by climate risk areas in the City is mainstreamed throughout the City and Municipal entities, inclusive of initiatives to reduce CO² emissions;
Develop policy and regulatory frameworks that will guide sustainable land use that balances the needs of promoting equitable economic development and conservation of the City’s biodiversity assets;
Development of green spaces planning; Strengthen biodiversity management through the development of Bioregional
plans; and Finalisation of the ecological footprint assessment and formulation of
initiatives to reduce the footprint.
The following are some of the measures of success for this programme:
MEASURES OF SUCCESS FOR THE PROGRAMME
1. Bioregional plan developed and approved;
2. Development of township and informal settlement greening plan/strategy;
3. Nr of open spaces and parks developed in line with abovementioned plan/strategy;
4. Nr of hectares of ecological sensitive areas protected through proclamation i.t.o. NEMA;
5. Finalise ecological footprint assessment; and
6. % reduction in CO² emissions
PROGRAMME 6: INFRASTRUCTURE FUNDING
This programme seeks to foster a culture of services payment and seek alternative funding sources for infrastructure expansion and reliable service provision.
4 http://www.eoearth.org/topics/view/51cbfc78f702fc2ba8129e70/
89

70
The City acknowledges the strategic role that effective and efficient infrastructure development and maintenance plays in enabling economic growth and development and social development; it is through the City’s Vision 2055 that notes that infrastructure is the most common entry point to achieve prosperity in the City as it provides the foundation for growth. Therefore, prioritizing infrastructure is part of long – term economic development for any City.
The City further recognizes the need through Vision 2055 to expanding and maintaining public infrastructure to keep abreast of the growing demand for sustainable infrastructure, in a way that promotes the development and redresses existing economic disparities. There is also an appreciation that the City cannot do this alone, and will have to take advantage of opportunities that exist in collaborative efforts with other spheres of government as well as other neighbouring metros within the Gauteng City Regions.
The growth of the urban population has created and will continue to create challenges for the City in terms of air and water pollution, transportation gridlock, shortage of affordable housing, inadequate waste collection, deteriorating infrastructure, and income polarization. In his 2013 State of the Nation Address, President J Zuma said:
“we should also be mindful of rapid urbanization that is taking place. The Census Statistics reveal that 63% of the population are living in urban areas. This is likely to increase to over 70% by 2030.”
The City therefore needs to provide and maintain a modern and progressive municipal infrastructure that will meet the needs of the City. That is about developing a future capital city that is resilient and efficient, reduces its carbon footprint, and social exclusivity. This is to be achieved through amongst others, the creation, expansion and maintenance of public infrastructure.
At the start of this term of office 2011/16, the City has identified various avenues for alternative funding and set targets for various indicators that support infrastructure expansion and reliable service provision; all these with an endeavour to foster a culture of services payment by consumers across the City. This is one aspect that needs to be maintained and sustained in our future plans in order to achieve the notion of a resilient and resource efficient city.
The following are some of the measures of success for this programme:
MEASURES OF SUCCESS FOR THE PROGRAMME
1. % of infrastructure development funded from alternative revenue streams
2. Increase in the average age of infrastructure (water, electricity, sanitation, stormwater, roads and landfill sites)
3. Number of townships with complete infrastructure as per standards (water, sanitation, electricity and roads)
Some of the proposed interventions that the City must pursue from 2016\17 onwards in relation to alternative funding sources for infrastructure expansion and reliable service provision include but not limited to:
Infrastructure asset management;
90

71
Establishment of an Infrastructure development fund; and Programmatic investment on infrastructure and upgrading.
Key interventions for 2016/17
Programme 1: Sustainable waste management Key intervention Activities for 2016/17 2016/17 Budget
Establishment of waste transfer stations and buyback centres
Site identification, authorisations and procurement of partnerships to develop waste transfer stations and buyback centres
R500k + off balance sheet
Material Recovery Facilities Procurement of partnerships authorizations Off balance sheet
Efficient waste transportation infrastructure and services
Review of collection routes Opex R500 000
Finalisation of plans for bulk transportation plan Opex R500 000
Programme 2: Mobility
Key intervention Activities for 2016/17 2016/17 Budget
Mobility A Re Yeng – continuation of the implementation of the TRT implementation plan and increase in rider numbers
Capex
Additional TRT busway lanes constructed Capex
Quality Infrastructure (roads and storm water)
Additional kilometer of required municipal storm water drainage network provided
Capex
Additional kilometers of roads provided to the required standard
Capex
Programme 3: Energy Security
Key intervention Activities for 2016/17 2016/17 Budget
Renewable energy Initiative Appointment of bidder to generate electricity through renewable sources
Capex
Energy efficiency 40 % of public lighting to be retrofitted with LED lights
Off balance sheet Capex
Energy Audit Reduction of NRE to be 12 % or less though auditing and removal of illegal connection
Opex
Programme 4: Water security
Key intervention Activities for 2016/17 2016/17 Budget
Water Treatment Plant Upgrade 75% completion of Temba water plant Capex
Bulk water reservoir Construction 20% construction of 3 new water reservoirs Capex
Upgrading of bulk water infrastructure 1500m of bulk water upgrades Capex and opex
Reduction in non-revenue water (NRW) Reduce NRW to 24.5% NRW Opex
91

72
Programme 5: Biodiversity and greening
Key intervention Activities for 2016/17 2016/17 Budget
Protection and proclamation of biodiversity areas
Identified biodiversity areas protected/ proclaimed
Internal capacity
Attraction of private sector participation into resorts management
Section 78 (3) approval obtained from council Opex R1m
Programme 6: Infrastructure and funding
Key intervention Activities for 2016/17 2016/17 Budget
Infrastructure asset management Initiate integrated infrastructure analysis to determine quality and lifespan of all service infrastructure
Opex
Establishment of a fund for focussed infrastructure development
Investigate different avenues to establish a ring-fenced fund for infrastructure development
Opex
RISKS AND MITIGATION
Risk / Challenge Mitigation Strategy
Limited Funds Consolidation and rationalization according to a more coherent service footprint and targeting areas where greatest impact will be felt Exploration of alternative funding and employment of public and private sector crowding depending of investment type
Unfunded mandates/programmes Reassignment / prioritization of resources where possible Partnering with private sector for mutual benefits
Synergy within the three spheres of government
Continue engagement and alignment processes; Participate wherever possible in crosscutting forums and drive programmes at political level with administrative support Develop implementation agreements between administrative and political principals on all programmes of the City
Theft/Fraud/vandalism of public property
Where needed provide security upgrade and this needs to be supplemented with community participation (councillors taking more responsibility) and taking demonstrative legal action against vandals. Enforcement of disciplinary code such that supervisors are ensuring frontline assets are managed responsibly (specifically in terms of managing insurance risk)
Compliance to legislation Ensuring compliance with new requirements whilst tracking compliance costs carefully (specifically challenging with regards to staffing requirements for social facilities such as clinics, ECD centres etc.
92

73
DEPENDENCIES/ ROLES AND RESPONSIBILITIES BY OTHER STAKEHOLDERS
Stakeholder Contribution to the Outcome
Business Encourage business to invest in CNG fleet
Promote in-work waste separation
Partner with the City in the development of infrastructure to
supplement funding
Investment in alternative energy sources and retrofitting
Citizen Participate in waste minimization at home
Citizens to pay for services rendered
Reduce water and energy consumption
Employ on-site water harvesting
National and Provincial Departments Develop and invest in line with agreed spatial and strategic plans for the city
Support spatial densification of the City through development and investment in the TOD especially for housing
93

74
OUTCOME 2: A GROWING ECONOMY THAT IS INCLUSIVE, DIVERSIFIED AND COMPETITIVE
Introduction
Tshwane Vision 2055 envisages the City to become ‘liveable, resilient and inclusive, whose citizens enjoy a high quality of life, have access to social, economic and enhanced political freedoms and where citizens are partners in the development of the African Capital City of excellence’.
The City’s role as an enabler of inclusive growth requires that our focus is on creating an environment that will see the economy flourish. In the context of globalisation, it is as much cities as it is countries that drive economic growth. Ever-growing bodies of literature show the importance of cities and city-regions in the economic development of countries. In the South African studies, over the past twenty years, Tshwane features as growing very strongly, particularly compared with other metropolitan cities. Two main propositions are put forward: (i) Cities are tending to replace national territories as the key units or engines of economic growth and value creation, and (ii) the fortunes of cities are increasingly independent of national governments.
Whilst benefitting from being a centre of national governance and administration, where its economic growth has been cushioned from recessionary effects, Tshwane’s industrial base has also performed quite well. Tshwane’s economy more than doubled in size over less than 20 years. The City of Tshwane has been the fastest growing municipality in South Africa, on average, between 1997 and 2014 and Tshwane contributes an estimated 28% of the GDP to the Gauteng province and almost 10% to the national economy. Importantly, the City of Tshwane has a well-established manufacturing sector with the automotive industry being a key player in this sector. Significant opportunity exists for high income and employment multipliers such as Knowledge-intensive service industries.
The employment situation of Tshwane has improved significantly over the period 1996-2014. Today, Tshwane has one of the lowest unemployment rates in South Africa. One of the implications of this good relative growth is that it provides stability in revenue. Although Tshwane has an estimated 7% of the country’s population, it contains 9% of the country’s residential real estate value; indicative of the levels of inequality confronting the Capital further reinforced by a high Gini coefficient, currently at 0.63, and amongst the highest in the world.
One also cannot ignore the racial inequality across space which has not changed much since 1994. Of course this spatial racial inequality compounds other inequalities when one considers the travel times taken for workers to travel to places of economic opportunity.
Six (6) Outcomes have been identified in Tshwane Vision 2055, Outcome 2 thereof commits to achieve ‘a growing economy that is inclusive, diversified and competitive’. Achieving smart growth depends upon a strategic approach that identifies and nurtures the very best growth opportunities. It also depends on planning so that the City and its surroundings can cope with the demands growth will
94

75
place on it, as well as integrating environmental thinking, and ensuring that all citizens enjoy their City’s prosperity.
The quality of services and infrastructure, both social and economic, that the City of Tshwane provides influences the extent that its economy can grow and diversify. A vibrant economy contributes to the overall quality of life for the citizens in part from their ability to locally access economic opportunities be it as part of the workforce required by the economy or as entrepreneurs exploiting such opportunities.
Through this Outcome, the City aims to achieve the following within the first decade of game changing:
Promote the City’s competitiveness:
Improving the cost of doing business and creating an enabling business environment;
Advancing the provision of quality economic infrastructure; o Includes exploring and implementing alternative metropolitan infrastructure
finance mechanisms Expanding the following sectors based on the City’s approved Sustainable
Inclusive Growth Strategy (SIGS)5: o Education (including innovation and R&D) o Agribusiness o Tourism
The following sections of this Outcome Plan will provide the contextual factors for this outcome that need to be addressed in order to realise the goals of the Capital within the backdrop of Tshwane Vision 2055 and the City’s inclusive growth plan, i.e. SIGS. It will also reflect on what the City has done in line with the outcome and this will be summarised to reflect the interventions of the City in relation to other key strategic framers such as the National Development Plan, provincial initiatives, 2011 among others. The final section will present proposed programmes that bridge the gap between what’s been done and what needs to be done and provides a conceptual consolidation of existing programmes as it relates to the outcome. This will include an identification of the dependencies and cross cutting issues that need to be considered towards achieving the aims of the outcome concerned.
Outcome 2 contextual overview
Globally, cities are the driving force for economic development and social progress, and in the South African context it is at the level of local government that the actual realisation of the ideals of the Freedom Charter, the Constitution, the RDP and the NDP is driven. Indeed, the country’s Metros account for more than 60 percent of South Africa’s economic output. This implies that city-regions will have an even more relevant role as engines of economic growth and social cohesion. Tshwane, like other capital cities around the globe, is a core driver of national growth and
5 Approved by the City of Tshwane Council on 28 April 2016.
95

76
development. Tshwane’s economy will have to grow significantly if it is to fulfil the NDP targets of reducing poverty, inequality and unemployment.
The City of Tshwane Population Model which was developed in 2015 shows that by 2020 the city will have 3.5 million people on low population estimates, 4.0 million on medium estimates and 4.2 million on high estimates from 3.2 million people in 2014 (see figure 1). The Gauteng Integrated Transport Master Plan (GITMP 25) which was developed in 2013 estimates that formal workers will constitute 28 percent of this population. In order to support this development, the City’s economy must become more productive, more labour absorbing and simultaneously create and support entrepreneurship as well as to overcome structural barriers for the entry of youth into the economy.
Figure 1: Tshwane Population Estimates
Source: CoT Calculations
TSHWANE VISION 2055: 1ST DECADE OF GAME CHANGING FOR OUTCOME 2
The Tshwane Vision 2055 recognises that for the implementation of the vision, enduring partnerships and sound sustained coordination between the City and the various stakeholders must be in place. The City aims to be a ‘caring city’ though the provision of high quality of life to all citizens, display a sense of sharing, provide comfort and dignity to all citizens and offer solutions that are communally responsive. This outcome therefore integrates the work of the City to ensure that the economic base in the city increases and diversifies in order to support the socio-economic goals of the City.
In support of the game changing initiatives referred to above, the City will also ensure that it focuses on the following priorities:
Responding to the changing global economic order;
0
1 000 000
2 000 000
3 000 000
4 000 000
5 000 000
6 000 000
7 000 000
8 000 000
9 000 000
10 000 000
19
96
19
98
20
00
20
02
20
04
20
06
20
08
20
10
20
12
20
14
20
16
20
18
20
20
20
22
20
24
20
26
20
28
20
30
20
32
20
34
20
36
20
38
20
40
20
42
20
44
20
46
20
48
20
50
20
52
20
54
Peo
ple
Tshwane Population
predicted_Population Low predicted_Population Medium predicted_Population High
96

77
Promoting economic agglomeration within the Gauteng City Region; Becoming more responsive to a younger City; Mitigating the impact of unemployment and social exclusion; Responding to the changing structure of economies; Capitalising on the City’s intellectual and innovation capacity; Increasing importance of becoming a low carbon economy; and Diversifying the City’s economic base.
As envisaged within Tshwane Vision 2055, these priorities must be translated into practical operational plans that can be measured, monitored, evaluated and refined where necessary. In so doing, it will demonstrate the manner in which the long-term principles of Tshwane Vision 2055 will find expression in the annual business plans and daily operations of departments across the City. These annual plans will evolve over time to meet the dynamic demands of Tshwane Vision 2055.
The City further maintains its commitment to focus on the continuous engagement with stakeholders to foster a collective responsibility and accountability in the remaking the capital city.
The table below summarises what has been done by the City to respond to the challenges outlined above as well as Tshwane Vision 2055.
Summary of the City’s interventions for the Outcome
Tshwane 2055 Strategic Actions Assessment of the City’s Interventions: 2011/16
Economic Development Strategy The City has developed and approved an inclusive growth strategy and implementation plan towards advancing the NDP Vision 2030 and Tshwane Vision 2055 targets, which was approved by Council in April 2016.
Income earning opportunities (Job creation
During the period mentioned above, City focused on income earning initiatives such as Tshepo 10 000, Vat Ales as well as Expended Public Works Programme (EPWP). These initiatives created a combined total of 122 328 income earning opportunities.
Significant progress achieved in the impending development of a Business-Process Outsourcing Park in the Hammanskraal area
Numerous successful township revitalisation projects have been implemented; a programme which will continue in the coming years
SMME Support and cooperatives and enterprise support
About 20 360 SMMEs were supported through business support initiatives since 2011
Various training initiatives and business skills development programmes were provided to SMMEs and co-operatives
Establishment of the Tshwane Food and Energy Centre in the Far-East of the Capital
Informal trading support An informal trader’s bursary fund has been established to support the children of informal traders
The City has facilitated the creation of informal trading regional organisations, which will culminate in the establishment of a Tshwane APEX Body to advance the interests of informal traders
97

78
Tshwane 2055 Strategic Actions Assessment of the City’s Interventions: 2011/16
Investment Attraction The Development Investment Incentives Policy was approved by Council during 2015 and has since been implemented with the approval of incentives for strategic investments into the City
Rand value of investments facilitated by the City has not yielded the required results as originally planned since 2011 due to the low-growth environment characterising the country in general since 2009. The City has officially managed to secure about R8,.75 billion worth of investment. However, the Rand value of building plan applications over the current term is in excess of R80 billion.
The City has also established a Strategic Investment Committee to ensure the expedition of catalytic investments within the City as well as to institutionalise the manner in which the City responds to investment applications.
98

79
LINKAGE BETWEEN OUTCOME 2, STRATEGIC OBJECTIVES AND PROGRAMMES
In order to implement Tshwane Vision 2055, the six IDP Strategic Objectives (SO) have been linked to the relevant Outcomes of the Vision. The SO that have been identified as directly supporting Outcome 2, is SO 2: “Promote Shared Economic Growth” and which is supported by specific identified programmes:
To facilitate implementation of the Outcome and the identified SO, the following programmes have been proposed and a set of key success measures have also been identified to measure the progress on achieving the outcome.
Programme 1: Sector support and investment attraction
The City of Tshwane, is one of the country’s major economic hubs in the country that accounts for 10 percent of national GDP and 28 percent of Gauteng’s GDP. The average growth has been amongst the highest of any City in South Africa (3.6
PROGRAMME 1: SECTOR SUPPORT AND INVESTMENT
ATTRACTION
This programme focuses on promoting inclusive economic
growth for all citizens in the City of Tshwane, sustainable job
creation and to promote investment in the City of
Tshwane that will attract local and international investors
PROGRAMME 2: GREEN ECONOMY SUPPORT
The programme focuses to consolidate green economic initiatives of the City through enabling policy and research
development
PROPOSED PROGRAMME AREAS FOR 2016/21 IDP
Sector Support and Investment Attraction
Green Economy Support
Economic Transformation
PROGRAMME 3: ECONOMIC TRANSFORMATION
This programme focuses on ensuring that the City’s economy become more productive, labour absorbing and simultaneously
create and support entrepreneurship and overcome structural barriers for the entry of
youth into the economy.
Political focus areas, new catalytic projects
Strategic Objective 2: Promoting shared economic growth
99

80
percent between 1994 and 2014), however jobs have not grown as quickly. As a result, whilst unemployment is lower than the national average, unemployment in 2014 (21.5 percent) is as high as it was in 2000 representing a wholly unenviable situation particularly in comparison to the situation in other developing economies within the globe.
FIGURE 2: Contributions to GVA at 2010 Prices
Source: IHS Global Insight, 2016
It is therefore essential to create an environment conducive to much-needed levels of shared economic growth and the sustainability thereof. This programme will focus inter alia on the following:
Develop and implement an internalization strategy that will attract investment as well as facilitate access to national, international markets as well as provide support and/or incentives to potential investors;
Promote the City’s competitiveness and comparative advantages to support existing businesses and attract new businesses through the provision of quality services and economic infrastructure;
Create an enabling environment to support R&D and the commercialisation of innovation to sustain growth and productivity;
Advocate and lobby for greater localisation policies to develop local industry that can compete due to increased R&D investment spending by other spheres of government, private sector and R&D and higher education institutions;
Reduce the cost of doing business within the City; Strengthen liveability to attract the human capital that is required to develop the
City’s economy; and Continued support and collaboration with other stakeholders with respect to the
advancement of the Gauteng City Region, the Gauteng Transformation, Modernisation and Re-industrialisation (TMR) Strategy and other regional interventions led by other spheres of government.
0.8% 0.6% 1.5%
2.0%
13.9% 9.3%
1.4% 2.6%
2.8% 3.2%
13.2% 10.9%
13.3% 11.9%
23.3% 25.3%
29.8% 34.1%
0.0%
10.0%
20.0%
30.0%
40.0%
50.0%
60.0%
70.0%
80.0%
90.0%
100.0%
2004 2014
Community services
Finance
Transport
Trade
Construction
Electricity
Manufacturing
Mining
Agriculture
100

81
The following are some of the measures of success for the creation of an environment for business and industrial investment and development in support of the programme:
MEASURES OF SUCCESS FOR THE PROGRAMME
1. Kilometres of new roads constructed in Babelegi, Rosslyn and Ekandustria economic nodes
2. Completion of capital projects in economic nodes as per project plan (water and sanitation, electricity and roads)
3. Adherence of maintenance projects completed as per maintenance plan (water and sanitation, electricity and roads)
4. Number of SMMEs in SIGS priority sectors trained in entrepreneurial skills
5. Rand value of investment in SIG priority sectors attracted to the City
6. Percentage increase in bulk infrastructure network and supply to support new developments in identified nodes and zones
Outcome 2 of Tshwane Vision 2055 commits to achieve ‘a growing economy that is inclusive, diversified and competitive’. The City of Tshwane Sustainable and Inclusive Growth Strategy (SIGS) has been initiated by the City to create specific actions in order to realise the aspirations set out in Vision 2055 – in conjunction with Provincial and National initiatives. SIGS has identified sectors that have the potential to stimulate economic growth and create new employment opportunities within the City.
Figure 3: Sectors Prioritised by SIGS
Source: City of Tshwane SIGS Strategy and Implementation Plan
Three sectors have been identified, in which the City will focus its efforts over the next fifteen years ultimately towards the achievement of the NDP Vision 2030, the Gauteng TMR and Tshwane Vision 2055. These sectors are Education (including the knowledge economy), Agribusiness (agricultural production and agro-processing) and Tourism underpinned by a strong green economy. These sectors could contribute up to 490,000 jobs and R125 billion to GVA by 2030. These high-potential sectors also represent a significant opportunity for citizens with different skills to find a job in the near future. The City will continue to support traditional sectors, such as the automotive, mining, retail, finance and support services sectors, which already
101

82
have strong plans and strategies and remain core assets of the City’s economy. The SIGS plan for the next five years are outlined per sector in the sections below.
Education and the Knowledge Economy
Figure 4: GVA and Potentials for City of Tshwane
Source: SIGS Strategy
Tshwane has a major opportunity to create a world-class education centre, servicing the ever-growing and urbanising African population, by building excellence in both tertiary and vocational skills. By 2030, Tshwane has the potential to achieve international recognition for world-class excellence in one or two important disciplines by building flagship tertiary campuses dedicated to those areas of study, and by establishing itself as the ‘African hub’ to export key skills across the continent. When implemented successfully, Tshwane has the potential to more than triple both the economic contribution and the employment base of its education sector. The sector’s GVA could grow from R17 billion in 2013 to R54 billion in 2030, while jobs in the sector could increase from 72,000 to 231,000 over the same period.
The following are some of the measures of success for the creation of an environment for education and the knowledge economy development in support of the programme with greater detail per intervention provided in the April 2016 Council-approved SIGS document:
102

83
MEASURES OF SUCCESS FOR THE PROGRAMME
1. Set up career centres to help students to select disciplines in high demand and later connect to employer (physical and online platforms)
2. Leverage corporate partnerships to develop key disciplines and ensure job placement
3. Expand capacity in key skills gaps
4. Develop corporate partnerships to subsidies training costs and facilitate internships and job placement
Agriculture and Agro-processing
Figure 5: GVA and Job Potential for Agriculture and Ago-processing
Source: SIGS Strategy
Agricultural production and processing are currently small sectors in the City of Tshwane. In 2013, production had a GVA of just over R1 billion, and employed 14,000 people in formal jobs, while processing had a GVA of R5.7 billion and 18,000 formal jobs. The growth rate in both GVA and jobs has not exceeded 2% per annum between 2009 and 2013. Agriculture and agro-processing can have a large transformational impact on residents within the Capital. A concerted effort to bridge the skills gap can improve inclusion by training people in critically scarce fields across the agriculture value chain (including farmers, extension officers and entrepreneurs). A more developed sector will also contribute towards improving the food-security position of Tshwane’s residents. If the City manages to grow this sector to its full potential, the combined GVA of agriculture and agro-processing could rise from R7 billion in 2013 to R31 billion in 2030 – an increase of more than 300% – while employment in agriculture could increase from 32,000 in 2013 to 156,000 in 2030.
103

84
The following are some of the measures of success for the creation of an environment for agricultural production and agro-processing development in support of the programme:
MEASURES OF SUCCESS FOR THE PROGRAMME
1. Perform baseline land assessment and expedite land reform claims process whilst ensuring comprehensive support for land claim beneficiaries
2. Provide enabling infrastructure for production and processing
3. Prioritise provisioning of key production inputs
4. Facilitate access to concessionary finance (low or no-interest financing)
5. Rapidly develop and train a cohort of emerging farmers to make use of leading techniques, methods and processes through the use agricultural extension services
6. Prioritise provisioning of key processing enablers
7. Develop a collective resolution of storage and transport issues for farmers
8. Develop and implement a production and processing expansion plan to achieve the necessary production and processing scale and quality to enable market expansion
9. Create a 'central market access champion' to facilitate access to profitable markets
Business and Diplomatic Tourism
Figure 6: GVA and Jobs Potential for Tourism focussing on Business and Diplomatic Tourism
Source: SIGS Strategy
Tshwane’s aspiration is to become Africa’s top global business tourism destination by 2030 – an aspiration which aligns with South Africa’s vision of becoming a top-20 global tourism destination, and the strategy to position Gauteng as a globally
104

85
competitive destination of choice. Although leisure tourism and visits to friends and relatives also represent opportunities for growth and jobs, business tourism is the fastest-growing category of tourism for Tshwane, with an average annual growth rate of 6.2% between 2003 and 2013. It is also the area in which Tshwane can truly differentiate itself, as the seat of national government, home to multinational and local corporate headquarters, and the location for one of the Africa’s largest diplomatic hubs and offices of major international organisations, such as the United Nations and the World Bank.
If the City manages to unlock this opportunity, business tourism could grow fourfold over this period, from R4 billion in 2013 to R17 billion in 2030. This in turn could drive an increase in the tourism sector’s GVA from R14 billion in 2013 to R40 billion in 2030, while jobs in the sector could increase from 38,000 to 105,000 over the same period.
The following are some of the measures of success for the creation of an environment for Business and Diplomatic Tourism development in support of the programme:
MEASURES OF SUCCESS FOR THE PROGRAMME
1. Define and communicate a clear value proposition for the City
2. Promote Tshwane as a viable business tourism destination
3. Ensure easy accessibility to Tshwane
4. Ensure easy accessibility within Tshwane – develop flexible transportation within the City
5. Product development – develop high quality infrastructure
6. Brand, organise and provide leisure tourism activities (sightseeing, attractions and shopping)
7. Structure tourism institutions for maximum impact and support.
8. Develop the right hospitality and service skills
Investment Attraction
Incentive framework and incentive policy
One of the critical success factors for attracting developers and investors is to offer a compelling value proposition with respect to the availability of land and the ability to process any development-related application within acceptable timeframes. The City of Tshwane must in this respect identify appropriate incentives that can be utilised to attract potential developers and/or investors to develop within the CoT. Further development within the CoT will not only enhance short-term revenue streams to the CoT, but will also stimulate long-term local economic development within the metropolitan region.
The Development Investment Incentives (DII) Policy enables the City to offer incentives to investors in order to attract increased levels of investment into the City aligned to the Capital’s endeavour of promoting enhanced growth, ultimately for the benefit of residents within Tshwane.
The DII Policy, which came into effect on 28 May 2015 through a Council Resolution, identifies a range of incentives available to investors and methods in which the City
105

86
can effectively facilitate investment opportunities. Furthermore, the Policy allows the City to identify different categories of investments with respect to investment amounts and zoning categories. The DII policy facilitates the inclusion of incentives within the existing structures of the rates policy of the City. Since approval, the City has approved incentives applications pertaining to catalytic investments within Tshwane and the policy will be reviewed in the new financial year.
Programme 2: Green economy support
The green economy is one of South Africa’s most underdeveloped sectors with a potential to have a significant socio-economic impact on the potential to create employment opportunities. Government has committed to the development of the green economy through the South Africa’s Green Economy Accord, which was signed at South Africa’s National Parliament on 17 November 2011 in Cape Town by representatives of the South African Government, business representatives, organised labour and the community constituency. The Accord is a comprehensive social compact aimed at creating 300 000 new green jobs by 2020, in economic activities as diverse as energy generation, manufacturing of products that reduce carbon emissions, farming activities to providing feedstock for biofuels, and soil to environmental management and eco-tourism. Critical commitments relate to:
Increased use of renewable energy through generation for the national electricity grid as well as mass installation of solar water heaters;
Expanded production of clean stoves; Support for biofuels through regulatory measures and assistance to small
farmers; Investment in mass transit and to shift freight from road to rail; Establishment of various finance facilities for green projects; A target of 80 percent of new jobs to go to young workers, who face high levels of
unemployment; Support for school programmes on the environment; Ease the regulatory framework for distributed generation; Incentivise residents and businesses for resource efficiency through incentives
and behavioural change policies; Increase public awareness of the importance of the green economy; Audit Tshwane’s green standards against those of peers and enforce stricter
standards where necessary; Offer non-financial incentives for private investment in green industry; and Strict enforcement of policies related to green economy.
The objective of this programme is to seek to consolidate green economic initiatives of the City through enabling policy and research and development. This programme also supports the other sectors mentioned earlier as its implementation will also contribute to the approach towards the various projects to contribute to sustainable and efficient development.
106

87
In line with the City’s vision of job creation and the lowering of its carbon footprint, the City has already identified a number of programmes on alternative and renewable energy that can be implemented in the key industry clusters that drive Tshwane’s economy, as defined in the City’s Green Economy Framework. The key areas that the City will focus on to become a green-city economy include construction, transport, agriculture, water, energy supply, tourism, waste, and manufacturing.
The transition to a low carbon economy presents economic development opportunities as well as broader social and environmental benefits for the City of Tshwane. The City of Tshwane is home to the country’s highest research and development, innovation and knowledge concentration. As such, the City has the potential to become a leading green economy, as it will be able to lever from this, support green industries, as these are normally services driven.
Interventions that the City of Tshwane will implement to transition to a low carbon economy include the following:
Develop City of Tshwane’s Green Economy Strategy; Strengthen our capacity to lead and mobilise stakeholders to support the
implementation of green mega-projects; Create an enabling environment to support R&D and commercialisation of
innovation to sustain growth and productivity; and Identify more low carbon-related levers that the City can develop appropriate
incentives to support the City’s efforts.
The following are some of the measures of success for the creation of an environment for development of the Green economy:
MEASURES OF SUCCESS FOR THE PROGRAMME
1. Green Economy plan / strategy developed as per the approved Green Economy Framework
2. Number of consumer awareness/education campaigns on green economy initiated
3. Percentage conversion of City’s fleet to alternative fuel sources i.e. bio fuel
4. Number of Green economy projects initiated with key partners
5. MW electricity generated and fed into City s grid through green technology
Programme 3: Economic transformation
This programme seeks to enable socio-economic transformation to reduce the triple challenges of poverty, inequality and unemployment. The programme is further designed to contribute to the outcome identified for the creation of diversified and shared economic development in the City. Programme 3 concerns economic development that is sustainably productive with a resultant higher labour absorption rate, competitive by being relevant and addressing overall improved quality of life for Tshwane’s residents. It is also about the use of innovation, research and development to support and develop the City’s priority sectors.
Since 2011, the City has facilitated about 17 812 income-earning opportunities which is inclusive of the Extended Public Works Programme (EPWP). The City has also
107

88
during the 2015/16 financial year further planned to contribute to this with 60 000 new income-earning opportunities. The Rand value of investments facilitated by the City has not yet yielded the required results as originally planned since 2011 as a result of the slowdown in economic growth nationally and globally.
As a core driver of the Gauteng City Region, the City’s economic transformation agenda must be in line with and support the Gauteng government’s ten pillar programme of radical transformation, modernization and reindustrialization; which serves as a strategic roadmap to move the Gauteng City Region forward over the next fifteen years. The following has been outlined by the Gauteng Premier as key elements of radical and decisive economic transformation which will assist in addressing the structural problems of our provincial and national economy:
Changing ownership patterns to bring black people into the economic mainstream and creating black industrialists;
Changing the current industrial structure of our economy to privilege manufacturing and industrialization through the processing of rich mineral resources and other raw materials locally;
The development of new modern, innovation-driven industries in the areas of high-tech, biotechnology, the green economy and blue economy;
Investing in skills development to change the skills profile of the citizenry in line with the new strategic sectors and modern industries;
Changing income distribution to ensure equity and decent living standards for all; Transforming the apartheid spatial economy and human settlement patterns to
integrate economic opportunities, transport corridors and human settlements; Growing the SMME sector as a key driver of growth and revitalising and
mainstreaming the township economy; Strengthening the capacity of the state to direct economic development and
enhance the competitiveness of strategic economic sectors; Significant investment in economic infrastructure as the key stimulator of growth
and investment; and Transformative partnerships between the private and public sector in addressing
the developmental challenges outlined in the NDP.
The City’s on the other hand, has through Tshwane Vision 2055 identified and proposed the medium term actions which must be implemented within the period. Those strategic actions include:
Investment attraction and retention; Informal sector mobilization; SMME support; Rural development; ICT to support growth; Youth labour absorption; Competitiveness in the City; Improve tourism to the City and improve IICA ranking, Job creation;
108

89
The following projects have been identified and are proposed under this programme:
Inner City rejuvenation; Township economic regeneration; Youth and gender sensitive procurement; and Entrepreneurial Development Fund/Bank.
The following are some of the measures of success to achieve economic transformation:
MEASURES OF SUCCESS FOR THE PROGRAMME
1. SCM / Supply Chain Management Policy reviewed to be sensitive and user-friendly towards youth and female entities/enterprises, cooperatives and SMMEs
2. % of budget (operational and capital) spent on local/township SMMEs
3. Number of township SMMEs supported by the City through business development services, access to funding through partnership with external funders/banks, product development, provision of managed work spaces and general business training – soft skills)
4. Access to markets for goods and services produced by townships and community enterprises facilitated
5. Number of job opportunities created City wide (EPWP, Vat Alles and Tshepo 10 000)
6. Amount and related value as a result of economic infrastructure provided for township entities/enterprises, cooperatives and SMMEs
It is evident from the preceding analysis and subsequent interventions proposed that the task ahead of the Capital is indeed challenging. As such, it is critical that this document defines precisely the interventions that must be achieved within the coming financial year, whilst remaining cognisant of the Capital’s long-term aspirations.
Key interventions for 2016/17
Catalytic interventions for programme 1:
Key intervention Activities for 2016/17 2016/17 Budget
Education (SIGS) - Student Centre Development
Commence engagements to initiate the establishment career centres to assist students to select disciplines in high demand and to later connect to employers (physical and online platforms)
Capex and Opex
Business and Diplomatic Tourism (SIGS) -Define and communicate a clear value proposition for the City
Engage with key tourism stakeholders in the industry and government and develop an action plan to streamline City-related tourism operations
Capex and Opex
Investment attraction, facilitation and aftercare - Promote Investment attraction, facilitation and aftercare
Complete the review of the City’s DII Policy Opex
Other interventions for programme 1:
109

90
Key intervention Activities for 2016/17 2016/17 Budget
Developer Support for identified nodes and zones - Increase in bulk infrastructure network and supply to support new developments in identified nodes and zones
Identify bulk services backlog and provide a costing and implementation plan for the 2016/2021 IDP period
Capex
Education (SIGS)- Build a brand of vocational training
Meet and establish partnerships with vocational training colleges, to further develop and change the perception around vocational training.
Opex
Education (SIGS) - Audit current skills offerings at FET and vocational skills institutions and realign curriculum to market needs
Meet with tertiary institutions and with key businesses in the city to develop a gap analysis to determine the disjoint between demand and supply of skills
Opex
Education (SIGS) - Enlarge Tertiary footprint in Tshwane
Engage with tertiary institutions and develop a state of education report and also discuss the key initiatives outlined to determine which SIGS initiatives can be implemented over the next 5 years
Opex
Develop a forum of heads of tertiary institutions to track discuss and implement these interventions
Opex
Agriculture and Agro-processing (SIGS) Conduct an exercise to determine infrastructure needs and costing
Land audit commencement in Regions 5 and 7
Engage with businesses in the Agro-processing space to determine needs to unlock expansion
Engage National and Provincial Departments to enable development of the sector within Tshwane
Opex
Reduction in the cost of doing business Develop clear short, medium and long-term action plans to ease the cost of doing business with the commencement of execution in the 2016/17 FY as per the recommendations articulated by the World Bank South Africa Subnational Cost of Doing Business Survey
Opex
Develop alternative metropolitan municipal finance model
Submission of policy brief and recommendations to National Treasury, COGTA and other stakeholders by the Chair of the South African Cities Network Board
Opex
Infrastructure masterplans to be revised
Revision of medium and long-term infrastructure masterplans to ensure quality economic infrastructure aligned to the approved SIG Strategy and Implementation Plan
Opex
110

91
Catalytic interventions for programme 2
Catalytic/ Project / initiative Deliverables for 2016/17 Indicate Capex / Opex
Green Economy (SIGS) -Green Economy Research Support
Utilise existing MOU’s with research institutions to identify key levers of green implementation and possible business ventures to further the green economy in the city – has already begun within the City and represents an ongoing initiative
Opex
Green Economy (SIGS) -Green Economy Awareness
Develop a green economy strategy and a resident awareness plan, as per the City’s approved Green Economy Framework.
Opex
Key interventions for programme 3:
Catalytic/ Project / initiative Deliverables for 2016/17 Indicate Capex / Opex
Tshepo 10 000 Support through mentorship/training to the Tshepo 10 000 co-operatives
Opex
Number of youth owned enterprises supported through economic development programmes
Opex and/or capex
# of jobs created through EPWP in the Department
Opex
Informal trader’s business support Promote participation of informal traders in economic activities through the number of workshops to be conducted
Opex
Contribute to the financial sustainability of the City through the Rand value of revenue collected through licensing and permits
Opex
Township revitalisation Township SMME promotion
% of budget (operational and capital) spent on local/township SMMEs
Opex and Capex
Township revitalisation - Infrastructure provision
Economic Infrastructure investment for township entities/enterprises, cooperatives and SMMEs
Opex and capex
RISK AND MITIGATION FACTORS
RISKS MITIGATION MEASURES
Conceptualisation of economic development and economic transformation
Cross-cutting area. Current understanding thereof perceived to be a Department of Economic Development or Economic Intelligence Unit (within the Office of the Executive Mayor) mandate. These areas will endeavour to create a far greater awareness of this important concept across all City departments in the new financial year.
111

92
Limited Funds Consolidation and rationalization according to a more coherent service footprint and targeting areas where greatest impact will be felt.
Unfunded mandates Reassignment / prioritization of resources where possible, rescinding of programmes where focus of the City has shifted due to context or policy
Lack of prioritization and sequencing Priority will be given to policies that need to be implemented immediately to enable interventions within the next financial year.
Poorly co-ordinated planning Vision 2055 provides an overarching policy framework to bring greater coherence to the work of government. However, many coordination problems relate to implementation and in these areas issues will need to be resolved through regular day-to-day interactions as well as the newly created Strategic Investment Committee.
Lack of continuous learning and improvement
It is important to figure out how to make things work before trying to implement at a large scale. Implementation needs to be a learning process, so that plans can evolve based on the experience of departments and the results of evidence-based monitoring and evaluation.
Lack of clarity of responsibility and accountability
Vision 2055 calls for the tightening of the accountability chain. An important step towards this is to ensure that all activities necessary to implement a programme are clearly spelt out including the timeframe and responsibility for implementation, as well as oversight and monitoring mechanisms that will help identify blockages.
Implementation of SIGS SIGS is a multi-disciplinary, multi-spherical (from a sphere of government perspective) and multi-stakeholder process. Many of the initiatives and interventions identified require a concerted effort from government, academia, the private sector and civil society, amongst other players. Tshwane will do as much as possible to lobby for support from these players as defined it the SIGS stakeholder engagement plan and problem solving mechanism; however, many of the recommended interventions are not entirely within the City’s direct control.
Current climate Economic and social (e.g. student protests and violence, xenophobic violence)
112

93
OUTCOME 3: QUALITY INFRASTRUCTURE DEVELOPMENT THAT SUPPORTS
LIVEABLE COMMUNITIES
Introduction
The provision of water, sanitation, roads, roads and stormwater, transportation, waste management, electricity, housing, recreation, health and safety are primarily the focus areas of the Infrastructure and Community Services cluster in the City of Tshwane. The provision of some of these services makes up a considerable component of the built environment which without, the built environment becomes dysfunctional.
These same services are also enablers for economic activities within the City. Investment in service delivery infrastructure is therefore a valuable resource that needs to be maintained and improved over time. It is therefore, very important to optimise the City’s existing infrastructure and equally plan for new infrastructure that
will propel the City to achieve the vision as set out in the Tshwane Vision 2055.
There are numerous factors that pushes the City of Tshwane to continuously invest in infrastructure. For instance, the City of Tshwane has one of the fastest growing populations compared to the other South Africa cities at almost 10% (Statistics South Africa, 2011). This high population growth compounded by high employment levels and poverty puts more pressure on the City’s endeavours to provide accommodation
to the poor households. The City of Tshwane’s infrastructure outlay is always
constrained and stretched because it has the biggest land coverage (6 368 square kilometres) compared to the other municipalities in South Africa. Providing infrastructure in response to the urban sprawl further places greater fiscal burden on the City’s ability to optimise infrastructure investment. The key aspect is to ensure sustainable City that promotes integration, inclusion and economic growth and the drive is towards a sustainable urban future emphasising the importance of developing sustainable infrastructure using truly original African solutions. The City’s
current spatial settlement patterns have led to long travel times and distances hindered access to employment opportunities which has to be matched with a faster pace in public and social infrastructure investment
The City inherited a spatially fragmented, inequitable and inefficient urban space economy. In this decade of change, the City of Tshwane intends to contribute to this outcome by creating a more equitable, efficient, environmentally and financially sustainable urban dispensation in line with current legislation and policy. For the City of Tshwane, it is not just about complying to the normative directives from national government to calls of higher density urban development, greater mixing of compatible land uses, and focused concentration of high-density residential land uses and intensification of non-residential land uses in nodes and along activity corridors, it is the impetus to ensure the remaking of the capital city.
This outcome, is the City’s commitment to implement initiatives to provide and
maintain quality infrastructure. In 2011/2016, the City has focussed on the provision of basic services to households, densification within the urban edge, reduction of
113

94
services backlogs, nodal development, and provision of sustainable shelter- low-cost, rental and social housing. It therefore becomes necessary to note that the City requires adequate infrastructural investment to ensure it is modelled around the efficient leveraging of resources and resilience in terms of the future climate change effects. Tshwane Vision 2055 proposes the following game changing actions which need to be implemented within the first decade of the vision:
Modernisation of City Transport & mobility systems; Improvement in land use management; Broadband Infrastructure investment to support access to economic
opportunities; Rural development; Sustainable human settlements; Water, sanitation, energy and roads & stormwater backlogs (Note roads and
stormwater upgrades and new build for new developments also must be catered for); and
Renewable/sustainable energy.
The following programmes has been identified to contribute to the achievement of the first decade of game changers contained in Vision 2055:
Information Communication Technology; Sustainable Human Settlement; Rural Development; Inner City Regeneration; Transit Orientated Development; and Sustainable land use management.
The City has made good progress in the development and maintenance of its infrastructure however more still needs to be done. The implementation of initiatives contained in the various programmes discussed below will ensure the City stay on track to achieve the desired results required for this outcome in the first decade. Essentially, it should sustainably contribute to the improved living quality and conditions for the citizens of the City.
OUTCOME 3: CONTEXT
The City has a constitutional responsibility to provide basic services to the communities as per its roles and responsibilities contained in the Constitution. These basic services include access to water and sanitation, electricity and roads and efficient public transport. The latter together with the provision of housing are responsibilities of not only the City but the national and provincial departments as well. Similarly, the provision of electricity is done by both the City and the state owned ESKOM. Whilst the above provides the scope of local government in relation to other spheres of government, the need to provide these services is not differentiated by households and businesses who rely on these services for
114

95
sustenance and for economic activity. The City of Tshwane therefore continues its commitments to improve access to these services in a sustainable, efficient and economically effective manner to support both liveable communities and shared economic development. In this section, a concise discussion of the challenges faced by the City in provision of basic services is shared and details of what the outcome seeks to address is given.
Water, and Sanitation: access to water remains fairly high in Tshwane. The Census 2011 reveals that in 2011, 89.2% households have access to piped water inside a yard with 7.4% accessing water through communal standpipes. Since 2011, the City has provided 9 845 households with a water connection. The City has continued to provide rudimentary water services in the form of Jojo tanks and water tankers to households living in informal area.
With regards to sanitation, the reported access levels as per Census 2011 data is 79.4% of households with access to either water borne sanitation or chemical toilets. During the 2012/13 financial year 9 845 additional waterborne sanitation connections were provided by the City with 1 700 UDS (chemical) sanitation devices provided.
Waste Removal: On the other hand, the City has continued to expand its footprint in terms of waste removal. Concerted efforts have been made to ensure that adequate supply of waste management facilities and infrastructure is provided. Since the beginning of the Council term, focus has been in replacing 85l bins with 240l bins in all old townships. Progress against this is continuing and the City is providing waste removal services to all formalised and proclaimed areas of the City. Supplementary to this, informal areas have continued to receive rudimentary waste removal service in a form of collection of plastic bags, removal of communal skips and clearing of illegal dumping sites. The city is currently experiencing a crises with regard to diminishing landfill airspace on which sustainable infrastructure is needed to mitigate against this challenge. Almost three of its eight waste disposal sites of the city are closed due to lack of air space due to high volume of waste received. This has lead into an increased operational costs; has drastically affected quality of service delivery and has increased pressure on the remaining waste disposal sites. A collaborative partnership between the City and a private sector on the development of the multi waste material recovery facility (MRF) at Kwaggasrand Landfill facility is one of the illustrations of the importance of recycling and waste minimisation. This are some of the innovative solutions of reducing the quantity of waste going to the waste disposal site as a way of increasing the air space .This is one of the drive initiated by the City for the establishment of the separation ate source program.
Electricity: the Census 2011 results recorded that 88.6% of households in the City have access to electricity for lighting. Although this is reflected as a good achievement for the City, it should be acknowledged that the number could include households who are connected illegally and therefore are not accounted for in the City’s billing system. On-going interventions of the City have yielded 21 121 connections in formal areas and in areas where backlogs were identified.
115

96
To ensure sustainability of supply, investment in bulk infrastructure and network upgrading has been a focus of the City. Further, in the 2011/16 IDP, the City committed to reduce non-revenue electricity by 10% in the term of office. This has been consistently achieved since the beginning of the Council term.
Transportation Services: the City is faced with public transport challenges as a result of inefficient land use practices of the past which have perpetuated urban sprawl and thus has left the majority of the poor located far from economic opportunities. The challenges with regards to public transport are centred on reliability, convenience and safety of public transport services; lack of coordinated and integrated public transport modes as well as inadequate non-motorised transport facilities. These challenges are juxtaposed with aging road network infrastructure and backlogs in terms of complete roads provision, especially in the townships and rural areas of the City.
To address the above the City has invested in expanding its road network with 95 km of new roads supported by the appropriate stormwater systems (128km) since 2011/12 financial year. The City is still committed to reducing roads infrastructure backlogs in the identified townships and other settlements of the City. Further, the construction of A Re Yeng, the City’s Rapid Transit System (TRT) which kicked-off in 2013/14 is aimed at providing reliable, convenient and safe public transport. The TRT development is supplemented by construction of non-motorised transport facilities especially around the inner City. Other public transport services included Tshwane Bus Service (by City) as well as taxis, other contracted bus services and rail.
A comprehensive Roads and storm-water backlogs reduction by for provision of basic services to minimum service levels is required. New township development must be done in a way that not does not increase the extent of the backlogs. The roads and storm-water backlogs in informal settlements also must be addressed, through township formalisation of such settlements.
The Light Rail transit is also one of the intended solutions to address the challenge of sustainable mobility in the city. It is one of the global commitment on carbon footprint reduction in C40 activities .LRT is intended for lights loads and scalability and it includes a range of vehicle types with different speeds, length and passenger capacities. It may also requires its own infrastructure or share the space with roads or other modes. Currently there are two priority lines (i.e. Sefako Makgatho – Mamelodi – Hatfield and Solomon Mahlangu – Centurion) proposed and be expanded in future.
Housing: The City’s mantra is to create liveable, resilient and inclusive
neighbourhoods where people can live, work and play. This can only be achieved by investing in social and public infrastructure that promotes the well-being of all citizens. Key to the City’s housing and human settlements infrastructure investment
programmes should be to bring people closer to the areas that encourages sustainability and economic activism among households, and reduction of urban sprawl. However, the vastness of the City, and the unavailability of suitable human
116

97
settlements in the city centre means that new developments are usually implemented in the periphery of the city. Providing infrastructure on the peripheral areas requires a significant capital outlay, and limits the City’s efforts of successfully
implementing its compaction and densification principles.
However, the impact of the City’s concerted efforts of providing adequate public
infrastructure and housing will not be meaningful if it does not go beyond just the physical structure, to comprehensively cover socio-economic benefits that improves the quality of life. Attempts in this decade should be towards consolidating the gains of democracy by tackling the triple challenges of unemployment, poverty and inequality. However, one of the critical challenges is to ensure that the government get returns on investment by ensuring that beneficiaries recognise low-cost housing as an investment. Several approaches are on the table and should be concretised through consumer education to recognise the market/asset value of the low-income houses, and through mortgaging and getting into real estate. It is anticipated that such efforts shall push the low-income households into the taxable pool. In the medium to long term, that will push towards reduction on state reliance/dependency.
The City of Tshwane has identified infrastructure development as a lever for both social and economic development. However, limited funding for infrastructure further puts a strain on the City’s efforts to maintain the existing services and related
infrastructure, making it impossible to meet future demand with ease. Over and above that, the proximity of the City to the citizens compels it to implement unfunded mandates as a way of addressing service delivery challenges. Thus, the City has to manoeuvre these resource constraints in a manner which have little impact on the already stretched City’s financial resource and tariff base. Essentially, such resource constraints dictates that the City should drive sustainable infrastructure developments through partnerships with neighbouring municipalities, local and international businesses, other spheres of government, local communities, and the international business. several developments are initiated and ran in partnership with the private sector has heightened the need for a sound balance on tenure mix to have a viable and functional housing delivery premised on a win-win situation for all stakeholders. Best practice show that partnership for public infrastructure investment should be based on among others, funding certainty, viable revenue streams, right institutional arrangements, right incentives, shared risk, and political will. The City is paying more attention to this by strengthening institutional and governance issues to attract the private sector because there are several housing and human settlements projects on the City’s pipeline which will be delivered through
public-private partnerships. Therefore, efforts should be made to ensure that the government’s investment is used to gear up private investment towards sustainable
housing and human settlements infrastructure.
Tshwane Vision 2055 puts emphasis on creating a better life for all. The focus is on creating a better life based on providing access to basic municipal services, and other practical programmes to improve the lives of the disadvantaged communities. The City has to provide social and health infrastructure and services of standards
117

98
befitting its status as a pilot site for the NHI. This also calls for building on agile and cotemporary technologic to support the health infrastructure for efficiency and ease of access.
Access should not only be limited to those who can afford. This implies providing appropriate and adequate shelter to the homeless and the indigent through adequate care and affordable rental facilities. The benefits of providing sustainable infrastructure for these people is that there is a high possibility that they can be re-absorbed into the main economic main stream, and they will then contribute to the municipal fiscus when they start paying for their municipal services.
One of the game changers in this decade is to implement environmentally sound developments to reduce ecological impact on the City’s unique and rare biodiversity.
This is also linked with efforts to become the leader in the green economy. The approach will be to arrest urban sprawl, and promote developments that adheres to compaction and densification. This ideal can only be achieved through a shared sense of developmental path, and development integration with all the stakeholders.
Meeting the demand for housing remains one of the City’s biggest challenges as can
be evidenced by the existence of 150 informal settlements. Informal settlements are likely to continue to exist with the City being the magnet for internal and international migrants who come into the City in search of education and job opportunities. The City will not rest until its inherited housing backlog is dealt with. About 220,000 households still needs to be housed, so that it can be said that the housing backlog is addressed. Over and above that, to address the challenge of informality, the City has continued to provide rudimentary services to all informal areas. Further, 31 informal settlements were formalised to meet proclamation requirements between 2011/12 and 2012/13 financial years. An additional 8 informal settlements were provided with serviced stands in preparation for meeting the proclamation requirements in future. In total, 11 281 households benefitted from the City’s
formalisation programme, with 12 181 houses which were transferred to owners, thus ensuring security of tenure.
A concerted effort has been made in providing of alternative tenure options through the provision of Community Residential Units (CRU’s) as well social housing. For
instance, the City has ensured that the Tshwane Housing Company is fully capacitated and accredited to drive social housing. Over and above that, the City encourages and continue to support activities of accredited private social housing institutions operating within the City. A viable pipeline of social housing projects has been developed to provide the much needed social housing.
Moreover, the City is looking at promoting FLISP (Finance Linked Individual Subsidy Programme) which is aimed at benefiting prospective home-owners earning between R3 501 and R15 000 who have challenges accessing home loans through the normal property market. Targeting the gap market has a potential to see a multitude of prospective home-owners own properties.
118

99
TSHWANE VISION 2055: 1ST DECADE OF GAME CHANGING FOR OUTCOME 3
Infrastructure is important in achieving economic and social prosperity in a city as it provides foundation for growth, human development and spatial transformation. To do this, cities should ensure that there is a strong long term vision in the development of infrastructure that is aligned to sustainable human settlement development, shared and inclusive growth, environmental protection as well as supports holistic human development. The Tshwane Vision 2055 state that this Outcome should achieve the following by the end of the first decade of game changing:
Programmatic investment on infrastructure and upgrading; Providing sustainable human settlements; Management of strategic land parcels to manage land development; Upgrading of townships, formalisation of informal settlements and roll out of
infrastructure services; Establishment of freight intermodal terminal at Pyramid South as part of the SIP 2
and support to the automotive industry; Improve mobility and connectivity through provision of integrated, efficient, safe
public transport (Rail, PRASA especially corridor modernisation, Contracted bus, TBS, taxis, ) and alternative mobility options (NMT);
Structural reform and modernising of the inner city and other nodes (like Operation Reclaim); and
Increase urban design and land use that supports land form and use of alternative modes of mobility to minimise travel distances and mitigate effects of climate change.
During the previous terms of office, the City had already started implementing some key actions that are in line with this outcome and this has resulted in improvements in the number of people with access to basic services, formalisation of settlements, and roll out of mass transit infrastructure among others. The table below summarises what has been done by the City to respond to the challenges outlined above as well as the Tshwane Vision 2055.
Tshwane 2055 Strategic Actions Assessment of the City’s Interventions: 2011/16
Basic Services Provision The City has met all its set objectives for the 2011/16 re: the provision of basic services.
Water provision to all settlements has been accompanied by a history of clean and safe water as per the standards of the Department of Water and Sanitation. There is however a need to maintain and upgrade the water and sanitation infrastructure to reduce interruption of services and to meet the health requirements and the expansion of the City for both residential and commercial purposes particularly with regards to waste water treatment and water treatment facilities.
Electricity roll out has been going full steam in the City and some households were provided with solar geysers. The efforts of both ESKOM and the City of Tshwane have ensured that an increased percentage of households year-on-year is lit up. To meet the demands for future growth, there needs to be integrated infrastructure planning supported by resources. This should be directed at energy generation, infrastructure expansion and maintenance for security of supply.
119

100
Tshwane 2055 Strategic Actions Assessment of the City’s Interventions: 2011/16
Innovative ways to protect infrastructure are also needed to infrastructure theft which threatens the economic growth.
Waste management has been rolled out in all settlements of the City.
Strategic Land Parcels Management Strategic land management- towards the end of the term, the City has paid specific focus on management of its land parcels and its strategic assets. This has resulted in institutional reconfiguration to ensure that this function is managed and planned for in line with the overall objectives of the City. However, much still needs to be done to ensure that the strategic land management consider the future demand for services and infrastructure in the city in the manner that ensures efficiencies and spatial justice.
On-going monitoring of land supply-demand for social and economic investment has also been the focus of the City. Through the understanding of the needs for social facilities in the future, the City is now in a position to know the extent of land needed for the development of social infrastructure towards social and human development. The role of the City is to ensure that all land management practices supports future development.
Formalisation of informal settlements The programme for formalization of informal settlements has been upscaled towards the end of the term. This has seen more households being able to access secure land and services towards incremental development of settlements. The Re Aga Tshwane is a flagship programme in this regard. To meet its objectives in the future, the City will need to ensure that infrastructure planning is aligned to human settlement development and that the sustainable human principles that seek to integrate “live, work, play principles” are not compromised.
Provision of rudimentary services to informal settlements not earmarked for upgrading has also improved. All informal settlements in the City have access to basic services re: water and waste removal. Much still needs to be done to roll out services such as sanitation to these settlements in line with standards that seek to ensure human dignity.
Coordinated grant management to support settlement upgrading has been achieved and has been instrumental in formalisation of informal settlements. There is still a need to ensure that medium to long term plans are developed to ensure predictable and efficient allocation of funds for this function.
Social Investment Establishment the status quo for social infrastructure availability and capacity has been completed and the City is in a position to plan for current and future demand for these facilities. The 2016/21 planning and budgeting should demonstrate that the City is working towards the reduction of social infrastructure backlogs through capital investment
All of the formal settlements in the city have access to one of more social facilities. A standard needs to be developed however to measure the sustainability of these settlements and therefore a need for the Tshwane Sustainable Human Settlement index.
Housing provision Implementation of 5 year IDP targets (low-cost, CRUs and social housing) has been ongoing and a number of new townships developed including mixed housing developments in Olivenhoutbosch. Much still needs to be done to ensure that housing typologies in the settlements are diversified to support sustainability and densification principles adopted by the City.
The City’s social housing entity was accredited and this means that the efforts towards diverse tenure options can be upscaled. Current social
120

101
Tshwane 2055 Strategic Actions Assessment of the City’s Interventions: 2011/16
housing projects are an indication of the City’s commitment towards this. There are also efforts to also improve the management of the existing social housing stock in the city.
Roads and Transportation development The Operationalisation of Phase 1A of TRT was achieved in 2014/15 FY. The City is currently developing Phase 1B of the project with an intention of operationalizing the line by the end of the 2016/21 term of office
To ensure that the TRT, (more broadly the IRPTN) is sustainable, the TOD development principles will need to become a reality through directed development along the transit routes, especially in promotion of high-density residential use
More roads and ancillary services have been developed in the City of Tshwane. Major road development such as Maunde, Simon Vermooten have either been completed or are in progress. These regional connectors are critical in facilitating ease of movement by people and goods. Implementation of freight intermodal hub in Pyramid is still to be realised and this will contribute towards economic growth in the City Region.
The City has invested in expanding its roads and stormwater networks. It is committed to reduce roads and stormwater infrastructure backlogs and upgrade public transport facilities.
Having stated the aspiration for the first decade with a good reflection on what has been achieved so far, it is important to unpack strategic and implementable actions that need to be undertaken as part of this first decade of game changing. The discussions below seek to provide details on the proposed programmes towards Tshwane Vision 2055 for the 2016/21 term of office and provide indicators that will be used as a measure towards the City’s progress.
PROPOSED PROGRAMMES FOR THE OUTCOME
This section presents the proposed programmes to respond to the outcome challenges and the Tshwane Vision 2055 aspirations as presented above. Each programme presented outlines the following:
Overall objective of the programme; Alignment of the programme to the Outcomes of the Vision; and Interdepartmental issues that need to be considered by the City in implementing
the programme.
For Outcome 3 the following programmes are proposed:
121

102
Programme 1: Information Communication Technology
To facilitate the use of ICT to improve living experience of the citizen and to facilitate for transitioning towards ICT enabled service provision.
Access to the digital landscape will improve the quality of service provision but also creating an environment for the residents of the city to access numerous opportunities which exist in the social and economic environment. The rollout of broadband infrastructure across the city and providing free Wi-Fi connectivity will open up these opportunities which the unemployed and youth will be able to access. Further to the above, the City also need to invest in transforming the way in which it is doing business with its customers towards smart services. This will further
Political focus areas, new catalytic projects
Strategic Objective1: Providing sustainable service infrastructure and human settlements
122

103
contribute to support the development of the green economy as envisaged in Outcome 1.
To be able to work towards the above, the following initiatives are proposed:
Broadband infrastructure roll out; Expansion of free Wi-Fi connectivity; and Transformation towards smart customer services.
The following are some of the outcome measures of success for the programme: MEASURES OF SUCCESS FOR THE PROGRAMME
1. % roll out of broadband infrastructure to increase connectivity
2. % of urban areas covered by free Wi-Fi
3. % of municipal business transactions available through e-services to customers
4. Nr of internal transactions modernised through e-service applications
5. Nr of internal management systems digitised
Programme 2: Sustainable Human Settlement
The provision of housing presents a challenge to the City of Tshwane, as it is influenced by the spatial spread of communities throughout the City, whether the settlements are formal or informal. The historic patterns of settlements in the City were influenced by the apartheid policy of the previous regime. The nature of these settlements that arise out of poverty often as they were located far from economic opportunities and areas targeted for integration and densification. The fact that access to adequate housing is now counted as a basic human right for all South African citizens, the City needs to ensure that it can provide quality housing in a sustainable manner. In terms of the geography of human settlements in the City of Tshwane, it is sprawled and unequal in terms of both level and quality of development and also in terms of opportunities.
The current spatial structure of Tshwane is also such that less affluent areas tend to be found on the peripheral areas of the City. The high capital outlay required to provide infrastructure in peripheral areas thus further compounds the problem. The result is that certain communities do not enjoy access to a full range of services, social amenities and facilities. The manner in which people traverse the City is also important. Those who can afford to do so make use of private vehicles whilst the majority of the City’s residents have no option other than to rely on inadequate public
transport which is also becoming increasingly expensive. Therefore in this “decade of game changing” the City needs to address with spatial fragmentation and promote spatial transformation to break access barriers by not only creating opportunities for the poor to access the city centres, but also prioritise spaces where people can live, work and play in the urban centres. Access therefore should not be limited to physical space and its amenities, but also the ones that provides social, health, economic and physical security. Meaningful access to the City should be recognised by how it improves both the poor’s well-being and the city’s fiscal productivity. A
123

104
good measure of access will be when all amenities and health facilities are within walking reach of the citizenry.
Sustainable human settlement programme aim to provide a range of services, amenities and residential options in an integrated approach giving the city’s citizens
the choice to work, live and play in communities with reduced need for travel, with low density sprawl and consolidating the area in which services and infrastructure is provided.
To deal with the above the City need to focus on inter alia the following priorities:
Upgrading of informal settlements; Improve mobility and connectivity through provision of an integrated, affordable,
efficient and safe public transport and alternative mobility options; Creation of liveable neighbourhoods and functioning nodes through strategic, and
sustainable social and infrastructure investment; Increase urban design and land use that supports compact urban form and use of
alternative modes of mobility to minimise travel demands and mitigate the effects of climate change mitigation; and
Develop living environments that encourage use of sustainable forms of transport.
The following projects are proposed which will ignite the programme:
Social housing; Mixed use housing; Re Aga Tshwane; Social infrastructure investment; Sustainable infrastructure investment; and Road and stormwater infrastructure.
The following are some of the measure for success for this programme:
MEASURES OF SUCCESS FOR THE PROGRAMME
1.Nr of social housing projects completed and formally occupied
2. Nr of informal settlements formalised/ number of households upgraded to formal settlements
3. Nr of formal and informal settlements having access to basic level of water and sanitation facilities.
4. Nr of new sport facilities developed and upgraded
5. Nr of new recreational facilities developed and upgraded
6. Nr of new parks developed and upgraded
7. % of sports and recreational facilities maintained as per the agreed norms and standards
Programme 3: Rural Development
Rural development is about enabling rural people to take control of their lives and destiny so that together with other social partners, rural people may directly confront the problems of poverty and underdevelopment in a way that suits them best. This programme seeks therefore to promote rural and land management as a significant
124

105
input towards food safety, economic development and sustainable management of rural land assets.
Poor infrastructure is a major impediment to development, poverty reduction and improved standard of living. For example, poor road networks has a potential to lead to poor public transportation system, which in turn reduces the potential of connectivity and economic activism. It is therefore anticipated that the provision of quality infrastructure will promote liveable, resilience, and inclusive communities, which can lever social and economic development.
The Gauteng Comprehensive Rural Development Strategy, with its five developmental pillars, was developed to create viable, equitable, vibrant, self-reliant rural communities by ensuring food security for all becomes a living reality to the millions of people of Gauteng. The City, as part of Gauteng City Region, is committed and contributes towards socio economic development with emphasis on rural development.
At the start of the current term of Council, the City had set targets that support rural development. The implementation of various basic service delivery projects and programmes has contributed to the rural development as well as rural land management.
The following are some of the measures of success for this programme Key intervention
1. Develop a comprehensive rural development strategy;
2. Number of small scale agricultural farmers supported
3. Support for local produce
4. Number of farmers markets coordinated by the City
Some of the projects which have been identified for implementation include but not limited to the following:
Rural development strategy; Food safety; Small scale agricultural support; East capital; Development of a rural land management framework; Develop a comprehensive rural development strategy; Number of small scale agricultural farmers supported; Support for local produces; Number of farmers market coordinated; and % reduction of dependency by small scale farmers on government support.
125

106
Programme 4: Transit orientated development
Transport plays a critical role in meeting the City’s Strategic intent. An efficient
transport system is one of the key enablers for enhancing productivity and delivering more sustainable economic growth. Enhancing the City’s transport infrastructure and
service provision can help open up new markets, increase access to employment and help build a critical mass of business that can drive up competitiveness and deliver growth. The objective of this programme seeks therefore to improve mobility and connectivity through provision of integrated intermodal transport system which is safe and affordable to all. This programme link with the programme on Mobility discussed in Outcome 1 which relate to a resilient and resource efficient city.
The provision of transportation and mobility infrastructure for people or goods supports the City’s social and economic development goals. The manner in which
the City’s transport network is developed, managed, maintained and integrated will largely determine the extent to which the City’s spatial transformation is successful
and supports its liveability goal.
The City of Tshwane has the opportunity to work towards changing the face of modern transportation for the good of the environment. This entails implementing an integrated sustainable mobility network that combines the use of non-motorised means of transport with the use of public transport to allow people to move in their local environments without utilising privately owned motor vehicles. The principles of eco-mobility and new urbanism will be key principles of the City’s future
transportation system. The current public transport system in the city follows the patterns of the apartheid spatial planning structure. The communities which should have access to a public A well-developed public transport system gives less-developed communities access to core economic activities and services while freight transport enables businesses to get goods and services to and from markets securely and efficiently.
The aim of this programme is to facilitate easier access through mobility systems and promote various land use typologies along transport corridors.
To deal with the above the City need to focus on inter alia the following priorities:
Improve mobility and connectivity through provision of an integrated, affordable, efficient and safe public transport and alternative mobility options;
Increase urban design and land use that supports compact urban form and use of alternative modes of mobility to minimise travel demands and mitigate the effects of climate change mitigation; and
Develop living environments that encourage use of sustainable forms of transport.
The following are some of the measure for success for this programme:
KEY SUCCESS MEASURES FR THE PROGRAMME
1. Average time (minutes) for work trips by public transport
126

107
KEY SUCCESS MEASURES FR THE PROGRAMME
2. Average travel time for all (modes) work trips
3. The percentage modal split (share) for main mode work trips.
4. Length of NMT (walkways / cycle ways / ) and facilities provided
5. Nr of initiatives introduced/implemented at Wonderboom Airport to contribute to economic sustainability
6. % of roads infrastructure backlog reduced
To following projects are proposed which will initiate the programme: TOD land development management; Public transport usage; and Complete street.
Programme 5: Inner City Regeneration
The programme focuses on ensuring liveability in the capital core whilst ensuring that it becomes the prefer destination for business.
Infrastructure investment within the inner city, its consistent management and maintenance is a key lever to raise economic productivity, permits economic expansion and allows previously marginalized communities to take advantage of the opportunities. It is therefore very important to optimize the City’s existing
infrastructure and equality plan for new infrastructure that will propel the City to achieve the vision of Tshwane Vision 2055, particularly as it regards to inner city regeneration.
One of the stated objectives pertaining to urban development in the National Development Plan: NDP 2030 is that travel distances need to be shorter. This means ensuring that a larger proportion of workers live closer to their places of work, and the public transport is safe, reliable, affordable, and energy efficient. From the land use point of view it means building denser and more liveable cities and towns. Densification is part of the city’s continued commitment to implementing the
principles of new urbanism that have been presented in the City’s 2005 Compaction
and Densification strategy. Compaction and densification will bring about certain benefits that include greater resource efficiency, increased access to economic opportunities, and reduction of the City’s carbon footprint.
The City’s 2005 Compaction and Densification strategy outlined that the reasons for
seeking to increase the gross density of the metropolitan area (inner city) will amongst others reduce the Inner City’s carbon footprint, facilitate greater use of public transport and promote other forms of mobility such as walking and cycling.
Inner city spatial transformation
The rapidly growing urban population and rising numbers of private vehicles is overwhelming the inner City resulting in increased congestion, less mobility and poor air quality. Linked to this is the public transportation network which was inherited which is characterized by the mono-focus of transportation on movement of people
127

108
from dormitory settlements into and out of economic hubs thus neglecting the economic opportunities that transportation presents. Reduction in the use of private vehicles and the increased use of public transport, supported by environments that encourage eco-mobility will give a multiplier effect to a reduced carbon footprint within the Inner City.
The City has already introduced the A Re Yeng rapid transit system (TRT) within the CBD, the project is aimed at providing reliable, convenient and safe public transport. The TRT development is supplemented by the construction of non-motorised transport facilities, especially around the inner city. The first phase of TRT development, which connects the CBD to Hatfield, was put into operation during November 2014 and the project is still continuing with other phases.
Other major inner city regeneration projects include as also identified for implementation by Tshwane Vision 2055 include the Tshwane House; it is the new municipal headquarters complex, it is also both a new building project and a CBD regeneration project that will not only achieve massive cost effectiveness and productivity goals for the City’s service delivery management, but also generate
economic redevelopment outcomes for the CBD in particular, for the whole city in general. The other one major inner city regeneration project is the Government Boulevard which include concentration of all government departments in one area to serve as one stop shop for all consumers.
The following are some of the measure for success for this programme: KEY SUCCESS MEASURES FOR THE PROGRAMME
1. % of completion of inner city catalytic projects
2. Number of inner city regeneration projects implemented
3. % increase in new investment/business attracted to the urban development zone
The following projects are proposed for 2016/17 Capital Core Management; Government Boulevard; Urban Development Zone management; Integrated public transport; and Road and Storm water infrastructure.
128

109
Programme 6: Sustainable land use management
The City and its geographical location play an important role to support government’s
integration efforts in Africa. Although the City may not be driving the regional infrastructure development, it has an important role to play by ensuring that land use management become strategic in nature and is supported by supporting infrastructure plans to facilitate this process.
Sustainable land use management will gear the city towards achieving spatial transformation. Spatial transformation is about improving quality of life; maximising employment opportunities; not spending unnecessary hours in traffic- getting a mother that works 60km away from home back to her children earlier in the day than later in the night. Spatial transformation is about providing a space for people across different income groups to interact with one another in the same communities; it’s
about breathing clean air, protecting limited natural resources and living healthier lives. Spatial transformation is the key to attracting investment into our cities though creating economies of scale through an efficient space economy: supplying the demand, in an efficient, effective and sustainable manner. Spatial transformation is about good governance, advancing the service delivery imperative in a meaningful, impactful and more affordable manner.
Spatial transformation uses roads and transportation modes, housing, community facilities and services, economic strategy, agricultural and environmental interventions, electricity and water supply as tools to realise the restructuring of space. Spatial transformation, then, is an all-encompassing strategic approach for creating a successful city across all sectors. And transformation does not happen by chance. It is a conscious decision to ‘undo’ business as usual.
Sustainable land use management will therefore require focused and unwavering application of sound planning principles in the medium- to long-term. As has been indicated earlier, one of the stated objectives pertaining to urban development in the National Development Plan 2030, is that travel distances need to be shorter. From a land use point of view it means building denser and more liveable cities and towns. Land reform should therefore play a critical role in how the City of Tshwane realises its spatial future. An efficient spatial form will address matters of spatial fragmentation and socio-economic equality.
The growth of the city’s urban population has created and will continue to create
serious challenges for the City in terms of air and water pollution, unacceptable travel times across the city due to the shortage of affordable housing close to the core economic nodes. This also have an impact on the cost and quality of the provision of basic services such as waste removal and deteriorating infrastructure, which places a burden on the City’s resources. Land use management must
contribute to spatial transformation in the city and support the concept of “smart
mobility” and “smart living”. The public transport system will address many of the ills currently caused by urban sprawl. It is imperative that infrastructure is provided within strategically targeted areas (nodes) and that once provided, is used optimally,
129

110
giving rise to transit-oriented development. Transit-oriented development will optimise the potential and infrastructure capacity of nodes through economies of scale while combating urban sprawl through movement between and connectivity of focus areas of development. There will also be a reduction in the cost of providing public facilities through the sharing of resources, equipment and land.
There is a growing need for the city to start investing in spatially targeted areas as identified in our spatial development frameworks. The current investment patterns are still not addressing the spatial inefficiencies of the past. There is a need particularly by infrastructure department and the Human Settlements Department to have a focused approach in terms of their infrastructure spending. The areas the city should be spending most of its Capex is in areas identified in MSDFs and RSDFs and are in line with the directives of spatial restructuring and long term vision (Tshwane 2055). This includes nodal development and corridor development.
The process of increasing land use densities in a planned and meaningful way within the existing boundaries of a specific area increases overall efficiency and reduces cost in the use of infrastructure, services and amenities. The City needs to develop policies from all relevant departments that are aimed at creating a city characterised by high density. Our land use management policies (or those affecting land use) must be supportive of high density development in areas identified as nodes and corridors. Coherent policies will lead to sustainable land use that balances the needs of promoting equitable economic development and conservation of the City.
It is therefore essential that the City implement its compaction and densification principles in an effort to curb urban sprawl within the City’s spatial structure. The
costs of urban sprawl and associated low densities are undeniable. To deal with this historic matter, the management of strategic land within the city is core to addressing integration as well as sustainability.
The programme therefore seeks to ensure strategic utilisation of land, compaction and density while it improves land use management systems in the City. The City should aggressively continue to identify and acquire land to drive its transformation agenda particularly land situated along corridors and notes for the purpose of mixed use housing development or other strategic investment initiatives.
The city should use the CIF in prioritising and targeting their Capex spending. This will go a long way in channelling city’s investments in spatial identified areas as per
the city’s spatial vision. Department must spend their Capex in line with the CIF.
A key deciding factor for the success of land use management and spatial plans is an understanding of the infrastructure requirements for densification and compaction. This includes intelligence around infrastructure location, specifications, condition, capacity and maintenance (schedule and budget) so as to avoid development of spatial plans that cannot be achieved or that will fail after a few years due to failure of infrastructure.
130
111
Another critical consideration is the policy coherence not only within the City but also with other spheres of government and the manner in which other government spheres implement certain projects within the City.
To deal with the above the City need to focus on inter alia the following priorities: Acquisition of strategic land parcels to promote integrated development; Structural reform and modernising of the inner city and other nodes; Promotion of mixed used transit orientated development, along corridors and
economic nodes; Creation of liveable neighbourhoods and functioning nodes though strategic and
sustainable social and infrastructure investment; Increase urban design and land use that supports compact urban form and use of
alternative modes of mobility to minimise travel demands and mitigate the effects of climate change mitigation; and
Develop living environments that encourage use of sustainable forms of transport.
The following are some of the measure for success for this programme:
KEY SUCCESS MEASURES FR THE PROGRAMME
1. % of land use development approved outside the urban edge (25 km development)
2. Rezoning applications may be a better indicator of restructuring land developments
3. Rand value of land development facilitated in strategic land parcels
4. Rand value of investment facilitated in the UDZ
5. Rand value of public investment in integration zones
6. Number of high density compact developments approved in nodes
7. Number of high density compact developments approved in identified transport corridors
The following projects are proposed which will initiate the programme: Vacant land audit system; SCOA compliant Asset Register; Review of Land Alienation Policy, processes and institutional arrangements to
facilitate the release of Strategic Land Parcels (SLP); Growth management strategy; Transition zone identification; Strategic land management; Land information management; Spatial policy development; IGR forum to manage how projects by other spheres of government are
implemented within the City; and Urban Design policy framework for the City.
131

112
KEY INTERVENTIONS FOR 2016/17 FINANCIAL YEAR
Programme Activities for the 2016/17 FY Expected Deliverables
Sustainable Human Settlements
Mixed housing developments 1,000 new top structures to be constructed.
4, 000 service stands to be serviced with water reticulations.
4, 000 service stands to be serviced with sewer reticulations.
30km of roads to be constructed.
Facilitation and provision of affordable rental housing
100 CRUs to be constructed.
500 units to be delivered.
Security of tenure: Issuing of title deeds to beneficiaries
80% of the received title deeds issued.
Formalisation of households (Re Aga Tshwane 1000 stands to be formalised.
Formalisation of informal settlements 1000 informal settlements to be formalised.
Extension of Rooiwal WWTW Capacity: Sludge facility, 40Ml.day BNR Module (Rainbow Junction, Mandela Corridor, West Capital, Tshwane house)
WWTW capacity to be increased to 40ML/day
Expansion of WWTW Capacities (City wide) WWTW capacity to be increased to 30ML/day
Upgrading of bulk water infrastructure 5000m of bulk water pipe installations Complete 3 new reservoirs
Extension of Water Treatment Plants 100% construction of Temba WTP
New Water connections 5 000
New sewer connections 5 000
Spatial policy development & growth management strategies
Detailed design for civic and Northern Gateway
ICT Roll out of free wi-fi All urban areas connected to wi-fi 1000km fibre network
E Tshwane kiosk
RISK AND MITIGATION MEASURES
Risk/ Challenge Mitigating Strategy
Limited Funds Consolidation and rationalization according to a more coherent service footprint and targeting areas where greatest impact will be felt.
Unfunded mandates/programmes Reassignment / prioritization of resources where possible, rescinding of programmes where focus of the City has shifted due to context or policy
132

113
Synergy within the three spheres of government Continue engagement and alignment processes; participate wherever possible in crosscutting forums and drive programmes at political level with administrative support Invite national and provincial partners to participate in City processes and sign delivery agreements Consistently update procedures based on new legislation
Theft/Fraud/vandalism of public property Where needed provide security upgrade and this needs to be supplemented with community participation (councilors taking more responsibility) and taking demonstrative legal action against vandals. Enforcement of disciplinary code such that supervisors are ensuring frontline assets are managed responsibly (specifically in terms of managing insurance risk)
Compliance to legislation Ensuring compliance with new requirements whilst tracking compliance costs carefully
DEPENDENCIES/ROLES AND RESPONSIBILITIES BY OTHER
STAKEHOLDERS
Stakeholder Contribution to the Outcome
Business Invest in infrastructure and human resource development Support the City in its revitalisation and upgrading of deteriorating areas and industries Initiate and encourage foreign investment
Citizens and NGOs Communities and NGOs
Community Based Management
Monitor and evaluate the implementation
Participate in the conceptualisation and identification of community-based projects
Organise capacity building
Organized Labour
Environmental Awareness
Green Scorpions & Whistle Blowing
133

114
OUTCOME 4: AN EQUITABLE CITY THAT SUPPORTS HAPPINESS, SOCIAL
COHESION SAFETY AND HEALTHY CITIZENS
Introduction
Outcome 4: An Equitable City that supports happiness, social cohesion and safety integrates the work of the City Departments and entities that take the strategic and practical lead on the City’s constitutional mandate to promote the social development
and upliftment of its residents. This outcome is about promoting a complete citizens through health and education promotion and access, improving citizen safety and promoting social cohesion. The goal of the outcome is to improve quality of life for all and to ensure that Tshwane continues to be a caring city through ensuring a high quality of life, displaying a sense of humanity, provision of comfort and dignity to the citizens and thus demonstrating that Tshwane is a city that cares.
To achieve the above, it is important to put into context the citizens of Tshwane and this will allow for a fit approach towards the attainment of a “caring city.” First,
Tshwane is a young City and therefore any plans of the City need to take into consideration the needs of the youth and children of the city. Second, just like most cities in South Africa, Tshwane is faced with challenges of poverty, inequality, drug and substance abuse and gender based violence. Whilst these are the challenges that are faced by the city and its citizens, the complex composition of the citizens in terms of culture and language presents an opportunity for the city to promote diversity and importantly to create a safe city which facilitates the realisation of individual aspirations.
To do this, efforts need to be employed towards investing in people so that they are part of the social and economic landscape of the city. Importantly also is the investment that needs to be made by in space to ensure that equitable access to social opportunities is achieved whilst creating self-sufficient communities and neighbourhoods.
Tshwane Vision 2055 is very bold on what needs to be done with regards to this outcome. In relation to the 2016/21 term of office, the Vision states that by 2020 the City would have completed planning for the transition. A new approach to addressing community safety, health, social cohesion, diversity would have taken hold and communities would be working together to tackle poverty and inequality. The Vision realises that to achieve greater impact and sustainability, effort from civil society, private sector and academia will be required.
This outcome strategy has identified the following programmes towards achieving the goals for the first decade of game changing:
Indigent and vulnerable support; Poverty spatial targeting; Food security; Healthy living; Safer city;
134

115
Education promotion and learning; and Social cohesion and Nation building.
The following sections of this Outcome Strategy will look into detail the contextual factors for the outcome that need to be addressed. Reference on this will be from the Tshwane Vision 2055 Discussion Document and the approved Tshwane Vision 2055 long term strategy document. The following section will reflect on what the City has done in line with the outcome and this will be summarised to reflect the interventions of the City in relation to other key strategic framers such as the National Development Plan, provincial initiatives, 2011 local government manifesto among others. The final section will then present proposed programmes that bridge the gap between what’s been done and what need to be done and provide a
conceptual consolidation of existing programmes as it relates to the outcome. The final section will identify the dependencies and cross cutting issues that need to be considered toward achieving the intentions of the outcome.
Outcome 4: Context
The City has a constitutional responsibility to promote safety, providing primary health care and environmental health services, healthy living promotion and the provision of sports facilities and sporting activities and the development, management and promotion of Early Childhood Development (ECD). On the other hand, the National and Provincial department have been mandated with basic and higher learning, tertiary health services, provision of higher order health services. On the other hand, the role of the different spheres of government re: sports development and promotion, nation building and social cohesion overlaps both in terms of programmes developed and implemented as well as in the provision of sports infrastructure specifically. Even with these differentiated and overlapping roles, the City of Tshwane still commits to the aspirations of the NDP and the Tshwane Vision 2055 and needs to address the societal challenges that are faced by the city. In this section, a concise discussion of the challenges that the outcome seeks to address is given. This is important to ensure that the response and interventions implemented during the 2016/21 term of office are targeted at real problems and that realistic solutions are proposed.
Responding to the challenges of a youthful city: the Stats SA Mid-Year Population estimates that, shows that Gauteng has a higher proportion of youth in the older cohorts. Youth make up approximately 35 per cent (4 million) of the population of the province. In the City of Tshwane, the Census of 2011 revealed that more than 677 000 of the population is below the age of 14 with more than 1.1 million people between the age of 15 and 34 and this makes Tshwane a youthful city. This means that the city potentially has adequate supply of labour and therefore challenges of aging workforce as experienced in some cities in the developed world may not be relevant to the city.
135

116
However, approximately 35.5 per cent of Gauteng’s youth aged 15 to 24 live in low income households compared to 57 per cent for the country. For the older youth age cohort of 25 to 34, 28.2 per cent in the province and 42.7 per cent in the country as a whole live in low income households. Of those aged 15 to 24 in the province, 23 per cent live in households reporting hunger due to inadequate food. The situation is worsened by the fact that among the youth that is of the working age group, on 32% of these are employed and this means that more than two-thirds of the city’s youth are unemployed. Even among youth that is below the employment age, there are challenges. Literature that seeks to link the education outcomes to overall health and wellness of children shows that children who come from poor households are more likely to have poor education results as compared to their peers. These challenges therefore means that there needs to be a concerted effort towards reducing youth unemployment; providing social support to poor households, especially those with school-going children; provision of infrastructure that is tailored to the development of youth towards their social, physical and economic development. Poverty and Inequality: the number of people living in poverty is the number of people living in households that have an income less than the poverty income. The poverty income is defined as the minimum monthly income needed to sustain a household and varies according to the size of that household. The larger the household, the larger the income required to keep its members out of poverty. This measure allows for economies of scale in larger households. In Tshwane, the number of peopled living below the poverty line has increased from 375 000 people to about 450 000 between 2011 and 2013 according to the IHS Global Insight. This is also evident from the increase in the number of indigent households registered by the City on an annual basis. The African population had the largest proportion of people living below the poverty line. On the other hand, Tshwane has experienced some improvements on some of its social welfare indicators, especially on the Human Development Index which measures improvements in long and healthy life, knowledge and a decent standard of living. Between 2011 and 2013, the IHS reported that this improved from 0.70 to 0.72. However, inequality in Tshwane seems to have worsened slightly over the 2011–2013 from 0.62 to 0.63 which signals strongly that the gap between the rich and poor has been slightly widening. The understanding of the nature and composition of poverty and inequality in the city needs to be completed by understanding the physical location of poverty in the city. The Gauteng Provincial government identified the most deprived wards in the province. From this study, areas such as Winterveldt, Temba, Olivenhoutbosch and the greater eKangala area are amongst the most deprived areas in the province. This deprivation is measured taking into consideration income and employment, shelter and service delivery, health and social development, education and disaster risk. This is in line with the Census 2011 results that showed that most people with no income are located in Region 1 (369 286) and Region 3 (200 653). This means that priority by all agents of government on social development needs to be spatially targeted to ensure that efforts to reduce poverty and inequality are concentrated in areas where they are mostly needed.
136

117
Education and learning: human development depends in part to access to and completion of education. The primary source of this knowledge is through education, beginning from the foundation phases to tertiary education and moving on to specialised training. In this regard, the city has experienced a steady increase in the number of people attending school from 71.4 per cent in 2001 to 72.4 in 2011. Further, the 2011 Census also revealed that that among those aged 20 years and older, most had achieved matric, followed by the group with post-matric qualifications. Tshwane performed increasingly well from 2011 to 2013 with respect to education, more so in the accumulation of matric and post-matric qualifications. In 2011, about 1.09 million individuals aged 20 years or older had at least a matric qualification, increasing to 1.12 million in 2013, which is a 2.3% increase. The number of individuals aged 20 years or older with no schooling declined from 70 152 to 68 216 in the same period, which reflects a 2.8% improvement. However, the attainment of high school education does not only begin in primary school and does not end in attainment of high school education. Investment in foundation phase education is key to improving education outcomes throughout the schooling years and it is for this reason that the City manages in its area of jurisdiction five ECD centres. These are supplemented by numerous private foundation phase centres of learning. However, there may still be a needs to expand these facilities in particular in areas where through gathered data, education outcomes have been poor and in areas riddled by poverty and thus may make poor children excluded from the much needed early childhood education. Having said the above, it is also important to highlight the role of tertiary education in the city and the role that the City of Tshwane can play to promote this. It is acknowledged that higher education plays a role in increasing the employment prospects in a growing economy. The current economic situation in South Africa means that a large number of those with tertiary education are not able to access secure employment with graduate unemployment rising with the overall unemployment rate as seen by the increase of unemployed graduates from 5.4 per cent in 1995 to 7 per cent in 2011 6. This means that all spheres of government and government need to ensure that this capacity is utilised towards building the economy. The City of Tshwane has recognised this and the Tshepo 10 000 programme has identified some of these graduates and has developed their various skills through cooperatives formation as a vehicle to ensure that they access economic opportunities. Much as this initiative has yielded results a lot still needs to be done to absorb unemployed graduates. The 2016/21 term of office therefore should demonstrated concrete efforts to end unemployment among the educated specifically. Promoting social safety and security: the promotion of safety and security is a responsibility of all in the city including government agencies, citizens and business. In spite of the guaranteed rights of South African citizens on safety and security as enshrined in the Constitution, a large number of South Africans have experienced
6 Broekhuize and Van der berg, 2013.
137

118
crime with violent crime and research has found that crime levels are exacerbated by inequality. The 2015 Gauteng Safety Strategy states that the province has been experiencing an increase in the violence used during the commission of crime. On the other hand, the same report notes that substance abuse, particularly the use of nyaope, has been linked to cable theft, metal infrastructure destruction and common theft. According to the GCRO Quality of Life Survey of 2014, about 29 percent of the citizens in the city are either dissatisfied or very dissatisfied with the overall service delivery in the province. Interestingly, despite the citizens’ recognition of police visibility and physical access to police station, the respondents to the Survey cited their dissatisfaction with the law enforcement service delivery as poor response times by enforcement agencies. The NDP indicates that this ‘demographic window’ of deprived youth and elderly can lead to a frustrating and destabilising environment where young people cannot get work, contributing to violence, crime, alcohol abuse and other social ills. The key determinant of success is whether a country can harness the advantage of having a large number of young people who are able and willing to work. Further, as has been discussed before in this section, the gap between the rich and the poor seem to be increasing in the city and it may be expected that crime rates may also increase if the inequality trend continues. It is therefore imperative to ensure access to education and skills and getting school leavers into work that they find stimulating and through which they can fulfil their aspirations. Health and healthy living: the South African Constitution articulates that among its many responsibilities, local government is responsible for promotion of a safe and healthy environment. The importance of health is further emphasised in the NDP which highlights quality health for all as one of the aspirations for South Africa of 2030. To achieve these aspirations requires investment not only in health care professionals and infrastructure, but also investment in health education and promotion as well as enforcement of laws that seek to promote the attainment of a healthy environment. The Tshwane Vision 2055 highlighted the impact of migration and the high burden of disease, fragmented health care service health workforce shortages and poor quality health infrastructure as the as the main health challenges that are faced by the city. Moreover In an Access to Community Facilities Study conducted by the City in 2015, it was confirmed that city has a good distribution of health care facilities. On average the travel distance to these facilities in 3.2 km across the city which make a total of 86.6 per cent of the population to be access standard of 5km of a primary health care. On the other hand, access to Level 1 hospitals within 20km travel distance is to 94% of the population; however, Region 5 and 7 needs investment in clinics as the average travel distance to a L1 hospitals in these two regions is 40km. The challenges with health services in the City relates to service capacity rather than physical access; this is because of operational capacities in these facilities which include the
138

119
provision of medical supplies, staffing and importantly the operating hours that do not match the need for the service to the working group. Further, the global trend of increase in people with lifestyle diseases need to be taken into consideration. In the Tshwane Vision 2055 Discussion document, recognition is made of how liveable communities can encourage community driven solutions in mitigating and responding to public safety and natural disasters, healthy lifestyles, including walking and cycling. Food Security: food security is defined as having adequate physical and economic access to sufficient, safe, and nutritious food to meet individual daily food intake requirements. Increases in food prices due to market systems, price of oil, climate change pose a risk to food security. This means that poverty and unemployment cause households to be food insecure. As discussed in the preceding sections, the challenge of poverty in the city cannot be downplayed. In fact, the General Household Survey of 2012 revealed that about 5.9 per cent of Gauteng’s population experience severe food shortages. The GCRO also reports that in 2011, one in five respondents in the QOLS reported missing a meal in the 12 months prior the survey with 6 percent of the household respondents reporting eating one meal a day and 31% having two meals a day. As can be expected, the physical location of these deprived households correlates with the earlier identified poverty pockets in the city. To reverse this, the Gauteng 20 year Food Security Plan proposes a targeted approach to eliminating food insecurity. This includes targeting wards and beneficiaries more likely to be food insecure. These could include households headed by the elderly, disabled, child headed households, poor households, sick/ill people as well as vulnerable migrants. To do this, the Strategy recognises that increase in food supply though improved food production, increased economic for the poor and increases in the supply of affordable food are key to tackling food insecurity. TSHWANE VISION 2055: 1ST DECADE OF GAME CHANGING FOR OUTCOME 4
The Tshwane Vision 2055 recognises that inequality, social exclusion and insecurity need to be addressed. The City aims to be a ‘caring city’ though provision of high
quality of life to all citizens display a sense of sharing, provide comfort and dignity to all citizens and offer solutions that are communally responsive. Through this Outcome, the City aims to achieve the following within the first decade of game changing:
Transform the poorest communities, reducing inequalities by addressing imbalances in access to income and economic opportunity,
Access to social infrastructure and access to services; Deploying programmes and interventions that promote literacy and enable
people of all age groups to get the most out of the education options available, working with low-literacy adults as well as learners and children
139
120
attending early childhood development (ECD) programmes within the City’s
boundaries; Provide a robust and sustainable safety that seeks to uplift the working age
and able bodied to self-sufficiency while enabling a basic level of care for the vulnerable;
Raise the level of social cohesion across the City decade on decade ; Improve the total health profile of the City ; and Improve the total public safety profile of the City.
These principles must, by the terms of the roadmap be translated into practical operational plans that can be measured, monitored, evaluated and corrected where necessary. In so doing, it will demonstrate how the long-horizon principles of the Tshwane Vision 2055 will find expression in the annual business plans and the day-to-day operations of the various departments within the cluster and entities (listed below). These annual plans will have to evolve over time to meet the transformative demands of the Tshwane Vision 2055.
The city maintains its commitment to continue focusing on poverty alleviation and safety measures towards achieving a liveable city. The city is working towards achieving universal access to basic services for all its citizens. This is a direct contribution to improving health outcomes and its initiatives towards the early childhood development still need to be expanded to all areas of the city, especially in deprived areas where poor are located.
The table below summarises what has been done by the City to respond to the challenges outlined above as well as the Tshwane Vision 2055.
Table 4.1: Summary of the City’s interventions for the Outcome
Tshwane 2055 Strategic Actions Assessment of the City’s Interventions: 2011/16
Vulnerable groups support The City has employed to a minimal scale social assistance to indigents (register
for FBS and exit strategy). This has ensured that the indigent households
received free basis services such as water and electricity and a limited number
have at irregular intervals receives food parcels. The interventions of the City
have cut across all regions and there is a need to deliberately target the poorest
wards of the city.
Over the last term of office, the City has developed and implemented programmes
dedicated focus to support elderly people and senior citizens with health care and
other necessities – focus programmes on chronic disease and treatment for
elderly
Deliberate efforts to reduce the scourge of drug and substance abuse have been
employed by the city. In 2014/15 financial year, a programme to rehabilitate drug
users in the City led to 121 of these completing the programme successfully.
Much still needs to be done by the City to promote sex education among the
youth to reduce teenage pregnancy, gender-based violence among others and
this will require strengthening the local NGO’s and action committees
Health The City is a pilot site for the National Health Insurance. This has resulted in the
140

121
Tshwane 2055 Strategic Actions Assessment of the City’s Interventions: 2011/16
establishment of ward based health teams which are able to bring health services
closer to the people.
A number of healthy lifestyle promotion programmes have been implemented by
the City. There still needs to be an assessment of the impact of these
interventions and a clear strategy developed which needs to be funded to ensure
that maximum results are achieved
All PHC centres of the City are running the PMTCT programme and this has
resulted in reduction of transmission of HIV virus from mother to child. Linked to
this, the City is also running HIV and AIDS awareness programmes which
includes provision of homebased care to those that are plagued by the disease.
The development of the Accessibility of Community Facilities has allowed the City
to acknowledge areas of greatest need for all social facilities, especially health
facilities. This will guide the development of health infrastructure in future.
Safety Ward deployment programmes to deal with issues of safety of families, children
and youth – deployment of 10 officers per ward is one initiative that has been
implemented by the City. This saw the training of 2000 officers. Currently, 1970 of
these officers are currently going through induction and will be placed in different
parts of the city.
The launch of the Namuna App by the City is a significant milestone. The app
seeks to allow easy reporting on crime and infringements and thus allowing all
citizens to help in improving safety and security.
Investment in infrastructure such as public lighting has been made as a
contribution to improve public safety. Coupled with this are urban and precinct
designs which are consciously seeking to promote public safety have been
developed and approved by the City
Crime and safety programmes through coordinated campaigns with partners –
social crime prevention with schools and communities in partnership with
business has been the focus of the City. This has included a particular focus on
business safety through which the City aims to retain investment in the City
Disaster management planning for climate change – awareness campaigns on
fire safety, floods and sinkholes have been conducted. Coupled with this, an
understanding of the areas of high risk re: disaster has allowed the City to
proactively plan for the emergency response.
Food security The City has identified land parcels that are preserved for agriculture. This was
done through spatial plans of the City.
The approved concept for the development of East Capital will among promote
agro-processing and thus not only build local economy but also ensure access to
affordable food supplies for the citizens
The food bank model of the city has been reviewed and has introduced PPP’s
towards increased share of poor communities that are benefiting from the
initiative.
Education and Learning Academic Bursary support to the need and deserving students has been initiated
by the City. Recently, a bursary fund for children of street traders has been
established and this will improve prospects of economic participation by more
youth.
The City developed and supports 5 ECD centres. Over and above this, a number
of other privately owned and NGO established ECD centres are supported by the
City.
The expansion of library infrastructure throughout the city has meant that more
141

122
Tshwane 2055 Strategic Actions Assessment of the City’s Interventions: 2011/16
people can access written forms of information. During the 2011/16 term of office,
3 libraries were developed with the completion of the Cullinan Library park
anticipated for the end of2016/17 FY.
The city has managed to keep a steady subscription to library services.
Programmes seeking to encourage reading are run in all seven regions of the
City.
A comprehensive approach towards school partnerships towards access and
development of libraries is sought to ensure that the city’s facilities are utilized to
achieve education outcomes
PROPOSED PROGRAMMES FOR THE OUTCOME
This section presents the proposed programmes to respond to the outcome challenges and the Tshwane Vision 2055 aspirations as presented above. Each programme presented outlines the following:
Overall objective of the programme; Alignment of the programme to the Outcomes of the Vision; and Interdepartmental issues that need to be considered by the City in
implementing the programme. For Outcome 4 the following programmes are proposed:
142

123
PROGRAMME 1: INDIGENT AND VULNERABLE SUPPORT
The programme is necessitated by the fact that the City has seen an increase in the number of households that have registered in the indigent register. Of these, women, children, elderly and migrants are the most vulnerable. Further, the projected economic conditions over the next 5 years indicate that the economy may not grow at the rate that it is needed to absorb the surplus labour that exists. If this happens, the City may find itself with an increased social burden and this warrants a consolidated approach to social support to cushion the effects of poverty to vulnerable households.
The objective of this programme is to ensure that the indigent households receive the city’s “basket of support,” increase upward mobility in the ladder of prosperity
Political focus areas, new catalytic projects
Strategic Objective 4: Ensure sustainable, safer communities and integrated social development
143
124
among the indigent support and to provide support to vulnerable groupings of the society. For a start, the City will define the basket of goods to which poor households should have reasonable access to. This should include: free water and electricity, rates rebase and constant provision of food supplies among others. Further, the programme should also seek to reduce social dependency by creating access to self-actualisation opportunities that are targeted at poor households to reduce social dependency. Importantly also is the role that the City should play to support the vulnerable groupings of society including women, elderly, disabled and displaced persons.
The programmes seeks to ensure the following:
That the social support programmes to the indigent and vulnerable by the City and other stakeholders are consolidated;
That the City comprehensively accounts financially for the social support provided to indigent households;
That the indigent households are linked to employment opportunities and thus reduce within reason the social burden;
That the number of vulnerable people that access the City’s support increases
through targeted interventions including provision of material support, social support and links to employment opportunities;
That support programmes are focused on the vulnerable groups such as the elderly, women and homeless;
Ensure that an increased number of households are placed in opportunities that will facilitate their exit from the indigent register and thus reduce social dependency; and
Increase the number of individuals from indigent register who participate in the City’s EPWP programme and its associated projects.
The following are some measures of success for the programme:
MEASURES OF SUCCESS FOR THE PROGRAMME
1. Increase in the number of legible households that receives the complete social package of the City
2. Increase in the number of EPWP jobs accessed by indigent individuals
3. Increase in the Number of indigent households exited from the indigent register
4. Percentage reduction in number of poor households in the city
5. Percentage increase in the number of women and disabled persons rendering services to the City
6. Increase in the number of elderly centres supported by the City
7. Number of child-headed households supported by the City
8. Number of homeless adults assisted to move away from the streets
For the success of the programme to be achieved, the City needs to take into consideration the following actions emanating from the 5 other Outcomes of Tshwane Vision 2055:
Roll out of water and electricity to indigent households; Procurement and employment processes that are biased towards disabled
persons who reside in the City with firm targets; and
144

125
Targeted engagements with the indigent and the vulnerable citizens to facilitate their awareness of their rights and participation in the City’s decision
making processes.
PROGRAMME 2: POVERTY SPATIAL TARGETING
Poverty expressed in spaced is perpetuated by imbalances in public and private investment. The role of the state therefore is to assist the redress these imbalances by targeted social investment in physical infrastructure and support programmes. It is also the role of the City to attract private investment into these pockets of poverty towards so that economic opportunities are accessible. The identified areas of Olivenhoutbosch, eKangala and Winterveldt are characterised by primal diversification of the economy which means that the poor in these areas have limited access to employment opportunities and therefore may be deepened further into poverty.
The programme seeks to reduce spatial poverty by deliberately steering investment towards the deprived areas of the City. This includes investment by all spheres of government and business alike. To do this, the City needs to identity investment packages towards the deprived areas in a manner that will promote spatial justice and access to services and opportunities for the poor in these areas. This needs to be in line with the Human and Social Development of the City.
The objectives of the programme are as follows:
Consolidate the efforts of the City in tackling spatial poverty; Reduction of real number of poor households in the deprived areas; Increase in public investment by all spheres of government towards pockets
of poverty; Promote private sector investment in poor areas to create economic
opportunities to the indigent; and Promote spatial justice through investment in public infrastructure and access
to social goods.
The following are some measures of success for the programme: MEASURES OF SUCCESS FOR THE PROGRAMME
1. Percentage of the city’s budget spent in the top priority wards
2. Increase in the newly formed businesses in deprived wards
3. Number of new employment opportunities facilitated by the city in deprived wards
4. Number of new social facilities developed in deprived wards
To achieve this the City will need to identify partnerships with the private sector and NGOs towards supporting the poor. Further, through intergovernmental relations, all spheres of government will need to work towards targeted investment in these areas.
145

126
PROGRAMME 3: FOOD SECURITY
Access to adequate food supply that meets necessary daily intake at affordable prices is key towards physical prosperity of the citizens. Food security, reduction of acute and chronic hunger requires an understanding of its underlying causes which among others are poverty and inequality. Further, food security can only be ensured through progressive and diverse agriculture promotion including small scale farming, urban agriculture among others. It also requires recognition that despite efforts, not all households will be able to produce food of afford to purchase food and hence the need for family support to access adequate food. The 2015 drought that is as a result of a number of factors including El ńino and global warming, it is expected that
supply of food from local producers will be affected. Coupled with the current economic situation re: inflation, it means that food security may escape even more households in the city
This programme seeks to ensure that the city produces adequate food supply to support not just the physical needs of the citizens but also to promote the agricultural sector of the economy. To do this, interventions on farmer support need to be consolidated to ensure that small scale farmers are linked to the markets, infrastructure to support agriculture development is provided and that urban agriculture is promoted. Further, the City and its partners need to create a systematic approach to feed the poor as part of the basket of social support to vulnerable persons and households. Of special consideration is how the City can utilise vacant urban land towards the development of food gardens and systematically implement this throughout all regions.
The objectives of the programme are therefore as follows:
Reduce the number of people that are suffering from chronic and acute hunger;
Increase the economic share of agriculture and develop small scale farmers into sustainable business;
Provide infrastructure to support agricultural growth and its related industries; and
Promotion of urban agriculture to reduce urban hunger.
The following are some measures of success for the programme: MEASURES OF SUCCESS FOR THE PROGRAMME
1. Number of poor households receiving monthly food parcels from the city
2. Increase in the number of urban agriculture projects supported by the city
3. Increase in the number of small scale farmers that are beneficiaries of the City facilitated skills development programmes
4. Percentage increase in the number of small scale farmers supplying the TFM with produce
5. Hectares of land reserved for agricultural activities
6. Rand value of agricultural and associated activities attracted to the city
146

127
PROGRAMME 4: HEALTHY LIVING
This programme seeks to integrate operational and capital expenditure of the City and its partners towards achieving an outcome of improving the life expectancy of its citizens. The programme seeks to support the national objectives of the National Development Plan which articulates 2030 objectives which are among others: increasing the life expectancy to 70 years; improve TB prevention and cure; reducing the prevalence of non-communicable disease; complete health care reforms; reduce maternal, infant and child mortality; deployment of primary health care teams to communities and families; universal health care coverage; filling of health care post with competent and committed individuals7. To achieve these objectives, a balance between preventative and curative actions need to be sought whilst ensuring that operational matters such as improvements in health care information management is achieved.
The Department of Health Strategic Plan 2014/19 was developed to articulate practical actions towards the NDP. This strategy highlights among others the following actions towards 2019: implementation of health norms and standards and facilities planning; development of efficient health information management system to assist in decision making; improvement towards universal care by implementing the NHI and improving accountability in the health care system through training of the health care professionals. With regards to the implementation plan the National Department of Health articulates objectives and indicators that need to be achieved by 2019 and some of these relate to local government. Some of these include monitoring the TB treatment success rates; increasing the number of ART clients remaining of treatment; municipalities meeting their environmental health norms and standards.
The City of Tshwane is already working in line with the NDP and the Health Strategy. This is evidenced by the fact that the City reports to National Health Department on the health indicators and some of these were already part of the planning processes in 2011/16 financial year. Further, the Tshwane Health District is already one of the districts in which the NHI pilot is being implemented. Further, the City confirmed and enhanced its norms and standards for access to health facilities in line with NDoH and will utilise these in planning for investment of physical infrastructure in 2016/21. The City still needs to consolidate its focus on environmental health services through promotional, educational and enforcement programmes targeting potable water quality, structural and hygiene compliance on food premises, improved waste management practices and compliance, improved legislative compliance of places of care.
Having discussed the above, this programme seeks to:
7 National Development Plan, 2012
147

128
Align to national objectives in terms of provision to quality health care services;
Ensure continuous support to ART clients on medications by monitoring the time they are on treatment;
Reduce mother-to-child HIV infection Reduce child and maternal mortality; Reduce the prevalence of non-communicable diseases; Improve health awareness; and Ensure adherence to environmental health norms and standards.
The following are some measures of success for the programme:
MEASURES OF SUCCESS FOR THE PROGRAMME
1. % of ART patients visiting the COT health facilities remaining on treatment (monthly)
2. % of children under six year of age vaccinated
3. % adherence by the City to environmental health to norms and standards
4. % increase in the number of health care facilities implementing the boimetrix data management
5. Number of health care professional employed by the city in relation to the city’s population against norms and standards
6. Number of operational ward based health teams
7. % adherence to emergency response times norms and standards
8. Number of Community Emergency Response Team (CERT) members trained
9. Increase in the number of city swimming pools offering swimming lesson
PROGRAMME 5: SAFER CITY
Safety promotion is a responsibility of all stakeholders in the City. Safety in relation to the functions of the municipality includes enforcement of municipal by-laws and road traffic management among others. To build safe communities, an integrated approach is needed, i.e. tackling the fundamental causes of crime through mobilising stat and non-state resources and capacities as well as citizen involvement including co-responsibility. The National Development Plan recognises the need for tailored interventions towards women safety, school safety and child safety and recommends that local government should develop environmental designed aimed at promoting safety for the aforementioned categories of people. Further, in terms of dealing with domestic violence, the NDP recommend that municipalities in collaboration with the Department of Social Development should establish safety shelter for those requiring temporary shelter as a result of domestic violence. The document also highlights the need for infrastructure investment that supports safety such as public lighting, maintenance of public environment, enforcement of municipal buy-laws and increase in community safety and wellness awareness.
On the other hand the Gauteng Safety Strategy of 2015 notes that the GCRO survey revealed that victimisation in Gauteng increased from 20 percent in 2009 to 23 per cent in 2013. The Strategy also notes that migration and increases in population in the province have resulted in the mismatch between the size of the population and the police resources that are available. Whilst the obvious response to this can be to
148

129
increase the number of officers, a more integrated approach is needed. Among these is improving the quality of policing through crime combating strategies, social crime prevention through physical planning and development; deepening community participation; pedestrian and driver education and traffic law enforcement.
In the City of Tshwane, some of the recommendation of both the NDP and the provincial Strategies have been implemented. For an example, in 2014/15 financial year, the city recruited and trained 2000 youths towards being traffic officers. This came through a recognition of the shortage of police. The placement of the 1970 qualified metro police is underway and will be based on crime and safety intelligence that the City has at its disposal. The City has also invested on public lighting particularity in informal areas which are dense and are hard to access towards increasing safety perceptions and to improve surveillance. Recently, technology has been incorporated in crime reporting by communities through the launch of Namuna application and the impact of this is yet to be assessed; the roll out if surveillance cameras has been in place and this is proving to bear fruits in reducing crime where they are deployed. Further, the command control centre has been in operation and this has allowed the Metro police to respond more efficiently than before whilst it employs technology in its operations. No clear intervention have been employed by the City towards reducing and supporting domestic crime victims and there is still a lot that can be done to portray law enforcement in a positive light among school children
The objectives of this programme therefore is to:
Reduce the number of by-law infringements in the city; Increase the level of community participation towards promoting safety; Improve traffic management and road safety; Employ strategies towards addressing the root causes of crime; Strengthen partnerships towards improved safety and security; and Continue to use integrated technological solutions towards crime prevention
and management. The following are some measures of success for the programme:
MEASURES OF SUCCESS FOR THE PROGRAMME
1. Number of school safety cadets
2. Number of drug abusers participating in the in the City’s facilitated rehabilitation programmes
3. Number of school outreach programmes conducted by TMPD on safety
4. % reduction in safety incidents
5. Number of police stations with Metro-police desk
6. Number of community safety volunteers in the City
PROGRAMME 6: EDUCATION PROMOTION AND LEARNING
The education levels of the population in the city are above the national average. The National Development Plan and the Tshwane Vision 2055 places education and learning high on the agenda as a facilitator for personal development and a
149

130
contributor to economic growth. The National Development Plan emphasises the role of early childhood development and access to learning centres towards achieving the education outcomes. Recently, emphasis has been on creating a conducive environment to learn and teach within and outside of school premises. In Gauteng, this is seen through the implementation of digital strategies in schools.
Even with these good intentions and good strategies, the repetition rates among learners have increased between 2009 and 2013 in the province, especially for primary school learners. This could be as a result of a number of factors including poverty, lack of out-of-school support including parental support; high teacher to children rates among others. With this in mind the Gauteng Department of Education has committed to: make 2 years of pre-learning education compulsory; improve performance of underachieving schools; provide adequate access to education facilities through physical investment. Important also, is to ensure that safety nets are provided especially nutritional support to poor families as there is a direct link between nutrition and education outcomes
However, education is not limited to the school going age population, there are still a number of illiterate adults in the city and this may lead to their social exclusion. Importantly is a recognition that learning is a life-long process that needs to be promoted together with languages of the city
This programme therefore seeks to ensure that the City supports the national and provincial education outcomes. One of the ways in which this is done is through promotion of access to quality early childhood development; supporting the province on its digitisation programme, reducing adult illiteracy and promoting leaning through development of libraries and knowledge hubs in the City. Further, the programme emphasises the need for preservation indigenous languages through use in government communications and promoting access to written forms of African languages.
The following are some of the desired outcomes for the programme
Increase in the number of children that complete primary school education; Support Adult Based Education and Training through ward targeting; Increase access to COT free-wifi to public schools; Promote and conserve indigenous languages; and Support Early Childhood centres in the City through financial and other
support. The following are some measures of success for the programme:
MEASURES OF SUCCESS FOR THE PROGRAMME
1. % of people with access to libraries as per the norms and standards
2. Nr of ECD centres supported by the City
3. % increase of active library subscription in the city’s libraries
4. Nr of ECD teachers trained
5. % of public schools that are within the wifi range
150
131
6. Nr of adults receiving ABET through the City’s initiated programmes
7. Nr of African Literature Centres developed
PROGRAMME 7: SOCIAL COHESION AND NATION BUILDING
Tshwane is a culturally diverse city which is a home to people of different backgrounds, language, cultures and economical status. In diversity that the City is celebrating, there needs to be an equalisation through promoting mutual respect, interaction and cooperation among the citizens. Social cohesion cannot be promoted only through efforts of the state; it is the responsibility of families, individuals, religious and community leaders as well as the role of the media to reflect diversity and promote unity in the city. The National Development Plan recognises the role of social cohesion and nation building and highlights the challenge of poverty and unemployment, racism as well as gender based discrimination as key inhibitors to social cohesion and nation building.
The role of sports in promoting social cohesion is emphasised in the Tshwane Vision 2055. This means that the City must take progressive steps towards increasing mass participation in sports, invest in sporting facilities that are accessible to community and strengthen partnerships with sporting fraternity to develop sport in the City. However, sport alone cannot promote cohesion, and therefore supporting arts and culture initiatives is as important in promoting diversity and to achieve social cohesion. The latter has often been seen as a tourism drawcard without looking at its role in educating about the different cultures and ways of life that are in the City. Sadly, in recent years, the commercialisation of arts and culture has also seen the decline in the number of community based initiatives on performance arts and this has excluded a large number of people from this important social interaction. There is also a need to promote diverse language use, particularly the official languages of the City through increasing access to official documentation in more than one language of the city.
This programme therefore seeks to reach the following objectives:
Promote cultural diversity as expressed in language and cultural practices; Promote social cohesion through sport by increasing access to sports facilities
and sporting codes supported by the city; Acknowledge the cross-border integration as a result of migration and
promote the culture to “love-thy-neighbour”; Utilise all forms of media to promote social cohesion and diversity through
partnerships with the media; and Re-introduces performing arts in the townships through support and access to
theatre and theatrical productions. The following are some measures of success for the programme:
MEASURES OF SUCCESS FOR THE PROGRAMME
1. % increase of people within access to sporting facilities
2. Increase in the number sporting events supported by the city
151

132
3. Number of diversity-promotion programmes facilitated by the city
4. Nr of swimming facilities offering Learn-to-Swim
5. Nr of sporting facilities developed by the City
6. Nr of legislated Council documents available in official languages of the city
7. Nr of township theatres developed
Key interventions for 2016/17
Catalytic interventions for programme 1: Social Cohesion Catalytic/ Project / initiative Deliverables for the 2016/21 2016/17 Budget Create an Art Bank to promote local artists
Art Bank completed and operational R1000 000
Intercultural Relations 1 inter-cultural engagements facilitated by the City
OPEX Budget
Catalytic interventions for programme 2: Safer Cities Catalytic/ Project / initiative Deliverables for the 2016/21 2016/17 Budget Integrated Police Management System
E-Policing System in place and operational
R1000 000
Anti-drug abuse
1000 services users rehabilitated, after-care, upskilled and reintegrated in the communities.
OPEX Budget
Catalytic interventions for programme 3: Indigent and Vulnerable Support Catalytic/ Project / initiative Deliverables for 2016/21 2016/17 Budget
Indigent and vulnerable support 60 000 indigent and vulnerable supported
OPEX budget
Indigent exist from the indigent register
2000 indigent households exited from the indigent register
OPEX Budget
Catalytic interventions for programme 4: Spatial Targeting Catalytic/ Project / initiative Deliverables for the 2016/21 2016/17 Budget Provision of social facilities in deprived wards
4 social facilities provided in deprived wards
R
City budget spent in deprived wards
RXXX spent in deprived wards R
Catalytic interventions for programme 5: Food Security Catalytic/ Project / initiative Deliverables for the 2016/21 2016/17 Budget Provision of food support to vulnerable households
2 000 households having food packages monthly
OPEX
Urban Agriculture 50 urban agriculture project supported by the city in deprived wards
OPEX budget
152

133
Catalytic interventions for programme 6: Healthy Living Catalytic/ Project / initiative Deliverables for the 2016/21 2016/17 Budget HIV/AIDS testing and access to medication
90% ART patients visiting the City’s facilities remaining on treatment
OPEX budget
Healthy living promotion 8 healthy living initiatives conducted together with private sector and NGOs
OPEX budget
RISKS AND MITIGATION
Risk / Challenge Mitigation Strategy
Limited Funds Consolidation and rationalization according to a more coherent service footprint and targeting areas where greatest impact will be felt Automation of certain processes to reduce need for labour, e.g. Booking of social facilities
Unfunded mandates/ programmes
Reassignment / prioritization of resources where possible, rescinding of programmes where focus of the City has shifted due to context or policy
Synergy within the three spheres of government
Continue engagement and alignment processes; participate wherever possible in crosscutting forums and drive programmes at political level with administrative support. Invite national and provincial partners to participate in City processes and sign delivery agreements. Consistently update procedures based on new legislation.
Theft/ Fraud/vandalism of public property
Where needed provide security upgrade and this needs to be supplemented with community participation (Councillors taking more responsibility) and taking demonstrative legal action against vandals. Enforcement of disciplinary code such that supervisors are ensuring frontline assets are managed responsibly (specifically in terms of managing insurance risk).
Compliance to legislation Ensuring compliance with new requirements whilst tracking compliance costs carefully (specifically challenging with regards to staffing requirements for social facilities such as clinics, ECD centres etc.
Financial dependency on the City by targeted groups
Emphasis on beneficiary transformation as a programme principle in for all social support programmes.
153

134
OUTCOME 5: AN AFRICAN CAPITAL CITY THAT PROMOTES EXCELLENCE
AND INNOVATIVE GOVERNMENT SOLUTIONS
Introduction
Outcome 5: “An African capital city that promotes excellence and innovative government solutions with the aim of formulating and implementing innovative governance solutions to tackle the triple challenge of poverty, inequality and unemployment”.
This outcome is about the City of Tshwane as an African capital city of excellence. It is about ‘smart governance’ and the human elements of ‘smart people.’ Smart
governance requires that the City be transparent, ensure participatory decision-making, and work with its partners to deliver quality services. This will require that the City has access to human capital with the skills, competence, and developmental attitude needed to drive Tshwane Vision 2055.
Tshwane Vision 2055 is very bold on what needs to be done with regards to this outcome. In relation to the 2016/21 term of office, the Vision states that by 2020 the City would have completed planning for the transition. A new approach in addressing the triple threat of poverty, inequality and unemployment would have taken hold and communities would be working together to tackle poverty and inequality but in the same time the continuation of planning for low carbon infrastructure development and investment. This will be supported by government solutions which are innovative and supported by institutional and human capacity, allowing for improved representation of communities in the City processes. The Vision realises that to achieve greater impact and sustainability, effort from civil society, private sector and academia will be required.
This outcome strategy has identified the following programmes towards achieving the goals for the first decade of game changing:
ICT infrastructure and capability; Citizen care and customer centricity; Operation Clean Audit; Institutional efficiency; and Revenue maximisation and financial management.
The following sections of this Outcome Strategy will look into the detail contextual factors for the outcome which need to be addressed. Reference on this will be from the Tshwane Vision 2055 Discussion Document and the approved Tshwane Vision 2055 long term strategy document. It will also reflect on what the City has done in line with the outcome and this will be summarised to reflect the interventions of the City in relation to other key strategic framers such as the National Development Plan, provincial initiatives, 2011 and 2016 local government manifesto among others.
154

135
The final section will then present proposed programmes that bridge the gap between what’s been done and what need to be done and provide a conceptual consolidation of existing programmes as it relates to the outcome. The final section will also identify the dependencies and cross cutting issues that need to be considered toward achieving the intentions of the outcome.
Outcome 5: Context
The City of Tshwane has experienced unprecedented economic growth, urbanisation, migration as well as geographic expansion in the past two decades. Besides this growth, the City in 2011 became the 3rd largest city in the world in terms of geographic area with the incorporation of the previous Metsweding region into the City of Tshwane. This has placed the City in a position where it have to provide services and governance to a population of over 3 million people which is mainly concentrated in a geographically very large area. The largest part of this is home to previous disadvantaged communities as a result of the previous apartheid planning. There is also a large rural component within the city which poses a challenge in the provision of services to the residents of these areas. In responding to these challenges, realistic solutions and programmes are proposed for governance of the city.
Addressing social and spatial inequalities: Some of the communities above still do not have access to the same level of basic services as the developed areas and the continued spatial concentration of poverty, and underdevelopment in these previously disadvantaged areas require deliberate governance intervention and public expenditure to redress this. Matters such as dealing with the ever increasing development of gated communities which is not conducive to social integration and work against the principle of class integration.
Creating a better life for all: the access to and provision of basic services is one of the core mandates of local government. Improving the quality of lives of the poor is embedded in the access to these services. Further to this is the continued provision and maintaining of high quality services to the users in the city. This will not only ensure the competitiveness of the City in terms of ensuring continued investment as discussed in outcome 2, but also ensure that users will pay for services of high quality, thereby contributing to the financial sustainability and ensuring a financial
resilient city.
To be competitive the City requires strong and visionary leadership. The foundation laid over the last decade of a well governed and managed institution, will be consolidated and build on to form the basis for an institution which will be representative and inclusive of all groups in civil society with accountability, integrity and transparency. To be competitive the City will continue to provide infrastructure in the form of water, sanitation, electricity, waste removal and disposal, safety initiatives to improve safety in the city. This will ensure that the City attract investment and create capacity to fund capital expenditure requirements.
155

136
The City of Tshwane does not only perceive this interconnectedness as a governance problem, but also as an opportunity to address the very same issues confronting us. We also acknowledged that the 21st century governance challenges facing the City require both vertical and horizontal approaches between all stakeholders in order to improve the quality of life.
For the City to keep its competitive advantage it needs to be well managed and for this, various alternative service delivery and urban management models will be explored. This will contribute to the City departments to deliver better on its constitutional mandate to provide democratic and accountable local government for local communities and contribute to entrenching a customer-centric approach to
development responding to its constitutional responsibility as set out in Section 152 of the Constitution to:
Provide democratic and accountable government for local communities; Ensure the provision of services to communities in a sustainable manner; Promote social and economic development; Promote a safe and healthy environment; and Encourage the involvement of communities and community organisations in the
matters of local government.
Participation in the BRICS agenda and advancement of the GCR is an important step for the City. This will provide opportunities for the City in the emerging powers and BRICS economies. The City will have to pay more attention in providing an environment for improved conditions to do business. The review of the regulatory burden and red tape will assist the City to advance its competitiveness and sustain its position as the “Gateway to Africa”. The strengthening of its relationship with
higher education and research and development institutions will assist the City in contributing towards the GCR economy as well as cross border opportunities.
TSHWANE VISION 2055: 1ST DECADE OF GAME CHANGING FOR OUTCOME 5
The Tshwane Vision 2055 recognises that for the City to promote excellence and innovation it need to revisit its governance approach and work with citizens and leadership in all sectors of society to successfully achieve it. Together all must work towards an approach of capacity building, alternative service delivery models and skills development and training. Through this Outcome, the City aims to achieve the following within the first decade of game changing:
Addressing social and spatial inequalities through a programmatic approach to service delivery;
Creating a better life for all by internal capacity development and partnerships; Creating a competitive City through strong and visionary leadership; Developing a capable and developmental City that is responsive and accountable
156

137
Ensuring a financially resilient City; The City’s capacity to fund capital expenditure requirements; Building a reputable City through applying high ethical standards; The City’s participation in BRICS agenda and advancement of the GCR; and Leading the agenda of broadening participation and empowerment of residents in
City governance processes.
These principles must, by the terms of the roadmap be translated into practical operational plans that can be measured, monitored, evaluated and corrected where necessary. In so doing, it will demonstrate how the long-horizon principles of the Tshwane Vision 2055 will find expression in the annual business plans and the day-to-day operations of the various departments within the cluster and entities. These annual plans will have to evolve over time to meet the transformative demands of the Tshwane Vision 2055.
The City maintains its commitment to continue focusing on addressing poverty, unemployment and inequality
The table below summarises what has been done by the City to respond to the challenges outlined above as well as the Tshwane Vision 2055.
Table 5.1: Summary of the City’s interventions for the Outcome
Tshwane 2055 Strategic Actions Assessment of the City’s Interventions: 2011/16
Innovative Government solutions The City have initiated the roll-out of broadband infrastructure with the aim to
create smart technology and communications
Implemented various e-services and modernized processes within the City
The City has implemented the free Wi-Fi programme in various locations across
the city with a focus on tertiary education institutions and is also providing it in the
A re Yeng rapid transport system in operation.
Financial management Sustainable procurement in gaining momentum
Acceptable collection levels
Increased expenditure on maintenance of infrastructure
Credit rating although negatively influenced by the National rating has been stable
Customer centricity Integrated electronic customer complaint centre established and operational
Regional Operations Centre established
Implemented the Regionalisation model to improve services to customers
Governance Established various governance structures such as Oversight committees, MPAC
and Audit Committee
Unqualified Audit opinion from the Auditor General
Anti-Fraud and corruption policy implementation
Leadership development Human capital management
Skills development plan implemented supported by induction and staff training
Embed a culture of quality - Conducted an organisational diagnostic creating a
baseline
157

138
PROPOSED PROGRAMMES FOR THE OUTCOME
This section presents the proposed programmes to respond to the outcome challenges and the Tshwane Vision 2055 aspirations as presented above. Each programme presented outlines the following:
Overall objective of the programme; Alignment of the programme to the Outcomes of the Vision; and Interdepartmental issues that need to be considered by the City in implementing
the programme. For Outcome 5 the following programmes are proposed:
PROGRAMME 1: BUILDING UP A KNOWLEDGE CITY
This programme focuses on expanding broadband infrastructure across the city to ensure deployment of
smart technologies and free Wi-Fi across the City
PROGRAMME 2: CUSTOMER CENTRICITY
The programme focuses on ensuring that interaction with customers is provided within norms and standards of the city in line with Batho Pele principles to improve customer experience
PROGRAMME 5: INNOVATIVE GOVERNMENT SOLLUTIONS
This programme seeks to improve the financial position of the City to improve bankability and creditworthiness. This
will enable improvement on the ability to fund capital expenditure to continue to roll out and maintain infrastructure and
services
PROPOSED PROGRAMME AREAS FOR 2016/21 IDP
Building up and Knowledge City
Customer centricity
Institutional efficiency
Financial sustainability
Innovative Governance solutions
PROGRAMME 3: INSTITUTIONAL EFFICIENCY
This programme focuses on the rollout and Operationalisation of
the approved institutional structure and capacitation of the staff complement through skills
development to deliver a professional customer centric approach and to build ethical
public leadership
PROGRAMME 4: REVENUE MAXIMISATION AND FINANCIAL
MANAGEMENT
This programme seeks to improve the financial position of the City to improve bankability and creditworthiness. This
will enable improvement on the ability to fund capital expenditure to continue to roll out and maintain infrastructure and
services
Political focus areas, new catalytic projects
Strategic Objective 5: Improve financial sustainability
Strategic Objective 6: Continue institutional development, transformation and innovation
158

139
PROGRAMME 1: BUILDING UP A KNOWLEDGE CITY
The programme is necessitated by the fact that the City need to shift towards smart electronic business services and communication with its customers. To be able to be cost effective in the services the City renders, it must ensure that the supporting infrastructure and systems are in place. Free Wi-Fi is becoming an essential service to communities and it allows the youth and unemployed to access the market place and social media which has become an important communication tool in society. The implementation of this programme will create a platform for the City to interact with its customers in an innovative manner.
The programmes seeks to ensure the following:
That the City deliver services in an innovative, reputable and smart basis; That the City strengthen its competitive advantage in the province and country; That the City deliver on its mandate in an responsive and accountable manner; That the City become a financial resilient city; That the City place the residents at the centre of its development agenda
regardless of their status in society, gender and religion; and To improve conditions of doing business through smart technologies and within a
conducive environment where the regulatory burden and red tape is minimised. The following are some of the measures of success for the programme: MEASURES OF SUCCESS FOR THE PROGRAMME
1. Increase in the total area of the city covered by broadband infrastructure
2. Increase in the capacity and “uptime” of the server capacity of the City
3. Increase in the provision of free Wi-Fi connectivity across the city
4. Number of smart services developed and implemented
For the success of the programme to be achieved, the City needs to take into consideration the following actions emanating from the 5 other Outcomes of Tshwane Vision 2055:
Roll out of smart water and electricity meters in all areas; and Targeted engagements with the strategic stakeholders and citizens to facilitate
their awareness of their rights and participation in the City’s decision making
processes.
PROGRAMME 2: CUSTOMER CENTRICITY
This programme focuses on ensuring that interaction with customers on services which are provided are at the highest standard to ensure satisfaction levels of residents on the services are improved. The achievement of a clean audit for the City in both financial and performance objectives with no emphasis of matter and strategic risk register is developed and implemented.
The objectives of the programme are as follows:
159

140
Operationalization of the customer complaint system; To improve the participation of city stakeholders and communities in the decision
making processes of council; To ensure clean financial management and sustainability; To ensure all strategic risks are managed and addressed; Provision of sustainable services to customers and residents; and Capacitation of the institution to serve its customers in a customer centric
approach. The following are some of the measures of success for the programme: MEASURES OF SUCCESS FOR THE PROGRAMME
1. An efficient, effective and development oriented public service and an empowered, fair and inclusive citizenship
2. Improving front line user satisfaction level
3. Improving Responsiveness and turnaround times Indicator
4. Improving facilities usability and visibility
5. Improving the proficiency of staff to render frontline service
6. Increasing accessibility of services at frontline
To achieve this the City will need to identify partnerships with the private sector and institutions of higher learning and research and development to assist the development of the City to become one of excellence and innovation in the way it deliver services.
PROGRAMME 3: INSTITUTIONAL EFFICIENCY
This programme focuses on the rollout and operationalisation of the approved institutional structure and capacitation of the staff complement through skills development to deliver a professional customer centric approach and to build ethical public leadership
The objectives of the programme are therefore as follows:
To skill the City’s workforce to create a professional public service which are aware of the developmental challenges in the city;
To establish partnerships with external institutions to improve skills development; and
To become an institution of excellence in all levels of operations thereby improving customer satisfaction.
The following are some of the measures of success for the programme: MEASURES OF SUCCESS FOR THE PROGRAMME
1. WSDP implemented
2. Training programmes developed to improve customer centric services
3. Training programmes developed and implemented to create a professional public service to be aware of developmental challenges
4. Frontline staff trained on customer centricity
160

141
5. Functionality of institutions performing oversight on the City such as MPAC
6. Partnership agreements with skills development entities to assist in skills development
7. Staff trained in identified core skills through partnership agreements
8. Roll-out of performance management to all levels within the institution
PROGRAMME 4: REVENUE MAXIMISATION AND FINANCIAL MANAGEMENT
This programme seeks to improve the financial position of the City to improve bankability and creditworthiness. This will enable improvement on the ability to fund capital expenditure to continue to roll out and maintain infrastructure and services.
The objectives of the programme are therefore as follows:
To improve the efficiency levels of infrastructure development and maintenance; To improve the bankability and credit worthiness of the City; The development of strategic tariffs to support revenue enhancement
programmes; Alignment of the strategy and budget processes; and To undertake expenditure revenue with inter alia the support of rolling out smart
meters to support revenue collection. The following are some of the measures of success for the programme: MEASURES OF SUCCESS FOR THE PROGRAMME
1. Improvement in the credit rating of the City
2. Achievement of financial targets
3. % collection rate across all services
4. % increase in capital budget for the development of economic infrastructure
5. % increase in budget allocated towards refurbishment of infrastructure
For the success of the programme to be achieved, the City needs to take into consideration the following actions emanating from the 5 other Outcomes of Tshwane Vision 2055:
Roll out of smart water and electricity meters in all areas; Development of infrastructure maintenance plans; Development of alternative service delivery mechanisms; and Green economy strategy development and implementation.
PROGRAMME 5: INNOVATIVE GOVERNANCE SOLUTIONS
This programme focuses on creating an ecosystem for innovation in the City from which the City will tap on to access new solutions that will radically transform service delivery and embedding a culture of quality and innovation in the City thus positioning the City as the knowledge hub for Africa.
The objectives of the programme are therefore as follows:
161
142
To create and embed a culture of quality and innovation in the City; To establish an innovation ecosystem in the City through partnerships with
knowledge institutions from which the City can tap on; To create a hub where knowledge is generated, shared and commercialised for
competitiveness of the City; and To implement innovative solutions that will transform service delivery. The following are some of the measures of success for the programme: MEASURES OF SUCCESS FOR THE PROGRAMME
1. % improvement on Innovation Capability Index( every 2 years)
2. Nr of active partnership agreements with knowledge institutions.
3. Nr of young people benefiting from innovation programmes in the City.
4. Nr of solutions piloted in the City.
5. Nr of Departments where the Quality Management System has been implemented and maintenance.
Key interventions for 2016/17
Programme 1: Building up a Knowledge City Key intervention Activities for 2016/17 2016/17 Budget
Fastrack Roll-out of
broadband and Fiber to the
home
Broadband rolled out Capex
Expand Roll-out of Free WifI Additional sites completed and active Capex
Expand the rollout of E-
services supporting the smart
City
Focus on business process within City planning
Department
Capex and opex
Introduce Fiber to the Home Broadband rolled out Capex
Programme 2: Customer Centricity Key intervention Activities for 2016/17 2016/17 Budget
Create a single and seamless view of a City customer
Revamp the current CRM systems and integrate them
Capex and opex
Customer segmentation Framework approved and implemented Opex
Customer centricity and change management
Effective CRM with improved turnaround times Opex
CRM quality assurance CRM Quality assurance fully implemented Opex
Programme 3: Institutional efficiency Key intervention Activities for 2016/17 2016/17 Budget
Development and approval of WSDP
WSDP developed aligned to outcome plans Opex
Clean audit Ensuring MLAP functionality to support operation clean audit processes and functionality of oversight institutions
Opex
162

143
Front line staff training Identification and implementation of front line staff training
Opex
Programme 4: Revenue maximization and financial management Key intervention Activities for 2016/17 2016/17 Budget
Expand the rollout of Mmogo
re a Gola
Implement second phase of Mmogo Re A Gola
on being a responsible citizen
Opex
Fastrack rollout of SCOA Go live Opex
Improve collection levels 150 000smart prepaid meters rolled out Capex
Ensure value for money when
procuring
Perform a value for money review to identify
inefficiencies
Opex
Programme 5: Innovative government solutions Key intervention Activities for 2016/17 2016/17 Budget
eKasi Labs Programme (Build capacity for innovation and entrepreneurship in townships)
Implement programme in Region 6 and Region 3 Capex and opex
Fablab Programme (Build capacity for innovation and entrepreneurship in schools )
Implement programme in Region 6 and Region 3 Opex
Implement a Business Intelligence System
Approved Strategy and Pilot in two areas.
Innovative Solutions Identify and pilot 2 innovative solutions campaigns
Innovation Campaigns Implement 2 innovation Campaigns to drive new ideas
RISKS AND MITIGATION
Risk / Challenge Mitigation Strategy
Limited Funds Improved credit control and revenue management Development of alternative funding models
Weak operational efficiencies Review operational performance standards
Impact of National credit rating Ensure that financial ratios are met. Investment in new economic infrastructure and maintenance of existing infrastructure to ensure continues delivery of infrastructure
Compliance to legislation Implementation of operation clean audit
Financial dependency on the City by targeted groups
Emphasis on beneficiary transformation as a programme principle for all social support programmes
163

144
OUTCOME 6: SOUTH AFRICA’S CAPITAL WITH AN ACTIVIST CITIZENRY THAT
IS ENGAGING, AWARE OF THEIR RIGHTS AND PRESENTS THEMSELVES AS
PARTNERS IN TACKLING SOCIETAL CHALLENGES
Introduction
Outcome 6: “South Africa’s Capital with an active citizenry that is engaged, aware of
their rights and presents themselves as partners in tackling societal challenges”
consolidates the work which the City need to do in response to the Constitutional mandate of organising local government which is not only participatory in nature but also accessible to local communities. The role of local government has changed over the last two decades from being a service delivery platform to one which is now the space where society expresses their dissatisfaction with the matters which belong at National and Provincial level. It has also become a space in which political activities are being performed. The focus of local government therefor needs to shift from being compliant driven model to being a community engagement model.
To realise the above initiatives and to allow community and stakeholder engagement the City need to review its approach to citizen interaction and engagement. Besides the operationalisation of ward committees it requires a new and differentiated approach to allow for the establishment of platforms through which civil society, business and other key stakeholders will be able to participate in the planning and implementation processes of the City.
Guiding principles and Legislative Context relevant to Outcome 6
The following are the identified pieces of legislation which are relevant to Outcome 6, they include but not limited to:
Constitution of RSA of 1996 - Section 152 [3] of the Constitution compels municipalities to encourage the involvement of communities and community organisations in the matters of local government;
Municipal Systems Act 32 of 2000 - The Act also compels municipalities to develop a culture of municipal governance that complements formal representative government with a system of participatory governance and for this purpose must; and
Encourage and create conditions for the local communities to participate in the affairs of the municipality including in the preparation, implementation and review of its IDP and budget; as well as in the strategic decisions relating to the provision of municipal services.
This requires the municipality to involve communities and stakeholders in all services being rendered by them. Historically communities and stakeholders have mainly been involved in the IDP and budget processes but not in the basic delivery of services where it happens on the ground. Alternative participatory initiatives will have to be developed to establish platforms through which this can take place.
164

145
Intergovernmental Relations Framework Act of 2005 (IGR Act) - This Act encourages municipalities to establish intergovernmental forum in order to promote and facilitate intergovernmental relations between the municipalities within a district / region. The forum is meant to serve as a consultative structure for municipalities to discuss and consult each other on matters of mutual interest.
Tshwane Vision 2055 is descriptive about what needs to be done with regards to this outcome. In relation to the 2016/21 term of office, the Vision states that by 2020 the City would have completed planning for the transition. A new approach to addressing active citizenry will be the establishment of dialog networks and participatory mechanisms which will be resilient and contribute to successful implementation of Vision 2055 by all. The Vision realises that to achieve greater impact and sustainability, effort from civil society, private sector and academia will be required.
This outcome strategy has identified the following strategic actions towards achieving the goals for the first decade of game changing:
Strengthening dialogue networks with civil society, community organizations and the private sector;
Strengthen participatory mechanisms currently in place; Explore alternative active citizenry models and implement; Development of policies that promote inclusiveness and aimed at bridging the
urban divide; Support informal structures that are found in communities that are aimed at
tackling societal challenges; Become more gender sensitive and protect the rights of children and youth
through targeted spatial interventions in marginalised communities; Ensure coordination of the three spheres of government to ensure the rights
of the residents; Developing a shared vision about promoting the right to the City; and Deliberate efforts to invest in human capital.
Outcome 6: Context
The City of Tshwane attracts people to its geographical space both for economic reasons and also for reasons that has to do with the concept of urban life. For those who move to the City as a response to the wave of urban life, the economic consideration such as material interest is not an immediate drive. In a sense, economic progress that is experienced outside the City gets to the levels where its bearers believe it should better be expressed in the City space; hence they subsequently move to the City as an ideal space to express their economic prosperity.
The City of Tshwane is therefore confronted with the reality of residents who are not only diverse in their culture, but are also at different levels of social and economic
165

146
development and different political views. Planning is an expression of future vision; however it has to take off from the given conditions of the present diversity among City residents to inform this future. The most basic question for the City to consider is what model of governance would support the implementation of Tshwane Vision 2055 while inspiring citizens’ confidence in the City among a diverse population.
This Outcome is important because there is often an assumption that the clarity of the grand vision of an entity will sustain its implementation. This idea does not consider the challenge that, for a great idea to live up to its full implementation it requires that there is a process in place to manage expectations. Building active citizenship forms a central principle of South Africa’s National Development Plan
(NDP) 2030. It proceeds from the dual nature of the relationship between governments and citizens which is, that while it is the responsibility of governments to provide certain basic services to the citizens, the success of such interventions will depend on the cooperation of citizens. This is an important shift from the overemphasis on the concept of service delivery. In other words, citizens should not see themselves as external to the delivery of services.
Outcome 6 is therefore about the City of Tshwane creating an environment that strengthens activist citizenry. This outcome also embraces elements of smart governance’ and ‘smart people’. Smart governance highlights the attributes of
participatory decision-making that cities need to promote. However, the extent to which the City’s residents participate will also be influenced by factors such as
tolerance of social and cultural diversity, flexibility, creativity as well as participation in public life.
The NDP 2030 also highlights the importance of active citizenry to support development and deepen democracy. Thus, the City of Tshwane cannot merely act on behalf of the people – it has to act with the people, working together with other institutions to provide opportunities for the advancement of all communities. The City needs to ensure that it upholds the central principle of participatory governance and listen to the needs and suggestions of the City’s residents in forging a better and
prosperous life for all in the City.
Tshwane Vision 2055 is very specific with what needs to be done with regards to this outcome. Over the next four decades of game changing the City of Tshwane will work with its development partners to respond to promote the right to the City which is not only meaning access to basic services but means inclusivity in what is taking place within the city which inter alia extends to access to housing, facilities, public goods, environment, political participation, economic development opportunities, education, celebration of diversity (rights of minority groups, gender, cultural rights, individual rights, sexual orientation, age, and race). The City further have the responsibility to promote opportunities to woman, girl children and the youth. On the other hand the various role-players also have a responsibility to participate and contribute to ensure the initiatives are implemented and sustained.
166
147
To strengthen active citizenry for sustainable city development, the City will take a three pronged approach towards achieving this. Firstly a focus should be on voter participation in the political environment. As voter turnout at local government level historically has been lower that that at national and provincial level, programmes to promote the importance of voter participation at local level government level will be implemented. Secondly to establish an institutional approach to political participation. This approach focus on the development of the institutional capacity within communities which will empower them to interact with and benefit from the various planning initiatives. The City will identify strategic partners from all segments of the community and empower them intellectually in terms of skills acquisition and financially in terms of support for their community driven initiatives. Thirdly the City will utilise the capabilities of the electronic media through its broadband capacity to develop an e-government platform which will facilitate greater access to information for all residents and customers. Taking the above into consideration, the City need to ensure its governance models are practical and must aim to balance long term goals with the immediate community demands.
In South Africa’s history it has shown that local government is exposed to the expression of residents and stakeholders in terms of their political struggles which relate more to national government than local. The evolution of local government from an instrument of basic service delivery to a scene for political activities is a phenomenon that cannot be reversed. It can only be catered for through institutions. Further, this is a bottom up phenomenon driven by communities and failure to appreciate this would lead to a crisis of legitimacy at local government level. The City need to set processes in place to respond to the changing face of local
government governance.
A further matter that will be addressed is to create an environment in which citizens understand the structures through which they can engage in, to address their concerns. The City will continue to implement campaigns to educate citizens on their role within the various communication structures which allows them to interact and participate in the affairs of the City. The renewal and establishment of structures inter alia such as stakeholder forums and ward committees will contribute to institutional capacitation of communities and ensure that developmental
approaches are rooted within them.
TSHWANE VISION 2055: TOWARDS THE 1ST DECADE OF GAME CHANGING
FOR OUTCOME 6
The Tshwane Vision 2055 recognises that for the implementation of the vision, enduring partnerships and sound sustained coordination between the City and the various stakeholders must be in place. The City aims to be a ‘caring city’ though
provision of high quality of life to all citizens display a sense of sharing, provide comfort and dignity to all citizens and offer solutions that are communally responsive.
167

148
Through this Outcome, the City aims to achieve the following within the first decade of game changing:
Improvement in participatory governance by measuring: o Level of participation through promoting access to and right to the City o Community lead developmental initiatives implemented and sustained o Representation in the City lead planning activities
Active citizenry and sustainable City development.
These principles must, by the terms of the roadmap be translated into practical operational plans that can be measured, monitored, evaluated and corrected where necessary. In so doing, it will demonstrate how the long-horizon principles of the Tshwane Vision 2055 will find expression in the annual business plans and the day-to-day operations of the various departments within the cluster. These annual plans will have to evolve over time to meet the transformative demands of the Tshwane Vision 2055.
The City maintains its commitment to focus on the continuous engagement with stakeholders to foster a collective responsibility and accountability in remaking the capital city.
The table below summarises what has been done by the City to respond to the challenges outlined above as well as the Tshwane Vision 2055.
Table 6.1: Summary of the City’s interventions for the Outcome
Tshwane 2055 Strategic Actions Assessment of the City’s Interventions: 2011/16
Strengthen participatory mechanisms
The City have initiated a process through which civil society is targeted in
the developmental processes
Utilisation of non-traditional stakeholders in the City’s processes through
the use of media and technology (Social media – Digi Imbizo)
Improvement in the regional IDP ward based planning
Enhanced the community participation in planning processes by
responding to ward needs identified
Reviewed policy relating to the establishment and functioning of ward
committees
Gender sensitive society Defined targets around gender issues to implement Gender
mainstreaming
Promoting the right to the city Continued implementation of the City’s language policy
Continued promotion to make citizens aware of their rights
LINKAGE BETWEEN OUTCOME 6, STRATEGIC OBJECTIVES AND
PROGRAMMES
168

149
In order to implement Tshwane Vision 2055, the six IDP Strategic Objectives (SO) have been linked to the relevant Outcomes of the Vision. The SO that have been identified as directly supporting Outcome 6, is SO 4: “Promote Good Governance
and Active Citizenry”.
To facilitate implementation of the Outcome and the identified SO, the following programmes have been proposed and a set of key success measures have also been identified to measure the progress of achieving the outcome.
PROGRAMME 1: CIVIC EDUCATION
This programme focuses on ensuring the basis of citizen participation in the affairs of
the City is operational. This include the functionality of ward committees and
strategic stakeholder forums to allow for meaningful participation in the City’s
processes and programmes. The programme focuses on the following:
To provide preventative civic education to communities, promote fundamental rights and freedoms; and enhance a participatory democracy culture;
PROGRAMME 1: CIVIC EDUCATION
The programme will work towards making the City of Tshwane residents aware of their rights and how the legal system can be used to protect them but also their responsibility as part of society. This will inter alia cover the following:
Functionality of ward committee structures and understanding their roles and responsibilities
Various stakeholder forums such as Religious, Business, NGO’s and CBO’s established and functional as representatives of the broader civil society
PROGRAMME 2: DIGITAL CITIZEN PROGRAMME
This programme aims to build on the current ‘smart city’ and smart citizen’s opportunities (e.g. free Wi-Fi and broadband). This will inter alia cover the following:
Establishment of various electronic platforms to allow citizens to interact with the City digitally
The success of this is dependent on the functionality of the components contained in programme 1 as well as the availability of resources to successful implement the digital environment
PROPOSED PROGRAMME AREAS FOR 2016/21 IDP Strengthen participatory mechanisms currently in place
Explore alternative active citizenry models to implement
Strategic Objective 4: Promote good governance and active citizenry
Political focus areas, new catalytic projects
169

150
Creating community awareness of their rights and responsibilities in relation to municipal governance;
Training and capacitation of citizens on their rights and responsibilities; Radicalise Project Community Liaison Framework - Participation of citizens in the
implementation of developmental projects and programmes; Deepening local Democracy - Operational support to ward committees and
stakeholder forums; Community expression spaces at existing multipurpose facilities, libraries, etc;
and Spatial Justice Promotion.
The following are some measures of success for the programme:
MEASURES OF SUCCESS FOR THE PROGRAMME
1. Nr of initiatives implemented to make citizens aware of their rights
2. Execution of citizen survey to measure awareness, participation and interaction with the City
3. Functionality of ward committees
4. Training of newly instated ward committees
5. Nr of annual corporate projects (CSI) implemented as part of the IDP
6. Nr of strategic stakeholder forums established and functional
7. Increased levels of engagement with Traditional Authorities
The above measures will be supported through the implementation of the following programmes:
Democracy for all – this programme will focus on the education and capacitation of communities on the principles of democratic governance and equality;
Councillor and ward committee training – this programme will focus on the training and capacitation of ward committees to ensure functionality; and
Review of MOU between CoT and the two traditional councils - to explore better working relationships and to confirm rules of engagement and responsibilities.
The Citizenry’s understanding of their rights and responsibilities would assist in laying a foundation for their participation and meaningful engagement with the City on its plans and programmes. For this a focussed curriculum will be developed to train and capacitate relevant staff to roll out the initiative.
Ward committees play an important link between the City and its communities at ward level but also communities at large. The functionality thereof is therefore important in the planning and budgeting process. Their role should however not be limited to the IDP and budget process but they should be involved in all other processes relating to operational and capital projects and programmes be it City or private sector driven, which is taking place in the wards.
Supporting the initiative of ward committees and stakeholder forums to be functional and operational, the broader sense the understanding by citizens of their rights as well as their responsibility within society need to be enhanced. This will happen
170

151
through the capacity building and awareness initiatives of communities to develop institutional capabilities within these structures. Increased engagement with the two traditional authorities will further assist in improved coordination and implementation of projects and programmes in their respective areas.
PROGRAMME 2: DIGITAL CITIZEN PROGRAMME
This programme focuses on building on the current ‘smart city’ concept and to develop participation models with the focus on creating digital communication platforms to deepen participatory in governance through various media forms. The use of the electronic and social media has become globally the new approach to communicating and interaction in society. Projections indicate an exponential growth in the utilisation of the electronic media in the next ten years. The City, through the rollout and implementation of broadband and free WiFi laid the foundation for creating digital platforms and e-governance solutions which will improve communication internally and externally with stakeholders and communities.
The following are some measures of success for the programme:
MEASURES OF SUCCESS FOR THE PROGRAMME
1. Nr of digital platforms established to allow citizens to interact meaningful with the City
2. Nr of digital engagements and communities reached
3. % improvements in citizens’ satisfaction levels on services delivered
4. Nr of initiatives implemented to increase the access for citizens to form part of the municipal operations
5. % increase in community media usage for engagement with communities
The above measures will be supported through the implementation of the following project:
Development digital platforms – this programme will focus on development and operationalization of additional digital platforms through which citizens and stakeholders can interact with the City.
For the city to be accessible to its communities and to create an environment in which stakeholders, customers and residents can actively participate in initiatives that take place within the city, the current forms of stakeholder engagements need to be improved. The creation of a digital environment in which residents and other stakeholders can raise their developmental issues constructively, but also to interact with the City on a frequent basis will contribute to the realisation of this outcome.
For Vision 2055 to be realised, the role of civil society is just as important as that of government in tackling issues of unemployment, poverty and underdevelopment and need to be strengthened. Partnerships need to be established between theses role players to collectively deal with these matters. Access to the City can only be realised if role players across all sectors of society play a constructive role, participate and commit themselves to work together to ensure that democracy is upheld, quality of life is improved and growth and prosperity is achieved. Each role
171

152
player, be it the City, National and Provincial government, residents, the diplomatic community, civil society, business and institutions of higher learning and research, therefore need to play its part in this process as well as commit to the process.
Key interventions for 2016/17
Key Interventions Activities for 2016/17 2016/17 Budget
Democracy for all Initiate process with Department of Basic Education for development and inclusion of curriculum in the school syllabus
Operational R 3 million
Draft and finalise an IGR MOU with relevant National and Provincial authorities on curriculum development and implementation
Resourcing of libraries (schools, provincial and city owned) with material and programmes on democracy – e.g. Constitution and applicable legislation relating to Government with specific reference to Local Government functions and roles of civil society
Councillor and ward committee capacitation and training
Induction of August 2016 elected Councillors
Operational
Election and induction of Ward committee members in all wards
Operational
Review of MOU between CoT and the two traditional councils
Establishment of forum with the two traditional authorities to evaluate current MOU and review to improve working relationship and to review and submit MOU to Council for approval
Operational
Development digital platforms to increase engagement between the City and the citizenry
Investigate and prioritise the establishment of additional digital platforms through which citizens can access and form part of the municipal operations
R 20 million
Further roll out and activation of WiFi sites across the city
R 200 000
RISKS AND MITIGATION
Risk / Challenge Mitigation Strategy
Limited Funds Identification of areas of focus and Consolidation and rationalization of resources targeting those areas where greatest impact will be felt
Poor participation in 2016 Local Government elections
Increased awareness initiatives to create an environment in which citizens understand the structures through which they can engage in to address their concerns. The City will continue to implement campaigns to educate citizens on their role within the various communication structures which allows them to interact and participate in the affairs of the City
Unfunded mandates/programmes Reassignment / prioritization of resources where possible, rescinding of programmes where focus of the City has shifted due to context or policy
Synergy within the three spheres of government
Continue engagement and alignment processes; participate wherever possible in crosscutting forums and drive programmes at political level with administrative support Invite national and provincial partners to participate in City processes and sign delivery agreements Consistently update procedures based on new legislation
172

153
Key priorities for 2016/17 IDP
During March 2016 the City discussed priorities for the 2016–2021 term of office. These are informed by the following, among others:
The need to finalise the projects that were started in 2011–2016; Continued provision of basic services; The limiting financial position of the City; and The need to improve on the City’s performance and monitoring as per the
Auditor-General’s areas of emphasis.
Based on this, the City commits to the following:
Embarking on an aggressive implementation of strategy – consolidating the people’s capital
Mainstreaming pilot projects of the City into funded programmes of the City. These include Tshepo 10 000 and the Kuka Maoto approach to addressing urban management as well as the accelerated formalisation programme, Re Aga Tshwane
Continuing to strengthen the financial position of the City through liquidity improvement: tilting the scale of expenditure to revenue towards financial resilience, to be able to fund future plans of the City
Escalating the implementation of catalytic projects: o West Capital o Caledonian o BPO Park o Power stations
Urgently implementing the accelerated urban management model and realigning functions between the regions and departments as proposed
Replicating successful township revitalisation programmes in the city and developing an approach for township development
Reducing non-revenue water and electricity Completing the upgrade of Temba and Rooiwal Water Treatment Plant and
Reservoir within agreed timeframes Achieving the implementation of TRT infrastructure and increasing ridership
Conclusion
This section has discussed the strategic planning framework for the City of Tshwane and communicated some of the proposed focus areas as well as the programmes for the 2016–2021 term of office. The priorities above informed the development of this IDP and the MTREF for the 2016–2021 financial years and will ensure that the commitment made in the current term is achieved.
173

154
4. GOVERNANCE AND INSTITUTIONAL ARRANGEMENTS
Introduction
On 9 June 2011 the Tshwane Metropolitan Municipal Council adopted a governance model which aims to separate the roles and functions of the legislative and executive wings of the Council. The rationale for implementing the model included the following:
The need to enhance service delivery through improving the institutional arrangements of the City;
Improved oversight of the Council through the development of oversight committees; and
Allowing for an iterative decision-making process in the executive and legislative arms of the Council.
This chapter articulates the City’s broad institutional framework in relation to the governance model and provides details on the roles and responsibilities of the constituents of the model. This includes the outline of the oversight arrangements of the Council, administrative arrangements of the City, both in terms of departments and municipal entities and the regional services model as well the role and responsibilities of the City’s Shareholder Unit.
City of Tshwane governance model
The governance model adopted by the Council at the start of its elected term in June 2011 consists of the legislature, made up of the Speaker of Council, Chief Whip and Section 79 Portfolio and Standing Committees; the executive branch, which consists of the Executive Mayor and members of the Mayoral Committee (MMCs); and the administration, which is led by the City Manager. This model has been implemented and consistently applied in the affairs of the City throughout its term of governance.
The model intends to ensure that the City executes its functions through the leadership of the Executive Mayor while the legislature oversees the activities of the executive branch for transparency and accountability.
The following diagram depicts the City of Tshwane’s governance arrangements.
174
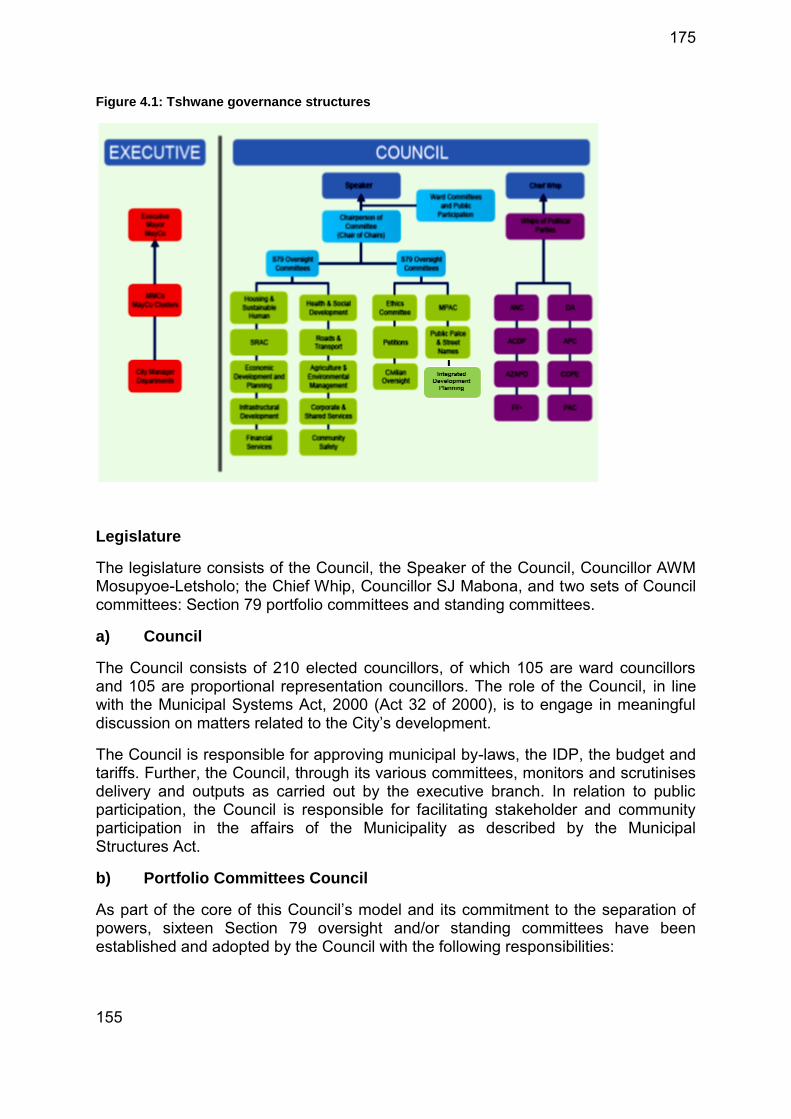
155
Figure 4.1: Tshwane governance structures
Legislature
The legislature consists of the Council, the Speaker of the Council, Councillor AWM Mosupyoe-Letsholo; the Chief Whip, Councillor SJ Mabona, and two sets of Council committees: Section 79 portfolio committees and standing committees.
a) Council
The Council consists of 210 elected councillors, of which 105 are ward councillors and 105 are proportional representation councillors. The role of the Council, in line with the Municipal Systems Act, 2000 (Act 32 of 2000), is to engage in meaningful discussion on matters related to the City’s development.
The Council is responsible for approving municipal by-laws, the IDP, the budget and tariffs. Further, the Council, through its various committees, monitors and scrutinises delivery and outputs as carried out by the executive branch. In relation to public participation, the Council is responsible for facilitating stakeholder and community participation in the affairs of the Municipality as described by the Municipal Structures Act.
b) Portfolio Committees Council
As part of the core of this Council’s model and its commitment to the separation of powers, sixteen Section 79 oversight and/or standing committees have been established and adopted by the Council with the following responsibilities:
175

156
Scrutinising reports referred to them by the Council emanating from the Executive Mayor and/or Mayoral Committee and advising the Council accordingly;
Overseeing the performance of the executive branch and departments on behalf of the Council; and
Providing an advisory legislative role.
The Section 79 oversight committees are chaired by councillors who are designated full-time councillors and these chairpersons are elected by the Council.
The City of Tshwane’s Council has approved the following Section 79 oversight and/or standing committees:
Service Infrastructure; Transport; Housing and Human Settlement; Health and Social Development; Sport and Recreation; Community Safety; Integrated Development Planning; Agriculture and Environment; Economic Development and Spatial Planning; Corporate and Shared Services; and Finance.
The following councillors are Chairpersons of these Committees in the City of Tshwane.
Table 4.1: Chairpersons of committees
Name Committee
Samuel Mashola Community Safety
Refiloe Kekana Finance
Nomthandazo Maseko Sport and Recreation
Aaron Maluleka Economic Development and Planning
Ryder Mokgothadi Infrastructure
Selopi Tlometsane Agriculture and Environment
Joe Mkhize Corporate and Shared Services
Conference Ntuli Roads and Transport
Derick Mosito Housing and Human Settlement
Alphina Ndhlovana Health and Social Development
Johnny Mohlala Integrated Development Planning
Standing Committees
176

157
Standing Committees are permanent committees established to deal with Council-related matters. They are delegated some decision-making powers, and are required to submit reports to the Council. Councillors chair all standing committees, except the Audit Performance Committee, which is chaired by an independent person in line with the prescriptions of the Municipal Finance Management Act, (Act 56 of 2003) (MFMA).
The Standing Committees and their chairpersons are as follows:
Table 4.2: Chairpersons of standing committees of the Council
Chairperson Committee
Oscar Mathafa Municipal Performance Audit Committee
Dolly Ledwaba Civilian and Oversight
Noki Makitla Petitions
Joan Muller Rules and Ethics
Sizwe Mthethwa Public Places and Street Names
Executive Mayor and Mayoral Committee
The Executive Mayor is at the centre of the system of governance since executive powers are vested in him by the Council to manage the daily affairs of the City. This means that he has overarching strategic and political responsibility to do this work. Each member of the Mayoral Committee is responsible for a particular portfolio, as listed below. The Executive Mayor, Councillor Kgosientso Ramokgopa, assisted by the Mayoral Committee, leads the executive branch of the City.
Table 4.3: Members of the Mayoral Committee
Member of Mayoral Committee Portfolio
Petunia Mashaba Agriculture and Environmental Management
Subesh Pillay Economic Development and Spatial Planning
Thembi Mmoko Corporate and Shared Services
Terence Mashego Community Safety
Dorothy Mabiletsa Finance
Eulanda Mabusela Health and Social Development
Joshua Ngonyama Housing and Human Settlements
Jacob Masango Services Infrastructure
Nozipho Tyobeka-Makeke Sport, Recreation, Arts and Culture
George Matjila Transport
Institutional arrangements to improve administration
Over the years the City has improved a number of processes to ensure that the administration of the Council improves its processes through better planning,
177

158
budgeting and reporting. This in turn has enabled the legislature to engage better with the proposals of the administration and thus perform oversight more efficiently.
Among these, is the establishment of the Mayoral Sub-committees chaired by MMCs which have, over the duration of the term of office, allowed for more engagement on the development and institutional plans as proposed by departments. These subcommittees have brought about better interdepartmental planning and have allowed for accountability by departments on Council commitments. The key Mayoral Subcommittees and their constitution are as follows:
Table 4.4: Chairpersons of Mayoral Subcommittees
Member of Mayoral Committee Mayoral Subcommittee
Dorothy Mabiletsa Governance
Nozipho Tyobeka-Makeke Health and Social Development
Subesh Pillay Infrastructure and Planning
Revenue and Performance Committee
In 2013/14, a Performance, Revenue and Expenditure Mayoral Subcommittee chaired by the Leader of Executive Business and supported by the MMC for Finance was established. This structure is tasked with the following:
Monitoring key operational and capital expenditure throughout the financial year to identify risks and develop mitigation measures;
Monitoring the overall performance of the City in line with its approved plans and budget; and
Overseeing the administration processes for planning and budgeting and performing the functions of the Budget Steering Committee as set out in the Municipal Systems Act through the delegation of the Executive Mayor.
This committee has been instrumental in advising the Mayoral Committee on the financial and strategic directives for the 2015/16 financial year.
Municipal entities
Municipal entities are separate legal entities, each headed by a board of directors and utilised by a municipality to deliver services to its community in line with the developmental objectives of the municipality. The City is serviced by three municipal entities which must perform according to service delivery agreements and performance objectives set by the Municipality. The following table lists the entities servicing the City of Tshwane.
Table 4.5: Municipal entities of the City of Tshwane
CEO Entity
Anthony Ngcezula Housing Company Tshwane (HCT)
Zimasa Socikwa (Acting) Sandspruit Works Association (SWA)
178
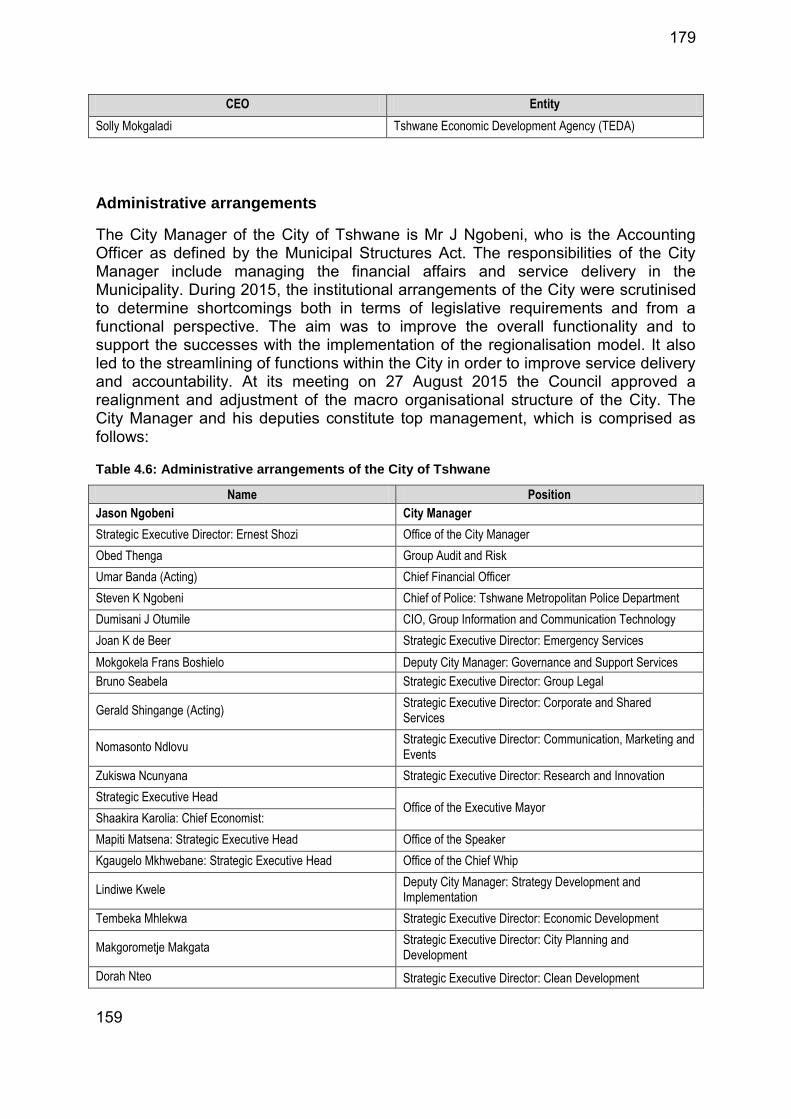
159
CEO Entity
Solly Mokgaladi Tshwane Economic Development Agency (TEDA)
Administrative arrangements
The City Manager of the City of Tshwane is Mr J Ngobeni, who is the Accounting Officer as defined by the Municipal Structures Act. The responsibilities of the City Manager include managing the financial affairs and service delivery in the Municipality. During 2015, the institutional arrangements of the City were scrutinised to determine shortcomings both in terms of legislative requirements and from a functional perspective. The aim was to improve the overall functionality and to support the successes with the implementation of the regionalisation model. It also led to the streamlining of functions within the City in order to improve service delivery and accountability. At its meeting on 27 August 2015 the Council approved a realignment and adjustment of the macro organisational structure of the City. The City Manager and his deputies constitute top management, which is comprised as follows:
Table 4.6: Administrative arrangements of the City of Tshwane
Name Position
Jason Ngobeni City Manager
Strategic Executive Director: Ernest Shozi Office of the City Manager
Obed Thenga Group Audit and Risk
Umar Banda (Acting) Chief Financial Officer
Steven K Ngobeni Chief of Police: Tshwane Metropolitan Police Department
Dumisani J Otumile CIO, Group Information and Communication Technology
Joan K de Beer Strategic Executive Director: Emergency Services
Mokgokela Frans Boshielo Deputy City Manager: Governance and Support Services
Bruno Seabela Strategic Executive Director: Group Legal
Gerald Shingange (Acting) Strategic Executive Director: Corporate and Shared Services
Nomasonto Ndlovu Strategic Executive Director: Communication, Marketing and Events
Zukiswa Ncunyana Strategic Executive Director: Research and Innovation
Strategic Executive Head Office of the Executive Mayor
Shaakira Karolia: Chief Economist:
Mapiti Matsena: Strategic Executive Head Office of the Speaker
Kgaugelo Mkhwebane: Strategic Executive Head Office of the Chief Whip
Lindiwe Kwele Deputy City Manager: Strategy Development and Implementation
Tembeka Mhlekwa Strategic Executive Director: Economic Development
Makgorometje Makgata Strategic Executive Director: City Planning and Development
Dorah Nteo Strategic Executive Director: Clean Development
179

160
Name Position
Mechanism Desk
Mayur Maganlal Strategic Executive Director: City Strategies and Performance Management
Pule Mmutlana (Acting) Strategic Executive Director: Group Property Management
Lisa N Mangcu Deputy City Manager: Infrastructure and Community Services
Mpho Kekana Strategic Executive Director: Health and Social Development
Mthobeli Kolisa Executive Director: Environmental Management
Doctor Tshwale Strategic Executive Director: Sport, Recreation, Arts and Culture
Amolemo G Mothoagae Strategic Executive Director: Housing and Human Settlements
Robert Maswanganye (Acting) Strategic Executive Director: Electricity and Energy
Stephens Notoane (Acting) Strategic Executive Director: Water and Sanitation
Nava Pillay (Acting) Strategic Executive Director: Transport
Imelda Matlawe (Acting) Strategic Executive Director: Tshwane Rapid Transport
Dr Ndivho Lukhwareni Deputy City Manager Service Delivery and Coordination
Nava Pillay (Acting) Strategic Executive Director: Regional Operations Centre
General Manganye Strategic Executive Director: Community and Business
Vacant Strategic Executive Director: Division Rural Economic Initiatives Implementation Coordination
The diagram below shows the City’s organisational structure.
180
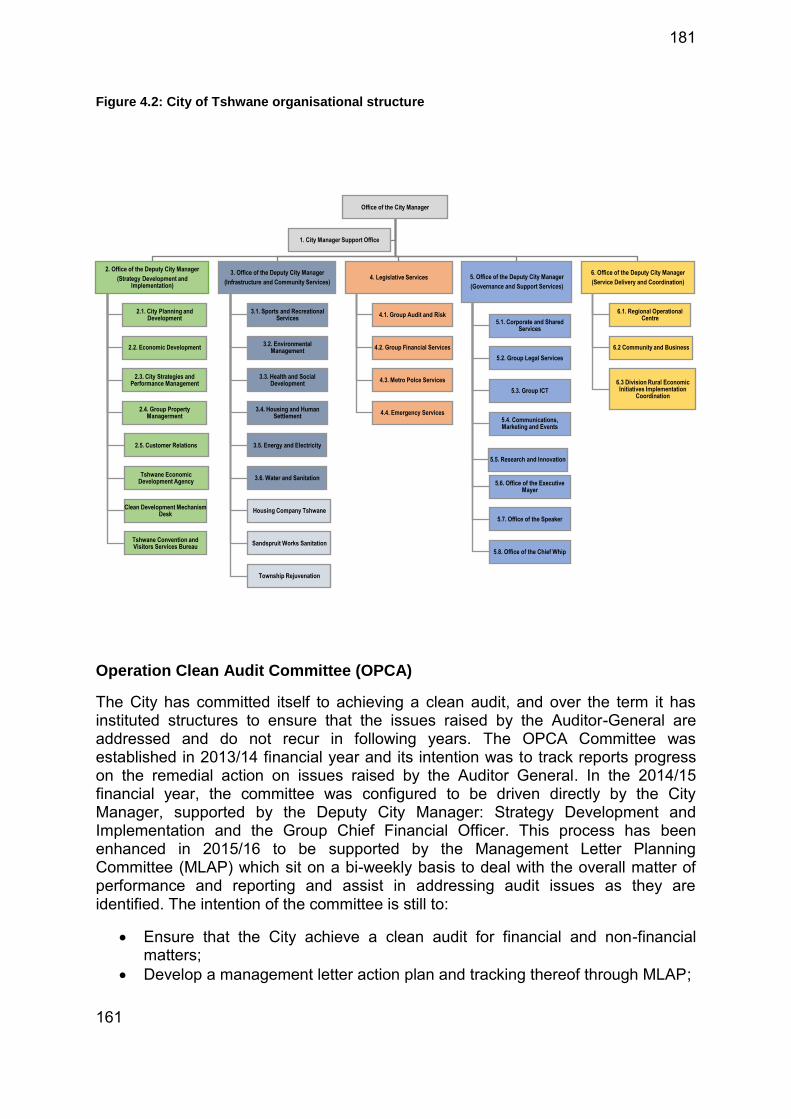
161
Figure 4.2: City of Tshwane organisational structure
Operation Clean Audit Committee (OPCA)
The City has committed itself to achieving a clean audit, and over the term it has instituted structures to ensure that the issues raised by the Auditor-General are addressed and do not recur in following years. The OPCA Committee was established in 2013/14 financial year and its intention was to track reports progress on the remedial action on issues raised by the Auditor General. In the 2014/15 financial year, the committee was configured to be driven directly by the City Manager, supported by the Deputy City Manager: Strategy Development and Implementation and the Group Chief Financial Officer. This process has been enhanced in 2015/16 to be supported by the Management Letter Planning Committee (MLAP) which sit on a bi-weekly basis to deal with the overall matter of performance and reporting and assist in addressing audit issues as they are identified. The intention of the committee is still to:
Ensure that the City achieve a clean audit for financial and non-financial matters;
Develop a management letter action plan and tracking thereof through MLAP;
Office of the City Manager
2. Office of the Deputy City Manager
(Strategy Development and Implementation)
2.1. City Planning and Development
2.2. Economic Development
2.3. City Strategies and Performance Management
2.4. Group Property Managerment
2.5. Customer Relations
Tshwane Economic Development Agency
Clean Development Mechanism Desk
Tshwane Convention and Visitors Services Bureau
3. Office of the Deputy City Manager
(Infrastructure and Community Services)
3.1. Sports and Recreational Services
3.2. Environmental Management
3.3. Health and Social Development
3.4. Housing and Human Settlement
3.5. Energy and Electricity
3.6. Water and Sanitation
Housing Company Tshwane
Sandspruit Works Sanitation
Township Rejuvenation
4. Legislative Services
4.1. Group Audit and Risk
4.2. Group Financial Services
4.3. Metro Polce Services
4.4. Emergency Services
5. Office of the Deputy City Manager
(Governance and Support Services)
5.1. Corporate and Shared Services
5.2. Group Legal Services
5.3. Group ICT
5.4. Communications, Marketing and Events
5.5. Research and Innovation
5.6. Office of the Executive Mayer
5.7. Office of the Speaker
5.8. Office of the Chief Whip
6. Office of the Deputy City Manager
(Service Delivery and Coordination)
6.1. Regional Operational Centre
6.2 Community and Business
6.3 Division Rural Economic Initiatives Implementation
Coordination
1. City Manager Support Office
181

162
Reduce the assets under construction to improve the financial management of the organisation;
Ensure that all supporting plans such as asset plans and IT management plans are in place; and
Create mechanisms to trace progress to monitor progress made by department to resolve the issues raised by the Auditor General in the previous financial year.
Risk Audit Committee
The objective of the Risk Audit Committee is to assist the accounting officers in carrying out their responsibilities related to corporate accountability in relation to risk for the investors, the community and the associated risks in terms of management, assurance and reporting. This entails not only rendering assistance to the accounting officers, but also dealing with risk, improving the control environment of the municipal entities, minimising unforeseen risks and managing risks.
The role of the Risk Committee is crucial to the implementation of a successful risk management programme in the municipal entities. The Risk Committee is an oversight structure that deals with overseeing the full implementation of risk management processes in all the entities.
Moreover, the Risk Committee is responsible for assisting the municipal entities to address their oversight requirements of risk management and evaluating and monitoring the entities’ performance with regard to risk management. Management is responsible for risk management, specifically implementing risk management processes.
The Risk Committee has scheduled quarterly meetings and is chaired by an independent external person appointed by the City Manager. The Risk Committee consists of the following members:
Four independent members; Four Deputy City Managers; Service Delivery Coordination and Transformation Manager; Group Chief Financial Officer; CEOs of municipal entities; Chief of Emergency Services; Chief of Police; Chief Legal Counsel; Chief Risk Officer; and Chief Audit Executive.
The Risk Committee deals with the following reports:
Occupational health and safety report Section 24 results report; Insurance report; Fraud and whistle-blowing incidents report;
182

163
Progress report on investigations; Security management matters in the City; and Strategic risk register for all municipal entities and for the City.
The Risk Committee has developed the Risk Committee Charter.
The Shareholder Unit
The Shareholder Unit (SHU) is tasked with reviewing, monitoring and overseeing the affairs, practices, activities, behaviour and conduct of the municipal entities (MEs) to satisfy the City of Tshwane that the MEs’ affairs and businesses are being conducted in the manner expected and in accordance with the commercial, legislative and other prescribed or agreed norms. It is headed by Zimasa Socikwa.
The SHU will deliver on the above by “getting the balance right”, in other words, through using the principles of enterprise governance, which is defined as follows:
“The set of responsibilities and practices exercised by the board and executive management with the goal of providing strategic direction, ensuring that objectives are achieved, ascertaining that risks are managed appropriately and verifying that organisation’s resources are used responsibly”
Through enterprise governance, the SHU ensures that the entire accountability framework of the MEs to the City of Tshwane is monitored through both dimensions of enterprise governance – conformance and performance – that need to be in balance.
It is important to note that enterprise governance constitutes the entire accountability framework – the conformance dimension takes a historic view while the performance view is forward-looking.
Performance dimension: It reflects the dual role of the City of Tshwane in compliance monitoring (conformance or corporate governance) and strategy implementation (performance or business governance) and acknowledges the short- and long-term tensions between governance and value creation. This dimension also covers the internal workings of the organisation as well as the outward-facing aspects. Lastly, it considers the whole picture to ensure that strategic goals are aligned and good management is achieved.
Conformance dimension: The intention of this dimension is to achieve the following:
Monitoring and reviewing the effectiveness of MEs’ enterprise-wide risk management;
Ensuring composite enterprise-wide reporting on all significant issues affecting the MEs and by default the City of Tshwane;
Monitoring the MEs’ ethical practices; organisational integrity, safety, health and environment practices; and social and transformation issues;
183

164
Ensuring that good and sound corporate governance practices, standards and norms are implemented and maintained with periodical reviews, as well as aligned with best international practice;
Enabling MEs to use the latest management tools relevant to their industries; Ensuring that the interests of the City are protected; Mitigating the risk of duplicating inefficiencies through cross-functional and
cross-sectoral monitoring; Ensuring the establishment, development and review of policies in respect of
the appointment, retirement and rotation of non-executive directors to the boards of MEs;
Assessing the effectiveness of the boards and other governance structures in the implementation of the business and service delivery imperatives of the MEs;
Assessing the cohesion and effectiveness of the board and, where necessary, implementing corrective action such as training and development; and
Coordinating annual general meetings (shareholder meetings) together with the company secretaries.
To date, the Shareholder Unit has ensured adherence to key governance elements, including the review of the shareholder representation policy, board capacitation (executive and non-executive directors), and it has conducted the mid-year budget and performance assessment as required by section 88 of the MFMA and tabled the 2014/15 annual reports of the municipal entities.
In 2016/21, the Shareholder Unit will continue to strengthen governance in the entities through the following actions:
Induction of boards (new non-executive directors); Evaluation or assessment of boards; Convening the annual general meeting (shareholders’ meeting); Ensuring financial sustainability of entities; Reviewing existing policies related to entities (remuneration, governance of
municipal entities, etc); and Reviewing service delivery agreements and shareholder compacts.
Regional services
The City’s regional services model and regional structures are integral parts of its rationale to bring services closer to the people and to transform regions into superb places to live, work and stay; while capitalising on each region’s uniqueness to create strong, resilient and prosperous areas.
With the adoption of the new model, the City was subdivided into seven regions and Regional Executive Directors (REDs) were appointed to head these regions. The purpose of subdivision was, and still remains, bringing quality services closer to the people.
The institutional arrangements in the Regional Services and Transformation Office are as follows:
184

165
Table 4.7: Arrangements for regional service delivery management
Name Function
Nava Pillay (Acting) SED: Regional Operational Centre
Phillemon Mathane Regional Executive Director: Region 1
Godfrey Mnguni (Acting) Regional Executive Director: Region 2
Kgomotso Mohlala Regional Executive Director: Region 3 A
Stanley Maduna Regional Executive Director Region 3 B
Masehe Tebello (Acting) Regional Executive Director: Region 4
Nomsa Mabasa Regional Executive Director: Region 5
Sello Chipu (Acting) Regional Executive Director: Region 6
Persia Makgopa (Acting) Regional Executive Director: Region 7
The regionalisation of service delivery refers to the decentralisation of certain operational and maintenance functions to regional offices led by the respective REDs. While functions such as strategic planning and the implementation of capital projects will remain the responsibility of City departments, daily functions such as maintenance and repairs, information desks, etc will be delivered directly in the different regions through performing the following functions:
Health, social development, sport and recreational services that include: - Health - Social development - Environmental health - Sport - Recreation
Urban management that includes: - Parks and horticulture - Nature conservation - Resorts and swimming pools - Waste management - Cemeteries - Housing and human settlements: rental stock and informal settlements - Urban agricultural and rural development - Land use compliance and by-laws
Roads, storm water and transport services that include the following functions: - Roads and storm water maintenance operations and traffic signs - Reactive maintenance of roads, storm water systems, traffic signs and
road markings Water and sanitation services that include the following functions:
- Water distribution - Waste water collection - Clearing of sewer blockages. - Construction and repair work on sewer infrastructure. - Operation and maintenance of sewer pump stations and reticulation
networks - Repair of water leaks
185

166
- Addressing issues related to no water and low water pressure - Operation and maintenance of water distribution network
Energy and electricity services that include: - Streetlights and distribution operations - Control of electricity systems - Advisory and reporting control services
Customer care, which is divided into the following three sub-sections: walk-in centres, back office and Thusong service centres
The process of regionalisation is in the second of four stages: establishment, stabilisation, consolidation and sustainability. In 2011/16 term of office, the City has seen the establishment of regions and towards the end of the 2011/16 term of office the stabilisation of the function has been realised. In the 2016/21 term of office, consolidation and sustaining of regional services will be achieved.
186

167
5. INTER-GOVERNMENTAL ALIGNMENT
Introduction
This chapter deals with continuous strengthening of intergovernmental relations (IGR). It reflects on the State of the Nation Address, the National Budget Speech, the State of the Province Address, and the Provincial Budget Speech. It highlights some of the key national and provincial frameworks to which the City of Tshwane has aligned the IDP. The City’s responses to the comments provided by the MEC for Provincial Government on the 2015/16 IDP are also provided here.
Background to intergovernmental relations
Intergovernmental relations refer to the complex and interdependent relations between the national, provincial and local governments as well as the coordination of public policies between these three spheres. In essence, this means that the governance, administrative and fiscal arrangements operating at the interface between national, provincial and local government must be managed to promote the effective service delivery.
This is guided by the Intergovernmental Relations Framework Act, 2005 (Act 13 of 2005), which aims to provide, within the principle of cooperative government set out in Chapter 3 of the Constitution, a framework for national, provincial and local government, as well as all organs of state, to facilitate coordination in the implementation of policy and legislation, including the following:
Coherent government Effective provision of services Monitoring of the implementation of policy and legislation Realisation of national priorities
The impact of IGR practice on service delivery arises from the interplay between the formal design elements of the system described above and operational factors that impinge on the implementation of that system (e.g. capacity issues, the budget, the political context, community dynamics, etc). These operational risks are managed by the vertical and horizontal dimensions of IGR. This includes the coordination and supervision duties between different spheres of government, e.g. in relation to concurrency in powers and functions across the three spheres, or the oversight and integration roles within particular spheres of government, e.g. national cluster committees established by the President in 1999 to enhance cross-sectoral coordination.
Ultimately, the effectiveness of the IGR system may be gauged by the extent to which it adds value to effective service delivery, development and good governance across the three spheres of government. This is recognised in the preamble to the Intergovernmental Relations Framework Act, which acknowledges that challenges of poverty, inequality and marginalisation of vulnerable groups and communities are best addressed through “concerted effort by government in all spheres to work
187

168
together and to integrate as far as possible their actions in the provision of services, the alleviation of poverty and the development of our people and our country”.
In the light of the above, intergovernmental planning should in practice do the following:
Facilitate the flow of information between and within sectors in all three spheres of government
Improve the weak IGR between local government and the other two spheres of government
Achieve greater clarity on the obligations of different spheres of government where there are concurrent responsibilities
Give greater attention to the lack of capacity in all three spheres of government
According to sections 24(1) to 24(4) of the Municipal Systems Act (MSA) of 2000 (Act 32 of 2000), the planning of local government must at all times be integrated and aligned with the planning and strategies of the national and the provincial government. In addition, any organ of state which initiates legislation at national or provincial level that affects planning at local government level must first consult with organised local government before the legislation can be duly effected.
The City has guided the IDP’s review of the proposals contained in Tshwane Vision 2055 which has been developed through taking guidance from the National Development Plan. It is also in line with the Gauteng Vision 2055, which is premised on equitable growth, social inclusion and a cohesive society, friendliness to the environment, and sustainability of human settlements coupled with good governance.
State of the Nation Address (SONA), 2016
The State of the Nation Address was presented by President Jacob Zuma to a joint sitting of Parliament on Thursday, 11 February 2016.
In his address, the President highlighted the government’s achievements against the nine-point plan which was unveiled in 2014/15 in an effort to ignite economic growth and job creation; those include the following:
Resolving the energy challenge: About R83 billion was invested in Eskom to support its main power stations (Medupi and Kusile power stations) and to continue with maintenance programmes, which resulted in stabilising the electricity supply.
Incentives to boost investments: Several incentives have been introduced to boost investments in the manufacturing sectors, especially the textile, leather and automotive sectors. The incentives for the automotive sector have attracted investments of over R25 billion over the past five years. They include investments from Mercedes, General Motors, BMW, etc. Multinational companies such as Nestlé, Unilever, Samsung and Hisense have also affirmed South Africa as a regional manufacturing hub by retaining and expanding their investments in new plants.
188

169
Agriculture and land reform: The Agri-Parks Programme was introduced to increase the participation of smallholder farmers in agricultural activities. Since the reopening of land claims for people who had missed the 1998 deadline, about 12 000 new land claims have been lodged by December 2015.
Water and Sanitation: Farmers and communities that are affected by drought in four provinces have been provided with support. Training of 15 000 young people as artisans is underway and, once trained, they will be deployed to fix leaking pipes and curb water wastage.
Improving labour relations: The social partners have reached an agreement at the National Economic Development and Labour Council (Nedlac) on the principles of a national minimum wage. Nedlac is furthermore finalising a framework to stabilise the labour market by reducing the length of strikes and eliminating violence during strike actions.
Mining sector: One of the positive developments in the mining sector was the Leaders’ Declaration to save jobs, which was signed by mining industry stakeholders in August 2015. The government has also appealed to businesses that retrenchments should not be the first resort when they face difficulties.
SONA 2016 focused on, among other things, the need to accelerate economic growth. The President further indicated that to achieve the objectives of creating jobs, reducing inequality and pushing back the frontiers of poverty, we need faster economic growth. “In the National Development Plan, we set our aspirational target growth of 5% per year, which we had hoped to achieve by 2019,”, he said.
These are two critical pronouncements from the address which are specific to local government. They relate to the introduction and implementation of austerity measures which will ensure cutting wasteful expenditure without compromising the core government business of providing quality services to the people; intensifying the implementation of the Back-to-Basics local government revitalisation plan, which was launched in 2014. More active monitoring and accountability measures to be used will include unannounced municipal visits, spot checks of supply chain management processes, site visits of projects funded by the Municipal Infrastructure Grant as well as increasing interventions to assist struggling municipalities.
National Budget Speech 2016
The National Budget was tabled on Wednesday, 24 February 2016 by Finance Minister Pravin Gordhan. The minister stressed the need to reaffirm the government’s commitment to close the gap between spending and revenue, implementing a plan for stronger economic growth, and cooperation between the government and the business sector. That should keep the rating agencies that want to downgrade South Africa’s debt position to junk status temporarily at bay.
Personal income tax rates were not increased as was expected and as was the case last year (2015), although about R18 billion more will be collected in 2016/17. This will mostly be through yet another big increase of 30 cents per litre in the fuel levy, as well as increases in capital gains tax, property transfer tax and an increase of about 7% in the sin taxes (tax on alcohol and tobacco) A new tyre levy and a tax on the sugar content of sweetened beverages (next year only) will also be introduced.
189

170
The expenditure ceiling was also cut by R25 billion over the next three years, to bring the budget deficit down to 2.4% of gross domestic product by 2018/19, and to stabilise debt at around 45% of GDP. The public sector wage bill will be cut, but provision for contingencies like drought relief and additional spending has been made, and increases in expenditure on, for example, higher education and small business development, continue. The Minister stressed that the government would not burden South Africans with “austerity measures”, and that social grants will also be raised.
190

171
The highlights of the budget are:
191

172
State of the Province Address (SOPA) 2016
The Premier of Gauteng, Mr David Makhura, presented his State of the Province Address on 22 February 2016. During his address, the Premier reiterated the commitment to the ten-pillar programme of radical transformation, modernisation and reindustrialisation as a strategic roadmap to move the Gauteng City Region forward over the next five to fifteen years. The address also gave a full account of the work the current Gauteng administration is doing; as well as of future plans to transform, modernise and reindustrialise the province.
In his speech the Premier indicated that in order for the province to cope with rapid urbanisation, persistent unemployment, poverty and inequality, we have to work doubly hard and do things differently in Gauteng with regard to the economy, infrastructure development and service delivery. Consequently, our economic interventions should seek to achieve the following:
Change ownership patterns to bring black people into the economic mainstream and create black industrialists
Change the current industrial structure of our economy to privilege manufacturing through processing the rich mineral resources and other raw materials locally
Develop new modern, innovation-driven industries in the areas of high-tech, pharmaceuticals, biotechnology, the green economy and the blue economy
Invest hugely in skills development to change the skills profile of citizens in line with the new strategic sectors that were identified
Change income distribution to enhance equity and raise the living standards of all our people
Transform the apartheid spatial economy and human settlement patterns to integrate economic opportunities, transport corridors and human settlements
Grow the SMME sector as a key driver of growth, and revitalise and mainstream the township economy
Strengthen the capacity of the state to direct economic development and enhance the competitiveness of strategic economic sectors through active industrial policy
Ensure significant investment in infrastructure as the key stimulator for inclusive growth and economic development
Build transformative partnerships between the private and public sector in addressing the developmental challenges outlined in the National Development Plan Vision 2030.
Specific to the City of Tshwane, the Premier reaffirmed the commitment to address unemployment, poverty and inequality jointly with municipalities and private sector partners. In line with the province’s ten-pillar programme of radical transformation, modernisation and re-industrialisation, Makhura promised an injection of billions of rand into several initiatives around all major regions in the province.
The Premier pronounced that the City of Tshwane would invest R525 million to establish a business process outsourcing park in Hammanskraal. The park will offer on-site training, technical support, and incubators for SMMEs. The project is
192

173
expected to create more than 1 000 jobs during construction, and more than 1 000 indirect jobs.
Gauteng Provincial Budget Speech 2016
The MEC for Finance in Gauteng, Barbara Creecy, presented the 2016/17 provincial budget on 3 March 2015. This budget for various provincial departments responded further to the commitments made during the State of the Province Address. The MEC announced that the 2016 Medium-term Expenditure Framework (MTEF) is anchored on the following principles:
Spending more on the ten-pillar programme of transformation, modernisation and re-industrialisation; and less on catering, travel, accommodation and telecommunications
Improving on own revenue collection to maintain provincial spending on social services for the poor
Prioritising the filling of vacant positions for teachers, doctors, nurses, and social workers; and abolishing administrative positions we no longer need
Speeding up the implementation of the open tender system to restore public confidence in state procurement
Making ongoing improvements in project management to strengthen clean government and improve financial controls
Off-budget financing (within affordable limits) of infrastructure, housing, the township economy and youth development
Key aspects of the MEC’s pronouncements directly related to Tshwane, include but are not limited to the following:
The Gauteng government will spend R41.6 billion over the 2016 MTREF on infrastructure.
R1.9 billion allocated to health: A new Lilian Ngoyi Hospital will be constructed from the above provincial allocation.
R5.2 billion for human settlement: This allocation is for the implementation of mega projects, amongst others the Nellmapius project.
R23 billion for roads and transport: Part of this allocation will go towards the upgrading and doubling of Solomon Mahlangu Road, from the N4 to Mamelodi.
To support the focus on strategic economic sectors, the following has been committed:
R164.5 million over 2016 -2019 MTREF; one of the key projects for the 2016/17 financial year include the development of the Bioscience Park facility at the Tshwane Innovation Centre.
The Tshwane Innovation Hub is also allocated an additional R30 million, bringing their budget to R95.3 million – an effort to support growth of the knowledge economy and to promote innovation in the city region.
193

174
R30 million has been allocated for the Women’s Living Heritage Monument which is located on Lillian Ngoyi Square in the Pretoria CBD.
R159 million has been allocated over the next three years to upgrade nine centres into industrial parks or business hubs. These include three in Tshwane: Saulsville Industrial Park, Hammanskraal Skills Centre and Mabopane Skills Centre.
Comments received from the MEC for the Department of Cooperative Governance and Traditional Affairs on the City of Tshwane’s 2015/16 reviewed Integrated Development Plan
The Municipal Systems Act compels the MEC responsible for Local Government to evaluate the municipal IDPs on an annual basis, and provide comments thereon to enhance intergovernmental relations and alignment in order to improve service delivery. MEC Jacob Mamabolo commended the City on a number of issues contained in the reviewed IDP, and also raised certain matters that require the City’s attention. The comments and the City’s responses are captured in the table below.
Service delivery and infrastructure development
MEC’s comments Response on comments
The City is commended for progress made in relation to the formalisation and reduction of informal settlements (from 150 to 115) within its area of jurisdiction.
It has been noted that the City is incurring major financial loses as a result of electricity loss due largely to theft, tampering with meters and faulty meters. In the context of the current electricity blackouts and shortage, urgent attention must be paid to this challenge. As part of the approach to reduce electricity loss in Tshwane, the Metro is urged to implement the following measures, amongst others: proactive infrastructure maintenance, civic education against theft and malicious damage as well as know-your-asset campaigns.
The City of Tshwane’s Electricity Department takes note of the comments on electricity losses. The losses are a combination of technical and non-technical losses. Technical losses are not controllable because they are unavoidable power current losses due to ageing infrastructure and natural power transmission.
The City is implementing the following as part of managing and controlling non-technical losses:
Retrofitting streetlights with LED lights.
Rolling out maintenance plans in line with licence conditions – to maintain NRS 047 and NRS 048 conditions.
The reintroduction of community consultation and involvement to develop a solution that enhances safety, revenue and access to electricity.
Re-engineering of current infrastructure will be done and advanced technologies will be used from now on.
o Energy balancing from 132 kV to 11 kV o Implementation of a smart grid o Smart metering
The efforts by the City to create a viable and efficient public transport system in the form of Bus Rapid Transit are acknowledged and bode well with the goals of the Gauteng Integrated Transport Master Plan 2025. As the anchors of the Gauteng City Region, the three Metropolitan Municipalities are urged to consolidate and interlink the
A Re Yeng – Network planning Phase 1 network design comprises two trunk line services and numerous feeder services supplemented by a comprehensive non-motorised transport network. Trunk line services are:
Line 1 – Pretoria Central to Kopanong in Soshanguve
194

175
MEC’s comments Response on comments
aforesaid efforts in order to create an accessible and sustainable intermodal public transport system that will modernise the manner in which people move through and experience Gauteng.
Line 2 – Pretoria Central to Mahube Valley in Mamelodi
A Re Yeng integration with other public transport services A Re Yeng service will be integrated with other public transport services, such as the Gautrain, Metrorail, Tshwane Bus Services as well as Public Transport Operating Grant buses (i.e. Putco, North West Star, etc.) and taxis, at the following six key nodes:
Pretoria Station
Hatfield Station
Belle Ombre Station
Wonderboom Station
Denneboom Station
Kopanong Station Integration with Wonderboom Airport A Re Yeng services will also link Gautrain services (Pretoria Station) with Wonderboom Airport. Discussions with the Gautrain are ongoing. Integration with metropolitan municipalities in Gauteng Future A Re Yeng services are planned to integrate with metropolitan municipalities in Gauteng at the following nodes:
Johannesburg Metropolitan Municipality – along the R55 in Centurion
Ekurhuleni Metropolitan Municipality – along the M18 (Main Road) in Irene
Gauteng township economic revitalisation
MEC’s comments Response on comments
Since the dawn of the new administration, the Gauteng Provincial Government has recognised the need to revitalise township economies as a key strategy for socio-economic transformation. The Ten Pillars express the programmatic intent of the current administration through radical transformation, modernisation and re-industrialisation of the provincial economy.
This represents a policy reaffirmation by the government; but most importantly it elevates township revitalisation as one of the key strategies for ascertaining that the Ten Pillar objectives are realised. The approval of the Gauteng Township Economic Revitalisation (TER) Strategy represents a clarion call for collective and integrated planning, harmonisation of budgets as well as multi-sectoral implementation across all spheres of government.
The Gauteng TER Strategy aims to contribute to the overall vision for South Africa: by 2030 to be a country with an
The City of Tshwane has identified six core projects for the implementation of the TER programme, namely:
1. Kgora Community Bakery (“Kgora”)
2. Integrated vehicle-washing facility (IVWF)
3. A plastic manufacturing factory
4. A paper towel factory
5. A brick and paving manufacturing factory
6. A fresh produce market
Two of these projects, Kgora and the IVWF, have already been completed and launched, and they are currently operational. The remaining four projects will be launched
195

176
MEC’s comments Response on comments
economy that can sustainably meet the material needs of all its citizens as well as broadening economic participation of previously marginalised groups. The TER Strategy is cast in intergovernmental posture, suggesting that all relevant stakeholders in Gauteng will have to give their collective support to ensure successful implementation. The Strategy requires a strong multi-sectoral and sphere interaction wherein provincial sector departments, municipalities, business and organised township chambers throw in their lot for maximum impact.
The Gauteng EXCO has further commissioned the establishment of a TER Intergovernmental Working Committee as an institutional mechanism through which the Strategy is coordinated and monitored. The purpose of the committee is to guide the coordination, facilitation, monitoring and evaluation of the strategy implementation across all spheres of government. The TER committee will interface with the IDP Technical Steering Committee, mainly due to the fact that IDPs will henceforth be used as platforms to track planning, budgeting as well as implementing the intent of municipalities regarding TER; but most importantly, striving for integration across the board.
before the end of the current financial year (2015/16).
The main objective is to equip selected beneficiaries (mainly cooperatives) with the required skills in their area of operations and to provide them with economic opportunities.
By facilitating partnerships with the relevant stakeholders in the respective sectors of the identified projects, the City will then incubate these beneficiaries for a period of three years, after which they should be able to effectively run financially sustainable businesses and thus contribute to the city’s mainstream economy and that of the country as a whole.
Ongoing consultations with ward councillors, Regional Executive Directors (REDs) and community stakeholders are conducted for the success and sustainability of the projects and ultimately the attainment of the whole initiative.
The City of Tshwane partakes in the TER Intergovernmental Working Committee, in which monthly reports are forwarded and lessons learnt are shared and discussed further. The committee also serves as a platform for sharing best practices between municipalities and other governmental institutions on own interventions or programmes, successes and challenges, thus forming linkages where possible.
Electricity and energy
MEC’s comments Response on comments
At present, there is national concern over energy and its use. South Africa as a whole is affected by challenges regarding energy, its demand and how it is supplied. The recent episodes of load shedding across the country, with a considerable amount of the impact felt in Gauteng as the economic backbone of South Africa, have demonstrated the necessity for deeper dialogue and action around exploring sustainable ways of providing energy. One of the immediate actions to be taken in the province, amidst others that have been proposed, is for municipal IDPs to begin to design projects in the IDP that mitigate load shedding. Energy-efficiency projects together with energy-saving campaigns, for instance, will go a long way towards curbing the current energy demand facing the province.
The City’s Built Environment Performance Plan (BEPP) was developed to cushion the impact of load shedding. In so doing the City is engaging with potential investors to reindustrialise its current power-generation capacity (Pretoria West and Rooiwal) for self-use.
The following energy-efficiency projects were started during the
period under review:
Projects Quantity
Solar water heater roll-out 22175
Streetlights retrofitted with energy
savers
30338
Traffic lights retrofitted with LEDs 296
Building lights retrofitted with energy
savers
44 648
Financial viability
196

177
MEC’s comments Response on comments
In line with the principle of financial sustainability, it is observed that the City’s budget is unsustainable in the current financial year. However, it is improving in the two outer years. This is the result of a range of factors, namely: inadequate cash coverage; the budget not being cash-backed and not funded at all. Furthermore, the City of Tshwane’s collection rate has declined from the audited 106.4% in the 2013/14 financial year to 105,1% and 91,8% in 2014/15 and 2015/16 respectively. It is important that the City addresses these financial hurdles and strengthens collection measures for a financially sustainable municipality.
The Tshwane Municipality is further commended for the rendering of its budget as credible, as based on the budget assumptions and related budget policies. Correspondingly, the tariff increases are in line with the prescribed guidelines of the National Treasury. Moreover, it is observed that the City is able to perform its obligation to pay creditors within 30 days. For instance, bulk services and suppliers are paid on time according to the City’s creditors’ age analysis. This is positive for the municipality.
However, it is noted that households in Tshwane remain the major contributing factor to the City’s growing debtor’s book, with consumer debtors sitting at 54% of total debtors in the 2014/15 budget. The City is advised to pay close attention to debt collection procedures as this can cause financial distress if not attended to.
The City of Tshwane has established an outbound call centre to carry out in-house debt collection. The call centre has been operational from 13 July 2015 and it currently has more than 80 call centre agents.
The main purpose of the call centre is to improve the City’s revenue collection by ensuring that all the customers whose accounts are more than 30 days in arrears are contacted in an effort get them to pay their municipal service accounts on time, and further to have the queries and disputes lodged with the Municipality resolved quickly.
The Municipality has appointed revenue agents to assist with the collection of revenue, queries and resolution of disputes.
Additionally, the City of Tshwane has approved a revenue-collection strategy called Revenue Recovery and Continuous Improvement. (RRCI). RRCI maps out a way to how the City should approach credit control in order to ensure that there is an increase in revenue collection and a decrease of the debtor’s book.
The RRCI seeks to ensure that revenue collected on a monthly basis is in line with the billing and the budget. In the RRCI strategy the City’s debtor’s book is segmented into various initiatives linked to debtor types as well as ageing debts, with the purpose of ensuring that there is special focus and efforts to prevent the debtor’s book from increasing.
Another part of the resources deployed to curb the debtors’ book and increase revenue collection is the education and awareness campaigns on household customers and indigents, through the Mmogo re a Gola Programme, which educates customers and communities at large on taking the responsibility of paying their municipal services accounts on time and in full. It also focuses on how customers should manage their consumption, thereby ensuring that their monthly municipal bills are affordable.
Mmogo re a Gola educates communities and customers on issues of water leaks, illegal consumption and points of contact with the City in terms of lodging queries and disputes.
The City has also established an Affordability Committee which helps to assess the affordability status of customers who cannot afford to make payment arrangements within the period terms according to the Credit Control Policy. The committee is ensures that a conducive environment is created for customers to be able to pay their municipal accounts.
The City of Tshwane continues to fully implement credit
197

178
MEC’s comments Response on comments
control on a daily basis by ensuring that all monies due to the City are collected. Customers who qualify for an indigent subsidy are also encouraged to come forward and apply for this subsidy.
Good governance
MEC’s comments Response on comments
It has been observed that the City’s petition system is not effective. The ineffectiveness of the current system bears negative implications on participatory governance. It is important that the municipality strengthens its petition management system, procedures and processes, governance structures, reporting; as well as monitoring and evaluation. This is particularly important for strengthening trust between the Municipality and its citizenry. We must be able to demonstrate our ability to listen and effectively address concerns raised, especially in the form of petitions.
The City is further commented for having fraud and anti-corruption strategies in place. However, the effectiveness of these strategies is not reported on. In line with the principles of accountability and transparency as required by the Municipal Systems Act, 2000 (Act 32 of 2000) (MSA), Sections 57(a), subsection 7 to 8, it is important that the City informs and submits on a quarterly basis to the MEC for Local Government whenever there is an investigation on corruption cases.
As advocated by the Gauteng Premier, and in line with the ideal of an active citizenry, it is important that the City of Tshwane capacitates civil society structures within its respective areas of jurisdiction. Furthermore, there is a need to review and strengthen the current public participation processes or model in order to incorporate the views and needs of special groups of people in the IDP as required by the MSA.
The petitions system is effective and is in line with the adopted by-law on petitions.
In support of the City’s petition system being effective, the petitions are submitted to the Council by councillors. However, the petitioners also submit their petitions to the office of the Speaker (Petitions Section or regional offices). The Petitions Committee meet once a month to adjudicate on petitions received, and petitioners and departments are invited to participate during the adjudication process.
Petitions are resolved within the stipulated time frame of 90 days. The office of the Speaker ensures when a petition is received, it is registered, acknowledged and referred to the relevant department to attend to it.
The Petitions Committee conducts Inspections in loco and the Office of the Speaker convenes preliminary meetings between departments and petitioners, which strengthens public participation and creates trust and a relationship between the City and citizens. The Office of the Speaker is responsible for tracking and monitoring resolutions taken by the Petitions Committee to ensure that departments adhere to resolutions.
Petitioners have the right to appeal if they are not satisfied with the adjudication of their petitions.
The Office of the Speaker strategically implements public participation and consultation processes and programmes through the ward committee system by –
ensuring training of ward committees on identified core skills areas (QPR);
providing monthly and quarterly reports on ward committee functionality;
providing the administrative resources required by ward committees;
facilitating ward interventions requested by ward committees and the community and managing and facilitating research matters or issues;
facilitating regular public meetings between ward
198

179
MEC’s comments Response on comments
councillors and civil society by mobilising communities and stakeholders;
assisting ward committees and ward councillors in facilitating consultative meetings, e.g. concerning the IDP (the IDP process is done in three phases to ensure proper and thorough consultation. Phase I is ward committee consultation, Phase II is community consultation and Phase III the last phase of community consultation, which is verification), and;
promoting public relations in the regions and managing and facilitating stakeholder meetings; facilitating public hearings for policies and by-laws referred to communities for public consultations; and ensuring successful planning of quarterly meetings for ward councillors.
Spatial planning
MEC’s comments Response on comments
Regarding spatial planning in the City of Tshwane, there is a need for greater spatial expression and analysis beyond municipal boundaries, especially within the functional Gauteng city region. The City is thus urged to purposefully utilise the Gauteng Spatial Development Framework (GSDF) for this process. The City is further urged to decisively integrate the densification targets along public transport routes in relation to transit-orientated development as outlined in the Gauteng Integrated Transport Master Plan 25. The City is urged to explore the applicability of mechanisms for environmental management as outlined in the Gauteng Environmental Management Framework (GEMF) prepared by the Gauteng Department of Agriculture and Rural Development. In addition, ongoing efforts to advance responses to climate change, resource scarcity, waste output reduction and sustainable transformation of infrastructure to be integrated within the built environment and spatial planning.
1. The need to address cross-border issues with other metropolitan municipalities, e.g. Johannesburg and Ekurhuleni, has been expressed and a tri-metro committee between the municipalities has been established. It is the intention to address these issues in more detail in the BEPP and Capital Investment Framework (CIF) in order to give effect to provincial priorities and to align planning and implementation.
The revised MSDF will address cross-border matters that impact on the City’s development. The issue of cross-border planning has been raised at previous engagements with the GSDF development team, as the currently approved GSDF did not adequately address cross-border matters within the context of the Gauteng City-Region Observatory (GCRO). Through further engagements with the GSDF development process and other independent efforts of the City, the revised MSDF will be further enhanced in this area.
2. Integration of densification targets along public transport
routes: The City has recently completed work looking into the development trends in and around BRT routes. This will allow good insight into what interventions might be required in areas where densification is not yet being realised. Densification along public transport routes is an established principle in the Municipal and Regional Spatial Development Frameworks. The challenge is to align budget allocation, project prioritisation and engagements with the private sector in order to ensure that the densification policies are implemented. Much of this work is being facilitated through the BEPP and CIF and this will be taken up in the revision of the MSDF. The chapter on transit-oriented development (TOD) in the BEPP deals with comments as highlighted.
199

180
MEC’s comments Response on comments
3. It is agreed that the environmental aspects, including climate change, resource scarcity, waste reduction and sustainable transformation of infrastructure, need further attention. The BEPP team has already had discussions with the Sustainability Department and follow-up meetings will be held to ensure that these are further explored and formalised to be taken into the BEPP up to project-level.
The City Sustainability Desk has done a great deal of work related to environmental matters including climate change, resource scarcity and waste output reduction. As with the previous example, the challenge lies largely in the implementation. There is still more work to be done in the area of sustainable transformation of infrastructure. During revision of the MSDF, work done by the Environmental Management Department and the Sustainability Desk will be integrated into the document and gaps will be addressed where required.
Spatial planning is cross-sectoral. The quality of the MSDF largely depends on the level to which the other sectoral departments contribute, playing their respective roles, towards developing and/or implementing specific technical plans that contribute to an efficient spatial urban form.
The regulatory environment
MEC’s comments Response on comments
REGULATORY ENVIRONMENT: Gauteng Municipalities are generally characterised by a challenge pertaining to the inadequacy or poor enforcement of municipal by-laws; poor implementation of anti-fraud and corruption policies as well as poor performance and risk management systems. This was confirmed earlier this year by the Back-to-Basics Report produced by Gauteng COGTA. To address these challenges, the provincial government has embarked on:
A review, update and alignment of municipal by-laws across Gauteng; and
a review and update of anti-fraud and corruption policies, including efforts to build a culture of ethical behaviour and accountability. To effect this, a partnership has been established with SALGA, Department of Cooperative Governance and Ethics Institute of South Africa (EthicsSA). The Gauteng Provincial Government will pilot the conducting of the ethics survey in the province over the next three (3) months.
Anti-fraud and corruption
The City of Tshwane has the following policies in place that were reviewed and approved by the Council in August 2015:
Anti-fraud Policy
Whistle-blowing Policy
Anti-fraud Strategy The Group Audit and Risk Department has focused its efforts on a campaign that aims to create awareness of policies that relate to fraud and corruption in Tshwane.
The City has a signed memorandum of understanding with the Ethics Institute of South Africa for the implementation of a project that aims to promote good ethics and integrity in the City. The activities of the project includes an ethics assessment of the City, and through this we will identify the inefficiencies and find solutions for improvement.
The project will further assist the City to create structures to
200

181
MEC’s comments Response on comments
focus on issues of ethics and governance.
Risk management systems
The City has implemented an Enterprise Risk Management System across its departments, regions and entities.
The following documents have been approved by the Council:
Enterprise Risk Management Policy
Enterprise Risk Management Strategy The City has established a Risk Committee with four independent members. Furthermore, two risk committee charters for the entities and City have been drafted and approved.
Risk assessments, monitoring of mitigations and risk management are conducted by the City of Tshwane at corporate, departmental, regional and entity-level.
Evidence-based planning
MEC’s comments Response on comments
From a statistics perspective, IDP's have improved a great deal in terms of compliance. That is, having statistics visible and included in the IDP documents. The challenge, however, has been the inconsistency of data sources, inconsistent or irrelevant indicators, and the absence of benchmarks. While it is not incorrect for municipalities to use statistical data reports from other sources, it is a legislative requirement that such data must meet specified minimum requirements to be considered official, as illustrated for instance in the gazetted Statistics Framework. Municipalities are therefore cautioned against using data that has not been verified as this may lead to ill-planning and subsequent mismanagement of our already limited resources.
From the IDP assessments this year, there is also a growing concern about the absence of a demographic illustration of trends or patterns of the population within a given municipal area. Recording the quantities of sex, ages, race and so forth are essential for understanding the development needs and quantities required in planning for development. This type of data set also informs probable indexes such as life expectancy, demographic dividend, labour force, population growth, birth and death rates, migration patterns, and so on.
Moreover, municipalities should be able to appreciate the importance of their area’s population pyramid. This is important as the shape of a population pyramid for a specific
Censuses are a principal means of collecting basic population and housing statistics required for social and economic development and policy interventions as wells as their implementation and evaluation. South Africa has conducted three censuses (1996, 2001 and 2011). Census 2011 was the third census to be conducted since the first democratic elections in 1994, and a number of population and household attributes were measured and a variety of indicators generated. This provides the City with specific profiles on all census topics: demographics, migration, education, general health and functioning, labour force, mortality, and households. The City enhanced the information by utilising the recent IHS Global Insight population and demographic projections to provide a more recent picture of the current situation. This source of information has enabled the City to compare the changes over several years, and the City has utilised this source over the last few IDP reviews.
201

182
MEC’s comments Response on comments
municipal area informs the probable current trends and the future likelihoods. Municipalities are encouraged to study these statistical dynamics as strategic intentions must be grounded in empirical data. With limited resources and the rapid economic trends that impact on the social well-being of communities, good use of statistics is a prerequisite.
State of the Capital Address
The State of the Capital address was delivery by the Executive Mayor of City of Tshwane Cllr Kgosientso Ramokgopa on the 21st of April 2016 at Freedom Park here in Pretoria under the theme “One Nation, One Capital: Advancing Tshwane Vision 2055”.
‘The 2016 State of the Capital Address is thus framed as a message that sums up the general insights of the service delivery cycle in its entirety as well as shares specific features of the financial year whose tail end we have reached’, said the Mayor.
The following are the areas wherein the Mayor gave a detailed account of innovative ideas explored during the term including some future sustainability plans:
One nation, one capital: Advancing Tshwane Vision 2055; Accelerating radical economic transformation within the capital; Advancing social cohesion within the capital; The reconfiguration of space in the capital; Engendering excellence through good governance within the capital; Positioning the capital as a global player; Engendering excellence through good governance within the capital; and Positioning the capital as a global player.
202

183
In addition to the above, the Executive Mayor further announced that since there is a consideration of relocating Parliament from Cape Town, the City has considered various sites for its location in Pretoria, and named the area of Fort Klapperkop as the suitable site due its relevance to the Tshwane inner city renewal strategy, its symbolic significance and standing relative to the Union Buildings, its natural and environmental dimensions as well as its accessibility and immediate availability of land. The site also provides superb access to the inner city, OR Tambo International Airport and the Union Buildings through a network of roads that includes the R21, the N4 and the Gautrain rail network.
The details of the above summary re-enforced the City’s commitment during the term towards achieving to aspirations of the National Development Plan and other planning directives in ensuring unhindered development of people in society.
Conclusion
The City will continue to foster intergovernmental planning and monitoring in all spheres of government. This will also be intensified during the financial year and throughout the 2016/21 Term of Office.
203

184
6. COMMUNITY PARTICIPATION
Introduction
This chapter briefly explains, in context, the concept of community participation. It also outlines participation in the South African context (local government); this includes the identification of specific legislative prescripts that guide community and stakeholder participation during Integrated Development Planning (IDP). Stakeholders who were consulted and processes undertaken during the development of this IDP for 2016/17 financial year are also stated herein.
Understanding the concept “participation”
Often the term participation is modified with adjectives, resulting in terms such as community participation, citizen participation, people’s participation, public participation and popular participation. The Oxford English Dictionary defines participation as “to have a share in” or “to take part in,” thereby emphasising the rights of individuals and the choices that they make in order to participate. Arnstein (1969) defined citizen participation as a process by which citizens’ act in response to public concerns, voice their opinions about decisions that affect them and take responsibility for changes to their community.
Brager, Specht, and Torczyner (1987), on the other hand, define participation as a means to educate citizens and to increase their competence. It is a vehicle for influencing decisions that affect the lives of citizens and an avenue for transferring political power. However, it can also be a method to ensure dissent or a mechanism for ensuring the receptivity, sensitivity, and even accountability of social services to the consumers.
According to the African Charter for Popular Participation in Development and Transformation (ACPPDT) of 1990, as cited in Theron (2009:15), public participation is “the empowerment of people to effectively involve themselves in creating the structures and in designing policies and programmes that serve the interests of all as well as to effectively contribute to the development processes and share equity in its benefits.”
Davids et al. (2005) argue that there are three levels of public participation; these include participation through informing the participants, consulting participants and empowering participants. These levels of public participation can be reflected by the practice of public participation as identified by the International Association for Public Participation (IAPP) in 2002, which states in Theron (2009:114) that –
the public should have a say in decisions about actions that affect their lives; public participation includes the premise that the public’s contribution will
influence the decisions to be taken; the public participation process communicates the interests and meets the
process needs of all participants; the public participation process seeks out and facilitates the involvement of
those partially affected;
204

185
the public participation process involves participants in defining how they participate;
the public participation process communicates to participants how their inputs affected the decision; and
the public participation process provides participants with the information they need to participate in a meaningful way.
Public participation in the South African context (local government – IDP)
The post-apartheid legislative framework in South Africa emphasises the importance of public participation as an essential tool for democratic consolidation. This is articulated in the number of legislations, particularly as it relates to Integrated Development Planning (IDP). Those include, amongst others the White paper on Reconstruction and Development (1994), the Constitution of the Republic of South Africa (1996), the White Paper on Local Government (1998), the Municipal Systems Act (2000) and many others.
The Constitution: Public participation in decision-making is encouraged in the 1996 Constitution as it stipulates in sections 195(1)(e): “people’s needs must be responded to and the public must be encouraged to participate in policy making”. The Constitution further asserts that the function of local government is to encourage the involvement of communities and community organizations in local government (section 152). Section 195(e) states that in terms of the basic values and principles governing public administration, people’s needs must be responded to and the public must be encouraged to participate in policy-making.
White Paper on Local Government (1998): This document proposed a new mandate to local governments termed as “developmental local government”. The local governments’ approach to fulfil this mandate is “to work together with local communities to find sustainable ways to meet their needs and improve the quality of their lives”.
Local Government: Municipal Structures Act, 1998 (Act 117 of 1998): It requires municipalities to consult with civil society in meeting the needs of local communities.
Local Government: Municipal Systems Act, 2000 (Act 32 of 2000): It instructed municipalities to “establish appropriate mechanisms, processes and procedures to enable the local community to participate in the affairs of the municipality” (MSA of 2000, Act 32 of 2000, section 17.2). According to this act: “A municipality must develop a culture of municipal government that complements formal representative government with a system of participatory governance, and it must for this purpose - encourage and create conditions for the local community to participate in the affairs of the municipality” and “contribute to building the capacity of (i) the local community to enable it to participate in the affairs of the municipality and (ii) councillors and staff to foster community participation” (MSA, 32 of 2000: section 16.1).
205

186
City of Tshwane’s approach to community and stakeholder participation in developing the draft IDP
The City’s commitment to public participation continues to be based on legislative obligation. In August 2015, the Council approved the process plan to guide the development of 2016/17 IDP and compilation of the MTREF. It contained a consolidated approach to public participation which is explained as follows:
Pre-tabling public participation: Communities and stakeholders were consulted with regard to service delivery within their respective areas; such consultations formed (amongst others) the basis for the preparation and consolidation and subsequent tabling of the draft IDP in March 2016.
Post-tabling public participation: This is the legislated consultation which took place after the tabling of the draft plans in April 2016, it served to solicit inputs and comments from communities and stakeholders before this IDP and budget could finally be submitted to Council for consideration and approval during May 2016. A detailed account of the consultation activities as undertaken is outlined in this chapter.
PRE-TABLING PUBLIC PARTICIPATION
During the planning stages between July and August 2015, the critical governance structures were consulted. The consultation was for the purpose of making presentations and explaining the contents of the 2016/17 IDP process plan, the IDP and budget, as well as soliciting inputs and comments prior to its noting and final approval by the Council. These structures include the Mayoral Committee, the Council, the Governance Cluster (Mayoral Subcommittee Cluster), the Section 79 Oversight Committee on IDP, as well as the Governance Technical Cluster
These structures have been consulted throughout the planning process until the IDP is finally adopted by the Council in May 2016. The following discuss these engagement platforms:
The Mayoral Committee and Council
The Mayoral Committee is central to the IDP and budgeting processes; it is the only structure which recommends the Council to consider the development, approval and review of the IDP. The consultation with the committee started in August 2015 for the purpose of the facilitating the approval of the 2016/17 IDP process plan which was subsequently approved by Council.
The Executive Mayor convened the Mayoral Lekgotla during the first quarter of the financial year to discuss matters concerning the IDP 2016/2021, amongst others. This was in consideration of the fact that 2016/17 is a year between two council terms (the current council ending their term and the council to be elected in the new term) and that this council should ensure that there is an IDP and budget in place by the beginning of the new financial year, i.e. July 2016. The decision was to develop an IDP with specific focus on the 2016/17 financial year and the new council will carry over planning once appointed for the remainder of the term (2016–2021). The
206

187
above resolution was in line with National Treasury MFMA Circular No.78: Municipal Budget Circular for the 2016/17 MTREF.
The lekgotla discussions were also centred on institutionalising and giving effect to Tshwane Vision 2055 from the 2016/17 financial year onwards. The discussions around the approaches to community and stakeholder consultations on IDP matters were around the principles as outlined in Outcome 6 of Vision 2055 Furthermore, the following has to be taken into consideration as the City engages with stakeholders towards the development of 2016/17 IDP:
Exploring alternative active citizenry models to deepen democracy;
Identifying strategic partners from various segments of the community to form part of the engagements. This would include structures such as, but not limited to, traditional authorities, business community, non-governmental organisations and community-based organisations; and
Developing an implementable programme for the legislated outreach process which is mindful of any other community engagement that may take place with regard to elections;
Consistent consultation with the Mayoral Committee was maintained throughout the process until the tabling of the draft IDP in March 2016 and its final approval in May 2016.
Budget Steering Committee (BSC)
The Budget Steering Committee assisted this IDP development process by continuously assessing service delivery and the City’s financial status. The first meeting of the Budget Steering Committee was held from 12 to 16 February 2016 and departments presented their proposed IDP and budget proposals for the 2016/17 IDP and MTREF. The second meeting was to make an assessment of all the submissions against Council priorities for 2016/17.
Financial allocation was in line with the priorities of the Council and the current economic climate. The recommendations at the Budget Steering Committee were presented to the Budget Lekgotla to inform planning and budget in 2016/2017.
IDP technical working group
Following the approval of the 2016/17 IDP and Budget Process Plan, the IDP technical working group (IDPTWG) was informed of the process. The IDPTWG constitutes representatives from all internal City of Tshwane departments; most of the departments are represented by project planners and business planners. The purpose of the consultation was to present the approved process plan, including its critical activities and timelines which the departments are expected to adhere to during the review process.
207

188
Outcome strategy working groups
Based on the Mayoral Lekgotla resolution that Tshwane Vision 2055 be institutionalised and put in practice an outcome-based planning model was adopted which proposed, amongst others, the establishment of outcome working groups. These working groups consist of internal departments that directly contribute to a specific outcome from the six outcomes of Tshwane Vision 2055. These outcome working groups were consulted for the development of outcome-based strategies/plans, which included the identification of multi-level key performance indicators, programmes and projects to ensure operationalisation of Tshwane Vision 2055.
These outcome-based strategies/plans formed the basis for resource allocation for the IDP and budget. Consultation is continuous until the outcome-based strategies/ plans are finally approved for implementation during the 2016/17 financial year. Reference to this approach including the outcome based strategies is contained in Chapter 3 of this document.
Councillors and ward communities
The above structures continued to serve as a link between the community and Council. During the pre-tabling of the IDP document, the establishment of the ward committees was still underway which meant that this period also went ahead in the absence of respective ward committees. However, ward councillors as the elected ward representatives remained critical points of entry at ward level particularly on matters relating to IDP. They were consulted consistently and the results of these consultations are outlined below in the section dealing with April 2016 outreach meetings.
External consultation
Gauteng provincial sector departments
The engagements with the above-mentioned stakeholders, in the form of the Provincial IDP Technical Steering Committee, were centrally facilitated and coordinated by the Gauteng Department of Cooperative Governance and Traditional Affairs (GCOGTA) through the Municipal Integrated Development Planning Section. The engagement took place on 25 February 2016. This process was preceded by written communications with GCOGTA on specific sector department matters for response. This served as a platform where provincial sector departments were given an opportunity to directly discuss issues raised through public participation at the level of local government and to further devise appropriate ways to collectively and directly plan and budget for community issues as raised.
The meeting resolved, among others, that the IGR be intensified and supported, that metropolitan municipalities further utilise other IGR forums such as MEC-MMC IGR forums, because these platforms could assist in unblocking challenges experienced, that an in-depth analysis of all issues presented will be done by GCOGTA and that all concerned sector departments consistently and continuously provide responses to issues raised by communities through municipalities.
208

189
National Treasury visits
The National Treasury visits all metropolitan municipalities in Gauteng twice a year. The first visit is termed “the mid-year service delivery and performance visit” which is held in January/February of each year. The second is the “benchmark exercise” which is held between April and May of each year after the tabling of the draft IDP and budget.
The mid-year visit was held on 29 February and 1 March 2016. The City’s mid-year performance was measured against the IDP, and its implementation plan, the service delivery and budget implementation plan (SDBIP) and the budget were discussed. The discussions included other key planning and budgeting processes and interventions, which include the Built Environment Performance Plan (BEPP) process, financial management, the Auditor-General’s report and risk management. The recommendations that arose from these interactions are responded to throughout this IDP and the MTREF.
Communities (ward level) and community organisations (Regional level)
During the 2012/13 financial year an approach on the sourcing and collation of community needs was approved by the Mayoral Committee wherein it resolved that the long lists of ward issues in the IDP should be reprioritised (by the respective wards) into three priority issues per ward that are of strategic importance and need to be focused on and attended to for the remainder of the term.
At the time of consolidating the draft plan, summation of the available ward priorities was done; the approved approach was to not source new ward needs/priorities but to focus on giving attention to the available priorities which has been detailed underneath (since the term is closing). Progress on the implementation of these wards priorities and other services delivery interventions has been the basis for annual community consultations and the review of the IDP.
Preliminary analysis of ward issues
The analysis of priority issues across all seven regions indicates the provision of basic services, maintenance of infrastructure and job creation as the major issues. The following are presented as key priorities:
Provision of new infrastructure and maintenance of existing infrastructure (water, sanitation, roads, storm water and electricity);
Provision of housing and the upgrading of informal settlements; Provision of social amenities/infrastructure (sport and recreational facilities,
parks, clinics and libraries) and accompanying programmes; Economic development and job creation; and Safety and security.
All the ward issues were analysed and a total of 350 priorities were recorded. Of these 350 ward issues, 318, amounting to 91%, fall within the responsibilities of the Municipality, meaning that they can be attended to and implemented by the City’s
209

190
departments such as the Transport Department and the Health and Social Development Department.
The remaining 32 issues, which translate to 9%, fall with the responsibilities of other sector departments, e.g. the Departments of Education, Health and Community Safety, amongst others. This percentage also includes state-owned entities such as Eskom.
About 102 of the above-mentioned issues, amounting to 29%, were raised in Region 1, followed by Regions 3 and 6 at 22% and 19% respectively. The regions with the lowest number and percentage of ward issues raised were Regions 5 and 7 with 2% and 4% respectively. The highest number of issues raised per region can be attributed to two critical developmental factors, i.e. the number of wards per region and the population per ward, as well as the level of development of specific wards and regions. The notion does not conclude that regions with a smaller number of issues raised were presumably well developed. Regions 5 and 7 are underdeveloped, low-income residential areas and include rural areas.
Responses to ward issues
A number of the priorities that fell within the responsibility of the City has been implemented by the City’s departments since 2011. A detailed account and actual results concerning the implementing these ward issues is outlined in the City’s Annual Reports from 2011/12 to date. Those priorities that fell within the responsibilities of the provincial sector departments and other state-owned entities have been forwarded to the provincial department of Cooperative Governance and Traditional Affairs who is coordinating the process; reports are also received during the implementation time and are forwarded to the relevant points.
The following graph indicates (as summary) progress made by the City as at 2015 to address the issues raised by the wards.
210

191
Almost 5% of the issues have already been attended to and completed in previous years; the majority of these are in Regions 1, 2, 3 and 6;
2014/15 capital expenditure covered 22% of ward issues across all the regions;
An additional 20% was targeted during this current MTREF (multi-year projects/programmes); and
In total, 42% of ward issues were attended to during the current MTREF since 2013/14, when this initiative started.
Details regarding areas of implementation/ specific areas of interventions are contained in Chapter 11 of this document.
POST – TABLING PUBLIC PARTICIPATION
At the end of March 2016, Council noted the draft IDP and resolved that it be subjected to public participation for a period of 21 days to facilitate public and stakeholder comments and or inputs. During April 2016 the City engaged with its broader communities and stakeholders, information was disseminated through various means including placing of copies of drafts at City libraries, walk in centres, municipal website, and print media as well as through social media. Face-to-face interactions communities and stakeholders took place as follows:
Ward level meetings
All ward councillors were brought on board to facilitate their respective ward meetings (all 105 wards) wherein the draft IDP and budget were presented and discussed. Prior to these ward meetings, an all in one briefing session for councillors was convened to brief councillors on the generic content (draft IDP) for meetings;
Issues already completed
5%
Issues prioritised from 2014/15
22%
Issues to be considered
during current MTREF
20%
To be considered post-2016
53%
211

192
expectations from ward level meetings were outlined and explained to councillors. These meetings were scheduled to take place from 1st April until 7th April 2016 and they were organised as follows:
DATES REGIONS WARDS CONFIRMED VENUE
1 April 2016 5 87 Kameeldrift Community Hall
99 Refilwe Community Hall
100 Refilwe Community
7 102 Zithobeni Community Hall
Bronkhorstspruit Council Chamber
103 Rethabiseng Community Hall
104 Masakhane Community Hall
105 Ekangala Community Hall
Bronkhorstspruit Council Chamber
2 April 2016 1 2 Pretoria North Hall
4 Akasia Council Chamber
9 Winterveldt Multipurpose Centre
11 Rivhoningo Primary School
12 Mabopane High School
19 Winterveldt Multipurpose Centre
20 Indoor Sports Centre
21 Mabopane Skills Centre
22 Indoor Sports Centre
24 Winterveldt Training Centre (Rand Water)
25 Kgotlhelelang Primary School
26 Uthando Primary School
27 Block X Community Hall
29 Block Cv Hall
6 6 Kekana Secondary School
10 Rephafugile Secondary School
15 Lehlabile Secondary School
16 Stanza Bopape Sporting Complex
17 Emaswangweni Primary School
18 Somafco Secondary School
23 Rethabile Hall
28 Moretele Primary School
38 Kingsley Hostel
40 Ext 6 primary School
41 Silverton Recreation Centre
43 Eersterust Civic Centre
3 April 2016
3 3 Van Ransburg Hall
7 Lotus Garden Primary School
42 Scouts Hall
51 Isaac More Primary School
55 Clement Park (between Market and Bokoned Kloof )
56 University of Pretoria High Performance Centre
58 Philip Nel Park
59 Harlequin Rugby Club - Groenkloof
1 30 Pay Point Zone 4
31 Zone 1 Community Hall
32 Rakale Primary School
33 Falala Hall
34 Halala Community Hall
35 Block K Tennis Court
36 Hlomphanang Secondary School
212

193
DATES REGIONS WARDS CONFIRMED VENUE
37 KT Motubatse Community Hall
39 Reabetswe Primary School
88 St Francis Primary School
89 Refitlhilepele Primary Hall
90 KT Motubatse Community Hall
94 Echibini Primary School
98 Pretoria North Hall
4 April 2016 6 44 Garsfontein Hoer Skool
45 Garsfontein Laer Skool
46 Alkantrant Library Skool
47 Erasmuskloof Fire Station
67 Emthunzini primary school
83 Erasmuskloof Fire Station
85 Erasmuskloof Fire Station
86 Customer care
91 Open Space (Cnr Wekker and Mary Ethel Streets)
93 Balebogeng primary school
97 Meetse A Bophelo Primary School
101 Wozanibone Secondary School
3 60 Ou Raad Saal
62 Atteridgeville Community Hall
63 Saulridge High School
68 Mlambo Community Hall
71 Ledwaba Hall
72 Mabafeng Primary School/ Block I
80 Sunnyside Primary School
81 Sunnyside Swimming pool
82 Northern Gauteng Wrestling Club, 26TH Str Menlo Park
1 Nethedutch Reformed Church ,Corner of Ferdinand & Van Riebeeck Streets, Daspoort
53 Moot Police station, Glaskasteel from 17 Avenue
107 Brazaville Sport Ground
5 April 2016 4 48 Mooiplaas Sports Ground
57 Lyttelton Town Library
61 Laudium Community Hall
64 Rooihuiskraal Community Library
65 Irene Middle School
66 Department of Defence Hall
69 Eldoraigne Community Library
70 Swartkop Lapa
77 Olievenhoutbotsch Community Centre
78 Banquette Hall
79 Lyttelton Library
106 New Creation Absa Ground
3 84 Queenswood Tennis Club Cnr woodlands Drive and Engel Street.
92 Arcadia Scout Hall Beckett Street
6 April 2016 2 5 Montana Hoer Skool
8 Suurman Community Hall
13 Fatlhogang Primary School
14 New School Eesterus
49 Mandela Hall
50 Kudu Building
73 Lebello primary School
74 Marokolong Primary School
75 Makgoba Sebothoma
213

194
DATES REGIONS WARDS CONFIRMED VENUE
76 Selemela Ground
95 Leratong Primary School
96 Rooiwal Community Hall
3 54 Moot Police Station Glaskasteel from 17 Avenue
7 April 2016 3 52 Waverly Oos Kerk Cnr Trumper and Dickenson street
It should be noted however that not all 105 meetings took place as planned due to various reasons. An analysis of reports received from ward meetings which took place revealed the following as being the dominant service delivery issues across all the wards and regions:
Service delivery issues emanating from under developed wards (townships and rural wards) are summarised as follows:
o Provision of basic services and infrastructure maintenance such as:
water, sanitation, housing, roads and storm-water drainage, waste management, electricity (bills),
o Formalisation of informal settlements and provision of above services,
o Job creation for youth people and unskilled community members,
o Provision of social / recreational infrastructure such as parks and sports facilities, skills development centres and community halls,
o Safety and Security – Deployment and visibility of Metro police in townships and police stations amongst others, for crime reduction,
o Feedback on IDP issues and service delivery in general.
Service delivery issues emanating from developed wards (urban areas) are summarised as follows:
o Urban management and sustainability (pothole patching, robot repairs, management of open spaces)
o Turn-around time on repairs and maintenance of reported instances
o Traffic congestions,
o Job creation and access to economic activities presented by the,
o WiFi - internet connectivity
o Fraud and corruption
214

195
Regional Outreach meetings April 2016
These outreach meetings were targeting organised stakeholders such as youth formations, people living with disabilities, church organisations, NPO, NGO, business organisations etc. They were identified throughout all the seven (7) regions and invited to the regional outreach meetings per their respective region. The meetings were organised and held as follows:
REGION VENUE DATE
1 Halala community Hall 11th April 2016
2 Suurman Community Hall 11th April 2016
3 A Attridgeville Community Hall 11th April 2016
6 Mamelodi West Community Hall 11th April 2016
7 Rethabiseng Community Hall 11th April 2016
5 Lethabong 12th April 2016
3 B Sammy Marks Library Hall 12th April 2016
4 Olievenhoutsbosch Community Hall 12th April 2016
All the above meetings took place as planned. The table below summarises inputs which were received during the Regional Outreach meetings: Region Issues Raised
1 240 LITTER BINS. The community complains that they did not ask for the 240 litter bins and now the municipal rates have increased to more than double & they can’t afford them. This is exacerbated by the fact that, one household cannot fill the 240l anyway. So why should they pay for them? Tarring of roads. There are projects which were stopped and the community wants commitment that they will be prioritized in 2016/17. Dilapidated Buildings. Municipality to either demolish them or renovate the houses and use them for something else. IDP sessions to be localized and not high level
2 IDP to be presented per region per ward Cllrs to be present at IDP meetings Request for stands to build Churches, The municipality demolished the church structures but they don’t help churches to apply for sites to build again. Poor response from the regional office on maintenance issues (Water leakages and open manholes not attended to timeously) Street Naming process must include communities Inconsistency on electricity billing REDs office must consult with stakeholders & Cllrs to identify needs and areas of intervention for Kuka Maoto Ward 74 - Ext 1 community don’t have proper sanitation. They have ‘bucket system’ which can be called chemical toilets. Lack of proper transport - the community in general emphasized the request for a train from Hammanskraal Temba to the CBD Request for stands at Kanana Ext 3, there is land invasion in the area
3A Incomplete IDP projects identified in the area e.g. road project in Atteridgeville Provision of support and skills to local textile manufactures and local entrepreneurs. Limited sports fields space for local schools kids to participate in their various sports activities Deployment of Metro police officials to assist with scholar patrol activities at schools entrances to help control traffic caused by local taxis Provision of solar geezers for all houses and a flat rate for all municipal services (people not informed they will have to pay for 240 l bins) Provision of municipal offices or call center/service point in Atteridgeville west
3B The city to harvest water during raining days Leaking pipes at the shelter ( Struben no 2) The park that is in ward 60 to be used to build low cost houses as it is not being used.
215

196
The shelter in Struben Str, no.2 does not have the laundry and the kitchen Residents to be afforded an opportunity to buy electricity directly from Eskom
4 Bad storm water drainage system and water streams at Olievenhoutbosch Youth in Olievenhoutbosch must be employed for services / projects/programmes implemented at the area. No to employment of people outside the area including Tshepo 10 000 Demarcation of the CBD area of Olievenhoutbosch – then provide hawkers with selling stalls same as at the Pretoria CBD Metro police only working day shift – no night shift and crime normally takes place during the night No skips for waste management, illegal dumps everywhere RDP houses which are wheel chair compliant are required for the disabled Estimates are used to charge Ext 36 residents since there are not meters Metro buses not covering all the areas of Olievenhoutbosch, only old and unreliable buses are dispatched for Olievenhoutbosch as compared to other areas Request for extension of Clinic operating hours to 24hrs a day What prioritization model is used to determine funding and allocation of projects to wards/regions since projects that are to be implemented but the City are not projects required by the community as per the 3 priorities per ward
5 What is progress with the informal settlement on Pienaarspoort Sport tournaments are held across the city but not in the area. Notice of Tshwane organized sport events are communicated very late and it is difficult to organise teams to participate Formalisation is very slow and people are frustrated. Specifically Plot 45 Pienaarspoort Matter of formalisation of the Lethabong area is outstanding What is the situation on the establishment of ward committees? They are needed in all the City s processes. When will the elections of ward committees take place? Clean water, sanitation, electricity, roads and storm water required. Free WiFi also not available in their area Require clinic services in the area. There is a need to provide more frequent mobile clinic services to the area. Prioritisation is questioned – Do not see any projects in the area. Need high mast lights on the route to the station in Lethabong Need to understand the process to register for opportunities through supply chain
6 No questions were raised during the meeting, stakeholders were further requested to provide written submissions of the draft should they have any before the closing date
7 Site has been identified, the City to assist with proper demarcation and installation of services for RDP houses Inspection of water reservoir for possible increase in capacity The City not cooperating and working together with the chiefs in the area Extension of Wifi at Region 7 especially at community facilities No water (increase jojo tanks for farms) and electricity at Vaalpark and most areas of Sokhulumi Continuous maintenance and fencing at the clinic EPWP programme to consider more youth due to high unemployment in the area There is a need for the college in the area as the learners are travelling to Pretoria on a daily basis and costly for parents
During the above regional meetings, most of the issues raised centred on non- and slow implementation of some of the basic service delivery projects/priorities as identified by communities. Most of the issues were responded to by the Regional Directors and the deployed MMCs. The responses to general maintenance and refurbishment of infrastructure such as water and sewer networks, electricity, roads and storm-water were that resources have been allocated per region for such purposes and to be fast-tracked from the regional offices; and that projects such as Kuka Maoto which is targeted towards fast-tracking services delivery at regional level will be up scaled to be amongst the City programmes and possibly rolled-out on a fulltime basis due to its benefits since its inception.
216

197
Engagements with Traditional Councils/Authorities
Section 81 of the Municipal Structures Act, 1998 (Act 117 of 1998) provides for the participation of recognised traditional leaders in municipal councils. Section 4 of the Traditional Leadership and Governance Framework Act, 2003 (Act 41 of 2003) describes the functions of the traditional councils as, amongst others, to –
support the municipality in the identification of the needs of the community; and
facilitate the involvement of the traditional communities in the development and review of the municipal IDP for their respective areas.
There are two (2) recognised Traditional Councils within the boundaries of City of Tshwane, they are:
AmaNdebele-Ba-Lebelo Community of Kgosi Kgomotso Cornelius Kekana in Hammanskraal; and
AmaNdebele Ndzundza Sokhulumi Community of Kgosi Mkhambi Petrus Mahlangu
Engagements were held with these Traditional Councils on the 10th and 16th April 2016 respectively to also source their inputs and comments on the draft IDP. Both the Traditional Councils seemed very concerned with the level of provision of basic services within their communities, that their areas are underdeveloped, high unemployment amongst youth; key to the concerns especially by AmaNdebele Ndzundza Sokhulumi was lack of cooperation and working together between the City and the Traditional Council on matters of service delivery within their area.
Other interactive platforms
Further to the above outlined interactive platforms, the City continued to utilise digital izimbizo as another platform wherein communities were engaged through twitter to discuss service delivery matters in general and the IDP and budget in particular. Several written inputs and comments were also received through the [email protected] e-mail; these written comments were from ordinary members of the public, public representatives, business organisations and entities amongst others. Some of those are as follows: Person / Comment / input
Mr Vusi Khuma Reminding the City of the request for a park in the open space at Nyusela Sehloho section in ward 62
Mr Kobus Scheltema Raised a concern about vagrants in open spaces and vacant land along Steve Biko and Johan Heyns road in ward 53, further proposes that those open spaces/vacant land be redeveloped into warehouses and for car retailers.
Priscilla Botha – Hospital manager at Netcare Jacaranda Hospital
Suggest the City to consider a traffic circle at the entrance of the hospital at Middelberg street as well as speed humps between Johnston and Bourke street to restrict speeding along the hospital.
Brigadier General Robert B. King Acknowledged the effort put is developing the City’s plans; he further commented on the current state of the economy
217

198
as being in danger and that there is a need to support governments’ drive in promoting savings and focus spending on identified priorities (avoiding abuse of free electricity by putting more control measures). And that more attention should be given to improving job opportunities.
Martin Manthakha – SANCO Ward 100 Branch Chairperson Suggest that the proposed R10 million proposed for upgrading Refilwe stadium be re-allocated to speed-up the process formalization and provision of basic services at Lethabong, Onverwarcht and Phumzile Park respectively; they believe is that the stadium is not going to benefit most of the ward residents.
Coenie Bronkhorst – Six Fountains Residential Estate Manager
Upgrading and general maintenance of roads (roads belong to the City) and street lights in the estate.
Silver Lakes Homeowners Association and Willow Acres Homeowners Association
Upgrading and general maintenance of roads and electricity infrastructure. Widening of Von Backstrom boulevard between Silver Lakes Golf Estate and Solomon Mahlangu drive
Engagements with National Treasury
This was the second engagement with National Treasury and it took place from the 11th to 12th April 2016. This annual engagement focused the Spatial Development Framework / Built Environment Performance Plan (SDF / BEPP) as well as the draft IDP and budget. National Treasury commented that a lot has been done on the IDP to mainstream the implementation of Tshwane Vision 2055; the concern was mainly on the achievements of the City’s plans since the City’s revenue stream is mainly grants, and on bulk electricity.
Conclusion
The processes outlined above demonstrate the City’s commitment to fostering participatory democracy. All the received inputs and comments on the draft as presented have been noted, analysed and considered towards the finalisation of this document. All the comments and inputs which relates to repairs and maintenance of infrastructure will be referred to the relevant City departments and Regional Office for consideration and possible inclusion into their respective operational plans. Those comments and inputs that fall within the responsibilities of the provincial sector departments and other state-owned entities will be forwarded to the department of Cooperative Governance and Traditional Affairs for coordination of responses by relevant sector departments. The reports thereof once received, will be communicated through normal community and stakeholder engagements platforms such as ward community meetings.
The preliminary analysis also revealed new service delivery inputs which were submitted by ward councillors and communities and are now an addition to the already documented three (3) priorities per ward requiring long term capital planning and budgeting. Since these engagements were not meant for new needs identification; those new issues have also been documented separately and will form part of handover reports for incoming ward Councillors who will then determine the way forward in consultation with their respective ward communities.
218

199
Detailed information on allocated resources in response to some of the above community issues, reference can be made in chapter 8 (Capital Investment Framework) of this document; furthermore on the IDP scorecard in Chapter 10 which will have to be read together with the 2016/17 SDBIP Scorecard (once finalised and approved in June 2016).
REFERENCES 1. Arnstein, Sherry R. "A Ladder of Citizen Participation," JAIP, Vol. 35, No. 4, July 1969, pp. 216-
224. 2. George Brager, Harry Specht, James L. Torczyner: 1987: Community Organizing. Columbia
University Press, - Political Science – pp. 441 3. Davids, I. Theron, F. and Maphunye, J. (2009): Participatory Development in South Africa:
Development Management Perspective. 4. Davids, I. Theron, F. and Maphunye, J. (2009): Participatory Development in South Africa:
Development Management Perspective.
219

200
7. SPATIAL DEVELOPMENT FRAMEWORK (Summary)
Introduction
The Tshwane Metropolitan Spatial Development Framework (MSDF 2012) was adopted by the Council in June 2012. As a municipal statutory requirement serving as one of several municipal sector plans that are a component of the IDP, the focus for the relevance of the chapter will be on the spatial directives and guidelines, intended spatial outcomes, spatial targeting for unlocking investment in strategic localities as well as the analysis of the capital expenditure from a spatial perspective. This chapter discusses the City’s restructuring and spatial transformation elements as well as significant national projects that will have an impact on space in Tshwane and that are aimed at reversing the apartheid spatial form.
Purpose of the MSDF
The purpose of a spatial framework for the city is to provide a spatial representation of the City Vision and to be a tool to integrate all aspects of spatial (physical) planning such as land use planning; planning of a pedestrian, vehicular and other movement patters; planning regarding buildings and built-up areas; planning of open space systems; planning of roads and other service infrastructure; as well as to guide all decision-making processes regarding spatial (physical) development.
The MSDF aims to address the following towards the achievement of the City vision: Addressing social need; Restructuring of a spatially inefficient City; Promotion of sustainable use of land resources; Strategic direction around infrastructure provision; Creating opportunities for both rural and urban areas; Guiding developers and investors as to appropriate investment localities; and Rural management program.
The SDF must also comply with the requirements of Chapter 2 part 4 of the Local Government: Municipal Planning and Performance Management Regulations, 2001 and it must: Set out objectives that reflect the desired spatial form of the city; Contain strategies and policies regarding the manner in which the above
objective is to be achieved specifically with regard to indication of desirable land-use patterns, addressing spatial reconstruction of the city and the location and nature of development within the municipality will be achieved;
Set out a Capital Investment Framework for the municipality’s development programs;
Contain a strategic assessment of the environmental impact of the SDF; Identify programmes and projects for the development of land; Be aligned with the spatial development frameworks reflected in the integrated
development plans of neighbouring municipalities; Provide visual representation of the desired spatial form of the city, which
representation ;
220

201
Must indicate where public and private development and infrastructure investment should take place;
Must indicate desired or undesired utilisation of space in particular areas; May delineate the urban edge; Must identify areas where strategic intervention is required; and Must identify areas where priority spending is required In terms of the Municipal
Systems Act, the specific purpose of the SDF is to facilitate efficient land use management and sustainable development of the applicable area.
Hierarchy of Spatial Plans in Tshwane The MSDF represents the spatial interpretation of desired growth and development directions for the City. It spatially focuses economic and infrastructure development and gives spatial expression to the development plans, both for the long- and the medium term. This MSDF is informed by the legislative framework, national and provincial plans. In addition, existing planning within Tshwane was taken into account in conjunction with sound planning principles that are required in order to achieve the city vision. The purpose of a metropolitan spatial framework for the city is to provide a spatial representation of the city vision and to be a tool to integrate all aspects of spatial (physical) planning such as land use planning; planning for pedestrian movement vehicular and other movement patterns; planning regarding buildings and built-up areas; planning of open space systems; planning of roads and other service infrastructure; as well as to guide all decision-making processes regarding spatial (physical) development. Other sectoral plans for the city exist, e.g. Tshwane Integrated Transport Plan and Tshwane Environmental Policy. All of these plans seek to achieve the City vision as contained in Tshwane Vision 2055. The MSDF is a statutory requirement and focuses on the overall municipal/metropolitan scale. It is therefore important that, apart from the MSDF, an appropriate hierarchy of spatial development frameworks be developed, guided by the principles, objectives and intentions of the MSDF. These different spatial frameworks should focus on smaller geographical/functional areas and contain appropriately detailed guidelines to describe the context and intentions and contain meaningful proposals for potential developments. Each lower level spatial plan should support the higher level frameworks/plans that informed their formulation and may not be in contradiction with the higher level planning frameworks.
221

202
Figure 7.1: Hierarchy of Spatial Planning Documents and Enablers
222

203
Gauteng City Region
The Gauteng Spatial Development Framework (GSDF, 2011) elevates the prominence of Tshwane as part of the Gauteng Economic Core, an administrative capital city and home to the public sector is highlighted. The importance of the concentration of economic opportunities in the southern and eastern parts of Tshwane (now forming part of regions 5, 6 and 7) is also highlighted. The following five critical factors were identified in the GSDF and their spatial implications are included in the MSDF 2012:
Contained urban growth; Resource based economic development (resulting in the identification of the
economic core); Re-direction of urban growth (stabilise/limit growth in economically non-viable
areas, achieve growth on the land within the economic growth sphere); Protection of rural areas and enhancement of tourism and agricultural related
activities; and Increased access and mobility. The defined objective is to promote Gauteng as a Global City Region (GCR) i.e. “to build Gauteng into an integrated and globally competitive region where activities of different parts of the Province complement each other in consolidating Gauteng as an economic hub of Africa and internally recognized global city region”. The concept of global city regions can be traced back to the “world cities” idea by Hall (1966). The idea seeks to promote Gauteng’s development agenda by positioning the province as a globally competitive city region. The key objective is to reduce unemployment and poverty through promoting economic growth, integrated strategies and joint planning between the different spheres of government. The nodes of regional importance as contained in the Gauteng City Region Spatial Development Framework, as well as the regional transportation links are indicated. In terms of the spatial plan for Gauteng, the following are of specific importance for Tshwane:
Gauteng economic core, focussed along the R21 and N1 with Rosslyn as its northern anchor (and the Johannesburg CBD and OR Tambo International Airport in Ekurhuleni as the other anchors of the Economic Core);
The support of corridor development along the N1, and R21; The importance of the R21, N1, Proposed PWV9, N4 (towards Bronkhorstspruit)
and Proposed PWV2 as mobility spines; and Rosslyn, Mamelodi, Atteridgeville, Hammanskraal and Mabopane are highlighted
as important economic development nodes with the Tshwane metropolitan area.
Gauteng Spatial Development Framework
The G2055 initiative is an initiative aimed at preparing the Gauteng City Region for a population of approximately 28million people by 2055. The Gauteng 2055 GDS vision is for Gauteng to have a strong knowledge capital, be the hub of innovation to Africa, be a liveable, prosperous, competitive, equitable, accessible and sustainable City region. The initiative is spatially addressed in the Gauteng Spatial Development Framework (February, 2011).
223

204
The Gauteng Spatial Development Framework (GSDF) proposes future spatial structure for the Gauteng Province and is clear on the fact that growth must be structured and directed; not merely accepted and accommodated, and thus informs and guides the Tshwane MSDF with specific regards to the location and nature of the physical development in the province. The following five critical factors were identified in the GSDF:
Contained urban growth; Resource based economic development (resulting in the identification of the
economic core); Re-direction of urban growth (stabilise/limit growth in economically non-viable
areas, achieve growth on the land within the economic growth sphere); Protection of rural areas and enhancement of tourism and agricultural related
activities; and Increased access and mobility. The primary structuring elements identified within the GSDF are those of:
urban mixed-use activity nodes; open space and green system; public transit and movement routes; and urban corridors and activity spines.
Node hierarchy The GSDF defines nodes as being intense concentrations of activities, containing a mixture of uses such as retail, office, entertainment, community facilities and an adjoining residential component. A node can be oriented towards a local, neighbourhood, regional or city-wide community. The GSDF identifies a hierarchy of nodes that correspond with Tshwane nodes in the following manner: GSDF MSDF
Regional Node Capital Core/ Tshwane CBD
Primary Node Secondary Node
Metropolitan Node
Secondary Node Tertiary Node
Urban Core
Local Node Emerging Node
Specialist Node Specialised Nodes
Public transit and movement routes The GSDF indicates that the existing rail systems and BRT routes should form the basis of the transport system for Gauteng for both freight and public transport. The GSDF further takes cognisance of the proposed extended/upgraded rail links, providing a commuter line that connects Mabopane to Hammanskraal and Hammanskraal to the Capital Core (urban structuring initiative), as indicated in the Tshwane MSDF . It also indicates that the proposed Tshwane inner-rail loop of the
224
205
Tshwane MSDF would significantly increase urban consolidation potential as a well-located public, subsidized initiative. Urban corridors and activity spines The GSDF defines an urban corridor as being the largest of the urban structure elements, consisting of a combination of structuring elements at the metropolitan and regional scale of the urban environment. It is typically a linear element linking two metropolitan nodes, showing that it is origin and destination driven (i.e. it goes from somewhere important to somewhere important). A corridor of this nature is complex in profile and the mix of uses, resulting in varying development intensity and a width. On the other hand, an activity spine is a linear mixed-use element of urban structure containing an intense concentration of facilities which are all focused along a major transportation route. It is the focal point of an urban corridor or can be a separate element. The spine is traffic oriented, accessed through public and private transport. It carries various modes of traffic which give direct access to a range of high intensify land uses. Pedestrian movement in between passing trade characterizes the nature of the activity, supported by a strong residential component. Major Regional Corridors identified are:
N1 (Polokwane/Tshwane/JHB/Vaal/Bloemfontein/Cape Town); N 4 (Rustenburg/Tshwane/ Witbank);
Major Provincial Corridor:
R21 from Tshwane to OR Tambo International Airport
Consolidation and densification Given the comprehensive system of discernible urban corridors and public transport potential within Gauteng, consolidation of urban development should be concentrated around existing primary urban centres, urban nodes, and urban corridors and along urban activity spines.
Context of the development of the City of Tshwane
Tshwane’s historical spatial growth pattern shows that the spatial growth pattern was not as a result of planned growth. In its current form today, it began as a mono-centric city before the 1900s with the Capital Core (Pretoria CBD) the main economic hub. With the development of the rail network, the city grew to the immediate east and west areas, but the east and south of the city later became the growing areas of residential development and economic centres influenced by highly-skilled, higher income communities. The inclusion of the erstwhile North West Province municipal areas north of Tshwane further added new settlements in marginalized areas far-removed from any meaningful economic activities. These areas were developed where land was cheaper and rural in nature. The recent amalgamation with the erstwhile Metsweding Municipal further added to Tshwane’s land mass, but also providing some opportunities of linking Tshwane’s economic activities through the Maputo Corridor
225

206
to the east and Limpopo Tourism Corridor to the North, but it is the displaced communities that should be well-considered in the building of the Capital. The spatial structure of Tshwane comprises a large urban complex located in the western half of its area of jurisdiction, and a predominantly rural environment towards the east and north-east. The urban complex comprises a large residential component (yellow) with the previously disadvantaged communities and informal settlements (orange) being located on the peripheral parts of the urban complex – especially towards the north (the Ga-Rankuwa-Mabopane-Soshanguve- Winterveld-Temba complex); the east (Mamelodi-Eersterust); the west (Atteridgeville); and south (Olievenhoutbosch). The south-eastern suburbs of the metropolitan complex predominantly represent the higher income communities, and therefore also attract a large number of office and retail activities. The City of Tshwane has a multi-nodal structure with the Inner City/CBD being the dominant node in terms of economic activity and job opportunities. Tshwane’s expansive geographical area means that the city comprise of a vast area of diverse sub-areas, each with its own characteristics. From a planning perspective, the population density provides a good point of departure. The main areas of high and dense population is Soshanguve, Mamelodi and Atteridgeville. Hammanskraal and Ga-Rankuwa. It is interesting to note that some of the outlying areas of Tshwane is very sparsely populated. From an infrastructure investment point of view therefore, the notion of working towards a more compact city, and directing investment towards the more densely populated areas will result in more sustainable outcomes, a better economic return on investment and a better improvement on the overall liveability of Tshwane’s citizenry. The challenge for Tshwane going forward would be not to simply respond to these trends by trying to keep up with service delivery and housing, but to find ways of channelling the settlement of people in an economically sustainable way to alleviate some of the financial burden to accommodate the rampant growth. A comprehensive and integrated growth and infrastructure investment strategy should seek to realise these outcomes.
Spatial restructuring elements of the City
The City of Tshwane covers an area of 6 260 km² and, due to its vastness, it is characterised by –
low-density sprawl, which can be a result of low-density developments that are not aligned to principles of transit-oriented development (TOD) being implemented within nodal areas that are essentially targeted for high-density development or as a result of developments, whether high- or low-density, taking place in peripheral areas outside of those targeted for development within a specific time period;
fragmentation, which means that the “grain” of development is coarse, with isolated (introverted) pockets (or cells) connected by roads (and freeways) and frequently separated by buffers of under-utilised open space; and
226

207
separation of functions, which means that land uses, public facilities (urban elements), races and income groups are all separated by great distances.
The spatial development concept that addresses the above-mentioned spatial challenges is structured around the following building blocks:
Nodes and activity areas which address issues; Movement and connectivity; and Environmental structuring concept.
These three building blocks form the foundations for the nine spatial restructuring elements of the City which are depicted in Figure 7.2.
Figure 7.2: Spatial restructuring elements of the City
Strategic nodal investment and urban development zones will ensure economically sound growth management. Growth management is a spatial concept that encompasses all aspects that ensure efficient, optimal and sustainable development of the physical environment. A key principle of this concept is smart growth. This principle guides development in such a way that resources and services are provided in such a manner that they meet the demands of the affected population over the long term. This will ensure sustainable urban growth.
Nodal investment areas are those parts of the city where development should be focused. The widest variety of services and opportunities should be provided at nodal points, at degrees relative to their nodal status. The inner city is the primary node and capital core of the city and has thus been determined as a locality for
Spatial restructuring
Sustainable urban growth
Densification, eg along TRT
Strategic nodal investment
Urban development
zones
Public transport integration
(TRT) Sustainable human
settlements
Rural development management
Infrastructure management and
development
Green economy of spatial planning
227

208
specific urban development zones where the National Treasury will provide tax incentives for developments adhering to predefined criteria in accordance with the requirements of both the National Treasury and the Council’s resolution.
In the short to medium term, the key focus areas for development should be contained within a 25 km radius from the capital core (CBD). The rationale is based on sustainable principles which seek to improve efficiency and maximum utilisation of available resources. The following key considerations should be applied:
Where development already exists, a maintenance development strategy should be applied in the periphery areas in support of developing sustainable human settlements. This entails provision of new infrastructure, where required, as well as eradication of service backlogs
The provision of social infrastructure should be primarily focused on nodal areas in the form of multipurpose centres catering for health, education, safety and security, as well as customer care centres, emergency facilities and other state services prescribed to be provided for the benefit of serving larger communities
Figure 7.3: Sustainable urban growth
The urban edge, as reflected in the City’s seven Regional Spatial Development Frameworks (RSDFs) will, as a growth management tool, further contribute to the achievement of strategic objectives of the green economy of spatial planning. This can be done by conserving valuable environmental areas which would otherwise be compromised by development and by promoting the use of existing infrastructure through redevelopment, infill development and densification within the edge, thus
228

209
achieving sustainable development. The urban edge also encourages the economies to agglomerate within the edge and scattered secondary or emerging nodes to develop into consolidated primary nodes, as opposed to leapfrog development. The edge ensures the protection of land, an exhaustible resource, by encouraging brownfield instead of greenfield developments.
Rural development management is a component of the green economy of spatial planning. The NDP 2030 highlights the importance of rural areas, reminding us that despite population shifts from rural to urban areas, the health and well-being of the entire population still depends on rural goods and services: food, water, minerals, energy, biodiversity, natural and cultural experiences, labour and land. This will become increasingly clear in the next few decades, as resources become more constrained.
Infrastructure management and development is important in overcoming the high cost of providing bulk infrastructure in low-density areas; urban sprawl should be discouraged. It is imperative that available infrastructure within the nodes is used optimally. This requires densification and intensification of land uses through compaction and infill developments. Transit-oriented development will optimise the potential and infrastructure capacity of nodes while combating urban sprawl through movement between and connectivity of focus areas of development.
The sustainable human settlements concept is akin to the concept of nodal development in that it both aims to provide a range of services, amenities and residential options in an integrated location. Citizens are therefore given the choice to work, live and play with reduced need and cost for travel. Public transport integration is critical in this regard.
Tshwane’s future spatial growth
Tshwane’s spatial vision is to become a “spatially efficient capital city that is sustainable, competitive and resilient”. The rationale for the spatial restructuring elements is to ensure that the Spatial Development Framework is implemented through programmes and projects of the City. The key elements of the MSDF, as supported by the outlined spatial restructuring elements as outlined above, is depicted in Figure 7.4.
229

210
Figure 7.4: Spatial development concept for the City of Tshwane in line with the MSDF
Transformation of the urban space through the City Support Programme (CSP)
In recognition of the role of cities in the fulfilment of the key government objectives and to improve the spatial transformation through coordinated public investment, the National Treasury developed an urban network strategy which enforces a pro-poor/pro-growth approach to the development of cities. CSP work in Tshwane began after the approval of the 2012 MSDF, and is thus being incorporated within the framework of the MSDF, but applied with the support of the Built Environment Performance Plan, which is explained in the following section. The CSP strategy is aimed at the following:
Facilitating the eradication of spatial inequality to enable the creation of liveable, sustainable, resilient, efficient and integrated human settlements
Shifting infrastructure investments towards the creation of efficient and effective urban centres through an approach of spatial targeting of public investment, primarily infrastructure
Identification and investment in a city-wide interconnected hierarchy of strategic nodes and public transport links between and within nodes
To implement this strategy and to improve grant management, the National Treasury has further established the City Support Programme which seeks to accelerate the process of spatial transformation by influencing where and how public funds are invested in the urban environment in order to promote more functional, productive, inclusive and sustainable cities. The programme also seeks to coordinate funding
230

211
programmes, to link these to national regulatory reforms in the built environment and to support enhanced capacity in metropolitan municipalities themselves. The CSP has four components:
Core city governance implementation support Human settlements support Public transport support Climate resilience and sustainability support
One of the assumptions behind the CSP is that metropolitan municipalities should take prime responsibility for urban integration and management of the built environment on the basis of their superior knowledge of local needs and dynamics, and, because of their extensive powers, legitimacy and accountability for pursuing this role. These powers are being supplemented by the gradual transfer of additional responsibilities in housing, transport and spatial planning from the provincial and national spheres of government.
Metropolitan municipalities also have significant revenue-raising capabilities and borrowing powers that could and should contribute to the funding of additional infrastructure. There is therefore a powerful logic in metropolitan municipalities assuming strategic responsibility for planning and managing more integrated urban development. It makes obvious sense for metropolitan municipalities to lead this function. Formulating and applying appropriate urban indicators is an important part of the task. The national government will support and reward metropolitan municipalities for their performance in achieving better urban development outcomes through the instruments contained in the CSP.
The introduction of clearly defined performance measures to improve the performance of the built environment makes the CSP unique. In 2013/14, the Integrated City Development Grant (ICDG) was rolled out. It sought to incentivise municipalities to improve their built environment performance.
Based on the same principle, the City Support Programme identifies relevant indicators and targets for metropolitan municipalities and lays the foundation for assessing their capacity needs in terms of how to achieve these, i.e. the functions, tasks and competencies required. These indicators should be complemented by enhanced strategies, programmes, projects, incentives, partnerships with land owners, negotiations with developers and financiers, coordination with departmental infrastructure providers and revised regulations and land-use zoning schemes.
The City has participated in the development of the City Support Programme and has prepared the 2014/15 Built Environment Performance Plan in line with the new requirements centred on CSP principles. To demonstrate this, key integration zones as per the CSP requirements have been identified as follows:
Mabopane Urban Hub Atteridgeville Urban Hub Hammanskraal Urban Hub Mamelodi Urban Hub Ga-Rankuwa Urban Hub
231

212
The City has already done some work in these areas and any investment that is done by other spheres of government is ready for implementation. The sections below discuss each node and the interventions (existing and planned) to support the CSP. The following additional areas to form part of the programme in the future have also been identified:
Refilwe Urban Core Olievenhoutbosch Urban Core Ekangala Urban Core Zithobeni Urban Core
Atteridgeville Urban Hub
Atteridgeville in Region 3 is located west of the inner city. It is anchored by the Saulsville Station Precinct. As a primarily low-income area, growth is limited to the north by large extensive land uses that occupy land to the north and environmentally-sensitive areas to the west.
For development purposes, the areas should be considered for transit-oriented development, built environment upgrades, provision of social facilities and strategic management of informal settlements.
Mabopane Urban Hub
Mabopane falls in Region 1 of the City of Tshwane. Region 1 is divided by the N4 highway into a northern and southern portion. The southern portion includes Akasia, Rosslyn and Pretoria North and is more affluent, while the northern portion includes Winterveld, Soshanguve and Ga-Rankuwa, which remain poor. The southern portion of Region 1 offers limited employment opportunities, primarily in the Rosslyn area. As a result, many Soshanguve residents travel to the CBD for work.
Mabopane is functionally aligned with Soshanguve to the east and, in terms of the MSDF, the two complementary nodes constitute a single catchment area. The node is therefore referred to as Mabopane/Soshanguve in the MSDF.
From a spatial planning perspective, strategic interventions that have been proposed include social housing, mixed land uses in support of transit-oriented development, spatial integration and connectivity between Mabopane and Soshanguve.
The planning in and around Mabopane will be influenced by the approved Soshanguve/Klip-Kruisfontein Urban Design Framework of 2009 as depicted in the diagram below.
232

213
Mamelodi Urban Hub
Mamelodi is an urban core within Region 6 and also a Neighbourhood Development Partnership Grant (NDPG) beneficiary. It is well-located in terms of its proximity to the Menlyn metropolitan mode and the Waltloo and Silverton industrial areas. It is envisaged that the first phase of the TRT will link the CBD with Mamelodi via the Hatfield and Menlyn metropolitan nodes. However, there is no land left for the expansion of Mamelodi, and development will thus depend on re-development and urban re-generation projects, which are in line with the sustainable and growth management principles of the Tshwane MSDF.
Key focus areas in this regard are the provision of social facilities, higher density residential development and provision of a public realm.
Mamelodi is anchored by the Eerste Fabrieke, T-Section and Denneboom precincts.
The K16/Tsamaya Road, R104 (Stanza Bopape Street) and Pretoria Road provide east-west mobility. However, north-south mobility is restricted and limited to Watermeyer/Waltloo and Solomon Mahlangu Drive. Private sector interest in the area is steadily growing and is evident in the implementation of two new retail developments, Mamelodi Mall and Denneboom Mall.
233

214
Hammanskraal/Temba Urban Hub
The Hammanskraal node is in Region 2, south of the Babelegi industrial area and functionally aligned with the Temba node. The area to the south is a formal middle-income residential area, whereas the areas to the north and east are informal or recently upgraded low-income housing. The precinct includes the station and railway reserve, the Apies River floodplain, the business centre along Douglas Rens Road as well as Hammanskraal Extensions 1 and 2.
The Spatial Development Framework of 2014 makes the following proposals with regard to the spatial configuration of the Hammanskraal precinct area:
Hammanskraal and Temba comprise a single functional node. A railway line links the Hammanskraal station with the Soshanguve area. The
proposed line will run from Hammanskraal station, intersect with the proposed PWV 9 and terminate in the Soshanguve area in Tswaing Village No. 1.
A minor industrial strip is proposed directly north of the precinct (to the west of the K97).
The road and rail network should be improved to ensure that the entire community is accessible and that public transport will be able to serve virtually the entire community.
234

215
In terms of NDPG capital expenditure, a pedestrian bridge and road upgrades were planned for the Hammanskraal area during the 2014/15 financial year. Further projects that have been proposed from a strategic planning perspective include the revitalisation of Babelegi Industrial, the extension of Sefako Makgatho Drive to join Rachel de Beer Street and the general landscaping and streetscaping of various areas.
Ga-Rankuwa Urban Core
Ga-Rankuwa is located approximately 25 km north of the Tshwane CBD which also represents the majority of job opportunities in the metropolitan area. Approximately 5 km to the east of Ga-Rankuwa is the Rosslyn industrial area, while the Ga-Rankuwa industrial area is located in the north-western part of Ga-Rankuwa itself. The closest surrounding retail-based activity node to the Ga-Rankuwa area is Akasia Park, which is located about 5 km to the south of the Rosslyn industrial area, and the Mabopane CBD, which is located to the north-east.
Ga-Rankuwa residents largely depend on public transport, which is of a low standard in the region due to poor operational conditions that result in capacity problems. There is limited private sector investment in Ga-Rankuwa, as in the rest of the north of the region, resulting in backlogs in infrastructure provision and underdeveloped and less-than-desirable urban environments in some areas. Ga-Rankuwa therefore needs investment in the areas of –
service infrastructure; transport infrastructure; upgrading of the build environment; and economic development.
235

216
The Urban Networks Strategy (UNS), which encapsulates the NDPG, comes at an opportune time and gives a strategic opportunity to prioritise Ga-Rankuwa as an urban hub.
From a strategic spatial planning perspective, some proposals for Ga-Rankuwa include mixed-use development around focal points, non-motorised transport routes along key areas, electricity substation upgrades, a road upgrade to link with the N4 and a further link with Molefe Makinta Road.
All the above-mentioned proposed strategic interventions were identified during 2013 but are subject to further investigation and due diligence. During 2014, Mamelodi was identified as a pilot project within the CSP framework. During the 2014/15 financial year, the following were targeted for the Mamelodi Urban Hub using ICDG funding:
Status quo review Economic analysis and project packaging Infrastructure capacity assessment and plan Scientific analysis of basis for proposals using urban simulations
Projects that are identified for implementation will be captured within the Capital Investment Framework (CIF) which is a component of the Metropolitan Spatial
Ga-Rankuwa- Region 1
Ga-Ranguwa± 24 km from CBDUniversity City Concept to be Anchored by T.O.D
Mixed Use &Public Transport
Facility
Open Space Rehabilitation
TUT Proposal
Strategic Land parcelMixed Use Development
Housing, Municipal, Social & Retail
Medunsa George Mukhanri Hospital
Link RosslynMixed
Development
K212 Proposed AliLink to
N4/BakwenaPlatinum
Rama Development
Pedestrian friendlyCycle Paths
Lighting
Pedestrian friendlyCycle Paths
LightingPublic Art
236
217
Development Framework (MSDF) 2012 that is reviewed annually within the context of each financial year. Its purpose is to close the gap between spatial strategy and implementation by guiding and informing capital investment. The CIF will enable the City to use a single spatially-based platform for planning while allowing multiple stakeholders at various levels to engage on relevant issues and address the challenges of the IDP and its planning processes. The main objectives are to guide the City’s expenditure so that it is aligned with the MSDF 2012 and Tshwane Vision 2055, to provide for integration in the implementation of the City’s strategies and to ensure intergovernmental planning, thus catalysing effective service delivery.
237

218
8. CAPITAL INVESTMENT FRAMEWORK
Introduction
This chapter seeks to communicate the capital planning process and major projects for the City in line with the 2016-2019 MTREF and the Built Environment Performance Plan (BEPP) as was approved by the Council. The chapter summarises the details of the planned projects for the MTREF. These projects are ward-referenced and are used as a basis to determine some of the targets in the scorecard that is outlined later in the document.
The premise for compiling the BEPP was the BEPP/IDP/Budget 2015/16. It is a positional iteration on the approach the City will undertake with its 2016/17 capital budget in line with all mandatory legislative imperative. The City’s approach seeks to refine, enhance and consolidate the baseline established in 2015/16.
The Gauteng Spatial Development Framework (GSDF, 2011) elevates the prominence of Tshwane as part of the Gauteng Economic Core, where an administrative capital city and home to the public sector is highlighted. The importance of the concentration of economic opportunities in the southern and eastern parts of Tshwane (now forming part of Regions 5, 6 and 7) is also highlighted. The following five critical factors were identified in the GSDF and their spatial implications are included in the MSDF 2012 (Chapter 7):
Contained urban growth Resource-based economic development (resulting in the identification of the
economic core) Redirection of urban growth (stabilising/limiting growth in economically non-
viable areas, and achieving growth on the land within the economic growth sphere)
Protection of rural areas and enhancement of tourism and activities related to agriculture
Increased access and mobility The defined objective is to promote Gauteng as a global city region, i.e. “to build Gauteng into an integrated and globally competitive region where activities of different parts of the Province complement each other in consolidating Gauteng as an economic hub of Africa and internally recognized global city region”. This idea seeks to promote Gauteng’s development agenda by positioning the province as a globally competitive city region. The key objective is to reduce unemployment and poverty through promoting economic growth, integrated strategies and joint planning between the different spheres of government. The nodes of regional importance, as contained in the Gauteng City Region Spatial Development Framework, as well as the regional transportation links, are shown below. In terms of the spatial plan for Gauteng, the following are of specific importance for Tshwane:
238

219
Gauteng economic core, focused along the R21 and N1 with Rosslyn as its northern anchor (and the Johannesburg CBD and OR Tambo International Airport in Ekurhuleni as the other anchors of the economic core)
The support of corridor development along the N1 and R21 The importance of the R21, N1, proposed PWV9, N4 (towards Bronkhorstspruit)
and proposed PWV2 as mobility spines Rosslyn, Mamelodi, Atteridgeville, Hammanskraal and Mabopane are highlighted
as important economic development nodes in the Tshwane metropolitan area Automotive cluster/Pyramid Freight Hub and Wonderboom Airport identified by
Tshwane as significant economic nodes in the north
Figure 8.1: Gauteng city region strategic initiatives
Source: Gauteng Integrated Transport Master Plan (2025)
239

220
Figure 8.2: Integrated rapid public transport network
Capital budget
Budget guidelines related to the compilation of the 2016/17 capital budget were compiled in consultation with the City Planning and Development Department and IDP Office, and were used by departments as a basis for planning. Budget indicatives were issued to the City Planning Department to take into consideration and also to align budget proposals to departmental business plans, objectives and targets.
Departmental budget hearings were held in February 2016 by the Budget Steering Committee to assess capital budget proposals, the outcome of which was that departments were required to prioritise capital projects and resource allocations within the context of affordability, taking into account contractual obligations, ongoing infrastructure maintenance and executive commitments.
The compilation of the capital budget in terms of internal capacity (Council funds) is based on the application of sound financial management principles, which were considered during the compilation of the 2016/17 MTREF, in order to ensure that a financially sound and funded budget is tabled. Taking this into consideration, the internal funding capacity for the 2016/17, 2017/18 and 2018/19 financial years is R4.5 billion, R3.7 billion and R4 billion respectively.
240
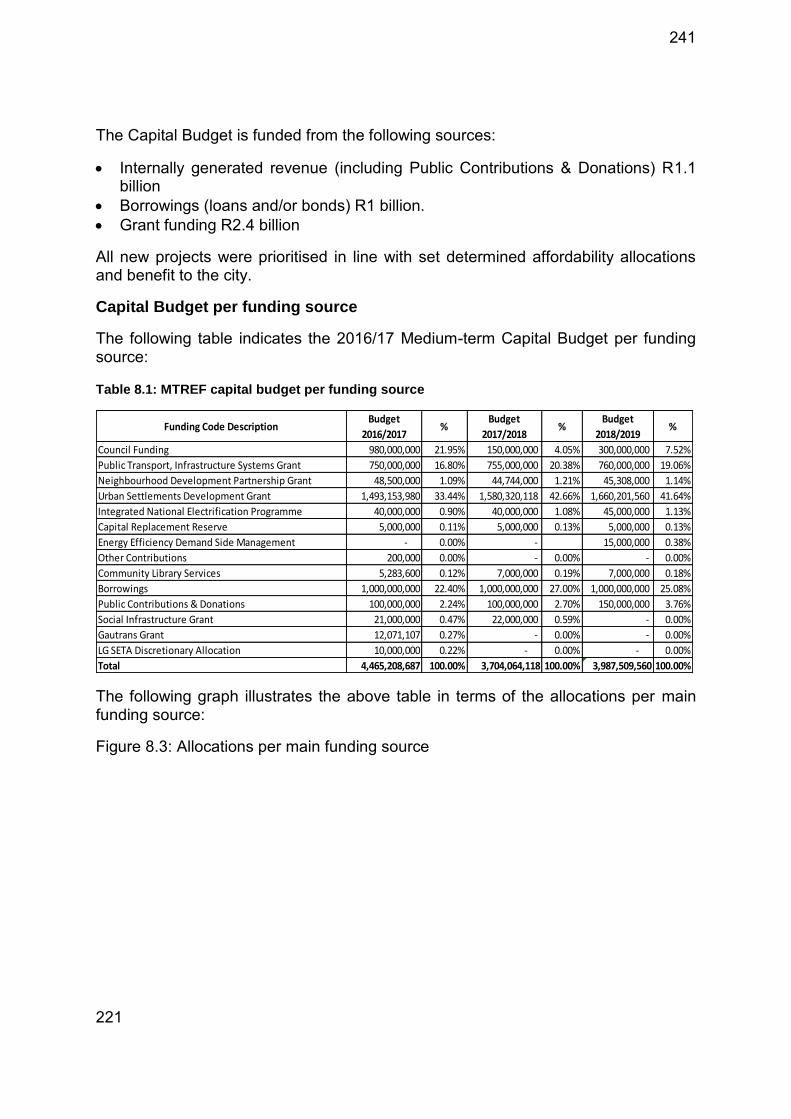
221
The Capital Budget is funded from the following sources:
Internally generated revenue (including Public Contributions & Donations) R1.1 billion
Borrowings (loans and/or bonds) R1 billion. Grant funding R2.4 billion
All new projects were prioritised in line with set determined affordability allocations and benefit to the city.
Capital Budget per funding source
The following table indicates the 2016/17 Medium-term Capital Budget per funding source:
Table 8.1: MTREF capital budget per funding source
The following graph illustrates the above table in terms of the allocations per main funding source:
Figure 8.3: Allocations per main funding source
Funding Code DescriptionBudget
2016/2017%
Budget
2017/2018%
Budget
2018/2019%
Council Funding 980,000,000 21.95% 150,000,000 4.05% 300,000,000 7.52%
Public Transport, Infrastructure Systems Grant 750,000,000 16.80% 755,000,000 20.38% 760,000,000 19.06%
Neighbourhood Development Partnership Grant 48,500,000 1.09% 44,744,000 1.21% 45,308,000 1.14%
Urban Settlements Development Grant 1,493,153,980 33.44% 1,580,320,118 42.66% 1,660,201,560 41.64%
Integrated National Electrification Programme 40,000,000 0.90% 40,000,000 1.08% 45,000,000 1.13%
Capital Replacement Reserve 5,000,000 0.11% 5,000,000 0.13% 5,000,000 0.13%
Energy Efficiency Demand Side Management - 0.00% - 15,000,000 0.38%
Other Contributions 200,000 0.00% - 0.00% - 0.00%
Community Library Services 5,283,600 0.12% 7,000,000 0.19% 7,000,000 0.18%
Borrowings 1,000,000,000 22.40% 1,000,000,000 27.00% 1,000,000,000 25.08%
Public Contributions & Donations 100,000,000 2.24% 100,000,000 2.70% 150,000,000 3.76%
Social Infrastructure Grant 21,000,000 0.47% 22,000,000 0.59% - 0.00%
Gautrans Grant 12,071,107 0.27% - 0.00% - 0.00%
LG SETA Discretionary Allocation 10,000,000 0.22% - 0.00% - 0.00%
Total 4,465,208,687 100.00% 3,704,064,118 100.00% 3,987,509,560 100.00%
241

222
The following should be noted with regard to conditional grants:
Urban Settlements Development Grant (USDG):
The USDG assists metropolitan municipalities to improve urban land production to the benefit of poor households, by supplementing the revenues of metropolitan municipalities to –
reduce the real average cost of urban land; increase the supply of well-located land; enhance tenure security and quality of life in informal settlements; improve spatial densities; and to subsidise the capital costs of acquiring land and providing basic services for
poor households.
The gazetted allocations amount to R1.5 billion, R1.6 billion and R1.7 billion in the 2016/17, 2017/18 and 2018/19 financial years respectively.
Public Transport, Infrastructure and Systems Grant:
This grant provides for accelerated planning, construction and improvement of public and non-motorised transport infrastructure and services. The gazetted allocations amount to R750.0 million, R755.0 million and R760.0 million in the 2016/17, 2017/18 and 2018/19 financial years respectively.
Neighbourhood Development Partnership Grant:
The purpose of this grant is to support neighbourhood development projects that provide community infrastructure and create the platform for other public and private sector development, towards improving the quality of life of residents in targeted underserviced neighbourhoods. R48.5 million, R44.7 million and R45.3 million have been gazetted for the 2016/17, 2017/18 and 2018/19 financial years respectively.
Integrated National Electrification Programme:
242

223
The purpose of this grant is to implement the Integrated National Electrification Programme (INEP) by providing capital subsidies to municipalities to address the electrification backlog of occupied residential dwellings, clinics and the installation of bulk infrastructure and rehabilitation and refurbishment of electricity infrastructure in order to improve the quality of supply. R40 million, R40 million and R45 million have been gazetted for the 2016/17, 2017/18 and 2018/19 financial years respectively.
Capital budget per department
The following table indicates the 2016/17 medium-term capital budget per department:
Table 8.2: Medium term capital budget per department
Some of the main projects and key focus areas of the budget and IDP to be addressed in 2016/17 financial year include amongst others:
City Planning and Development Redevelopment of Caledonian – R50million
Economic Development
Business Process Outsourcing Park in Hammanskraal – R50 million Brick Making Facility – R4 million Informal Trade Market (Inner City) – R7.4 million Tshwane Packaging Facility – R4 million
Energy and Electricity Electricity for All – R227.6 million New Bulk Infrastructure – R176 million New connections – R34.7 million 11kV Overhead Network – R14 million AMVI Infrastructure (smart meters) – R 950 million
Department Budget 2016/17 % Budget 2017/18 % Budget 2018/19 %
City Planning and Development 50,000,000 1.12% - 0.00% - 0.00%
Corporate and Shared Services 10,000,000 0.22% - 0.00% - 0.00%
Economic Development 65,400,000 1.46% 56,900,000 1.54% - 0.00%
Emergency Services 11,000,000 0.25% 11,000,000 0.30% 11,000,000 0.28%
Environmental Management 38,500,000 0.86% 39,000,000 1.05% 58,500,000 1.47%
Group Audit and Risk 10,000,000 0.22% 16,000,000 0.43% - 0.00%
Group Financial Services 65,000,000 1.46% 45,000,000 1.21% 45,000,000 1.13%
Group Information and Communication Technology 204,700,000 4.58% 140,500,000 3.79% - 0.00%
Group Property Management 5,000,000 0.11% 5,000,000 0.13% - 0.00%
Health and Social Development 50,900,000 1.14% 54,200,000 1.46% 12,000,000 0.30%
Housing and Human Settlement 537,704,001 12.04% 874,820,000 23.62% 1,025,508,909 25.72%
Metro Police Services 30,000,000 0.67% 10,000,000 0.27% 10,000,000 0.25%
Office of the City Manager 259,950,000 5.82% 128,744,000 3.48% 245,308,000 6.15%
Energy and Electricity 1,428,664,750 32.00% 418,312,146 11.29% 499,378,998 12.52%
Water and Sanitation 383,500,000 8.59% 573,304,248 15.48% 597,115,428 14.97%
Sports and Recreation 68,283,600 1.53% 62,000,000 1.67% 62,000,000 1.55%
Transport 1,246,606,336 27.92% 1,269,283,724 34.27% 1,421,698,225 35.65%
TOTAL CAPITAL BUDGET 4,465,208,687 100% 3,704,064,118 100% 3,987,509,560 100%
243

224
Environmental Management Extension of Ga-Rankuwa Cemetery – R2 million 240 Litre containers – R21 million Upgrading of the market trading system – R5.5 million Upgrading and extension of facilities – R5.5 million
Group Financial Services Improvement of the Supply Chain processes – R30million Security at Stores (CCTV and document management system) – R30 million
Health and Social Development Social Development Centre in Hammanskraal – R7 million Social Development Centre in Winterveld – R7 million Social Development Centre in Mabopane – R7 million Upgrading of Clinic Dispensaries – R14.5 million Multi-purpose Development Centres (Phomolong) – R7.7 million Refurbishment of Rayton Clinic – R7.7 million
Group Information and Communication Technology Upgrade of IT Networks – R30 million E-Initiative supporting the Smart City – R20 million Computer Equipment Deployment – R15.5 million Credit Control Solution – R20 million IT Infrastructure (Tshwane House) – R29 million
Housing and Human Settlement Project Linked Housing - Water Provision – R128.9 million Sewerage - Low Cost Housing – R153.4 million Roads and Storm water - Low Cost Housing – R193.7 million Project Linked Housing – Acquisition of Land – R31.4 million Hostels (Saulsville and Mamelodi) – R20 million
Metro Police Services Purchase of policing equipment – R30 million
Office of the City Manager
Implementation of the Tsosoloso Programme – R48.5 million City Hall Renovations – R20 million Re Aga Tshwane – R191.4 million
Sports and Recreational Services Olievenhoutbosch Multi-Purpose Sport Facility – R15 million Lotus Gardens Multi-Purpose Sport Facility – R8 million New Ga-Rankuwa Library –R10 million Upgrade Refilwe Stadium – R10 million Greening Sports fields – R20 million
Transport
244

225
Mabopane Station Modal Interchange – R54,1 million TRT - Transport Infrastructure - R750 million (busway; depots; stations and
non-motorized transport) Flooding backlogs: Networks and Drainage canals – R369.9 million Upgrading of Garsfontein Road – R12 million Internal Roads: Northern areas – R18,2 million Airport – R21.5 million
Water and Sanitation Reservoir Extensions – R50 million Replacement and Upgrading: Redundant Bulk Pipeline Infrastructure - R50.5
million Refurbishment of Water Networks and Backlog Eradication – R80 million Waste Water Treatment Works Facilities – R203 million
The following table reflect the detail capital projects per department contained in the 2016-2019 MTREF.
245

226
Table 8.4: Capital projects per department
Department Project Name Project Nr
WBS Level 3 Budget 2016/17 Budget 2017/18 Budget 2018/19 Ward Region
City Planning and Development
Redevelopment of Caledonian
712915 9.712915.1.015 R 50 000 000.00 - 81 Region 3
Total R 50 000 000.00 - -
Corporate and Shared Services
Tshwane Leadership and Management Academy
712953 9.712953.1.020 R 10 000 000.00 - - Tshwane Wide Tshwane Wide
Total R 10 000 000.00 - -
Group Property Management
Replacement/Modernization of all the Lifts within various Council Buildings
712743 9.712743.1.015 R 5 000 000.00 R 5 000 000.00 67,101,100,100,102,4,58,65,96,49,7
Tshwane Wide
Total R 5 000 000.00 R 5 000 000.00 -
Economic Development Tshwane Packaging Facility
712974 9.712974.1.015 R 4 000 000.00 - - 49 Region 2
Economic Development Brick Making Facility
712985 9.712985.1.015 R 4 000 000.00 - - 21,21,20,12 Region 1
Economic Development Informal Trade Market(Inner City)
712988 9.712988.1.015 R 7 400 000.00 R 6 900 000.00 - 58 Region 3
Economic Development Business Process Outsourcing Park
712977 9.712977.1.015 R 50 000 000.00 R 50 000 000.00 - 73 Region 2
Total R 65 400 000.00 R 56 900 000.00 -
Emergency Services Renovation & Upgrading Of Facilities
711455 9.711455.1.015 R 6 000 000.00 R 6 000 000.00 R 6 000 000.00 60,60,92,92,58,58,53,53,50,50,50,43,43,100,100,104,105,105,104,57,57,83,83,82,82,70,70
Tshwane Wide
Emergency Services Disaster risk management tools and equipment (Emergency
712587 9.712587.1.015 R 5 000 000.00 R 5 000 000.00 R 5 000 000.00 60 Region 3
246

227
Department Project Name Project Nr
WBS Level 3 Budget 2016/17 Budget 2017/18 Budget 2018/19 Ward Region
Services Tools and Equipment)
Total R 11 000 000.00 R 11 000 000.00 R 11 000 000.00
Energy and Electricity Payments to Townships for Reticulated Towns
710006 9.710006.1.016 R 22 328 530.00 R 4 000 000.00 R 5 000 000.00 Tshwane Wide Tshwane Wide
Energy and Electricity Low Voltage Network Within Towns
710177 9.710177.1.001 - - R 20 000 000.00 Tshwane Wide Tshwane Wide
Energy and Electricity Electricity for All (USDG)
710178 9.710178.2.005 R 187 664 750.00 R 155 500 000.00 R 195 000 000.00 12, 15, 16, 17, 20, 21, 24, 32, 33, 35, 40, 43, 44, 45, 47, 48, 49, 71, 74, 75
Multi Region
Energy and Electricity Electricity for All - Region 1
R 26 809 250.00 R 22 214 286.00 R 27 857 142.00 1,2,4,7,9,11,12,13,14,19,20,21,22,24,25,26,27,29,30,31,32,33,34,35,36,37,39,49,50,54,55,88,89,90,94,96,98
Region 1
Energy and Electricity Electricity for All - Region 2
R 26 809 250.00 R 22 214 286.00 R 27 857 143.00 1,2,3,4,5,7,41,42,43,46,47,48,50,51,52,53,54,55,56,57,58,59,60,61,62,63,66,68,71,72,79,80,81,82,83,84,87,92
Region 2
Energy and Electricity Electricity for All - Region 3
R 26 809 250.00 R 22 214 286.00 R 27 857 143.00 3,7,42,47,48,51,57,59,61,64,65,66,68,69,70,71,72,77,78,79,91
Region 3
Energy and Electricity Electricity for All - Region 4
R 26 809 250.00 R 22 214 286.00 R 27 857 143.00 3,7,42,47,48,51,57,59,61,64,65,66,68,69,70,71,72,77,78,79,91
Region 4
247

228
Department Project Name Project Nr
WBS Level 3 Budget 2016/17 Budget 2017/18 Budget 2018/19 Ward Region
Energy and Electricity Electricity for All - Region 5
R 26 809 250.00 R 22 214 286.00 R 27 857 143.00 5,10,16,17,40,43,52,73,84,87,93,96,97,99,100,101,102,103
Region 5
Energy and Electricity Electricity for All - Region 6
R 26 809 250.00 R 22 214 286.00 R 27 857 143.00 6,10,15,16,17,18,23,28,38,40,41,42,43,44,45,46,47,65,67,79,82,83,84,85,86,87,91,93,97,99,100,101,102,105
Region 6
Energy and Electricity Electricity for All - Region 7
R 26 809 250.00 R 22 214 284.00 R 27 857 143.00 100,101,102,103,104,105,105
Region 7
Energy and Electricity Electricity for All (INEP)
710178 9.710178.2.006 R 40 000 000.00 R 40 000 000.00 R 45 000 000.00 12, 15, 16, 17, 20, 21, 24, 32, 33, 35, 40, 43, 44, 45, 47, 48, 49, 71, 74, 75
Multi Region
Energy and Electricity Electricity for All - Region 1
R 5 714 286.00 R 5 714 286.00 R 6 428 572.00 1,2,4,7,9,11,12,13,14,19,20,21,22,24,25,26,27,29,30,31,32,33,34,35,36,37,39,49,50,54,55,88,89,90,94,96,98
Region 1
Energy and Electricity Electricity for All - Region 2
R 5 714 286.00 R 5 714 286.00 R 6 428 572.00 1,2,3,4,5,7,41,42,43,46,47,48,50,51,52,53,54,55,56,57,58,59,60,61,62,63,66,68,71,72,79,80,81,82,83,84,87,92
Region 2
Energy and Electricity Electricity for All - Region 3
R 5 714 286.00 R 5 714 286.00 R 6 428 572.00 3,7,42,47,48,51,57,59,61,64,65,66,68,69,70,71,72,77,78,79,91
Region 3
Energy and Electricity Electricity for All - Region 4
R 5 714 286.00 R 5 714 286.00 R 6 428 572.00 3,7,42,47,48,51,57,59,61,64,65,66,68,69,70,71,72,77,78,79,91
Region 4
248

229
Department Project Name Project Nr
WBS Level 3 Budget 2016/17 Budget 2017/18 Budget 2018/19 Ward Region
Energy and Electricity Electricity for All - Region 5
R 5 714 286.00 R 5 714 286.00 R 6 428 572.00 5,10,16,17,40,43,52,73,84,87,93,96,97,99,100,101,102,103
Region 5
Energy and Electricity Electricity for All - Region 6
R 5 714 286.00 R 5 714 286.00 R 6 428 570.00 6,10,15,16,17,18,23,28,38,40,41,42,43,44,45,46,47,65,67,79,82,83,84,85,86,87,91,93,97,99,100,101,102,105
Region 6
Energy and Electricity Electricity for All - Region 7
R 5 714 284.00 R 5 714 284.00 R 6 428 570.00 100,101,102,103,104,105,105
Region 7
Energy and Electricity Electricity for All (Borrowings)
710178 9.710178.2.015 - R 30 000 000.00 R 45 000 000.00 12, 15, 16, 17, 20, 21, 24, 32, 33, 35, 40, 43, 44, 45, 47, 48, 49, 71, 74, 75
Multi Region
Energy and Electricity Electricity for All - Region 1
- R 4 285 714.00 R 6 428 571.00 1,2,4,7,9,11,12,13,14,19,20,21,22,24,25,26,27,29,30,31,32,33,34,35,36,37,39,49,50,54,55,88,89,90,94,96,98
Region 1
Energy and Electricity Electricity for All - Region 2
- R 4 285 714.00 R 6 428 571.00 1,2,3,4,5,7,41,42,43,46,47,48,50,51,52,53,54,55,56,57,58,59,60,61,62,63,66,68,71,72,79,80,81,82,83,84,87,92
Region 2
Energy and Electricity Electricity for All - Region 3
- R 4 285 714.00 R 6 428 571.00 3,7,42,47,48,51,57,59,61,64,65,66,68,69,70,71,72,77,78,79,91
Region 3
Energy and Electricity Electricity for All - Region 4
- R 4 285 714.00 R 6 428 571.00 3,7,42,47,48,51,57,59,61,64,65,66,68,69,70,71,72,77,78,79,91
Region 4
249

230
Department Project Name Project Nr
WBS Level 3 Budget 2016/17 Budget 2017/18 Budget 2018/19 Ward Region
Energy and Electricity Electricity for All - Region 5
- R 4 285 714.00 R 6 428 572.00 5,10,16,17,40,43,52,73,84,87,93,96,97,99,100,101,102,103
Region 5
Energy and Electricity Electricity for All - Region 6
- R 4 285 714.00 R 6 428 572.00 6,10,15,16,17,18,23,28,38,40,41,42,43,44,45,46,47,65,67,79,82,83,84,85,86,87,91,93,97,99,100,101,102,105
Region 6
Energy and Electricity Electricity for All - Region 7
- R 4 285 716.00 R 6 428 572.00 100,101,102,103,104,105,105
Region 7
Energy and Electricity Strengthening 11kV Overhead Network
710481 9.710481.1.005 R 14 000 000.00 - - Tshwane Wide Tshwane Wide
Energy and Electricity Strengthening 11kV Overhead Network
710481 9.710481.1.016 - R 12 500 000.00 R 13 000 000.00 Tshwane Wide Tshwane Wide
Energy and Electricity Replacement of Obsolete And non-functional Equipment
712006 9.712006.1.016 R 4 000 000.00 R 1 000 000.00 R 1 500 000.00 41, 42, 43, 44, 45, 46, 47, 52
Region 6
Energy and Electricity New Bulk Infrastructure (USDG)
712279 9.712279.1.005 R 26 000 000.00 R 602 995.00 - 2, 4, 10, 40, 50, 57 Tshwane Wide
Energy and Electricity Wildebees 400/132KV Infeed Station
R 26 000 000.00 R 602 995.00 -
Energy and Electricity New Bulk Infrastructure (Borrowings)
712279 9.712279.1.015 R 150 000 000.00 R 129 000 000.00 - 2, 4, 10, 40, 50, 57 Tshwane Wide
Energy and Electricity Bronkhorstspruit 132/11kv substation
R 14 218 010.00 R 12 000 000.00 - 102,105 Region7
Energy and Electricity Eldoraigne 132/11kv Substation
R 35 545 024.00 R 2 000 000.00 - 69 Region 4
250

231
Department Project Name Project Nr
WBS Level 3 Budget 2016/17 Budget 2017/18 Budget 2018/19 Ward Region
Energy and Electricity Heatherley 132/11KV substation
R 29 857 820.00 - 40 Region 6
Energy and Electricity Kentron 132/11kv Substation refurbishment
R 10 663 507.00 R 20 000 000.00 - 78 Region 4
Energy and Electricity Mamelodi-3 132/11kv substation (2 x 40MVA Power Transformers)
R 31 990 520.00 R 5 000 000.00 - 99 Region 5
Energy and Electricity Monavoni 132/11KV Substation
R 20 616 114.00 R 30 000 000.00 64,70,77 Region 4
Energy and Electricity Soshanguve JJ 132/11KV Substation
R 7 109 005.00 R 60 000 000.00 11 Region 1
Energy and Electricity New Bulk Infrastructure (Public Contributions)
712279 9.712279.1.016 - R 22 397 005.00 R 38 000 000.00
Energy and Electricity Wildebees 400/132KV Infeed Station
- R 22 397 005.00 R 12 063 492.00 40 Region 6
Energy and Electricity Bronkhorstspruit 132/11kv substation
- - R 1 809 524.00 102,105 Region7
Energy and Electricity Kentron 132/11kv Substation refurbishment
- - R 3 015 873.00 78 Region 4
Energy and Electricity Soshanguve JJ 132KV Power Line
- - R 21 111 111.00 11 Region 1
Energy and Electricity New Connections 712483 9.712483.1.016 R 34 671 470.00 R 23 312 146.00 R 60 000 000.00 Tshwane Wide Tshwane Wide
251

232
Department Project Name Project Nr
WBS Level 3 Budget 2016/17 Budget 2017/18 Budget 2018/19 Ward Region
Energy and Electricity Stand by quarters 712601 9.712601.1.001 - - R 8 000 000.00 Tshwane Wide Tshwane Wide
Energy and Electricity Energy Efficiency and Demand Side Management
712688 9.712688.1.008 - - R 15 000 000.00 Tshwane Wide Tshwane Wide
Energy and Electricity Construction of Centralised Engineering Support
713008 9.713008.1.015 - - R 10 000 000.00 55 Tshwane Wide
Energy and Electricity Digital Trunked Radio Communication
713009 9.713009.1.015 - - R 18 000 000.00 Tshwane Wide Tshwane Wide
Energy and Electricity Infrastructure Fault Reporting and Dispatch
713010 9.713010.1.015 - - R 10 000 000.00 Tshwane Wide Tshwane Wide
Energy and Electricity Rebuild IE lines Doornkloof AH, New Poles and MV
713011 9.713011.1.015 - - R 2 250 000.00 Tshwane Wide Tshwane Wide
Energy and Electricity Rebuilt IW Irene Doorkloof AH
713013 9.713013.1.015 - - R 1 200 000.00 Tshwane Wide Tshwane Wide
Energy and Electricity Replace dangerous and Obsolete ODS- Clubview
713014 9.713014.1.015 - - R 1 200 000.00 Tshwane Wide Tshwane Wide
Energy and Electricity Replace dangerous and Obsolete Tricon
713015 9.713015.1.015 - - R 7 200 000.00 Tshwane Wide Tshwane Wide
Energy and Electricity Replace dangerous meter boxes in PVR
713016 9.713016.1.015 - - R 1 500 000.00 Tshwane Wide Tshwane Wide
Energy and Electricity Replace Vandalised low voltage networks- Laudium
713017 9.713017.1.016 - - R 851 000.00 Tshwane Wide Tshwane Wide
Energy and Electricity Replace 713018 9.713018.1.016 - - R 976 000.00 Tshwane Wide Tshwane
252
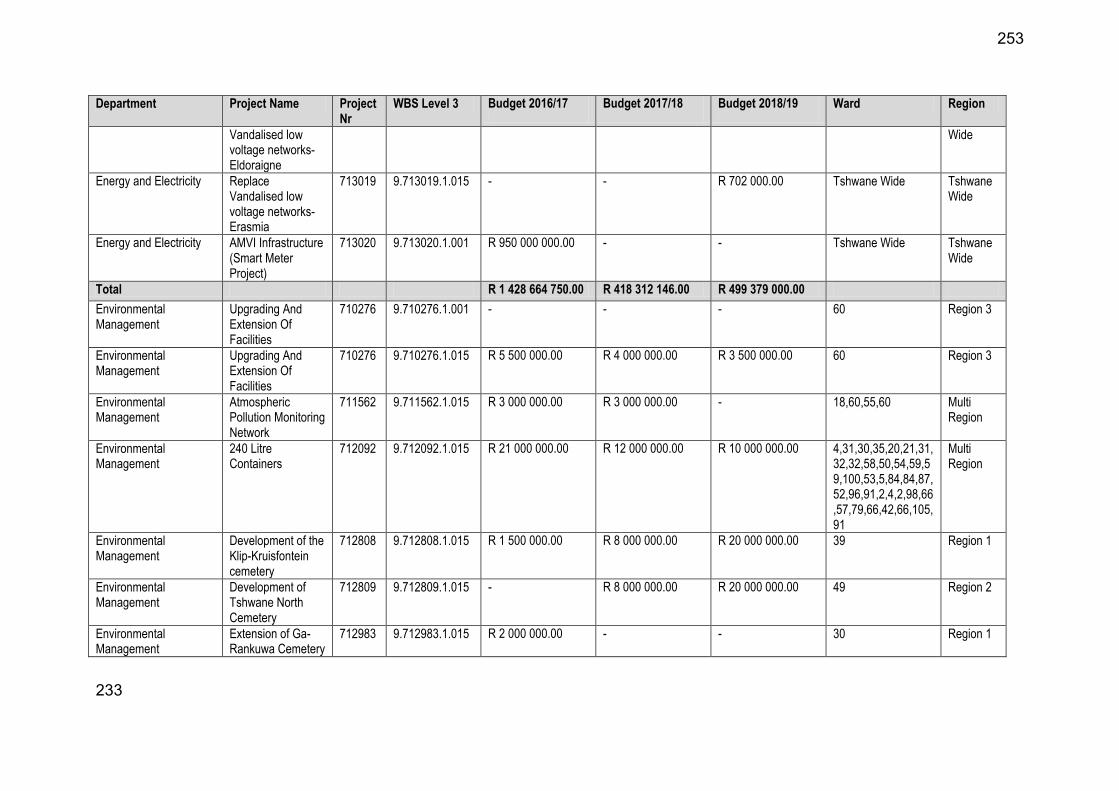
233
Department Project Name Project Nr
WBS Level 3 Budget 2016/17 Budget 2017/18 Budget 2018/19 Ward Region
Vandalised low voltage networks- Eldoraigne
Wide
Energy and Electricity Replace Vandalised low voltage networks- Erasmia
713019 9.713019.1.015 - - R 702 000.00 Tshwane Wide Tshwane Wide
Energy and Electricity AMVI Infrastructure (Smart Meter Project)
713020 9.713020.1.001 R 950 000 000.00 - - Tshwane Wide Tshwane Wide
Total R 1 428 664 750.00 R 418 312 146.00 R 499 379 000.00
Environmental Management
Upgrading And Extension Of Facilities
710276 9.710276.1.001 - - - 60 Region 3
Environmental Management
Upgrading And Extension Of Facilities
710276 9.710276.1.015 R 5 500 000.00 R 4 000 000.00 R 3 500 000.00 60 Region 3
Environmental Management
Atmospheric Pollution Monitoring Network
711562 9.711562.1.015 R 3 000 000.00 R 3 000 000.00 - 18,60,55,60 Multi Region
Environmental Management
240 Litre Containers
712092 9.712092.1.015 R 21 000 000.00 R 12 000 000.00 R 10 000 000.00 4,31,30,35,20,21,31,32,32,58,50,54,59,59,100,53,5,84,84,87,52,96,91,2,4,2,98,66,57,79,66,42,66,105,91
Multi Region
Environmental Management
Development of the Klip-Kruisfontein cemetery
712808 9.712808.1.015 R 1 500 000.00 R 8 000 000.00 R 20 000 000.00 39 Region 1
Environmental Management
Development of Tshwane North Cemetery
712809 9.712809.1.015 - R 8 000 000.00 R 20 000 000.00 49 Region 2
Environmental Management
Extension of Ga-Rankuwa Cemetery
712983 9.712983.1.015 R 2 000 000.00 - - 30 Region 1
253

234
Department Project Name Project Nr
WBS Level 3 Budget 2016/17 Budget 2017/18 Budget 2018/19 Ward Region
Environmental Management
Upgrading of the market trading system
712868 9.712868.1.015 R 5 500 000.00 R 4 000 000.00 R 5 000 000.00 60 Region 3
Total R 38 500 000.00 R 39 000 000.00 R 58 500 000.00
Group Audit and Risk Insurance replacements (CTMM Contribution)
712449 9.712449.1.001 R 5 000 000.00 R 8 000 000.00 - Tshwane Wide Tshwane Wide
Group Audit and Risk Insurance replacements (CTMM Contribution)
712449 9.712449.1.015 - - - Tshwane Wide Tshwane Wide
Group Audit and Risk Insurance replacements
712450 9.712450.1.001 R 5 000 000.00 R 8 000 000.00 Tshwane Wide Tshwane Wide
Total R 10 000 000.00 R 16 000 000.00 -
Group Financial Services
Buildings & Equipment
712444 9.712444.1.001 R 20 000 000.00 - - Tshwane Wide Tshwane Wide
Group Financial Services
Buildings & Equipment
712444 9.712444.1.015 R 10 000 000.00 R 10 000 000.00 R 10 000 000.00 Tshwane Wide Tshwane Wide
Group Financial Services
Capital Moveable’s 712755 9.712755.1.012 - - - Tshwane Wide Tshwane Wide
Group Financial Services
Automation of Supply Chain
712978 9.712978.1.015 R 30 000 000.00 R 30 000 000.00 R 30 000 000.00 Tshwane Wide Tshwane Wide
Group Financial Services
Corporate Capital Movables
712989 9.712989.1.007 R 5 000 000.00 R 5 000 000.00 R 5 000 000.00 Tshwane Wide Tshwane Wide
Total R 65 000 000.00 R 45 000 000.00 R 45 000 000.00
Group Information and Communication Technology
Upgrade Of IT Networks
710200 9.710200.1.015 R 30 000 000.00 R 20 000 000.00 - Tshwane Wide Tshwane Wide
Group Information and Communication Technology
One Integrated Transaction Processing System
710213 9.710213.1.015 R 25 000 000.00 R 25 000 000.00 - 80 Tshwane Wide
Group Information and Computer 710268 9.710268.1.015 R 15 500 000.00 R 15 500 000.00 - 3 Tshwane
254

235
Department Project Name Project Nr
WBS Level 3 Budget 2016/17 Budget 2017/18 Budget 2018/19 Ward Region
Communication Technology
Equipment Deployment - End user computer hardware equipment
Wide
Group Information and Communication Technology
Implementation Of Storage Area Network
710344 9.710344.1.015 R 15 000 000.00 R 20 000 000.00 - 58 Tshwane Wide
Group Information and Communication Technology
E-Initiative Supporting the Smart City
712554 9.712554.1.015 R 20 000 000.00 R 25 000 000.00 - 58 Tshwane Wide
Group Information and Communication Technology
Disaster Recovery System Storage
712950 9.712950.1.015 R 20 000 000.00 R 20 000 000.00 - 58 Tshwane Wide
Group Information and Communication Technology
BPC and SCOA 712961 9.712961.1.015 R 30 000 000.00 - - 80 Tshwane Wide
Group Information and Communication Technology
Credit Control Solution
712969 9.712969.1.015 R 20 000 000.00 R 15 000 000.00 - Tshwane Wide Tshwane Wide
Group Information and Communication Technology
Smart Connect 712981 9.712981.1.010 R 200 000.00 - - 80 Tshwane Wide
Group Information and Communication Technology
IT infrastructure -Tshwane House
713005 9.713005.1.015 R 29 000 000.00 - - Tshwane Wide Tshwane Wide
Total R 204 700 000.00 R 140 500 000.00 -
Health and Social Development
Upgrade Workflow System For Health-ERP
712028 9.712028.1.001 - R 7 000 000.00 R 7 000 000.00 1, 3, 4, 7, 18, 28, 40, 41, 43, 45, 48, 60, 61, 62, 64, 65, 66, 68, 69, 71, 72
Tshwane Wide
Health and Social Development
Upgrading Of Clinic Dispensaries
712278 9.712278.1.015 R 14 500 000.00 R 5 000 000.00 R 5 000 000.00 23 Region 6
255

236
Department Project Name Project Nr
WBS Level 3 Budget 2016/17 Budget 2017/18 Budget 2018/19 Ward Region
Health and Social Development
Multipurpose Development Centres: Phomolong Clinic
712681 9.712681.1.015 R 7 700 000.00 R 7 700 000.00 - 71 Tshwane Wide
Health and Social Development
Refurbishment of Rayton Clinic
712684 9.712684.1.015 R 7 700 000.00 R 12 500 000.00 - 100 Region 5
Health and Social Development
Social Development center in Hammanskraal
712948 9.712948.1.017 R 7 000 000.00 R 11 000 000.00 - 49 Region 2
Health and Social Development
Social Development center in Winterveld
712954 9.712954.1.017 R 7 000 000.00 R 11 000 000.00 - 94 Region 1
Health and Social Development
Social Development center in Mabopane
712955 9.712955.1.017 R 7 000 000.00 - - 21 Region 1
Total R 50 900 000.00 R 54 200 000.00 R 12 000 000.00
Housing and Human Settlement
Project Linked Housing - Water Provision
710863 9.710863.2.005 R 128 909 831.00 R 200 000 000.00 R 290 185 797.00 14, 74 Region 2
Housing and Human
Settlement Chantel x39 R 9 687 500.00 - - 4 Region 1
Housing and Human
Settlement Fortwest 4&5 R 20 000 000.00 - - 7 Region 3
Housing and Human
Settlement Kirkney / Andeon South
R 6 250 000.00 - - 55 Region 3
Housing and Human
Settlement Kopanong phase 2 R 8 000 000.00 - - 20,39 Region 1
256

237
Department Project Name Project Nr
WBS Level 3 Budget 2016/17 Budget 2017/18 Budget 2018/19 Ward Region
Housing and Human
Settlement Lotus Gardens R 5 000 000.00 - - 7 Region 3
Housing and Human
Settlement Mabopane Ext 1 R 10 000 000.00 - - 22 Region 1
Housing and Human
Settlement Temba View X1 - Bulk line connection (water & sewer)
R 11 754 906.00 - - 49 Region 2
Housing and Human
Settlement Rama City R 17 500 000.00 R 200 000 000.00 32 Region 1
Housing and Human
Settlement Soutpan (phase 2) R 7 000 000.00 - - 13,14 Region 1
Housing and Human
Settlement Sunnyside R 3 000 000.00 - - 59 Region 3
Housing and Human
Settlement Zithobeni 8&9 R 30 717 425.00 - - 102,102 Region 7
Housing and Human
Settlement Water provision - Low cost housing 2018/19
- - R 290 185 797.00 Tshwane Wide Tshwane Wide
Housing and Human
Settlement Sewerage - Low Cost Housing
710864 9.710864.2.005 R 153 437 500.00 R 250 000 000.00 R 300 000 000.00 7, 30, 40, 55, 74 Region 2
Housing and Human
Settlement Chantel x39 R 9 687 500.00 - - 4 Region 1
Housing and Human
Settlement Fortwest 4&5 R 20 000 000.00 - - 7 Region 3
Housing and Human Kirkney / Andeon South
R 6 250 000.00 - - 55 Region 3
257

238
Department Project Name Project Nr
WBS Level 3 Budget 2016/17 Budget 2017/18 Budget 2018/19 Ward Region
Settlement
Housing and Human
Settlement Kopanong Ext 1 R 8 000 000.00 - - 20,39 Region 1
Housing and Human
Settlement Lotus Gardens R 5 000 000.00 - - 7 Region 3
Housing and Human
Settlement Mabopane Ext 1 R 10 000 000.00 - - 22 Region 1
Housing and Human
Settlement Rama City - R 250 000 000.00 32 Region 1
Housing and Human
Settlement Refilwe Manor Ext 9 - Reservoir 10Ml and Construction of 1.5KL/day sewer pump station
R 45 000 000.00 - - 100 Region 5
Housing and Human
Settlement Soutpan (phase 2) R 7 000 000.00 - - 13,14 Region 1
Housing and Human
Settlement Sunnyside R 3 000 000.00 - - 59 Region 3
Housing and Human
Settlement Zithobeni 8&9 R 15 000 000.00 - - 102,102 Region 7
Housing and Human
Settlement Zithobeni Heights R 7 000 000.00 - - 102,105 Region 7
Housing and Human
Settlement Sewer provision - Low cost housing 2018/19
- - R 300 000 000.00 Tshwane Wide Tshwane Wide
Housing and Human Roads & Storm water - Low Cost
710865 9.710865.2.001 - - R 191 557 716.00
258

239
Department Project Name Project Nr
WBS Level 3 Budget 2016/17 Budget 2017/18 Budget 2018/19 Ward Region
Settlement Housing
Housing and Human
Settlement Construction of Roads 2018/19
R 191 557 716.00
Housing and Human
Settlement Roads & Storm water - Low Cost Housing
710865 9.710865.2.005 R 193 739 207.00 R 300 561 250.00 R 98 442 284.00 12, 23, 30, 33, 34, 35, 36, 37, 39, 48, 49
Region 1
Housing and Human
Settlement Fortwest 4&5 - R 21 468 750.00 - - 7 Region 3
Housing and Human
Settlement Olievenhoutbosch 60
- R 20 250 000.00 - - 77 Region 4
Housing and Human
Settlement Soshanguve X12 - R 18 906 250.00 R 103 714 798.00 - 90 Region 1
Housing and Human
Settlement Soshanguve X13 - R 15 587 130.00 - - 90 Region 1
Housing and Human
Settlement Soshanguve X5 - R 24 527 077.00 - - 90 Region 1
Housing and Human
Settlement Thorntreeview - R 45 000 000.00 R 126 997 711.00 - 36,89,90 Region 1
Housing and Human
Settlement Winterveld - R 24 000 000.00 R 69 848 741.00 - 19,24 Region 1
Housing and Human
Settlement Zithobeni Ext 8&9 - R 24 000 000.00 - - 102,102 Region 7
Housing and Human
Settlement Project Linked Housing - Acquisition Of Land
710868 9.710868.2.005 R 31 358 713.00 - - 57,100,105 Multi Region
259

240
Department Project Name Project Nr
WBS Level 3 Budget 2016/17 Budget 2017/18 Budget 2018/19 Ward Region
Housing and Human
Settlement Land acquisitions (Region 7, 5 and 4)
R 31 358 713.00 - - 57,100,105 Multi Region
Housing and Human
Settlement Project Linked Housing - Acquisition Of Land
710868 9.710868.2.015 - - R 145 323 112.00 57,100,105 Multi Region
Housing and Human
Settlement Land Acquisition 2017/18 and 2018/19
- - R 145 323 112.00 Tshwane Wide Tshwane Wide
Housing and Human
Settlement Townlands - Marabastad
713003 9.713003.1.005 R 10 258 750.00 R 124 258 750.00 - 60 Region 3
Housing and Human
Settlement Redevelopment Of Hostels: Saulsville(Phase 3b and 4a)
711712 9.711712.2.005 R 10 000 000.00 - - 63 Region 3
Housing and Human
Settlement Redevelopment Of Hostels: Mamelodi
711713 9.711713.1.005 R 10 000 000.00 - - 38,67 Region 6
Total R 537 704 001.00 R 874 820 000.00 R 1 025 508 909.00
Metro Police Services Purchasing of policing equipment
712500 9.712500.1.015 R 30 000 000.00 R 10 000 000.00 R 10 000 000.00 58 Region 3
Total R 30 000 000.00 R 10 000 000.00 R 10 000 000.00
Office of the City Manager
Implementation of Tsosoloso Programme
712533 9.712533.1.001 - R 51 787 539.00 - Multi Region Multi Region
Office of the City
Manager Construction of Roads and Walkways in Olievenhoutbosch ( Council Funding )
- R 12 000 000.00 - 48,77,77 Region 4
Office of the City
Manager Garankuwa Walkways (Council funding)
- R 39 787 539.00 - 10 Region 1
260

241
Department Project Name Project Nr
WBS Level 3 Budget 2016/17 Budget 2017/18 Budget 2018/19 Ward Region
Office of the City
Manager Implementation of Tsosoloso Programme
712533 9.712533.1.003 R 48 500 000.00 R 44 744 000.00 R 45 308 000.00 Multi Region Multi Region
Office of the City
Manager Mamelodi East Multi-purpose (Indoor Sports) Centre
- R 22 000 000.00 - 10 Region 6
Office of the City
Manager Construction of Skills Centre Mamelodi East
R 22 744 000.00 10 Region 6
Office of the City
Manager Mamelodi East Walkways
R 20 000 000.00 - - 10 Region 6
Office of the City
Manager Nellmapius sidewalks
R 28 500 000.00 - - 86,101,86 Region 6
Office of the City
Manager Tsosoloso Programme - Placeholder 2018/19
- - R 45 308 000.00 Tshwane Wide Tshwane Wide
Office of the City
Manager Implementation of Tsosoloso Programme
712533 9.712533.1.005 - R 2 212 461.00 - Multi Region Multi Region
Office of the City
Manager Garankuwa Walkways
- R 2 212 461.00 - 10 Region 1
Office of the City
Manager Implementation of Tsosoloso Programme
712533 9.712533.1.015 - R 30 000 000.00 - Multi Region Multi Region
Office of the City
Manager Construction of Roads and Walkways in Olievenhoutbosch
- R 30 000 000.00 - 48,77,77 Region 4
Office of the City City Hall Renovations
712960 9.712960.1.015 R 20 000 000.00 - - 60 Region 3
261

242
Department Project Name Project Nr
WBS Level 3 Budget 2016/17 Budget 2017/18 Budget 2018/19 Ward Region
Manager
Office of the City
Manager RE - AGA - TSHWANE
712970 9.712970.1.005 R 191 450 000.00 - R 200 000 000.00 17,40 Multi Region
Office of the City
Manager Atteridgeville Ext 16 - Bulk water plus outfall sewer
R 18 000 000.00 - - 48 Region 3
Office of the City
Manager Atteridgeville Ext 19 - Sewerage network
R 26 000 000.00 - - 62 Region 3
Office of the City
Manager Atteridgeville Ext 19 - Water network
R 15 000 000.00 - - 62 Region 3
Office of the City
Manager Kameeldrift 174 & 175 - 1000 Housing Units - Sewer Provision
R 11 000 000.00 - - 93 Region 6
Office of the City
Manager Kameeldrift 174 & 175 - 1000 Housing Units - Water Provision
R 8 000 000.00 - - 93 Region 6
Office of the City
Manager Kudube Unit 8 - 1784 Housing Units - Sewer Provision
R 16 000 000.00 - - 75 Region 2
Office of the City
Manager Kudube Unit 8 - 1784 Housing Units - Water Provision
R 13 000 000.00 - - 75 Region 2
Office of the City
Manager Mamelodi Ext 11 (Mahube Valley) - Sewerage network line
R 17 000 000.00 - - 17 Region 6
Office of the City
Manager Mamelodi Ext 11 (Mahube Valley) - Water network link
R 12 970 000.00 - - 17 Region 6
262

243
Department Project Name Project Nr
WBS Level 3 Budget 2016/17 Budget 2017/18 Budget 2018/19 Ward Region
Office of the City
Manager Phomolong Erf 34041 - Sewer provision for 965 stands
R 11 000 000.00 - - 40 Region 6
Office of the City
Manager Phomolong Erf 34041 - Water provision for 965 stands
R 8 000 000.00 - - 40 Region 6
Office of the City
Manager Piernaarspoort Plot 45 - Bulk water and reservoir
R 34 000 000.00 - - 100 Region 5
Office of the City
Manager Re Aga Tshwane Programme 2017/18
- - R 200 000 000.00 Tshwane Wide Tshwane Wide
Office of the City
Manager Refilwe ERF 778* Ext 7 - High mast LED x 2 + connection
R 740 000.00 - - 99 Region 5
Office of the City
Manager Refilwe ERF 779* Ext 10 - High mast LED x 2 + connection
R 740 000.00 - - 99 Region 5
Total R 259 950 000.00 R 128 744 000.00 R 245 308 000.00
Sports and Recreation Olievenhoutbosch Multi-Purpose Sport
711432 9.711432.2.015 R 15 000 000.00 - - 48, 64 Region 4
Sports and Recreation Lotus Gardens Multi-Purpose Sport Facility
712260 9.712260.1.015 R 8 000 000.00 - - 55 Region 3
Sports and Recreation Capital Funded from Operating
712773 9.712773.1.013 R 5 283 600.00 R 7 000 000.00 R 7 000 000.00 2, 3, 43, 60 Multi Region
Sports and Recreation New Ga-Rankuwa Library
712910 9.712910.1.015 R 10 000 000.00 - - 30, 37 Region 1
263

244
Department Project Name Project Nr
WBS Level 3 Budget 2016/17 Budget 2017/18 Budget 2018/19 Ward Region
Sports and Recreation Upgrade Refilwe Stadium
712916 9.712916.1.015 R 10 000 000.00 - - 100 Region 5
Sports and Recreation Upgrade Ekangala Stadium
712917 9.712917.1.015 - R 30 000 000.00 R 30 000 000.00 105 Region 7
Sports and Recreation Greening Sports fields
712941 9.712941.1.015 R 20 000 000.00 R 25 000 000.00 R 25 000 000.00 Tshwane Wide Tshwane Wide
Total R 68 283 600.00 R 62 000 000.00 R 62 000 000.00
Transport Essential/Unforeseen Storm water Drainage Problems
710116 9.710116.2.001 - R 2 387 321.00 R 10 000 000.00 1, 42 Multi Region
Transport Essential/Unforeseen Storm water Drainage Problems
710116 9.710116.2.015 - - R 4 410 748.00 1, 42 Multi Region
Transport Apies River: Canal Upgrading, Pretoria Central
710117 9.710117.1.001 - R 724 748.00 R 1 764 299.00 59 Region 3
Transport Apies River: Canal Upgrading, Pretoria Central
710117 9.710117.1.015 - R 230 181.00 - 59 Region 3
Transport Concrete Canal: Sam Malema Road, Winterveld
710128 9.710128.1.015 - R 1 591 547.00 - 9, 34 Region 2
Transport Replacement Of Traffic Signs
710221 9.710221.1.015 - - R 7 351 248.00 Tshwane Wide Tshwane Wide
Transport Traffic Calming And Pedestrian Safety For Tshwane
710229 9.710229.2.001 - R 7 957 739.00 - Tshwane Wide Tshwane Wide
Transport Traffic Calming And Pedestrian Safety For Tshwane
710229 9.710229.2.015 - - R 14 702 495.00 Tshwane Wide Tshwane Wide
Transport Mabopane Station Modal Interchange
710657 9.710657.2.005 R 54 097 344.00 R 3 978 869.00 R 7 351 247.00 29 Region 1
Transport Block W - Storm water Drainage
711164 9.711164.2.005 - R 2 387 321.00 - 25 Region 1
264

245
Department Project Name Project Nr
WBS Level 3 Budget 2016/17 Budget 2017/18 Budget 2018/19 Ward Region
Transport Block W - Storm water Drainage
711164 9.711164.2.015 R 8 504 376.00 R 21 485 897.00 - 25 Region 1
Transport Storm water Drainage Mahube Valley
711213 9.711213.2.005 R 850 437.00 R 15 915 479.00 - 10, 17 Region 6
Transport Montana Spruit: Channel Improvements
711268 9.711268.1.015 R 1 660 352.00 R 7 957 739.00 - 5 Region 2
Transport Major Storm water Drainage System: Majaneng
711273 9.711273.2.005 R 8 559 289.00 R 11 936 609.00 - 74, 75 Region 2
Transport Major Storm water Drainage Channels: Ga-Rankuwa
711284 9.711284.2.005 - R 11 936 609.00 - 30, 31, 32 Region 1
Transport Storm water Drainage Systems In Ga-Rankuwa View
711285 9.711285.2.005 - R 11 936 609.00 - 30, 31, 32 Region 1
Transport Olievenhoutbosch Activity Spine
711325 9.711325.2.015 - - R 100 000.00 64, 65 Region 4
Transport Internal Roads: Northern Areas
711863 9.711863.2.016 - R 23 873 220.00 - 19, 20, 21, 22, 30, 31, 32
Region 1
Transport Internal Roads: Northern Areas
711863 9.711863.2.005 R 18 174 347.00 R 197 990 330.00 R 150 000 000.00 19, 20, 21, 22, 30, 31, 32
Region 1
Transport Separation: Airside/Landside Movement - Legal Compliance
711953 9.711953.2.001 - R 5 000 000.00 R 5 000 000.00 50 Region 2
Transport Separation: Airside/Landside Movement - Legal Compliance
711953 9.711953.2.015 R 5 000 000.00 - - 50 Region 2
Transport Flooding Backlogs: 712220 9.712220.1.005 R 230 488 284.00 - R 332 798 227.00 11, 26, 29, 88, 94 Region 1
265

246
Department Project Name Project Nr
WBS Level 3 Budget 2016/17 Budget 2017/18 Budget 2018/19 Ward Region
Sosh & Winterveld Area
Transport Flooding Backlogs: Sosh & Winterveld Area
712220 9.712220.1.015 R 114 652 615.00 - - 11, 26, 29, 88, 94 Region 1
Transport Flooding Backlogs: Mamelodi, Eersterust
712223 9.712223.1.005 - R 19 894 349.00 - 6, 10, 15, 16, 17, 18, 23, 28, 38, 40, 67, 97, 99
Region 6
Transport Flooding backlog: Matanteng
712506 9.712506.1.005 - R 7 957 739.00 R 14 702 495.00 8, 13, 95 Region 2
Transport Flooding backlog: Matanteng
712506 9.712506.1.015 R 10 205 251.00 - - 8, 13, 95 Region 2
Transport Flooding backlog: Kudube Unit 7
712507 9.712507.1.005 R 5 582 764.00 - - 8 Region 2
Transport Flooding backlog: Atteridgeville
712511 9.712511.1.005 R 5 582 764.00 R 7 957 739.00 - 62, 63 Region 3
Transport Flooding backlog: Atteridgeville
712511 9.712511.1.015 - R 7 957 739.00 - 62, 63 Region 3
Transport Flooding Backlogs: Soshanguve South
712513 9.712513.1.015 - R 24 430 261.00 - 19, 20, 21, 22 Region 1
Transport Flooding backlog: Network 2B, Ramotse
712515 9.712515.1.005 - R 7 957 739.00 - 73 Region 2
Transport Flooding backlog: Network 1A, 1C & 1F, Ramotse
712520 9.712520.1.015 - R 15 915 484.00 - 73, 75 Region 2
Transport Collector Road Backlogs: Mamelodi
712521 9.712521.1.001 - R 3 978 870.00 R 14 702 495.00 86 Region 6
Transport Collector Road Backlogs: Atteridgeville
712522 9.712522.1.001 - - R 14 702 495.00 62 Region 3
Transport Collector Road Backlogs:
712522 9.712522.1.015 - R 5 570 418.00 - 62 Region 3
266

247
Department Project Name Project Nr
WBS Level 3 Budget 2016/17 Budget 2017/18 Budget 2018/19 Ward Region
Atteridgeville
Transport Flooding backlog: Network 3A, Kudube Unit 9
712523 9.712523.1.015 R 3 401 750.00 R 11 936 609.00 - 73, 74 Region 2
Transport Giant Stadium: Buitekant Street
712545 9.712545.1.015 R 100 000.00 20, 35 Region 1
Transport CBD and surrounding areas (BRT) -(Transport Infrastructure)
712591 9.712591.1.002 R 750 000 000.00 R 753 950 840.00 R 665 117 230.00 Tshwane Wide Multi Region
Transport Upgrading of Mabopane Roads (red soils)
712611 9.712611.1.005 - R 15 915 479.00 - 19, 20, 21, 22 Region 1
Transport Upgrading of Sibande Street, Mamelodi
712612 9.712612.1.015 - R 31 830 959.00 R 73 512 476.00 06,23 Region 6
Transport Maintenance and replacement of all runway and taxiway lights, apron lights, security and lightning system
712884 9.712884.1.015 R 2 500 000.00 - - 50 Region 2
Transport Maintenance and replacement of all runway and taxiway lights, apron lights, security and lightning system
712884 9.712884.1.001 - - R 1 500 000.00 50 Region 2
Transport Main terminal building carousel and mechanical baggage handling equipment
712891 9.712891.1.015 R 2 000 000.00 - - 50 Region 2
267
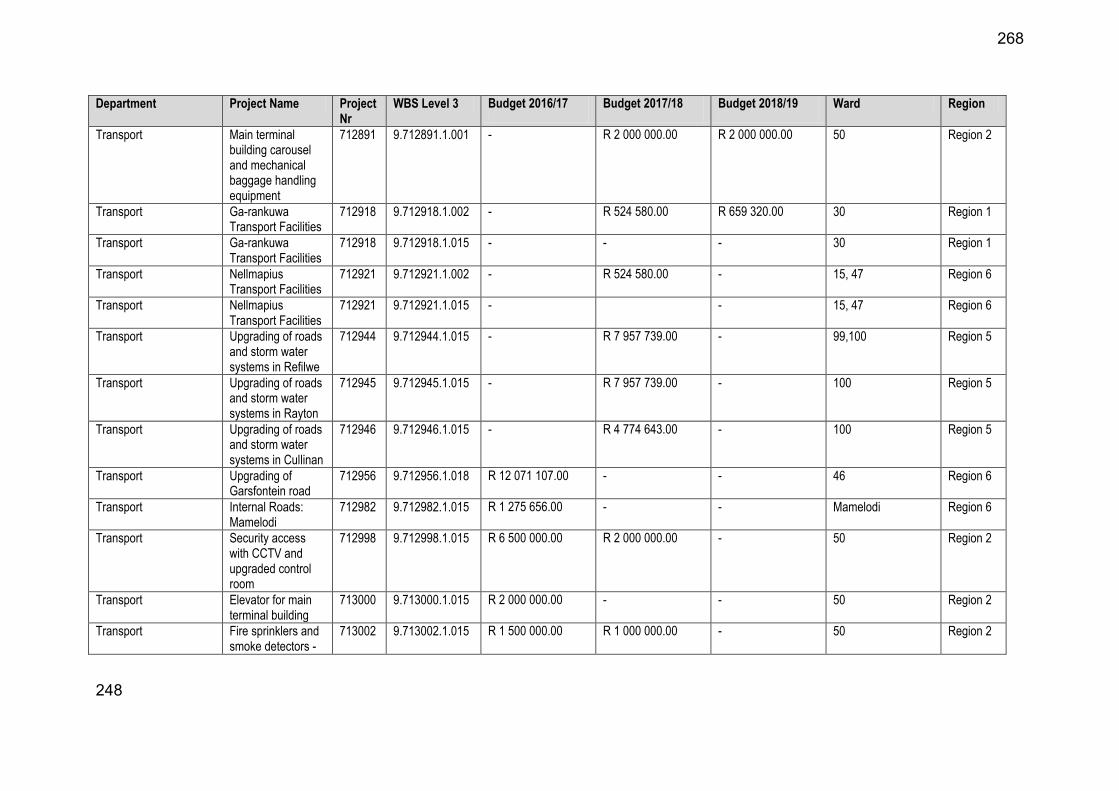
248
Department Project Name Project Nr
WBS Level 3 Budget 2016/17 Budget 2017/18 Budget 2018/19 Ward Region
Transport Main terminal building carousel and mechanical baggage handling equipment
712891 9.712891.1.001 - R 2 000 000.00 R 2 000 000.00 50 Region 2
Transport Ga-rankuwa Transport Facilities
712918 9.712918.1.002 - R 524 580.00 R 659 320.00 30 Region 1
Transport Ga-rankuwa Transport Facilities
712918 9.712918.1.015 - - - 30 Region 1
Transport Nellmapius Transport Facilities
712921 9.712921.1.002 - R 524 580.00 - 15, 47 Region 6
Transport Nellmapius Transport Facilities
712921 9.712921.1.015 - - 15, 47 Region 6
Transport Upgrading of roads and storm water systems in Refilwe
712944 9.712944.1.015 - R 7 957 739.00 - 99,100 Region 5
Transport Upgrading of roads and storm water systems in Rayton
712945 9.712945.1.015 - R 7 957 739.00 - 100 Region 5
Transport Upgrading of roads and storm water systems in Cullinan
712946 9.712946.1.015 - R 4 774 643.00 - 100 Region 5
Transport Upgrading of Garsfontein road
712956 9.712956.1.018 R 12 071 107.00 - - 46 Region 6
Transport Internal Roads: Mamelodi
712982 9.712982.1.015 R 1 275 656.00 - - Mamelodi Region 6
Transport Security access with CCTV and upgraded control room
712998 9.712998.1.015 R 6 500 000.00 R 2 000 000.00 - 50 Region 2
Transport Elevator for main terminal building
713000 9.713000.1.015 R 2 000 000.00 - - 50 Region 2
Transport Fire sprinklers and smoke detectors -
713002 9.713002.1.015 R 1 500 000.00 R 1 000 000.00 - 50 Region 2
268

249
Department Project Name Project Nr
WBS Level 3 Budget 2016/17 Budget 2017/18 Budget 2018/19 Ward Region
Main terminal building
Transport Security fences/gates, fence lighting and equipment
713004 9.713004.1.015 R 2 000 000.00 - R 7 000 000.00 50 Region 2
Transport Automated Fare Collection (AFC-TBS)
713006 9.713006.1.002 - - R 72 690 058.00 Tshwane Wide Region 3
Transport Refurbishment and Upgrading of TBS depots
713007 9.713007.1.002 - - R 21 533 392.00 Tshwane Wide Region 3
Total R 1 246 606 336.00 R 1 269 283 724.00 R 1 421 698 225.00
Water and Sanitation Township Water Services Developers: Tshwane Contributions
710022 9.710022.1.016 R 5 000 000 - - Multi Region Multi Region
Water and Sanitation Lengthening Of Network & Supply Pipelines
710023 9.710023.1.016 R 1 000 000 - - Multi Region Multi Region
Water and Sanitation Replacement of Worn Out Network Pipes
710026 9.710026.1.015 R 15 000 000 - - Multi Region Multi Region
Water and Sanitation Replacement of Worn Out Network Pipes
710026 9.710026.1.016 R 1 000 000 - - Multi Region Multi Region
Water and Sanitation Replacement, Upgrade, Construct Waste Water Treatment Works Facilities
710411 9.710411.1.015 R 33 000 000 R 133 183 750 R 260 697 921 Tshwane Wide Tshwane Wide
Water and Sanitation (710411A1) Sunderland Ridges
R 5 000 000 R 20 000 000 R 50 000 000 70 Region 4
269

250
Department Project Name Project Nr
WBS Level 3 Budget 2016/17 Budget 2017/18 Budget 2018/19 Ward Region
WWTW new 30ML BNR
Water and Sanitation (710411B) Zeekoeigat waste water treatment works
- - R 30 000 000 87 Region 5
Water and Sanitation (710411C) Klipgat WWTW Sludge facility and Anaerobic Digester
- - R 4 000 000 22 Region 1
Water and Sanitation (710411D) Extension of Rooiwal waste water treatment works
R 13 000 000 R 33 183 750 R 50 000 000 96 Region 2
Water and Sanitation (710411F) Baviaanspoort waste water treatment works
R 15 000 000 R 80 000 000 R 60 000 000 93 Region 6
Water and Sanitation (710411K) Godrich WWTW nes 10 Ml/day BNR
- - R 20 000 000 105 Region 7
Water and Sanitation (710411Y) Upgrade of sewerage pump station (City Wide)
- - R 1 634 701 Tshwane Wide Tshwane Wide
Water and Sanitation (710411Z) Waste Water Treatment facilities upgrades Minor Capital Projects (City wide)
- - R 11 000 000 Tshwane Wide Tshwane Wide
Water and Sanitation (710411H) Sandspruit WWTW Sludge facility
- - R 30 000 000 37 Region 1
Water and Sanitation (710411E) - - R 20 000 000 7 Region 3
270

251
Department Project Name Project Nr
WBS Level 3 Budget 2016/17 Budget 2017/18 Budget 2018/19 Ward Region
Hennops River waste water treatment works
Water and Sanitation Replacement, Upgrade, Construct Waste Water Treatment Works Facilities
710411 9.710411.1.001 - - R 1 054 795 Tshwane Wide Tshwane Wide
Water and Sanitation (710411Y) Upgrade of sewerage pump station (City Wide)
- - R 1 054 795 Tshwane Wide Tshwane Wide
Water and Sanitation Replacement, Upgrade, Construct Waste Water Treatment Works Facilities
710411 9.710411.1.005 - R 1 816 252 R 28 936 780 Tshwane Wide Tshwane Wide
Water and Sanitation (710411D) Extension of Rooiwal waste water treatment works
- R 1 816 252 R 10 000 000 96 Region 2
Water and Sanitation (710411F) Baviaanspoort waste water treatment works
- - - 93 Region 6
Water and Sanitation (710411L) Cullinan/ Refilwe Effluent Pump Station
- - R 3 000 000 100 Region 5
Water and Sanitation Replacement, Upgrade, Construct Waste Water Treatment Works Facilities
710411 9.710411.1.016 R 22 000 000 - - Tshwane Wide Tshwane Wide
Water and Sanitation (710411D) Extension of
R 22 000 000 - 96 Region 2
271

252
Department Project Name Project Nr
WBS Level 3 Budget 2016/17 Budget 2017/18 Budget 2018/19 Ward Region
Rooiwal waste water treatment works
Water and Sanitation Refurbishment of Water Networks and Backlog Eradication
710878 9.710878.2.005 R 213 000 000 R 85 000 000 R 42 784 730 Multi Region Multi Region
Water and Sanitation (710878C) Mabopane water reticulation and bulk pipeline
R 3 404 255 - - 9,12,21,20,22 Region 1
Water and Sanitation (710878E) Water reticulation Stinkwater Ext 2 to 8 and main supply line
- R 559 882 - 13 Region 2
Water and Sanitation (710878K) Sewer reticulation Kudube 5
R 6 382 979 - - 8,75 Region 2
Water and Sanitation (710878N) Sewer reticulation Stinkwater Ext 2 to 8
R 2 127 660 R 11 441 804 R 12 184 730 13 Region 2
Water and Sanitation (710878O) Sewer reticulation New Eersterust Ext 1,2,3
R 4 255 319 R 10 000 000 R 30 000 000 13,14,95 Region 2
Water and Sanitation (710878SG) Reticulation mains in Soshanguve DD and L reservoir
R 600 000 13,14,25,26,27,88,96
Region 1
Water and Sanitation (710878T) Temba Water Purification Plant Extension
R 63 829 787 R 7 998 314 - 75 Region 2
Water and Sanitation Refurbishment of 710878 9.710878.2.015 R 10 000 000 R 40 377 920 - Multi Region Multi
272

253
Department Project Name Project Nr
WBS Level 3 Budget 2016/17 Budget 2017/18 Budget 2018/19 Ward Region
Water Networks and Backlog Eradication
Region
Water and Sanitation (710878E) Water reticulation Stinkwater Ext 2 to 8 and main supply line
- R 1 497 684 - 13 Region 2
Water and Sanitation (710878N) Sewer reticulation Stinkwater Ext 2 to 8
- R 22 883 609 - 13 Region 2
Water and Sanitation (710878T) Temba Water Purification Plant Extension
R 10 000 000 R 15 996 627 - 75 Region 2
Water and Sanitation Refurbishment of Water Networks and Backlog Eradication
710878 9.710878.2.016 - - R 30 673 000 8, 14, 20, 21, 67, 73, 74, 75, 76
Region 2
Water and Sanitation (710878N) Sewer reticulation Stinkwater Ext 2 to 8
- - R 30 673 000 Multi Region Multi Region
Water and Sanitation Refurbishment of Water Networks and Backlog Eradication
710878 9.710878.2.001 - R 43 283 875 R 22 718 200 Multi Region Multi Region
Water and Sanitation (710878E) Water reticulation Stinkwater Ext 2 to 8 and main supply line
- R 1 442 434 - 13 Region 2
Water and Sanitation (710878N) Sewer reticulation Stinkwater Ext 2 to
- R 21 235 244 R 22 318 200 13 Region 2
273

254
Department Project Name Project Nr
WBS Level 3 Budget 2016/17 Budget 2017/18 Budget 2018/19 Ward Region
8
Water and Sanitation (710878SG) Reticulation mains in Soshanguve DD and L reservoir
- - R 400 000 13,14,25,26,27,88,96
Region 1
Water and Sanitation (710878T) Temba Water Purification Plant Extension
- R 20 606 197 75 Region 2
Water and Sanitation Replacement & Upgrading: Redundant Bulk Pipeline Infrastructure
711335 9.711335.1.015 R 5 500 000 R 54 742 453 R 106 250 000 Multi Region Multi Region
Water and Sanitation (711335H) Bulk Water supply pipeline from Klapperkop to Union Buildings area
R 5 500 000 R 25 000 000 R 25 000 000 58,59,80,81,92,58 Region 3
Water and Sanitation (711335P) Heights Iscor Feeder
- R 10 000 000 R 5 000 000 3,59,59 Region 3
Water and Sanitation (711335BR) Bronkhorstspruit bulk pipeline
- R 10 000 000 R 50 000 000 17,40,99,100,102,103
Multi Region
Water and Sanitation (711335O) Waterkloof Res 2 Feeder Main
- R 1 000 000 R 10 000 000 42,47,79,83 Region 6
Water and Sanitation (711335S) Olympus / Zwavelpoort bulk water supply pipelines
- R 742 453 R 4 250 000 44,45,85,91,101 Multi Region
Water and Sanitation (711335T) Bronkhorstspruit
- R 2 000 000 - 102,105 Region 7
274

255
Department Project Name Project Nr
WBS Level 3 Budget 2016/17 Budget 2017/18 Budget 2018/19 Ward Region
Reservoir zone eastern pipe reinforcement and PRV
Water and Sanitation (711335U) Laudium/Atteridgeville HL reinforcing pipework, chamber and bridge, FCV
- R 6 000 000 - 3 Region 3
Water and Sanitation (711335CP) Cathodic protection to all Steel pipes (City wide)
- - R 1 000 000 Tshwane Wide Tshwane Wide
Water and Sanitation (711335GF) Replace feeder main from Garsfontein to Parkmore HL Reservoir
- - R 2 000 000 45,47,83 Region 6
Water and Sanitation (711335GK) New feeder main for Garankuwa East reservoir & Garankuwa West Reservoir
- - R 2 000 000 4,30,31,32 Region 1
Water and Sanitation (711335L) Soshanguve feeder main to Reservoirs DD and L upgrade and replace
- - R 4 000 000 29,33,88 Region 1
Water and Sanitation (711335LW) Lynnwood road link pipe from Bronberg system to Garsfontein system
- - R 1 000 000 45,47,83 Region 6
275

256
Department Project Name Project Nr
WBS Level 3 Budget 2016/17 Budget 2017/18 Budget 2018/19 Ward Region
Water and Sanitation (711335ML) Mamelodi R5 feeder main relocation
- - R 2 000 000 10,97,99 Multi Region
Water and Sanitation Replacement of Sewers
711404 9.711404.2.016 R 5 000 000 - - 2,4,19,20,21,22,26,27,29,30,31,32
Region 1
Water and Sanitation Reduction Water Losses: Water Networks
711542 9.711542.1.016 R 5 000 000 - - Multi Region Multi Region
Water and Sanitation Establishment of Water Distribution Depots
712124 9.712124.1.015 R 2 000 000 - - 4, 5, 8, 22, 41, 42, 47, 50, 65
Multi Region
Water and Sanitation Moreletaspruit: Outfall sewer
712121 9.712121.1.015 - - R 6 000 000 41, 42, 43, 44, 45, 46, 47, 52
Region 6
Water and Sanitation (712534A) Annlin Reservoir Extension
- - R 6 000 000 79 Multi Region
Water and Sanitation Reservoir Extensions
712124 9.712534.1.005 - R 144 603 541 - 4, 5, 8, 22, 41, 42, 47, 50, 65
Multi Region
Water and Sanitation (712534C) Doornkloof Reservoir
- R 45 000 000 -
Water and Sanitation (712534D) Mooikloof Reservoir
- R 4 603 541 -
Water and Sanitation (712534S) New Parkmore LL Reservoir
- R 50 000 000 -
Water and Sanitation (712534T) Bronkhorstbaai: Refurbishment and upgrade of Water Purification Plant
- R 20 000 000 -
Water and Sanitation (712534U) R 25 000 000 -
276

257
Department Project Name Project Nr
WBS Level 3 Budget 2016/17 Budget 2017/18 Budget 2018/19 Ward Region
Grootfontein Water Reservoir, tower and pipework
Water and Sanitation Reservoir Extensions
9.712534.1.015 R 66 000 000 R 42 498 922 R 78 000 000 Tshwane Wide Tshwane Wide
Water and Sanitation (712534A) Annlin Reservoir Extension
R 952 381 - - 50,54 Region 3
Water and Sanitation (712534C) Doornkloof Reservoir
R 4 761 905 - - 79 Region 4
Water and Sanitation (712534D) Mooikloof Reservoir
R 4 761 905 R 8 396 459 R 20 000 000 91 Region 6
Water and Sanitation (712534E) Installation of telemetry, bulk meters and control equipment at reservoirs (City Wide)
R 7 142 857 - R 20 000 000 Tshwane Wide Tshwane Wide
Water and Sanitation (712534G) Replace reservoir fencing (City Wide)
R 16 000 000 - R 5 000 000 Tshwane Wide Tshwane Wide
Water and Sanitation (712534H) Relining/upgrading reservoirs
R 1 904 762 R 4 000 000 R 4 000 000 54,59 Region 3
Water and Sanitation (712534HYD) Conduit hydropower Development
- R 4 456 582 R 7 000 000 60,60,60,60 Region 3
Water and Sanitation (712534J) New Klipgat Reservoir
R 14 285 714 R 645 881 22 Region 1
Water and Sanitation (712534JU) - - - 49,74 Region 2
277

258
Department Project Name Project Nr
WBS Level 3 Budget 2016/17 Budget 2017/18 Budget 2018/19 Ward Region
Replacement of Jubilee Tower
Water and Sanitation (712534M) New 20Ml la-Montagne reservoir
- - - 85 Region 6
Water and Sanitation (712534ML) 12 ML Mamelodi R5 Reservoir
- - R 2 000 000 10,10,97 Region 6
Water and Sanitation (712534S) New Parkmore LL Reservoir
R 4 761 905 - 46 Region 6
Water and Sanitation (712534T) Bronkhorstbaai: Refurbishment and upgrade of Water Purification Plant
R 4 285 714 - 102 Region 7
Water and Sanitation (712534U) Grootfontein Water Reservoir, tower and pipework
R 7 142 857 R 25 000 000 R 20 000 000 91 Region 6
Water and Sanitation Reservoir Extensions
9.712534.1.016 - R 12 917 629 - Tshwane Wide Tshwane Wide
Water and Sanitation (712534E) Installation of telemetry, bulk meters and control equipment at reservoirs (City Wide)
- R 12 917 629 - Tshwane Wide Tshwane Wide
Water and Sanitation Reservoir Extensions
9.712534.1.001 - R 9 879 908 - Tshwane Wide Tshwane Wide
Water and Sanitation (712534E) Installation of telemetry, bulk
- R 7 082 371 - Tshwane Wide Tshwane Wide
278

259
Department Project Name Project Nr
WBS Level 3 Budget 2016/17 Budget 2017/18 Budget 2018/19 Ward Region
meters and control equipment at reservoirs (City Wide)
Water and Sanitation (712534HYD) Conduit hydropower Development
- R 2 443 418 - 60,60,60,60 Region 3
Water and Sanitation (712534J) New Klipgat Reservoir
- R 354 119 - 22 Region 1
Water and Sanitation (712534S) New Parkmore LL Reservoir
- - - 46 Region 6
Water and Sanitation Purification Plant Upgrades
711921 9.711921.1.015 - R 5 000 000 R 20 000 000 102 Region 7
Water and Sanitation (711921E) Bronkhorstspruit Water Purification Plant Refurbishment
R 5 000 000 R 20 000 000 102 Region 7
Total R 383 500 000 R 573 304 250 R 597 115 426
Total Capital Budget R 4 465 208 687.00 R 3 704 064 118.00 R 3 987 509 560.00
279

260
9. PERFORMANCE MANAGEMENT
Introduction
This chapter describes the performance management system in the City of Tshwane as well as the City’s approach to ensure that the objectives in the strategic plans of the City are realised.
This chapter addresses the following areas:
The model of performance management used in the City of Tshwane Plans and the alignment of targets and indicators Monitoring and evaluation Auditing of performance Tools for performance management Roles and responsibilities related to performance management
Legislative environment governing performance management
Various pieces of legislation exist to govern the performance management of local government. These include –
the Municipal Systems Act (MSA), 2000 (Act 32 of 2000); the Municipal Planning and Performance Management Regulations (MPPMR),
2001; the Municipal Finance Management Act (MFMA), 2003 (Act 53 of 2003); and the Municipal Performance Regulations for Municipal Managers and Managers
Directly Accountable to Municipal Managers, 2006.
The City’s performance management regarding each of these acts is summarised as follows:
Local Government: Municipal Systems Act, 2000 (Act 32 of 2000): The City’s IDP contains five-year IDP sub programmes which include key performance indicators (KPIs) and targets to measure progress over the medium and short term. The IDP contains annual performance targets that determine targets to assess implementation progress on a year-to-year basis.
These KPIs and targets are translated into service delivery and budget implementation plans (SDBIPs) to inform expected city-wide, departmental and individual performance outputs. The City’s performance is monitored and reviewed quarterly and annually; it is informed by the achievement reports on the identified organisational, departmental and individual performance plans.
280

261
Municipal Planning and Performance Management Regulations, 2001: As required by the 2001 regulations, the City’s Performance Management System allows for quarterly reporting to the Council. The quarterly reports are prepared for the purpose of identifying performance achievements and gaps, based on the set IDP indicators.
In enhancing performance monitoring, measurement and review, the City has an internal audit department which is responsible for auditing the results of performance measurements. In addition, the City has an audit and performance committee that considers the quarterly performance audit reports and reviews of the City’s PMS to recommend improvements.
Local Government: Municipal Finance Management Act, 2003 (Act 56 of 2003): As part of the reporting processes, in addition to quarterly reports, the City compiles mid-year and annual reports on service delivery performance related to the achievement of targets and indicators. All the quarterly service delivery and budget implementation plan reports are prepared and submitted to legislated stakeholders.
In terms of annual reporting, annual reports have been prepared and published on the City’s website, and submitted to the Auditor-General as required.
Local Government Municipal Performance Regulations for Municipal Managers and Managers Directly Accountable to Municipal Managers, 2006: In accordance with the 2006 regulations, the appointment of all Section 57 employees is in terms of the written employment contracts and subject to the signing of performance agreements which are submitted to the MEC for Local Government, as well as the national minister.
The model of performance management
The City of Tshwane approved a long-term strategy, i.e. Tshwane Vision 2055, in August 2013. Tshwane Vision 2055 sets out six outcomes that are aligned with the National Development Plan and that are to be achieved over four decades. The strategic tool that will be used to contribute to the institutionalisation of Tshwane Vision 2055 and the realisation of the objective of developmental local government is the Council-approved City of Tshwane Performance Management Framework.
The Council-approved City of Tshwane Performance Management Framework (November, 2014) focuses on the implementation of an outcomes-based approach to performance management in the City of Tshwane in order to ensure that the outcomes in Tshwane Vision 2055 are effectively planned for, monitored and reported on.
The "Outcomes Performance Management System" as aligned with national governments approach to planning and performance management ensures that the City’s plans are driven by strategic outcomes, and that resources will be allocated
281

262
accordingly. In other words, the outcomes approach forces alignment between inputs, outputs, outcomes and impacts, and enables the measurement of efficiency, effectiveness, economy and equity. The diagram below illustrates the logic process of the outcomes approach.
Figure 9.1: The results-based management pyramid (National Treasury, 2007)
Plans and the alignment of targets and indicators
The key underlying principles of the approved Performance Management Framework include –
linking strategy to operations; linking individual and organisational performance processes; linking and integrating risk management and audit with performance
management processes; aligning levels of indicators and plans; and linking municipal entities to the performance management system of the City of
Tshwane.
This requires that all levels of plans in the City be aligned.
IMPACTS
OUTCOMES
OUTPUTS
INPUTS
ACTIVITIES
The developmental results of achieving specific outcomes
The medium-term results for specific beneficiaries that are the consequence
of achieving specific outputs
The final products, or goods and services produced for delivery
The processes or actions that use a range of inputs to produce the desired
outputs and ultimately outcomes
The resources that contribute to the production and delivery of
outputs
What we use to do the work?
What we do?
What we produce or deliver?
What we wish to achieve?
What we aim to change?
Plan, budget,
implement and
monitor
Manage towards
achieving these
results
282

263
The IDP is an important instrument that sets out how Tshwane Vision 2055 will be achieved over the four decades of game changing. Figure 9.2 illustrates the alignment between the key plans of the City in relation to outcomes performance management.
Of note are the following:
Tshwane Vision 2055 sets out six outcomes that are measured by impact and outcome measures.
The IDP sets out five-year outcomes that contribute to the longer-term Tshwane Vision 2055.
The service delivery and budget implementation plan (SDBIP) is developed annually, and sets out annual output measures that contribute to the achievement of the IDP outcomes.
Departmental SDBIPs are developed annually, and set out specific departmental level outputs that contribute towards the achievement of the City’s SDBIP.
Individual performance plans and agreements are developed annually and are based on – - the IDP outcomes; - the SDBIP outputs; and - departmental SDBIP outputs.
283

264
What we aim to change in the long term
What we produce or deliver in the short term, including activities and resources
What we wish to achieve in the medium term
Tshwane Vision 2055
SDBIP (Corporate, Departmental SDBIP (departments and entities)
Individual plans
Tshwane Vision 2055/IDP (five years) and MTREF
Figure 9.2: Hierarchy of plans (adapted from the Presidency, 2010)
The effectiveness of the City’s performance management system is dependent on the quality of the plans of the City. Therefore, the planning aspect of performance management processes in the City is focused on –
ensuring alignment between the hierarchy of plans listed above, through the planned outcomes, outputs, targets and indicators; and
ensuring that indicators are reliable, well-defined, verifiable, cost-effective, appropriate and relevant8, and that targets are specific, measurable, achievable, relevant and time-bound.
The City’s approach to planning requires that projects planned in the SDBIP must achieve the planned targets in the SDBIP and the planned outcomes in the IDP. Furthermore, all indicators and targets at various levels of planning must be supported by concise system descriptions9.
The community is predominantly involved in the planning processes through the IDP consultation mechanisms. To prevent and mitigate risks of not achieving the planned 8 FMPPI 2007 9 A description of the indicator details, amongst others, how they are measured, the source of information for reporting, the frequency of data collection and the means of verification.
284

265
outcomes listed in the IDP, the City implements risk planning in the process of developing the hierarchy of plans. As part of the review of the performance management framework, the City will develop operating procedures for planning.
Monitoring and evaluation
Monitoring and evaluation are critical parts of the performance management system and enable performance improvement. Monitoring and evaluation are intimately related. Both are necessary management tools to inform decision-making and demonstrate accountability. Evaluation is not a substitute for monitoring nor is monitoring a substitute for evaluation. They may use the same steps (as listed below); however they produce different kinds of information United Nations Population Fund (UNFPA, 2004).
The UNFPA, 2004 defines monitoring and evaluation as follows:
Monitoring continuously tracks performance against what was planned by collecting and analysing data on the indicators established for monitoring and evaluation purposes. It provides continuous information on whether progress is being made towards achieving results (outputs, outcomes) through recordkeeping and regular reporting systems. Monitoring looks at both programme processes and changes in conditions of target groups and institutions brought about by programme activities. It also identifies strengths and weaknesses in a programme. The performance information generated from monitoring enhances learning from experience and improves decision-making.
Evaluation is a periodic, in-depth analysis of programme performance. It relies on data generated through monitoring activities as well as information obtained from other sources (e.g. studies, research, in-depth interviews, focus group discussions, surveys, etc). The characteristics of monitoring and evaluation are discussed in the table below.
Table 9.1: Characteristics of monitoring and evaluation (UNICEF, 1991; WFP, May 2000)
Monitoring Evaluation
Continuous Periodic: At important milestones such as the mid-term of programme implementation
At the end or a substantial period after programme conclusion
Keeps track, oversight, analyses and documents progress In-depth analysis
Compares planned achievements with actual achievements
Focuses on inputs, activities, outputs, implementation processes, continued relevance, likely results at outcome level
Focuses on outputs in relation to inputs, results in relation to cost, processes used to achieve results, overall relevance, impact, and sustainability
Answers what activities were implemented and the results achieved
Answers why and how results were achieved
Contributes to building theories and models for change
Alerts managers to problems and provides options for corrective actions
Provides managers with strategy and policy options
Self-assessment by programme managers, supervisors, Internal and/or external analysis by programme managers,
285

266
community stakeholders and donors
supervisors, community stakeholders, donors and/or external evaluators
Monitoring, reviewing and reporting
Monitoring continuously tracks performance against what was planned by collecting and analysing data on the indicators established for monitoring and evaluation purposes. It provides continuous information on whether progress is being made towards achieving results (outputs, outcomes) through recordkeeping and regular reporting systems (UNFPA, 2004).
Continuous monitoring and periodic reporting against the indicators and targets set in the different plans of the City are crucial during the implementation of the plans to measure progress against planned results. A result, according to UNFPA, 2004, is a describable/measurable change in state that is derived from the effects of generated programmes. There are three types of results (see table below) and these have already been discussed in the performance planning process; they include outputs, outcomes and impacts.
Table 9.2: Definition of three results
Term Definition
Outputs
The final products or goods and services produced for delivery
What we produce or deliver
Products and services that result from the completion of activities within a development intervention (UNFPA, Toolkit 1, 2004)
Outcomes
The intended or achieved short- and medium-term effects of an intervention’s outputs, usually requiring the collective effort of partners
Outcomes represent changes in development conditions which occur between the completion of outputs and the achievement of impact (UNFPA, Toolkit 1, 2004)
The medium-term results for specific beneficiaries that are the consequence of achieving specific outputs
Outcomes that relate clearly to an institution's strategic goals and objectives set out in its plans
What we wish to achieve
Impacts
The results of achieving specific outcomes, such as reducing poverty and creating jobs
Positive and negative long-term effects on identifiable population groups produced by a development intervention, directly or indirectly, intended or unintended
These effects can be economic, socio-cultural, institutional, environmental, technological or of other types (UNFPA, Toolkit 1, 2004).
286

267
The City of Tshwane monitors the implementation of plans at various levels of the organisation. However, for the purposes of monitoring and reporting on progress against planned targets and projects in the IDP and SDBIP the following is done:
Monthly and quarterly reporting on the finances of the City; Monthly reporting of departments on the departmental SDBIPs, projects and
corporate SDBIP targets; Quarterly reporting of departments on the departmental SDBIPs, projects and
corporate SDBIP targets; Monthly and quarterly coaching and individual performance assessments against
individual performance plans; Annual review of individual performance in relation to the annual performance
results of the City and the Auditor-General’s report; Quarterly submission of evidence of reported performance; Quarterly reporting of performance results to the Council through the Council
systems; Quarterly reporting of performance results to external stakeholders such as the
National Treasury; and Mid-year and annual reporting of performance results to the Council and to
external stakeholders.
Communities are provided feedback on performance against the IDP in the following ways:
Mayoral Izimbizo; Quarterly reports to ward committees via ward councillors after reports have
served at the Council; and IDP engagement processes.
Management and exception reports are developed regularly, and engagements take place with departments in order to address reasons for under-performance, corrective measures and quality of reports.
Service delivery outcomes must be assessed together with the financial dimension of performance. Currently, some aspects of this work are done through performance monitoring and reporting, where an assessment is done on whether or not the planned outcomes in the IDP have been achieved (effectiveness/non-effectiveness).
Auditing of performance
Reported performance results are audited quarterly. In order to ensure the integrity of the reported performance results, all departments are required to submit evidence of reported performance against the SDBIP targets and projects, as well as the departmental SDBIPs. The quality of evidence is weighed against the eight dimensions of quality from the South African Statistical Quality Assessment Framework, 2010 (SASQAF) and the Auditor General South Africa (AGSA) criteria for auditing.
287

268
Table 9.3: AGSA criteria
Main criteria Sub-criteria Explanation of audit criteria
Compliance with reporting requirements
Existence Objectives, indicators and targets must be predetermined and performance information must be reported against them.
Timeliness Performance information must be reported within two months after year-end.
Presentation
Performance information must be reported using the National Treasury guidelines.
Actual performance information in tables and narrative in annual report must be consistent.
Material differences between actual and planned performance must be explained.
Reliability
Validity Actual reported performance has occurred and pertains to the entity.
Accuracy Amounts, numbers and other data relating to reported actual performance have been appropriately recorded and reported.
Completeness All actual results and events that should have been recorded have been included in the annual performance report.
Usefulness Measurability
Objectives must be measurable by means of indicators and targets.
Indicators should be well-defined and verifiable while targets should adhere to the SMART criteria.
Evidence files are centralised in the City Strategies and Performance Management Department; they are accessed by either Internal Audit or the Auditor-General through strict protocols for purposes of annual external audits.
The City has established Operation Clean Audit committees in order to ensure that matters raised by the Auditor-General are addressed, and to prevent further audit findings. Audit reports are submitted to the Audit and Performance Committee and to the Council. Furthermore, the audited quarterly performance reports, the annual report and the annual financial statements are submitted to the Audit and Performance Committee and to the Council.
The Council may refer reports to the Municipal Public Accounts Committee (MPAC) for oversight.
Tools for performance management
The City of Tshwane has implemented an electronic reporting system called QPR. Departments report on their departmental SDBIP targets, corporate SDBIP targets and their capital projects; they also submit declarations confirming performance results and reliability of reported information. The IDP outcome results are calculated on the system using planning information and formulae as contained in the approved IDP and
288

269
SDBIP10; management information is extracted for various stakeholders. Access to the system is controlled through strict protocols. All users are required to be trained to use the system. All heads of departments are required to sign off data that is reported by their departments on the system (first level of combined assurance).
Roles and responsibilities for performance management
Performance management in the City of Tshwane is contributed to by a range of stakeholders. Below is a summary of key role players.
The City Strategies and Performance Management Department within the Strategy Development and Implementation Cluster is responsible for assisting the City Manager to coordinate the following:
The development of the IDP The development of the corporate SDBIP The development of the departmental SDBIP Organisational performance management and preparation of audit of
predetermined objectives
The Corporate and Shared Services Department assists the City Manager to manage the process of individual performance management for all levels of employees.
The Office of the Executive Mayor tracks and monitors mayoral commitments and priorities in addition to those on the IDP and SDBIP.
The Chief Financial Officer ensures the development of a credible budget to fund the IDP and SDBIP and monitors and reports on the financial performance of the City.
Table 8.4 lists specific stakeholders and their roles in the performance processes in the City of Tshwane.
Table 9.4: Roles and responsibilities for performance management
Stakeholders Involvement
Executive Mayor
Oversight and strategic direction and ensuring service delivery approach to the planning and hence the performance system
Setting a long-term vision
Setting key strategic direction
Developing the IDP
Approving the SDBIP developed by the City Manager
Ensuring that the IDP contains performance framework and input, output and outcome indicators
Reporting to the Council on performance on the IDP and SDBIP, quarterly
10 Supplemented by system descriptions
289

270
Stakeholders Involvement
and annually
Mayoral Committee and Mayoral Subcommittee
Supporting the Executive Mayor
Depending on systems of delegation will assist the Executive Mayor with the IDP development and oversight of the performance on the SDBIP and IDP
Assisting with decision-making on performance reports that are then forwarded to the Council
Section 79 oversight committees
Oversight on behalf of the Council
Monitoring performance of the Mayor on the implementation of the IDP and budget
Oversight to ensure that the performance management system complies with legislative requirements
Audit and Performance Committee
A committee of the Council that should report to the Council at least each quarter
Auditing the planning and performance management system
Oversight on performance, especially on compliance to audit criteria
Advising the Municipal Manager on improvements
Council
Approving the IDP and the MTREF
Approving the adjusted SDBIP
Approving any amendments to the IDP and adjustments on the budget
Approving the performance management system as part of the IDP
Receiving performance reports of the Mayor and monitoring performance of the Mayor and administration
Submitting reports to the MPAC and other oversight committees for oversight
MPAC Council oversight on the IDP, annual report, financial statements and
other functions delegated by the Council
Municipal Manager
Assisting the Executive Mayor to develop the IDP
Ensuring that all senior managers sign performance agreements aligned with the IDP and SDBIP
Developing the SDBIP within the legislated timeframes and submitting it to the Executive Mayor for approval
Monitoring the performance of departments in the implementation of the budget and IDP
Reporting to the Executive Mayor on the implementation of the SDBIP, IDP and MTREF
Accountable to the Executive Mayor and Mayoral Committee
Direct reports to the City Manager – Deputy City Managers, Strategic Executive Directors and technical clusters
Developing departmental SDBIPs
Contributing to the development of the IDP and SDBIP
Implementing approved plans
Reporting monthly on the implementation of approved plans
Managing their departments' performance and implementing correct measures
290

271
Stakeholders Involvement
Signing performance agreements with the City Manager
Signing performance agreements with direct reports and ensuring that direct reports have operational plans that are reported on
Staff and employees
Implementing plans according to delegations
Signing and implementing performance agreements
Reporting monthly on implementation
Internal Audit
Assessing the functionality, effectiveness and legal compliance of the PMS
Auditing the PMS to ensure that measures are reliable and useful
Preparing the institution for audit by the Auditor-General
Testing alignment of the operational plans with the strategic plans of the City
Auditor-General
Testing the financial and performance reports of the Municipality for reliability, usefulness and legislative compliance
Assisting municipalities to comply with clean audit criteria
Reporting to parliament on the performance of government entities
National and provincial spheres of government Functioning as legislated in the MSA and MFMA
Ward committees, councillors and stakeholder forums
Participating in the IDP, performance management and MTREF processes
Informing priority setting
Monitoring implementation of the plans of the City as committed, e.g. the implementation of IDP projects committed to a specific ward
Citizens and communities
Being consulted on needs
Developing the long-term vision for the area
Influencing the identification of priorities
Influencing the choice of indicators and setting of targets
Towards improved performance monitoring and evaluation
Performance management in the City continues to evolve. It is a critical tool for measuring the City’s progress against its short- and medium-term goals, as well as the long-term outcomes of the City. The City will continue to strengthen this tool for individual performance, institutional performance and to monitor and evaluate itself against its long-term goals.
Tshwane Vision 2055 as approved by the Council has outlined the long-term key outcomes with specific actions for implementation during the four decades leading up to 2055. Against this, monitoring and evaluation of the long-term plans need to be an inherent part of improvements and accounting processes of the City as outlined in the approved Performance Management Framework.
291

272
Furthermore, the framework proposes key initiatives that should be implemented in order to achieve its objectives and broadly contribute towards the institutionalisation of Tshwane Vision 2055. The following table summarises key initiatives that should be addressed from the 2014/15 financial year.
Table 9.5: Summary of key actions
Action required Description of action Progress
Unpack Tshwane Vision 2055
Tshwane Vision 2055 should be unpacked into clear outcomes and outputs to be achieved for each decade of change.
A matrix of indicators should be developed for all levels of plans aligned with Tshwane Vision 2055, and should include economy and efficiency indicators, as well as national and provincial KPIs.
The unpacking should be aligned to various scenarios of future development.
The mechanisms to monitor the contributions of external role players and investors should also be defined.
The process of reviewing the IDP for the 2016–21 term has addressed this. Outcome plans for each of the outcomes have been developed and contain multilevel indicators to ensure outcome integration.
The outcome plans above also reflect what partnerships are required from external organisations to support the achievement of the various outcomes.
An effective model for budgeting aligned to the outcomes performance approach
A model for budgeting should be developed that ensures that the outcomes of Tshwane Vision 2055 as well as the priorities of the first decade are funded.
A prioritisation model on the budget has been developed as part of the CAP system and has been phased in in the budget process. This will be adjusted to include the outcome plan proposals.
Development of procedures and guidelines for the performance management system
The following procedures must be developed:
Performance planning
Development of indicators, baselines and targets
Programme and project planning
Procedures for reporting
Preparation of audit files and verification of evidence
The process has been initiated and will be finalised in the new IDP to be developed for the 2016–21 term.
Integrated electronic performance system
An integrated electronic performance management system should be implemented that enables performance management in the City of Tshwane.
The City has implemented an electronic system named QPR which is the reporting system of the City.
Mapping of business processes
Existing business processes for service delivery should be mapped in order to determine the baseline of service delivery processes. Thereafter, new processes should be determined to allow for efficient and economical service delivery.
Business processes were mapped through the ISO 9001 project. These are however in the process of being refined.
Capacity-building
Materials for capacity-building on performance management and the implementation of accredited and non-accredited interventions to build the capacity of the Municipality to do performance management over time should be
Seminars are held regularly, and accredited materials are in the process of being developed. Current materials are being developed against unit standards US 116358
292

273
Action required Description of action Progress
developed. This includes the development of project maturity.
and US 116341.
Governance matters
Clarification and resolution of the role and accounting lines of municipal entities, and of the full implementation of the regionalisation model vis-à-vis departments
Regionalisation is being rolled out with a greater separation of duties.
The accounting lines of the municipal entities have been defined. The Shareholder Unit has to ensure that municipal entities comply with all governance matters, and all entities are required to report to the parent in terms of performance reporting standards and requirements.
293

274
10. CITY OF TSHWANE PERFORMANCE SCORECARD FOR 2016 – 2021
Introduction
This section outlines the key indicators and targets for the 2016–2021 period. These serve as a performance contract between the City and its residents. The indicators and targets outlined below should be read together with the SDBIP for 2016–2017. The information is structured around the six outcomes contained in Tshwane Vision 2055. The following table reflects the outcomes with supporting programmes:
Outcome 1: A resilient and
resource-efficient city
Outcome 2: A growing economy that is
inclusive, diversified and competitive
Outcome 3: Quality infrastructure
development that support liveable
communities
Sustainable Waste Management
Mobility
Energy Security
Water security
Biodiversity and Greening
Infrastructure funding
Resilience for climate change
Sector support and investment attraction
Green economy
Economic transformation
Sustainable human settlement
Rural development
Transport-orientated development
Inner city regeneration
Land use management
Mobility
Greening
Outcome 4: An equitable city
that supports happiness, social
cohesion, safety and healthy
citizens
Outcome 5: An African capital city that
promotes excellence and innovative
government solutions
Outcome 6: South Africa’s capital with
an activist citizenry
Indigent and vulnerable support
Poverty spatial targeting
Food security
Healthy living
Safe city
Social cohesion and nation
building
Building up a knowledge city
Customer centricity
Institutional efficiency
Revenue maximisation and financial
management
Civic education
Digital citizens
The indicators and targets which are contained in the scorecard show a continuation in delivering on the mandate of the City as well as supporting the programmes referred to above. This should be read in conjunction with the previous IDP and its subsequent reviews to maintain a line of sight on what it is that has been set out to be achieved in the 2016–21 term.
Baseline determination has been informed by performance of the City since the start of its current term in 2011. The projected baseline has been set in anticipation that the targets in the adjusted 2015/16 IDP and SDBIP scorecards will be achieved.
294

275
The outcomes in Tshwane Vision 2055 and the indicators which contribute to the achievement of the programmes identified in the strategic context chapter are reflected below.
Outcome 1: A resilient and resource-efficient city
Outcome programmes: • Sustainable waste management • Energy security • Water security • Biodiversity • Infrastructure development
Indicator 2016/21 five-
year target Projected baseline for the period 2011/12 - 2015/16
Target 2016/17 Target 2017/18 Target 2018/19 Target 2019/20 Target 2020/21 Definition of indicator
Percentage of households11 in formal areas with access to water (metered connections)
87,09% (793 902 households)
81,2% (740 202 households)
82,17% (8 800 new connections for the year)
83,28% (10 100 new connections for the year)
84,53% (11 400 new connections for the year)
85,80% (11 600 new connections for the year)
87,09% (11 800 new connections for the year)
This indicator measures water meter connections installed, as applied for by consumers and the water meter connections installed to respond to new developments as well as addressing the backlogs.
Percentage of formalised areas with access to weekly waste removal services
100% 100% 100% 100% 100% 100% 100% This indicator measures
the waste removal
services provided to
households in townships
as per City’s
Geographical Information
11 Reference in the scorecard to Households refer to the number of households in the city as reported in the 2011 census figure which is 911 536
295

276
Indicator 2016/21 five-year target
Projected baseline for the period 2011/12 - 2015/16
Target 2016/17 Target 2017/18 Target 2018/19 Target 2019/20 Target 2020/21 Definition of indicator
System (GIS) listings.
Percentage of households with access to sanitation
82,23% (749 567 households)
78,58% (716 277 households)
79,07% (4 500 new connections for the year)
79,91% (7 670 new connections for the year)
81,07% (7 520 new connections for the year)
81,45% (6 500 new connections for the year)
82,23% (7 100 new connections for the year)
In the 2011–16 IDP, the City approved the minimum standard for access to sanitation to be UDS toilets and waterborne sanitation/ flush toilets as full access. This indicator measures both service levels. This excludes households with access to sanitation through VIP and chemical toilets as calculated by the 2011 Census.
Percentage of formal households with access to electricity
86,45% (787 980 households)
80,43% (733 230 households)
81,65% (11 050 new connections for the year)
82,90% (11 400 new connections for the year)
83,86% (9 900 new connections for the year)
85,22% (11 200 new connections for the year)
86,45% (11 200 new connections for the year)
This indicator measures the access to electricity provided by the City through formal connections to households in formal settlements as per town planning definition.
Outcome 2: A growing economy that is inclusive, diversified and competitive
Outcome programmes: • Sector support and investment attraction • Green economy support
296

277
• Economic transformation
Indicators supporting these programmes: Indicator 2016/21 5 year
target Projected baseline for the period 2011/12 - 2015/16
Target 2016/17 Target 2017/18 Target 2018/19 Target 2019/20 Target 2020/21 Definition of indicator
Number of new work opportunities facilitated by the City)
125 500 182 328 21 500 44 500 cumulative (23 000 for the year)
69 500 cumulative (25 000 for the year)
96 500 cumulative (27 000 for the year)
125 500 cumulative (29 000 for the year)
New work opportunities
created through the
implementation of capital
and operational projects:
These are work
opportunities created
through EPWP when City
departments implement
their capital or operational
funded projects and a
beneficiary is
remunerated a minimum
wage.
Rand value investment attracted to the city
R13 billion R12,289 billion R2,2 billion R4,6 billion cumulative (R2,4 billion for the year)
R7,2 billion cumulative (R2,6 billion for the year)
R10 billion cumulative (R2,8 billion for the year)
R13 billion cumulative (R3 billion for the year)
This indicator reflects the
Rand value of investment
realised in terms of
private sector investment
in the city as a result of
investment attraction
initiatives by the City
landing investments during a specific financial year resulting from investors/developers investing in Tshwane.
297

278
Indicator 2016/21 5 year target
Projected baseline for the period 2011/12 - 2015/16
Target 2016/17 Target 2017/18 Target 2018/19 Target 2019/20 Target 2020/21 Definition of indicator
Support through mentorship/training of the Tshepo 10 000 cooperative
1 342 240 245 502 cumulative (257 for the year)
772 cumulative (270 for the year)
1 052 cumulative (280 for the year)
1 342 cumulative (290 for the year)
This indicator measures the support provided to the Tshepo 10 000 cooperatives through training and mentorship programmes.
Outcome 3: Quality infrastructure development that supports liveable communities
Outcome programmes: • Information communication technology • Sustainable human settlements • Rural Development • Inner city regeneration • Transit oriented development
Indicators supporting these programmes:
Indicator 2016/21 five-year target
Projected baseline for the period 2011/12 - 2015/16
Target 2016/17 Target 2017/18 Target 2018/19 Target 2019/20 Target 2020/21 Definition of indicator
Percentage of required municipal storm water drainage network provided
209.7 km over the 5yr term towards eradicating the backlog of
37.1% (667,66 km out of the total backlog of storm water of 1780 km
38.62% out of a backlog of 1780 km (19,7 km for the year)
41.14% cumulative out of a backlog of 1780 km (45 km for the year)
43.95% cumulative out of a backlog of 1780 km (50 km for the year)
46.65% cumulative out of a backlog of 1780 km (48 km for the year)
49.29% cumulative out of a backlog of 1780 km (47 km for the year)
This indicator is derived
from the total storm water
backlog of 1780 km as
determined in 2015/16
298

279
Indicator 2016/21 five-year target
Projected baseline for the period 2011/12 - 2015/16
Target 2016/17 Target 2017/18 Target 2018/19 Target 2019/20 Target 2020/21 Definition of indicator
178012 km
Percentage of roads provided to the required standard (km)
192 km over the 5yr term towards the eradication of the backlog of 303613 km
31.73% (690,44 km out of the total backlog of 3036 km of roads)
32.88% out of a backlog of 3036 km (25 km for the year)
34.72% cumulative out of a backlog of 3036 km (40 km for the year)
36.69% cumulative out of a backlog of 3036 km (43 km for the year)
38.76% cumulative out of a backlog of 3036 km (45 km for the year)
40.55% cumulative out of a backlog of 3036 km (39 km for the year)
This indicator is derived
from the total roads
backlog of 3036 km as
determined in 2015/16
Percentage of completed TRT bus-way lanes constructed
100% of 39 km 17,72 km 12,82% of 39 km cumulative (5 km for the year)
35,90% of 39 km cumulative (9 km for the year)
48,72% of 39 km cumulative (5 km for the year)
74,36% of 39 km
cumulative (10
km for the year)
100,00% of 39 km cumulative (10 km for the year)
Bus lanes are physically segregated lanes that are exclusively for the use of Tshwane Rapid Transit vehicles. This indicator only measures the length of bus lanes to be constructed and completed. It measures the percentage of the completed of works.
Percentage of informal settlements with access to rudimentary water services
100% 100% 100% of 130 informal settlements
100% of 130 informal settlements
100% of 130 informal settlements
100% of 130 informal settlements
100% of 130 informal settlements
The indicator measures the percentage of informal settlements receiving rudimentary water services through water tankers, Jojo tanks or
12 The city delivered 667.66km of storm water in the previous term but due to fast tracking of formalisation of informal settlements where roads and storm water infrastructure to the required standard follows later, the backlog has increased to 1780km. 13 The city delivered 690.44km of roads in the previous term but due to fast tracking of formalisation of informal settlements where roads and storm water infrastructure to the required standard follows later, the backlog has increased to 3036km.
299

280
Indicator 2016/21 five-year target
Projected baseline for the period 2011/12 - 2015/16
Target 2016/17 Target 2017/18 Target 2018/19 Target 2019/20 Target 2020/21 Definition of indicator
communal standpipes.
Percentage of informal settlements with access to rudimentary sanitation services
100% of 54 informal settlements provided with rudimentary sanitation
54 100% of 54 informal settlements
100% of 54 informal settlements
100% of 54 informal settlements
100% of 54 informal settlements
100% of 54 informal settlements
This indicator measures only access to sanitation through chemical toilets in informal settlements provided and serviced by the City.
Number of informal settlements formalised
TBD 10 TBD TBD TBD TBD TBD This indicator measures the formalisation as per the Re Aga Tshwane programme.
Outcome 4: An equitable city that supports happiness, social cohesion, safety and healthy citizens
Outcome programmes: • Indigent and vulnerable support • Poverty spatial targeting • Food security • Healthy living • Safe city • Social cohesion and nation building
Indicators supporting these programmes:
300

281
Indicator 2016/21 5 year target
Projected baseline for the period 2011/12 - 2015/16
Target 2016/17 Target 2017/18 Target 2018/19 Target 2019/20 Target 2020/21 Definition of indicator
Percentage of achievement of the child health index
100% 100% 100% 100% 100% 100% 100% The indicator is made up
of achievements against
Health facilities providing
the following –
Percentage of PHC fixed clinics providing immunisation coverage for children under the age of 1
Percentage of PHC
fixed clinics
implementing PMTCT
programme
Percentage of PHC
fixed clinics providing
HIV testing facilities for
pregnant women
Number of indigent households supported by the City through its social packages
20 000 114 490 118 490 households on indigent register (4 000 new households for the year)
122 490
households on
indigent register
(4 000 new
households for
the year)
126 490
households on
indigent register
(4 000 new
households for
the year)
130 490
households on
indigent register
(4 000 new
households for
the year)
134 490
households on
indigent register
(4 000 new
households for
the year)
This indicator measures
the number of households
on the indigent register.
Percentage of reduction in safety incidents (fire, rescue as well as specialised humanitarian incidents)
5% decrease between 2016 and 2021 (decrease safety incidents from
13 688 1% (13 551 incidents for the year)
2% (13 414 incidents for the year)
3% (13 277 incidents for the year)
4% (13 140 incidents for the year)
5% (13 003 incidents for the year)
The decrease in safety
incidents refers to the
actual number of safety
incidents reported and
responded to by the City.
301

282
Indicator 2016/21 5 year target
Projected baseline for the period 2011/12 - 2015/16
Target 2016/17 Target 2017/18 Target 2018/19 Target 2019/20 Target 2020/21 Definition of indicator
13 688 to 13 003)
Percentage of increase in interventions to root out crime and related incidents (annual)
5% increase over the 5 years (1% increase per year on 2015/16 result)
2 737 1% increase on 2015/16 target (2 764 interventions for the year)
1% increase on 2016/17 target (2 792 interventions for the year)
1% increase on 2017/18 target (2 819 interventions for the year)
1% increase on 2018/19 target (2 846 interventions for the year)
1% increase on 2019/20 target (2 874 interventions for the year)
This indicator refers to
interventions around
crime prevention, by-law
policing and road policing
interventions conducted
by the TMPD in efforts to
increase public safety.
Outcome 5: An African capital city that promotes excellence and innovative government solutions
Outcome programmes: • Building up a knowledge city • Customer centricity • Institutional efficiency • Revenue maximisation and financial management
302

283
Indicators supporting these programmes: Indicator 2016/21 5 year
target Projected baseline for the period 2011/12 - 2015/16
Target 2016/17 Target 2017/18 Target 2018/19 Target 2019/20 Target 2020/21 Definition of indicator
Unqualified audit opinion achieved (annual)
Unqualified audit opinion
Unqualified audit opinion
Unqualified audit opinion
Unqualified audit opinion
Unqualified audit opinion
Unqualified audit opinion
Unqualified audit opinion
This indicator reflects on the Auditor-General’s opinion on the City’s financial and non-financial report for the financial year under review.
Percentage of financial targets met (regulated targets = cost coverage, debt coverage and % of service debtors to revenue)
100% 100% 100% 100% 100% 100% 100% The financial targets of the City are set in the MTREF. This indicator measures the cost coverage, debt coverage and service debtors to revenue.
Percentage of reduction of non-revenue water (NRW) from 25,06% to 22,71% (2,25% over the five years)
2,25% 25,06% 24,61% 24,16% 23,61% 23,16% 22,71% This indicator refers to the
reduction of non-revenue
water as measured by the
City. Water losses are a
component of non-
revenue water.
Percentage of average of annual non-revenue energy (NRE)
< 10% 16,05 <10% <10% <10% <10% <10% This indicator measures
the total % of non-
revenue energy which is
made up of technical
losses and unaccounted
for electricity out of the
total energy distributed.
Percentage of employee satisfaction rating
62 60 N/A 60 N/A 62 N/A This indicator measures the employee satisfaction
303

284
Indicator 2016/21 5 year target
Projected baseline for the period 2011/12 - 2015/16
Target 2016/17 Target 2017/18 Target 2018/19 Target 2019/20 Target 2020/21 Definition of indicator
which is determined through an employee satisfaction survey. The percentage is calculated using the employees who completed the survey as the denominator. This is seen as a proxy for employee satisfaction as not all employees will participate and complete the survey although they will have the opportunity. The employee satisfaction survey is conducted once in two years. Although the survey is conducted by the Corporate and Shared Services, achieving improved ratings in the survey is the responsibility of all departments through implementation of HR policies, amongst others. The target set is based on the average norm for organisations such as the CoT as proposed by the BMR of UNISA.
304

285
Outcome 6: South Africa’s capital city with an active citizenry that is engaging, aware of their rights and presents themselves as
partners in tackling societal challenges
Outcome programmes: • Civic Education Programme • Digital Citizen Programme
Indicator 2016/21 5 year target
Projected baseline for the period 2011/12 - 2015/16
Target 2016/17 Target 2017/18 Target 2018/19 Target 2019/20 Target 2020/21 Definition of indicator
Length of broadband infrastructure rolled out
1 500 km
100 km 150 km 600 km 750 km 0 0 This indicator measures the km of broad brand fibre network laid out against the City-approved project plan.
Percentage of ward committees established and operational
100% of elected ward committees
New Initiation of process for the election of ward committees14
100% 100% 100% 100% This indicator measures the establishment and functionality of ward committees that have been elected.
14 Due to the 2016 local government elections which is scheduled to be held on 3 August 2016, the election of ward committees will only be possible during the 3rd or last quarter of 2017 and therefor the target for the functionality of ward committees is only set for the 2017/18 financial year.
305
286
11. FINANCIAL PLAN
Introduction
This chapter outlines the funding and budget approach to the 2016/17 IDP review, specifically the 2016/17 MTREF. The process towards the development of the 2016–19 MTREF is in line with the Council-approved IDP and Budget Process Plan of August 2015.
Background
Section 16(1) of the Municipal Finance Management Act (MFMA), 2003 (Act 56 of 2003) stipulates that the council of a municipality must approve an annual budget for the municipality for each financial year before the start of that financial year. Section 16(2) stipulates that in order to comply with subsection (1), the mayor of the municipality must table the annual budget at a council meeting at least 90 days before the start of the budget year.
Section 22 of the MFMA also stipulates that immediately after an annual budget is tabled in a municipal council, the accounting officer must make public the annual budget and documents in terms of section 17, invite the local community to submit representations in connection with the budget, and submit the annual budget to the National Treasury and the relevant provincial treasury in printed and electronic formats.
Section 23(2) of the MFMA stipulates further that “after considering all budget submissions, the Council must give the Executive Mayor an opportunity –
to respond to the submissions; and if necessary, to revise the budget and table amendments for consideration by the
council”. The tabling of the draft budget and IDP was followed by public consultation meetings (outreach sessions) with various stakeholders to strengthen the principles of people-centred governance, transparency and accountability. Outreach meetings were held in all the regions. Section 24 of the MFMA contains the requirements regarding the approval of annual budgets:
“(1) The municipal council must at least 30 days before the start of the budget year consider approval of the annual budget.
(2) An annual budget – (a) must be approved before the start of the budget year; (b) is approved by the adoption by the council of a resolution
referred to in section 17(3)(a)(i); and
306

287
(c) must be approved together with the adoption of resolutions as may be necessary – (i) imposing any municipal tax for the budget year; (ii) setting any municipal tariffs for the budget year; (iii) approving measurable performance objectives for
revenue from each source and for each vote in the budget;
(iv) approving any changes to the municipality’s integrated development plan; and
(v) approving any changes to the municipality’s budget-related policies.
(3) The accounting officer of a municipality must submit the approved annual budget to the National Treasury and the relevant provincial treasury.”
Community consultation process on the draft 2015/16 MTREF and Tshwane Integrated Development Plan
The Office of the Speaker conducted the community consultation process and published the meeting dates on billboards and in the Beeld and Pretoria News newspapers on 30 March 2016.
The Draft 2016/17 MTREF and the proposed tariffs, as well as the proposed amendments to the approved Property Rates Act, were presented and discussed with the public in all seven regions. Furthermore the public was invited to render written comments for consideration.
Consultations were held in the seven regions on 11 and 12 April 2016. The tabled budget was also placed on the City’s website, as well as distributed to all community libraries on 31 March 2016, for access by all stakeholders.
Written representations to the tabled 2016/17 MTREF, proposed tariffs and the proposed amendments to the approved Property Rates Policy and By-Law.
Submissions to the tabled 2016/17 MTREF were received and have been responded to in the budget documents which are separate from this document.
2016/17 MTREF policy statement and guidelines
The Tshwane Vision 2055 and the IDP together form the primary point of reference for preparation of the MTREF.
According to section 25 of the Local Government: Municipal Systems Act, 2000 (Act 32 of 2000), each municipal council must, after the start of its elected term, adopt a single, inclusive and strategic plan (Integrated Development Plan) (IDP) for the development of the municipality which links, integrates and coordinates plans and takes into account proposals for the development of the municipality and which aligns the resources and capacity of the municipality with the implementation of the
307

288
said plan. The IDP forms the policy framework and general basis of the budget. A few are listed concerning the direction in which the MTREF will eventually have to lead.
Alignment with national directives
In his budget speech on 24 February 2016, the Finance Minister highlighted the following plan:
Managing our finances in a prudent and sustainable way; Re-igniting confidence and mobilising the resources of all social partners; Collectively investing more in infrastructure to increase potential growth; Giving hope to our youths through training and economic opportunities; Protecting South Africans from the effects of the drought; Continuously improving our education and health systems; Accelerating transformation to an inclusive economy and participation by all; and Strengthening social solidarity and extending our social safety net
The following impacts directly on local government’s budgets:
Growth in the South African economy is currently expected to be only 0.9% in 2016, after 1.3% in 2015, to improve gradually over the medium term to 1.7% in 2017, reaching 2.4% in 2018. This reflects both depressed global conditions and the impact of the drought;
There is an urgent need to restore confidence in fiscal sustainability, if not, deteriorating conditions can create a vicious cycle of lower growth, declining incomes, rising inflation, currency depreciation, rising interest rates and falling investment and consumption;
Local government faces tough fiscal choices; growth in transfers will slow while the cost of providing the services increases; and
Municipalities are urged to improve own revenue collection, increasing efficiency and obtain greater value for money;
The following parameters directly informed the 2016/17 Draft Budget: Slowing down of expenditure and building reserves; Collection levels will be targeted at 95%; The levels of borrowing will be maintained at R1 billion to fund capital
infrastructure Creation of cash surpluses over the MTREF; and Departments should critically review their current activities and do more with less.
National Treasury issued MFMA Circular No 78 date 7 December 2015 and subsequently issued MFMA Circular No 79 on 7 March 2016, to guide the compilation of the 2016/17 MTREF.
The key focus of Circular 79 is the impact of the date of the 2016 Local Government Elections on municipalities, affected by re-demarcations and the changes to the local government grant allocations.
308

289
Changes to municipal boundaries will result in some significant changes to municipal allocations in 2016/17. To cushion the impact of these changes, all municipalities will receive at least 95% of the equitable share formula allocation indicatively allocated to them in 2016/17 in the 2015 Division of Revenue Act.
Local government budget and financial management reforms
Section 216 of the Constitution prescribes that national legislation must prescribe measures to ensure transparency and expenditure control in each sphere of government, by introducing –
Generally-recognised accounting practices; Uniform expenditure classifications; and Uniform treasury norms and standards.
Uniform financial norms and standards
The National Treasury issued a circular on uniform financial norms and standards on 17 January 2014. It aims to bring consistency in the interpretation and application of certain financial information using standardised financial ratios. The circular addresses different categories of ratios, norms and interpretation and covers various aspects of a municipality’s finances, such as financial position, financial performance and budget implementation, so that these can be used as part of in-year and end-of-year analysis. This will also aid in long-term financial planning and can be used to track progress over a number of years.
The focus of the 2016/17 MTREF is to ensure that the City is financially viable and sustainable. This required reviewing of the current spending levels within prudent financial limits, necessitating realignment and addressing basic service delivery.
309

290
Figure 31.1: Guiding principles for the 2016/17 MTREF
The following budget guidelines directly informed the compilation of the budget:
Produce a surplus budget and build cash reserves; Resources will be redirected towards the Mayoral priorities; Departments and Entities must ensure that on-going expenditure is funded with
on-going revenues and any reduction in revenues should be followed by a reduction in expenditure;
Departments should critically review their current activities and redirect funds towards priority areas;
Maintain all assets at a level adequate to protect the capital investment and minimize future maintenance and replacement costs;
Explore alternative options of providing services, thereby ensuring value for money; and
Implementation of National Treasury Circular 82 regarding cost containment measures and elimination of all non-essential expenditure.
Budget assumptions
The following assumptions apply to the 2016/17 MTREF:
Table 11.1: Budget assumptions
Assumptions 2016/17 2017/18 2018/19
% % %
Consumer price index 6,6 6,2 5,9
Debt collection rate 95 95 95
• Revise the level of expenditure to
create a surplus in the 2016/17 MTREF
• Revise the level of borrowing • Accelerating revenue collection • Implement operational efficiencies.
Ensuring the City’s financial viability
• Reprioritisation of existing funds to
accelerate basic service delivery • Accelerate programmes as per
Mayoral Lekgotla priority
Accelerate basic service delivery
310

291
Assumptions 2016/17 2017/18 2018/19
% % %
Debt impairment 5 5 5
Expected operating expenditure 100 100 100
Salary and wage increase 6 6 6
Expected capital expenditure 98 98 98
Tariff increases:
Sanitation 12 11 10
Refuse removal 10 9 8
Property rates 10 9 8
Water 12 11 10
Electricity 9.5 8.5 7.5
Rand Water 11.9 11 10
Eskom 7.9 8,0 8,0
Surplus R988.6 billion R1.5 billion R2.2 billion
Funding capital: Bonds R1 billion R1 billion R1 billion
Funding capital: Council funding (including public contributions)
R115 million R255 million R455 million
POLICY AMENDMENTS
Budget policy
The budget policy was reviewed and amendments were made to bring the policy in line with National Treasury directives and to strengthen the financial management controls. The policy is contained in Annexure I in the Budget documents.
Property rates policy and by-laws
Amendments to the pensioners and disabled rebates were effected in the Draft Property Rates Policy. The policy is contained in Annexure J in the Budget documents.
Discussion of the 2016/17 MTREF
Operational budget
The 2016/17 proposed operating revenue (excluding capital grants and contributions) amounts to R29.6 billion and escalates to R33.5 billion in 2018/19. The operating expenditure amounts to R27.6 billion, resulting in a surplus of R1 930.7 million for the 2016/17 financial year. Revenue presents an increase of 10.6% and expenditure an increase of 6.1% against the 2015/16 adjustment budget.
The table below indicates the Medium-term Revenue and Expenditure Budget for the 2016/17 to the 2018/19 financial year.
311

292
Table 11.1: MTREF 2016–2019
Adjustments Budget 2015/16
Budget 2016/17
Increase/ (Decr)
Budget 2017/18
Budget 2018/19
R’000 R’000 % R’000 R’000
Revenue (26 750 791) (29 578 240) 10,6 (31 002 738 (33 531 033)
Expenditure 26 054 894 27 647 570 6,1 29 456 217 31 379 703
(Surplus)/ Deficit (695 897) (1 930 670) 177,4 (1 546 520) (2 151 330)
Capital Grants (2 456 036) (2 370 209) (3,5) (2 449 064) (2 532 510)
(Surplus)/ Deficit incl. capital grants (3 151 932) (4 300 879) 36,5 (3 995 584) (4 683 840)
Revenue framework
Maintaining the financial viability of the City of Tshwane is critical to the achievement of service delivery and economic objectives. Revenue generation is fundamental in strengthening the institutional environment for the delivery of basic municipal services and infrastructure. The capacity of generating revenue is challenged by affordability and by unemployment that is prevalent in the municipal area.
The MFMA Circular 66 requires municipalities to continue to explore appropriate ways of generating revenue required to fund the maintenance, renewal and expansion of the infrastructure required to provide municipal services. Municipalities must table a credible and funded budget, based on realistic estimates of revenue that are consistent with their budgetary resources and collection history.
The table below highlights the proposed percentage increase in tariffs per main service category.
Table 111.2: Tariff increase per main service category
Revenue category 2016/17 proposed tariff increase (%)
Sanitation 12
Refuse removal 10
Water 12
Electricity 9.5
Property rates 10
The following table is a high-level summary of the MTREF (classified per main revenue source):
312

293
Table 111.3: High-level summary of the MTREF (classified per main revenue source)
Statement of Financial Performance
Adjusted Budget 2015/16
2016/17 Medium Term Revenue and Expenditure Framework
Budget Year 2016/17 %
Budget Year +1 2017/18
Budget Year +2 2018/19
R R R R
Revenue by Source
Property rates (5 236 780 500) (5 764 124 295) 10.1 (6 284 005 584) (6 787 610 232)
Service charges - electricity revenue
(10 359 204 400) (11 360 245 985) 9.7 (12 325 866 889) (13 250 306 906)
Service charges - water revenue
(3 406 694 600) (3 815 497 952) 12.0 (4 242 731 931) (4 673 835 054)
Service charges - sanitation revenue
(798 908 400) (894 777 408) 12.0 (994 602 028) (1 095 331 399)
Service charges - refuse revenue
(1 095 809 400) (1 205 390 340) 10.0 (1 314 755 205) (1 420 636 333)
Service charges: other (199 580 800) (209 559 840) 5.0 (222 552 550) (235 683 150)
Rental of facilities and equipment
(109 111 600) (127 396 900) 16.8 (134 840 269) (142 382 811)
Interest earned - external investments
(41 175 946) (41 895 300) 1.7 (44 446 806) (39 188 038)
Interest earned - outstanding debtors
(182 050 000) (187 511 500) 3.0 (199 137 213) (210 886 309)
Fines (196 691 400) (198 658 314) 1.0 (210 975 132) (223 422 665)
Licences and permits (57 679 800) (60 563 790) 5.0 (64 318 746) (68 113 552)
Transfers recognised - operational
(3 553 164 959) (3 976 476 420) 11.91 (4 079 907 880) (4 423 238 440)
Other revenue (1 513 938 701) (1 736 142 189) 14.7 (884 527 467) (960 328 432)
Total Revenue (excluding capital transfers and contributions
(26 750 790 506) (29 578 240 233) 10.6 (31 002 667 700) (33 530 963 321)
The revenue sources are discussed below.
Property rates
Increased by 10.1% compared to the 2015/16 Adjustments Budget.
The property rates revenue expected for the 2015/16 financial year, including supplementary values, was utilised as basis for determining baseline revenue for the 2016/17 MTREF. For the 2016/17 MTREF, all category’s tariffs are proposed to increase with 10% from 1 July 2016.
The first R75 000 value (R15 000 legally impermissible plus R60 000 granted by the city) of residential properties is exempted and registered indigents pay no property rates.
Amendments to the pensioners and disabled rebates were effected in the Draft Property Rates Policy.
313

294
Electricity revenue
The revenue increase is attributed to the average increase of 9.5% in tariffs (the average domestic tariff increases ranges from 8% to 12%) for the 2016/17 financial year. The proposed tariff increase range between 12% for commercial to 13% to 16% on bulk commercial and industrial TOU (time of use) scales subject to load profiles and load factor percentage.
The percentage increase is based on the Eskom tariff increase and guidelines from NERSA. The tariff increase application, submitted to NERSA, is slightly higher than proposed in the pre-community consultation budget, to cover actual costs. Furthermore, the cross subsidisation of the domestic lower block tariffs, is being challenged by lower consumptions, owing to load shedding and pre-paid meters being monitored by consumers towards savings. The application is still subject to NERSA approval.
The tariff structure with regard to households provides for inclining block tariffs. Registered indigents are granted 100 kWh free of charge.
Water revenue
Revenue increased by 12%, owing to the proposed 12% increase in tariffs, based on the 2015/16 adjustments budget revenue.
The tariff structure consists of a rising block tariff with pro-poor lower block tariffs and pro-water conservation blocks for higher usage to encourage water savings.
It should be noted that the tariff was increased to 12% in line with Rand Water guidelines and the bulk purchase was also amended accordingly. This is still subject to any increase in the bulk purchase tariff of electricity, still to be approved by NERSA at the end of June 2015, which may again impact on the proposed tariff for selling water to the City’s consumers.
Registered indigents are granted 12 kℓ free of charge.
Sanitation revenue
The increase in revenue amounts to 12%, in line with the 2016/17 tariff increase. Sanitation charges are calculated according to the percentage water discharged. A zero-based tariff is charged for registered indigents for the first 6 kℓ discharged.
Refuse removal revenue
Increased with 10% in line with the 2016/17 tariff increase. The tariff structure for refuse removal comprises of two components, which is for refuse removal and city cleansing. The tariff for refuse removal is based on the cost per m³ (container capacity) of refuse removed per month and on the service provided in a specific area. The tariffs for city cleaning are levied on all premises irrespective of who removes the refuse generated on the premises.
314

295
NT MFMA Circular 66 requires refuse removal tariffs to cover the cost of providing the service and appropriately structured cost reflective tariffs must be in place. The tariffs must also maintain a cash-backed reserve to cover the future costs of rehabilitating landfill sites.
A tariff increase of 10% for 2016/17 is proposed to render a stable service to all areas.
More information regarding the tariff increases are contained in Annexure B of the detailed budget document and details of the proposed tariff schedules are set out in Annexures C to G.
Grant funding
The national allocations in terms of the Division of Revenue Bill No. 2 of 2016 are set out as follows:
Operating grants
The operating grants increased by 9%; the increases are mainly on the EPWP and ICDG. The equitable share and fuel levy increased by 13% and 3% respectively compared to the previous Division of Revenue Act (DoRA) allocation.
Infrastructure grants
Infrastructure grants increased by 0.3% compared to the previous DoRA allocation; the increases are mainly on the USDG grant and INEP.
Detail grant allocations
With the promulgation of the 2016 Division of Revenue Bill on 18 February 2016, the following operational and capital allocations to the City of Tshwane have been factored into the 2016/17 MTREF:
315

296
Table 11.4: Grant allocations
The grant allocations according to the Division of Revenue Bill amount to R6 billion, R6.4 billion and R6.8 billion in the 2016/17, 2017/18 and 2018/19 financial years respectively.
Expenditure framework
The following table is a high-level summary of the 2016/17 Medium-term Expenditure Framework (classified per main category of expenditure).
2015/16 2016/17 2017/18 2018/19
National Grants DoR Bill DoR Bill DoR Bill DoR Bill
R'000 R'000 R'000 R'000
Infrastructure Grants 2,569,292 2,577,845 2,688,940 2,816,997
Urban Settlement Development Grant (USDG) 1,500,683 1,539,334 1,629,196 1,711,548Integrated National Electrification Programme (INEP) 37,000 40,000 40,000 45,000Public Transport Infrastructure and Systems Grant (PTNG)
931,609 950,011 975,000 1,000,141
Neighbourhood Development Partnership Grant (NDPG) 100,000 48,500 44,744 45,308Energy Efficiency and Demand Side Management (EEDSM) - - - 15,000 Operational Grant Allocation 87,851 95,774 44,542 46,722
Integrated City Development Grant (ICDG) 39,702 42,652 41,892 44,322Local Government Financial management Grant (FMG) 4,175 2,875 2,650 2,400
Expanded Public Works Programme (EPWP) 31,143 50,247 - -Municipal Human Settlement Capacity Grant (MHSCG) 12,831 - - -
Indirect Grants 60,103 14,073 16,186 14,635
Integrated Electrification Programme (ESKOM) Grant 26,203 10,479 11,386 12,046
Neighbourhood Development Partnership Grant (Technical Assistance) 3,900 3,594 4,800 2,589Regional Bulk Infrastructure Grant 30,000 - - - Equitable Share 3,050,239 3,304,938 3,631,225 3,942,812
Equitable Share Formula 1,654,390 1,864,838 2,148,143 2,404,418 Fuel Levy 1,395,849 1,440,100 1,483,082 1,538,394 TOTAL 5,767,485 5,992,630 6,380,893 6,821,166
MUNICIPAL FINANCIAL YEAR 01 JULY TO 30 JUNE
316

297
Table 11.5: 2016/17 Medium-term Expenditure Framework (classified per main category of expenditure)
Statement of Financial Performance
Adjusted Budget 2015/16
2016/17 Medium Term Revenue and Expenditure Framework
Budget Year 2016/17
Increase Budget Year
+1 2017/18 Budget Year +2
2018/19
R R % R R
Expenditure by Type
Employee related costs 6 922 747 652 7 459 140 450 7.7 7 907 371 487 8 381 525 135
Remuneration of councillors 112 749 100 120 466 574 6.8 127 935 507 135 483 701
Debt impairment 756 783 000 849 491 950 12.3 927 972 635 1 005 095 783
Depreciation and asset impairment 1 087 264 900 1 254 566 602 15.4 1 326 149 727 1 398 492 568
Finance charges 1 039 747 164 1 057 637 958 1.7 1 114 528 351 1 088 506 331
Bulk purchases 8 796 859 800 9 748 735 783 10.8 10 629 909 388 11 486 219 117
Other materials 316 569 482 272 960 566 -13.8 289 175 018 306 709 375
Contracted services 2 863 810 590 2 673 690 227 -6.6 2 959 953 735 3 201 541 185
Transfers and grants 254 147 800 288 054 588 13.3 284 073 767 290 590 573
Other expenditure 3 904 213 494 3 922 824 505 0.5 3 889 146 720 4 085 538 419
Loss on disposal of PPE 1 000 1 000 0.0 1 062 1 125
Total Expenditure 26 054 893 982 27 647 570 202 6.1 29 456 217 397 31 379 703 312
(Surplus)/Deficit before Transfers recognised - capital
(695 896 524) (1 930 670 031) 177.4 (1 546 450 303) (2 151 260 010)
Transfers recognised - capital (2 456 035 754) (2 370 208 687) -3.5 (2 449 064 118) (2 532 509 560)
(Surplus)/Deficit for the year (3 151 932 278) (4 300 878 718) 36.5 (3 995 514 421) (4 683 769 570)
The operating expenditure equates to R27.6 billion in the 2016/17 financial year and escalates to R31.4 billion in the 2018/19 financial year, which is a growth of 6.6%. Total operating expenditure has increased by 6.1% against the 2015/16 adjustment budget.
The following graph illustrates the percentage each expenditure group constitutes of the total expenditure for the 2016/17 financial year:
317

298
Figure 11.2: Percentage per each expenditure group for the 2016/17 financial year
The expenditure groups are discussed below.
Employee-related costs
The South African Local Government Bargaining Council entered into a three-year Salary and Wage Collective Agreement for the period 01 July 2015 to 30 June 2018. The agreement reached is as follows:
2015/16 Financial Year – 7 per cent 2016/17 Financial Year – average CPI (Feb 2015 – Jan 2016) + 1% 2017/18 Financial Year – average CPI (Feb 2016 – Jan 2017) + 1%
Should the above CPI’s be more than 10% or less than 5%, it will be assumed to be 10% and 5% respectively. The average CPI for February 2015 to January 2016 was published as 4.7% and the salary increases from 1 July 2016 will thus be 5% + 1% = 6%.
This group of expenditure will be closely monitored in order to ensure that costs are managed. The city encourages staff to take time off to make up for overtime worked and all planned overtime must be submitted to management for approval.
Remuneration of councillors
The cost associated with the remuneration of councillors is determined and informed directly by way of the Remuneration of Public Office Bearers Act, 1998 (Act 20 of 1998). The determined upper limits of salaries, allowances and benefits of members of Council are gazetted annually in December/January.
Employee related costs
26.98%
Remuneration of councillors
0.44%
Debt impairment 3.07%
Depreciation and asset impairment
4.54%
Finance charges 3.83%
Bulk purchases 35.26%
Other materials 0.99%
Contracted services 9.67%
Tranfers and grants 1.04%
Other expenditure
14.19%
318

299
Debt impairment
The provision for debt impairment was determined based on an annual collection rate of 96%. For the 2016/17 financial year this amount equates to R849.5 million.
Depreciation and asset impairment
Provision for depreciation and asset impairment has been informed by the Municipality’s asset management strategy (Asset Management Policy and Procedures). Budget appropriations in this regard amount to R1.2 billion for the 2016/17 financial year and equates to 4.5% of the total operating expenditure.
Finance charges
The finance charges provided in the MTREF amount to R1 billion, R1.1 billion and R1 billion respectively.
Bulk purchases
Compared to the 2015/16 adjustment budget, the bulk purchases group of expenditure (Rand Water and Eskom) has increased by 10.8% from R8.8 billion to R9.7 billion. The tariff increases with regard to Eskom (7.857%) and Rand Water (11.9%) have been provided for. A decline in electricity purchases and an increase in Water purchases are expected based on the 2015/16 trend, which was factored in.
Other materials
This expenditure group amounts to R273 million, a decrease of R43.6 million. Other materials consist of stationery, cleaning material, coal, consumables, chemicals, etc. The decrease in other materials is attributed to the cutting of expenditure in line with cost containment measure the municipality is proposing to implement in the 2016/17 MTREF.
Contracted Services
This group of expenditure decreased with 6.9%, owing to the cutting of expenditure in line with cost containment measures relating to expenditure items such as consultant fees.
Other Expenditure
This group of expenditure comprises of general related expenditure. It should be noted that in terms of NT regulations and formats, repairs and maintenance is divided between other materials, contracted services and other expenditure. This group of expenditure has increased by 0.5% when compared to the 2015/16 Adjustments Budget. Subsistence and travelling for Council officials has been centralised in the office of the City Manager in order to manage and monitor this expenditure and the City Manager must approve all travelling in line with submitted motivations.
319

300
Operating budget per vote
The following table represents the 2016/17 MTREF per department:
Table 11.6: 2016/17 MTREF per department
MTREF FINANCIAL PERFORMANCE PER STRATEGIC UNIT (Excluding Municipal Rates and Transfer and Grants - Capital)
Description Current Year
2015/16 2016/17 Medium Term Revenue and Expenditure
Framework
Adjusted Budget Budget Year
2016/17 Budget Year +1
2017/18 Budget Year +2
2018/19
Operating Revenue By Vote
City Planning and Development (135 981 225) (111 701 206) (113 672 257) (118 862 292)
Communications, Marketing and Events
(43 893 300) (45 210 099) (48 013 125) (50 845 900)
Corporate and Shared Services (48 152 430) (23 346 109) (21 607 568) (22 882 414)
Economic Development (33 143 000) (52 347 000) (2 230 200) (2 361 782)
Emergency Services (87 591 568) (77 288 409) (81 326 591) (86 753 273)
Energy and Electricity Department (10 606 046 800) (11 616 115 909) (12 597 600 748) (13 538 073 061)
Environmental Management (1 302 143 000) (1 427 108 064) (1 550 219 426) (1 669 992 942)
Group Audit and Risk (132 206 700) (45 111 896) (47 164 833) (49 239 558)
Group Financial Services (8 430 727 346) (9 215 491 326) (10 070 288 962) (10 886 341 575)
Group Information & Comm Technology Man
(8 867 525) (17 716) (18 814) (19 924)
Group Legal Services (375 700) (386 971) (410 963) (435 210)
Group Property Management Department
(734 355 571) (64 532 686) (68 099 714) (71 704 597)
Health and Social Development (12 113 500) (12 819 349) (12 900 910) (13 655 584)
Housing and Human Settlement (116 820 984) (250 182 390) (49 905 350) (52 436 649)
Metro Police Services (202 348 900) (204 503 369) (217 182 577) (229 996 350)
Service Delivery and Coordination (276 392 657) (291 043 509) (308 556 060) (326 713 915)
Sports and Recreation (6 975 400) (7 000 062) (10 312 249) (9 317 023)
Transport (240 072 500) (341 596 894) (425 541 786) (483 606 598)
Water and Sanitation Department (4 332 582 400) (4 842 367 269) (5 377 615 567) (5 917 724 674)
Total Revenue (26 750 790 506) (28 628 170 233) (31 002 667 700) (33 530 963 321)
Operating Expenditure By Vote
City Planning and Development 302 418 749 316 181 456 331 903 165 351 509 804
City Strategies and Performance Management
29 994 000 29 767 188 31 564 866 33 452 580
Communications, Marketing and Events
166 753 994 148 697 222 155 332 371 162 192 148
Corporate and Shared Services 1 092 179 383 1 096 548 191 1 160 724 166 1 229 033 703
Customer Relations Management Department
91 966 109 100 541 382 106 600 346 112 982 309
Economic Development 333 893 364 340 584 974 304 862 833 319 552 010
Emergency Services 591 305 620 620 381 740 657 651 496 696 440 951
Energy and Electricity Department 8 943 201 453 9 538 915 103 10 322 082 396 11 068 259 089
Environmental Management 577 080 747 591 831 108 629 664 159 665 766 192
Group Audit and Risk 284 120 216 306 160 892 323 127 271 340 504 249
Group Financial Services 1 200 815 682 1 502 514 101 1 595 267 008 1 683 628 258
Group Information & Comm Technology Man
563 344 451 560 990 932 595 304 996 626 852 425
320

301
Group Legal Services 111 375 229 115 386 922 122 389 346 129 690 138
Group Property Management Department
244 082 960 261 151 196 256 542 625 259 633 712
Health and Social Development 196 640 957 204 811 203 213 469 559 222 720 259
Housing and Human Settlement 442 202 483 555 196 016 359 797 215 370 813 858
Metro Police Services 1 787 624 711 1 841 714 957 1 953 106 304 2 068 566 000
Office of the Chief Whip 31 847 300 34 374 726 36 454 883 38 632 788
Office of the City Manager 275 013 915 302 864 246 321 465 587 340 193 584
Office of the Executive Mayor 297 262 628 280 043 148 292 202 138 304 824 074
Office of the Speaker 258 354 916 273 174 357 289 888 630 307 110 004
Service Delivery and Coordination 3 676 920 205 3 809 093 221 4 082 647 102 4 322 531 471
Sports and Recreation 118 256 815 124 164 756 134 392 862 138 165 727
Transport 1 172 918 448 1 230 897 327 1 306 189 020 1 367 916 532
Water and Sanitation Department 3 265 319 647 3 461 583 838 3 873 587 052 4 218 731 445
Total Expenditure 26 054 893 982 27 647 570 202 29 456 217 397 31 379 703 312
(Surplus)/Deficit for the year (695 896 524) (1 930 670 031) (1 546 450 303) (2 151 260 010)
The following are some of the issues/programmes accommodated within the operational budget:
Drug and Substance abuse – R50 million EPWP – R168 million (Grant funding = R50,2 million) Events Management – R27,5 million LED initiatives – R29,2 million National Health Insurance – R19,6 million NGO Support – R6,9 million Prevention of illegal land invasion – R28,4 million Re-aga-Tshwane – R113,3 million Repairs and Maintenance (R1,5 billion in total) inter alia for –
o Water: R114,2 million o Sanitation: R55,1 million o Electricity: R190 million o Roads and Transport: R119 million o Refuse Removal: R16,4 million o Power Stations: R70,8 million
Rudimentary Services – R73 million SMME initiatives – R12,1 million Sustainability initiatives – R15 million Urban Management – R70,4 million Wi-Fi – R100 million Formalization of informal settlement – R90 million A Re Yeng operations R300 million Household refuse removal – R350 million
Capital budget
321

302
The compilation of the 2016/17 MTREF posed many challenges amongst others the prioritisation, ranking and evaluating of projects that are competing for limited financial resources. Projects were considered in terms of priority and urgency by the respective strategic units/departments and subsequently included in the budget submission for consideration. Corporate budget indicatives were issued per funding source subsequent to the Mayoral Budget Lekgotla.
Budget Steering Committee hearings were held in February 2016 where departments presented their budget proposals for the 2016/17 MTREF. This process required for departments to prioritise capital projects and resource allocations within the context of affordability taking into account inter alia contractual obligations, ongoing infrastructure maintenance and executive commitments.
The compilation of the capital budget in terms of internal capacity (council funds) is based on the application of sound financial management principles in order to ensure that a funded budget is tabled. Taking this into consideration the funding capacity for the 2016/17, 2017/18 and 2018/19 financial years amounts to R4.5 billion, R3.7 billion and R4 billion respectively.
The Capital Budget is funded from the following sources:
Internally generated revenue (including Public Contributions & Donations) R1.1 billion
Borrowings (loans and/or bonds) R1 billion. Grant funding R2.4 billion
All new projects were prioritised in line with set determined affordability allocations and benefit to the city.
Capital Budget per funding source
The following table indicates the 2016/17 Medium-term Capital Budget per funding source:
Table 11.7: MTREF capital budget per funding source
Funding Code DescriptionBudget
2016/2017%
Budget
2017/2018%
Budget
2018/2019%
Council Funding 980,000,000 21.95% 150,000,000 4.05% 300,000,000 7.52%
Public Transport, Infrastructure Systems Grant 750,000,000 16.80% 755,000,000 20.38% 760,000,000 19.06%
Neighbourhood Development Partnership Grant 48,500,000 1.09% 44,744,000 1.21% 45,308,000 1.14%
Urban Settlements Development Grant 1,493,153,980 33.44% 1,580,320,118 42.66% 1,660,201,560 41.64%
Integrated National Electrification Programme 40,000,000 0.90% 40,000,000 1.08% 45,000,000 1.13%
Capital Replacement Reserve 5,000,000 0.11% 5,000,000 0.13% 5,000,000 0.13%
Energy Efficiency Demand Side Management - 0.00% - 15,000,000 0.38%
Other Contributions 200,000 0.00% - 0.00% - 0.00%
Community Library Services 5,283,600 0.12% 7,000,000 0.19% 7,000,000 0.18%
Borrowings 1,000,000,000 22.40% 1,000,000,000 27.00% 1,000,000,000 25.08%
Public Contributions & Donations 100,000,000 2.24% 100,000,000 2.70% 150,000,000 3.76%
Social Infrastructure Grant 21,000,000 0.47% 22,000,000 0.59% - 0.00%
Gautrans Grant 12,071,107 0.27% - 0.00% - 0.00%
LG SETA Discretionary Allocation 10,000,000 0.22% - 0.00% - 0.00%
Total 4,465,208,687 100.00% 3,704,064,118 100.00% 3,987,509,560 100.00%
322
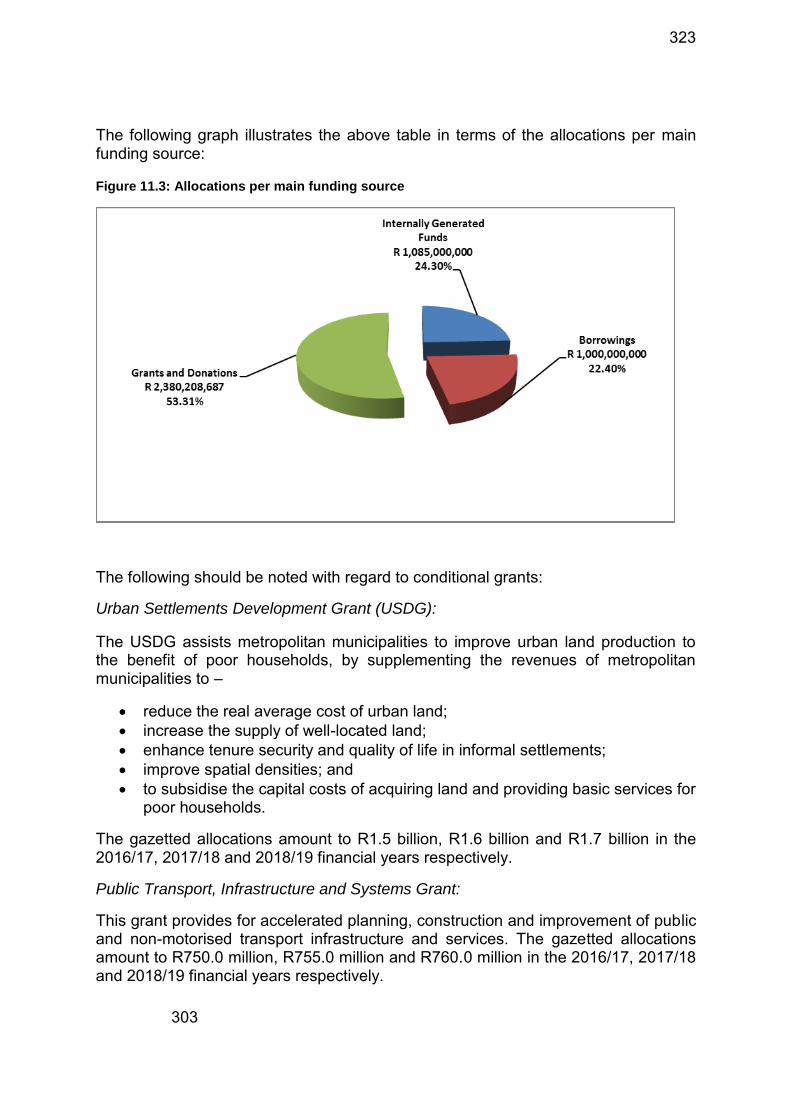
303
The following graph illustrates the above table in terms of the allocations per main funding source:
Figure 11.3: Allocations per main funding source
The following should be noted with regard to conditional grants:
Urban Settlements Development Grant (USDG):
The USDG assists metropolitan municipalities to improve urban land production to the benefit of poor households, by supplementing the revenues of metropolitan municipalities to –
reduce the real average cost of urban land; increase the supply of well-located land; enhance tenure security and quality of life in informal settlements; improve spatial densities; and to subsidise the capital costs of acquiring land and providing basic services for
poor households.
The gazetted allocations amount to R1.5 billion, R1.6 billion and R1.7 billion in the 2016/17, 2017/18 and 2018/19 financial years respectively.
Public Transport, Infrastructure and Systems Grant:
This grant provides for accelerated planning, construction and improvement of public and non-motorised transport infrastructure and services. The gazetted allocations amount to R750.0 million, R755.0 million and R760.0 million in the 2016/17, 2017/18 and 2018/19 financial years respectively.
323

304
Neighbourhood Development Partnership Grant:
The purpose of this grant is to support neighbourhood development projects that provide community infrastructure and create the platform for other public and private sector development, towards improving the quality of life of residents in targeted underserviced neighbourhoods. R48.5 million, R44.7 million and R45.3 million have been gazetted for the 2016/17, 2017/18 and 2018/19 financial years respectively.
Integrated National Electrification Programme:
The purpose of this grant is to implement the Integrated National Electrification Programme (INEP) by providing capital subsidies to municipalities to address the electrification backlog of occupied residential dwellings, clinics and the installation of bulk infrastructure and rehabilitation and refurbishment of electricity infrastructure in order to improve the quality of supply. R40 million, R40 million and R45 million have been gazetted for the 2016/17, 2017/18 and 2018/19 financial years respectively.
Capital budget per department
The following table indicates the 2016/17 medium-term capital budget per department:
Table 111.8: Medium term capital budget per department
Department Budget 2016/17 % Budget 2017/18 % Budget 2018/19 %
City Planning and Development 50,000,000 1.12% - 0.00% - 0.00%
Corporate and Shared Services 10,000,000 0.22% - 0.00% - 0.00%
Economic Development 65,400,000 1.46% 56,900,000 1.54% - 0.00%
Emergency Services 11,000,000 0.25% 11,000,000 0.30% 11,000,000 0.28%
Environmental Management 38,500,000 0.86% 39,000,000 1.05% 58,500,000 1.47%
Group Audit and Risk 10,000,000 0.22% 16,000,000 0.43% - 0.00%
Group Financial Services 65,000,000 1.46% 45,000,000 1.21% 45,000,000 1.13%
Group Information and Communication Technology 204,700,000 4.58% 140,500,000 3.79% - 0.00%
Group Property Management 5,000,000 0.11% 5,000,000 0.13% - 0.00%
Health and Social Development 50,900,000 1.14% 54,200,000 1.46% 12,000,000 0.30%
Housing and Human Settlement 537,704,001 12.04% 874,820,000 23.62% 1,025,508,909 25.72%
Metro Police Services 30,000,000 0.67% 10,000,000 0.27% 10,000,000 0.25%
Office of the City Manager 259,950,000 5.82% 128,744,000 3.48% 245,308,000 6.15%
Energy and Electricity 1,428,664,750 32.00% 418,312,146 11.29% 499,378,998 12.52%
Water and Sanitation 383,500,000 8.59% 573,304,248 15.48% 597,115,428 14.97%
Sports and Recreation 68,283,600 1.53% 62,000,000 1.67% 62,000,000 1.55%
Transport 1,246,606,336 27.92% 1,269,283,724 34.27% 1,421,698,225 35.65%
TOTAL CAPITAL BUDGET 4,465,208,687 100% 3,704,064,118 100% 3,987,509,560 100%
324

305
The following graph illustrates the above table in terms of allocations per department:
Figure 11.4: Capital budget allocation per department
The detail capital budget indicating all projects per department is contained in Chapter 8 of this document
Some of the main projects and key focus areas of the budget and IDP to be addressed in 2016/17 financial year include amongst others:
City Planning and Development Redevelopment of Caledonian – R50 million
Economic Development
Business Process Outsourcing Park in Hammanskraal – R50 million Brick Making Facility – R4 million Informal Trade Market (Inner City) – R7.4 million Tshwane Packaging Facility – R4 million
Energy and Electricity Electricity for All – R227.6 million New Bulk Infrastructure – R176 million New connections – R34.7 million 11kV Overhead Network – R14 million AMVI Infrastructure (smart meters) – R950 million
325

306
Environmental Management Extension of Ga-Rankuwa Cemetery – R2 million 240 Litre containers – R21 million Upgrading of the market trading system – R5.5 million Upgrading and extension of facilities – R5.5 million
Group Financial Services Improvement of the Supply Chain processes – R30.0 million Security at Stores (CCTV and document management system) – R30 million
Health and Social Development Social Development Centre in Hammanskraal – R7 million Social Development Centre in Winterveld – R7 million Social Development Centre in Mabopane – R7 million Upgrading of Clinic Dispensaries – R14.5 million Multi-purpose Development Centres (Phomolong) – R7.7 million Refurbishment of Rayton Clinic – R7.7 million
Group Information and Communication Technology Upgrade of IT Networks – R30 million E-Initiative supporting the Smart City – R20 million Computer Equipment Deployment – R15.5 million Credit Control Solution – R20 million IT Infrastructure (Tshwane House) – R29 million
Housing and Human Settlement Project Linked Housing - Water Provision – R128.9 million Sewerage - Low Cost Housing – R153.4 million Roads and Storm water - Low Cost Housing – R193.7 million Project Linked Housing – Acquisition of Land – R31.4 million Hostels (Saulsville and Mamelodi) – R20 million
Metro Police Services Purchase of policing equipment – R30 million
Office of the City Manager
Implementation of the Tsosoloso Programme – R48.5 million City Hall Renovations – R20 million Re Aga Tshwane – R191.4 million
Sports and Recreational Services Olievenhoutbosch Multi-Purpose Sport Facility – R15 million Lotus Gardens Multi-Purpose Sport Facility – R8 million New Ga-Rankuwa Library –R10 million Upgrade Refilwe Stadium – R10 million Greening Sports fields – R20 million
Transport
326

307
Mabopane Station Modal Interchange – R54.1 million TRT - Transport Infrastructure - R750 million (busway; depots; stations and
non-motorized transport) Flooding backlogs: Networks and Drainage canals – R369.9 million Upgrading of Garsfontein Road – R12 million Internal Roads: Northern areas – R18.2 million Airport – R21.5 million
Water and Sanitation Reservoir Extensions – R66 million Replacement and Upgrading: Redundant Bulk Pipeline Infrastructure - R5.5
million Refurbishment of Water Networks and Backlog Eradication – R223 million Waste Water Treatment Works Facilities – R203 million
In view of the above it is evident that a large portion of the capital budget has been allocated to address infrastructure and human settlement provision infrastructure in the 2016/17 MTREF.
The balance of the funding allocations has been prioritised in terms of promoting good governance and active citizenry, improved financial sustainability, safer communities and integrated social development, shared economic growth and job creation and institutional development, transformation and innovation.
Details of the budget is contained in the detail MTREF document which is separate from this document.
327