Embed Size (px)
Citation preview
NBSIR 73-277
Evaluation of a Pressurized Stairwell
Smoke Control System for a 12 Story
Apartment Building
Francis C. W. Fung
Center for Building Teclinology
Institute for Applied Technology
National Bureau of Standards
Washington, D. C. 20234
June 1973
Final Report
Prepared for
Office of Policy Development and Research
Department of Housing and Urban Development
Washington, D. C. 20410

NBSIR 73-277
EVALUATION OF A PRESSURIZED STAIRWELL
SMOKE CONTROL SYSTEM FOR A 12 STORY
APARTMENT BUILDING
Center for Building Technology
Institute for Applied Technology
National Bureau of Standards
Washington, D. C. 20234
June 1973
Final Report
Prepared for
Office of Policy Development and Research
Department of Housing and Urban Development
Washington, D. C. 20410
Francis C. W. Fung
U. S. DEPARTMENT OF COMMERCE, Frederick B. Dent, Secretary
IMATIOWAL BUREAU OF STANDARDS, Richard W. Roberts. Director
TABLE OF CONTENTS
Page
Abstract 1
1.0 INTRODUCTION 1
2.0 CONCEPTS OF SMOKE MOVEMENT DERIVED FROM BASIC PRINCIPLES 2
2.1 Movement of Air Containing Smoke 2
2.2 Buoyancy Force 4
2.3 Estimate of Volume Outflow From a Fire 5
2.4 Pressure Force Due to Volume Outflow From a Fire 6
2.5 Pressure Force Due to Stack Effect 7
2.6 Determination of Location of Neutral Plane 8
3.0 DISCUSSION OF SMOKE SIMULATION AND SMOKE CONTROL 9
4.0 HUD OPERATION BREAKTHROUGH SMOKEPROOF STAIRWELLREQUIREMENTS 11
4.1 Operation BREAKTHROUGH Criteria 11
4.2 Method Chosen 12
4.3 Special Conditions 13
5.0 EXPERIMENTAL PROGRAM 14
5.1 Experimental Procedure 15
5.2 Instrumentations 16
5.2.1 Flow Rate Measurements 16
5.2.2 Pressure Measurements 16
5.2.3 SF, Gas Metering 160
5.2.4 SF^ Analysis 17
6.0 DISCUSSION OF EXPERIMENTAL RESULTS 18
7.0 STAIRWELL PRESSURE FOR EXTENDED WEATHER CONDITIONS 19
Page
8.0 CONCLUSIONS AND RECOMMENDATIONS 21
9 . 0 ACKNOWLEDGEMENTS 23
REFERENCES 24
TABLES 26-36
FIGURES 37-48
EVALUATION OF A PRESSURIZED STAIRWELL SMOKE
CONTROL SYSTEM FOR A 12 STORY APARTMENT BUILDING
by
Francis C. W. FungBuilding Fires and Safety Division
Center for Building Technology
ABSTRACT
An NBS study to evaluate the effectiveness of a pressurized
stairwell smoke control system in a high rise apartment building
is summarized and discussed in the light of experimental results,
analysis, and computer prediction. A quantitative experimental
technique of smoke simulation and smoke movement measurement is
described, supplemented by basic physical laws necessary for
correlation with small fires, and illustrated by the results of an
actual field experiment. Experiments were conducted in a 12 story
apartment building constructed on the Operation BREAKTHROUGH
prototype site in St. Louis, Missouri. The -experimental results
are then further extended to a wider range of ambient weather
conditions by way of computer prediction calculations. General
conclusions and relevant recommendations as a result of the study
are also presented.
Key Words: Analysis; basic correlation formulas; computer
calculations; high-rise building fire; Operation BREAKTHROUGH;
pressurized stairwell; quantitative experiment; smoke control;
smoke simulation

1.0 INTRODUCTION
The many fire safety problems introduced by smoke have been widely
recognized. Traditionally, the characterization of smoke and smoke control
in building fires has been very actively investigated by the fire re-
search community. Of late the investigations have received new impetus
due to a focus of attention on high rise building fires. Smoke as a
critical factor in high rise building fire safety has been well discussed
by a number of authors [1,2]. It is well known that the laws of nature
dictate that hot smoke and gases from a fire will move upwards. In the
case of fire in a conventional high rise building the combination of
bouyancy force due to fire and the stack effect due to weather conditions
can cause air and smoke to travel upwards in stairways, elevator shafts
and vertical utility shafts. This vertical movement of smoke not only
speeds smoke infiltration to the upper levels, it can also leave all the
escape paths smoke logged. This smoke logging of stairway and elevator
shafts presents the added hazard of obstructing fire fighting as well as
preventing safe evacuation from a building fire.
Recent research abroad and in the United States has indicated the
feasibility of smoke control by means of ventilation; and in particular
maintaining the exitways smoke free by pressurization of the stairwells.
From a brief survey of the current status of smoke control in high rise
buildings it appears that the basic principle and guidelines for this
technique of smoke control in high rise buildings have been developed
[3-10] . For a more detailed literature discussion one is referred to
Hobson and Stewart's article [11]. For general guide lines on high rise
smoke control one is referred to Galbreath, McGuire and Tamura's article
1
on control of smoke movement [12],
Current smoke control activities at the NBS are aimed at putting
the techniques to practice by providing a quantitative design base.
With this in mind two approaches have been taken: One, to conduct
high rise smoke simulation experiments that can quantitatively measure
the smoke movement under pressurized and unpressurized conditions; and
second, in conjunction with the first approach, to model the smoke
simulation experiments analytically and to establish a smoke movement
prediction computer program for optimum smoke control design and
standards
.
2.0 CONCEPTS OF SMOKE MOVEMENT DERIVED FROM BASIC PRINCIPLES
Following is a summary of useful concepts applicable to smoke move-
ment study and control. The inclusion of certain concepts is guided by
their usefulness in practical smoke control rather than their elegance,
and to facilitate discussions on smoke simulation experiments in the
following sections. An attempt will be made to illustrate these concepts
by derivations from elementary principles. The purpose of these
derivations is to present the concepts in simple expressions to make them
available to a wider spectrum of interests in the fire community.
2.1 Movement of Air Containing Smoke
Fluid motion in general, including air or smoke, is caused by the
action of natural and mechanical forces. In a fire the two motivation
forces that cause smoke movements are buoyancy force and pressure forces.
Buoyancy forces in a fire are caused by density changes due to heating.
The relative differences in density then sets up a convective flow in a
2

gravity field. Pressure forces can originate in a number of ways, e.g.
by restriction of volume expansion, by stack effect or by the intro-
duction of ventilation controls. Before discussing these forces,
consider smoke motion caused by a generalized pressure force, p. The
momentum equation for the flow field in this case can be simply written
as
,
pVVV = -Vp (1)
where
p: the gas density,
V: the gas velocity vector
p: the pressure distribution of the flow field
V: the gradient operator.
Integrating (1) along the direction of smoke motion one obtains
l/2pV^ = |ApI (2)
where
Ap: the pressure difference
Assume that gas density change is governed by the ideal gas law,
P=|t (3)
where
T: the absolute temperature
R: the gas constant
Combining (2) and (3) and evaluating for air under one atmosphere
condition, with R equaling 53.3 ft. lb/lb "R one obtainsm
V = 174/ApT (4)
where
V: velocity in feet per minute3
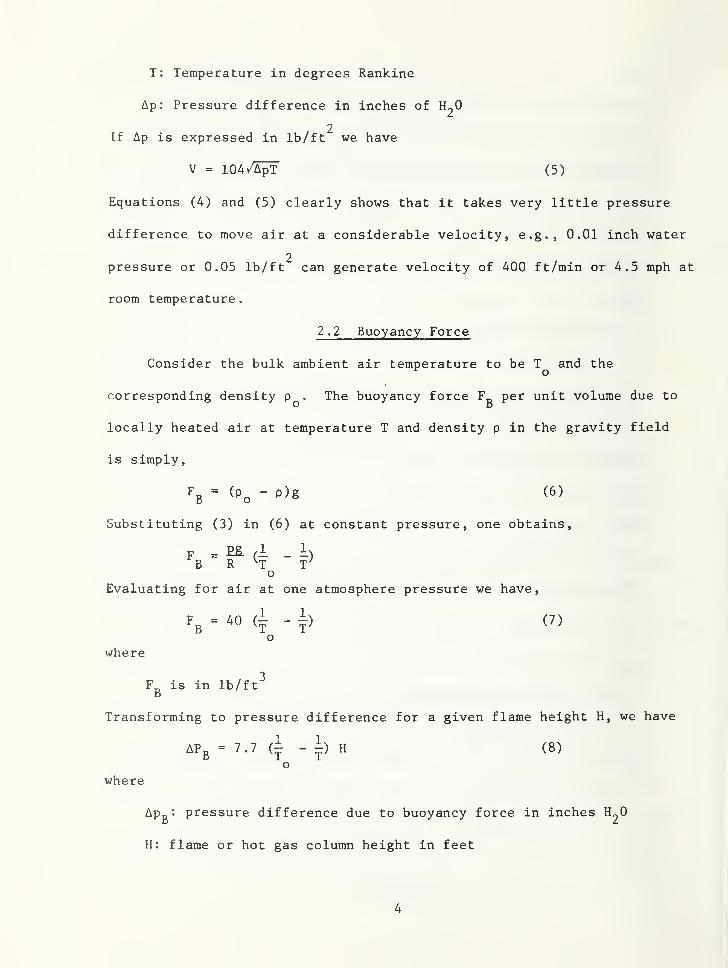
T: Temperature in degrees Rankine
Ap: Pressure difference in inches of
2If Ap is expressed in lb/ft we have
^ V = (5)
Equations (4) and (5) clearly shows that it takes very little pressure
difference to move air at a considerable velocity, e.g., 0.01 inch water
' 2pressure or 0.05 lb/ft can generate velocity of 400 ft/min or 4.5 mph at
room temperature.
2.2 Buoyancy Force
Consider the bulk ambient air temperature to be T and the
corresponding density p . The buoyancy force per unit volume due toO D
locally heated air at temperature T and density p in the gravity field
is simply
,
Fg = (P^ - p)g (6)
Substituting (3) in (6) at constant pressure, one obtains,
F = £^ (i -B R ^T T'^
o
Evaluating for air at one atmosphere pressure we have,
F =40 (i -i) (7)
o
where
F„ is in Ib/ft"^D
Transforming to pressure difference for a given flame height H, we have
APg = 7.7 - H (8)
o
where
Ap^: pressure difference due to buoyancy force in inches H2O
H: flame or hot gas column height in feet
4

The above formula shows that for a fully developed fire with gas temper-
ature reaching 1600°F and confined to one floor with a ceiling height of
10 ft the pressure difference due to buoyancy can reach 0.1 inch H^O.
2.3 Estimate of Volume Outflow From a Fire
Consider the following simplified cellulose burning reaction in air
as representing one possible form of wood burning in a fire,
C^H^qO^ + 6 0^ + 24 N^- ^6 CO^ + 5 H^O + 24 (9)
The above reaction indicates that for every lb-mole of cellulose 30 lb-
moles of air are required to sustain burning, resulting in 35 moles of total
combustion products. Knowing that one lb-mole of cellulose weighs 162 lbs
3and one lb-mole of any gas occupies 359 ft at STP, one can calculate the
volume of combustion products per pound of cellulose consumed as follows,
359 3 1V = TZT X 35 ft = 77.5 ft at STP (10)
162
Thus for a given burning rate R Ib/min of cellulose and a burn room
average air temperature T we have
V = 77.5 R Y- (10a)O o
We see that in a fire where temperature can reach as high as 1600 F
the effect of temperature increase can represent a five fold expansion
of gas at room temperature.
The stoichiometric reaction stated in equation 9 also indicates an
air to cellulose ratio of 5.3 to 1 by weight. This checks with Thomas'
calculation [13] that in a ventilation controlled fire the air to
fuel ratio can be estimated to be in the range of 5.45 to 1 by weight. It
may be pointed out that the roughly 5 to 1 to fuel ratio fire is a lower
5
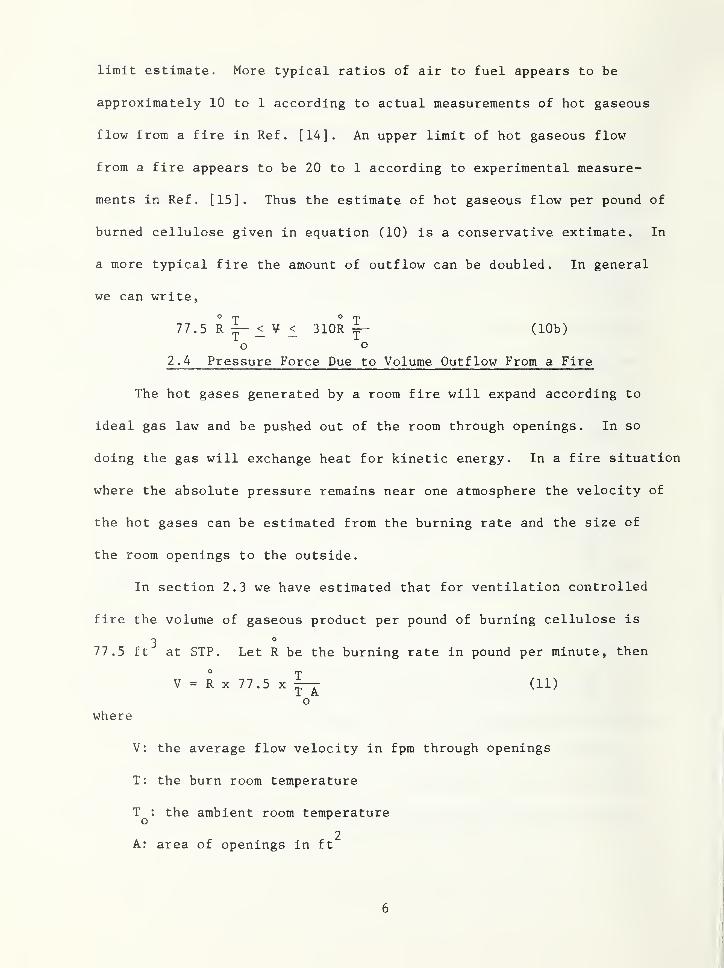
limit estimate. More typical ratios of air to fuel appears to be
approximately 10 to 1 according to actual measurements of hot gaseous
flow from a fire in Ref. [14], An upper limit of hot gaseous flow
from a fire appears to be 20 to 1 according to experimental measure-
ments in Ref. [15]. Thus the estimate of hot gaseous flow per pound of
burned cellulose given in equation (10) is a conservative extimate. In
a more typical fire the amount of outflow can be doubled. In general
we can write,
The hot gases generated by a room fire will expand according to
ideal gas law and be pushed out of the room through openings. In so
doing the gas will exchange heat for kinetic energy. In a fire situation
where the absolute pressure remains near one atmosphere the velocity of
the hot gases can be estimated from the burning rate and the size of
the room openings to the outside.
In section 2.3 we have estimated that for ventilation controlled
fire the volume of gaseous product per pound of burning cellulose is
77.5 ft at STP. Let R be the burning rate in pound per minute, then
O rp O rp
o o
2.4 Pressure Force Due to Volume Outflow From a Fire
3o
V = R X 77.5 xT A
(11)
o
where
V: the average flow velocity in fpm through openings
T: the burn room temperature
T^: the ambient room temp
A: area of openings in ft
6
The pressure due to this flow rate can then be obtained from equation (4)
or (5).
Substituting (11) in equation (4) and solving for Ap , we obtain the
pressure force due to this volume outflow given by,o
-1 R 2Ap = 2.0 X 10
^x~A^^ stochiometric burning
o
where
Ap: pressure difference in inch H2O
T^, T: temperature in degree Rankine
o
R: burning rate in Ib/min
In general for varying degree of air supply to a fire as discussed in
section 2.3, we haveo o
2.0 X 10"^ (^) < Ap < 8.0 X 10~^ (^) (12)
o o
The above formula shows that the pressure difference across the outlet of
a burn room is directly proportional to the square of burning rate, and
inversely proportional to the square of the burn room outflow area. For
example in a fully developed room fire with a burning rate of 10 Ib/min
2and 1600°F gas temperature, a 20 ft doorway opening can induce a pressure
2difference of .0004 to .002 in H2O, whereas a 2 ft small window opening
can induce a pressure difference of .04 to 0.2 inch H2O across the window
opening
.
2.5 Pressure Force Due to Stack Effect
The well known stack effect in a high rise building is caused by the
difference in hydrostatic pressure due to two air columns at different
temperatures. Thus the pressure difference is given by
7
(p^ - p) gh
where
p^: the outside density
p: the inside density
g* the gravity constant
h: distance from neutral plane
Assuming the. ideal gas low are given in equation (3) we have
= f (f - i) h
o
Considering one atmosphere condition, we can express the above as
Ap = 7.7 - h (13)
o
where
h: is in ft
T: in degrees Rankine
Ap : in inches of water
The above formula indicates that for a 100 ft tall building with neutral
plane at mid height and a 70°F temperature differential, a maximum of
0.1 inch H^O pressure difference can be induced by stack effect.
2.6 Determination of Location of Neutral Plane
To calculate the pressure force due to stack effect in formula 13
one needs to determine the location of neutral plane. The stack effect
causes a circulatory motion with a transition neutral plane. The stack
effect causes a circulatory equilibrium pressure. This neutral plane
location can be easily determined by invoking the law of conservation
of mass.
8
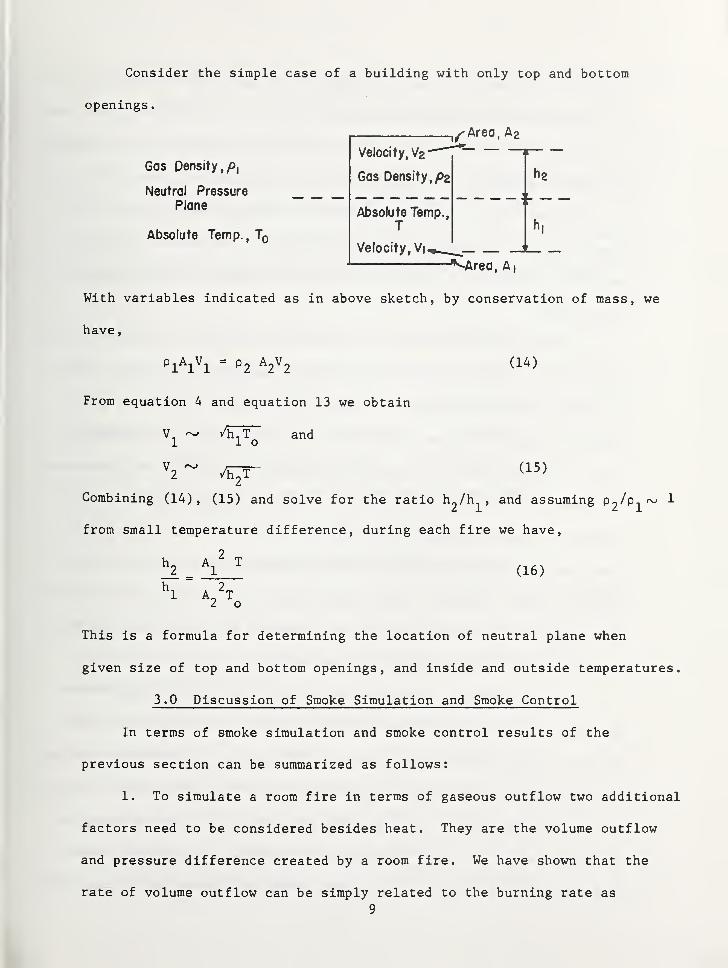
Consider the simple case of a building with only top and bottom
openings
.
_ ./-Area, A2
Gas Density,/),
Neutral Pressure
Plane
Absolute Temp., Tq
Velocity, Vz
Gas Density, /52
Absolute Temp.,T
Velocity, Vi^«
'I
i ,
*^Area, A|
With variables indicated as in above sketch, by conservation of mass, we
have
,
Pl^^ = P2 A2V2 (14)
From equation 4 and equation 13 we obtain
and
^2^ AJ- (15)
Combining (14), (15) and solve for the ratio h2/h^, and assuming p2/p-j^~ 1
from small temperature difference, during each fire we have,
2h^
2 o
(16)
This is a formula for determining the location of neutral plane when
given size of top and bottom openings, and inside and outside temperatures.
3.0 Discussion of Smoke Simulation and Smoke Control
In terms of smoke simulation and smoke control results of the
previous section can be summarized as follows:
1. To simulate a room fire in terms of gaseous outflow two additional
factors need to be considered besides heat. They are the volume outflow
and pressure difference created by a room fire. We have shown that the
rate of volume outflow can be simply related to the burning rate as
9
indicated in equation 10 and the pressure difference due to this overflow
is proportional to the square of the burning rate. Furthennore in a room
fire with the burn room door open as discussed in section 2. A the pressure
difference created by the outflow from the burn room is on the order of
.01 in H^O or less. Thus the simulation of smoke movement during early
stages of a fire by warm rather than hot smoke is relatively simple and
can now be related to a real fire in terms of volume flow and pressure
difference.
2. The pressure created by a buoyancy force due to the presence of a
layer of hot gases is proportional to the thickness of the layer. Thus
the effect of buoyancy force only makes itself felt when the vertical
height of the fire becomes extensive. From equation 8, a hot gaseous
layer 1 ft thick with an average gas temperature of 1600°F only sustains
a pressure of .01 in across it. In other words in terms of smoke
control in high rise buildings the buoyancy force created by the fire
itself is not the critical factor until the building is extensively in-
volved in fire. However, if two stories are fully involved in fire with
a temperature of 1600°F the pressure difference due to buoyancy can be as
high as .2 inch H^O according to equation 8.
3. The pressure created by stack effect on the other hand is pro-
portional to the height of the building. Thus in a high rise building
when there is a significant temperature difference inside and outside due
to weather, the stack effect is the major factor in smoke control even at
the early stages of a fire, e.g. from equation 13, a 10 story building
in the winter with a lOO^F temperature difference, can produce pressure
difference of .16 in H2O. The present design philosophy using pressurized-
10
stairwells following the Canadian example [12] is aimed at countering the
pressure difference and volume flow rate induced by the stack effect.
This calls for rather large flow rates during evacuation. However, it has
seldom been mentioned that the stack effect in a stairwell can be reduced
by the operation of the pressurization system. Since the pressurization
system circulates outside air into the stairwell, the stairwell temperature
can quickly reach equilibrium with the outside and thus reduce the stack
effect. This actually inhibits the upward movement of the smoke in the
stairwell. According to these considerations it appears to be more
relevant to design pressurization to aim at countering the buoyancy force
due to a fire. Since, the stack effect is a function of the indoor and
outdoor temperature difference it is subject to weather variations, this
is considered in Section 7.0 by means of computer simulation.
A.O HUD OPERATION BREAKTHROUGH SMOKEPROOF
STAIRWELL REQUIREMENT
4.1 Operation BREAKTHROUGH Criteria
Criteria L.4.2.9, Volume I, Operation BREAKTHROUGH Guide Criteria
recommended that one exit stairway in apartment buildings over six
stories in height be a smokeproof enclosure. The definition of
smokeproof enclosure was:
"A smokeproof stair enclosure is a stair enclosure so
designed that the movement of products of combustion,
produced by a fire occurring in any part of the building,
into the smokeproof stair enclosure, should be limited by
the use of an appropriate design method to ensure that
with the minimum winter exterior dry bulb temperature
11
(based on the ASHRAE design tables for 97-1/2 percent
probability for the geographical location of the building)
,
the atmosphere in the stair enclosure should not, during a
period of two hours, develop a contaminated atmosphere
emanating from the fire area that is more than one (1)
percent of the volume of the smokeproof stair enclosure."
Each Housing System Producer was given the choice of using any design
method he wished in meeting the criteria noted above. For guidance, one
of the three methods described in the National Research Council of
Canada's publication, "Explanatory Paper on Control of Smoke Movement in
High Buildings" [12] was suggested.
4.2 Method Chosen
For their MFHR at St. Louis, the Housing System Producer (HSP)
elected to use a modification of NRC Method III, "Pressurized Vertical
Shafts." In this method the following conditions apply:
1. The stair enclosure chosen to be the smokeproof enclosure shall
have equipment capable of providing a mechanical air supply into the
shaft at the upper end of not less than 15,000 cfra plus
a. 100 cfm for each door (having a perimeter of not more
than 20 feet) that is equipped with a tight-fitting weatherstripping
or,
b. 200 cfm for every other door (having a perimeter of not
more than 20 feet) into the stairshaft.
12
2. Each stairshaft shall have a vent at street level, opening
either directly outside or into a vestibule or corridor that has a
similar opening to outside, having an opening of not less than 0.5 square
feet for every door that opens into the stairshaft, other than doors at
street floor level, but in any case not less than 20 square feet.
3. The vent at the bottom of the stairshaft may be provided with
a window, shutter or door, which shall open automatically, unless there
is a central control facility from which the window, shutter or door may
be opened manually, and shall be designed to remain in the open position
during the fire emergency.
4. Manual or automatic operation of a fire alarm box on any floor
shall initiate the mechanical air supply to the smokeproof stair enclosure
as provided in (1) above and shall cause the window, shutter, or door to
open as provided in (3) above.
4.3 Special Conditions
For the 12-story building at St. Louis, the basic air supply to the
smokeproof stair enclosure was set at 10,000 cfm instead of the 15,000
cfm stipulated above. Also, the HSP elected to use weatherstripped doors
on the smokeproof stair enclosure thereby reducing additional air supply
needed for door leakage from 200 cfm to 100 cfm per door. As a result,
the total air supply provided by the HSP was approximately 11,200 cfm,
made up of 10,000 cfm plus 1,200 cfm for door leakage.
The air supply fan for the smokeproof stair enclosure was placed on
the roof over the stairtower. Both this fan and the automatic-opening
device on the grade-level door to the outside were connected to the
building fire alarm system. Operation of the building fire alarm system
13
starts the fan and opens the grade-level exit door.
5.0 EXPERIMENTAL PROGRAM
An experimental program to study the effectiveness of smoke control
in a stairwell by pressurization was conducted from March 23 to 28, 1973,
at a twelve story apartment building constructed under Operation BREAK-
THROUGH at St. Louis, Mo. The experiment was designed to study
systematically the effect of various key variables on smoke movement
in a high rise building. Smoke was simulated by a net air flow of
1800 CFM from a room designated as the burn room. The air was mixed
with a predetermined percentage of SF, tracer gas* and heated to a
temperature 10 degrees above the corridor temperature. The range of
reference concentrations of the SF^ tracer gas** in the air from the burn
room contains from 0.3 to 10 parts per million, which is the maximum
reference concentration from each experiment. Altogether ten simulations
were tested. Table 1 lists the description of the tested configurations.
Key variables investigated include simulated fire on the second and ninth
floors, with and without stairwell pressurization, and a number of stair-
well door openings. The stairwell was pressurized by a blower delivering
11,000 CFM. This flow rate resulted in a high velocity flow and high noise
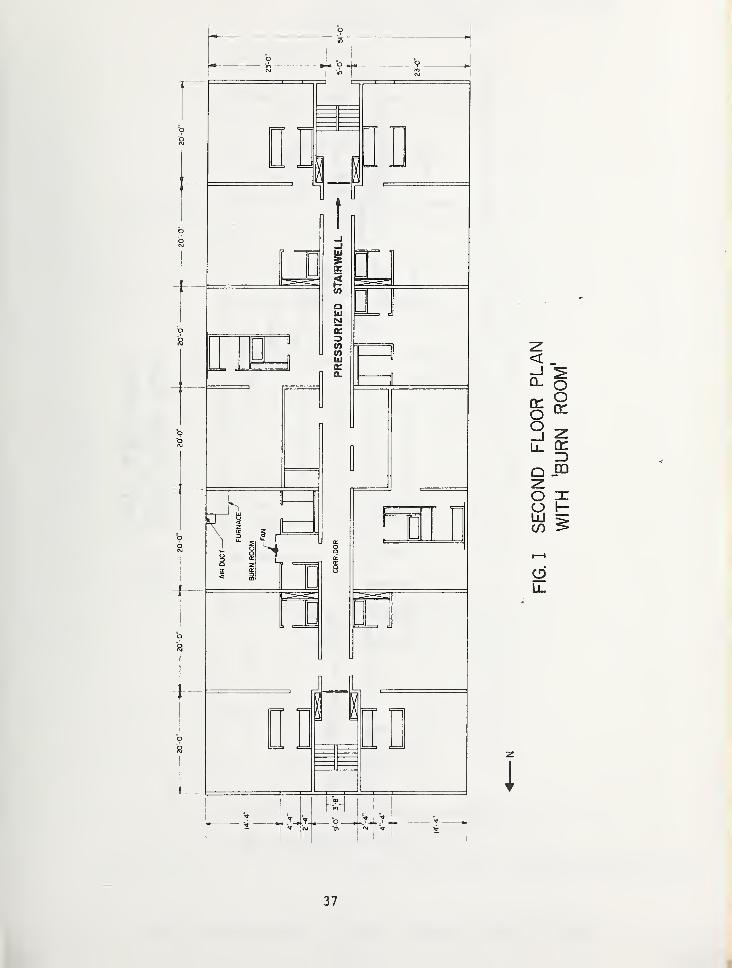
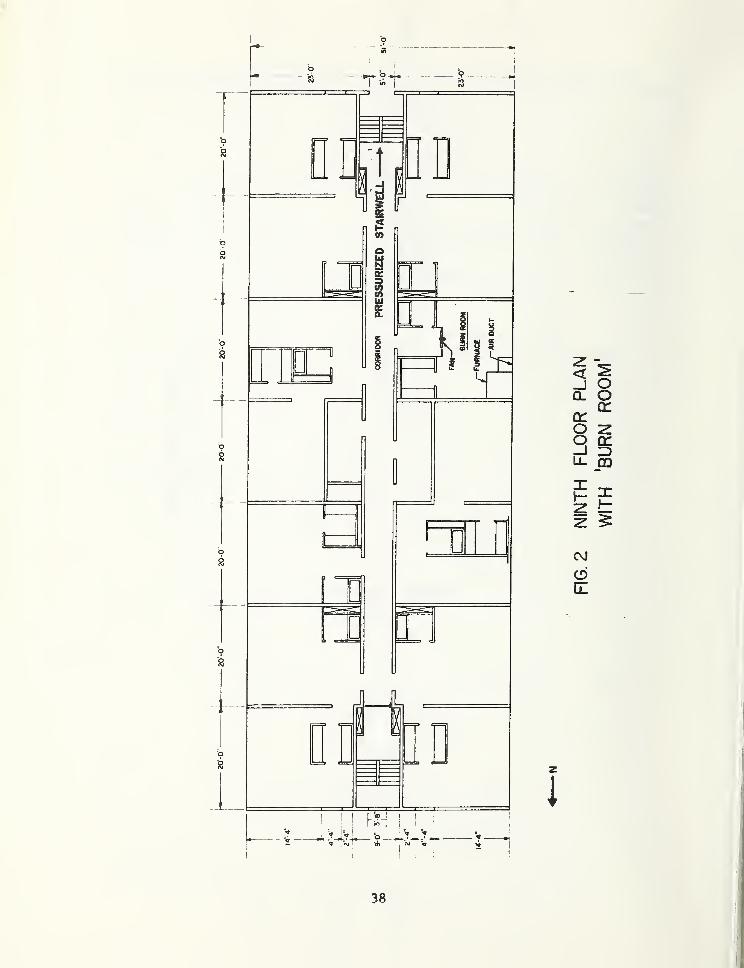
level in the stairwell. Figs. 1 and 2 show the floor plans of the second
and ninth floors respectively of the 12th story building. Rooms used to
*SF^ was chosen as a tracer gas because of its electron capture property
for detection, as well as being odorless, colorless, harmless and stable.
**0SHA concentration limits of SF^ is 1000 PPM as set forth in the
Federal Register, Volume 36, No. 157, August 13, 1971.
14
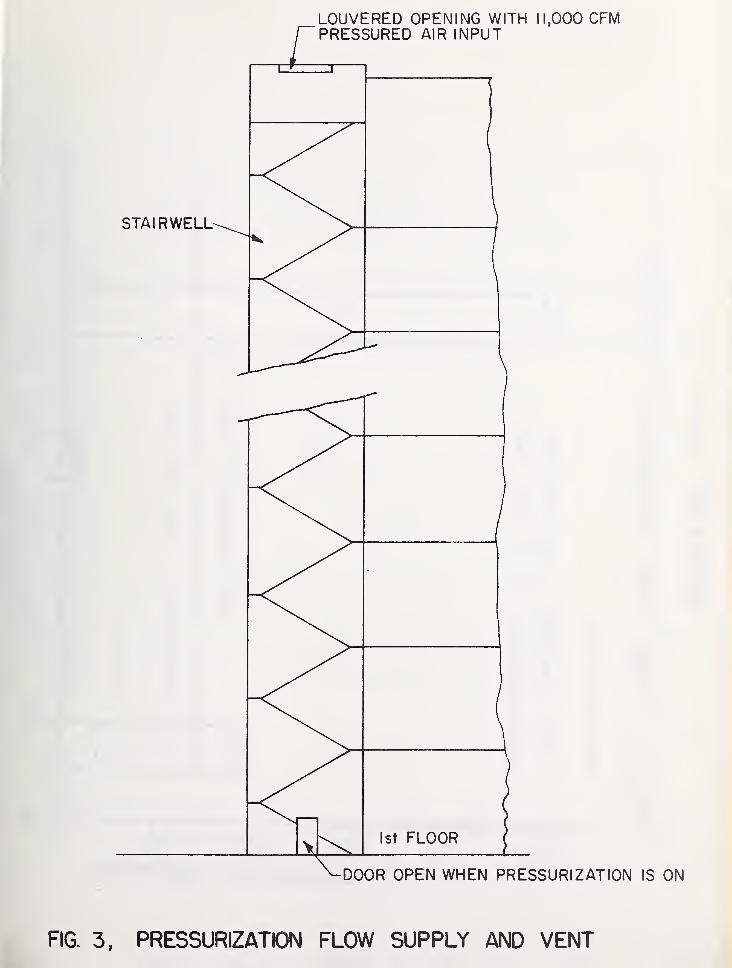
simulate the burn room are indicated in the Figures. Fig. 3 shows the
location of the air supply louver at the top of the stairwell and the
vent (door) opening at the bottom of the stairwell. This door had to be
opened manually as the automatic door release was inoperative.
5.1 Experimental Procedure
Prior to the beginning of each experiment the burn room air was
preheated to a temperature of 80°F by setting of the thermostat of the
forced air heating furnace in that apartment. Air was directed from the
outdoors into the furnace inlet by means of a cardboard duct. A window
box-type fan as shown in Figs. 1 and 2 was used to draw the preheated air
from the burn room and blow it into the corridor. A cardboard mask was
installed at the hall on the same vertical plane as the fan to allow air
from the burn room to be channeled through the fan only. The measured
air flow through the fan was approximately 1800 CFM with an average
pressure of .04 in. H^O across the fan.
At time zero a lecture size bottle of SF, gas located in front of6
the fan was turned on to continuously deliver a predetermined amount of
SF^ , to be mixed with the burn room air supply. The infiltration of
SF^ gas into the rest of the building was then traced by sampling at
4 designated floors at both the north stairwell and mid-corridor at 5-
minute intervals. The floors chosen for measurement were the second,
fifth, ninth, and eleventh. In the sampling routine, one man was stationed
in the stairwell, and another in the building to collect integrated gas
samples at the above chosen floors beginning at 5, 15 and 25 minutes after
time zero. Each vertical traverse of the building from the 11th floor
15
to the second floor took approximately 4 minutes. The gas samples collected
in ballons were then analyzed by a third man during and immediately after
each test.
- 5.2 Instrumentation
5.2.1 Flow Rate Measurements
Flow rates were determined by average velocities. Velocity
measurements were performed by using a thermo-anemometer with a low
range 100 - 500 fpm and a high range of 500 - 1200 fpm. Average
velocities were obtained by making a traverse of 9 points for square
or rectangular ducts.
5.2.2 Pressure Measurements
Static pressures were measured by a Magnehelic pressure gauge of
.01 to 1.0 in. H^O range.
•" ' •• 5.2.3 SF^ Gas Metering
In tests 3a, 3b, 4b, 5a, 7 and 8 the continuous release of
SF^ gas was metered by a ball type flow meter with a range of 1 to
310 ft /hr. A slight turn of the needle valve with the ball barely off
its seat results in burn room SF, concentrations varying from 3 to 10 ppmo
for different tests. Subsequent test experience showed that with this
kind of burn room concentration it takes more than four hours of purge
time before the building is cleared of SF^ for the next test. In order
to speed up the purge time between tests it was decided to run the rest
of the tests at a lower burn room concentration. Since the dispersion of
SF^ is exponential, to cut down the dispersion time by half, one needs to
drop the burn room concentration by an order of 1 ppm (1000 ppb) is quite
16

acceptable to our experimental requirement since the gas analyser sensi-
tivity is readable at 1 ppb . This means that the relative concentration
can be measured to one part in one thousand.
A rough estimate showed that in order to bring the air supply from
the burn room fan to SF, concentration of 1000 ppb, a continuous releaseD
3of 100 cc/min or 2 ft /hr of SF^ is required. For tests 5c, 5g and
repeat of 5a and 3e another ball type flow meter of the appropriate
range was used. The flow meter was calibrated by the soap film dis-
placement method over the measuring range.
One additional problem associated with SF^ metering was the unsteadi-
ness of the SF^ flow for experiments 3b, 4b. Although the relative
concentration was calculated by normalizing the sample concentration by
the burn room concentration at the corresponding time, extreme unsteadi-
ness can result in lack of reproducibility. The unsteady SF^ metering
was found to be caused by the first flow meter used. This flow meter
was operated by barely lifting the ball from its seat. The situation
was remedied by using another flow meter with a lower range operating
in the neighborhood of 100 cc/min.
5.2.4 SF^ Analysis
SF^ samples were analysed by a portable gas chromatograph having
an electron capture cell fitted with a 300 mc tritium source. The response
of the instrument to SF^ is exponential and the usable range is between 1
and 100 ppb. Dilution of samples when necessary was effected by a 10 to
1 critical orifice.
17
6.0 DISCUSSION OF EXPERIMENTAL RESULTS
In tables 2 to 11 the results of SF^ analyses for 10 tests are sum-
marized. SF^ concentrations for each chosen floor at the specified time
Intervals are listed in ppb , and percentage concentration normalized by
the "burn room" SF concentration. Burn room gas samples were taken inD
the hall between the "burn room" and the corridor. Comparative evaluations
of smoke concentration for the different test simulations are plotted on
Figures 4 to 12:
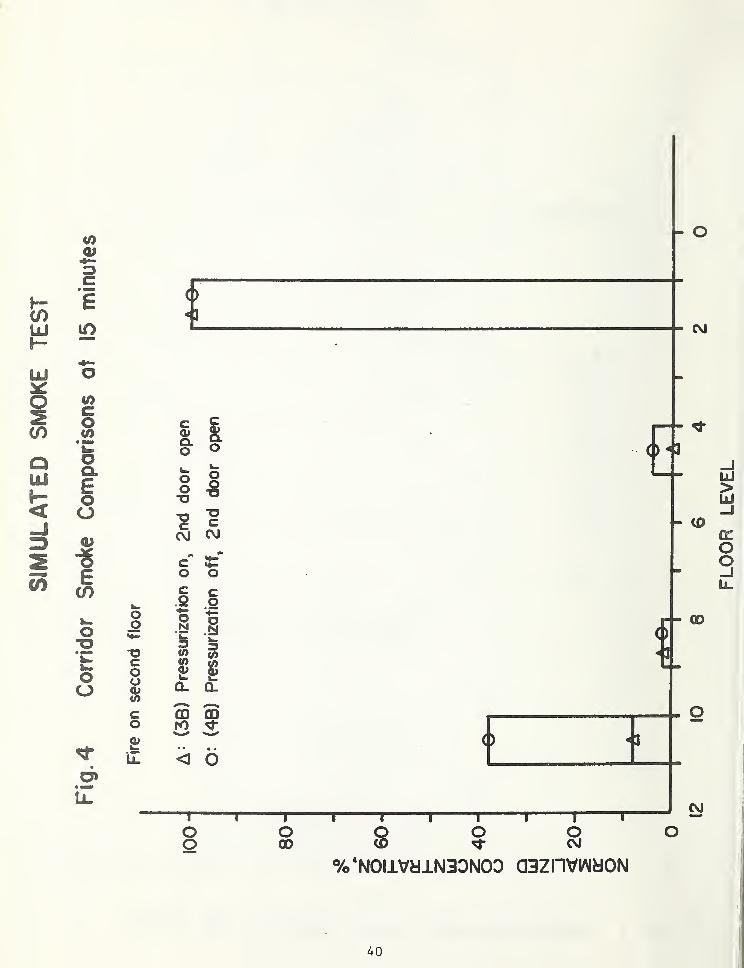
1. Fig. 4 compares the corridor smoke concentrations at the 15 minutes
for tests 3b and Ab . The result is that stairwell pressurization in this
case not only kept smoke concentration in the stairwell below the 0.001 or
undetectable level, it also reduced the smoke level in the building
corridor significantly.
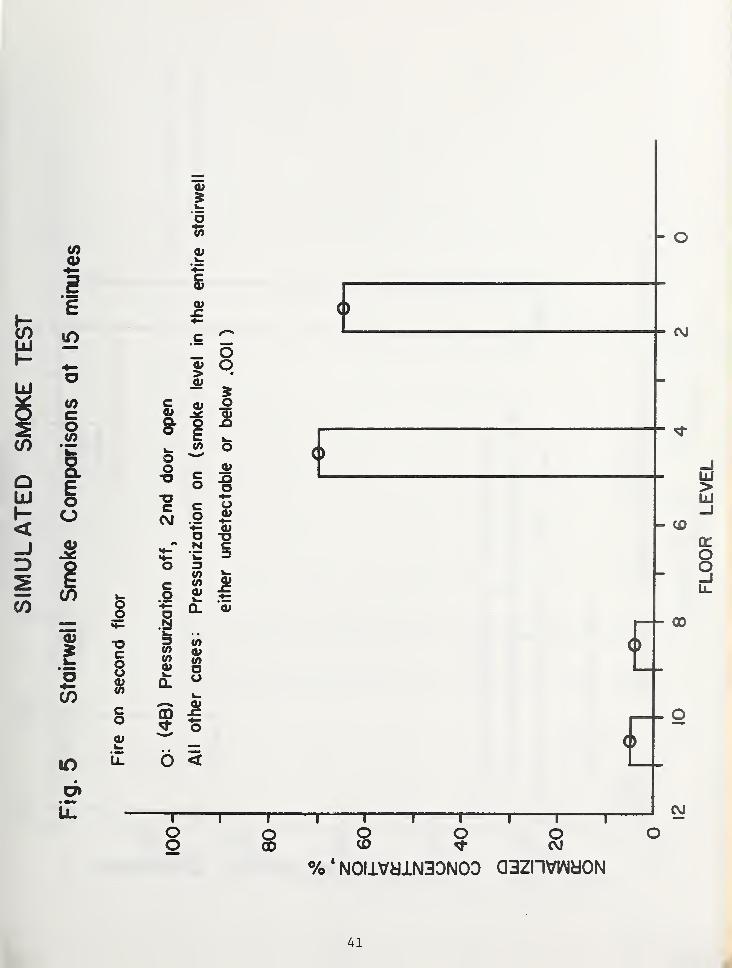
2. Fig. 5 shows smoke concentrations in the stairwell at 15 minutes.
Note that in all tests with the pressurization on, the smoke level in the
entire stairwell was either below 0.1% or undetectable whereas in case
4b with pressurization off the measured concentration at 15 minutes
ranged from 4 to 70%.
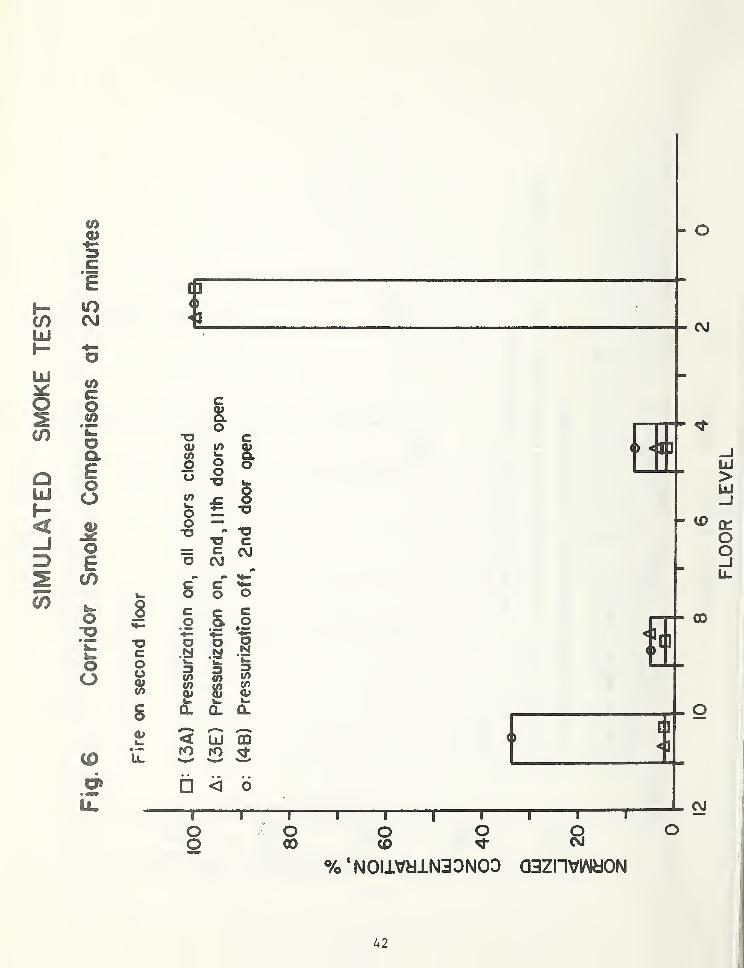
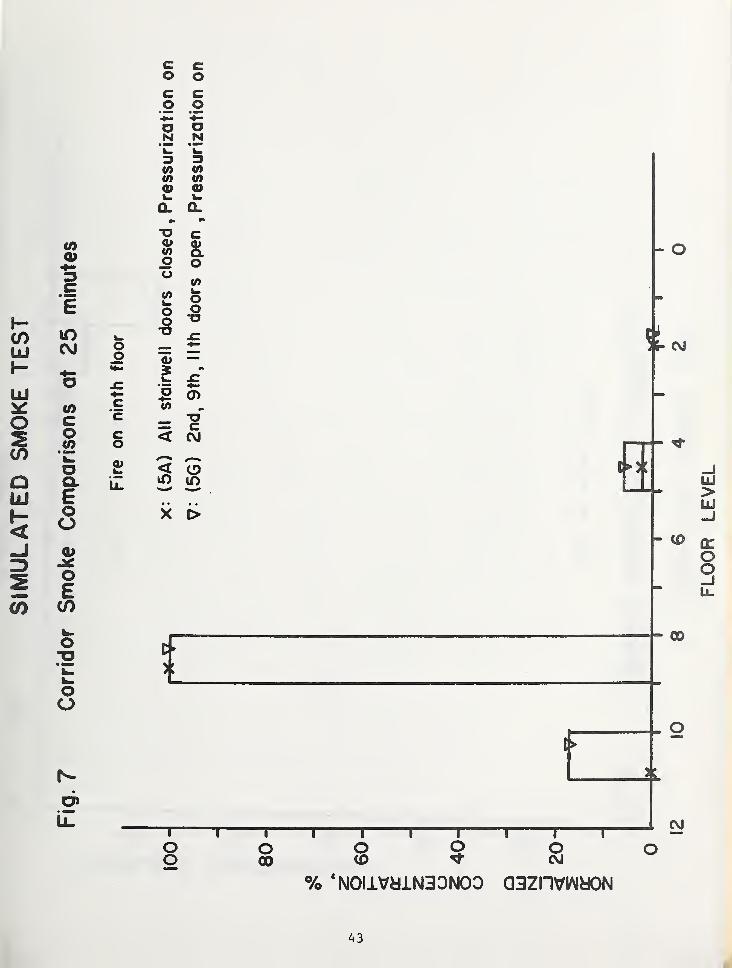
3. Figs. 6 and 7 compare smoke concentration in the corridors for
simulated fire on the second and ninth floor respectively for different
stairwell door openings.
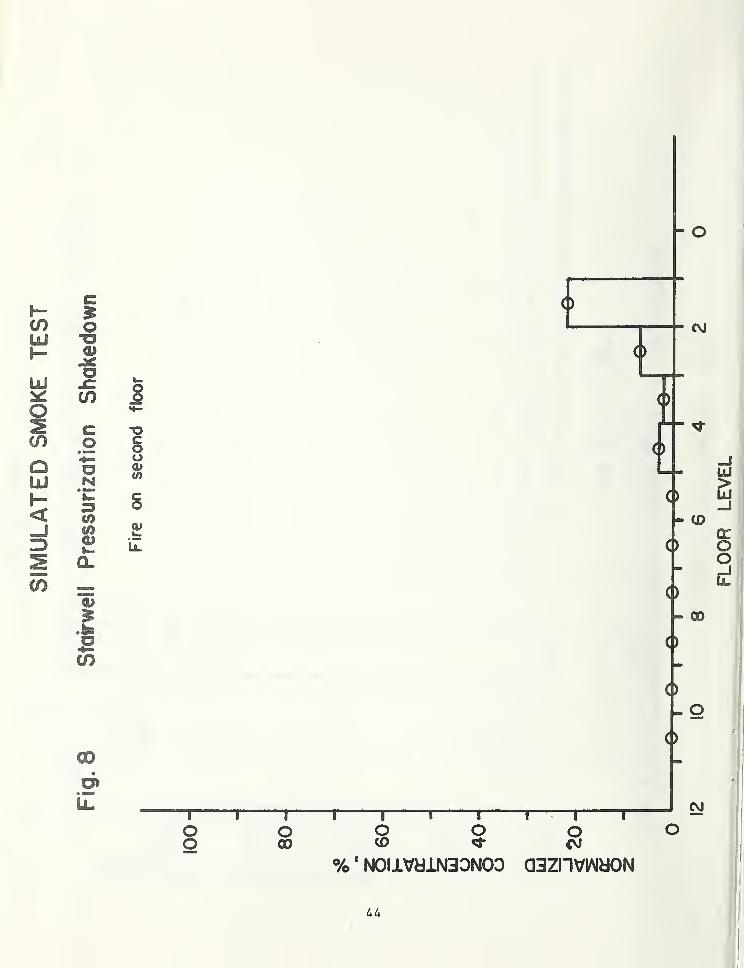
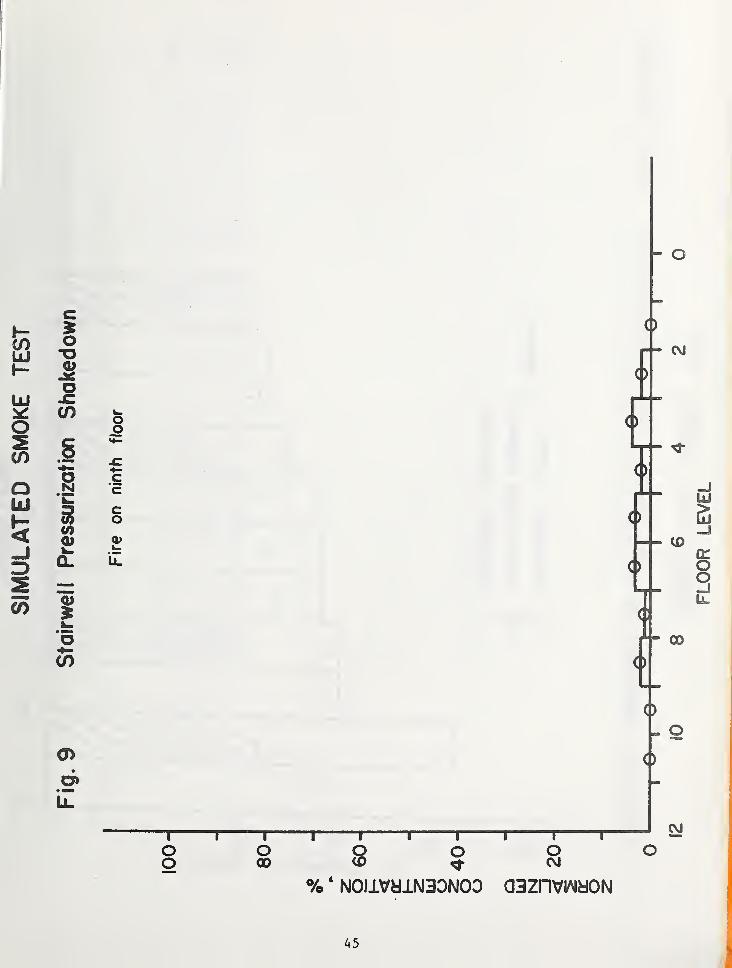
4. In Figs. 8 and 9 the stairwell pressurization "shake down" test
results are presented for the case of simulated fire on the second floor
and the ninth floor respectively. In each case the "shake down" procedure
was to open one stairwell door at a time at two minute intervals and then
measure the SF, concentration in the stairwell at that level. Every door6
18
after being opened remained open for the rest of the test so that a
cumulative effect of door openings was obtained. The routine started
five minutes after initiating the SF, flow in the burn room, with sample
collections proceeding from the 11th floor down to the second floor.
Using a 1% concentration as a critical cut off limit, it appears that for
a simulated fire on the second floor, the stairwell pressurization failed
after opening the 5th floor stairwell door, and for a simulated fire on
the ninth floor, failure occurred after the opening of the 9th floor
stairwell door.
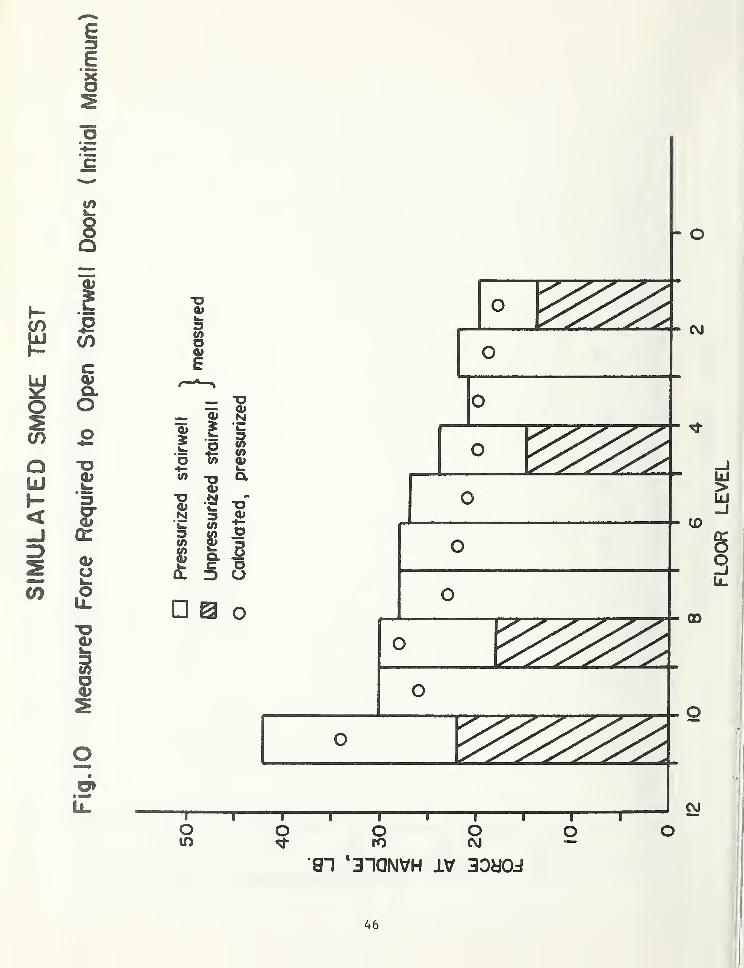
5. The force required to open stairwell doors during the pressurized
mode was also measured, by means of a graduated spring scale, since the
additional force due to pressurization can be a critical design con-
sideration. The measured force and the calculated force from pressure
measurements are plotted in Figure 10. The correlation between measured
force and calculated force appears to be good except for the 11th floor
stairwell door. The total force required to open the doors under
pressurization conditions was below 30 pounds except the 11th floor door.
For this door the measured force required is 42 pounds and the calculated
force is 34 pounds.
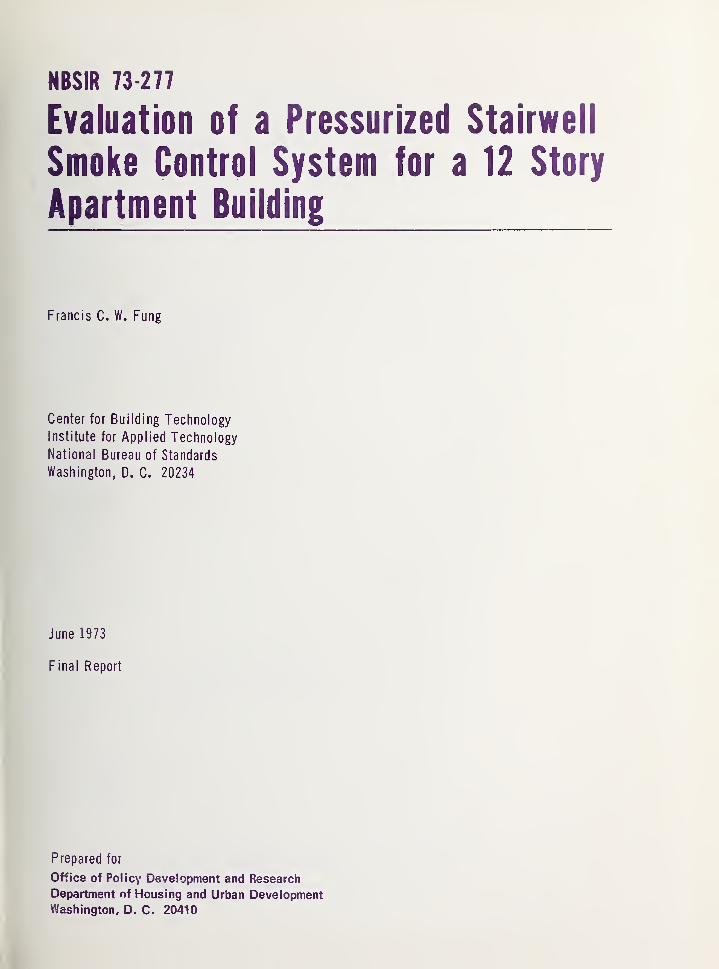
7.0 STAIRWELL PRESSURE FOR EXTENDED WEATHER CONDITIONS
The experimental results obtained by the smoke simulation program
confirmed the feasibility of stairwell smoke control by pressurization.
The experiments were performed only under moderate 60°F outside weather
conditions and the effect of more severe weather conditions should also
be investigated. Since direct control of ambient conditions was not
possible, an alternate indirect way to extend the investigation is through
19
computation and prediction. The computer program chosen for this purpose
was a modified numerical program originally developed by Sander and Tamura
[16]. This numerical program based on Ref. [14] calculates pressure
differences in a high rise building by taking into account the buoyancy
force, stack effect due to temperature difference, net flow due to the
air handling system, and leakage flows by empirically estimated leakage
characteristics through doors, walls, and floors.
With the leakage characteristics estimated according to Ref. [lA] , and
treating the stairwell shaft as a building with large floor leakage and
the building as a vertical shaft, as suggested by T. Kusuda of National
Bureau of Standards, a series of computer calculations were performed to
predict the pressures in the subject high rise apartment building.
" The variables investigated included simulated smoke production on
second and ninth floor levels, outside weather conditions with temperatures
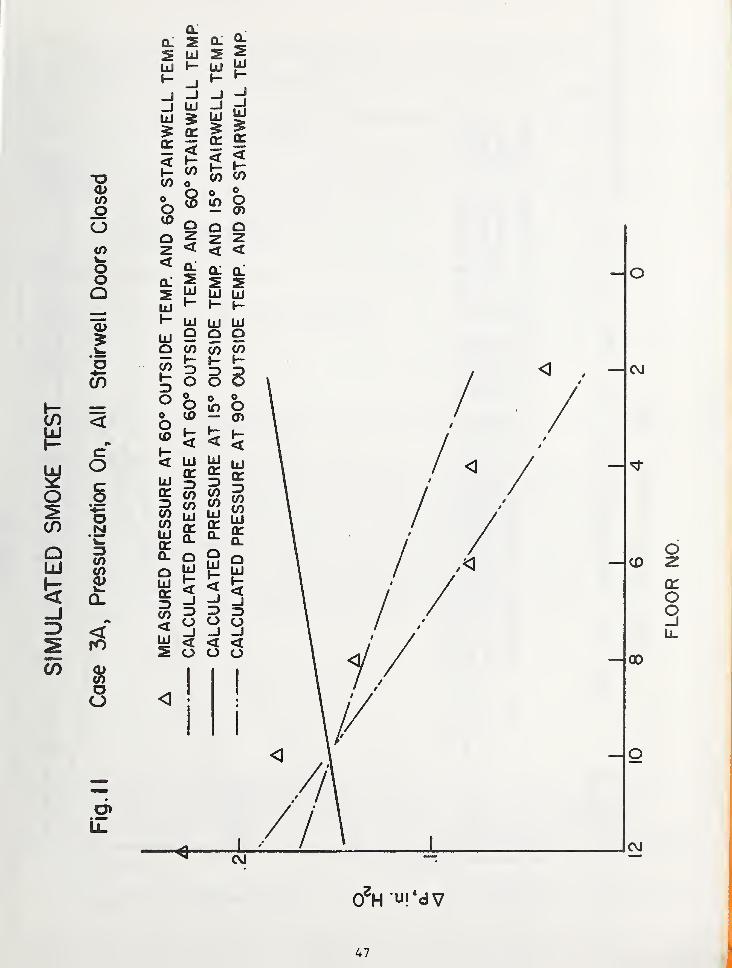
15°F, 60°F, and 90°F, and different stairwell door openings. Calculated
pressure differences across stairwell doors are presented in Figs. 11
and 12 along with the measured pressure differences. Fig. 11 presents
calculations for the case where pressurization is on and all stairwell
doors closed. For all cases calculated the building temperature is
assumed to be 72°F. The pressure difference across the stairwell doors
in each case is caused by the combined effects of the pressurization
system and the temperature difference between the building and the
stairwell. Agreement of calculation for the case of 60°F outside temper-
ature with the corresponding case 3a experimental measurement is fair.
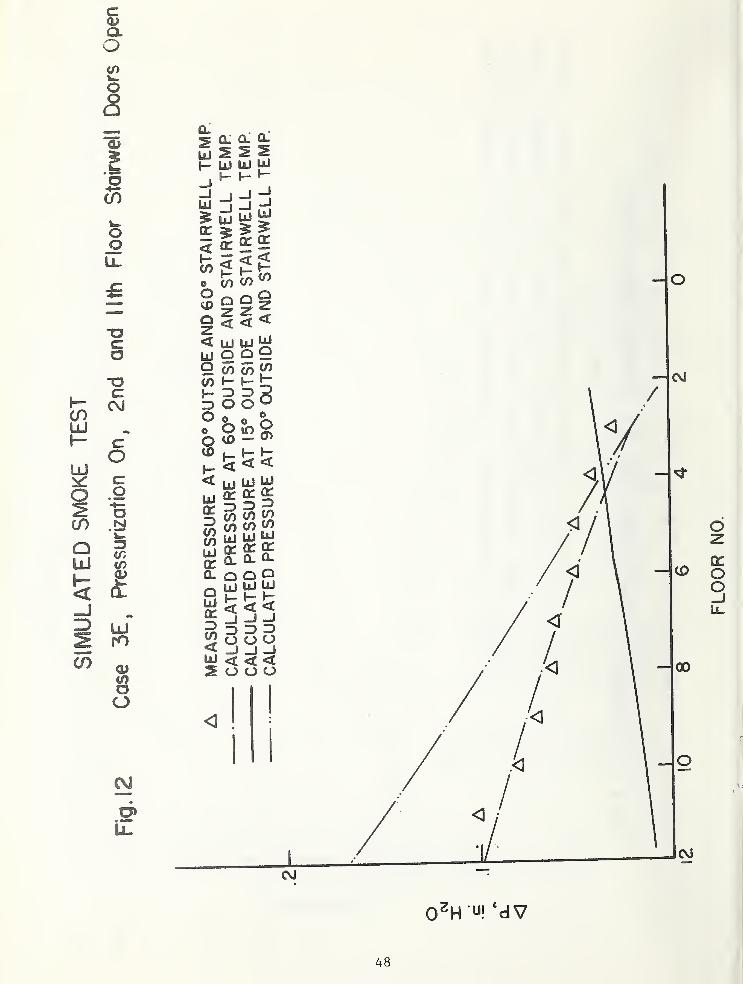
Fig. 12 presents calculations for the case where pressurization is
on, and the second and 11th floor stairwell doors are open. Agreement of
20

the calculations for a 60°F outside temperature with the corresponding
case 3e experimental measurement is excellent. In both Figs. 11 and 12
one can see that according to the computer calculations the stairwell
pressure differences remained positive for the two building configurations
studied for both extreme temperatures of IS^F and 90°F outside air. Posi-
tive stairwell pressure difference is the necessary condition for preventing
smoke from entering the stairwell. Thus results of the computer calcu-
lation for extended temperature ranges indicate that for the more severe
condition of a second floor fire, the stairwell has favorable pressure
conditions to remain smoke free up to opening of the second and 11th
floor stairwell doors, and at both 15°F and 90°F outside temperatures,
assuming the stairwell reaches the ambient air temperature.
In relation to the computer calculations it may be relevant to point
out that in the subject high rise apartment the pressurization unit
circulates 11,000 CFM of outside air through the stairwell. Experimen-
tally it was found that the stairwell air reached the temperature of
the outside air in less than a minute. Computer prediction results may
lead to different conclusions if the pressurization unit circulates
conditioned air, thus requiring different stairwell temperature input
to the computer program. However, in the subject high rise apartment
the proper temperature input under pressurization was that of the ambient
temperature level.
8.0 CONCLUSIONS AND RECOMMENDATIONS
Major conclusions as a result of the present study are:
1. Stairwell pressurization can be very effective in
preventing smoke from entering stairwells even with
several doors open. The effectiveness of the 11,000
21

cfm blower in this case was clearly illustrated by
this study
.
2. The simulation of smoke movement due to a fire in a
high rise building by using SF, as tracer gas mixedb
with a warm air supply is feasible. The model can be
related to a real fire in terms of volume outflow,
heat energy output and average pressure difference
across the burn-room doorway.
3. Present smoke control design guidelines are in need
of optimization by using quantitative experiments
and computer calculations.
Relevent future recommendations as a result of the present study are
1. Smoke simulation experiments by using SF, as a tracerb
gas mixed with heated air should be relatable to a wide
- range of early burn-room fires through basic physical
laws in terms of volume outflow, heat energy output
and average pressure across the burn-room door. Basic
formulas for this comparison are contained in
section 2 of this report.
2. Proper design of prototype smoke control systems
should consist of (a) design estimate according to
physical laws similar to those contained in section
2 of this report and (b) realistic smoke simulation
experiments with quantitative measurements such
as the SF, technique used in this program
(c) computer calculations for correlation with
experiment and to cover extended weather conditions.22

3. The high noise level of large, high velocity
pressurization units can be an objectionable
feature even though it is designed for safety.
A possible solution for this is both optimum
design and breakdown of large pressurization
units into smaller units distributed vertically
along the stairwell.
4. As a result of the added force required to open stairwell
doors due to pressurization, it is recommended that a design
specification be required to limit the maximum force needed
to open pressurized stairwell doors.
9 . 0 ACKNOWLEDGEMENTS
The computer program used for predicting the performance of the
stairwell was developed with help from Dr. Tamami Kusuda of the National
Bureau of Standards. The field data collection was supported by a con-
tract from the Department of Housing and Urban Development.
Messrs. James Steel, Richard Zile and Tom Lee of Building Fires
and Safety Section, National Bureau of Standards, were most helpful in
the data collection.
23
REFERENCES
1. Hutcheon, N.B., Shorter, G. W. , "Smoke Problems in High-Rlse
Buildings," ASHRAE Journal, 9, 1968.
2. Galbreath, M. , "Fire in High Buildings," National Research Council
of Canada, Fire Study No. 21, A, 1968.
3. McGuire, J. H., "Control of Smoke in Building Fires," Fire
Technology, Vol. 3 , No . 3 , 8, 1967.
4. McGuire, J. H. , "Control of Smoke in Building Fires," Fire
Technology, Vol. 3, No. 4, 11, 1967.
5. Tamura, G. T., Wilson, A. G., "Building Pressures Caused by
Chimney Action and Mechanical Ventilation," ASHRAE Transactions,
1967, Vol. 73, Part II.
6. Tamura, G. T., Wilson, A. G., "Pressure Differences Caused by
Chimney Effect in Three High Buildings," ASHRAE Transactions,
1967, Vol. 73, Part II.
7. Barrelt, R. E., Locklin, D. W.,"Computer Analysis of Stack Effect
in High-Rise Buildings," presented at ASHRAE 1968 Annual Meeting
at Lake Placid, New York, 6, 1968.
8. Butcher, E. G., Fardell, P. J. and Clarke, J., "Pressurization
as a Means of Controlling the Movement of Smoke and Toxic Gases
on Escape Routes," Joint Fire Research Organization Symposium No. 4,
Movement of Smoke on Escape Route in Buildings, Paper 5, Watford, 1969.
9. Butcher, E. G., Hall, M., "Smoke Tests in New Law Courts Building,"
Joint Fire Research Organization Research Note No. 889, 1971.
10. "Mechanically Ventilated Smoke Proof Enclosure, "Los Angeles Fire
Department, 1970, City of Los Angeles BFP and PA Requirement No. 56.
24
11. Hobson, P. J., Stewart, L. J., "Pressurizatlon of Escape Routes in
Buildings," Heating and Ventilating Research Association, Bracknell
Berkshire, England.
12. Galbreath, M., McGuire, J. H., Tamura , G. T., "Exploratory Paper
on Control of Sraoke Movement in High-Rise Buildings," National
Research Council of Canada, Ottawa, 6, 1970.
13. Thomas, P. H., Heselden, A. J. M., "Fully-Developed Fires in Single
Compartments," Fire Research Note No. 923, August 1972, Fire
Research Station, Joint Fire Research Organization.
14. Fung, Francis C. W., Suchomel, M. R., Oglesby, P. L., "Corridor
Fires Energy and Radiation Models, NBS Tech. Note, Washington, D.C.,
1973.
15. Lee, B. T., Private Communication, National Bureau of Standards,
Washington, D.C. 1973.
16. Sander, D. M., Tamura, G. T., "A Fortran IV Program to Simulate
Air Movement in Multi-Storey Buildings," National Research Council
of Canada, Ottawa DBR Computer Program No. 35, March 1973.
25
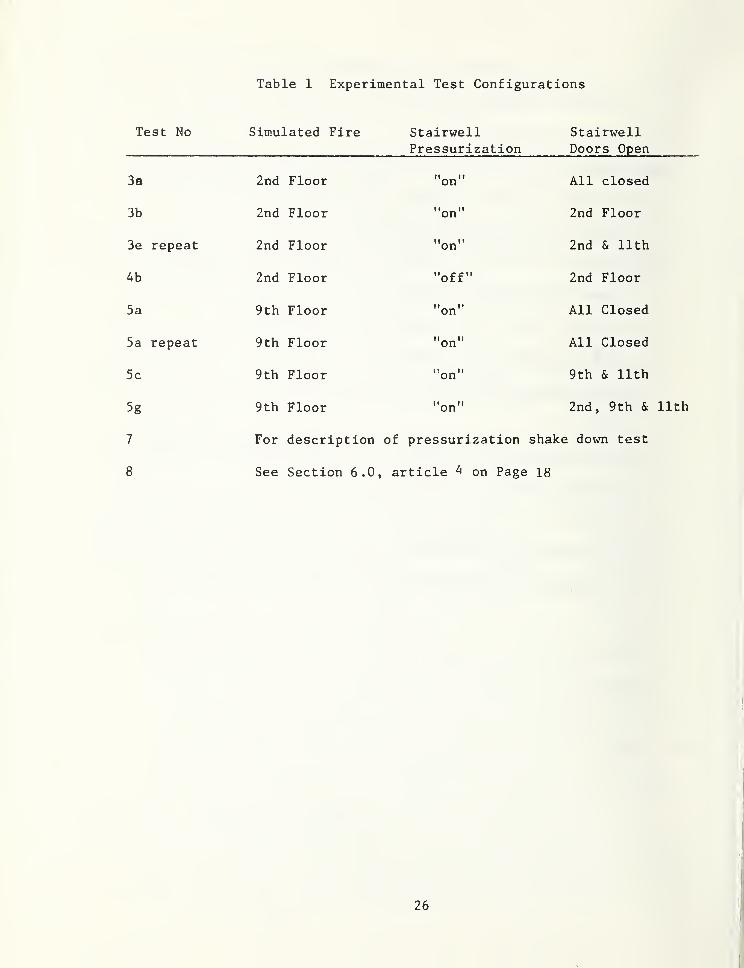
Table 1 Experimental Test Configurations
Test No Simulated Fire Stairwell StairwellPressurization Doors Open
3a 2nd Floor on All closed
3b 2nd Floor on 2nd Floor
3e repeat 2nd Floor "on" 2nd & 11th
4b 2nd Floor "off" 2nd Floor
5a 9th Floor IT f*
on All Closed
5a repeat 9th Floor on All Closed
5c 9th Floor on 9th & 11th
5g 9th Floor on 2nd, 9th &
7]
For description of pressurization shake down test
8 See Section 6.0, article ^ on Page 18
26
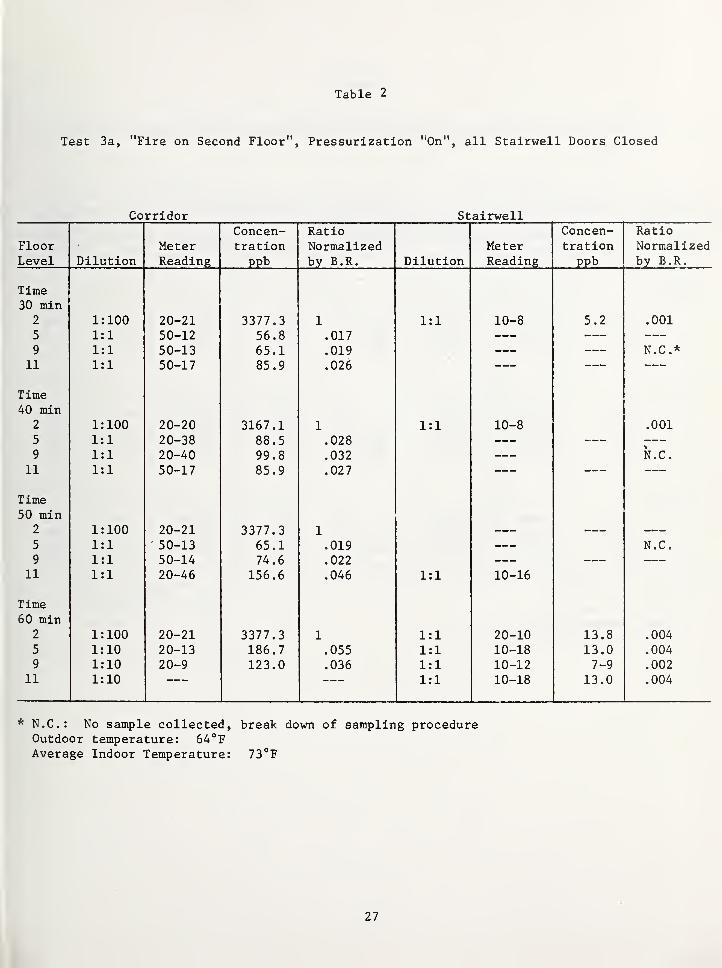
Table 2
Test 3a, "Fire on Second Floor", Pressurization "On", all Stairwell Doors Closed
Corridor StairwellConcen- Ratio Concen- Ratio
Floor Meter tration Normalized Meter tration NormalizedLevel Dilution Reading ppb by B.R. Dilution Reading ppb by B.R.
Time30 min
2 1:100 20-21 3377.3 1 1:1 10-8 5.2 .001
5 1:1 50-12 56.8 .017 —
—
9 1:1 50-13 65.1 .019 ——
—
N.C.*11 1:1 50-17 85 .9 .026
Time40 min
2 1:100 20-20 3167.1 1 1:1 10-8 .001
5 1:1 20-38 88.5 .0289 1:1 20-40 99.8 .032 N.C.
11 1:1 50-17 85.9 .027
Time50 min
2 1:100 20-21 3377.3 1
5 1:1 50-13 65.1 .019 N.C.9 1:1 50-14 74.6 .022
11 1:1 20-46 156.6 .046 1:1 10-16
Time60 min
2 1:100 20-21 3377.3 1 1:1 20-10 13.8 .004
5 1:10 20-13 186.7 .055 1:1 10-18 13.0 .004
9 1:10 20-9 123.0 .036 1:1 10-12 7-9 .00211 1:10 1:1 10-18 13.0 .004
* N.C: No sample collected, break down of sampling procedureOutdoor temperature: 64°FAverage Indoor Temperature: 73''F
27
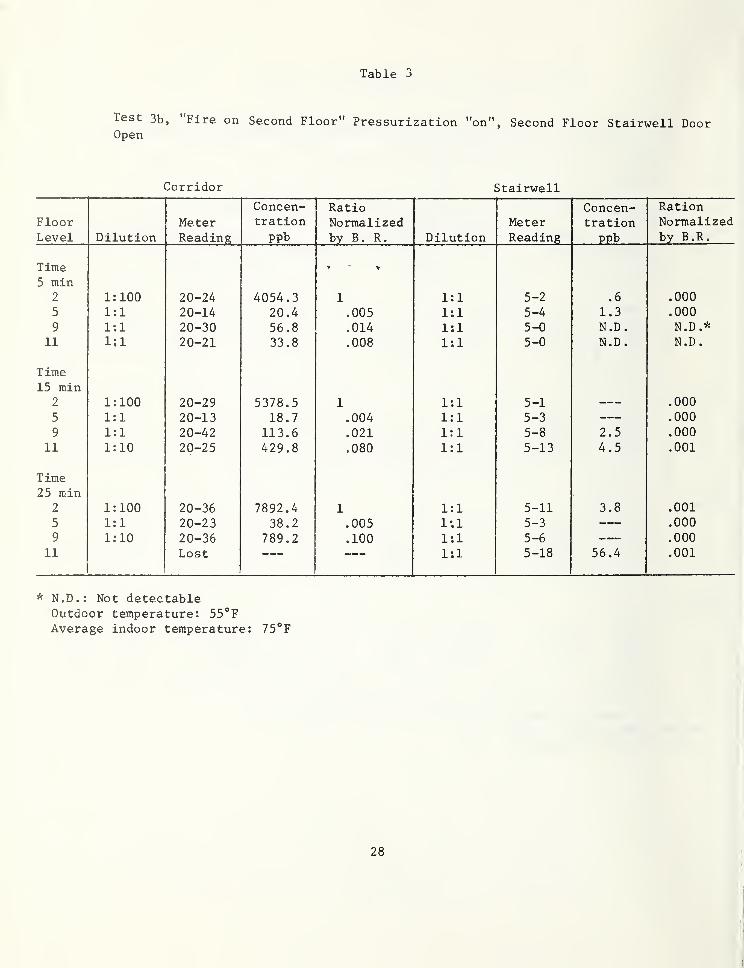
Table 3
"Fire on Second Floor" Pressurization "on", Second Floor Stairwell Door
Corridor Stairwell
Concen- Ratio Concen- RationFloor Meter tration Normalized Meter tration NormalizedLevel Dilution Reading ppb by B. R. Dilution Reading ppb by B.R.
i ime5 min
2 1:100 20-24 4054.3 1 1:1 5-2 .6 .000
5 1:1 20-14 20.4 .005 1:1 5-4 1.3 .000
9 1:1 20-30 56.8 .014 1:1 5-0 N.D. N.D.*11 1:1 20-21 33.8 .008 1:1 5-0 N.D . N.D.
Time15 min
2 1:100 20-29 5378.5 1 1:1 5-1 .000
5 1:1 20-13 18.7 .004 1:1 5-3 .000
9 1:1 20-42 113.6 .021 1:1 5-8 2.5 .000
11 1:10 20-25 429.8 .080 1:1 5-13 4.5 .001
Time25 min
2 1:100 20-36 7892.4 1 1:1 5-11 3.8 .001
5 1:1 20-23 38.2 .005 l-.l 5-3 .000
9 1:10 20-36 789.2 .100 1:1 5-6 .000
11 Lost 1:1 5-18 56.4 .001
* N.D.: Not detectableOutdoor temperature: 55°FAverage indoor temperature: 75°F
Test 3b,
Open
r
28
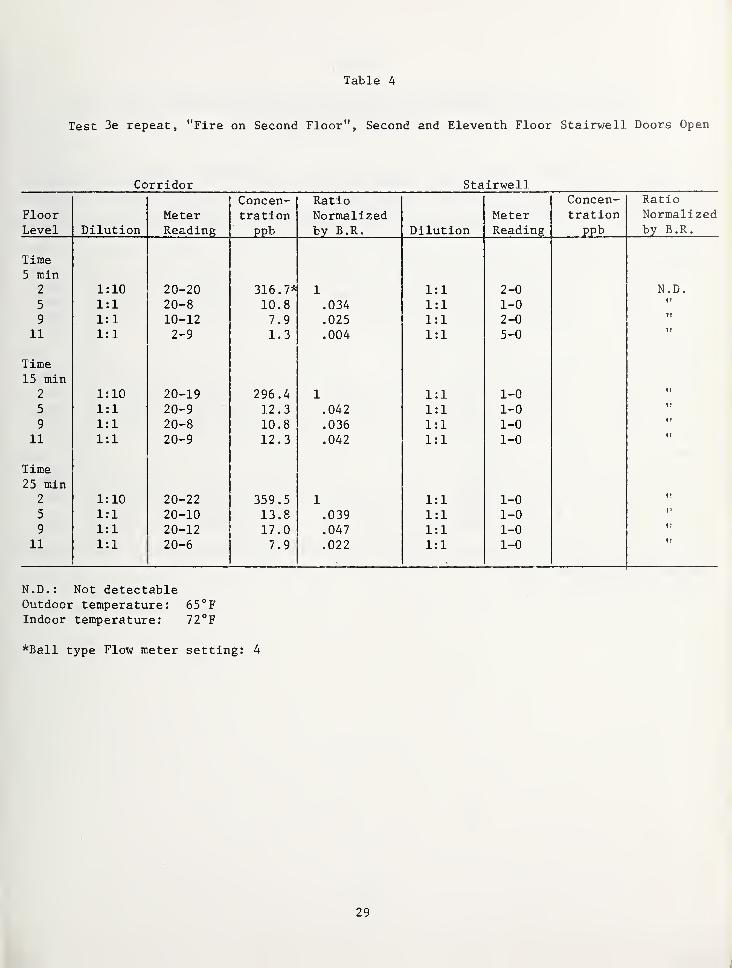
Table 4
Test 3e repeat, "Fire on Second Floor", Second and Eleventh Floor Stairwell Doors Open
Corridor StairwellConcen- Ratio Concen- Ratio
Floor Meter tration Normalized Meter tration NormalizedLevel Dilution Reading ppb by B.R. Dilution Reading ppb by B.R.
Time5 min
2 1:10 20-20 316.7* 1 1:1 2-0 N.D.
5 1:1 20-8 10.8 .034 1:1 1-0
9 1:1 10-12 7.9 .025 1:1 2-0 f T
11 1:1 2-9 1.3 .004 1:1 5-0 1 f
Time15 min
2 1:10 20-19 296.4 1 1:1 1-0 II
5 1:1 20-9 12.3 .042 1:1 1-0 1!
9 1:1 20-8 10.8 .036 1:1 1-0 ei
11 1:1 20-9 12.3 .042 1:1 1-0 M
Time25 min
2 1:10 20-22 359.5 1 1:1 1-0 I!
5 1:1 20-10 13.8 .039 1:1 1-0 1!
9 1:1 20-12 17.0 .047 1:1 1-0 i:
11 1:1 20-6 7.9 .022 1:1 1-0 II
N.D.: Not detectableOutdoor temperature: 65°FIndoor temperature: 72°F
*Ball type Flow meter setting: 4
29
1
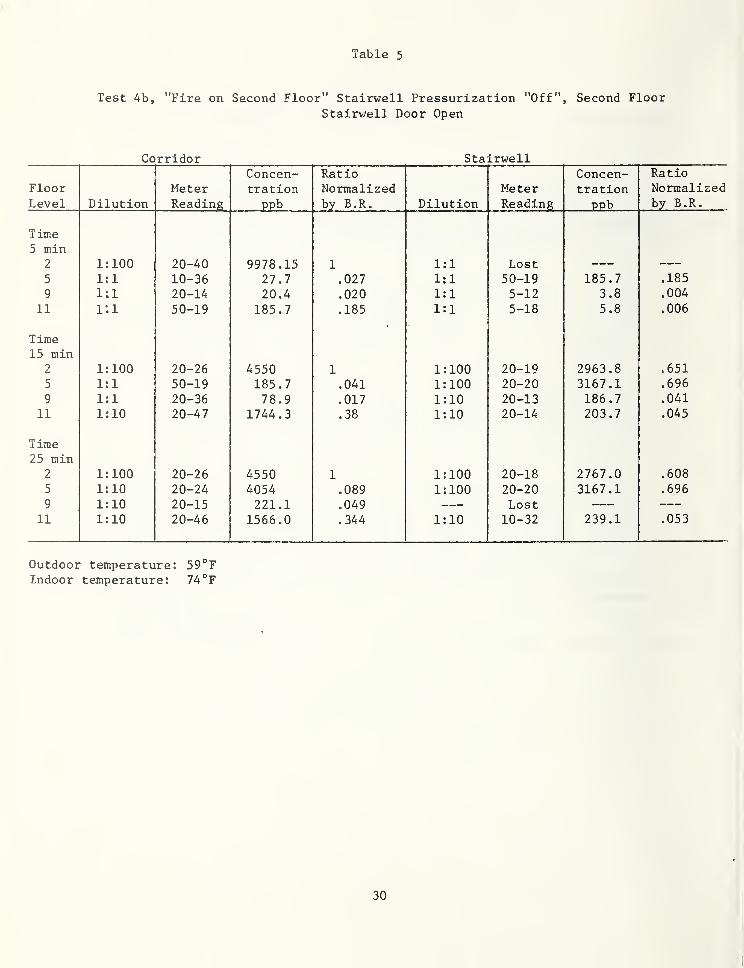
Table 5
Test 4b, "Fire on Second Floor" Stairwell Pressurization "Off", Second Floor
Stairwell Door Open
Corridor StairwellConcen- Ratio Concen- Ratio
Floor Meter tration Normalized Meter tration NormalizedLevel Dilution Reading PPb by B.R. Dilution Reading PPb by B.R.
Time5 min
2 1 • 1 on QQ78 1
S
1X 1 • 1X . X
5 1:1 10-36 27.7 .027 1:1 50-19 185.7 .185
9 1;1 20-lA 20.4 .020 1:1 5-12 3.8 .004
11 i:i 50-19 185.7 .185 1:1 5-18 5.8 .006
Time15 min
2 1:100 20-26 4550 1 1:100 20-19 2963.8 .651
5 1:1 50-19 185.7 .041 1:100 20-20 3167.1 .696
9 1:1 20-36 78.9 .017 1:10 20-13 186.7 .041
11 1:10 20-47 1744.3 .38 1:10 20-14 203.7 .045
Time25 min
2 1:100 20-26 4550 1 1:100 20-18 2767.0 .608
5 1:10 20-24 4054 .089 1:100 20-20 3167.1 .696
9 1:10 20-15 221.1 .049 Lost11 1:10 20-46 1566.0 .344 1:10 10-32 239.1 .053
Outdoor temperature: 59°FIndoor temperature: 74 °F
30
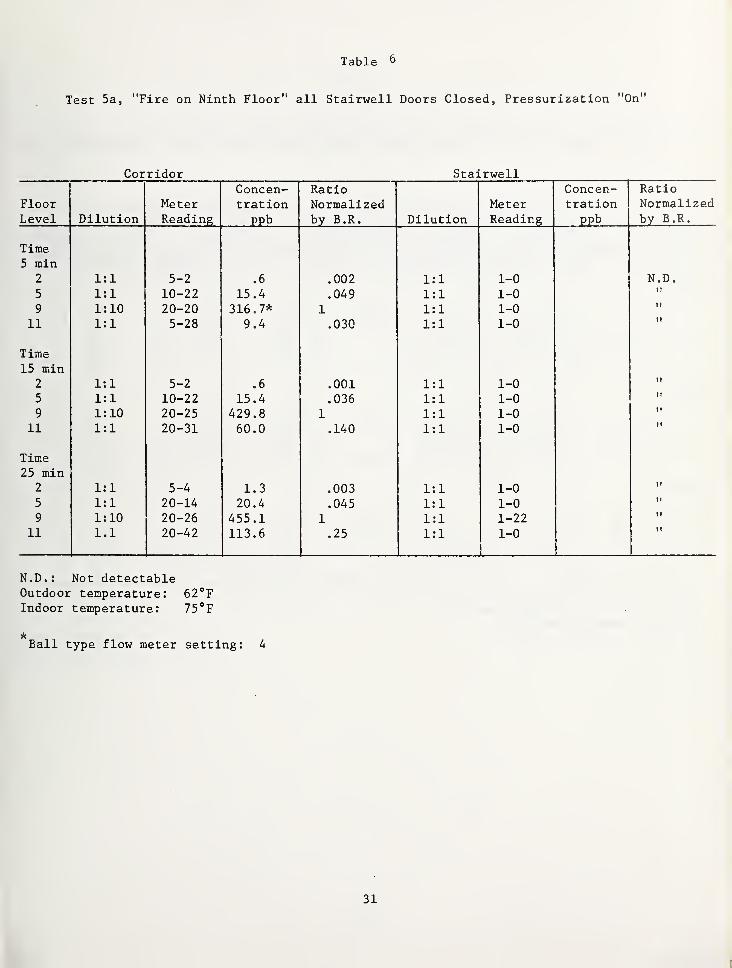
Table 6
Test 5a, "Fire on Ninth Floor" all Stairwell Doors Closed, Pressurization "On"
Corridor StairwellConcen- Ratio Concen- Ratio
Floor Meter tration Normalized Meter tration NormalizedLevel Dilution Reading ppb by B.R. Dilution Reading ppb by B.R.
Time5 min
2 1:1 5-2 .6 .002 1:1 1-0 N.D.
5 1:1 10-22 15.4 .049 1:1 1-0 II
9 1:10 20-20 316.7* 1 1:1 1-0 II
11 1:1 5-28 9.4 .030 1:1 1-0 II
Time15 min
2 1:1 5-2 .6 .001 1:1 1-0 II
5 1:1 10-22 15.4 .036 1:1 1-0 It
9 1:10 20-25 429.8 1 1:1 1-0 11
11 1:1 20-31 60.0 .140 1:1 1-0 II
Time25 min
2 1:1 5-4 1.3 .003 1:1 1-0 II
5 1:1 20-14 20.4 .045 1:1 1-0 II
9 1:10 20-26 455.1 1 1:1 1-22 II
11 1.1 20-42 113.6 .25 1:1 1-0 It
N.D.: Not detectableOutdoor temperature: 62°FIndoor temperature: 75°F
Ball type flow meter setting: 4
31
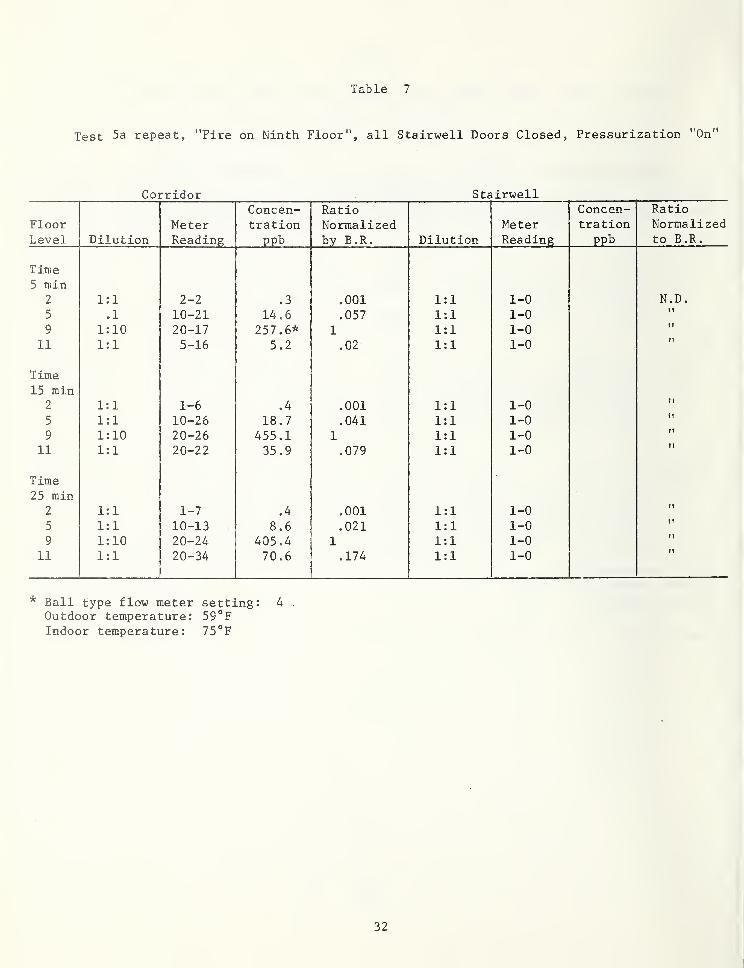
.^;^v.ry^., -..V^'';.'^ Table 7
Test 5a repeat, "Fire on Ninth Floor", all Stairwell Doors Closed, Pressurization "On"
Corridor StairwellConcen- Ratio Concen- Ratio
Floor Me ter tration Normalized Meter tration NormalizedLevel Dilution Reading ft"-' bv B.R. Dilution Reading ppb to B.R.
Time5 min
2 1:1 2-2 .3 .001 1:1 1-0 N.D.
5 .1 10-21 14 .6 .057 1:1 1-0 II
9 1:10 20-17 257 .6* 1 1:1 1-0 II
11 1:1 5-16 5.2 .02 1:1 1-0 II
Time15 min
2 1:1 1-6 .4 .001 1:1 1-0 II
5 1:1 10-26 18.7 .041 1:1 1-0 II
9 1:10 20-26 455.1 1 1:1 1-0 II
11 1:1 20-22 35.9 .079 1:1 1-0 II
Time25 min
2 1:1 1-7 .4 .001 1:1 1-0 II
5 1:1 10-13 8.6 .021 1:1 1-0 1!
9 1:10 20-24 405.4 1 1:1 1-0 II
11 1:1 20-34 70.6 .174 1:1 1-0 II
* Ball type flow meter setting: 4
Outdoor temperature: 59°FIndoor temperature: 75 °F
32
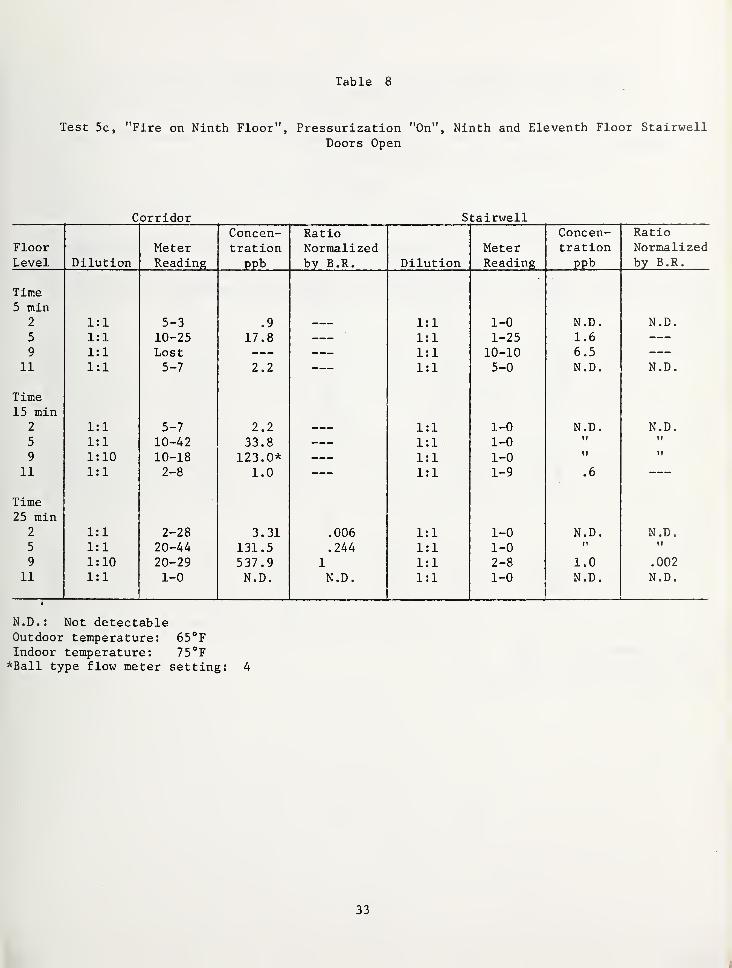
Table 8
Test 5c, "Fire on Ninth Floor", Pressurization "On", Ninth and Eleventh Floor StairwellDoors Open
Corridor StairwellConcen- Ratio Concen- Ratio
Floor Meter tration Normalized Meter tration NormalizedDt 1 nf- -I nn ppb uy D . x\.
.
US. Xu L XfJii by B.R.
Time5 min
2 1:1 5-3 .9 1:1 1-0 N.D. N.D.
5 1:1 10-25 17.8 1:1 1-25 1.6
9 1:1 Lost 1:1 10-10 6.511 1:1 5-7 2.2 ::: 1:1 5-0 N.D. N.D.
Time15 min
2 1:1 5-7 2.2 1:1 1-0 N.D. N.D.
5 1:1 10-42 33.8 1:1 1-0 ti )i
9 1:10 10-18 123.0* 1:1 1-0 II II
11 1:1 2-8 1.0 1:1 1-9 .6
Time25 min
2 1:1 2-28 3.31 .006 1:1 1-0 N.D. N.D.5 1:1 20-44 131.5 .244 1:1 1-0 M II
9 1:10 20-29 537.9 1 1:1 2-8 1.0 .002
11 1:1 1-0 N.D. N.D. 1:1 1-0 N.D. N.D.
T
N.D.: Not detectableOutdoor temperature: 65°FIndoor temperature: 75°F*Ball type flow meter setting: 4
33
I
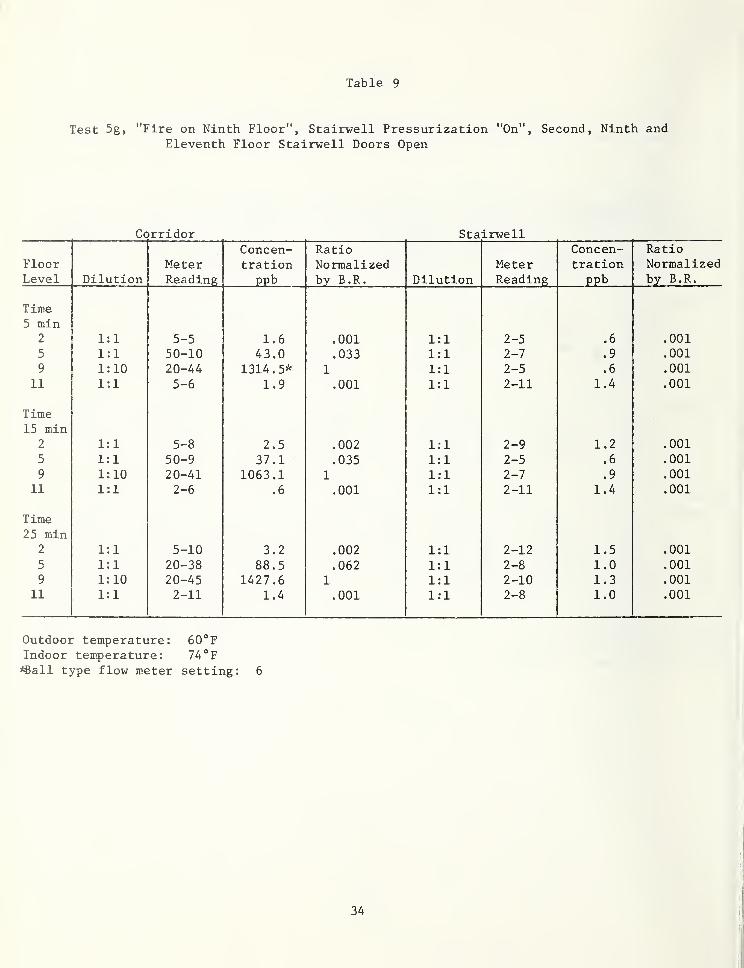
Table 9
Test 5g, "Fire on Ninth Floor", Stairvell Pressurization "On", Second, Ninth andEleventh Floor Stairwell Doors Open
Corridor StairwellConcen- Ratio Concen- Ratio
Floor Me ter IN 1^ I. Illd u_ _L ^cu Mete r t" "ration NormalizedLevel Dilution Reading Ppb by E.R. Dilution Reading ppb by B.R.
Time5 min
2 1:1 5-5 1.6 .001 1:1 2-5 .6 .001
5 1:1 50-10 43.0 .033 1:1 2-7 .9 .001
9 1:10 20-44 1314.5* 1 1:1 2-5 .6 .001
11 1:1 5-6 1.9 .001 1:1 2-11 1.4 .001
Time15 min
2 1:1 5-8 2,5 .002 1:1 2-9 1.2 .001
5 1:1 50-9 37.1 .035 1:1 2-5 .6 .001
9 1:10 20-41 1063.1 1 1:1 2-7 .9 .001
11 1:1 2-6 .6 .001 1:1 2-11 1.4 .001
Time25 min
2 1:1 5-10 3.2 .002 1:1 2-12 1.5 .001
5 1:1 20-38 88.5 .062 1:1 2-8 1.0 .001
9 1:10 20-45 1427.6 1 1:1 2-10 1.3 .001
11 1:1 2-11 1.4 .001 1:1 2-8 1.0 .001
Outdoor temperature: 60°FIndoor temperature: 74°F*Sall type flow meter setting: 6
34
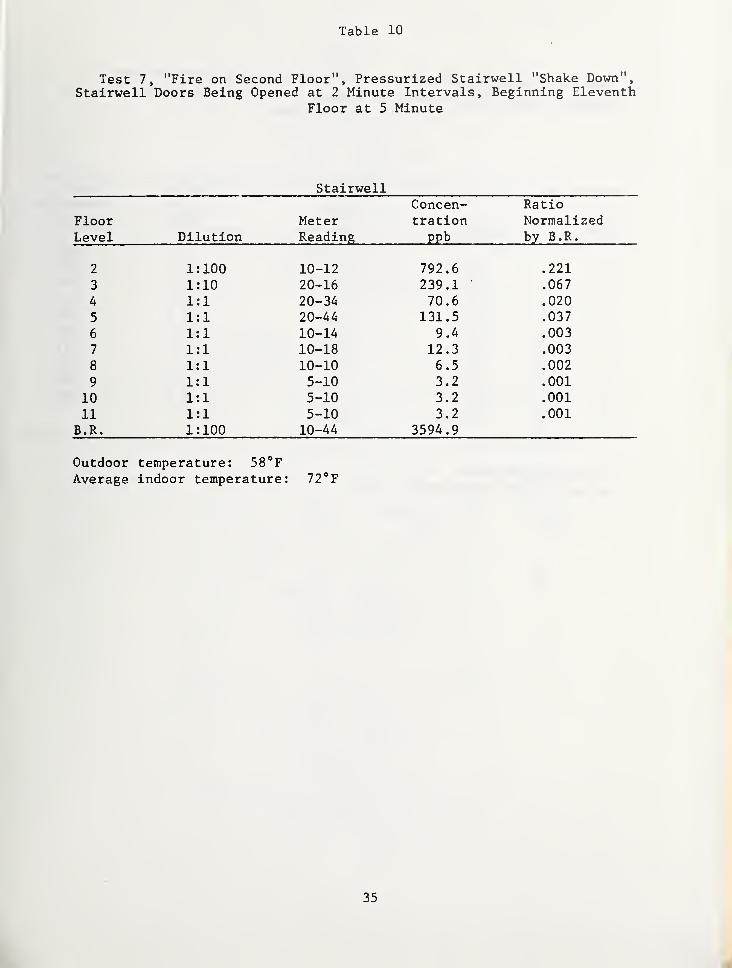
Table 10
Test 7, "Fire on Second Floor", Pressurized Stairwell "Shake Down",Stairwell Doors Being Opened at 2 Minute Intervals, Beginning Eleventh
Floor at 5 Minute
StairwellConcen- Ratio
Floor Meter tration NormalizedLevel Dilution Reading ppb by B.R.
2 1:100 10-12 792.6 .221
3 1:10 20-16 239.1 .067
4 1:1 20-34 70.6 .020
5 1:1 20-44 131.5 .037
6 1:1 10-14 9.4 .003
7 1:1 10-18 12.3 .003
8 1:1 10-10 6.5 .002
9 1:1 5-10 3.2 .001
10 1:1 5-10 3.2 .001
11 1:1 5-10 3.2 .001
B.R. 1:100 10-44 3594.9
Outdoor temperature: 58**F
Average indoor temperature: 72*'F
35
r
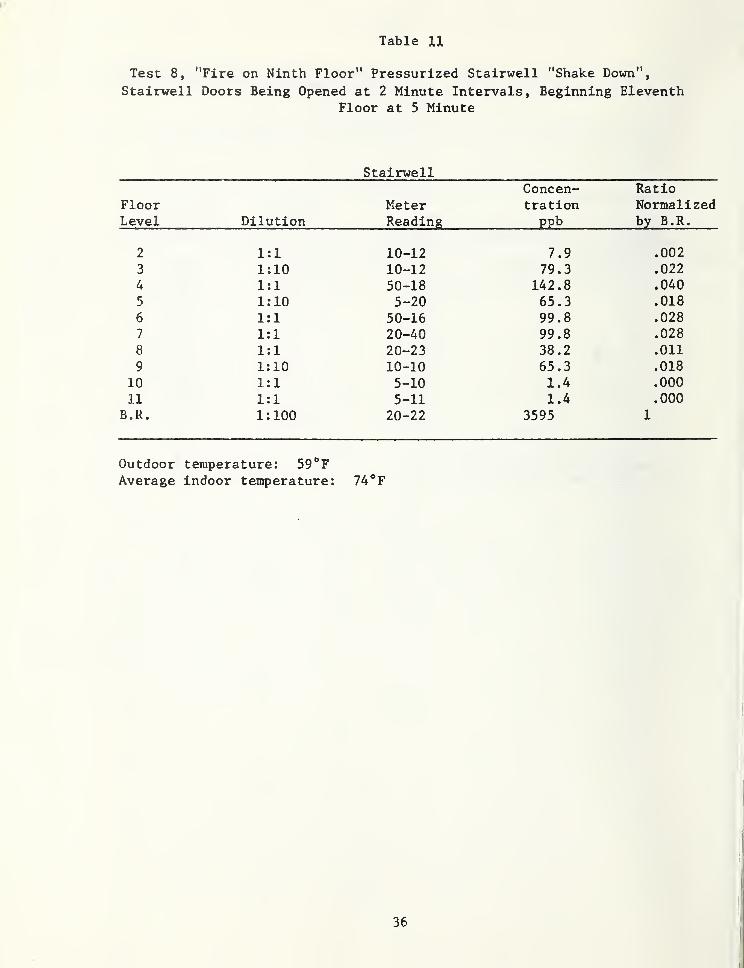
Table 11
Test 8, "Fire on Ninth Floor" Pressurized Stairwell "Shake Down",
Stairwell Doors Being Opened at 2 Minute Intervals, Beginning EleventhFloor at 5 Minute
Stairwell
FloorLevel Dilution
MeterReading
Concen-trationppb
RatioNormalby B.R
. 2 1:1 10-12 7.9 .002
3 1:10 10-12 79.3 .022
4 1 :
1
50-18 142.8 .040
5 1:10 5-20 65.3 .018
6 1:1 50-16 99.8 .028
7 1:1 20-40 99.8 .028
8 1:1 20-23 38.2 .011
9 1:10 10-10 65.3 .018
10 1:1 5-10 1.4 .000
11 1:1 5-11 1.4 .000
B.R. 1:100 20-22 3595 1
Outdoor temperature: 59*'F
Average indoor temperature: 74*F
36
ge
CO
aUJNfE
V)ifi
111
KO.
1-
D
D
< _
3 2
Q DO
Ijj >C/) >
S2U-
Jl.
i I
37
-T
i.
If rI
0
CO
a:
tuoca.
1IT 5
Di
<-JQ.
oro3
X
CVJ
(T.
ZD03
i
38
3, PRESSURIZATKDN FLOW SUPPLY AND VENT
0- o
Ein
Ul
<n
oUJ
€0
COcoto
•MB
oOl£oo
I
0o
5r
X3coo
co
11:
cOfOlO
ca.o
I I
CM CJ
C It"0 o
1 i
I I
^ iQ- Q.
fO ^
< O
>u-J
oo_J
r - 00
-T-OO O
GO 8 O-roCVJ
OJ
%*NoiivdiN3DNO0 a3znvyMaoN
40
5s
in
CO
0)
in
•ocou$coa;
a»
'5
s
>
9jc _a io ^« s
1
1
o•4- w.
a;c.2
o
o
CO £
O <
OO
o
ou
•o
0)
- O
CVJ
- CO
UJ>UJ
OO
GO
OO
T"O00 s o
[
oCM
% * N0llVdJLN3DN00 QSZHVI^aON
41
r
inHIh-
:^O
o
<
E
CVJ
</>
co
o
Eoo
oEcn
CO ^... ^ 8
ooT3Cou0)(O
co
c<va.o
XJ c(u (/) a>Sol" 5 w
8V)
o ^o c= c cviO OJ
8 S oc
o
c
UJ>LJ-I
h ^ a:oo_JLi.
(D
3 3 3(/)(/)<n «> tf0; <u <uC S.
Q. Q. CL
2? < UJ mil G iS 3
< b
Too
o00
o O
- O
CVI
%*NOIlVdlN33NO0 a3ZnVI/^0N
42
c co oc co ooN
oN3 3(0 V)(A Vt
Q. 0.
(/)
LUK
o
01
inCM
co
OLlJ
<
oQ.EooOf
oE(/)
oo
x:
c'c
co
(Ao
(A
og
c&o(A
oo
- O
= C< CM
»0 If)
X >
CM
UJ>UJ
h CD q:oo
oo
T"Oo O
00
T"o
T"O O
CM
% *N0llVdiN3DN03 a3ZnVI/\ldON
CM
43
id
if)
oUJ
<-J
co01
ISI
(0
01
"O
gua>wco
Sf
<0
- o
CVJ
- CD
>LU-J
oroo
- CD
GO
u.
Oo
1^
oGO
o O-ro
% * NoiivdiN30Noo a3znvk\iaoN
- o
CVJ
44
- o
UJ:^Oif)
OUJ
!5
O
O
r- c\J
oo
c'c
co
COft.
• VMM
o
- o
ooT T1 1 1 r-
% * NOIlVdlN30NO0 a3Znvi/MdON
TOO
00
45
46
CL 5 a: ^5 5 ,^UJ ^- LU
if)LU
O
oUJ
jOo
Ooo
55
cOcoo*^
<o
<ro
<u
aO
• MM
UJ
<I-
oo
<a:
UJ
UJ
COo
8O<Q.
UI
UJo(O
OoO
UJ
9h-
ooO(D
^ << UJ
UI %
UJ <S o
LU UJ
< <(O CO
o %^^ 9— <J>
O Q< <o: q:
Ul UJH h-
UJ UJ
9 9<o <o
3O
3OlO O
55UiQCZ)COCOUI(ra.
aUJ
<
UIq:
COCOUJQCQ_
OUI
<
3 S_l _l< <
CVJ
oCD Z
ITOO
CO
CM
O^H ui'dV
47
QliJ
cn
SoOf)
o
o
o
ca
-ocCVJ
UJh-
UJ
o
oco
3
UJro
oo
48
I
FORM NBS-114A (1-71) f
U.S. DEPT. OF COMM. 1. PUBLICATION OK REPORT NO. 2. Gov't Accession
BIBLIOGRAPHIC DATA No.
SHEET NBSIR 73-277
3. Recipient's Accession No.
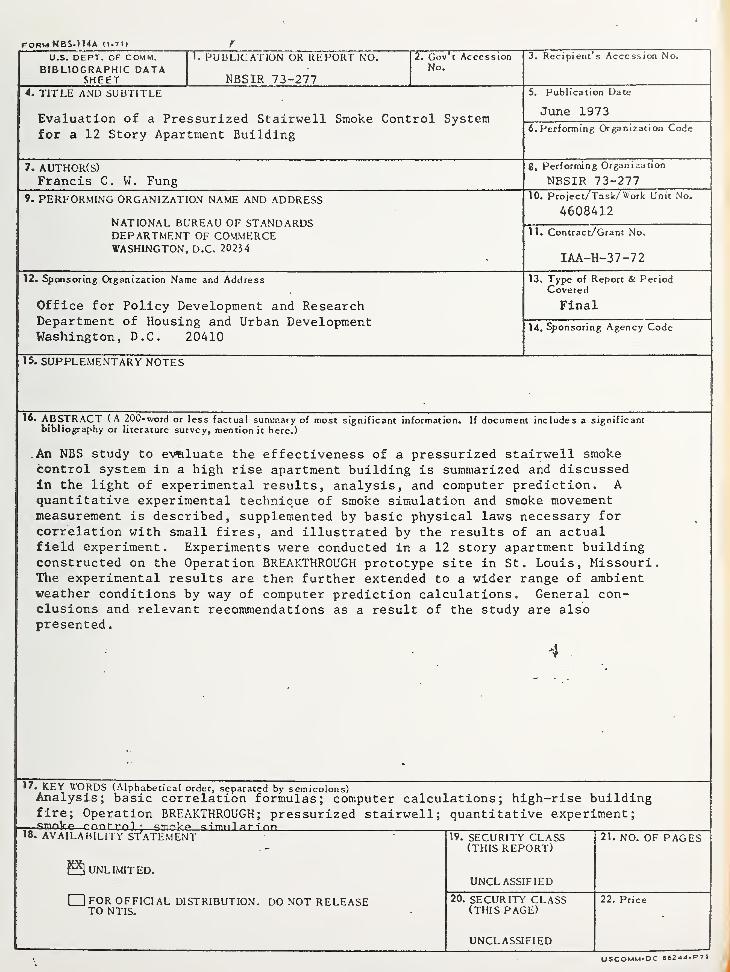
4. TITLE AND SUBTITLE
Evaluation of a Pressurized Stairwell Smoke Control Systemfor a 12 Story Apartment Building
5. Publication Date
June iy/J
6. Performing Organization Code
7. AUTHOR(S)Francis C. W. Fung
8. Performing Organization
NBSIR 73-277
9. PERFORMING ORGANIZATION NAME AND ADDRESS
WAllONAL BUKhAU Or blANUAKUoDEPARTMENT OF COMMERCEWASHINGTON, D.C. 20234
10. Project/Task/Work Unit No.
4608412
11. Contract/Grant No.
IAA-H-37-72
12. Sponsoring Organization Name and Address
v/i-x-xc-c lUL rujLxcy i/cVcxoptnent anu rvesearcnDepartment of Housing and Urban DevelopmentWashington, D.C. 20410
13. Type of Report & PeriodCovered
14. Sponsoring Agency Code
15. SUPPLEMENTARY NOTES
16. ABSTRACT (A 20C-word or less factual sunim.aty of most significant information. If document includes a significantbibliography or literature survey, mention it here.)
An NBS Study to evaluate the effectiveness of a pressurized stairwell smokecontrol system in a high rise apartment building is summarized and discussedIn the light of experimental results, analysis, and computer prediction. Aquantitative experimental technique of smoke simulation and smoke movementmeasurement is described, supplemented by basic physical laws necessary forcorrelation with small fires, and illustrated by the results of an actualfield experiment. Experiments were conducted in a 12 story apartment buildingconstructed on the Operation BREAKTHROUGH prototype site in St. Louis, Missouri.The experimental results are then further extended to a wider range of ambientweather conditions by way of computer prediction calculations. General con-clusions and relevant reeoinmendations as a result of the study are alsopresented.
. 4 .
17, KEY WORDS (Alphabetical order, separated by semicolons)Analysis; basic correlation formulas; computer calculations; high-rise buildingfire; Operation BREAKTHROUGH; pressurized stairwell; quantitative experiment;smnke r nnrrol ; smoke '^ttthiI at- i np
18. AVAILABILITY ST'aTEMENT
UNLIMITED.
for OFFICIAL DISTRIBUTION.TO NTIS.
DO NOT RELEASE
19. SECURITY CLASS(THIS REPORT)
UNCL ASSIFIED
20. SECURITY CLASS(THIS PAGE)
21. NO. OF PAGES
22. Price
UNCLASSIFIED
OSCOMM-DC 66244-P71