Embed Size (px)
Citation preview
Managerial work stations are expected to proliferate in the near future. But managers have diverse needs. To serve managers well, we must have ways of studying man- agers, so that we can adapt systems to their individual needs. The author discusses three roads to the study of managers: use-of-time analysis, the analysis of procedures, and the critical success factors approach. The author also raises the issue of how much individualization we can afford and how much users really want.
The author is with the College of Busi- ness Administration at the University of Hawaii, 2404 Maile Way, Honolulu, HI 96822, USA (Tel 808 261-2675).
This article is an edited version of a paper submitted for presentation at the Fifteenth International Conference on System Sciences, Honolulu, Hawaii, January 1982.
ILois Paul, ‘First large-scale computer, Eniac, turns 35 years old’, Computerworld, 2 March 1982, pp 1,4. zPretrial Brief for Defendant international Busines Machines Corporation, United States of America vs IBM Business Machines, 60 civ. 200-civ. No 72-344 (DNE), 15 January 1975. “‘IDC expects “staggering” desktop growth’, Computerworld, 1 December 1980, p 78.
Off ice automation needs
Studying managerial work
Raymond R. Par&o
In 1981, students at the University of Pennsylvania decided to pit a modern TRS 80 desktop computer, costing about $2000, against ENIAC, which was the world’s first electronic computer. ENIAC was built at the end of the second world war at a cost of $400000 (about $2 million in today’s dollars). In the contest, both machines were given the same numerical problem: to square all integers from 1 to 10000. There was no competition. The little desktop computer was about twenty times faster than ENIAC.’
The price/performance ratio of computers has been increasing by about 25% annually in recent years,’ and most people expect this trend to continue. If it does, a $3000 desktop computer ten years from now will rival today’s $30000 microcomputers. Twenty years from now, when most of us will still be working for a living, it will have the power of today’s $250000 ‘super-minis’.
Today, personal (desktop) computers are comparatively rare. How- ever, according to one recent forecast by the International Data Cor- poration, the number of desktop computers in the USA will grow from 371 thousand units in 1979 to 3.1 million in 1984.’ The number of terminals through which managers and professionals can reach com- puters is also growing explosively. In 1981, there was only one terminal for every 48 US workers; by 1986, there will be one for every ten?
With this kind of power soon to be available, it makes sense to plan very diligently for office work stations. About 40% of the US work force now consists of office workers,s and office productivity has been growing by a sluggish 1.3% annually.6 As processing power becomes cheaper, we should be able to trade off machine costs against people costs to ever greater advantage.
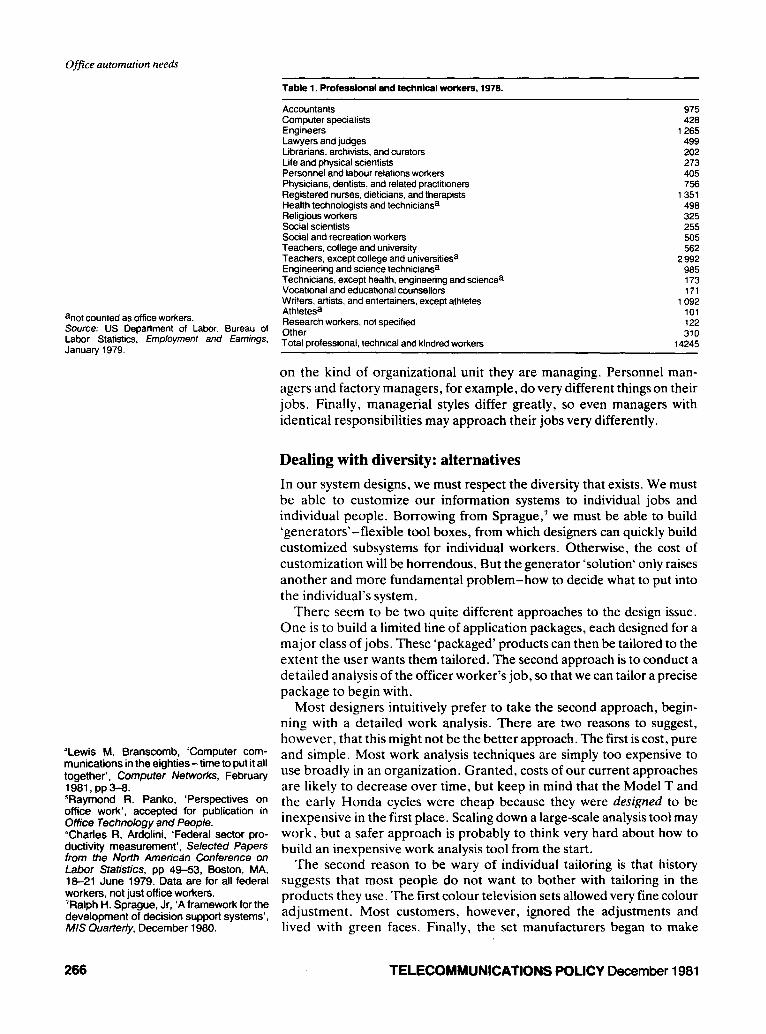
The problem, of course, is that office work is very diverse. Table 1 shows the kind of diversity found among just professional and technical jobs. There is also great diversity among managerial jobs. Many so-called ‘managerial’ jobs, in fact, are really professional jobs in which the discipline has not been recognized by the Bureau of Labor Statistics. Corporate planning is a good example of this. Furthermore, even ‘general’ managers find that the type of work they do is highly dependent
0308-5961/81/040265-08$02.00 0 1981 IPC Business Press 265
Office automation needs
Table 1. Professional and technical workers, 1978.
Accountants Computer specialists Engineers Lawyers and judges Librarians, archivists, and curators Life and physical scientists Personnel and labour relations workers Physicians, dentists, and related practitioners Registered nurses, dietitians, and therapists Health technologists and techniciansa Religious workers Social scientists Social and recreation workers Teachers, college and university Teachers, except college and universitiesa Engineering and science techniciansa Technicians, except heaith, engineering and sciencea Vocational and educational counsellors Writers, artists, and entertainers, except athletes
anot counted as office workers. Athletesa Research workers, not specified
Source: US Department of Labor, Bureau of Cther Labor Statistics, Employment and Earnings. January 1979.
Total professional, technical and kindred workers
975 420
1265 499 262 273 465 756
1351 498 325 255 565 562
2 992 905 173 171
1092 101 122 310
14245
on the kind of organizational unit they are managing. Personnel man- agers and factory managers, for example, do very different things on their jobs. Finally, managerial styles differ greatly, so even managers with identical responsibilities may approach their jobs very differently.
Dealing with diversity: alternatives
‘Lewis M. Branscomb, ‘Computer com- munications in the eighties-time to put it all together’, Computer Networks, February 1981.pp3-8. *Raymond R. Panko, ‘Perspectives on office work’, accepted for publication in Office Technology and People. Charles R. Ardoiini, ‘Federal sector pro- ductivity measurement’, Selected Papers from the North American Conference on Labor Statistics, pp 4%53, Boston, MA, 18-21 June 1979. Data are for all federal workers, not just office workers. ‘Ralph H. Sprague, Jr, ‘A framework for the development of decision support systems’, MIS Quarterly, December 1980.
In our system designs, we must respect the diversity that exists. We must be able to customize our information systems to individual jobs and individual people. Borrowing from Sprague,’ we must be able to build ‘generators’-flexible tool boxes, from which designers can quickly build customized subsystems for individual workers. Otherwise, the cost of customization will be horrendous. But the generator ‘solution’ only raises another and more fundamental problem-how to decide what to put into the individual’s system.
There seem to be two quite different approaches to the design issue. One is to build a limited line of application packages, each designed for a major class of jobs. These ‘packaged’ products can then be tailored to the extent the user wants them tailored. The second approach is to conduct a detailed analysis of the officer worker’s job, so that we can tailor a precise package to begin with.
Most designers intuitively prefer to take the second approach, begin- ning with a detailed work analysis. There are two reasons to suggest, however, that this might not be the better approach. The first is cost, pure and simple. Most work analysis techniques are simply too expensive to use broadly in an organization. Granted, costs of our current approaches are likely to decrease over time, but keep in mind that the Model T and the early Honda cycles were cheap because they were designed to be inexpensive in the first place. Scaling down a large-scale analysis tool may work, but a safer approach is probably to think very hard about how to build an inexpensive work analysis tool from the start.
The second reason to be wary of individual tailoring is that history suggests that most people do not want to bother with tailoring in the products they use. The first colour television sets allowed very fine colour adjustment. Most customers, however, ignored the adjustments and lived with green faces. Finally, the set manufacturers began to make
TELECOMMUNICATIONS POLICY December 1981
Office automation needs
automatic colour adjustment. It was never very good, but neither was it ever very bad. In microwave ovens and 35 mm cameras, too early designers overshot the mark and built equipment too intricate for most people. Not until Canon’s simple, cheap, and automatic AE-1 did the 35 mm camera really explode in the marketplace.
We have already seen a strong user requirement for KISS (‘Keep it simple, stupid’) in the office products market. In a study of electronic message system users, for example, managers were found to fall into three major categories.’ About a sixth made extensive use of filing, editing, and retrieving functions for their mail. Another sixth rarely did. The rest delegated terminal work to their secretaries. It should be noted that the delegators liked the system’s end results. They just saw no real benefit in using any of its features. In comparison, most EMS system designers have tended to be heavy and sophisticated users. And most of their feedback comes from heavy users. Unless extremely vigorous and forceful efforts are made to design systems to suit all market segments, the ‘light majority’, who should be the prime design targets, are usually overlooked.
In word processing, which today contains the best examples of good office products design, current systems are much simpler than earlier systems. Sometimes they can do things earlier systems could not, but these new features are almost always very simple to use. Any pro- grammer who wants to develop products for office workers should first look at the IBM Display writer, the CFT 8CKKl and other popular word processors to see the kind of elegant simplicity that marks successful office products.
In general, well designed office products seem to anticipate what users will do even before the user knows. In fact, there is a lot of truth behind this impression. Well designed systems are based on careful studies of what people do and in what order they do things. Then, designers follow three simple rules:
0 The user must be able to do simple things simply. 0 All frequent sets of actions must be handled elegantly. 0 Your competitors are probably smarter than you; study all
competitive products and use their best insights when possible.
In perspective, the amount of power and tailoring a user wants probably depends on two things: how important the system is in his or her work and how much he or she likes to tinker. If you need a system three or four hours per day (if you are involved mainly in records management work, for example), then you are much more likely to demand customized functions. Even then, surprisingly, many people never learn the full range of sophisticated features of their systems. Few people, in turn, who use a system for only half an hour per day find it worthwhile to do ‘fancy’ things with the system. While there are some tinkerers among the light users, they do not seem to be in the majority, and there are even serious doubts that tinkerers are really being more productive by using the system in a heavy and sophisticated manner.
Whether the full-tailoring or limited-product-line approach ultimately wins out, excellent tools are still needed to study managers. Under full
“Raymond FL Panko and Rosemarie U. tailoring, we must understand each person in detail. Under a limited-
Panko, ‘A survey of EMS users at product-line approach, we must be able to design our product line very
DARCOM’, Computer Networks, March intelligently and understand how much alteration different market seg- 1981, pp 19-34. ments will desire for any given product.
TELECOMMUNICATIONS POLICY December 1981
Ofjice automation needs
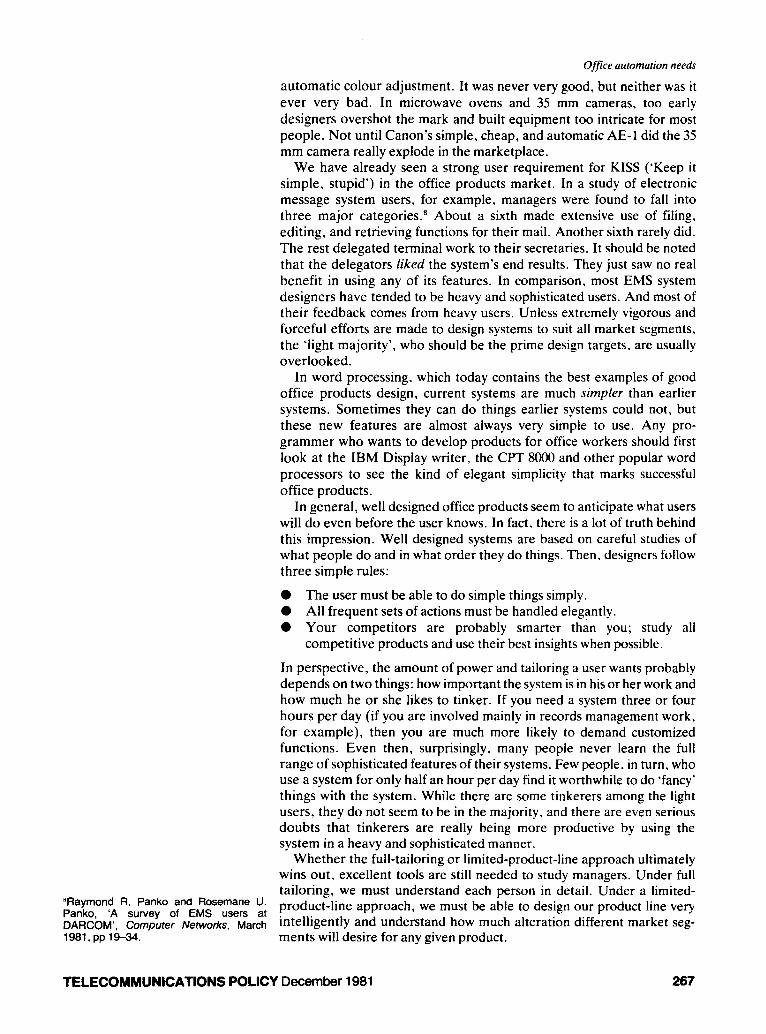
a Respondents were both managers and pro- fessionals. Sources: Rosemary Stewart, Managers and Their Jobs, Pan Books, London, 1967; Thomas Bums, ‘Management in action’, Operational Research Quarterly, Vol8, No 2,1957, pp 45-60: James Home and Thomas Lupton, ‘The work activities of middle manaaers - an exoloratotv study’, Journal of Management Studies, i/al 1, No 2, 1965, pp 14-33; R. Dubin and S.L. Spray, ‘Executive behaviour and interaction’, industrial Relations. No 3, 1964; J.D. Croston and H.B. Goulding, ‘The effectiveness of communication at meetings: a case study’, Operational Research ~uarterk Vol 17, No 1, 1967, pp 45-47; Henry Mintzberg, ‘Managerial work: analysis fr& observation’. Manaoement Science. Voll8. No 2. October 1971, pp ~97-8110; A.W: Palmer and R.J. Beishon. ‘How the day goes’, Personnel Management, 1970; Netting, reported in Sune Carlson. Executive Behavior, Stomber. Stockholm, 1951; Wayne L. Rhodes, Jr, ‘How to boost your office productivity’, Infosystems, August 1980, pp 38-42.
‘Henry Mint&erg, ‘Managerial work: analysis for observation’, Management Science, Vol 18, No 2, October 1971, pp 697-8110. loWayne L. Rhodes, Jr, ‘How to boost your office productivity’, Infosystems, August 1980, pp 38-42. ’ I Ibid.
Table 2. Managers’ use of time.
Study
Booz-Allen 8 Hamiltona Stewart Burns Home and Lupton Dubin and Spray Croston and Gouldina Mint&erg Palmer and Beishon Notting ‘COMPOSITE’
No of
299 160 76 66
: 5
Percentage of workrng day
Face-to-face FrF plus Reading meetings Telephone tdqhone Writing
54 6
54 9 55 6 56 7 64 6 54 6
50 6
46 21 67 60 28 88 52 24 76 63 24 87 61 5 66 63 18 81 70 20 90 60 15 75 59 17 76 56 24 80
cetii
This article surveys tools that are now being used to study office work. There are, of course, many more tools available. In particular, there have been extensive studies of how scientists and technologists use various information sources and even empirical studies on the relationship be- tween a professional’s performance and his or her use of information. The three approaches that have been selected for review in this article have been included primarily because they are the most frequently used in the study of office work.
Time studies
Perhaps the simplest way to study managers is to observe them and record what they do with their time. This way, we can at least identify major activities and perhaps pinpoint some minor activities. *As shown in Table 2. the analysis of managers’ time is not a new activity.
From the summary data shown in Table 2, it is clear that most studies are in strong general agreement. Managers spend most of their day communicating-a quarter of it reading and writing, 5% or so on the telephone, and half of the day in meetings of various sorts. It is no accident, then, that communication support is now a major pre- occupation of system designers.
Of the studies shown in Table 2, probably the best known is that by Mintzberg.’ Unfortunately, Mintzberg used only a microscopic sample of five managers. Furthermore, he studied chief executives only. Other studies (cited less often) have demonstrated that use of time varies greatly according to managerial level. Lower-level managers spend a great deal less time in the chaotic communication-on-the-fly mode observed by Mintzberg, more time in thought and analysis.
Use of time studies pinpoint the need for improved communication services-telephone service, electronic message systems, dictation systems, reading enhancements, and so on. But few have analysed the ‘residual’ non-communication category in any depth.
Thus the Booz, Allen and Hamilton study” is notable for its attempt to look beyond communication, at what it called ‘less productive’ activities- things that either waste time completely or that could be delegated to lower-paid employees. These less productive activities accounted for 1540% of the work day in the organizations studied. They included ‘doing clerical tasks, finding and screening the “right information”, wait- ing idle while travelling, expediting previously assigned tasks and scheduling and organizing their work’.”
The Booz study also examined the use of ‘professional tools’, such as
TELECOMMUNICATIONS POLICY December 1981
Oftice automation needr
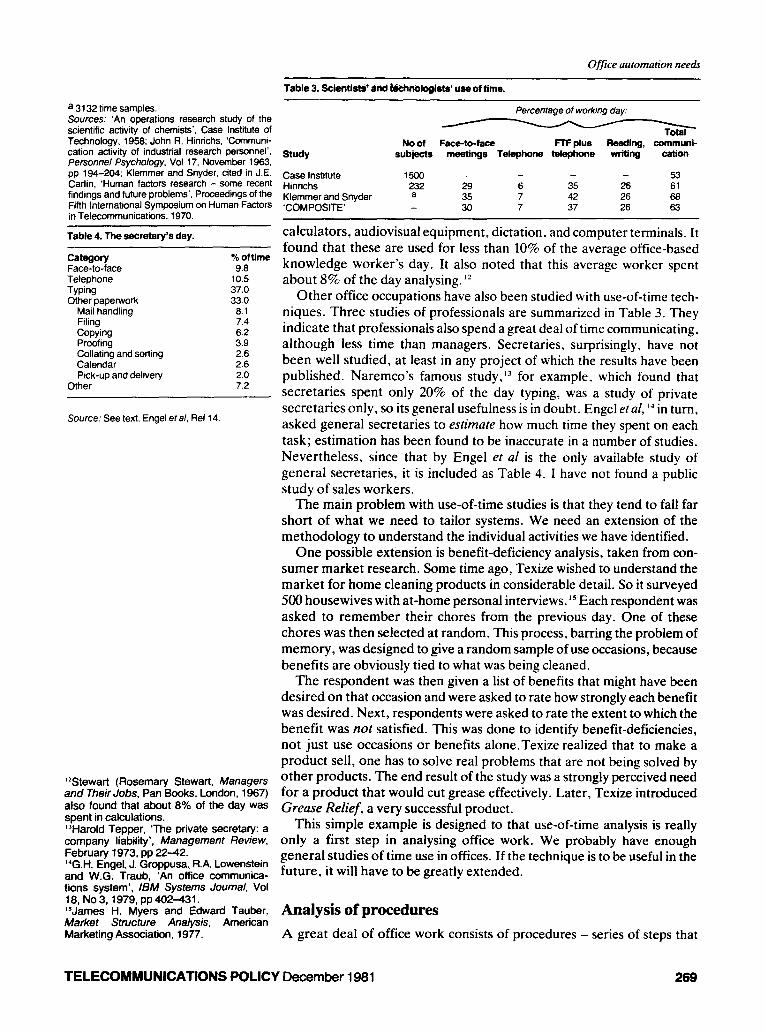
Table 3. scientists’ arid &hnologists’ use of time.
a 3132 time samples. Sources.’ ‘An operations research study of the scientific activity of chemists’, Case Institute of Technology, 1956; John R. Hinrichs. ‘Communi- cation activity of industrial research personnel’, Personnel Psychology, Vol 17. November 1963, pp 194-204; Klemmer and Snyder, cited in J.E. Carlin, ‘Human factors research - some recent findings and future problems’, Proceedings of the Fifth International Symposium on Human Factors in Telecommunications. 1970.
Table 4. The secretary’s day.
Category % of time Face-to-face 9.8 Telephone 10.5 Typing 37.0 Other paperwork 33.0
Mail handling 6.1 Filing 7.4 Copying 6.2 Proofing 3.9 Collating and sorting 2.6 Calendar 2.6 Pick-up and delivety 2.0
Other 7.2
Source: See text, Engel er al, Ref 14.
“Stewart (Rosemary Stewart, Managers and Their Jobs, Pan Books, London, 1967) also found that about 8% of the day was spent in calculations. “Harold Tepper, ‘The private secretary: a company liability’, Management Review, February 1973, pp 2242. “G.H. Engel, J. Groppusa. R.A Lowenstein and W.G. Traub, ‘An office communica- tions system’, IBM Systems Journal, Vol 18, No $1979, pp 402431. ‘“James H. Myers and Edward Tauber, Market Structure Analysis, American Marketing Association, 1977.
Percentace of workina day:
Na of Face-to-face m plus Reading, communi- Study subjects meetings Telephone telephone writing cation
Case Institute 1500 53 Hinrichs 232 29 6 35 26 61 Klemmer and Snyder a 7 42 26 68 ‘COMPOSITE’ :: 7 37 26 63
calculators, audiovisual equipment, dictation, and computer terminals. It found that these are used for less than 10% of the average office-based knowledge worker’s day. It also noted that this average worker spent about 8% of the day analysing.12
Other office occupations have also been studied with use-of-time tech- niques. Three studies of professionals are summarized in Table 3. They indicate that professionals also spend a great deal of time communicating, although less time than managers. Secretaries, surprisingly, have not been well studied, at least in any project of which the results have been published. Naremco’s famous study,13 for example, which found that secretaries spent only 20% of the day typing, was a study of private secretaries only, so its general usefulness is in doubt. Engel etal, I-! in turn, asked general secretaries to estimate how much time they spent on each task; estimation has been found to be inaccurate in a number of studies. Nevertheless, since that by Engel et al is the only available study of general secretaries, it is included as Table 4. I have not found a public study of sales workers.
The main problem with use-of-time studies is that they tend to fall far short of what we need to tailor systems. We need an extension of the methodology to understand the individual activities we have identified.
One possible extension is benefit-deficiency analysis, taken from con- sumer market research. Some time ago, Texize wished to understand the market for home cleaning products in considerable detail. So it surveyed 500 housewives with at-home personal interviews. I5 Each respondent was asked to remember their chores from the previous day. One of these chores was then selected at random. This process, barring the problem of memory, was designed to give a random sample of use occasions, because benefits are obviously tied to what was being cleaned.
The respondent was then given a list of benefits that might have been desired on that occasion and were asked to rate how strongly each benefit was desired. Next, respondents were asked to rate the extent to which the benefit was not satisfied. This was done to identify benefit-deficiencies, not just use occasions or benefits alone.Texize realized that to make a product sell, one has to solve real problems that are not being solved by other products. The end result of the study was a strongly perceived need for a product that would cut grease effectively. Later, Texize introduced Grease Relief, a very successful product.
This simple example is designed to that use-of-time analysis is really only a first step in analysing office work. We probably have enough general studies of time use in offices. If the technique is to be useful in the future, it will have to be greatly extended.
Analysis of procedures
A great deal of office work consists of procedures - series of steps that
TELECOMMUNICATIONS POLICY December 1981 269
Office automation need.5
‘“George R. Terry, Office Automation, Dow Jones-Irwin, Homewood, IL. 1966. “For a slightly dated but excellent survey of tools for modelling and programming, see Clarence A. Ellis and Gary Nutt, ‘Office information systems and computer science’, Computing Surveys, Vol12, No 1, March 1980, pp 27-60. ‘“David L. Holzman and Victor Rosenberg, ‘Understanding shadow functions: the key to system design and evaluation’, Work- shop on Evaluating the Impact of Office Automation, Xerox Palo Alto Research Center, Palo Alto, CA, 13-14 May 1976.
must be completed in some basic order, perhaps by a single person, perhaps by many people. Automating such procedures is likely to bring considerable productivity gains. In fact, it already has. Procedural auto- mation systems are now used extensively in every large and medium-size corporation. In 1948 when we first began computerizing them, they were called ‘office automation’ tools.‘6 Today, for some reason, we exclude them from the definition of office automation, despite the fact that they are clearly tools for office work and are still done by office workers. What do we call them today? Data processing. Nearly all DP applications in business are designed to automate procedures for office work.
In the last generation, DP applications have matured greatly. The large applications are far more sophisticated and powerful. We have seen the emergence of powerful techniques for analysing office procedures, pro- gramming tools for building certain classes of applications, and even techniques for designing packages to fit common applications in a way that is attractive to users. Packages for many common applications are even available today for small offices, thanks to small business systems that use minicomputers and microcomputers.
Now we are beginning to attack the problem of small scale and infre- quent clerical applications, the kinds too specific and uncommon to generate a market (at least today) for packages. A number of tools for studying, modelling, and programming these specialized procedures are now being created. I7
Before we can model or program, of course, we need data. The standard procedure manual for an office is often a surprisingly good starting point if it is a decent manual. Even if it is more ignored than followed, it generally indicates major problems and general approaches, as well as specific exception problems.
The next step is to interview people who work in the office to see what they really do. Having studied the procedure manual, we are likely to understand their work better, so that we can quiz them intelligently on what they do in known exception cases, and ask them specific probing questions on why they do in known exception cases, and ask them specific probing questions on why they do not follow the procedures manual in certain instances.
One problem with interviewing people is that there are certain things that are frequently overlooked. Holzman and Rosenberg’” have called these ‘shadow functions’. They seem to come in two major categories. First, there are things so routine that they become invisible and are overlooked in interviews. Second, there are exceptions when the basic system ‘breaks down’. These frequently go unreported, even when they consume a great deal of time.
After the data have been collected, the next step is deciding how much to program. The basic flow is usually simple and easy to program. But there are usually many exception conditions that lead to secondary branches in the work flow. And every system has ‘break downs’ in which the programmed flow fails-for instance, if an important piece of information needed to do some step in the procedure is missing.
One approach to handling the complexities of office procedures is to build a fairly simple prototype. This prototype is put into operation (as a back-up system) and then modified as needed. Prototyping fits one of the most troublesome problems in creating systems: the fact that knowledge of user needs tends to evolve even after diligent search. Prototyping is not always possible, but the growing number of ‘applications generator’
270 TELECOMMUNICATIONS POLICY December 1981
“Lucy A. Suchman, ‘Dffice procedures as practical action: theories of work and soft- ware design’, Workshop on Research in Office Semantics, Chatham, Cape Cod, MA, 15-l 8 June 1980. ‘OD. Ronald Daniel, ‘Management informa- tion crisis’. Harvard Business Review, SeptemberXIctober 1961, p 111. 2’John F. Rockart. ‘Chief executives define their own data n&s’, Harvard Business Review, March-April 1979, pp 81-93. “*Peter F. Drucker, The Effective Executive, Harper and Row, 1966.
Ofice automation need.5
software packages make prototyping and adaptive design relatively simple.
A caution should be added at this point. In much recent literature on procedural automation, an implicit assumption seems to exist that office work is largely procedural work. But consider what happens when a new office is created. At first, every problem is handled as a unique crisis. Later, as experience grows, certain problems are seen to be recurrent; effective and efficient procedures are usually created to handle them.
Even in the long run, however, not everything can be procedurized. Many problems must be solved individually or by general hueristic search strategies (‘Why don’t you look through the xyz file and see if anything there helps?‘). There is sometimes a real danger that computerizing major procedures will destroy access to files needed for one-of-a-kind and hueristic problem solving.
In the end, office work is practical action,lg that is, an environment in which goals have to be met and problems solved ‘any which way you can.’ Procedures are useful and desirable where they are appropriate, but they still constitute only one weapon in the office worker’s arsenal.
Again, a basic question is how much complexity is really desirable. As discussed above, a simple system that handles basic things well may be more acceptable to users than a powerful and sophisticated but complex tool. Power that goes unused is meaningless, expensive, and often daunt- ing to users.
Critical success factors
One of the most discussed techniques for studying managerial work is based on the idea of ‘critical success factors’ (CSFs) a concept invented by Daniel” and popularized in the MIS area by Rockart.”
The idea is simple. As Drucker has pointed out so eloquently in his book The Eflective Executive, 22 we must focus not on individual tasks but on the external contributions that tasks are designed to generate. An office exists to solve some problem, provide some information, or give some direction to other parts of the firm. An effective executive, Drucker notes, constantly asks what he or she could be doing to improve the overall performance of the firm. In the parallel language of CSF theory, every person or department has a relatively small number of critical success factors that will probably bring success if executed well and that will probably guarantee failure if not executed well.
The problem with traditional management information systems is that they merely provided predigested accounting data to managers. They never asked whether the reams of data really served some pressing need (pertained to a CSF). Nor did they ask whether they were serving all the CSFs of individual managers.
In the CSF approach, you either begin with goals (say, MB0 objec- tives) or CSFs, depending on whom you talk to. If you begin with goals, you then identify CSFs for each. If you begin with CSFs directly, you define CSFs for that manager’s job in total. In either case you create a limited set of critical factors for each manager and group. The world ‘limited’ is the key one. If there are too many CSFs, the manager will effectively have too little guidance on how he or she is to allocate time and resources.
The next step is to identify what information must be supplied in the support of each CSF. (Other resources have to be supplied, too, but that
TELECOMMUNICATIONS POLICY December 1981 271
Office automation needs
Table 5. Critical success factors for one manager (chief executive officer of a major oil company).
Decentralize organization Improve liquidity position Improve government/business relatlonships Create better social image Develop new ventures
Source: See text, Rockart, Ref 21
‘“Mawin Sirbu, Sandor Schoichet, Jay Kunin, and Michael Hammer, OAM: An Office Analysis Methodology, MIT, Labora- tory for Computer Science, October 1980.
is not our consideration here.) Now ways have to be found to measure whether each CSF has been satisfied. The last step, of course, is to measure the attainment of the CSFs and reward or punish the manager accordingly.
Table 5 is a CSF plan for one manager. Note that only some of the information needed is computerized. As use-of-time studies indicate, managers and other office workers obtain much of their critical infor- mation verbally.
The CSF approach is supposed to be superior to traditional man- agement by objectives. MB0 tells the manager what to do but not how to do it. MB0 measurement may give us ‘lagging indicators’, which may only indicate trouble after the situation is very bad. CSFs, in turn, give the manager guidance in what sub-objectives to focus on to achieve the main objective. They also help the manager’s superior to monitor partial progress. In practice, the gap between MB0 and CSF is more subtle than this. Most MB0 programs deal with partial objectives that build to a larger objective. Perhaps the greatest contribution of the CSF literature is its stress on finding those few things that will really make or break a manager or office when working toward goals.
Because the CSF approach was designed for the MIS environment, it has traditionally focused on the informafion that managers need to achieve their critical success factors. But in future systems, office workers will also be given processing fools to help them achieve their CSFs.
The Massachusetts Institute of Technology has been working to com- bine CSF thinking and procedure analysis into a full tool for studying office work. The MIT approach is called ‘Office Analysis Methodology’ (OAM).” It is currently evolving from a loose collection of ideas and intentions into a full and specific methodology.
Conclusion
Overall, we have a long way to go in understanding how to analyse office work. Our current tools solve only parts of the problem. They are also too expensive. We do not even know how much we need to tailor our systems.
Despite such discouraging conditions, the analysis of office work is probably the most critical contribution we can make to the future of office automation. The work already done indicates glaring weaknesses in past approaches to office automation. For too long, we have focused on secretaries, and then on parts of secretaries’ jobs. For too long. in addition, we have cherished absurd notions of what managers and professionals do. Unless we can destroy many myths quickly and make progress in other areas fairly quickly, the billions of dollars that firms now plan to spend on office systems in the next few years have little chance of being spent wisely.
272 TELECOMMUNICATIONS POLICY December 1981


![15-1. 15-2 Chapter 15 Managerial Accounting Learning Objectives After studying this chapter, you should be able to: [1] Explain the distinguishing features](https://img.pdfslide.net/doc/110x75/56649e6c5503460f94b6b3bc/15-1-15-2-chapter-15-managerial-accounting-learning-objectives-after-studying.jpg)