Embed Size (px)
Citation preview

Office Ergonomics Evaluation in a Naturalistic Work
Environment
Insurance Services - Support Services
Washington State Department of Labor and Industries
Jia-Hua Lin and Stephen Bao
SHARP Program
Washington State Department of Labor and Industries
Olympia, WA
Technical Report Number: 62-3-2016
2016
Olympia, Washington

1
Summary
An ergonomics evaluation study was conducted for Insurance Services - Support Services within
Washington State Department of Labor and Industries. The objectives of the study were:
1) To identify ergonomic risk factors that may be associated with updated technologies that the
existing guidelines might not take into account.
2) To measure physical exposures to workers from current tasks and office equipment, and
compare with historical trends.
In order to achieve the objectives, a 4-phase study design was developed. In Phase 1, a baseline
survey was conducted to obtain subjective overall work and musculoskeletal health information.
The survey was administered online and collected basic demographic information of the subjects,
work history information, perceived musculoskeletal problems of different body parts, and
psychosocial questions.
Phase 2 was designed to gather concurrent objective computer-specific activity measurements and
subjective body discomfort perception for a period of 10 days for each participant. This was done
by (1) using a program (RSIGuard) to register various computer use information, and (2)
administering online daily body discomfort survey at the end of a work shift. Relationships
between the two were explored.
Phase 3 was designed to analyze typical work activities and postures through observations. This
was done by using a time-lapse camera to capture images of task performances of workers during
a complete typical work shift to obtain detailed task distribution information.
In Phase 4, physical exposure of extended keying period was evaluated using surface
electromyography (EMG) on the shoulders and forearms. EMG technique is used to quantitatively
measure muscle activation levels, indicating muscular efforts of the specific body parts,
associated with different tasks. It helps to identify the intensities of parts of the whole job, or the
postures used to perform certain jobs, and then identify potential stress sources.
Throughout this study, 20 Support Services employees participated in various phases. Nineteen
participants finished the Phase 1 survey. Twelve enrolled for Phase 2, 13 for Phase 3, and 13 for
Phase 4.
The results showed that workers spent a slightly more time on computers than 7 years ago, with
an additional increase of other tasks at the desk. The employees were at their desk, sitting or
standing, for about 74% of the time, and 44% of the work shift was spent for data entry in the
current study. In comparison, 80% time at desk (performing data entry and other desk tasks) and
60% for data entry in the 1991 study.

2
The overall static, median and peak muscle loading for the four muscles throughout all tasks were
4-11%, 8-24%, and 16-46% of maximum voluntary contraction (MVC) respectively.
Corresponding limit values are known as 2%, 10% and 50% MVC, respectively. Although the
average peak muscle loading did not exceed the limit, the average static and median loading did.
Working on the computer demanded the most static loading for the extensor than other tasks.
Sorting, on the other hand, was the worst for the right trapezius. Claims Initiation and Bill
Processing employees experienced more static loading at these two muscles than their Imaging
colleagues did. Claims Initiation topped among the units in three of the four muscles for static
loading.
Static muscle loading is usually resulted from holding the same posture for an extended period.
This was the case for the wrist extensor (on the forearm) when the employees performing typing
activities using the keyboards. The employees needed to hold her/his hands in slightly extended
hand/wrist posture during typing. Positioning of the keyboard in a negative slope could be a
solution to reduce the static forearm extensor loading. In addition, the sorting task demands the
hand (typically the dominant hand, as monitored in this study) to grasp objects. This posts
consistent static loading to forearm muscles. And in order to move the right arm back and forth,
the right shoulder needs to generate the also consistent static loading.
The static shoulder loading might also be responsible for the relatively high shoulder complaints.
According to the employees’ survey, 79% of the employees reported having had pain, itching,
stiffness, burning, numbness, or tingling in the shoulder regions in the last 12 months. This was
much higher compared to the 31% in the 1991 study, or the 37% in the 2009 study. One of the
future workplace improvements should probably be focused on lowering the static loading on the
shoulder region for the employees.
44 40
60
3026
20
2634
20
0%
20%
40%
60%
80%
100%
2015 (All SS) 2009 (BP) 1991 (CI)
Task Allocation Historical Comparisons
Away from desk
Desk work (other
than keying)
Data Entry

3
Claims Initiation employees had to enter hand-written documents that did not go through the
scanner for optical text recognition. One finding of particular interest was that the hand-written
document quality (difficulty) affected static muscle loading. When entering employer report of
accident forms, the static loading on the left trapezius and the flexor were statistically significant
higher when the document difficulty level was equal or greater than 3 (on a scale of 1 to 5, 5
being the most difficult), compared when the level was lower than 3
According to the employees’ survey, in general, 74% of the participants in the current study were
satisfied with their current job situations. This was a slight improvement to what was found in the
2009 study (67%). They felt that they had little influence (in the responses to all four questions)
over the decisions that affected their jobs. This was worse than the 2009 study.
In summary:
Twenty people participated in this study for various phases. Fifteen percent of them were
from Bill Processing, 40% from Claims Initiation, and 45% from Imaging.
Time spent at the desk, or time spent for data entry have changed compared to those in
1991 and 2009. Workers spent more time on computers than in 2009.
All participants reported some musculoskeletal issue. The prevalence rates for all
surveyed body parts were all higher than in 2009.
29% of respondents reported missing work because of low back issues, and 25% due to
shoulders.
Ninety-five percent of the respondents reported eyestrain, dry or watery eyes, blurred
vision, or other eye symptoms.
Employees were generally satisfied with their current job conditions, but the lack of
influence about their jobs, except the flexibility to arrange furniture, seemed an
overwhelming issue that should not be neglected.
Self-reported shoulder problems were prominent. These could be caused by relatively high
static loading on the shoulder region. Reducing shoulder static loading should be the focus
in future ergonomic improvement efforts.
The difficulty of the documents that require manual data entry could affect static muscle
loading.
Workstations were mostly conforming to current guidelines. However, sit-stand function
of the standard issued desks was not widely used.
Further ergonomic improvements may need to go beyond the current office ergonomics
guidelines.

4
Introduction
The Safety and Health Assessment and Research for Prevention (SHARP) program conducted a
series of studies on workers in the Claim Initiation and Bill Processing units at the Washington
State Department of Labor and Industries since the early 1990’s (SHARP, 1991; SHARP, 1992;
SHARP 2009). Those studies measured the magnitudes and distribution of musculoskeletal
disorders (MSDs) associated with computer work using symptom questionnaires, physical
examinations, nerve conduction tests, work observations, surface electromyography, computer
activity logging and video observation. It was observed that the MSDs prevalence rates were 36%
for hand/wrist, 22% for neck, 14% for shoulder and 8% for both elbow and back, which were
higher than those observed in other studies of office workers in 1991 (SHARP, 1991).
Based on those findings, the studies recommended intervention methods including new
ergonomic furniture and alternative work patterns (for example, the combination of claim keying
jobs and phone conversation with customers). More importantly, the studies established
guidelines that limit intensive keying to 5 hours a day and more frequent alternation between
medium and low-paced keying jobs as an attempt to reduce the risks for hand/wrist and shoulder
musculoskeletal disorders.
These guidelines had been actively adopted by the Claim Initiation Unit and other computer
operation units at the Department of Labor and Industries. As a result, the prevalence rates of
discomfort decreased significantly. Notably, the neck MSDs prevalence rate was reduced by 7%
one year after the intervention (SHARP 1992). Employees gave positive feedback on alternative
work schedules and less keying, new workstations and office furniture, and a new building.
The latest study at the Bill Processing unit examined the impact of working hours on workers'
exposure to MSD risks (SHARP 2009). Results showed that 5-hour vs. 6-hour computer work had
no significance on workers' exposure to MSD risks, although employees showed muscle fatigue
signs within 2 hours after they started their daily work. The results provided guidance to the
management to allow 5.5-hour daily computer work, and introduced more frequent breaks and
annual discomfort survey among their employees.
Over the years, computer technologies have advanced at a much faster rate, as has the adaptation
within the Insurance Services division. Newer, faster, and sometimes automatic equipment were
recently put in service within various supporting units. The management of the Insurance Services
- Support Services at the Department of Labor and Industries has requested that SHARP assess
whether these technologies require changes to existing ergonomics guidelines, or whether they
further address old and unresolved ergonomics issues or incur unforeseen adverse health
problems. In addition to the two original units (Bill Processing and Claim Initiations) that
participated in the early series of studies, other units within the same agency were also interested
in the ergonomics evaluations of their job functions.
It is SHARP's perspective that latest technological developments in office environments and
computer systems may pose different exposures to the employees. For example, digital scanning,
optical character recognition (OCR) techniques, and text clipboard (copy and paste) functions
significantly reduce keying demands. A faster pace could have increased the overall workload
without employees realizing it. Further, the new technologies may require different operating
postures not previously observed. These warrant up-to-date observations and evaluations.

5
The objectives of the present study were:
- To assess ergonomics risk factors that may be associated with updated technologies that
the existing guidelines might not take into account.
- To measure physical exposures to workers from current tasks and office equipment, and
compare with historical trends where available (Bill Processing and Claims Initiation).

6
Materials and methods
Study Design
This study consisted of four phases: (1) employee work and health survey, (2) computer activity
exposure assessment and daily discomfort report, (3) observational task and ergonomics analysis,
and (4) muscle activity assessment of task samples. This study was approved by the Washington
State Internal Review Board (WSIRB) for the compliance with related federal, state, and local
regulations.
Participants
A series of information sessions was conducted for all Support Services employees at the
beginning of the project. SHARP researchers explained the background of the study, objectives,
procedures, and answered questions. Volunteers were then enrolled after providing their signed
informed consents. They chose to participate in one or more study phases. Altogether 20
participants participated various phases. They included three from Bill Processing (BP), eight
from Claims Initiation (CI), and nine from Imaging units. One participant started Phase 1 in CI,
but was transferred to Admin in Phases 2 and 3. Participants from the Imaging unit came from 4
different functional teams. For the purpose of data analysis, they were combined as a group, as
there were only one or two participants from each of the four teams. Table 1 shows the
demographic data of the study participants for each of the three phases.
Table 1. Demographic data of the study participant and the sex ratio.
Study phase # of subjects
(men/women)
Average age
(range)
Average height
(range)
1 19 (3/16) 44.4 (23-62) 5.4 (4.9-6.2)
2 12 (3/9) 43.7 (23-62) 5.5 (4.9-6.2)
3 13 (3/10) 44.6 (23-62) 5.5 (4.9-6.2)
4 13 (2/11) 45.9 (23-62) 5.3 (4.9-5.8)
Methods and procedures
Phase 1: Survey
A survey was conducted to obtain job and health information. The survey was administered
through an online survey site (http://www.surveymonkey.com/) and the link to the survey
questionnaires was sent to participants via emails. The survey collected basic demographic
information, work history, self-reported musculoskeletal problems of different body parts, and
psychosocial questions. The survey is presented in its entirety in Appendix A. Similar questions
that were used in previous studies in the Support Services unit were included in the present
survey.
Phase 2: Computer activity
Objective and quantitative computer use was recorded using a software (RSIGuard, Remedy
Interactive Inc., http://www.rsiguard.com/index.htm ), installed in each participant’s computer.

7
The program ran in the background. Depending on the individual preference settings, the software
could prompt the users to perform simple stretches, or to take short breaks. The main use for this
study was its registered computer use summary, including keyboard use time, mouse use time,
time using or not using computer, etc. The daily computer use information was collected for 10
complete workdays for each participant.
Concurrent daily body discomfort survey was filled at the end of each workday for the same 10-
day period. The survey was again collected online using the same online survey service
(http://www.surveymonkey.com/). A daily electronic calendar reminder prompted the participant
shortly before the end of the participant’s shift. The survey was one page long, and asked about
discomfort levels at different body parts (Appendix B).
Phase 3: Task and posture analysis
The work activity and posture observation was conducted on a separate day. This was done using
a camera to take time-lapse still images, one per minute, during a whole work shift. The camera
was set to focus on the participant in the workstation. This observation day was chosen by the
participant to represent a “normal work day”.
Observation coding was performed afterwards to categorize task activities and body postures of
each captured image. An analyst viewed individual images and coded various task activities, work
postures, and equipment use. Distribution (% of time) of task activities and work postures were
computed.
Phase 4: EMG
Physical exposure was evaluated using surface electromyography (EMG) technique. This non-
invasive method monitors minuet electricity corresponding to muscle activity to represent the
effort exercised by the muscles under surveillance. Surface EMG electrodes were placed on the
left and right trapezius muscles on the shoulders, as well as the forearm flexor digitorum
superficialis and extensor digitorum muscles of the dominant forearm (Figure 1). Cables carrying
the signal ran from the electrodes to a battery-powered transmitter wore or carried by the
participant. Signals were transmitted telemetrically to a receiver connected to a laptop computer
for data collection and storage. EMG was sampled at 1,000 Hz (1,000 data points for second per
muscle).
A calibration procedure was performed (Bao, Mathiassen, & Winkel, 1995, Bao, Silverstein, &
Cohen, 2001) to obtain the maximal muscle activity level (MVC – maximal voluntary
contraction) of each of the tested muscles. Muscle activities during work were expressed in terms
of percentage of the MVC (%MVC), which is a measure of the muscle load relative to the
employee’s capacity of a particular muscle. Percent of MVC (%MVC) is a relative risk indicator
of muscle loading. Work muscle activities were measured for up to two hours during a period of a
typical normal work day. At the same time, a video camera was used simultaneously so that
muscle activities could be associated to the various activities.
EMG data were bandpass filtered between 30 and 250 Hz, and smoothed using the root-mean-
square method with a 100 ms window, for later analysis. The EMG distribution was calculated
according to the amplitude probability distribution function (APDF). The static, median and peak

8
muscle load levels were obtained corresponding to the 10th
(P10), 50th
(P50) and 90th
(P90)
percentiles of the APDF curve (Jonsson, 1982).
Figure 1. Placement of EMG electrodes
The main job duty for Claims Initiation employees is to enter two paper forms into the computer
database: Report of Accident, and Employer Report of Accident. These forms are mostly
handwritten and submitted by parties (physicians, employers, injured employees, or designated
representatives) involved in a worker’s compensation claim. The difficulty of the document
(considering handwriting legibility, wordiness, etc.) was subjectively rated by the CI participant
using a five-point scale (integers 1 being the easiest to 5 being the most difficult) upon entry
completion.
Right TrapeziusLeft Trapezius
Right Forearm Extensor(Extensor Digitorium)
Right Forearm Flexor(Flexor Digitorum Superficialis )

9
Results
Phase 1: Survey
Nineteen participants (16 women and 3 men) filled out the
survey. Three were from Bill Processing, 7 from Claims
Initiation, and 9 from Imaging (2 Team A, 1 Team B, 3 Team
C, 1 Team D, 1 Team N, and 1 Team O). They were all right
handed. Their job tenure with Support Services ranged from
less than one year to 26 years.
“Data entry” and “document analysis, review, and correction”
are the major tasks on an average workday as reported by the
participants (Figures 2-3 and Table 2). Both tasks involved
intensive computer work. Imaging colleagues had a slightly
even spread time among tasks, compared to their colleagues in
the other two groups.
Table 2. Specific tasks spent on an average workday (mean and range in parentheses) comparison between the 2009
(Bao et al. 2009) and the current study.
Job activity 2009* 2015
Data entry 61 (range:5-100)% 51 (range: 0-100) %
Document analysis, review, correction N/A 21 (0-80) %
Document preparation (pre-scanning) N/A 12 (0-60) %
Keying 64 (5-100) % (see Fig. 2 below)
Telephone 3 (0-20) % 4 (0-20) %
* Activities not mutually exclusive, therefore not adding up to 100%.
Figure 2. Self-reported percent of time spent on various tasks on a typical day among three study groups.
0
20
40
60
80
100
Claims, dataentry
Documentanalysis,
review, corr.
Documentprep
Filing,sorting
Scanning,copying
Calls, emails Admin Other
Per
cen
t in
a d
ay
Task
Average percent of time spent on tasks by work group LNI support services, 2015
Bill Processing Claims Initiation Imaging
Key findings of Phase 1
* All participants reported at
least one musculoskeletal
complaint.
* Most common
musculoskeletal complaints
were on shoulders, followed
by necks, and low back.
* Employees were generally
satisfied with their jobs.

10
Figure 3. Percent of time in a typical day spent on keying reported by study participants of the three units.
The department issues standard computer accessories (monitor, keyboard, and mouse) for each
employee. However, the internal safety and health program allows each individual to obtain
necessary alternatives (e.g., ergonomics keyboard, vertical or trackball mouse) or additions
(document holder, wrist rest, footrest, etc.) based on individual requests or ergonomics
assessment recommendations. The participants reported their accommodations (Table 3). More
than half of the participants (10 out of 19) tilted their keyboards using the keyboard’s legs.
Among the 10, only one chose to tilt the bottom up (negative tilt), while the other nine tilted the
top up (positive tilt).
Table 3. Equipment used by participants
Equipment 2009 2015
Ergonomics keyboard 16% 37%
Trackball or vertical mouse 5% 37%
Dual monitors 90% 95%
Document holder 58% 58%
Wrist rests 58% 16%
Footrest 74% 47%
Headset 26% 42% (5 out of 12)
All participants (100%) reported having at least one musculoskeletal problem (pain, itching,
stiffness, burning, numbness, or tingling) in the last year. All percentages were greater than those
reported in 2009 (Table 4). Different from the 2009 study, where neck problems were most
frequently reported, the current survey showed that shoulder issues were most common. When
asked about the most serious or troublesome body part among which they reported, six of the
participants indicated “shoulder”, and four selected “hand/wrist”. “Neck” was named by only two
participants as the most troublesome issue.
0
1
0
2
1
0
1
5
2 2
3
2
0
1
2
3
4
5
6
1-25% 26-50% 51-75% 76-100%
Nu
mb
er
of
staf
f
Percent of time spent keying
Percent of time spent keying, LNI support services, 2015
Bill Processing
Claims Initiation
Imaging

11
Table 4. Prevalence rates (% participants) of reported musculoskeletal problems in the last 12 months
Body part 2009 2015
Neck 42% 58%
Shoulder 37% 79%
Elbow/forearm 16% 32%
Hand/wrist 11% 53%
Low back 37% 42%
Lengths and consequences due to the reported musculoskeletal problems varied by body parts
(Table 5). Many of the participants who experienced musculoskeletal problems also had the
problems in the last 7 days. More than half visited a doctor for their problems. Problems with the
low back, shoulders and neck have caused workers missing working days. Few occasions were
the workers who had problems assigned to light duty activities. Some workers who had problems
reported certain activities could make their problems worse. The most often reported activities
included prolonged sitting (especially in static/awkward postures), and keying in static/awkward
posture.
Table 5. Characteristics and consequences of the reported musculoskeletal problems.
Measure Neck
(n=11)
Shoulders
(n=15)
Elbows/
Forearms
(n=6)
Hands/
wrists
(n=10)
Low back
(n=8)
Problem lasted for ≥ 6 months 36% 20% 0 0 0
Problem lasted for 1 week to 6 months 0 13% 50% 30% 13%
Problem lasted for 1 day to 1 week 18% 20% 0 10% 25%
Problem lasted for < 1 day 45% 47% 50% 60% 63%
Still experience problem in last 7 days 82% 67% 83% 50% 38%
Believed as results from the current job 64% 80% 67% 80% 63%
Visited doctor for the problem 91% 47% 50% 70% 50%
Missed work due to the problem
(vs. 2009)
18%
(13%)
13%
(25%)
0
(0)
10%
(0)
50%
(29%)
Assigned to light duty activity (count) 0 0 1 2 1
Although not part of musculoskeletal concerns, the survey asked about their eye health that may
be related to using the computer monitors. Ninety-five percent of them reported some or all of
these symptoms in the past year: eyestrain (sore or tired eyes) (13), dry or watery eyes (7), blurred
vision (5), burning, itching or red eyes (5), glare sensitivity (4), or double vision (3). Eleven of
them reported headaches that further stemmed from these eye issues. In the immediate past 7 days
of the survey, seven participants reported moderate level of eye discomfort, while 8 and 4
reported little and none eye discomfort, respectively.
The job stress results were similar to those from the 2009 study (Table 6). Most workers rarely or
only occasionally felt conflicting demands with co-workers and short of time finishing their work,
and very often felt that their supervisors were willing to listen to their work-related problems.

12
However, the percentage of feeling of being able to influence aspects of their jobs declined
significantly over time. Overall, most participants were satisfied with their current job situations.
Table 6. Psychosocial aspects of jobs, current (vs. 2009) percentage of 19 responses. Green cells represent
improvements (combined responses on one side of the scale) of more than 10 percentage points (roughly equivalent
of 2 answers) compared to the 2009 results. Red cells indicate declines (worse) by more than 10 percentage points.
A: Job Stress
Rarely Occasionally Sometimes Fairly often Very often
How often are you faced with conflicting demands of people you work with?
84% (56%) 5% (11%) 5% (33%) 5% (0%) 0% (0%)
How often is your supervisor willing to listen to your work-related problems?
5% (0%) 5% (0%) 5% (12%) 26% (18%) 58% (71%)
How often does your job leave you with too little time to get everything done?
37% (50%) 26% (6%) 16% (22%) 11% (17%) 11% (6%)
B: Influence
Very little Little Moderate amount
Much Very much
How much influence do you have over the amount of work you do?
37% (17%) 26% (11%) 11% (22%) 16% (33%) 11% (17%)
How much influence do you have over the availability of materials you need to do your work?
11% (28%) 26% (0%) 32% (17%) 21% (44%) 11% (11%)
How much do you influence the policies and procedures in your work groups?*
39% (22%) 33% (6%) 11% (22%) 11% (39%) 6% (11%)
How much influence do you have over the arrangement of furniture and other equipment at your workstation?*
11% (18%) 17% (0%) 22% (18%) 44% (47%) 6% (18%)
* One participant did not answer.
C: Satisfaction
Not at all Not too much
Some what Quite a bit Very much
How satisfied are you with the amount of influence you have over the decisions that affect your job?
11% (11%) 11% (11%) 37% (28%) 37% (28%) 5% (22%)
All in all how satisfied are you with your job?
5% (11%) 0% (6%) 21% (17%) 37% (11%) 37% (56%)

13
Phase 2: Computer activity
This phase consisted of both the subjective daily
discomfort report and the objective registered
computer activity summary. Participants reported an
average of 5.7 hours of computer work with a 95%
confidence interval (CI) of 5.4 - 5.6 hours. This was
about 1 hour more than that reported in the 2009 study,
when the average and 95% CI was 4.8 and 4.6 - 5.0
hours, respectively.
The computer activity monitoring software
(RSIGuard), on the other hand, registered 3.7 (95%CI:
3.4 - 4.0) hours of computer use (Table 7). These
numbers were about the same as in the 2009 study. In
the current study, the registered hours were lower than
the subjective estimates. There was a moderate correlation between the self-reported computer use
time and RSIGuard registered hours (Pearson correlation coefficient: 0.6).
Computer use varied significantly by individual and work unit. Claims Initiation colleagues spent
an average of 5.6 hours on computers a day, while Bill Processing, Admin, and Imaging spent
3.8, 3.8, and 3 hours, respectively (Table 8). Computer use hours were consistent during the 10-
day period.
Table 7. The mean (standard deviation) registered computer activity per day in the 10-day period.
Parameter 2015 2009 Means
Computer use time (hours) 3.7 (±1.6) 3.8
Computer use proportion (% shift) 46.1 (±20) N/A
Keyboard use time (hours) 2.7 (±1.4) 3.4
Keyboard use proportion (% shift) 33.7 (±18) N/A
Mouse use time (hours) 2.3 (±1.1) 3.4
Mouse use proportion (% shift) 29.6 (±14) N/A
Total keystrokes 11,226 (±8109) 22,000
Total mouse clicks 3,467 (±1864) 1,067
The continuous keyboard and mouse use times were defined as the cumulative durations in which
two consecutive keystrokes/mouse clicks occur within a 20 second interval. Mouse clicks
included not only mouse clicks but also mouse moves and wheel-spins. These corresponded to 2.7
hours of continuous keyboard use and 2.3 hours of continuous mouse use, both lower than the
2009 levels. The participants averaged 11,226 keystrokes a day, about half of the 2009 number at
22,046 (Table 7). The total number of mouse clicks was 3467, almost three times more than in
2009 (1,067) per shift.
Key findings of Phase 2
* On average, each employee spent
about 3.7 hours on the computer
per shift.
* Longer computer use was
associated with higher shoulder and
low back discomfort ratings,
although discomfort levels were
generally low.
* Work postures when performing
data entry work on the computer
were mostly of low risks.

14
Table 8. Average registered computer activity by units.
Parameter Admin Bill
Processing
Claims
Initiation
Imaging
Computer use time (hours) 3.8 3.8 5.6 3.0
Computer use per shift 50% 46% 70% 37%
Keyboard use time (hours) 1.9 3.2 4.1 2.1
Keyboard use per shift 26% 39% 51% 26%
Mouse use time (hours) 3.2 1.6 2.8 2.4
Mouse use per shift 41% 20% 35% 31%
Total keystrokes 12170 13088 16674 8092
Total mouse clicks 5075 2769 3568 3505
If comparing only the Bill Processing colleagues between the two studies (Table 7 right column
and Table 8 middle column), the computer use time and keyboard use times were about the same.
The mouse use time decreased to about half (3.4 hours in 2009 and 1.6 hours in 2015). However,
keystrokes decreased, and the mouse clicks increased between the two studies.
Overall for all participants in the Support Services, the neck outranked the right shoulder for the
daily discomfort ratings, with a scale 0 - 10, followed by low back, during the 10-day period
(Table 9). Analysis of variance revealed that there was no significant report day effect. It means
that the discomfort report was consistent among the 10 days for each participant. Bill processing
employees had the highest discomfort among all participants for all body parts. Further, all
discomfort ratings were higher than in 2009, when the identical self-reported discomfort scale
(Borg 10-scale) was used.
Table 9. Daily body discomfort survey results
Body part 2015
Overall
2015
Imaging
2015
Bill Processing
2009
Bill Processing
Neck 1.75 1.76 3.28 0.51
Left shoulder 0.68 0.23 2.12 0.49
Right shoulder 1.44 0.97 3.59 1.55
Left elbow 0.40 0.11 1.28 0.04
Right elbow 0.86 0.31 2.59 0.12
Left hand 0.60 0.29 1.31 0.08
Right hand 1.30 0.93 2.76 0.23
Low back 2.09 2.35 3.05 0.43
Computer use parameters correlated to body discomfort ratings differently (Table 10). The total
computer hours in a day significantly correlated to discomfort ratings for all body parts except for
the neck and right hand/wrist. More keyboard use (both key strokes and length of time) was
associated with higher the discomfort for various body parts. However, mouse use (clicks and
length of time) affected the right and left side differently. Lower discomfort ratings were reported
on the left shoulder, left elbow, and left hand/wrist when the total mouse uses were greater.

15
Table 10. Correlations between body discomfort rating and computer use parameters, Pearson correlation coefficient
– including all data.
Body part Computer
Hours
Total Key
Strokes
Total Mouse
Clicks
Keyboard
Hours
Mouse
Hours
Neck 0.09 -0.00 -0.16 -0.06 -0.15
Left shoulder 0.20* 0.30* -0.28* 0.31* -0.27*
Right shoulder 0.23* 0.23* 0.00 0.17 -0.09
Left elbow 0.20* 0.31* -0.22* 0.28* -0.21*
Right elbow 0.20* 0.27* -0.11 0.21 -0.15
Left hand/wrist 0.30* 0.37* -0.26* 0.38* -0.19*
Right hand/wrist 0.15 0.27* -0.33* 0.22* -0.28*
* Significant at p < 0.05.

16
Phase 3: Task and posture analysis
On average, 499 (range: 468-509) time-lapse pictures on a given day were taken for each of the
12 participants. Pictures were analyzed frame by frame. The work activity and postures in each
frame were coded for analysis. When the participant was not observed in a picture, the activity
was not assigned, and marked as absent from picture.
Sitting averaged 65% per shift (Table 11). Standing averaged 9%, while 26% of the times the
participants were outside of the camera view.
Table 11. Distribution of task activities, keyboard/mouse use, and work postures based on video observations (% of
the shift)
Activity 2015 Observation % of shift (2009 result if available)
Sitting 65.4 (66.1)
Standing 8.7
Absent 25.9 (33.9)
Data Entry 42.6 (40.3, including viewing screen)
Viewing screen 1.6
Pre-scanning 9.7 (4.0, including sorting)
Hand sorting 0.3
Conversation/meeting 3.2 (3.5)
Using the phone 2.8 (1.3)
Reading/writing at desk 2.5 (9.5)
Micro breaks 1.9 (4.2)
Other 5.5 (3.9)
Posture at each body part was categorized into three risk levels, with 0 being no risk, 1 being
some risk, and 2 being high risk. Levels 1 and 2 were combined to represent any risks observed
and reported in Table 12. Neck had the highest observed risks among all body parts.
Two special risks were assessed: wrist placed on the desk edge (contact stress), and sitting with
the back leaning forward (back not supported). Wrist-on-desk-edge was observed among four
participants (ranging from one to 57 occurrences), while back leaning forward was observed on
average eight times per shift for all participants (ranging from 0 – 35 occurrences).
Table 12. Average (minimum – maximum) observed risks as percent of shift assessed at 7 body parts.
Body Part Risks observed % of shift (min-max)
Neck 21.0 (range: 3.4-52.4)
Back 3.0 (0-15.8)
Torso 2.3 (0-9.0)
Left arm 1.0 (0-4.3)
Right arm 1.6 (0-10.5)
Left hand 0.6 (0-2.0)
Right hand 2.2 (0-12.3)

17
Phase 4: EMG
An average of 73 (range 20 – 131) minutes of
EMG data was analyzed for each participant.
Three different muscle activity levels of the
amplitude probability distribution function
(APDF) analysis were performed and they
represented (1) static loading (10th
percentile
level or P10), (2) median loading (50th
percentile level or P50), and (3) peak loading
(90th
percentile level or P90) for the particular
period of interest. Altogether, 13 participants
with 111 distinct tasks and durations were
identified and analyzed. Summary results are
listed in Table 13.
Table 13. Overview of muscle activity study results. Numbers represent mean EMG (standard deviation) for the four
muscles. They were normalized to respective muscular maximum voluntary contraction (MVC), expressed as
%MVC.
Muscle Static
P10
Median
P50
Peak
P90
Extensor digitorum 10.7 (±6.4) 23.5 (±11.7) 46.4 (±22.8)
Flexor digitorum superficialis 3.7 (±3.2) 9.1 (±5.2) 29.6 (±12.7)
Trapezius (left) 4.1 (±3.9) 8.4 (±6.6) 15.7 (±11.0)
Trapezius (right) 4.1 (±3.9) 10.4 (±8.9) 20.9 (±17.6)
Muscle activities varied for different tasks (Figure 2). Extensor muscle at the forearm had the
highest static loading while performing computer and other manual work. However, computer
work had lower shoulder muscle static loading compared to sorting and all other activities.
Among the three units (Bill Processing, Claims Initiation, and Imaging), the static loading on the
muscles from computer work was different. Employees at Claims Initiation had the highest,
compared to their colleagues, static loading on wrist flexor, extensor, and left trapezius (Figure 3).
Bill Processing employees had higher static loading at the right trapezius than their colleagues.
For Claims Initiation employees, their job was mostly to enter two kinds of documents into the
computer database: Report of Accident (ROA), and Employer Report of Accident (EROA).
Document type was only significant on time to completion, as ROA was a longer form. Muscle
activity (all static, median, and peak measures) was not affected by document type.
Key findings of Phase 4
* Static loading on forearm extensor and
shoulder muscles were the main concerns.
* Static muscle loading was related to
computer work.
* Difficulty of the hand-written documents
for manual data entry was related to
forearm flexor and shoulder muscle
loadings.
* Sit-stand function was not related to any
upper body muscle loading measures.
18
Figure 2. Mean static muscle activities (%MVC) when performing different activities. “Other Manual” included
stamping, applying mailing labels, and other minor office tasks not included in the four defined categories. “All
Others” included remaining activities, such as reading during breaks, reaching for water, snacking, conversation with
colleagues, etc.
Figure 3. Static loading at four muscles for computer work among three Support Services units.
Extensor Flexor
%M
VC
L Trapezius R Trapezius
2
0
4
6
8
10
0
12
2

19
On the other hand, document quality score was found to affect muscle loading. During analysis,
the 1-5 document scores were further consolidated into two levels: <3 or >=3. Such separation
made the two groups of roughly equal size. There are 13 cases with scores <3 and 11 cases with
>=3 among recorded EROA completions, and 8 cases for each level for ROA completions. When
entering EROAs, the static loading on the left trapezius and the flexor were statistically
significant higher when the document difficulty level was equal or greater than 3, compared when
the level was lower than 3 (Table 14). Other muscles shared similar document difficulty effect,
although not at a statistical significant level. Regardless of document type, longer completion time
was associated with higher difficulty score (Table 15). Median loading at the left trapezius were
significantly higher when the document score was equal or greater than 3.
Table 14. Static loading on the four muscles by document difficulty level and document type.
Document Muscle Level Mean (%MVC)
SD (%MVC)
Difference (%MVC)
t-test p-value
EROA L. Trapezius >= 3 7.10 2.86 5.29 5.39 0.00
< 3 1.81 1.93
R. Trapezius >= 3 4.17 1.68 0.12 0.11 0.92
< 3 4.06 3.61
Flexor >= 3 6.34 3.71 3.15 2.32 0.03
< 3 3.19 2.80
Extensor >= 3 12.10 2.77 3.79 1.89 0.08
< 3 8.31 6.59
ROA L. Trapezius >= 3 3.55 1.51 1.55 1.48 0.16
< 3 1.99 2.54
R. Trapezius >= 3 3.62 2.30 1.56 1.67 0.12
< 3 2.06 1.28
Flexor >= 3 5.46 4.04 2.14 1.13 0.28
< 3 3.32 3.54
Extensor >= 3 12.32 2.72 5.43 2.09 0.07
< 3 6.89 6.82

20
Table 15. Median loading on the four muscles and the average data entry time, by document difficulty level and
document type.
Document Muscle Level Mean (%MVC)
SD (%MVC)
Difference (%MVC)
t-test p-value
EROA Time (min) >= 3 3.80 1.73 1.16 2.13 0.05
< 3 2.64 0.55
L. Trapezius >= 3 11.25 4.27 7.67 4.90 0.00
< 3 3.58 3.41
R. Trapezius >= 3 8.24 2.88 -1.10 -0.46 0.65
< 3 9.35 8.05
Flexor >= 3 13.47 5.92 4.26 1.90 0.07
< 3 9.21 5.09
Extensor >= 3 23.11 9.80 4.02 1.30 0.22
< 3 19.09 3.33
ROA Time (min) >= 3 9.90 3.83 3.32 2.23 0.05
< 3 6.58 1.78
L. Trapezius >= 3 6.62 1.89 3.08 2.20 0.05
< 3 3.55 3.48
R. Trapezius >= 3 9.52 5.15 5.41 2.81 0.02
< 3 4.12 1.78
Flexor >= 3 12.41 5.63 4.38 1.65 0.12
< 3 8.03 4.95
Extensor >= 3 20.48 7.47 0.68 0.15 0.89
< 3 19.80 10.88
All study participants were equipped with sit-stand workstations. They were free to adjust and
chose posture during data collection. Four participants were observed performing their work in
both sitting and standing postures. Their EMG data were further analyzed. Due to the lack of any
statistical power from such a small sample size, only the summary data are presented (Table 16).
For participant L13, standing resulted in higher (difference of more than 1% MVC) static and
median muscle activity than sitting. For the remaining three participants, the posture effect was
mixed. Many measures show negligible differences.
Table 16. Muscle static and median loading (in %MVC) at the four muscles among the four study participants while
continuously sitting and standing performing identical tasks. Participant L11 had two comparable pairs, separated due
to different tasks. Bold numbers indicate higher values (difference more than 1 %MVC) between the two postures.
ID Posture Time (s) Left Trapezius Right Trapezius Flexor Extensor
Static Median Peak Static Median Peak Static Median Peak Static Median Peak
L09 Sitting 581 0.7 11.7 21.4 10.1 24.2 41.4 1.0 6.0 13.2 9.2 15.7 27.4
L09 Standing 528 8.5 12.0 16.9 11.8 19.3 29.0 0.8 4.1 11.7 7.4 13.9 25.3
L11 Sitting 519 0.6 1.4 3.6 2.3 5.0 11.7 1.4 5.7 27.7 1.6 12.2 30.8
L11 Standing 545 0.3 0.8 2.4 1.8 3.6 10.7 1.9 5.8 28.6 3.4 14.5 32.3
L11 Sitting 338 0.6 1.7 3.2 1.7 3.0 5.3 1.0 5.3 35.3 0.7 14.1 29.9
L11 Standing 380 0.1 0.7 2.0 1.7 3.3 5.5 1.4 5.5 25.8 2.4 13.1 31.1
L12 Sitting 566 0.9 3.2 7.8 0.5 7.2 19.3 1.7 3.3 8.5 1.8 16.3 31.9
L12 Standing 2384 0.8 1.9 3.9 0.4 2.5 10.0 1.7 3.8 9.2 6.0 19.7 35.7
L13 Sitting 366 3.1 7.6 16.8 0.6 2.4 4.4 0.7 2.4 12.1 11.9 18.6 28.6
L13 Standing 183 8.6 11.7 17.3 3.1 5.2 7.7 3.6 9.6 28.0 24.6 31.9 42.2

21
Other observations
Throughout our data collection, we observed the workstation setups against common ergonomics
principles. Most were in acceptable compliance. Some minor issues were observed and listed in
below.
No stretching nor moving muscles regularly, except for two who used RSIGuard
reminders.
Bending neck to look down at items on the desk for extended periods. (reminder given)
Palm on the desk edge while typing. (Contact stress issue. recommended to move
keyboard back)
Staring at computer screens with little or no movements for extended periods. (Static
neck/shoulder loading issue. Recommended to have frequent micro-breaks and move
neck/shoulder muscles)
While sitting, leaning forward without using seat back for support. (back loading issue,
recommend to have propter chair fitting, and awareness training to workers on the
importance of back support).
Monitor distance being too far, font size being too small. Eye exam and font size
adjustment were recommended.
Duel monitor placements being not optimal. (Awkward neck posture issue: recommend to
have an ergonomics consultation from internal safety on monitor placement).
Glare through windows, or lighting from the ceiling. (Vision and neck posture issues.
Screen brightness adjustment recommended.)

22
Discussion and conclusions
Work activities
In the 1991 study, it was found that employees sat approximately 80% of the work shift and 60%
of the work shift was spent on actual keying. The observations showed that the employees sat at
their desk about 65% of the time, while 44% of the work shift was spent for data entry, both
similar to the 2009 study (Table 11). Absence from the work area was minimal in the 1991 study,
then about 34% in the 2009 study. In the current study, it was about 26%, slightly less than 2009
(Table 11). The amount time spent on computer work did not seem to change between 2009 and
2015 via time-lapse observations. However, the software registered less keyboard and mouse use
times, less keystrokes, and more mouse clicks (Tables 7 and 8). This suggests that the technology
advances during this period reduced the keystroke demands. It could be that the automation
(OCR) reduces the burden for typing, and many data entry functions are replaced by mouse
clicking and dragging rather than typing.
The 44% of time spent on computers corresponded to about 3.7 hours computer use per work shift
of 8.5 hours according task analysis (Table 11). This figure was about the same as the RSIGuard
registrations (Table 7). Of particular note is that Claims Initiations employees registered the
highest computer use time, keyboard use time, total keystrokes, and total mouse clicks. Their jobs
are traditional data entries from hard document copies. Self-reported survey also support this
finding, as the employees were aware of their times on the computer (Figures 2 and 3). It is
possible that this was related to the high complaint rate at the hand area among this unit (5 out of
7 reported positive hand pain).
Organizational concerns
In general, most participants in the current study were satisfied with their current job situations
(Table 6C). Job stress maintained in a steady (and somewhat improving) trend compared to 2009
(Table 6A). However, the area of concern came from their influences over the decisions that
affected their jobs (Table 6B). Similar job satisfaction results were found in both the 1991 and
2009 studies when employees reported at a relatively high level. However, the sense of lack of
influence seemed to become worse over time.
On the positive side, in 1991, most employees indicated that they rarely or only occasionally
faced conflicting demands or did not have enough time to get everything done. It was now 90%
reporting negative about conflicting demands. Supervisory support in listening to work-related
problems was encouraging. The majority of employees (84%) in the current study reported their
supervisors were willing to listen to their work-related problems (Table 6A).
Workers’ perceptions and self-reported musculoskeletal symptoms
Of concern were the self-reported musculoskeletal symptoms.
Based on baseline survey (N=19), the prevalence rates of reported
musculoskeletal problems in the last 12 months for all body parts
alarmingly increased from the 2009 (Table 4) and 1991 (values not
shown) studies. Currently, almost 4-fifth of the respondents had
Self-reported shoulder
problem, as the major
concern, worsened
drastically compared
to both the 1991 and
2009 studies.

23
shoulder discomfort of various degrees in the last 12 months. Similar trends were reported by the
13 participants in the 10-day Phase 3 study. For Bill Processing employees, the discomfort scores
for all eight body parts were higher than in 2009 (Table 9). The shoulder problems might still be
due to the relatively high static shoulder muscle loading as discussed previously. The static
shoulder muscle loading during work should be addressed in order to reduce the shoulder
problems. Some suggestions will be discussed later. Some of the self-reported musculoskeletal
problems might not be related to the current work conditions as some of them were first
experienced many years ago (Table 5).
About half of the survey respondents provided write-in comments (n=10). They were related to
prolonged sitting/standing (2), the monotonous specific task (2), chairs and back supports (2), and
the need of medical help (2), and question unrelated (2). As a comparison, in the 1991 study,
significant concerns were mostly about poor workstations. There seemed to have been extensive
changes in terms of ergonomic improvements of workstations.
Physical exposures
According to Jonsson (1982), a median trapezius EMG load level at or below 10%MVC, and a
peak level at or below 50%MVC should be considered safe for this particular muscle. The
measured trapezius muscle loading at the median and peak levels (Table 13) seemed to be not a
health concern.
Currently there are no definitive thresholds for the forearm muscles in the scientific literature.
Therefore, it is difficult to determine if the current exposures for these muscles were of health
concern. However, the physical exposures, in terms of muscle loading, were affected by tasks and
by units. Claims Initiations employees exhibited the greatest loading in the forearm for their
routine tasks (Figure 3). Combined with the nature of their duties that they had to work on the
computer (keying and mousing) for the most time (Figure 3 & Table 8) compared to their
colleagues, special care should be given to prevent or reduce damaging exposures.
Hand/Wrist
For the wrist extensors, the static muscle loading measures exceeding the current guidelines.
Longer computer and keyboard hours, and more keystrokes were correlated to higher hand/wrist
pain reports (Table 10).
All of these could be the results of improper hand postures, or the lack of proper adjustment of the
keyboard, or the slow rate of adaptation of ergonomics keyboards. From 2009 to 2015, the
percentage of ergonomics keyboards increased from 16% to 37%. Most employees still used
standard mice. While switching these accessories may not directly result in decreased muscle
activities, but it remains a viable solution for employees complaining about hand/wrist pain or
discomfort. As suggested in the previous 2009 report, negative keyboard tilt may reduce forearm
muscle strain. We did not observe any adaptation of this strategy. Employees experience
hand/wrist pains are encouraged to try this solution. Keyboard risers are available to achieve this
strategy.

24
Shoulder
High static muscle loading can usually cause muscle fatigue, which is believed to be linked to the
development of musculoskeletal disorders (Armstrong, 1993). The relatively high right shoulder
static muscle loading of 2%MVC in the current study (Table 13) was likely to be responsible for
the prevalent 79% shoulder complaints (Table 4). As part of their regular tasks, sorting caused the
greatest shoulder loading as measured by EMG (Figure 2). Although activities categorized as “All
Others” also resulted in higher shoulder activities, they were more irregular actions occurred in a
much lower frequency and of shorter durations (e.g., reaching for facial tissues or objects, fixing
hair, taking a snack bite).
Subject pain report on the shoulders correlated to also RSI registered computer hours, keystrokes,
and for the left shoulder, keyboard hours (Table 10). Of particular note is that left shoulder
complaints were negatively correlated to mouse use (Table 10). This means that the more the
mouse uses, the less the reported left shoulder pain. This is reasonable as all of the study
participants were right handed. While operating the mice using the right hand, the left hand, and
hence the left shoulder, could have a temporary relief. This side effect was observed also for
elbow and hand/wrist. Therefore, if the more tasks can be performed using mice, the more likely
the left upper extremity can experience more relief from the muscle loading.
Document Effect
Because the Claims Initiation employees have to transfer
hand written forms into computer database, one of the main
tests in the study was to examine if the document difficulty
(considering the legibility of the handwriting, the words used,
etc.) affected muscle strains, both static and median measures.
Based on their reported difficulty ratings, document type
(ROA and EROA) was not a significant factor, but difficulty
level was for several muscles. This means that document type had no influence on muscle
activity. On the other hand, the higher the document difficulty level, the higher the mean muscle
activities (Table 14). The differences were statistically significant for left Trapezius, static loading
at the Flexor with EROA documents, and median loading at the right Trapezius for ROA
documents. Due to the small sample size, some of the differences did not achieve a statistical
significance level. However, the trends applied both for static and median muscle loading on the
four muscles were observable.
Workstations
Generally speaking, the workstations in the current study
were, to a large extent, in compliance with the currently
accepted general office ergonomics guidelines. This was
quite different in the 1991 study when a substantial
number of chairs were found to be broken (SHARP, 1991).
Accessories were available to employees who were in need
to perform the jobs (Table 3). Through observation, there
were very few occasions when awkward postures resulted
* Workstations were generally
in compliance of current
ergonomics computer
workstation guidelines.
* Further improvements
beyond the guidelines may be
needed to reduce static
loadings and lower shoulder
and neck complaints.
For Claims Initiation
employees, no matter which
document type, the more
difficult the writing, the
higher the muscle static
and median loadings.
25
from furniture or tasks were identified. The only issue worth mentioning was about the neck.
Neck bending was observed mostly when the employees were not looking at the computer
monitors. Instead, manual work such as pre-scanning, reading documents, or handling
mails/applying mailing labels required the employees to look down on the desk. While for the
short bouts of occurrence, it might not be a concern. However, if such task lasts for an extended
period, for example, up to an hour, the bending posture would cause excessive loading to the neck
and shoulder area.
Sit-Stand Workstation
Since the agency introduced the sit-stand workstation to all employees, at the time of the study,
every participant was equipped with one. Based on the observation phase, sitting constituted the
majority of the shift, at 65% (Table 11). While being absent may underestimate both sitting or
standing, standing only took place in less than 9% of the observed photos. Prolonged sitting has
been identified as a contributing factor for low back pain. With the current back pain prevalence
at 42% (Table 4), alternating sitting and standing could be a solution to address this issue.
Among the participants, four used the standing function. EMG data were collected while they
performed their tasks in both sitting and standing postures, and were analyzed. While examining
only the static and median levels, there was no trend for different users at the four muscle sites
(Table 16). That is, the current practice of sitting or standing did not offer any perceivable and
general benefits for different users. One obvious reason is that there are currently no established
guidelines about the amount (or proportion) of standing, the frequency of changes, timing of
changes, etc. available for the users or for the ergonomist professionals. The users decide when
they wish to stand, how often they stand, and the standing desk height. Therefore, it is not
surprising that there is a lack of observable benefits.
During the computer work, we also found relatively high static loading on the forearm extensor
muscle (Table 13 and Figure 2). The reason for that is probably the hand/wrist posture when using
the keyboard. Most workers had their keyboard in a conventional slope position (i.e., the further
side of the keyboard is slightly higher than the closer side of the keyboard, or positive slope). This
keyboard position requires the hand/wrist assumes a slightly extended posture, which would result
in higher static extensor muscle loading. Simoneau et al. (2003) studied the effort of different
keyboard positions on the arm muscle activities and found that a slightly negative slope of
keyboard placement could improve the hand/wrist extension posture and reduce forearm extensor
muscle loading. Therefore using a negative slope keyboard placement might be an option for
employees who want to reduce their forearm static loading.
It was noted that more than 37% of the employees used various ergonomics keyboards or split
fixed angle keyboard (Table 3) among the 19 participants in study phase 1, increased from 16% in
2009. The small sample size did not have sufficient statistical power to prove the ergonomics
keyboard and hand/wrist pain association, other studies have shown that split fixed angle
keyboard could place the hand/wrist closer to a neutral posture (Baker & Cidboy, 2006, Marklin,
Simoneau, & Monroe, 1999). Therefore, offering employees ergonomic keyboards might be a
solution to hand/wrist concerns.
We observed that employees had their hand/arm supported (not hanging loose by the side) on the
desk, which reduced the shoulder loads. As a result, their hands and wrists had to rest on the desk.

26
Only a fraction of the participants used special wrist rests (16%), compared to 58% in 2009.
Prolonged direct contact between the wrist and a hard surface is not recommended, as the soft
tissues on the palm side of the wrist can be easily stressed. This is a possible cause for hand/wrist
pain. Several participants were even spotted when they lay their wrists at the desk edge during the
phase 3 study. They were directly informed about this risk immediately.
One other risk that was identified during the observation phase was that several participants
tended to lean forward close to the monitors, leaving the back unsupported. Upon notifications
and further informal interviews, they cited the reason as habitual, unaware of this habit, or glare
on the screen. Suggestions from the research team were provided to the individuals. However, it
demonstrated that the awareness of office ergonomics principles may not reach all employees in a
department. Certain refresher or training/awareness sessions may be necessary.
Conclusions
Workers spent about the same time on computers as identified from our previous studies,
with less keystrokes but more mouse clicks.
Self-reported shoulder problems were significant, with 79% of participants having pain in
the past 12 months. These could be caused by relatively high static loading on the
shoulder region. Reducing shoulder static loading should be the focus in future ergonomic
improvement efforts.
Employees were generally satisfied with their current job conditions.
Work postures and workstation layout were generally acceptable according to current
office ergonomics guidelines.
Sit-stand workstations were available, but were used only by a small proportion of the
study participants. Among the 4 who were observed using both standing and sitting
functions, the effect on muscle loading of the shoulder and forearm regions was not
significant. There were no guidelines about the proper use or setup for the users after the
desks were installed.
For employees who had to enter hand-written documents into computer database, the
document difficulty had some effect on muscle activities (loading).
Further ergonomic improvements may need to go beyond the current office ergonomics
guidelines. For example:
o Ergonomics awareness training.
o RSIGuard usage.
o Proper employee task assignments in order to balance the workload.
o Better hand/arm supports and alternative keyboard and mouse use.
Acknowledgment
We appreciate the cooperation of the employees and management in Support Services throughout
this project. Jennifer Marcum assisted in participant recruitment, data collection preparation, and
initial survey data processing.

27
References
Aarås, A. (1987). Postural load and the development of musculo-skeletal illness. Scand J Rehab
Med, Supplement No 18.
Anderson, A. M., Mirka, G. A., Joines, S. M. B., & Kaber, D. B. (2009). Analysis of alternative
keyboards using learning curves. Human Factors, 51, 34-45.
Armstrong. (1993). A conceptual model for work-related neck and upper-limb musculoskeletal
disorders. Scand J Work Environ Health, 19, 73-84.
Baker, N. A., & Cidboy, E. L. (2006). The effect of three alternative keyboard designs on forearm
pronation, wrist extension, and ulnar deviation: a meta-analysis. Am J Occup Ther, 60(1),
40-49.
Bao, S., Mathiassen, S. E., & Winkel, J. (1995). Normalizing upper trapezius EMG amplitude:
comparison of different procedures. 5, 251-257.
Bao, S., Silverstein, B., & Cohen, M. (2001). An electromyography study in three high risk
poultry processing jobs. International journal of industrial ergonomics, 27, 375-385.
Borg, G. A. V. (1982). Psychophysical bases of perceived exertion. Med Sc Spt Exer, 14(5), 377-
381.
Hägg, G., & Suurküla, J. (1988). Relations between electromyographic signs of fatigue during
work and occupational myalgia in the shoulder region. In (pp. 321-324): Elsevier Science
Publisher.
Jonsson, B. (1982). Measurement and evaluation of local muscular strain on the shoulder during
constrained work. Journal of Human Ergology, 11, 73-88.
Marklin, R. W., Simoneau, G. G., & Monroe, J. F. (1999). Wrist and forearm posture from typing
on split and vertically inclined computer keyboards. Hum Factors, 41(4), 559-569.
McAtamney, L., & Corlett, E. N. (1993). RULA: a survey method for the investigation of work-
related upper limb disorders. Applied Ergonomics, 24, 91-99.
SHARP (1991). Cumulative Trauma Disorders in Claims Initiation, Baseline Findings (Technical
Report No. 16-1-1991). Olympia, Washington: SHARP, Washington State Department of
Labor & Industries.
SHARP (1992). Cumulative Trauma Disorders in Claims Initiation - Follow-Up Preliminary
Report (Technical Report No. 16-3-1992). Olympia, Washington: SHARP, Washington
State Department of Labor & Industries.
SHARP (1993). Cumulative Trauma Disorders in Claims Initiation Follow-Up (Technical Report
No. 16-5-1993). Olympia, Washington: SHARP, Washington State Department of Labor
& Industries.
SHARP (2009). Ergonomic Evaluation at Bill Processing, Insurance Services – a Detailed Office
Ergonomics Case Study (Technical Report No. 62-2-2009). Olympia, Washington:
SHARP, Washington State Department of Labor & Industries.
Simoneau, G. G., Marklin, R. W., & Berman, J. E. (2003). Effect of computer keyboard slope on
wrist position and forearm electromyography of typists without musculoskeletal disorders.
Phys Ther, 83(9), 816-830.

28
Visser, B., de Korte, E., van der Kraan, I., & Kuijer, P. (2000). The effect of arm and wrist
supports on the load of the upper extremity during VDU work. Clin Biomech (Bristol,
Avon), 15 Suppl 1, S34-38.
Westgaard, R. H., & Winkel, J. (1996). Guidelines for occupational musculoskeletal load as a
basis for intervention: a critical review. Appl Ergon, 27(2), 79-88

Appendix A
Baseline Survey

Dear LNI Insurance Services Support Services colleague, SHARP is conducting an office ergonomics study for the whole Support Services group. Your participation will help us understand job stresses and identify potential problems. It is important for you to participate so we have an accurate picture of your work in Support Services, however participation is voluntary and you may stop at any time. The result from this study will allow us to make recommendations for improvements to work conditions in Support Services. Your individual responses are strictly confidential. Your supervisors will only be shown summary results, and will not see your individual responses. It should take less than 30 minutes to go through the survey. You can skip questions you do not wish to answer, with the exception of several critical questions noted by an asterisk (*). If you have any questions, concerns, or comments, feel free to email Jim Lin at [email protected].
1. SHARP Work and Health Survey questionnaires

1. Your logon id (aaaa235). We need to make sure that each survey is completed by a different person.
2. Age
3. Sex
4. Height
5. Weight
6. Are you right or left handed?
2. Personal Identification
*
Years
*
feet
inches
lbs
*
Male
nmlkj
Female
nmlkj
Right
nmlkj
Left
nmlkj
Both (I'm ambidextrous)
nmlkj
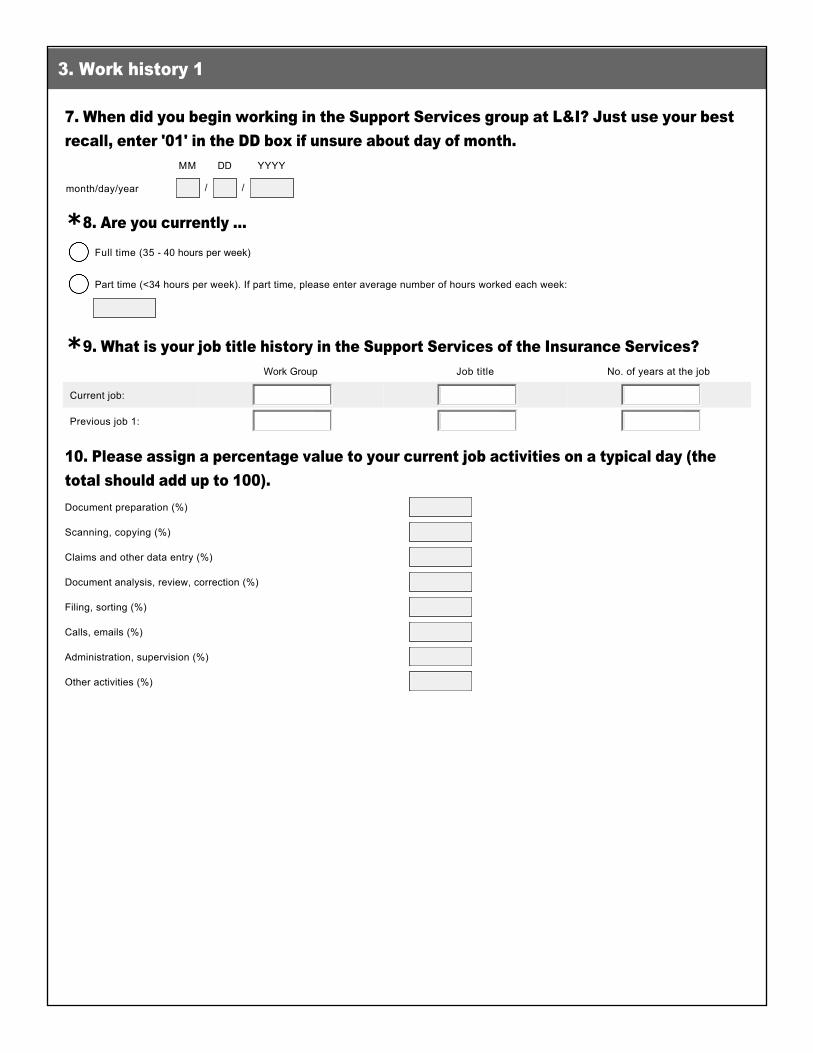
7. When did you begin working in the Support Services group at L&I? Just use your best recall, enter '01' in the DD box if unsure about day of month.
8. Are you currently ...
9. What is your job title history in the Support Services of the Insurance Services?
10. Please assign a percentage value to your current job activities on a typical day (the total should add up to 100).
3. Work history 1
MM DD YYYY
month/day/year / /
*
*Work Group Job title No. of years at the job
Current job: 6 6 6
Previous job 1: 6 6 6
Document preparation (%)
Scanning, copying (%)
Claims and other data entry (%)
Document analysis, review, correction (%)
Filing, sorting (%)
Calls, emails (%)
Administration, supervision (%)
Other activities (%)
Full time (35 40 hours per week)
nmlkj
Part time (<34 hours per week). If part time, please enter average number of hours worked each week:
nmlkj
Other

11. In most jobs, the workload varies from day to day. In your job, what percent of your days are heavy workload days ?
12. In the last year, how many weeks did you work more than 5 days or more than 40 hours?
13. Do you usually work in the office all day?
14. If yes how many times, on average, do you get up and away from your work station in a day?
4. Work history 2
weeks
# of times
0%
nmlkj
1 25%
nmlkj
26 50%
nmlkj
51 75%
nmlkj
76 99%
nmlkj
100%
nmlkj
Yes
nmlkj
No
nmlkj

15. Do you primarily key from hard copy?
16. What percent of your time do you spend keying?
17. Do you consider yourself a
5. Keyboard activity
Yes
nmlkj
No
nmlkj
0%
nmlkj
1 25%
nmlkj
26 50%
nmlkj
51 75%
nmlkj
76 99%
nmlkj
100%
nmlkj
touch (speed) typist
nmlkj
"hunt & peck" typist
nmlkj

18. Which keyboard do you currently use the most? Please use the pictures below for an example.
6. Keyboard use
Keyboard #1 Standard issue.
nmlkj
Keyboard #2 Ergonomics variation (e.g., curved, split, etc.)
nmlkj
Other keyboard (please specify)
nmlkj

19. How long have you used this keyboard?
20. Do you tilt the keyboard?
21. Have you used a different keyboard in the past year?
22. If Yes, why did you change?
23. How long did you use this other keyboard?
Years
Years
No, I did not adjust any keyboard legs and use it as is.
nmlkj
Yes, tilted top (function keys) up.
nmlkj
Yes, tilted bottom (the space key) up.
nmlkj
Yes
nmlkj
No
nmlkj
It's a recommended change (e.g., ergonomics assessment)
nmlkj
Equipment upgrade
nmlkj
Workstation/location change
nmlkj
I requested the change
nmlkj
Other (please specify)
nmlkj

24. What size of monitor(s) do you use? Standard IT issued monitor is 24". If you are not sure, the monitor model number may be found on the back of the monitor and the first 2 numbers typically indicate the size. For example, "P2412Hb" is for the standard issue 24" monitor.
25. If you are using two monitors, how are they positioned? Please refer to the figures below.
7. Monitor, eye health
Size
Monitor 1 (primary) 6
Monitor 2 6
A. Primary monitor at the direct front center, secondary monitor on the right
nmlkj
B. Primary monitor at the direct front center, secondary monitor on the left
nmlkj
C. Two monitors equally spaced on the left and the right.
nmlkj

26. When was the last time you had your eyes examined by a doctor or another health care provider?
1 year ago or less
nmlkj
2 3 years ago
nmlkj
4+ years ago
nmlkj
I've never had my eyes examined
nmlkj

27. In the past year, have you experienced any of the following symptoms while at your computer monitor? Choose all that apply.
28. Please rate the level of discomfort you have experienced because of these eyerelated symptoms during the past 7 days?
Headaches
gfedc
Sore or tired eyes (eye strain)
gfedc
Blurred vision
gfedc
Glare (light) sensitivity
gfedc
Dry or watery eyes
gfedc
Burning, itching, or red eyes
gfedc
Double vision
gfedc
None
nmlkj
Little
nmlkj
Moderate
nmlkj
Bad
nmlkj
Very bad
nmlkj
Almost unbearable
nmlkj
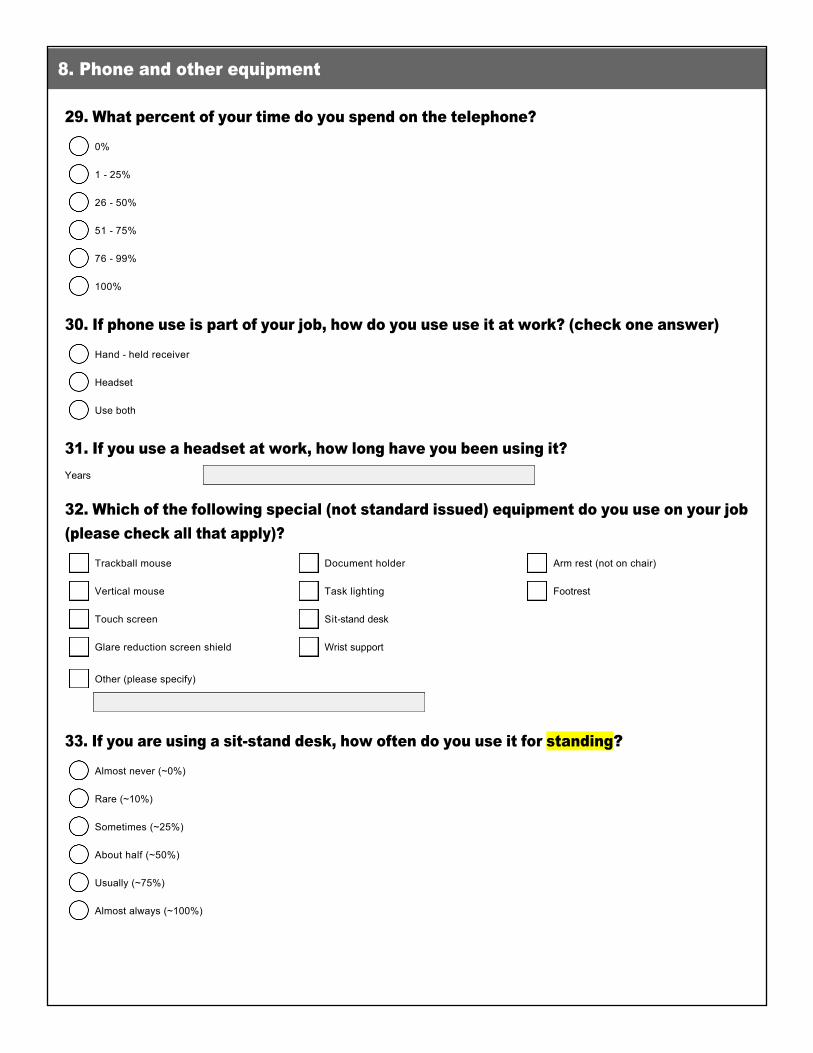
29. What percent of your time do you spend on the telephone?
30. If phone use is part of your job, how do you use use it at work? (check one answer)
31. If you use a headset at work, how long have you been using it?
32. Which of the following special (not standard issued) equipment do you use on your job (please check all that apply)?
33. If you are using a sitstand desk, how often do you use it for standing?
8. Phone and other equipment
Years
0%
nmlkj
1 25%
nmlkj
26 50%
nmlkj
51 75%
nmlkj
76 99%
nmlkj
100%
nmlkj
Hand held receiver
nmlkj
Headset
nmlkj
Use both
nmlkj
Trackball mouse
gfedc
Vertical mouse
gfedc
Touch screen
gfedc
Glare reduction screen shield
gfedc
Document holder
gfedc
Task lighting
gfedc
Sitstand desk
gfedc
Wrist support
gfedc
Arm rest (not on chair)
gfedc
Footrest
gfedc
Other (please specify)
gfedc
Almost never (~0%)
nmlkj
Rare (~10%)
nmlkj
Sometimes (~25%)
nmlkj
About half (~50%)
nmlkj
Usually (~75%)
nmlkj
Almost always (~100%)
nmlkj

The Neck
34. In the past year, have you had pain, stiffness, burning, numbness, or tingling in the area shown on this diagram more than three times or lasting more than one week?
9. Neck 1
Yes
nmlkj
No
nmlkj

35. How long does each episode of NECK problem usually last?
36. How often do separate episodes of this NECK problem occur in the past year?
37. Have you had this NECK problem in the past 7 days?
38. Have you ever had an accident or sudden injury to your NECK such as whiplash, a fracture, or sudden "slipped disc"?
10. Neck 2
less than 1 hour
nmlkj
1 hour to 24 hours
nmlkj
25 hours to 1 week
nmlkj
one week to 1 month
nmlkj
1 month to 6 months
nmlkj
more than 6 months
nmlkj
daily
nmlkj
once a week
nmlkj
once a month
nmlkj
every 23 months
nmlkj
every 6 months
nmlkj
Yes
nmlkj
No
nmlkj
Yes
nmlkj
No
nmlkj

39. Do specific activities make this NECK problem worse?
40. When did you first notice this NECK problem? Just use your best recall, enter 01 in the DD box if unsure about day of month.
41. What job did you have when you first noticed this NECK problem?
11. Neck 3
MM DD YYYY
month/day/year / /
Yes
nmlkj
No
nmlkj
If yes, please specify which activities:
Current job
nmlkj
Other job
nmlkj
If other, please specify:

42. Have you seen a doctor or other health care provider for this NECK problem?
43. If yes, how many times in the past year?
44. Have you missed any workdays because of this NECK problem?
45. If yes, how many days in the past year?
46. Have you spent any days doing light or restricted work because of this NECK problem?
47. If yes, how many days in the last year?
12. Neck 4
# of times
days
days
Yes
nmlkj
No
nmlkj
Yes
nmlkj
No
nmlkj
Yes
nmlkj
No
nmlkj

Shoulders
48. In the past year, have you had pain, stiffness, burning, numbness, or tingling in the area shown on this diagram more than three times or lasting more than one week?
13. Shoulder 1
Yes
nmlkj
No
nmlkj

49. How long does each episode of SHOULDER problem usually last?
50. How often do separate episodes of this SHOULDER problem occur in the past year?
51. Have you had this SHOULDER problem in the past 7 days?
14. Shoulder 2
less than 1 hour
nmlkj
1 hour to 24 hours
nmlkj
25 hours to 1 week
nmlkj
1 week to 1 month
nmlkj
1 month to 6 months
nmlkj
more than 6 months
nmlkj
daily
nmlkj
once a week
nmlkj
once a month
nmlkj
every 2 3 months
nmlkj
longer than every 3 months
nmlkj
Yes
nmlkj
No
nmlkj

52. Have you ever had an accident or sudden injury to your SHOULDER such as dislocation, fracture, or tendon tear?
53. Do specific activities make this SHOULDER problem worse?
54. When did you first notice this shoulder problem? Just use your best recall, enter 01 in the DD box if unsure about day of month.
15. Shoulder 3
MM DD YYYY
month/day/year / /
Yes
nmlkj
No
nmlkj
Yes
nmlkj
No
nmlkj
If yes, please specify

55. What job did you have when you first noticed this SHOULDER problem?
56. Have you seen a doctor or other health care provider for this SHOULDER problem?
57. If yes, how many times in the the past year?
16. Shoulder 4
# of times
Current job
nmlkj
Other job
nmlkj
If other, please specify:
Yes
nmlkj
No
nmlkj

58. Have you missed any workdays because of this SHOULDER problem?
59. If yes, how many days in the past year?
60. Have you spent any days doing light or restricted work because of this SHOULDER problem?
61. If yes, how many days in the past year?
17. Shoulder 5
# of days
# of days
Yes
nmlkj
No
nmlkj
Yes
nmlkj
No
nmlkj

Elbow/Forearm
62. In the past year, have you had pain, stiffness, burning, numbness or tingling in the area shown on this diagram more than three times or lasting more than one week?
18. Elbow/Forearm 1
Yes
nmlkj
No
nmlkj

63. How long does' each episode of ELBOW/FOREARM problem usually last?
64. How often do separate episodes of this ELBOW/FOREARM problem occur in the past year?
65. Have you had this ELBOW/FOREARM problem in the past 7 days?
19. Elbow/forearm 2
less than 1 hour
nmlkj
1 hour to 24 hours
nmlkj
25 hours to 1 week
nmlkj
one week to 1 month
nmlkj
1 month to 6 months
nmlkj
More than 6 months
nmlkj
daily
nmlkj
once a week
nmlkj
once a month
nmlkj
every 23 months
nmlkj
once more than3 months
nmlkj
Yes
nmlkj
No
nmlkj

66. Have you ever had an accident or sudden injury to your ELBOW/FOREARM such as dislocation, fracture, or tendon tear?
67. Do specific activities make this ELBOW/FOREARM problem worse?
68. When did you first notice this ELBOW/FOREARM problem? Just use your best recall, enter 01 in the DD box if unsure about day of month.
20. Elbow/forearm 3
MM DD YYYY
month/day/year / /
Yes
nmlkj
No
nmlkj
Yes
nmlkj
No
nmlkj
If yes, please specify activities:

69. What job did you have when you first noticed this ELBOW/FOREARM problem?
70. Have you seen a doctor or other health care provider for this ELBOW/ FOREARM problem?
71. If yes, how many times in the past year?
21. Elbow/forearm 4
# of times:
Current job
nmlkj
Other job
nmlkj
If other, please specify:
Yes
nmlkj
No
nmlkj

72. Have you missed any workdays because of this ELBOW/FOREARM problem?
73. If yes, how many days in the past year?
74. Have you spent any days doing light or restricted work because of this ELBOW/FOREARM problem?
75. If yes, how many days in the past year?
22. Elbow/forearm 5
# of days:
# of days:
Yes
nmlkj
No
nmlkj
Yes
nmlkj
No
nmlkj

Hand/Wrist
76. In the past year, have you had pain, stiffness, burning, numbness or tingling in the area shown on this diagram more than three times or lasting more than one week?
23. Hand/Wrist 1
Yes
nmlkj
No
nmlkj

77. How long does each episode of HAND/WRIST problem usually last?
78. How often do separate episodes of this HAND/WRIST problem occur in the past year?
79. Have you had this HAND/WRIST problem in the past 7 days?
80. Have you ever had an accident or sudden injury to your HAND/WRIST such as dislocation, fracture,or tendon tear?
24. Hand/wrist 2
less than 1 hour
nmlkj
1 hour to 24 hours
nmlkj
25 hours to 1 week
nmlkj
1 week to 1 month
nmlkj
1 month to 6 months
nmlkj
more than 6 months
nmlkj
daily
nmlkj
once a week
nmlkj
once a month
nmlkj
every 2 3 months
nmlkj
once more than 3 months
nmlkj
Yes
nmlkj
No
nmlkj
Yes
nmlkj
No
nmlkj

81. Do specific activities make this HAND/WRIST problem worse?
82. When did you first notice this HAND/WRIST problem? Just use your best recall, enter 01 in the DD box if unsure about day of month.
83. What job did you have when you first noticed this HAND/WRIST problem?
25. Hand/wrist 3
MM DD YYYY
month/day/year / /
Yes
nmlkj
No
nmlkj
If yes, please specify activities:
Current job
nmlkj
Other job
nmlkj
If other, please specify:

84. Have you seen a doctor or other health care provider for this HAND/WRIST problem?
85. It yes, how many times in the past year?
86. Have you missed any workdays because of this HAND/WRIST problem?
87. If yes, how many days in the past year?
88. Have you spent any days doing light or restricted work because of this HAND/WRIST problem?
89. It yes, how many days in the past year?
26. Hand/wrist 4
# of times:
# of days:
# of days:
Yes
nmlkj
No
nmlkj
Yes
nmlkj
No
nmlkj
Yes
nmlkj
No
nmlkj

Back
90. In the past year, have you had pain, stiffness, burning, numbness or tingling in the area shown on this diagram more than three times or lasting more than one week?
27. Back 1
Yes
nmlkj
No
nmlkj

91. How long does each episode of BACK problems usually last?
92. How often do separate episodes of this BACK problem occur in the past year?
93. Have you had this BACK problem in the past 7 days?
28. Back 2
less than 1 hour
nmlkj
1 hour to 24 hours
nmlkj
25 hours to 1 week
nmlkj
one week to 1 month
nmlkj
one month to 6 months
nmlkj
more than 6 months
nmlkj
daily
nmlkj
once a week
nmlkj
once a month
nmlkj
every 2 3 months
nmlkj
once more than 6 months
nmlkj
Yes
nmlkj
No
nmlkj

94. Have you ever had an accident or sudden injury to your BACK such as dislocation or fracture?
95. Do specific activities make this BACK problem worse?
96. When did you first notice this BACK problem? Just use your best recall, enter 01 in the DD box if unsure about day of month.
97. What job did you have when you first noticed this BACK problem?
29. Back 3
MM DD YYYY
month/day/year / /
Yes
nmlkj
No
nmlkj
Yes
nmlkj
No
nmlkj
If yes, please specify activities:
current job
nmlkj
other job
nmlkj
If other, please specify:

98. Have you seen a doctor or other health care provider for this BACK problem?
99. If yes, how many times in the past year?
100. Have you missed any workdays because of this BACK problem?
101. If yes, how many days in the past year?
102. Have you spent any days doing light or restricted work because of this BACK problem?
103. If yes, how many days in the past year?
30. Back 4
# of times:
# of days:
# of days:
Yes
nmlkj
No
nmlkj
Yes
nmlkj
No
nmlkj
Yes
nmlkj
No
nmlkj

104. Of the problems you have just described, which do you consider to be the most serious or troublesome?
105. For the problem that bothers you the most, how would you describe the pain or discomfort it has caused you during the past 7 days?
106. How would you describe the pain or discomfort this problem has caused you during your worst episode?
31. Symptom 1
I didn't report any problems above
nmlkj
Neck
nmlkj
Shoulder
nmlkj
Elbow/forearm
nmlkj
Hand/wrist
nmlkj
Back
nmlkj
None
nmlkj Little
nmlkj Moderate
nmlkj Bad
nmlkj Very bad
nmlkj Almost
unbearable
nmlkj
None
nmlkj Little
nmlkj Moderate
nmlkj Bad
nmlkj Very bad
nmlkj Almost
unbearable
nmlkj

The following questions ask you to describe your job in terms of specific qualities.
107. Work environment:
108. Influence: the degree to which you determine what is done by others and have freedom to determine what you do yourself.
109. Job satisfaction.
32. Psychosocial factors
Rarely Occasionally Sometimes Fairly often Very often
How often do you face conflicting demands from people you work with?
nmlkj nmlkj nmlkj nmlkj nmlkj
How often is your supervisor willing to listen to your workrelated problems?
nmlkj nmlkj nmlkj nmlkj nmlkj
How often does your job leave you with too little time to get everything done?
nmlkj nmlkj nmlkj nmlkj nmlkj
very little little moderate amount much very much
How much influence do you have over the amount of work you do?
nmlkj nmlkj nmlkj nmlkj nmlkj
How much influence do you have over the availability of materials you need to do your work?
nmlkj nmlkj nmlkj nmlkj nmlkj
How much do you influence the policies and procedures in your work groups?
nmlkj nmlkj nmlkj nmlkj nmlkj
How much influence do you have over the arrangement of furniture and other equipment at your workstation?
nmlkj nmlkj nmlkj nmlkj nmlkj
not at all not too some what quite a bit very much
How satisfied are you with the amount of influence you have over the decisions that affect your job?
nmlkj nmlkj nmlkj nmlkj nmlkj
All in all how satisfied are you with your job?
nmlkj nmlkj nmlkj nmlkj nmlkj

110. Anything you think would help relieving your symptoms or improving overall work health?
111. Is there anything else you would like to add?
33. Final stage
55
66
55
66

Thank you very much for your time. You can safely close this window.
34. Thank you!

Appendix B
Daily Discomfort Survey

This is a survey about your discomfort level (0 lowest discomfort, 10 highest discomfort). Please complete this at the end of your shift on each day during the study. Thanks for your cooperation. If you have any questions or concerns, please email Jim Lin at [email protected].
Your logon id:
How many hours do you think you spent on your computer today?
Please rate your discomfort level for each of the body parts:
NeckLeft
shoulderRight
shoulderLeft elbow
Right elbow
Left hand/wrist
Right hand/wrist
Low back
10 Maximum discomfort gfedc gfedc gfedc gfedc gfedc gfedc gfedc gfedc
9 Very, very high gfedc gfedc gfedc gfedc gfedc gfedc gfedc gfedc
8 Very high gfedc gfedc gfedc gfedc gfedc gfedc gfedc gfedc
7 High gfedc gfedc gfedc gfedc gfedc gfedc gfedc gfedc
6 gfedc gfedc gfedc gfedc gfedc gfedc gfedc gfedc
5 Somewhat high gfedc gfedc gfedc gfedc gfedc gfedc gfedc gfedc
4 Moderately high gfedc gfedc gfedc gfedc gfedc gfedc gfedc gfedc
3 gfedc gfedc gfedc gfedc gfedc gfedc gfedc gfedc
2 Light gfedc gfedc gfedc gfedc gfedc gfedc gfedc gfedc
1 Very light gfedc gfedc gfedc gfedc gfedc gfedc gfedc gfedc
0.5 Very, very light gfedc gfedc gfedc gfedc gfedc gfedc gfedc gfedc
0 No discomfort at all gfedc gfedc gfedc gfedc gfedc gfedc gfedc gfedc