Embed Size (px)
Citation preview
Office of Coast Survey
NOS Coastal and Surge ModelingNOS Coastal and Surge Modeling2011 NCEP Production Suite Review2011 NCEP Production Suite Review
Jesse C. FeyenCoast Survey Development Laboratory
Office of Coast Survey
NOAA Surge Model Development Efforts• Moving toward total water level modeling
– NOS & NWS adding tides to SLOSH– Implementing extratropical surge+tide system ESTOFS– Coupling surge (ADCIRC) and wave (WAVEWATCH
III®) models in the Nearshore Wave Prediction System
• Accelerating transition of research to operations– IOOS testbed for evaluating costs and benefits of
transitioning community models to operations– Investigating ensemble approaches to use multiple
surge models
Office of Coast Survey
Atlantic Extratropical Surge and Tide Operational Forecast System (ESTOFS)• Purpose
– Provide coastal water levels for coupling to WAVEWATCH III® (WW3) to drive Nearshore Wave Prediction System
– Compute surge with tides, astronomical tides, and subtidal water levels (surge only) for forecaster use
• Provides improvements in surge predictions– Incorporates the astronomical tides, lacking in ETSS
• Enables future development– River inflows
– Improved resolution of bays, inlets, and barrier islands
Office of Coast Survey
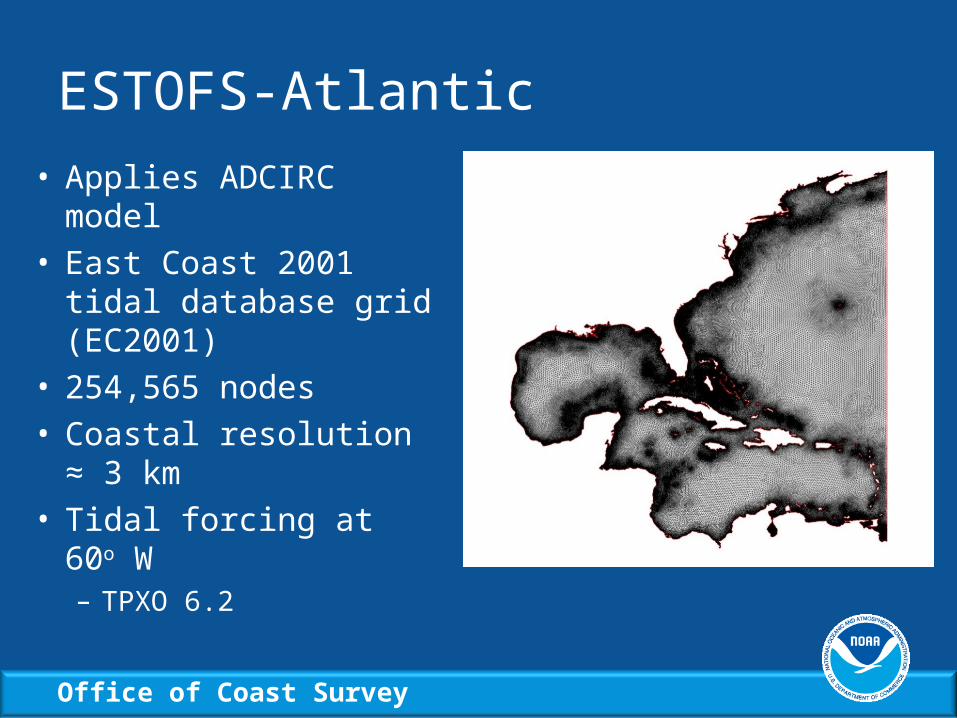
ESTOFS-Atlantic
• Applies ADCIRC model• East Coast 2001 tidal
database grid (EC2001)• 254,565 nodes• Coastal resolution ≈ 3
km• Tidal forcing at 60o W
– TPXO 6.2
Office of Coast Survey
Operational Set-up
• Mirrors WW3 set-up to support coupling• Surface forcing from GFS
– 10 m winds and sea level pressure every 3 hours
• Run cycle: 4 times per day alongside GFS & WW3– 00z, 06z, 12z, and 18z– 6-hr nowcast followed by 180-hr forecast
• Running experimentally in real-time now; fully operational April 2012
Office of Coast Survey
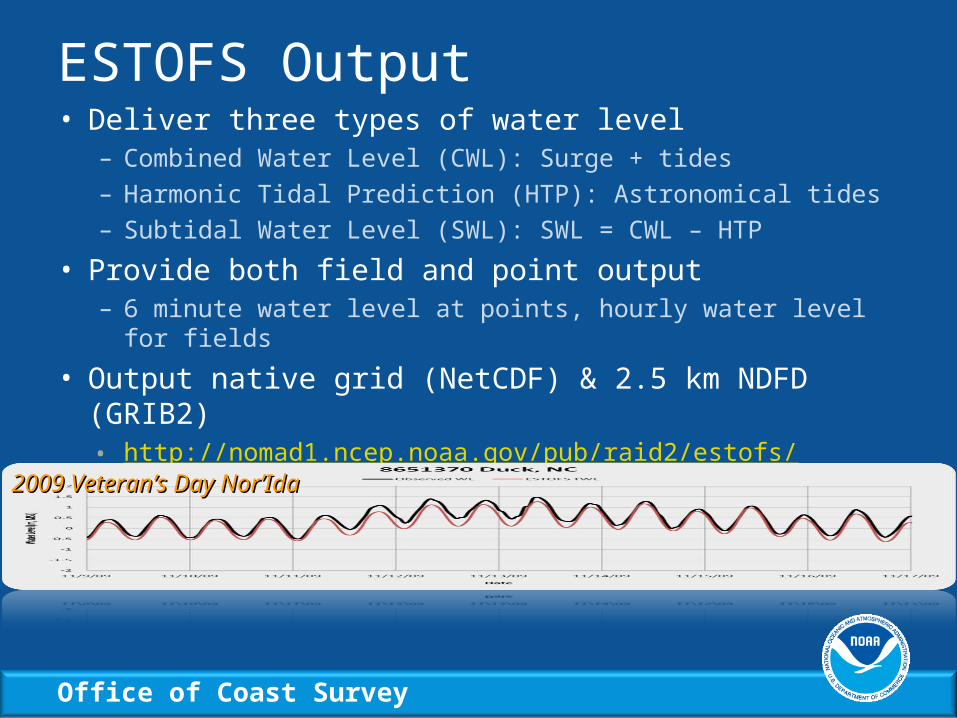
ESTOFS Output• Deliver three types of water level
– Combined Water Level (CWL): Surge + tides
– Harmonic Tidal Prediction (HTP): Astronomical tides
– Subtidal Water Level (SWL): SWL = CWL – HTP
• Provide both field and point output– 6 minute water level at points, hourly water level for fields
• Output native grid (NetCDF) & 2.5 km NDFD (GRIB2)• http://nomad1.ncep.noaa.gov/pub/raid2/estofs/
2009 Veteran’s Day Nor’Ida2009 Veteran’s Day Nor’Ida
Office of Coast Survey
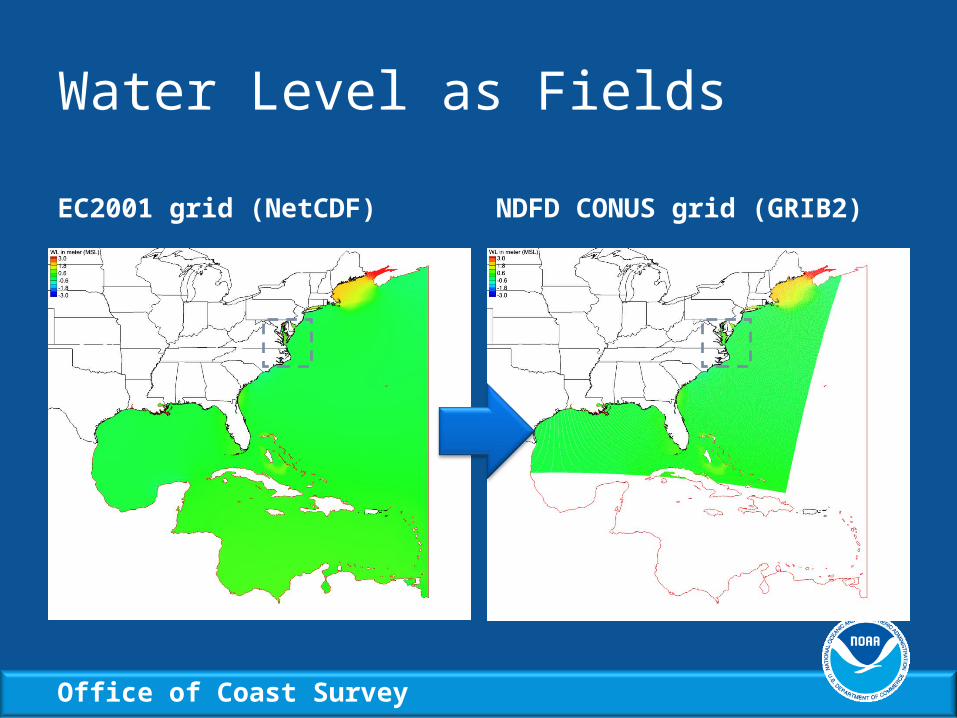
Water Level as Fields
EC2001 grid (NetCDF) NDFD CONUS grid (GRIB2)
Office of Coast Survey
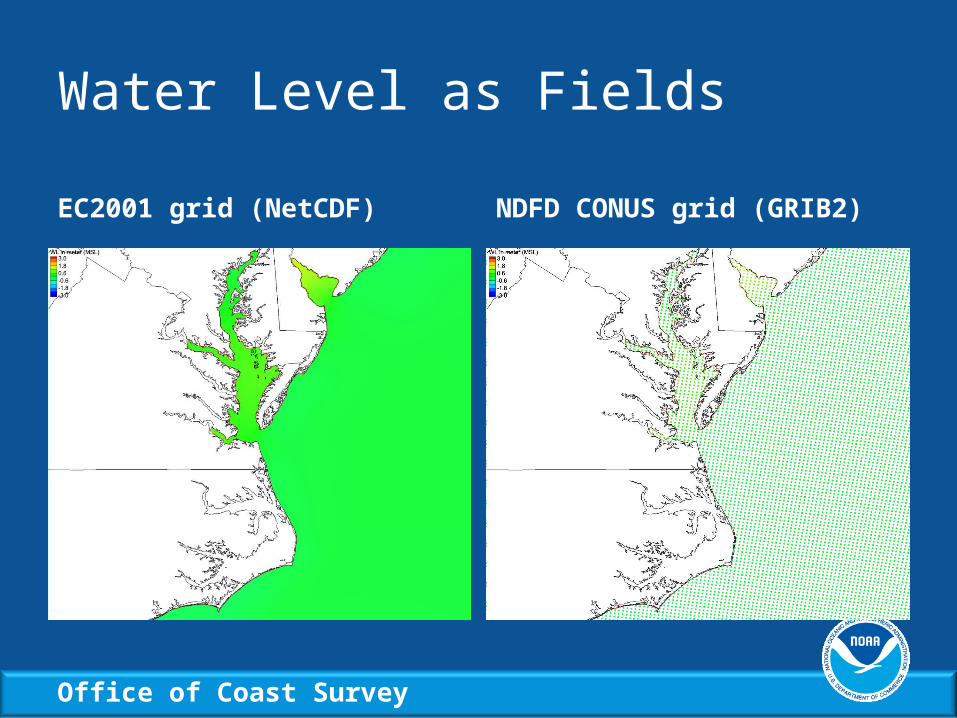
Water Level as Fields
EC2001 grid (NetCDF) NDFD CONUS grid (GRIB2)
Office of Coast Survey
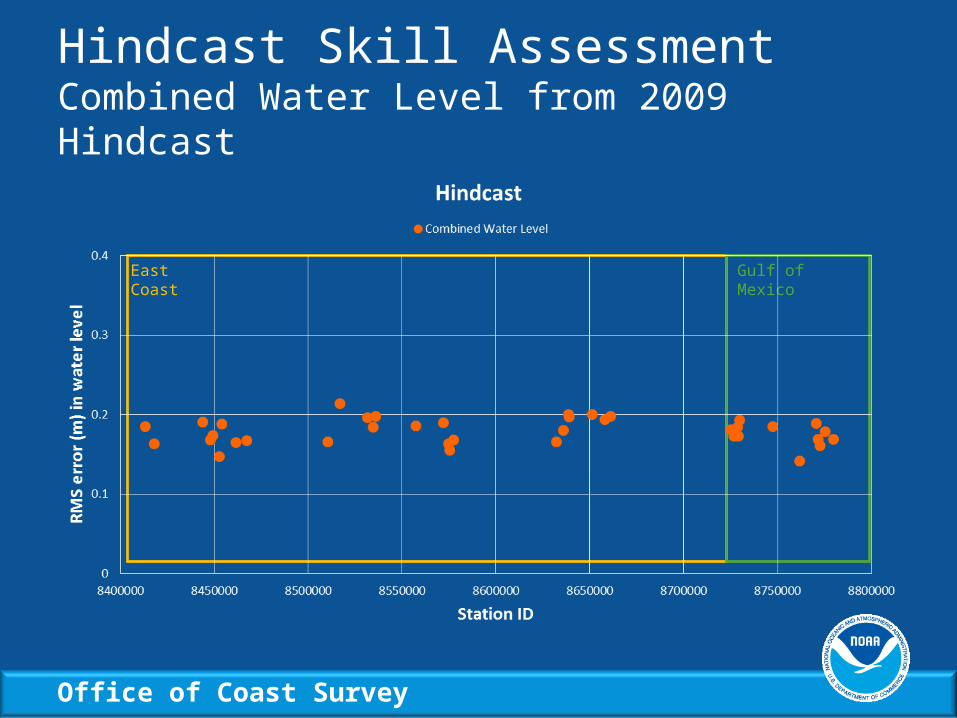
Hindcast Skill AssessmentCombined Water Level from 2009 Hindcast
East Coast Gulf of Mexico
Office of Coast Survey
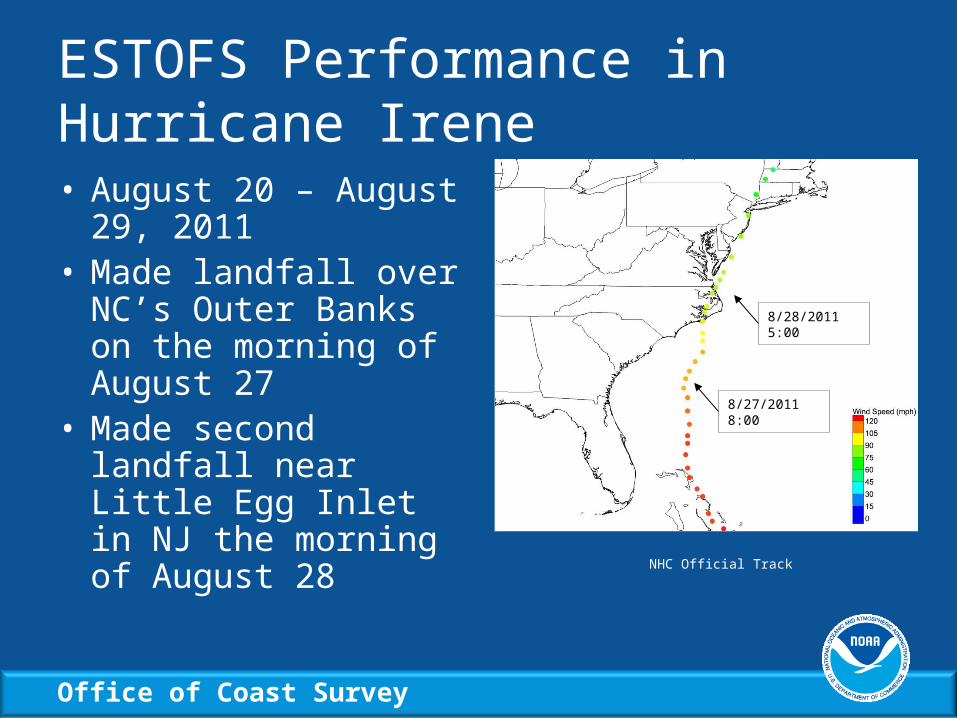
ESTOFS Performance in Hurricane Irene• August 20 – August
29, 2011• Made landfall over
NC’s Outer Banks on the morning of August 27
• Made second landfall near Little Egg Inlet in NJ the morning of August 28
8/27/2011 8:00
8/28/2011 5:00
NHC Official Track
Office of Coast Survey
Hurricane Irene Storm Surge
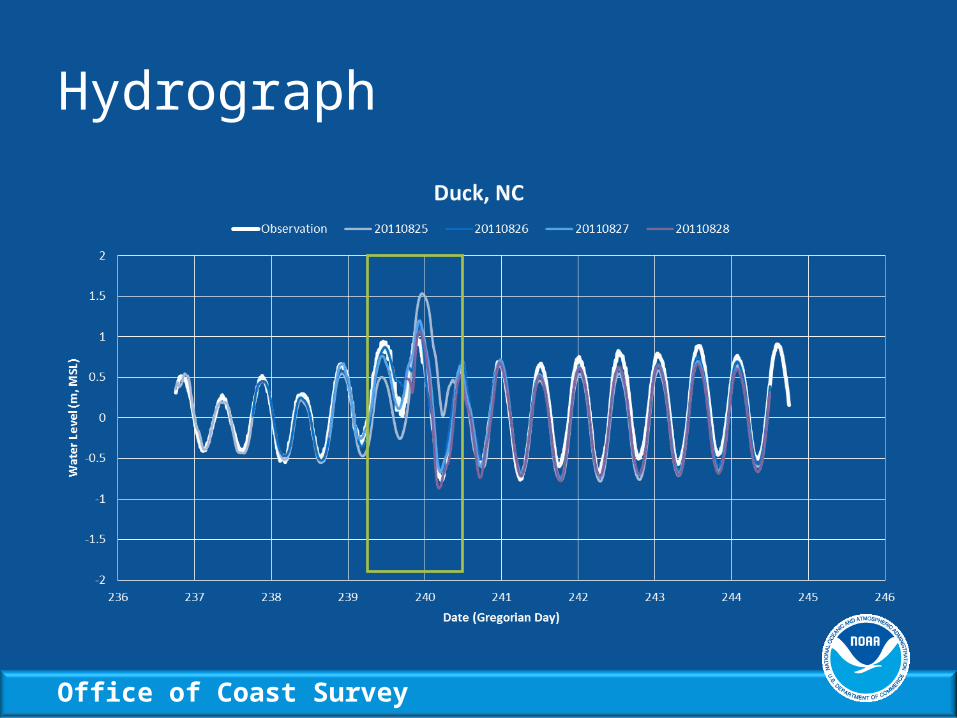
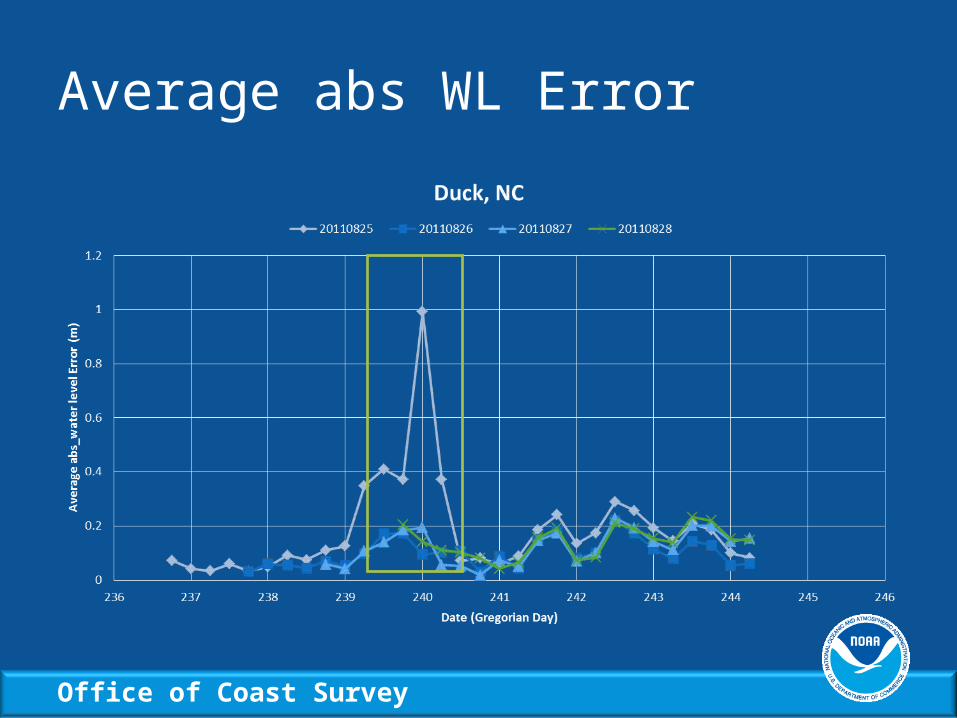
• Storm Surge– Along the North Carolina coast, surge values ranged from 0.3 m
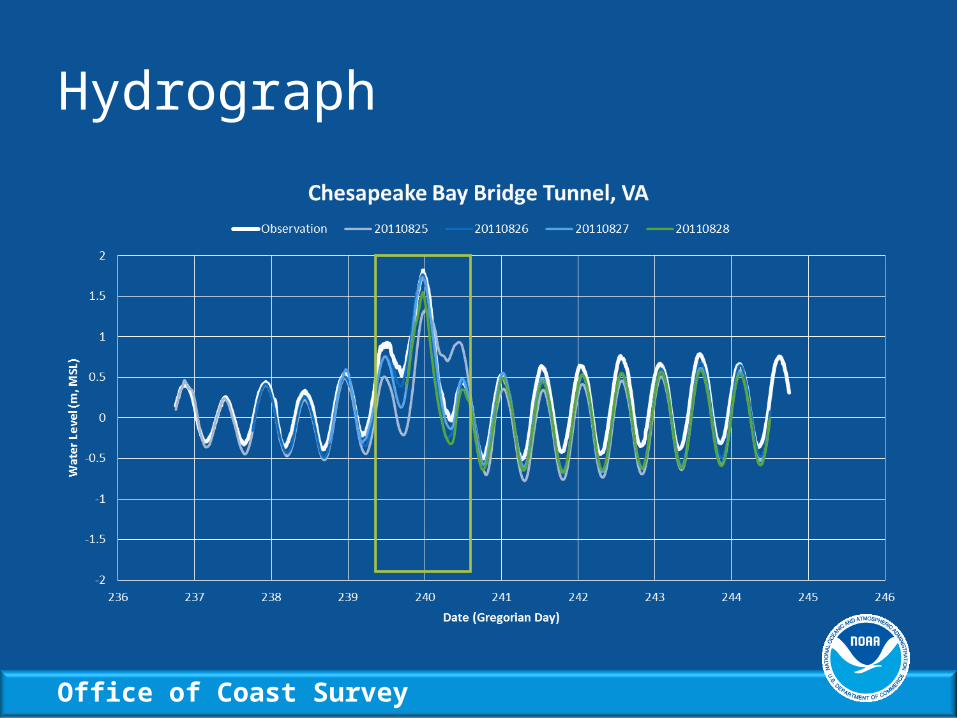
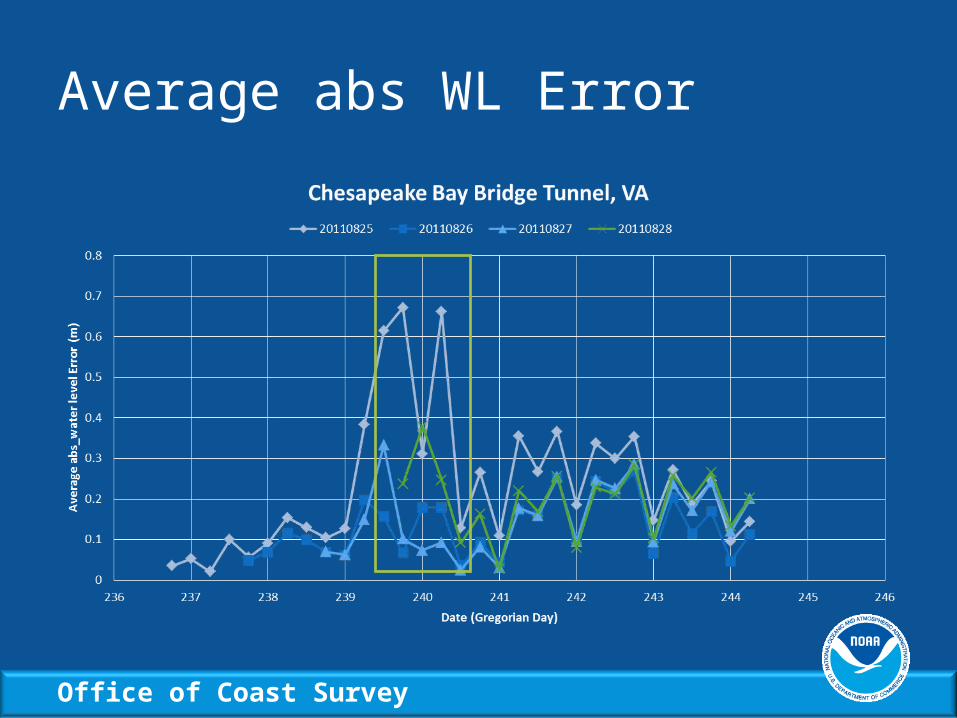
at Wilmington to about 1.0 m above predicted tide levels at Duck– Stations near the entrance to Chesapeake Bay recorded storm
surge values between 1.2 and 1.5 m above predicted tide levels– Stations from New York City to Woods Hole, MA, had maximum
storm surge between 1 and 1.6 m above tide levels
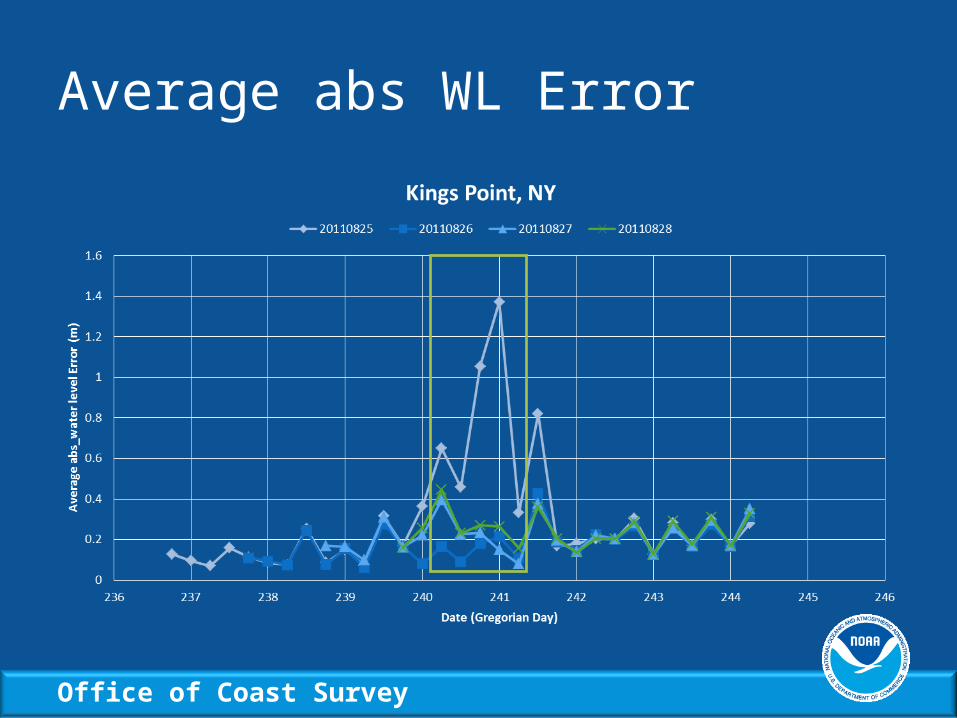
• Hydrographs and average abs water level errors– CO-OPS observation and ESTOFS Water Levels for the first
daily forecast cycle for 2011082500 through 2011082800
Office of Coast Survey
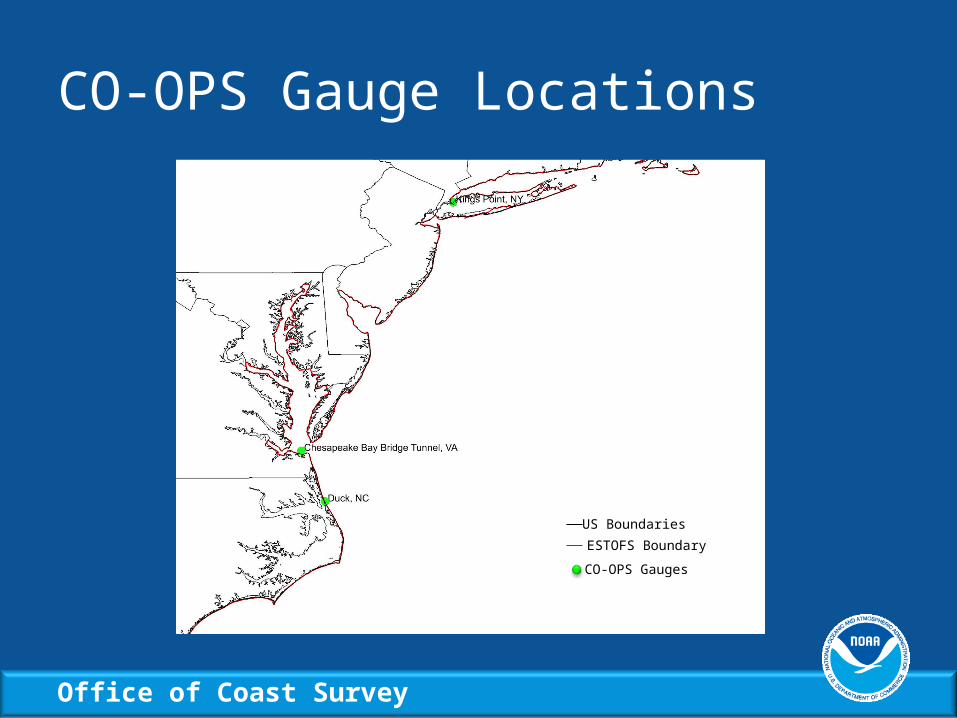
CO-OPS Gauge Locations
CO-OPS Gauges
US Boundaries
ESTOFS Boundary
Office of Coast Survey
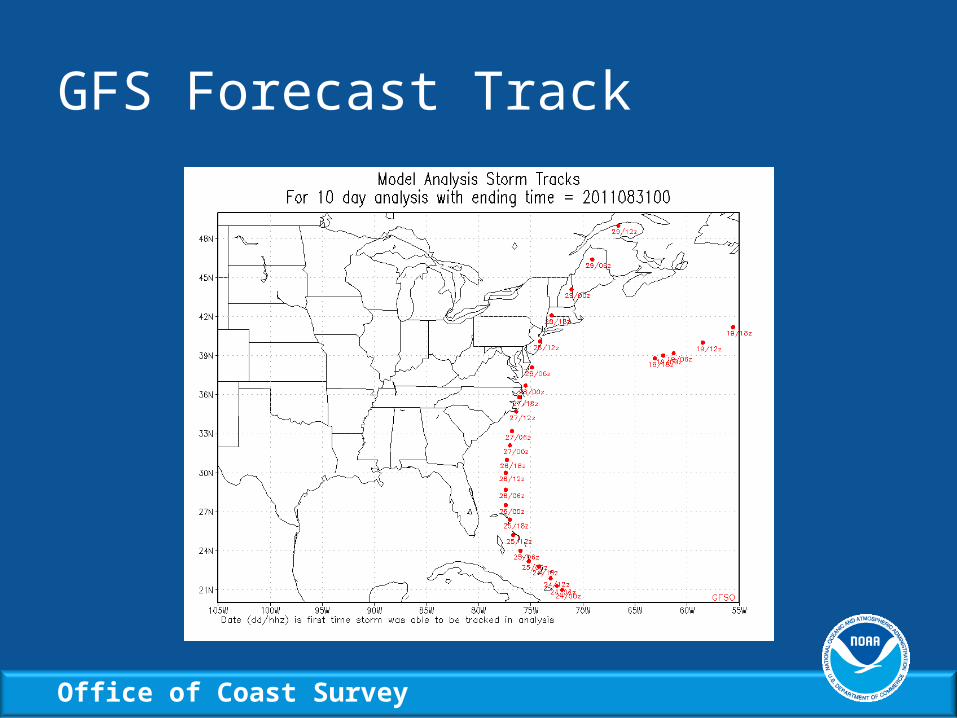
GFS Forecast Track
Office of Coast Survey
Hydrograph
Office of Coast Survey
Average abs WL Error
Office of Coast Survey
Hydrograph
Office of Coast Survey
Average abs WL Error

Office of Coast Survey
Hydrograph
Office of Coast Survey
Average abs WL Error
Office of Coast Survey
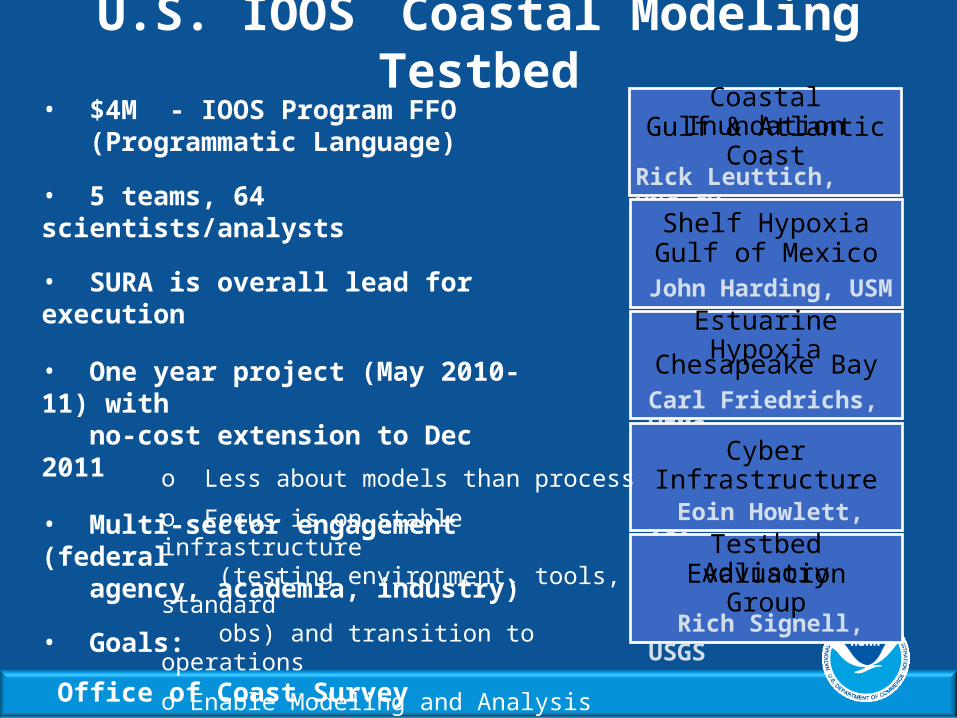
U.S. IOOS Coastal Modeling TestbedCoastal Inundation
Rick Leuttich, UNC-CH
• $4M - IOOS Program FFO (Programmatic Language)
• 5 teams, 64 scientists/analysts
• SURA is overall lead for execution
• One year project (May 2010-11) with no-cost extension to Dec 2011
• Multi-sector engagement (federal agency, academia, industry)
• Goals:
Gulf & Atlantic Coast
Shelf Hypoxia
John Harding, USM
Gulf of Mexico
Estuarine Hypoxia
Carl Friedrichs, VIMS
Chesapeake Bay
Cyber Infrastructure
Eoin Howlett, ASA
Testbed Advisory
Rich Signell, USGS
Evaluation Group
o Less about models than process
o Focus is on stable infrastructure (testing environment, tools, standard obs) and transition to operations
o Enable Modeling and Analysis subsystem
Office of Coast Survey
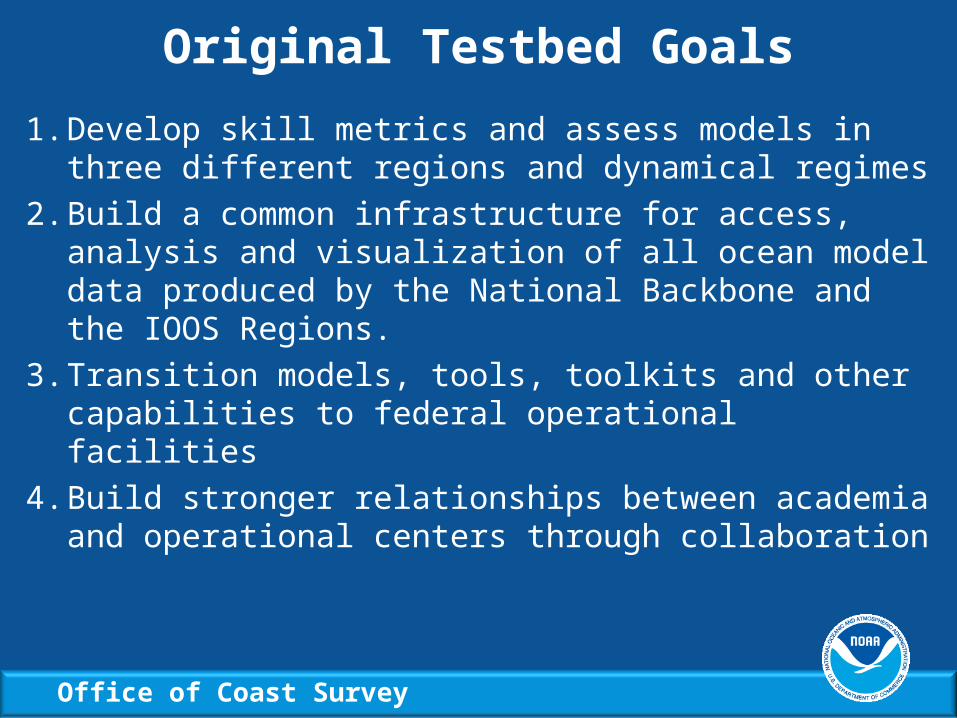
1. Develop skill metrics and assess models in three different regions and dynamical regimes
2. Build a common infrastructure for access, analysis and visualization of all ocean model data produced by the National Backbone and the IOOS Regions.
3. Transition models, tools, toolkits and other capabilities to federal operational facilities
4. Build stronger relationships between academia and operational centers through collaboration
Original Testbed Goals
Office of Coast Survey
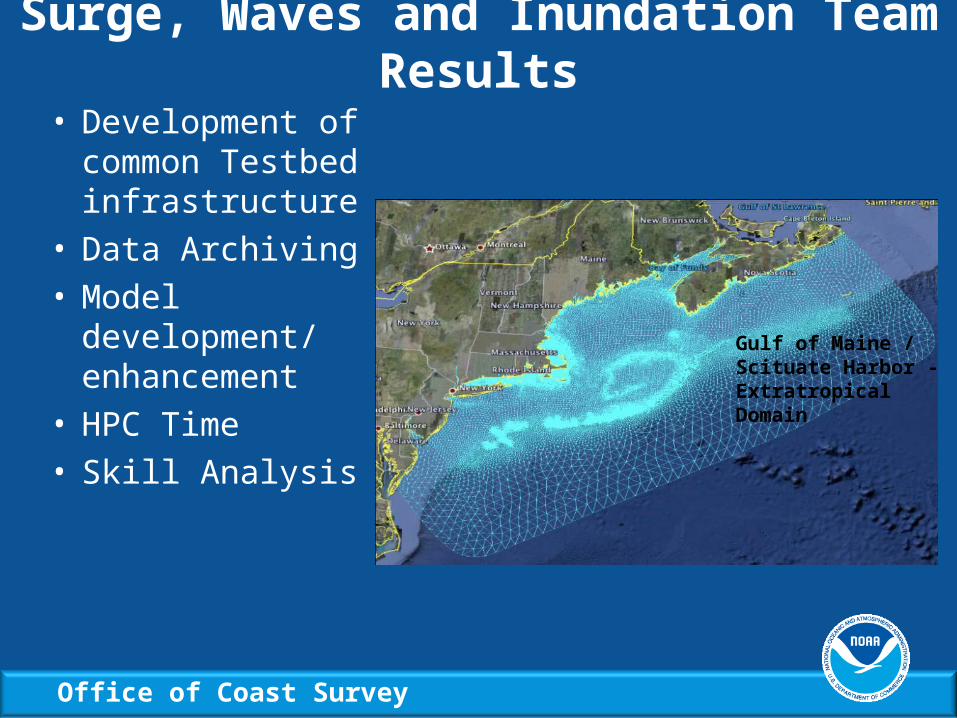
• Development of common Testbed infrastructure
• Data Archiving • Model
development/ enhancement
• HPC Time• Skill Analysis
Surge, Waves and Inundation Team Results
Gulf of Maine / Scituate Harbor - Extratropical Domain
Office of Coast Survey
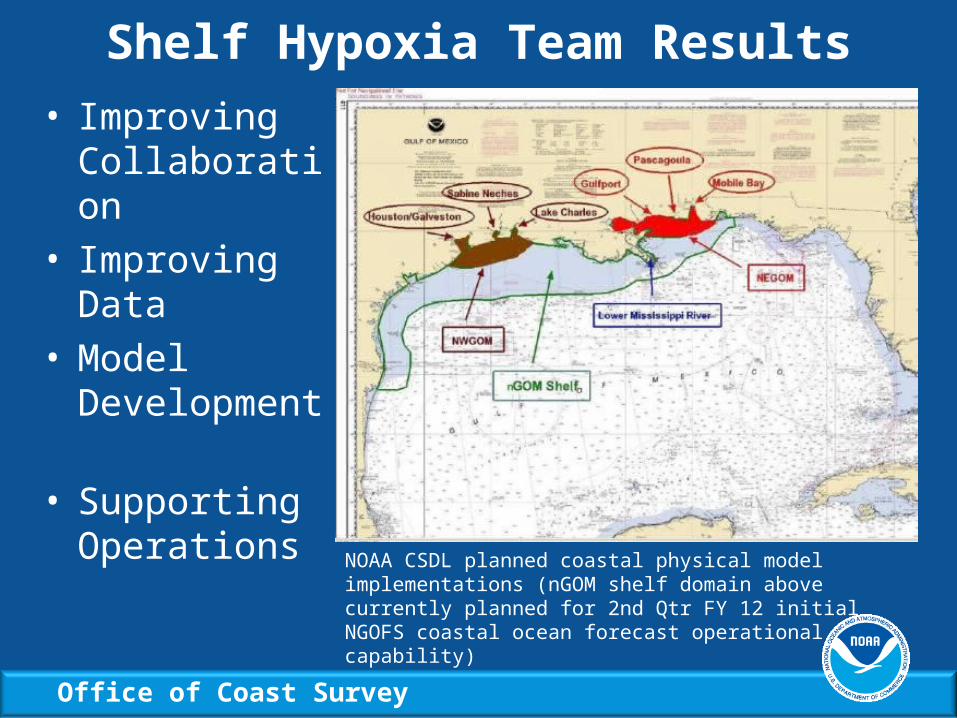
• Improving Collaboration
• Improving Data
• Model Development
• Supporting Operations
Shelf Hypoxia Team Results
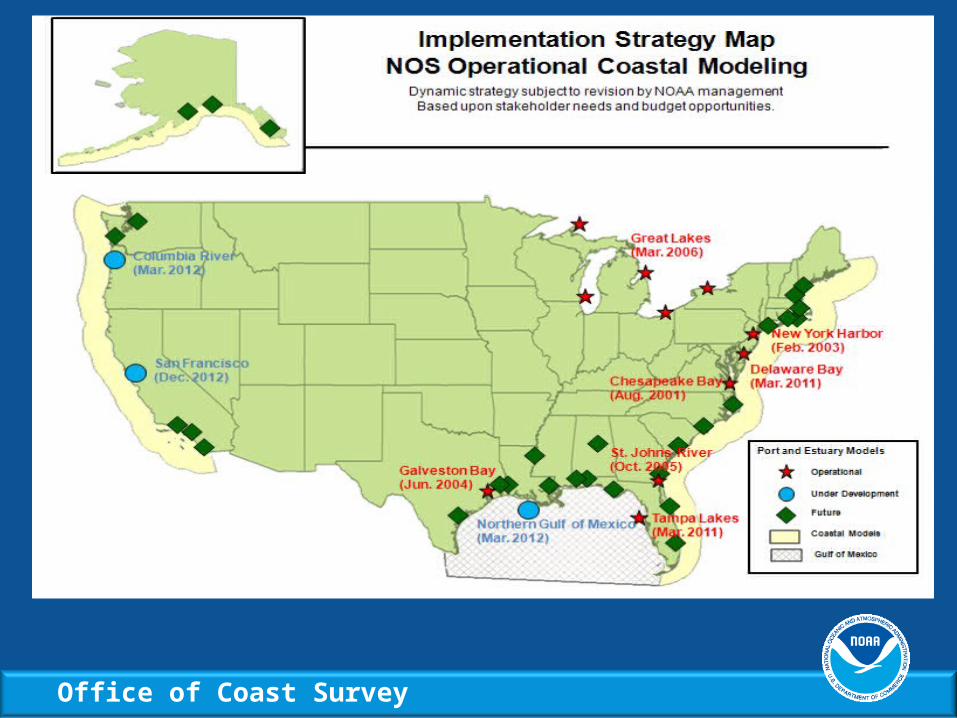
NOAA CSDL planned coastal physical model implementations (nGOM shelf domain above currently planned for 2nd Qtr FY 12 initial NGOFS coastal ocean forecast operational capability)
Office of Coast Survey
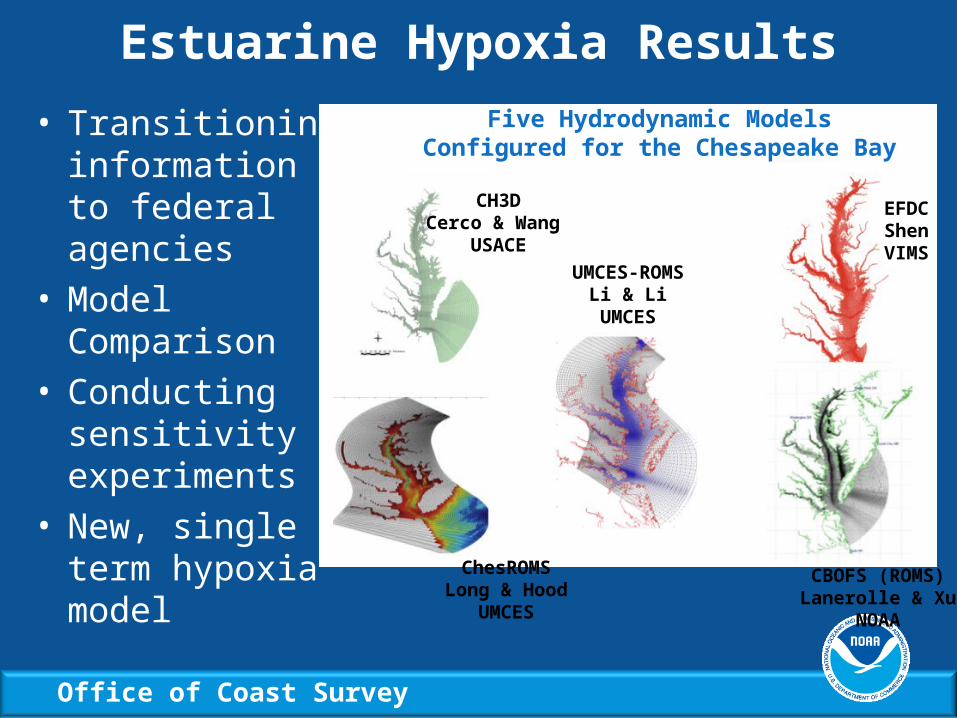
• Transitioning information to federal agencies
• Model Comparison
• Conducting sensitivity experiments
• New, single term hypoxia model
Estuarine Hypoxia Results
CH3DCerco & Wang
USACE
ChesROMSLong & Hood
UMCES
UMCES-ROMSLi & LiUMCES
CBOFS (ROMS)Lanerolle & Xu
NOAA
EFDCShenVIMS
Five Hydrodynamic Models Configured for the Chesapeake Bay
Office of Coast Survey
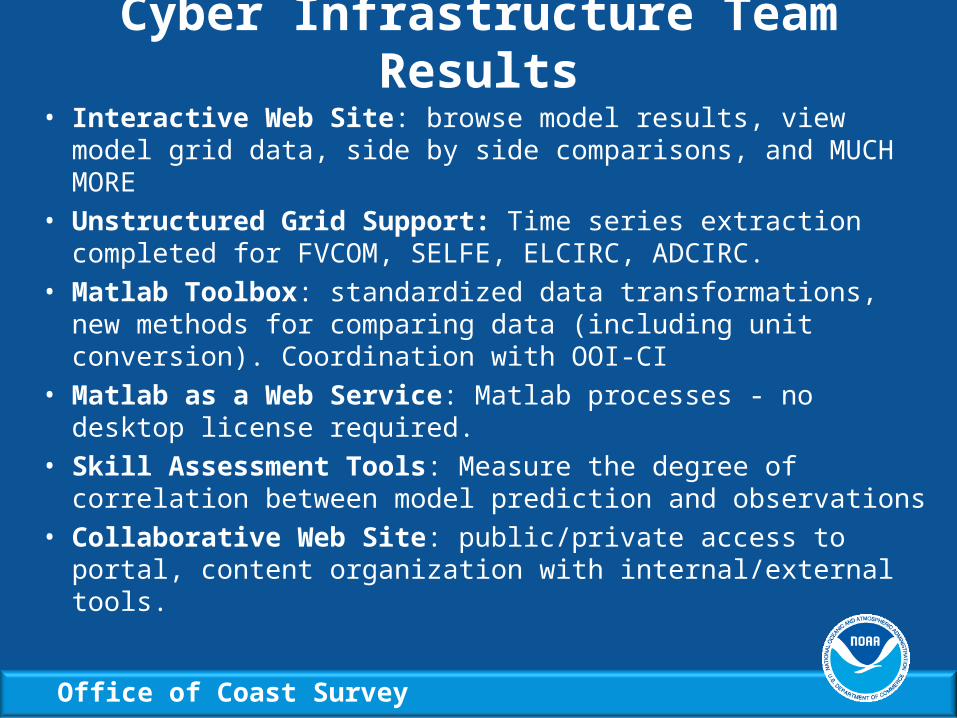
• Interactive Web Site: browse model results, view model grid data, side by side comparisons, and MUCH MORE
• Unstructured Grid Support: Time series extraction completed for FVCOM, SELFE, ELCIRC, ADCIRC.
• Matlab Toolbox: standardized data transformations, new methods for comparing data (including unit conversion). Coordination with OOI-CI
• Matlab as a Web Service: Matlab processes - no desktop license required.
• Skill Assessment Tools: Measure the degree of correlation between model prediction and observations
• Collaborative Web Site: public/private access to portal, content organization with internal/external tools.
Cyber Infrastructure Team Results
Office of Coast Survey
Looking Ahead• Teams are finalizing products for consideration or
transferring models, tools and toolkits to federal operational centers
• Cyber infrastructure team will continue developing tools to advance data repository and search features as well as comparison tools for data and models
• Management team is building framework for sustainability to include:– Defining and gathering broad agreement for structure and
CONOPS of long term Testbed– Ensuring funding support for future Testbed study
Office of Coast Survey
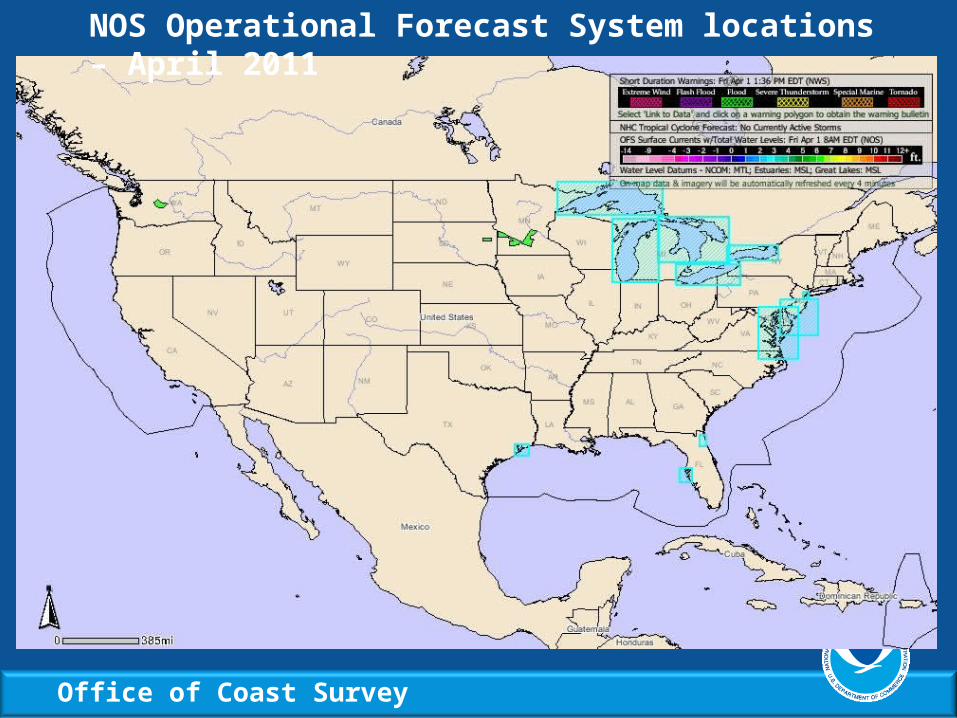
NOS Operational Forecast System locations – April 2011
Office of Coast Survey

Office of Coast Survey