Embed Size (px)
Citation preview
Joseph Paladino ([email protected]) National Summit on Smart Grid and Climate Change Washington, DC
Conservation Voltage Reduction
October 13, 2015
Office of Electricity Delivery & Energy Reliability
Office of Electricity Delivery and Energy Reliability 1
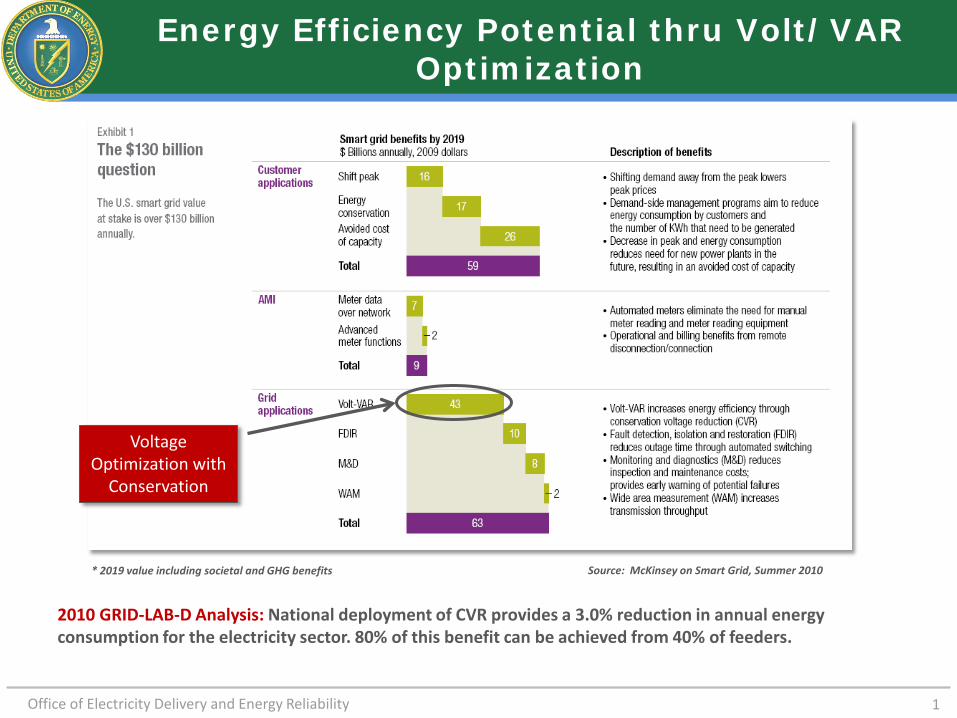
Energy Efficiency Potential thru Volt/VAR Optimization
* 2019 value including societal and GHG benefits Source: McKinsey on Smart Grid, Summer 2010
Voltage Optimization with
Conservation
2010 GRID-LAB-D Analysis: National deployment of CVR provides a 3.0% reduction in annual energy consumption for the electricity sector. 80% of this benefit can be achieved from 40% of feeders.
Office of Electricity Delivery and Energy Reliability 2
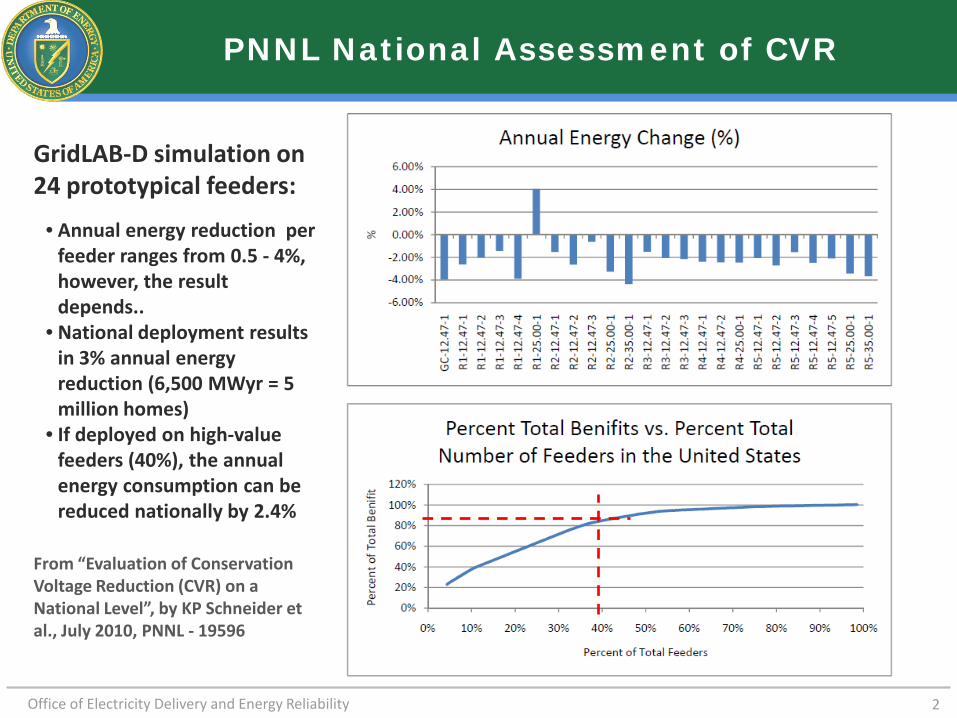
PNNL National Assessment of CVR
From “Evaluation of Conservation Voltage Reduction (CVR) on a National Level”, by KP Schneider et al., July 2010, PNNL - 19596
GridLAB-D simulation on 24 prototypical feeders:
• Annual energy reduction per feeder ranges from 0.5 - 4%, however, the result depends..
• National deployment results in 3% annual energy reduction (6,500 MWyr = 5 million homes)
• If deployed on high-value feeders (40%), the annual energy consumption can be reduced nationally by 2.4%
Office of Electricity Delivery and Energy Reliability 3
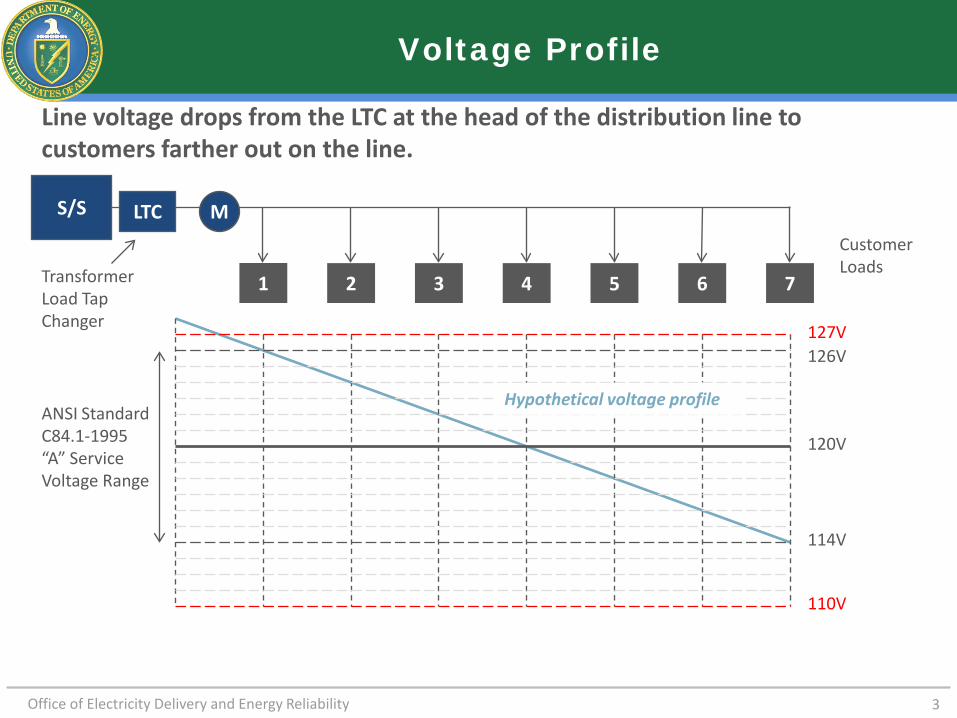
Voltage Profile
Line voltage drops from the LTC at the head of the distribution line to customers farther out on the line.
S/S
2 3 4 5 6 7
Customer Loads
1
M LTC
126V
114V
120V
127V
110V
Transformer Load Tap Changer
ANSI Standard C84.1-1995 “A” Service Voltage Range
Hypothetical voltage profile
Office of Electricity Delivery and Energy Reliability 4
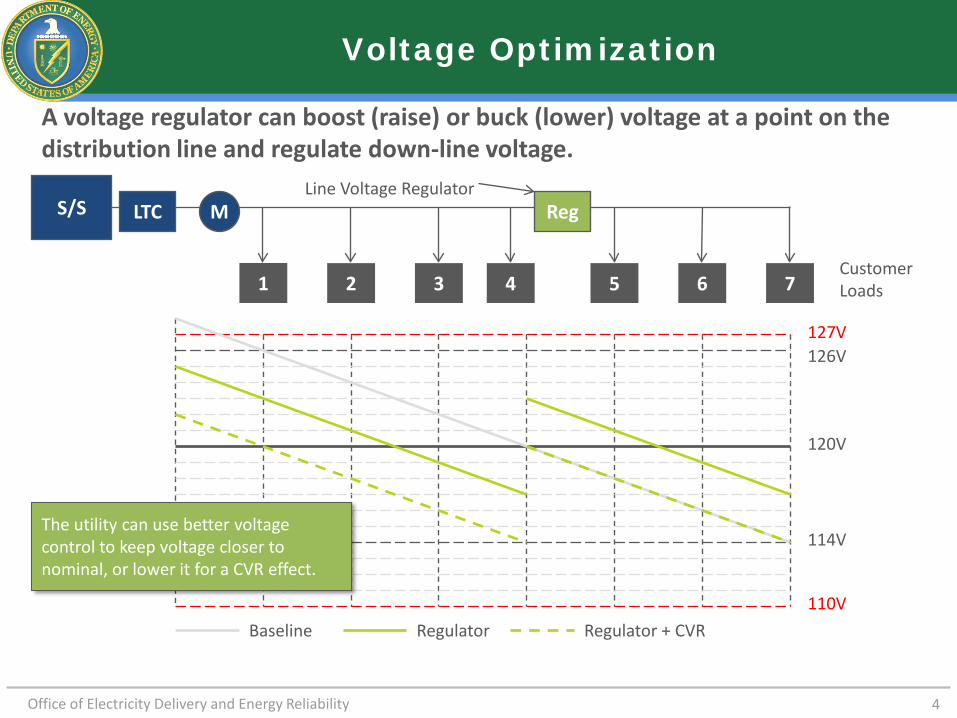
Voltage Optimization
A voltage regulator can boost (raise) or buck (lower) voltage at a point on the distribution line and regulate down-line voltage.
S/S
2 3 4 5 6 7 Customer Loads 1
M LTC
126V
114V
120V
127V
110V
Reg
Baseline Regulator Regulator + CVR
Line Voltage Regulator
The utility can use better voltage control to keep voltage closer to nominal, or lower it for a CVR effect.
Office of Electricity Delivery and Energy Reliability 5
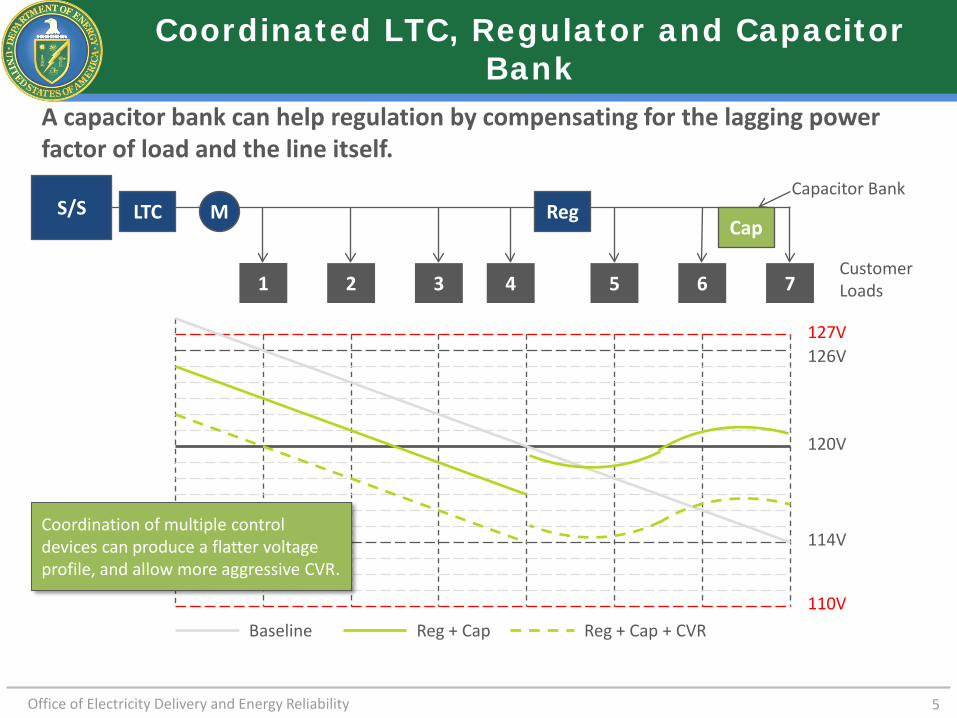
Coordinated LTC, Regulator and Capacitor Bank
A capacitor bank can help regulation by compensating for the lagging power factor of load and the line itself.
S/S
2 3 4 5 6 7 Customer Loads 1
M LTC
126V
114V
120V
127V
110V
Reg
Baseline Reg + Cap Reg + Cap + CVR
Cap
Capacitor Bank
Coordination of multiple control devices can produce a flatter voltage profile, and allow more aggressive CVR.
Office of Electricity Delivery and Energy Reliability 6
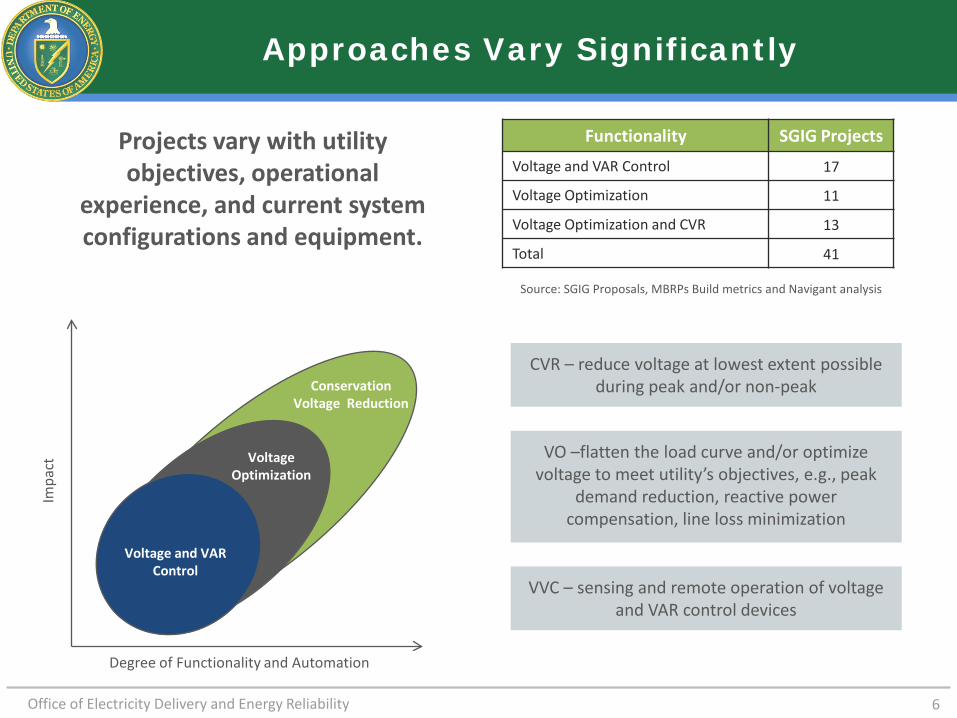
Projects vary with utility objectives, operational
experience, and current system configurations and equipment.
Functionality SGIG Projects
Voltage and VAR Control 17
Voltage Optimization 11
Voltage Optimization and CVR 13
Total 41
Voltage Optimization
Conservation Voltage Reduction
Impa
ct
Degree of Functionality and Automation
Voltage and VAR Control
Approaches Vary Significantly
Source: SGIG Proposals, MBRPs Build metrics and Navigant analysis
CVR – reduce voltage at lowest extent possible during peak and/or non-peak
VO –flatten the load curve and/or optimize voltage to meet utility’s objectives, e.g., peak
demand reduction, reactive power compensation, line loss minimization
VVC – sensing and remote operation of voltage and VAR control devices
Office of Electricity Delivery and Energy Reliability 7
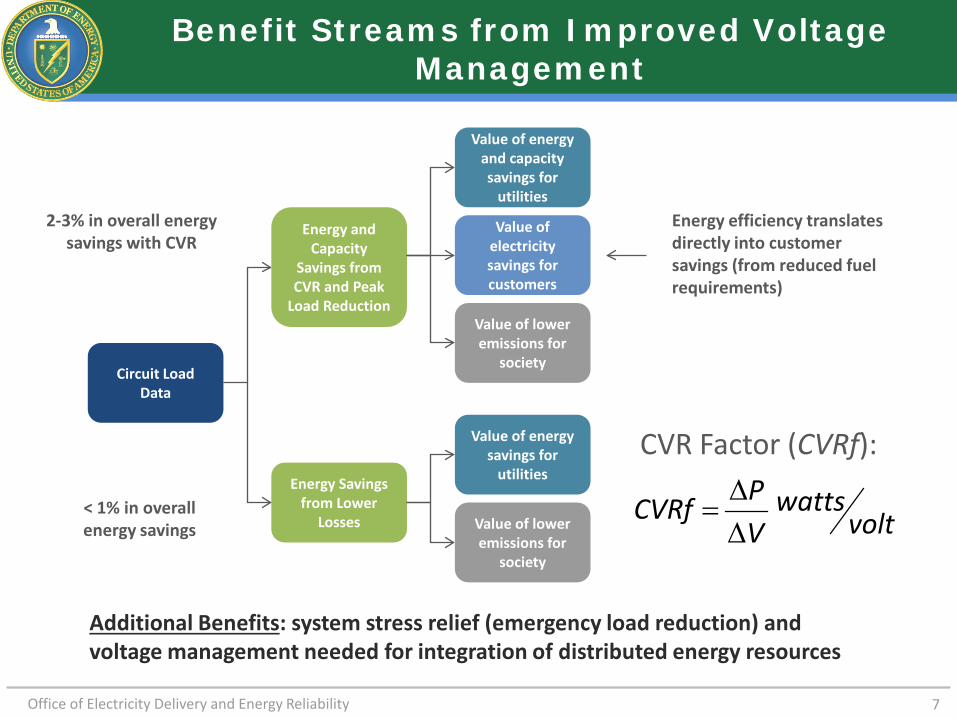
Benefit Streams from Improved Voltage Management
Circuit Load Data
Energy Savings from Lower
Losses
Value of energy savings for
utilities
Value of lower emissions for
society
Energy and Capacity
Savings from CVR and Peak
Load Reduction
Value of energy and capacity savings for
utilities
Value of lower emissions for
society
Value of electricity savings for customers
2-3% in overall energy savings with CVR
< 1% in overall energy savings
Energy efficiency translates directly into customer savings (from reduced fuel requirements)
CVR Factor (CVRf):
voltwatts
VPCVRf
∆∆
=
Additional Benefits: system stress relief (emergency load reduction) and voltage management needed for integration of distributed energy resources
Office of Electricity Delivery and Energy Reliability 8
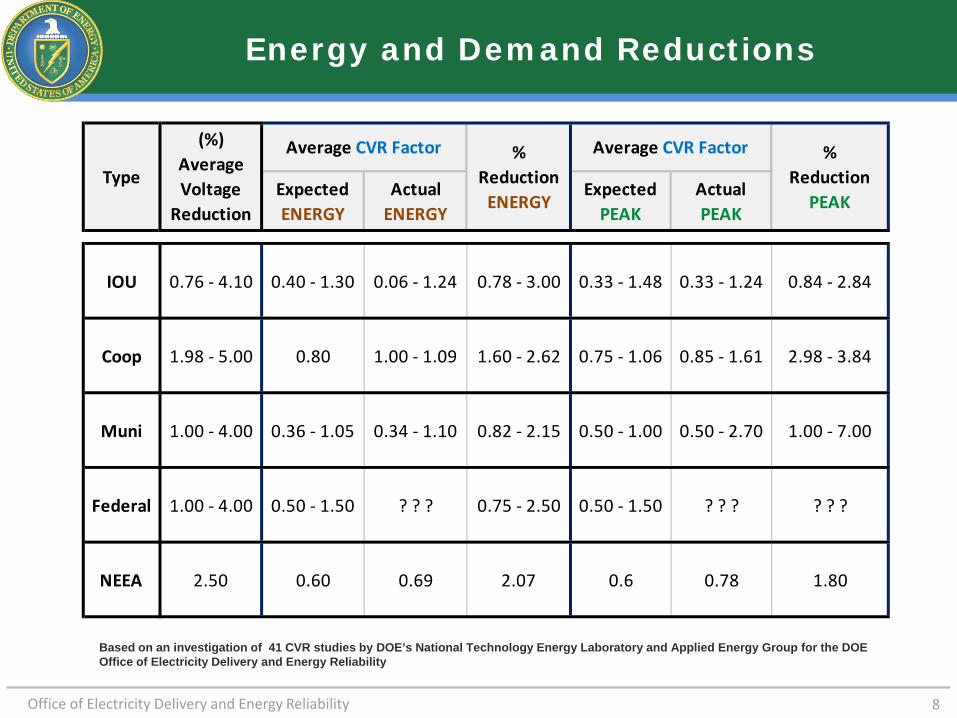
Energy and Demand Reductions
Expected ENERGY
Actual ENERGY
Expected PEAK
Actual PEAK
IOU 0.76 - 4.10 0.40 - 1.30 0.06 - 1.24 0.78 - 3.00 0.33 - 1.48 0.33 - 1.24 0.84 - 2.84
Coop 1.98 - 5.00 0.80 1.00 - 1.09 1.60 - 2.62 0.75 - 1.06 0.85 - 1.61 2.98 - 3.84
Muni 1.00 - 4.00 0.36 - 1.05 0.34 - 1.10 0.82 - 2.15 0.50 - 1.00 0.50 - 2.70 1.00 - 7.00
Federal 1.00 - 4.00 0.50 - 1.50 ? ? ? 0.75 - 2.50 0.50 - 1.50 ? ? ? ? ? ?
NEEA 2.50 0.60 0.69 2.07 0.6 0.78 1.80
Type
(%) Average Voltage
Reduction
Average CVR Factor % Reduction
ENERGY
Average CVR Factor % Reduction
PEAK
Based on an investigation of 41 CVR studies by DOE’s National Technology Energy Laboratory and Applied Energy Group for the DOE Office of Electricity Delivery and Energy Reliability
Office of Electricity Delivery and Energy Reliability 9
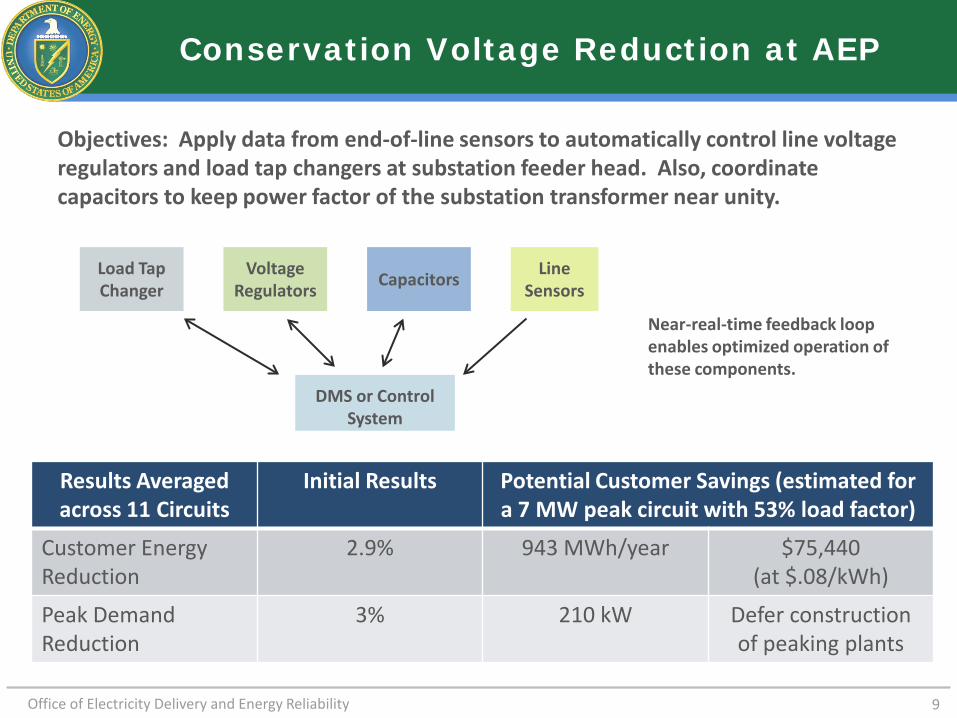
Conservation Voltage Reduction at AEP
Objectives: Apply data from end-of-line sensors to automatically control line voltage regulators and load tap changers at substation feeder head. Also, coordinate capacitors to keep power factor of the substation transformer near unity.
Line Sensors
Voltage Regulators
Load Tap Changer
DMS or Control System
Capacitors
Near-real-time feedback loop enables optimized operation of these components.
Results Averaged across 11 Circuits
Initial Results Potential Customer Savings (estimated for a 7 MW peak circuit with 53% load factor)
Customer Energy Reduction
2.9% 943 MWh/year $75,440 (at $.08/kWh)
Peak Demand Reduction
3% 210 kW Defer construction of peaking plants
Office of Electricity Delivery and Energy Reliability 10
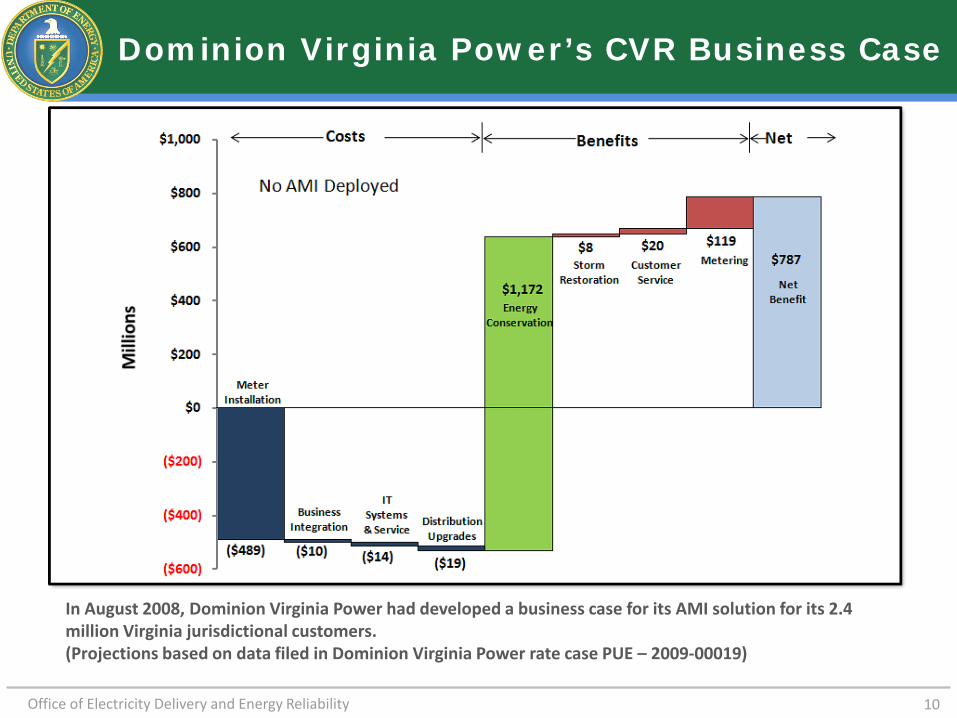
Dominion Virginia Power’s CVR Business Case
In August 2008, Dominion Virginia Power had developed a business case for its AMI solution for its 2.4 million Virginia jurisdictional customers. (Projections based on data filed in Dominion Virginia Power rate case PUE – 2009-00019)
Office of Electricity Delivery and Energy Reliability 11
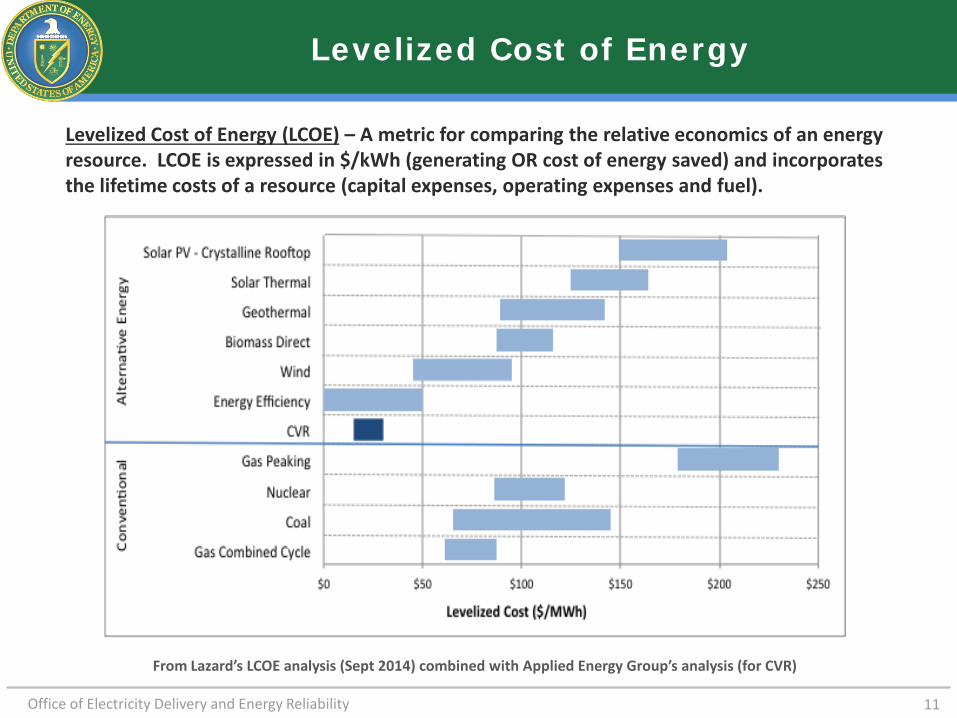
Levelized Cost of Energy
Levelized Cost of Energy (LCOE) – A metric for comparing the relative economics of an energy resource. LCOE is expressed in $/kWh (generating OR cost of energy saved) and incorporates the lifetime costs of a resource (capital expenses, operating expenses and fuel).
From Lazard’s LCOE analysis (Sept 2014) combined with Applied Energy Group’s analysis (for CVR)
Office of Electricity Delivery and Energy Reliability 12
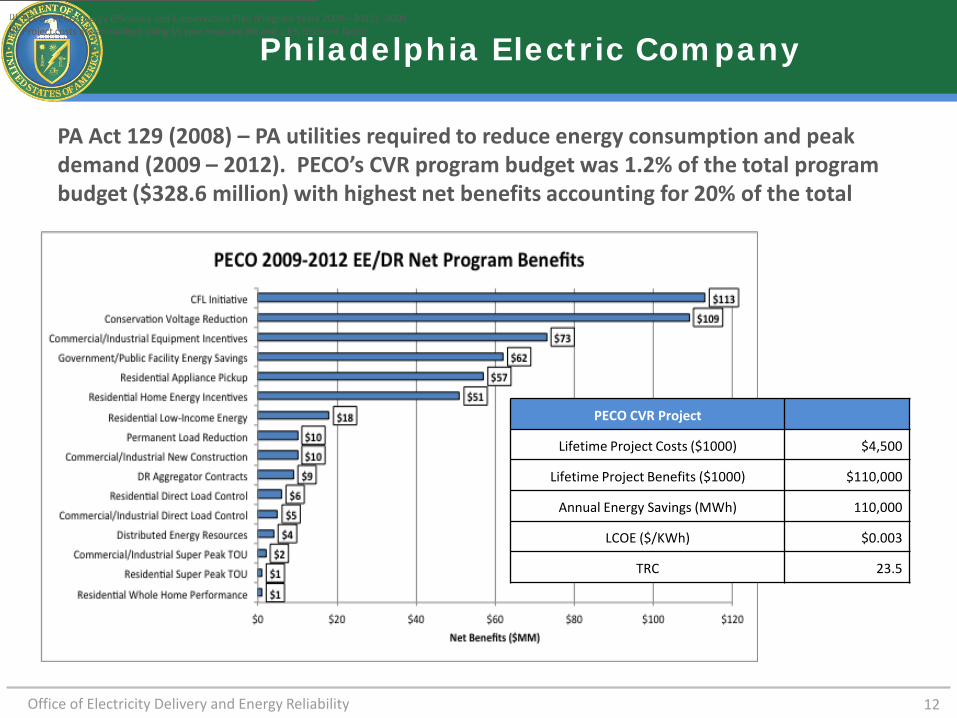
Philadelphia Electric Company
PA Act 129 (2008) – PA utilities required to reduce energy consumption and peak demand (2009 – 2012). PECO’s CVR program budget was 1.2% of the total program budget ($328.6 million) with highest net benefits accounting for 20% of the total
PECO CVR Project
Lifetime Project Costs ($1000) $4,500
Lifetime Project Benefits ($1000) $110,000
Annual Energy Savings (MWh) 110,000
LCOE ($/KWh) $0.003
TRC 23.5
[1] PECO. PECO Energy Efficiency and Conservation Plan (Program Years 2009 – 2012). 2009 [2] Project costs are annualized using 15 year measure life and a 6% discount factor
Office of Electricity Delivery and Energy Reliability 13
Observations
1. Major advancements in CVR technologies without compromising reliability 2. Value proposition is strong, but
a. Reliable full-scale deployment cost data remains elusive (many pilot projects) b. Value proposition for utilities impacted by disincentive of lost revenues
3. Momentum building as some utilities and regulators beginning to treat CVR in the EE resource portfolio, and leverage the regulatory mechanisms (e.g., cost recovery and lost revenue adjustments) and performance incentives already in place for EE programs.
a. For example, OH, MD, WA, OR and PA include CVR in EE portfolios, CO, CA and IL under consideration
b. However, there is lack of standardization in planning and evaluation tools (cost-benefit model specifications for comparative resource planning)
4. Business hurdles exist: a. New technology and vendor risk (including DER integration) b. Competing investment priorities
5. Leadership and increased awareness needed: a. Sharing of CVR cost/performance data and regulatory treatments b. Industry organizations can develop and promote reliable planning and evaluation
tools/protocols


![L 26 Electricity and Magnetism [3] Electric circuits what conducts electricity what doesn’t conduct electricity Current voltage and resistance Ohm’s Law](https://img.pdfslide.net/doc/110x75/56649dd95503460f94acf197/l-26-electricity-and-magnetism-3-electric-circuits-what-conducts-electricity.jpg)

![L 25 Electricity and Magnetism [3] Electric circuits what conducts electricity what doesn’t conduct electricity Current, voltage and resistance –Ohm’s](https://img.pdfslide.net/doc/110x75/56649cd85503460f949a0543/l-25-electricity-and-magnetism-3-electric-circuits-what-conducts-electricity.jpg)