Embed Size (px)
Citation preview
OFFICE OF FEDERAL HOUSING ENTERPRISE OVERSIGHT
NEWS RELEASE
FOR IMMEDIATE RELEASE Contact: Stefanie Mullin Friday, June 14, 2002 202.414.6921
www.ofheo.gov OFHEO SUBMITS ITS
ANNUAL REPORT TO CONGRESS
WASHINGTON, D.C. — Armando Falcon, Jr., Director of the Office of Federal Housing Enterprise Oversight (OFHEO), safety and soundness regulator for Fannie Mae and Freddie Mac (the Enterprises), today released OFHEO’s Annual Report to Congress.
“I am pleased to report that OFHEO has found both Fannie Mae and Freddie Mac to be well-capitalized and operating in a safe and sound manner,” said Falcon.
HIGHLIGHTS OF THE REPORT INCLUDE:
1) Results and conclusions of OFHEO’s annual examinations of Fannie Mae (p. 22) and Freddie Mac for 2001(p. 43).
2) An overview of the stress test and capital classifications of the Enterprises.
3) Detailed, new information on OFHEO’s examination program including information on the Enterprises’ derivatives use, corporate governance and audit practices.
4) An independent, unqualified audit opinion of OFHEO for the third consecutive year.
5) Detailed charts on the Enterprises’ portfolios.
###
1700 G STREET, NW WASHINGTON, DC (202)414-6922 FAX (202)414-3823
-1-

OFFICE OF FEDERAL HOUSING ENTERPRISE OVERSIGHT 1700 G STREET NW WASHINGTON DC 20552 (202) 414-3800
June 14, 2002
The Honorable Paul S. Sarbanes The Honorable Michael G. Oxley Chairman Chairman Committee on Banking, Housing, & Urban Affairs Committee on Financial Services United States Senate United States House of Representatives Washington, D.C. 20510 Washington, D.C. 20515
Dear Chairmen:
I am pleased to transmit the 2002 Report to Congress from the Office of Federal Housing Enterprise Oversight (OFHEO). This report has been prepared to meet the statutory requirements in section 1319B of the Federal Housing Enterprises Financial Safety and Soundness Act of 1992 (Title XIII of P.L. 102-550).
The views in this report are those of the Director and do not necessarily represent those of the Presidentor the Secretary of Housing and Urban Development.
Sincerely,
CC: The Honorable Phil Gramm, Ranking Member, Senate Committee on Banking, Housing & Urban Affairs The Honorable John J. LaFalce, Ranking Member, House Committee on Financial Services

OFFICE OF FEDERAL HOUSING ENTERPRISE OVERSIGHT 1700 G STREET NW WASHINGTON DC 20552 (202) 414-3800
June 14, 2002
The Honorable Paul S. Sarbanes The Honorable Michael G. OxleyChairman Chairman Committee on Banking, Housing & Urban Affairs Committee on Financial Services United States Senate United States House of Representatives Washington, DC 20510 Washington, DC 20515
Dear Chairmen:
According to Section 1319B(a)(3) of the Federal Housing Enterprises Financial Safety and Soundness Act of 1992, the Director of the Office of Federal Housing Enterprise Oversight (OFHEO) shall include any legislative recommendations to enhance the financial safety and soundness of Fannie Mae and Freddie Mac (the Enterprises) in this annual report to Congress. Pursuant to that requirement, I am forwarding the following recommendation which was submitted to the Congress earlier this year through the Administration’s Fiscal Year (FY) 2003 budget request.
As noted in the FY 2003 budget, the Enterprises continue to grow in both size and scope. As the safety and soundness regulator of the Enterprises, OFHEO must be adequately positioned to address this growth and any unforeseen contingencies. I concur with the Administration’s position that OFHEO should be permanently funded to ensure adequate resources and flexibility, on par with all other financial safety and soundness regulators. Such funding would not come from taxpayer dollars, but rather through direct assessment on the Enterprises. Congressional oversight of OFHEO would continue as it currently does with the other financial regulators.
The legislative recommendation which is identical to that recommended by the Administration follows:
Section 1316(a) of the Federal Housing Enterprises Financial Safety and Soundness Act of 1992 (12 U.S.C. 4516) is amended in the first sentence by striking “, to the extent provided in appropriations Acts.”
Sincerely,
CC: The Honorable Phil Gramm, Ranking Member, Senate Committee on Banking, Housing & Urban Affairs The Honorable John J. LaFalce, Ranking Member, House Committee on Financial Services

DIRECTOR’S MESSAGE
I am pleased to report that 2001 was a very busy and productive year at the Office of Federal Housing Enterprise Oversight. I am proud of the role that OFHEO plays in ensuring the safety and soundness of two of the vital government-sponsored enterprises charged with providing liquidity to the primary mortgage market. I am also pleased to report that OFHEO has found both Fannie Mae and Freddie Mac to be well-capitalized and operating in a safe and sound manner.
We have included in this report details on OFHEO’s work during 2001: A year in review summation; the results and conclusions of our examinations of the Enterprises; information on the completion of our risk-based capital rule; the development of rules and policy guidances for our Regulatory Infrastructure Project; the results of our quarterly house price index; the report of our independinformational charts and tables to assist in understandhas in past years, OFHEO received an unqualified, clea
With the completion of our risk-based capital rule, OFof a strong, thorough oversight program in place: ExamResearch. We continue to build upon that program tosoon be expanding OFHEO’s Examination staff, we wistress test as an analytical tool, we have research underunderstanding of Enterprise risks and we have establisderivatives and disclosure.
This year is already shaping up to be a very active year another successful year for OFHEO and the housing m
Sincerely,
ent audit; and numerous ing the Enterprises’ business. As it n audit.
HEO now has all the key elements inations, Capital standards and enhance our oversight. We will ll utilize the risk-based capital way to increase our hed working groups on
as well. We look forward to arket.

TABLE OF CONTENTS
CHAPTER ONE – YEAR IN REVIEW.................................................................................................. 1
HOUSING MARKET FLOURISHES AMID A FALTERING ECONOMY ............................1 House Price Appreciation....................................................................................................................2 The Enterprises’ Financial Performance .......................................................................................... 3 Examination Activities......................................................................................................................... 3 CAPITAL REQUIREMENTS.............................................................................................................5 OFHEO RULEMAKING.....................................................................................................................6 OFHEO POLICY GUIDANCES ........................................................................................................ 7OFHEO ACTIONS ON EXECUTIVE COMPENSATION........................................................ 7 OFHEO RESEARCH............................................................................................................................8
CHAPTER TWO – CAPITAL REGULATION ...................................................................................9
Capital Classification Process ............................................................................................................9 Implementation Period ........................................................................................................................9 Risk-Based Capital Standard............................................................................................................ 10 Box 2.1. OFHEO's Stress Test.......................................................................................................... 12 Enterprise Data .....................................................................................................................................13 Economic Conditions ..........................................................................................................................13 Mortgage Performance ....................................................................................................................... 14 Other Credit Factors .......................................................................................................................... 14 Cash Flows............................................................................................................................................ 14 Operating and Accounting Rules .................................................................................................... 15
CHAPTER THREE – OFHEO’S EXAMINATION PROGRAM AND RESULTS ................... 16
Table 3.1 OFHEO's Comprehensive Risk-Based Examination Program .............................. 16 INTRODUCTION................................................................................................................................17 OFHEO’s Examination Program ......................................................................................................17 Risk Profiles ...........................................................................................................................................17 Examination Strategies .......................................................................................................................17 Program Areas for Risk-Based Examinations and Categories of Risk and Risk Management ......................................................................................................................................... 18 Evaluation Criteria, Assessment Factors and Examination Objectives................................. 19 Communication of Examination Findings....................................................................................20 Effect Changes and Follow Up ........................................................................................................20 Fannie Mae Examination Results and Conclusions ...................................................................22 Box 3.1. Derivatives - Fannie Mae ...................................................................................................25 Box 3.2. Audit Program - Fannie Mae............................................................................................32Box 3.3. Board Governance - Fannie Mae .....................................................................................38 Freddie Mac Examination Results and Conclusions .................................................................43 Box 3.4. Derivatives Freddie Mac .................................................................................................. 46 Box 3.5 Audit Program - Freddie Mac...........................................................................................53 Box 3.6. Board Governance - Freddie Mac ...................................................................................59
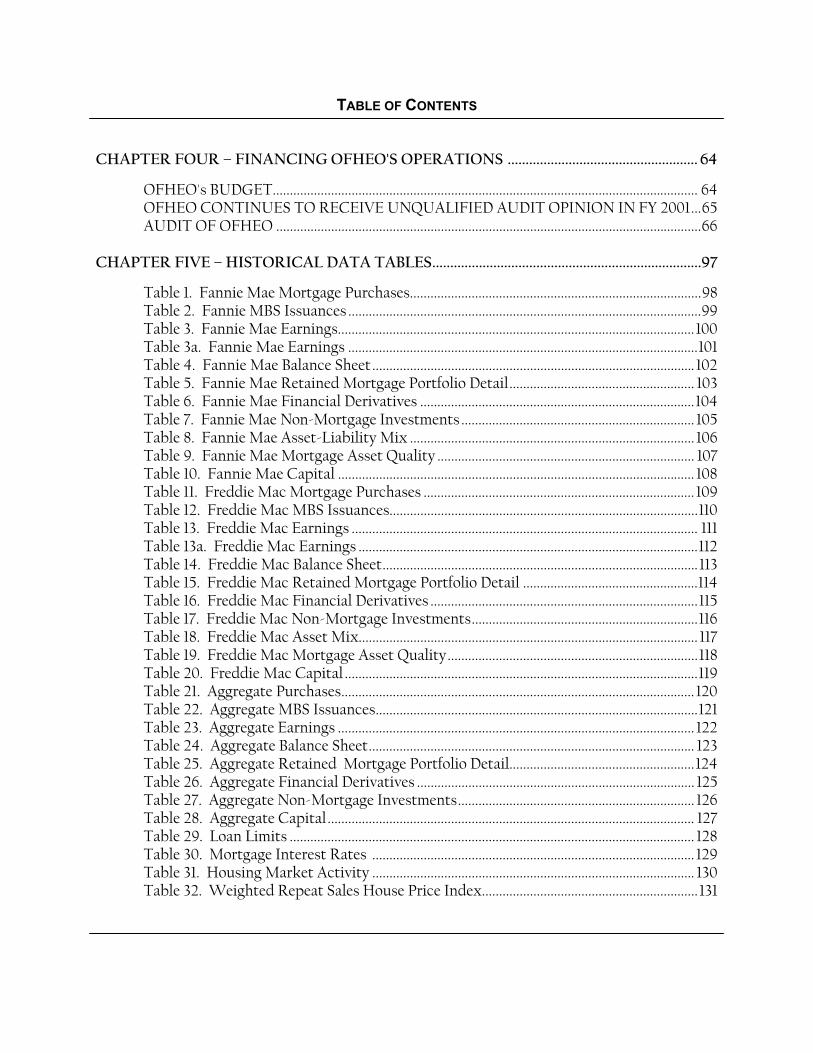
TABLE OF CONTENTS
CHAPTER FOUR – FINANCING OFHEO'S OPERATIONS ..................................................... 64
OFHEO's BUDGET............................................................................................................................ 64 OFHEO CONTINUES TO RECEIVE UNQUALIFIED AUDIT OPINION IN FY 2001...65 AUDIT OF OFHEO ............................................................................................................................66
CHAPTER FIVE – HISTORICAL DATA TABLES...........................................................................97
Table 1. Fannie Mae Mortgage Purchases.....................................................................................98 Table 2. Fannie MBS Issuances .......................................................................................................99 Table 3. Fannie Mae Earnings........................................................................................................ 100 Table 3a. Fannie Mae Earnings ......................................................................................................101 Table 4. Fannie Mae Balance Sheet.............................................................................................. 102Table 5. Fannie Mae Retained Mortgage Portfolio Detail...................................................... 103 Table 6. Fannie Mae Financial Derivatives ................................................................................104 Table 7. Fannie Mae Non-Mortgage Investments .................................................................... 105 Table 8. Fannie Mae Asset-Liability Mix ................................................................................... 106 Table 9. Fannie Mae Mortgage Asset Quality ........................................................................... 107 Table 10. Fannie Mae Capital ........................................................................................................ 108 Table 11. Freddie Mac Mortgage Purchases ............................................................................... 109 Table 12. Freddie Mac MBS Issuances..........................................................................................110 Table 13. Freddie Mac Earnings ..................................................................................................... 111 Table 13a. Freddie Mac Earnings ...................................................................................................112 Table 14. Freddie Mac Balance Sheet............................................................................................ 113 Table 15. Freddie Mac Retained Mortgage Portfolio Detail ...................................................114 Table 16. Freddie Mac Financial Derivatives ..............................................................................115 Table 17. Freddie Mac Non-Mortgage Investments..................................................................116 Table 18. Freddie Mac Asset Mix................................................................................................... 117 Table 19. Freddie Mac Mortgage Asset Quality.........................................................................118 Table 20. Freddie Mac Capital .......................................................................................................119 Table 21. Aggregate Purchases....................................................................................................... 120 Table 22. Aggregate MBS Issuances..............................................................................................121Table 23. Aggregate Earnings ........................................................................................................ 122 Table 24. Aggregate Balance Sheet............................................................................................... 123 Table 25. Aggregate Retained Mortgage Portfolio Detail......................................................124 Table 26. Aggregate Financial Derivatives ................................................................................. 125 Table 27. Aggregate Non-Mortgage Investments..................................................................... 126 Table 28. Aggregate Capital........................................................................................................... 127 Table 29. Loan Limits ...................................................................................................................... 128 Table 30. Mortgage Interest Rates .............................................................................................. 129 Table 31. Housing Market Activity .............................................................................................. 130Table 32. Weighted Repeat Sales House Price Index............................................................... 131

CHAPTER ONE - YEAR IN REVIEW
CHAPTER ONE – Year in Review
During 2001 OFHEO continued to ensure the Enterprises are financially safe and sound and, thereby, able to foster the strength and vitality of the nation’s housing finance system. OFHEO conducted risk-based examinations of both Enterprises, determined each Enterprise met its regulatory capital requirement throughout the year, finalized its risk-based capital rule, and continued to adapt its regulatory program to the evolution of the nation’s housing finance system and changes in the mortgage industries’ use of technology.
HOUSING MARKET FLOURISHES AMID A FALTERING ECONOMY
The year 2001 marked the end of the longest economic expansion in U.S. history, with the first recession in 10 years starting in March. Economic activity declined slightly during the late spring and summer, then more sharply for a brief period after September 11, before improving late in the year. On balance, the rate of economic output ended the year close to its rate at the end of the previous year, but the unemployment rate rose from 4 percent to 5.8 percent. In response, the Federal Reserve cut its Federal Funds rate target sharply over the course of the year from 6.5 percent to 1.75 percent. Mortgage interest rates, which had been declining in the latter half of 2000, fell somewhat further to the lowest rates since the 1960s. Rates on long-term, fixed-rate loans averaged a full percentage point below the 2000 average.
The housing market showed remarkable strength in 2001, despite the terrorist attacks and recession. Aided by the low interest rates, single-family housing starts exceeded 1.3 million units. Similarly, low mortgage rates resulted in strong home sales in 2001. Combined sales of new and existing homes totaled 6.2 million units, the best year ever, exceeding the 6.1 million record level of units set in 1999. Spurred by heavy refinancing activity, originations of single-family mortgages doubled the previous year’s level, topping the $2.1 trillion mark. Originations in 2001 exceeded the previous record of $1.45 trillion set in 1998 by 45 percent. The expansion in home sales translated into increased homeownership. The homeownership rate increased to a record high 68 percent.
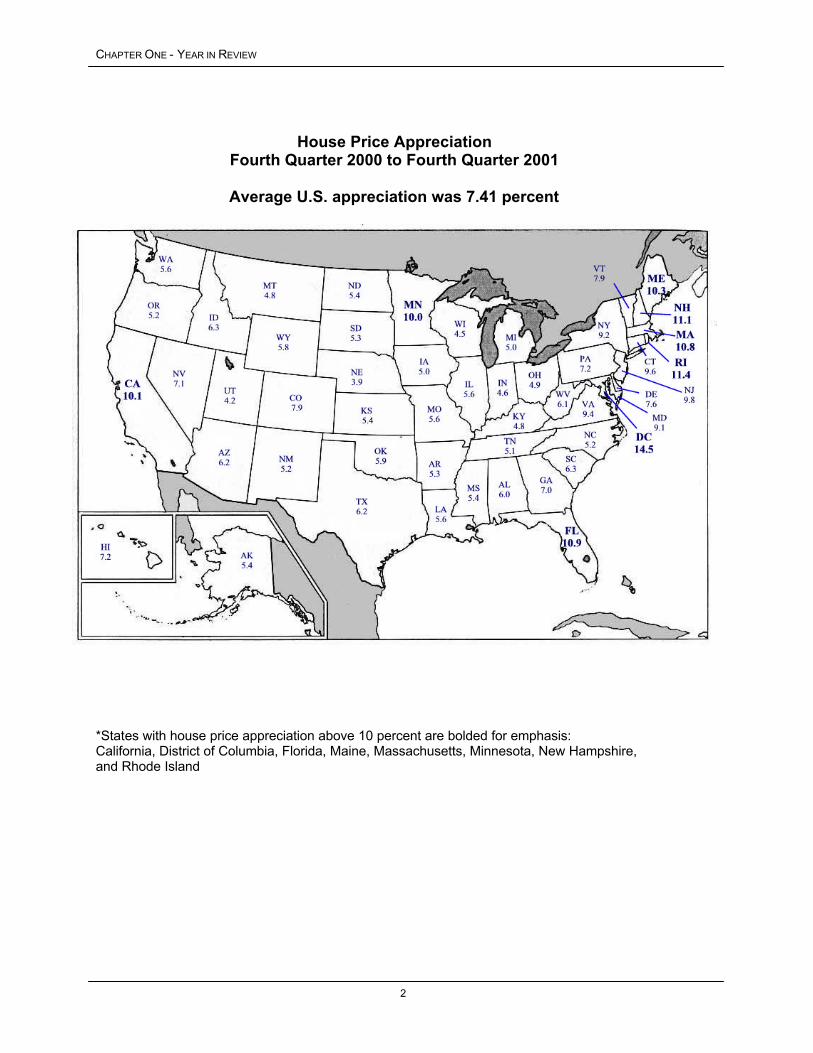
Home values, stimulated by heavy demand, continued their upward trend in 2001, albeit at more moderate rates than in 2000. Single-family home prices, as measured by OFHEO’s House Price Index (HPI), increased 7.41 percent from the fourth quarter of 2000 to the fourth quarter of 2001. During the previous year average appreciation was 8.1 percent.1
1 See House Price Index table (Table 32) on page 131 in Chapter Five - Historical Data Tables for more detailed HPI data.
1
CHAPTER ONE - YEAR IN REVIEW
House Price Appreciation Fourth Quarter 2000 to Fourth Quarter 2001
Average U.S. appreciation was 7.41 percent
*States with house price appreciation above 10 percent are bolded for emphasis: California, District of Columbia, Florida, Maine, Massachusetts, Minnesota, New Hampshire, and Rhode Island
2

CHAPTER ONE - YEAR IN REVIEW
The Enterprises’ Financial Performance
Fannie Mae and Freddie Mac each had a very successful year in 2001. Both Enterprises’ mortgage purchase volumes and securitizations were at record levels. Favorable market conditions also stimulated growth in the Enterprises’ mortgage asset portfolios. The combined assets of Fannie Mae and Freddie Mac increased 25 percent in 2001, to $1.4 trillion. Portfolio growth and widening spreads between asset yields and debt yields enhanced the Enterprises’ earnings. The Enterprises’ combined operating net income (GAAP net income adjusted to better reflect the profitability of continuing operations) increased 21 percent in 2001, to $8.5 billion. That income growth enabled the Enterprises to continue their long histories of high rates of return on equity.
Fannie Mae and Freddie Mac continued to actively manage their exposure to credit risk. The proportion of single-family mortgages purchased that were evaluated using the Enterprises’ automated underwriting systems prior to sale approached or exceeded 60 percent in 2001. The Enterprises also continued to limit their exposure to mortgage credit risk by obtaining credit enhancements on higher-risk single-family loans. Credit-related expenses – foreclosed property expenses plus provision for losses – declined at Fannie Mae and Freddie Mac despite the growth in their mortgage asset portfolios and mortgage-backed securities (MBS) held by other investors and generally weak economic conditions. Combined Enterprise credit-related expenses fell 19 percent during the year to an historically low $162 million.
Despite sizeable changes in interest rates in 2001, the Enterprises effectively managed their exposure to interest rate risk. This was accomplished by hedging asset acquisitions, making substantial use of derivatives, rebalancing hedges as interest rates changed, and continuing judicious risk management oversight.
Examination Activities
OFHEO conducted annual risk-based examinations of Fannie Mae and Freddie Mac in 2001, and provides the results and conclusions of the examinations in Chapter 3 of this report. Each quarter, the examination staff updates its evaluations using assessment factors covering more than 160 features of financial safety and soundness, which provides OFHEO with a comprehensive and timely understanding of the Enterprises’ financial conditions and performance. The assessments provided by examiners evaluate the key aspects of risk and risk management and cover credit risk, interest rate risk, liquidity management, model risk, information technology, internal controls, business process controls, internal and external audits, management information, management processes, and the governance provided by the Enterprises’ boards of directors.
Conducting comprehensive risk-based examinations is an important tool OFHEO employs to ensure the Enterprises operate prudently and remain safe and sound. We are committed to maintaining an excellent examination program by focusing on four core competencies: maintaining a quality examination framework; employing highly skilled personnel to conduct the program; utilizing tools that enhance the effectiveness and efficiency of examiners; and
3
CHAPTER ONE - YEAR IN REVIEW
engaging in a quality improvement process to ensure continuous improvement as a cornerstone of the program.
Like the examination programs of other financial safety and soundness regulators, OFHEO’s includes both on-site examinations and off-site surveillance and monitoring. It is through the on-site examinations that specialists make hands-on assessments of qualitative factors – such as management capabilities, risk management strategies, and internal control processes – which cannot be reflected in routine regulatory reporting. Trained examiners with specialty skills test and verify the quality and integrity of risk management tools, risk measurements, financial and management reports, operational controls, documentation standards, and a host of other qualitative and quantitative judgments.
OFHEO’s off-site surveillance and monitoring examination function is also an important element of prudential oversight. By (1) studying trends, (2) analyzing performance within the context of the broader marketplace, and (3) performing sophisticated analysis on features of risk at the Enterprises, the examination teams are well prepared to conduct on-site testing and evaluate the Enterprises critically.
Given the speed of change in the financial markets and at the Enterprises, OFHEO continuously improves its examination program and augments its examination specialties. The Office’s commitment to innovation is reflected in the quality-improvement process embedded within the examination program, which incorporates self- and peer-assessments and a formal feedback process. OFHEO’s examination activities continue to evolve to better capture the specific risks at the Enterprises.
4

CHAPTER ONE - YEAR IN REVIEW
CAPITAL REQUIREMENTS
Minimum Capital – OFHEO continued to enforce compliance with quarterly minimum capital standards for each Enterprise. The minimum capital requirements, which are required by the Federal Housing Enterprises Financial Safety and Soundness Act of 1992 (the 1992 Act), are similar to a bank’s leverage capital requirement. Since the test has been applied to the Enterprises (second quarter of 1993), both companies have exceeded their minimum capital requirements and have always been classified as adequately capitalized. The chart below illustrates each Enterprise’s capital in terms of their minimum capital requirement and the core capital they held each quarter for the past year.
Both Enterprises met their quarterly capital requirements in 2001.
FREDDIE MAC FANNIE MAE
17.34 18.52
16.3015.16
16.87
17.74 19.34
15.77
0
5
10
15
20
25
30
1Q01 2Q01 3Q01 4Q01
$ in
bill
ions
21.03 22.18
24.1823.13
21.48
23.78 25.1822.98
0
5
10
15
20
25
30
1Q01 2Q01 3Q01 4Q01
$ in
bill
ions
Risk-Based Capital – In addition to minimum capital, the 1992 Act requires OFHEO to establish risk-based capital requirements for Fannie Mae and Freddie Mac. The Office is required to use a stress test – a model that simulates the financial performance of the Enterprises under specified adverse economic conditions – to establish those requirements. On September 13, 2001, OFHEO published a final risk-based capital regulation. In addition to making minor technical corrections to the regulation, OFHEO also proposed changes to the risk-based capital regulation which were finalized March 15, 2002, after a public comment period. OFHEO continues to evaluate and analyze new financial instruments and new risk measurement techniques to improve the stress test and align the capital requirements more closely to each Enterprise’s risk.
5

CHAPTER ONE - YEAR IN REVIEW
OFHEO RULEMAKING
During 2001, OFHEO continued a comprehensive review of its regulatory infrastructure to enhance transparency and ensure the enforceability of supervisory standards. To address risk-based capital and further OFHEO’s Regulatory Infrastructure Project, which was initiated in July of 2000 to enhance transparency and ensure the enforceability of supervisory standards, OFHEO adopted and proposed rules and regulations including:
Civil Money Penalty Adjustment – On January 4, 2001 OFHEO amended its enforcement regulations to provide for the increase of available civil money penalties pursuant to the Federal Civil Money Penalties Inflation Adjustment Act. This maintains the civil money penalty section of OFHEO’s regulations at appropriate levels as required by law.
Assessments – On April 5, 2001 OFHEO published a final rule on the manner and procedures for collecting assessments from the Enterprises. The rule, which became effective May 7, 2001, recounts the agency’s assessment procedures and addresses various possible problems that could result from delays in enactment of appropriations legislation. The rule provides for an orderly and predictable regime for collecting assessments.
Enforcement Procedures – On April 5, 2001, OFHEO published amendments to its enforcement regulations that clarify and elaborate on its procedures for imposing sanctions, including civil money penalties and cease and desist orders, on an Enterprise, its officers or directors. The rule provides a summation of processes and procedures for enforcement actions along with an explanation of the legal underpinnings of OFHEO’s enforcement authorities.
Prompt Supervisory Response and Prompt Corrective Action – On April 10, 2001, OFHEO proposed for public comment a regulation to set forth procedures under which the agency would take prompt corrective action in response to specified declines in capital of an Enterprise, and to implement a system of prompt supervisory responses to specified developments that might warrant special supervisory review by the agency. The public comment period closed July 9, 2001, and a final regulation was adopted in early 2002. The rule clarifies procedures under the statutory system for employing capital as a measure for regulatory actions and goes further to create a process of action for issues of regulatory concern not tied to capital that fits within OFHEO’s statutory authorities.
Capital – On July 31, 2001, OFHEO completed work on a final risk-based capital regulation, which was published on September 13, 2001. On December 18, 2001, OFHEO proposed for comment a set of amendments intended to refine and clarify certain aspects of the regulation. The rule, as amended, will complete a risk-sensitive and flexible regulatory capital structure for the Enterprises.
Executive Compensation – On September 12, 2001, OFHEO adopted a final regulation to codify policies and procedures involved in the agency’s review of executive compensation policies and practices of the Enterprises. The rule largely formalizes procedures used by the
6

CHAPTER ONE - YEAR IN REVIEW
agency in performing its executive compensation oversight responsibilities and requires submission of relevant information by the Enterprises on a timely basis.
Corporate Governance – On September 12, 2001, OFHEO republished for public comment proposed regulations to address the applicability of minimum corporate governance standards to the Enterprises. The public comment period thereon was extended to November 9, 2001. The rule would strengthen OFHEO’s enforcement of the corporate governance standards it applies to the Enterprises.
Flood Insurance – On September 12, 2001, OFHEO proposed and thereafter adopted on December 18, 2001, a regulation to codify the authority of the agency to oversee and enforce certain statutory requirements affecting the operations of the Enterprises regarding the National Flood Insurance Program, and to effect statutorily mandated adjustments to the civil money penalties applicable to violations of that statutory regime.
OFHEO POLICY GUIDANCES
Regulatory Review – On April 2, 2001, OFHEO issued a written Policy Guidance announcing a process for routine review of its rules and regulations to determine whether they have become inefficient or create unwarranted burden, and, where appropriate, to identify possible revisions or repeal where such conditions are found.
Safety and Soundness Standards for Information – On December 19, 2001, OFHEO issued a written Policy Guidance that addresses standards for the Enterprises to be used in developing and implementing administrative, technical, and physical safeguards to protect the security, confidentiality, and integrity of information that is handled or maintained by or on behalf of an Enterprise.
OFHEO ACTIONS ON EXECUTIVE COMPENSATION
The Director of OFHEO, under OFHEO’s enabling statute and the Enterprises’ charter acts, has oversight responsibility in the area of executive compensation. OFHEO’s statute requires the Director to prohibit the Enterprises from providing excessive compensation to any executive officer. Additionally, the Enterprises must obtain the prior approval of the Director before entering into or changing termination agreements with their executive officers.
During 2001, an executive compensation consultant retained by OFHEO began a study comparing compensation provided by each Enterprise to its executive officers to that provided by similar businesses to executive officers with similar duties and responsibilities. That study, which is scheduled for completion in 2002, supplements the Director’s ongoing review of executive compensation and updates an earlier study completed in 1997. Also in 2001, OFHEO approved a termination benefit provided under an agreement by an Enterprise to its executive officers.
7

CHAPTER ONE - YEAR IN REVIEW
OFHEO RESEARCH
During 2001, OFHEO continued research and analysis on a variety of topics. These include the potential effects of Fannie Mae and Freddie Mac on systemic risk, subprime loans and the housing market, credit scores as determinants of mortgage prepayment and default, improving the precision of repeat sales house price indices, and developing alternate models to project Enterprise performance. OFHEO established an interdisciplinary Research Council to coordinate research plans and activities and ensure that research and analysis is focused on OFHEO’s achieving its strategic objectives and goals. In future years, OFHEO anticipates undertaking additional research and analysis, including looking at issues that arose in comments on the proposed risk-based capital rule and using the risk-based capital stress test to assess alternative stress scenarios to continue to analyze the Enterprises’ safety and soundness.
8
CHAPTER TWO – CAPITAL REGULATION
CHAPTER TWO – Capital Regulation
OFHEO was required by the 1992 Act to establish minimum and risk-based capital standards as part of its role as safety and soundness regulator. These capital requirements are intended to ensure both Enterprises continue to operate and perform their crucial roles in the secondary mortgage market, keeping constant the flow of funds to mortgage lenders and prospective American homeowners. By ensuring the Enterprises are adequately capitalized, OFHEO minimizes the risk that American taxpayers will ever be asked to pay for losses at these complex financial institutions.
OFHEO evaluates capital adequacy from other perspectives as well. OFHEO’s examination program conducts continuous, comprehensive examinations of the Enterprises to ensure they are operating under standards of financial safety and soundness. OFHEO’s examination of the Enterprises provides a qualitative assessment of capital adequacy. The more direct and quantitative tools are OFHEO’s minimum and risk-based capital standards, which are supplemented with other tests and analyses. OFHEO’s minimum capital standard is calculated based on specific percentages for assets and off-balance sheet guarantees. The minimum capital level is therefore determined more by the size of the Enterprise than its specific risks. The risk-based standard, in contrast, requires that Fannie Mae and Freddie Mac each have enough capital to survive prolonged, severe problems in financial and economic markets, as well as management or operational failures. It, therefore, is directly related to the risks the Enterprises are exposed to in their current business.
Capital Classification Process
Each quarter, OFHEO calculates a minimum capital requirement, which includes both a ‘minimum’ and a lower ‘critical’ level, and a risk-based capital requirement for each Enterprise. OFHEO classifies an Enterprise as adequately capitalized if it meets both its minimum and risk-based capital requirements.
Each quarter, OFHEO proposes a capital classification in writing to each Enterprise. Each Enterprise has up to 30 days to review and comment on its proposed classification. After reviewing any comments from the Enterprise, OFHEO makes a final capital classification and releases it to the public.
Failure to meet the requirements triggers a range of regulatory responses, depending upon the capital classification of an Enterprise.
Implementation Period
When OFHEO published the final risk-based capital regulation on September 13, 2001, it became effective immediately. However, Congress mandated a one-year implementation period between the effective date of the regulation and the date when OFHEO enforces the rule. This period provides the Enterprises an opportunity to understand and manage to the requirements
9

CHAPTER TWO - CAPITAL REGULATION
of the regulation. The first quarter that the risk-based capital calculation will be used to classify the Enterprises is the third quarter of 2002.
Risk-Based Capital Standard
OFHEO’s risk-based capital standard is unique among financial regulators. Unlike ratio-based capital rules, OFHEO’s standard is based on a 10-year stress test. A stress test measures risk in the context of a company’s overall portfolio, including the effectiveness of a company’s risk management activities. While companies often use stress tests for internal risk management, and rating agencies use stress tests to rate companies and securities, OFHEO is among the first financial institution regulators to use its own stress test to determine capital adequacy.
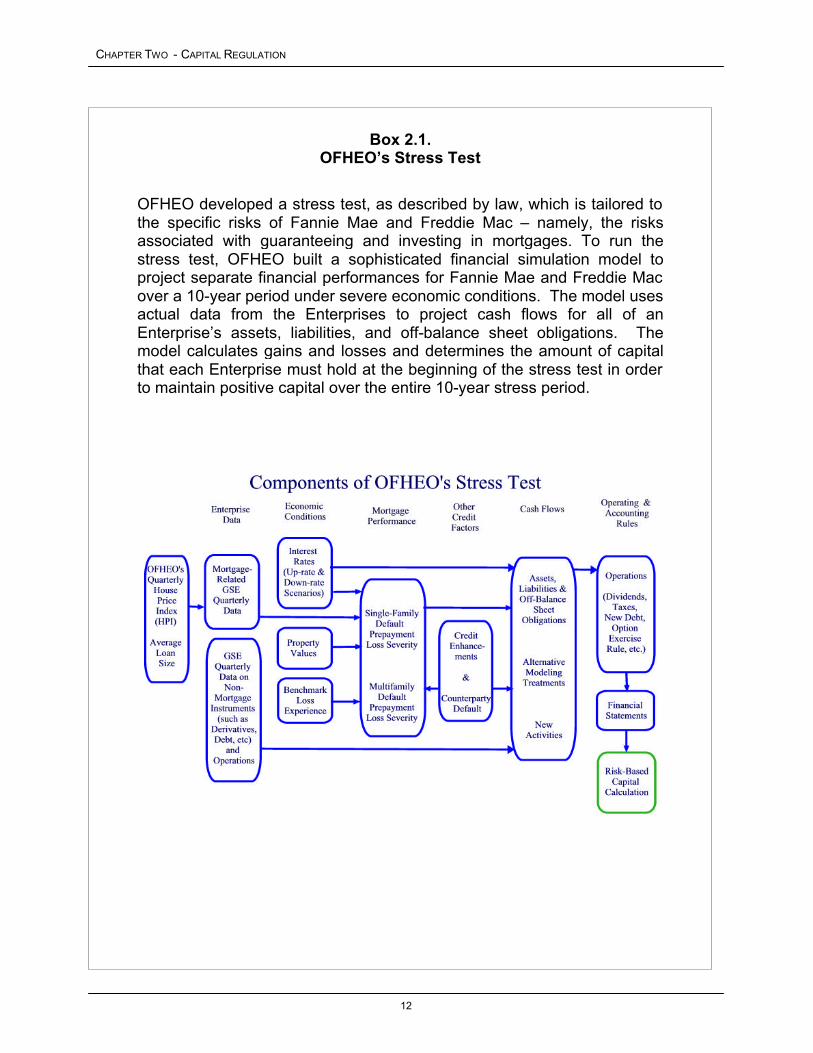
OFHEO’s stress test simulates an Enterprise’s financial performance over a 10-year period under severe economic conditions. (Box 2.1.) Key conditions describing the severe economic conditions used in OFHEO’s stress test are defined in the 1992 Act and further specified in OFHEO’s risk-based capital regulation. These conditions include high levels of mortgage defaults, with associated losses and large, sustained movements in interest rates.
OFHEO uses a sophisticated computer model to simulate each Enterprise’s cash flows associated with mortgages and other financial assets and obligations under the severe economic conditions of the stress test. The modeling of incoming and outgoing cash flows captures the risks embedded in those financial assets and obligations and the benefits of the hedges each Enterprise has set in place. To meet OFHEO’s risk-based capital standard, each Enterprise must have sufficient capital to survive the losses under these severe economic conditions plus an additional 30 percent for unspecified management and operations risks.
OFHEO’s stress test aligns the capital requirement for each Enterprise with its specific risk profile. In doing so, it provides Enterprise management with incentives to carefully manage risk. For example, risk reduction activities such as the effective use of interest rate derivatives, the use of private mortgage insurance (PMI) for high loan-to-value (LTV) mortgages, and the use of callable long-term debt all work to lower the risk-based capital requirement. Conversely, activities that increase risk, such as taking on unhedged interest rate exposures, serve to increase the risk-based capital requirement.
An Enterprise’s risk-based capital requirement is also sensitive to changing economic conditions that are beyond the control of management. For example, OFHEO’s stress test relates economic conditions to mortgage performance and, ultimately, to capital requirements. House price growth influences mortgage credit losses. When house prices increase, homeowner equity rises, and, all else being equal, the probability of borrowers defaulting declines. Thus, rising house prices tend to lower capital requirements. On the other hand, falling house prices tend to increase capital requirements by lowering homeowners’ equity which makes mortgages more risky.
Changes in interest rates also affect the risk-based capital calculation. For example, a change in interest rates influences mortgage prepayments and income generated from adjustable rate mortgages. Changes in interest rates also influence how much it costs the Enterprises to issue
10

CHAPTER TWO – CAPITAL REGULATION
new debt in the stress test, and the timing of the Enterprises’ exercise of call options on existing debt.
The dynamic nature of a stress test facilitates OFHEO’s understanding of how changes in the economy could impact the Enterprises. It will also help OFHEO uncover changes in capital needs before there could be a significant impact on the Enterprises’ balance sheets. In contrast, capital standards based on static ratios are affected only after economic changes impact the balance sheet.
OFHEO’s stress test provides the Enterprises with transparency, certainty, and flexibility in meeting their regulatory capital requirements. Both Enterprises have copies of OFHEO’s stress test and have incorporated the test into their everyday business processes. An Enterprise can comply with OFHEO’s risk-based capital standard by reducing risk or raising capital, or a combination of both. Therefore, each Enterprise can follow its own unique strategy to comply with OFHEO’s risk-based capital standard.
11
CHAPTER TWO - CAPITAL REGULATION
Box 2.1. OFHEO’s Stress Test
OFHEO developed a stress test, as described by law, which is tailored to the specific risks of Fannie Mae and Freddie Mac – namely, the risks associated with guaranteeing and investing in mortgages. To run the stress test, OFHEO built a sophisticated financial simulation model to project separate financial performances for Fannie Mae and Freddie Mac over a 10-year period under severe economic conditions. actual data from the Enterprises to project cash flows for all of an Enterprise’s assets, liabilities, and off-balance sheet obligations. model calculates gains and losses and determines the amount of capital that each Enterprise must hold at the beginning of the stress test in order to maintain positive capital over the entire 10-year stress period.
The model uses
The
12

CHAPTER TWO – CAPITAL REGULATION
Enterprise Data
The Enterprises provide OFHEO with the necessary data to run the stress test in their quarterly risk-based capital (RBC) data submissions. The data are sufficient to replicate the actual financial position of an Enterprise on the last day of the quarter, including assets, liabilities, and off-balance sheet obligations (e.g., guaranteed MBS and derivatives). These data represent the starting position of the Enterprises at the beginning of the stress test.
The data submissions are detailed enough to accurately project the cash flows associated with all of an Enterprise’s on- and off-balance sheet items. In the case of mortgage loans, for example, data are aggregated by a common set of mortgage risk factors, such as mortgage type and loan-to-value ratios. In other cases, such as derivative and debt instruments, data are needed at the instrument level, including any specific contractual terms, to accurately measure their cash flows.
The stress test assumes no new business occurs during the stress period, except that mortgages the Enterprises have committed to purchase through written agreements with their seller/servicers are added to their positions during the first year of the stress test.
Economic Conditions
The economic conditions describing the severity of the stress test are prescribed by law and affect the Enterprises through large and prolonged changes in interest rates and severe mortgage defaults and their associated losses. In general, the Treasury 10-year constant maturity yield either goes up by 75 percent or down by 50 percent, with a 600 basis point cap. All other interest rates used in the stress test (federal funds rate, LIBOR, federal agency cost of funds, etc.) are tied to movements in Treasury rates.
The 1992 Act requires that OFHEO impose credit losses on all mortgage loans owned or guaranteed by an Enterprise. These losses must be reasonably related to an Enterprise’s worst regional experience, known as the benchmark loss experience.2 The benchmark loss experience entails a 10-year default rate of 14.9 percent, a loss severity rate of 63.3 percent, and a loss rate of 9.4 percent for 30-year fixed-rate single-family loans. In the stress test, loss rates are adjusted to reflect differences between mortgage characteristics, collateral values, and economic conditions affecting current loans and those affecting loans in the benchmark loss experience. OFHEO also calibrated losses on adjustable-rate single-family loans and on multifamily loans, as required by law, to be reasonably related to the benchmark loss experience.
Current economic conditions are reflected in the starting position data. For example, OFHEO uses its House Price Index (HPI) to estimate the current amount of homeowner equity in the
2 The worst regional loss experience identified by OFHEO occurred for mortgages originated in Oklahoma, Arkansas, Louisiana and Mississippi from 1983 to 1984.
13

CHAPTER TWO - CAPITAL REGULATION
Enterprises’ single-family mortgage portfolios. The amount of homeowner equity in a property is a key factor in determining whether a loan will default.
Mortgage Performance
Mortgage performance refers to whether a loan will stay current, prepay, or default during the stress test, and if a loan defaults, how severe the loss will be to the Enterprise. OFHEO uses sophisticated statistical models to simulate mortgage performance over the 10-year stress period. These models project rates of prepayment, default, and loss severity. OFHEO uses different models for single-family and multi-family mortgages. For single-family mortgages, for example, the models use a variety of factors, such as mortgage type (fixed vs. adjustable), age of the loan, the current amount of equity in the property, and the difference between current mortgage rates and stated loan rate, to determine which mortgages default or prepay.
Other Credit Factors
Once the stress test has calculated how much an Enterprise would lose if a mortgage defaulted, the model will adjust the losses downward to account for any third-party credit enhancements applicable to the defaulted loan. The primary credit enhancement used by the Enterprises is private mortgage insurance, but other types of credit enhancements are used such as spread accounts and lender recourse. Information on credit enhancements is contained in each Enterprise’s quarterly RBC data submission to OFHEO.
To account for the strength of third party credit guarantees, OFHEO adjusts the value of the guarantees to the Enterprises based on the public credit ratings of the third party. Third party guarantees include private mortgage insurance and derivative counterparties. The lower the credit rating, the larger the ‘haircut’ (downward adjustment) applied to the value of the guarantee. OFHEO phases in the haircuts over the course of the stress test.
Cash Flows
OFHEO’s simulation model projects the cash flows of all assets, liabilities, and off-balance sheet obligations for each Enterprise on a monthly basis over the 10-year stress test. Cash flows for each Enterprise are largely determined by the performance of its mortgage portfolio during the stress test, interest payments made on its outstanding debt, and the cash flows associated with its derivatives positions.
To generate cash flows for items where there are insufficient data, the activity is new, or the activity is so small that a specific treatment has not yet been included in the current RBC regulation, OFHEO uses Alternative Modeling Treatments (AMTs). AMTs are a series of simple, conservative rules which, when applied to a particular activity, allow OFHEO to generate reasonable cash flows for the activity. AMTs ensure all Enterprise activities are incorporated in the stress test.
14
CHAPTER TWO – CAPITAL REGULATION
Operating and Accounting Rules
There are additional operating and accounting rules that influence the amount and timing of cash flows. These include rules on dividend payouts, rules that determine when a financial option is exercised (calls and puts), assumptions about operating costs, and accounting rules that determine tax payments. In addition, because of the ‘no new business assumption’ and the need to keep the financial statements in balance each month, OFHEO developed rules for investing excess funds and issuing new debt.
The resulting cash flows from the simulation model are used to generate pro forma financial statements for each Enterprise on a monthly basis during the 10-year stress test. These statements are generated using a close approximation to Generally Accepted Accounting Principles (GAAP). These financial statements show the resulting capital positions of each Enterprise for each month of the stress test.
Using the pro forma financial statements, the stress test determines the amount of capital needed to maintain positive capital throughout the 10-year stress period. Once that amount of capital has been determined, an additional 30 percent is added to protect against management and operations risks, which are not quantifiable. The total for each Enterprise is its risk-based capital requirement.
15
Inte
rest
Rat
e R
isk
Liq
uidi
ty M
anag
emen
t
• Strategy Tailored for Fannie Mae • Strategy Tailored for Freddie Mac
Examination Strategies
Categories of risk and risk management
- these remain constant
Program areas for risk based examinations
- these remain constant
Annual risk based examination plan
- reviewed and updated quarterly
OFHEO’s risk profile for each Enterprise
- updated quarterly
Constant changes at each Enterprise
Credit Market
Cre
dit
Ris
k
Operations
Info
rmat
ion
Tec
hnol
ogy
Bus
ines
s P
roce
ss C
ontr
ols
Inte
rnal
Con
trol
s
Boa
rd G
over
nanc
e
Man
agem
ent
Aud
its
Man
agem
ent I
nfor
mat
ion
Corporate GovernanceModels
Mod
el R
isk
Pro
cess
es
CHAPTER THREE - OFHEO’S EXAMINATION PROGRAM AND RESULTS
Assessment Factors
Examination Objectives
Evaluation Criteria
Communicate Examination
Findings; Effect Changes and Follow Up
Table 3.1 OFHEO’s Comprehensive
Risk-Based Examination Program
Basis for evaluating the quantitative and qualitative features of risk and risk management
- these remain constant
Continuous communications and follow-up
4
5
Assessment Factors
Examination Objectives
Evaluation Criteria
Communicate Examination
Findings; Effect Changes and Follow Up
Table 3.1 OFHEO’s Comprehensive
Risk-Based Examination Program
Basis for evaluating the quantitative and qualitative features of risk and risk management
- these remain constant
Continuous communications and follow-up
44
55
Credit
Cre
dit
Ris
k
Inte
rest
Rat
e R
isk
Liq
uidi
ty M
anag
emen
t
Market Operations
Info
rmat
ion
Tec
hnol
ogy
Bus
ines
s P
roce
ss C
ontr
ols
Inte
rnal
Con
trol
s
Models
Mod
el R
isk
Boa
rd G
over
nanc
e
Man
agem
ent
Pro
cess
es
Aud
its
Man
agem
ent I
nfor
mat
ion
Corporate Governance
Examination Strategies • Strategy Tailored for Fannie Mae • Strategy Tailored for Freddie Mac
Categories of risk and risk management
- these remain constant
3 33
Program areas for risk based examinations
- these remain constant
2 22 Annual risk based examination plan
Freddie Mac Risk Profile
• Balance Sheet and OBS • Strategy • Business Initiatives • Management of Risks
• Balance Sheet and OBS • Strategy • Business Initiatives • Management of Risks
Fannie Mae Risk Profile Freddie Mac Risk Profile
• Balance Sheet and OBS • Strategy • Business Initiatives • Management of Risks
• Balance Sheet and OBS • Strategy • Business Initiatives • Management of Risks
Fannie Mae Risk Profile
- reviewed and updated quarterly
OFHEO’s risk profile for each Enterprise
- updated quarterly
1 11 Constant changes at each Enterprise
16

CHAPTER THREE – OFHEO’S EXAMINATION PROGRAM AND RESULTS
CHAPTER THREE – OFHEO’s Examination Program
INTRODUCTION
OFHEO’s annual risk-based examination program is an integral part of a system designed to ensure the ongoing safety and soundness of Fannie Mae and Freddie Mac. The examination program assesses the appropriateness and effectiveness of the Enterprises’ policies and processes for risk management, and assesses the companies’ financial performance. Using a risk-based approach allows OFHEO to recognize the unique operations of each Enterprise while applying uniform safety and soundness standards throughout the year. This aspect of the examination program’s design ensures that OFHEO is responsive to changes at the Enterprises while not imposing unnecessary burdens. The analysis and testing conducted during the examinations add further depth and perspective to OFHEO’s oversight of Fannie Mae and Freddie Mac. The examination program contributes to OFHEO’s capital adequacy framework, by further informing the Director’s evaluation about the appropriateness of the balance of risk and capital at each Enterprise. The 2001 examinations found both Enterprises to be financially sound and well- managed.
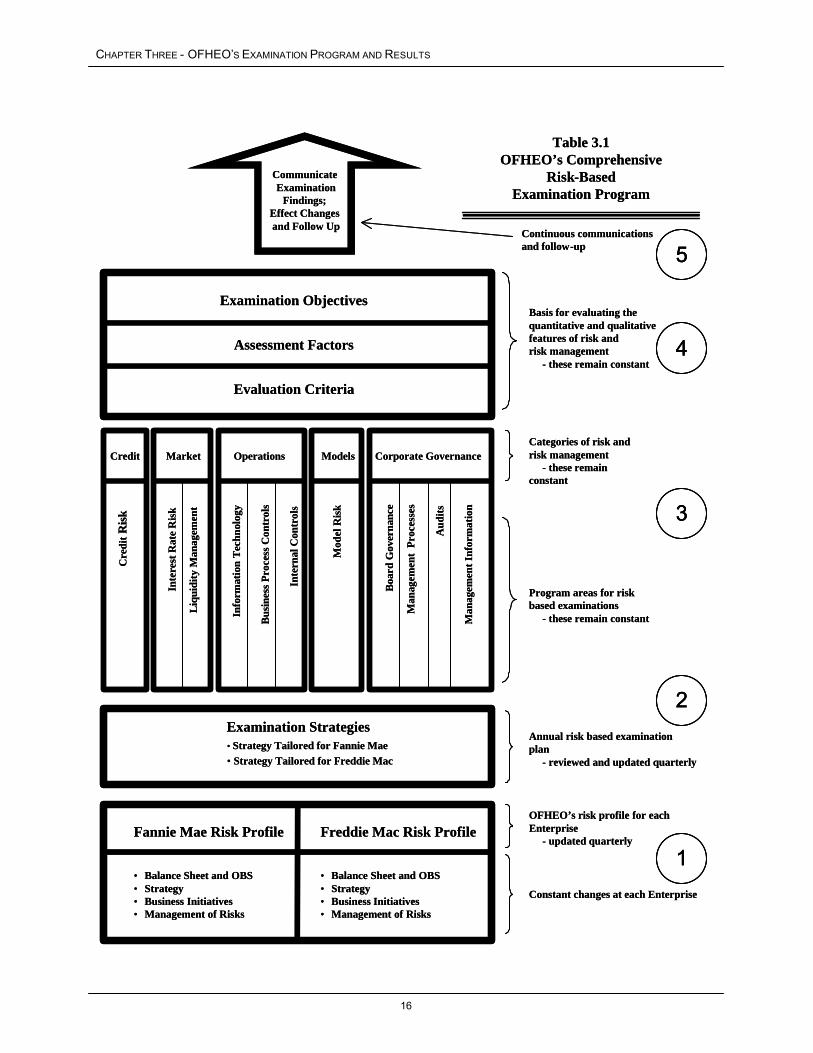
The process OFHEO employed in its comprehensive annual risk-based examinations to reach these conclusions is briefly described below, and depicted in Table 3.1. This information is provided to give context for the summary of the examination results and conclusions for each Enterprise. The description of the examination process corresponds to the chart in Table 3.1, beginning with the base of the chart and concluding at the top. Numeric references to the chart are included in the text that describes the examination process.
OFHEO’s Examination Program
Risk Profiles 1
Through a wealth of resources (including OFHEO knowledge, external sources and proprietary Enterprise information and data), the examination process begins by assessing the quantity of risk and quality of risk management at each Enterprise. OFHEO reviews each Enterprise’s risk profile at least quarterly, and revises its views if, for example, the Enterprise has planned or undertaken substantive new business initiatives, or if the Enterprise has substantially changed its level of risk or the manner in which it manages risks.
Examination Strategies 22
Based upon OFHEO’s unique position to understand the Enterprises’ risk profiles, OFHEO develops detailed examination strategies to provide effective, efficient oversight of each Enterprise. The annual written examination strategies are dynamic and represent a blueprint of the examination work to be conducted for the next year. The examination strategies are reviewed and updated quarterly based on Enterprise, industry and economic developments. In
17

CHAPTER THREE - OFHEO’S EXAMINATION PROGRAM AND RESULTS
conjunction with the strategies, OFHEO creates work plans that describe how the strategies will be achieved. The work plans outline the scope, timing and resources needed to meet the objectives and examination activities set forth in the strategies.
Program Areas for Risk-Based Examinations and Categories of Risk and Risk Management 33
Once OFHEO has strategies and work plans in place, examiners implement the strategies by completing exam work in each of the program areas for risk-based examinations. These are the program areas that capture the areas of risk and risk management being assessed at the Enterprises, with each program area focusing on specific sources of risk or risk management practices and tools. Later in this Chapter, OFHEO presents results and conclusions by program area for both Fannie Mae and Freddie Mac.
In order to enhance examinations and maximize expertise, OFHEO has grouped the program areas into four categories of risk and risk management, and aligned its examiner force expertise into five teams that correspond to the categories of risk and risk management, and provide analytical expertise and financial monitoring.
The focus of the eleven program areas, grouped by category, are:
CREDIT � Credit Risk Program – the risk that borrowers and counterparties will fail to meet their
contractual or other obligations to the Enterprise.
MARKET � Interest Rate Risk Program – the risk from movements in interest rates, including changes
in: the level of interest rates; the shape of the yield curve; the level of volatility; and the relationships or spreads among various yield curves or indices.
� Liquidity Management Program – the risk that could arise from an Enterprise’s inability to efficiently meet its obligations as they come due and to transact the next incremental dollar of business cost effectively.
MODEL EXPOSURE � Model Risk Program – the risk that could arise from inappropriate results or application of
financial models used for decision support in selecting, pricing and managing risk.
OPERATIONS � Information Technology Program – the infrastructure, or the general controls, needed to
safeguard data, protect computer application programs, prevent system software from unauthorized access, and ensure continued computer operations in case of unexpected interruptions.
18

CHAPTER THREE – OFHEO’S EXAMINATION PROGRAM AND RESULTS
� Business Process Controls Program – assesses the process employed to ensure business initiatives and endeavors are considered and evaluated within a complete business context with particular attention directed to risk assessment and risk management framework.
� Internal Controls Program – the plan of organization, methods and procedures adopted by management to ensure: goals and objectives are met; resource use is consistent with laws, regulations and policies; resources are safeguarded against waste, loss and misuse; and reliable data are obtained, maintained and fairly disclosed in reports.
CORPORATE GOVERNANCE � Audit Program – the risk that the Board or management’s reliance on internal or external
audits is misplaced. � Management Information Program – the risk that management will make decisions based
on ineffective, inaccurate or incomplete information or reports. � Management Processes Program – the processes used to drive behaviors to support the
Enterprise’s defined corporate goals, standards and risk tolerances. � Board Governance Program – the manner in which the Board discharges its duties and
responsibilities.
Evaluation Criteria, Assessment Factors and Examination Objectives 44
OFHEO conducts examination work in each of the 11 program areas by using evaluation criteria, assessment factors and examination objectives. The examination objectives are broad in scope, the assessment factors are more narrowly focused and the evaluative criteria are narrower still.
The approximately 700 evaluation criteria in the examination program detail both qualitative and quantitative items that examiners consider when making decisions about the assessment factors. The evaluation criteria are designed to assist the examiners and to ensure the examination work is consistent at both Enterprises by creating transparency and understanding of the framework within which examiners make judgments.
Examiners use the information and data from the evaluation criteria to form their expert opinions about the almost 100 assessment factors which in turn link directly to one or more of the examination objectives for each of the program areas. Sources for the assessment factors include industry standards and benchmarks, best practices and examiner expertise.
For each program area there are four or five examination objectives. These are the broad statements of what OFHEO’s examiners will achieve through their work in each of the eleven program areas. To make a determination on an examination objective, OFHEO’s examiners are required to opine on each of the supporting assessment factors. By using the evaluation criteria to reach judgments about the approximately 100 assessment factors, OFHEO achieves its examination objectives, and reaches the examination results and conclusions that are reported in this chapter.
19

CHAPTER THREE - OFHEO’S EXAMINATION PROGRAM AND RESULTS
Communication of Examination Findings 55
Throughout the course of conducting examinations, OFHEO communicates with Enterprise personnel not only to gather information, but also to share findings and discuss observations. OFHEO is committed to continuous, effective communication with the Enterprises. OFHEO has the same goal for all communications; that the free flow of information furthers the objective of ensuring the safe and sound operations of the Enterprises. Communications are tailored to the individual structure and dynamics of the Enterprise, and the timing of the communication depends on the situation being addressed. OFHEO keeps executive management and the Board appropriately informed and communicates directly with them as often as required by the Enterprise’s condition and the findings from examination activities. OFHEO brings those issues that introduce an exposure to the stable operation of the Enterprise, otherwise fall under the normal duties and responsibilities of the Board, or warrant the Board’s attention to the immediate attention of the Board and executive management. Technical issues and matters relating to a single line of business or activity are generally brought to the attention of operating managers with the Board and executive management kept appropriately informed.
Throughout the 2001 annual examination cycle, OFHEO’s examiners had ongoing dialogues with the operating management at both Enterprises about the operations and processes covered by each of the 11 examination program areas. In these discussions, the examiners shared their views about discrete opportunities the companies had to strengthen their operations and processes, including initiatives that, if implemented, would enhance existing tools and processes and minimize the resulting exposure to financial risk. The goal of ensuring the Enterprises’ operations meet or exceed financial safety and soundness standards at any given point in time is supported by this iterative process and netted results that found both companies to be well-managed and financially sound.
Effect Changes and Follow Up 55
A primary goal of the examination process is to influence positive changes at the Enterprises to enhance their financial safety and soundness. The intensity of the influence exerted by OFHEO relates directly to the risk presented by an issue. If, for example, in the course of an examination OFHEO identifies a significant issue in risk management systems or an undesirable risk level, OFHEO will require management to develop and execute a corrective action plan, and will ensure that the Board holds management accountable for executing the action plan. OFHEO will review the action plan to ensure it identifies the steps or methods required to cure the root causes of significant deficiencies, and determines whether the plan is likely to resolve the significant issues within an appropriate time frame. As part of follow-up, OFHEO verifies the action plan has been executed and evaluates its success.
OFHEO will consider the responsiveness of the Enterprise in recognizing the issue and formulating an effective solution when determining if OFHEO needs to take incremental action. If an Enterprise is unresponsive or unable to effect the resolution of meaningful issues, OFHEO will take more formal steps to ensure deficiencies are corrected.
20
CHAPTER THREE – OFHEO’S EXAMINATION PROGRAM AND RESULTS
While “effect changes and follow up” is at the top of the chart for the comprehensive annual risk-based examination process, in practice, the final step starts the examination cycle anew.
In accordance with our examination program, the results and conclusions for each program area are reported in relation to safety and soundness standards – whether they meet, exceed, or fail to meet safety and soundness standards. Throughout the annual examination cycle, January through December 2001, OFHEO’s examiners had ongoing dialogues with operating management at Fannie Mae and Freddie Mac about each company’s operations and processes in the program areas covered by Credit Risk, Market Risk, Operations Risk, Model Risk, and Corporate Governance. In these discussions, the examiners shared their views about discrete opportunities the company had to strengthen its operations and processes, including initiatives that, if implemented, would enhance existing tools and processes and minimize the resulting exposure to financial risk. The goal of ensuring the Enterprises’ operations meet or exceed financial safety and soundness standards at any given point in time is supported by this iterative examination process. At year-end 2001, both Fannie Mae and Freddie Mac exceeded safety and soundness standards in all examination program areas.
Throughout the year, operating management at both Fannie Mae and Freddie Mac were responsive and effective in addressing issues raised for their attention and action.
The results which are reported below reflect the examination work conducted from January through December 2001, and do not necessarily reflect the current condition or operations of the Enterprises. The results and conclusions presented for 2001 are similar to the results and conclusions reported in 2000. As described above, OFHEO’s comprehensive risk-based examinations apply a consistent set of standards to assess and evaluate each Enterprise’s financial condition, business operations, and internal controls. These standards remain consistent from year-to-year and are appropriately updated to reflect enhancements in regulatory best practice, developments in risk management or market practices, and innovations at either Enterprise. The similarity between the 2000 and 2001 examination results and conclusions stems from the Enterprises’ continuing strong financial performance, their maintenance of sound financial fundamentals, their maintenance of effective risk management and control practices, and a favorable business environment.
21

CHAPTER THREE - OFHEO’S EXAMINATION PROGRAM AND RESULTS
Fannie Mae Examination Results and Conclusions
Fannie Mae’s credit risk management and credit risk management framework exceed safety and soundness standards, and they have resulted in a high-quality portfolio and manageable credit exposure. The portfolio is diversified and the profile of credit risk is in compliance with the internally prescribed limits that examiners have deemed to be appropriate. Policies, procedures, internal controls and management reporting for the credit function are effective. Fannie Mae is appropriately compensated for the credit risk it assumes. Management prudently manages counterparty exposure. New products and initiatives are well researched prior to implementation. The process for determining the reserve for losses and credit risk sharing strategies are effective, as are the tools used to manage credit risk. Fannie Mae effectively identifies, quantifies and tracks its credit risk exposures. Management has an effective means for following up on credit-related issues. The technology and controls supporting the credit risk management function are effective. Management effectively reconciles differences between actual and expected credit portfolio performance.
Fannie Mae’s interest rate risk management exceeds safety and soundness standards. The policies, procedures, internal controls and management reporting relating to interest rate risk are appropriate and effective. Management has a meaningful methodology for quantifying and monitoring the level and nature of interest rate risk. Fannie Mae’s management effectively follows up on issues related to interest rate risk. Fannie Mae appropriately researches and controls the extent to which new products and initiatives may impact the interest rate risk profile. The technology and controls supporting the interest rate risk management function are effective. The tools used to model interest rate risk, and the strategies to alter the exposures to interest rates are prudent and effective. Management effectively incorporates tactical and strategic issues into the management of interest rate risk. The responsibilities for strategy and analytics functions are appropriately separated from those for the execution functions. Derivative instruments are used prudently for hedging risks and in accordance with the standards used by other large financial intermediaries. (Box 3.1.)
Fannie Mae’s liquidity management exceeds safety and soundness standards. The policies, procedures, internal controls and management reporting relating to liquidity management are appropriate and effective. Management has an effective methodology for quantifying and monitoring liquidity, and management appropriately evaluates the impact of various events and alternative environments when developing and updating contingency plans. The planning process for liquidity management is effective. Fannie Mae appropriately considers the impact new products and initiatives may have on liquidity. Management effectively follows up on issues and initiatives that influence liquidity. Technology and controls for liquidity management are prudent and effective. The quality of tools Fannie Mae uses to manage and monitor liquidity, and the quality of tools used to perform scenario analyses are comprehensive and effective. An appropriate separation of duties exists between the strategy and analytics functions and the execution function. Fannie Mae effectively analyzes and is well positioned to respond to trends and anomalies in the market and funding spreads. Liquidity management is appropriately integrated with other management and financial performance issues.
22

CHAPTER THREE – OFHEO’S EXAMINATION PROGRAM AND RESULTS
The information technology infrastructure and surrounding risk management framework exceed safety and soundness standards. Operating processes are in place to ensure secure, effective and efficient data center processing and problem management. There are effective policies and processes in place to ensure data, information and computing resources are secure and accessed only by authorized users. There are effective policies and processes in place to ensure the timely and appropriate resumption of business in the event of a disaster and these are routinely tested and enhanced. Management has processes in place that ensure information technology plans effectively address business unit and corporate objectives. Effective processes are in place to ensure appropriate controls are implemented and maintained. Documentation for system development and maintenance is complete. Fannie Mae has implemented effective processes to ensure data and information are processed accurately and in a timely manner. Effective controls are in place and regularly tested to secure networks and/or firewalls from unauthorized or inappropriate actions. Fannie Mae has policies and procedures to ensure the conduct of e-commerce is secure. Fannie Mae has effective controls over end-user computing.
Fannie Mae’s internal control framework and the management of that framework exceed safety and soundness standards. Management has an accurate and reliable process for identifying risks to business processes and implementing appropriate controls. Implemented controls properly address risks assessed by management. Management has a reliable process for ensuring the timely resolution of control-related issues. Internal Audit appropriately identifies and communicates control deficiencies to management and the Board of Directors. There are established policies and procedures that delineate internal control process and standards resulting in a sound control environment. Management routinely tests and ensures compliance with established internal controls.
The framework for business process controls and the management of that framework exceeds safety and soundness standards. The processes and control environment used when Fannie Mae considers and/or develops new or substantially revised business initiatives are effective. The use of pilot programs and the communication flows surrounding new or substantially revised business initiatives are effective. The balance between risk management, internal controls and the pressure to develop new or substantially revised business initiatives is appropriate. Fannie Mae’s corporate culture fosters the introduction of new ideas and values intellectual capital. Both the analysis and review conducted for potential new or substantially revised business initiatives, and the periodic analysis conducted after a new or substantially revised business initiative is launched, are effective and comprehensive.
The audit functions exceed safety and soundness standards. (Box 3.2.) The Internal and External Audit functions have the appropriate independence. Auditors performing the work possess appropriate professional proficiency. The scope of Internal and External Audit work performed is appropriate and comprehensive, and the audit work is documented and complete. The management of the Internal Audit department is effective. Executive management and the Board of Directors are appropriately involved with and follow up on identified audit issues. The auditor’s risk assessment process is effective. Internal Audit is appropriately involved in new products and new initiatives.
The Board discharges its duties and responsibilities in a manner that exceeds safety and soundness standards. (Box 3.3.) In discharging its duties and responsibilities, the Board of
23

CHAPTER THREE - OFHEO’S EXAMINATION PROGRAM AND RESULTS
Directors operates with the appropriate independence. The Board is appropriately engaged in the development of a strategic direction for the company, and the Board ensures management appropriately defines the operating parameters and risk tolerances of the Enterprise in a manner consistent with the strategic direction; legal standards; and ethical standards. The Board has an effective process for hiring and maintaining a quality executive management team, and the Board effectively holds the executive management team accountable for achieving the defined goals and objectives. The Board is appropriately informed of the condition, activities and operations of the Enterprise, and has sufficient, well-organized time to carry out its responsibilities. The framework used to produce timely, accurate and reliable reports exceeds safety and soundness standards and provides end-users with accurate and reliable information. Management and the Board of Directors receive complete and comprehensive reports on Fannie Mae’s performance relative to established goals and objectives. Management reporting provides the levels of management with the necessary information to carry out their responsibilities efficiently and effectively. Management reporting permits management to evaluate and gauge the quality of their decisions. Information systems are linked to Fannie Mae’s overall strategy, and are developed and refined consistent with the strategic direction and plan. The reports management uses for decision making are accurate. Enterprise strategy, roles and responsibility are effectively communicated. Employees have effective channels of communication to provide feedback, report suspected improprieties and suggest enhancements. Communications across the company are effective.
Key management processes that influence company-wide talent and behaviors exceed safety and soundness standards. The strategic planning process is comprehensive. Business unit goals, implementation plans and programs designed to achieve the corporate plan are effective. Management is able to monitor and manage change. Key performance measures are appropriate, effective and align with strategy. The behavior management programs are effectively designed to achieve corporate goals and objectives. Fannie Mae has effective programs for career and management development, and for identifying and recruiting competent people. Fannie Mae’s proprietary risk management programs and systems are effective. Management effectively conveys an appropriate message of integrity and ethical values. Management’s philosophy and operating style are consistent, and they have a pervasive effect on the company. The organizational structure and the assignment of responsibility provide for accountability and sound controls.
24
CHAPTER THREE – OFHEO’S EXAMINATION PROGRAM AND RESULTS
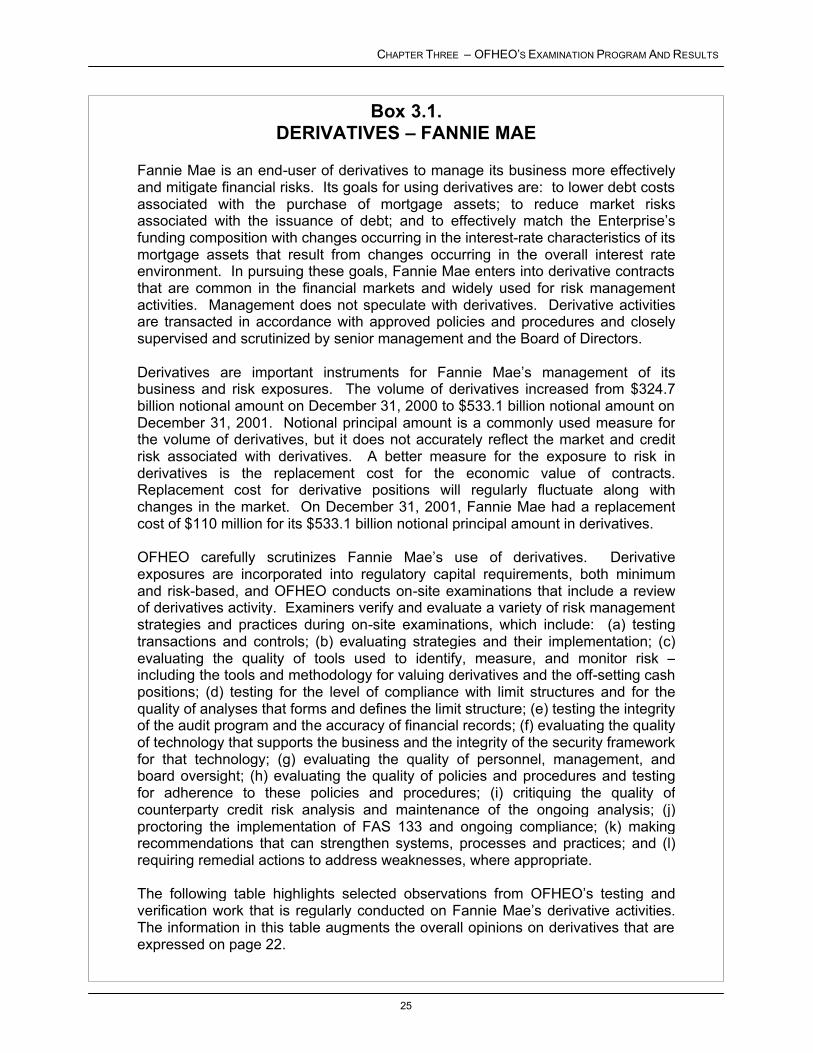
Box 3.1. DERIVATIVES – FANNIE MAE
Fannie Mae is an end-user of derivatives to manage its business more effectively and mitigate financial risks. associated with the purchase of mortgage assets; to reduce market risks associated with the issuance of debt; and to effectively match the Enterprise’s funding composition with changes occurring in the interest-rate characteristics of its mortgage assets that result from changes occurring in the overall interest rate environment. that are common in the financial markets and widely used for risk management activities. are transacted in accordance with approved policies and procedures and closely supervised and scrutinized by senior management and the Board of Directors.
Derivatives are important instruments for Fannie Mae’s management of its business and risk exposures. The volume of derivatives increased from $324.7 billion notional amount on December 31, 2000 to $533.1 billion notional amount on December 31, 2001. the volume of derivatives, but it does not accurately reflect the market and credit risk associated with derivatives. derivatives is the replacement cost for the economic value of contracts. Replacement cost for derivative positions will regularly fluctuate along with changes in the market. cost of $110 million for its $533.1 billion notional principal amount in derivatives.
OFHEO carefully scrutinizes Fannie Mae’s use of derivatives. exposures are incorporated into regulatory capital requirements, both minimum and risk-based, and OFHEO conducts on-site examinations that include a review of derivatives activity. strategies and practices during on-site examinations, which include: transactions and controls; (b) evaluating strategies and their implementation; (c) evaluating the quality of tools used to identify, measure, and monitor risk – including the tools and methodology for valuing derivatives and the off-setting cash positions; (d) testing for the level of compliance with limit structures and for the quality of analyses that forms and defines the limit structure; (e) testing the integrity of the audit program and the accuracy of financial records; (f) evaluating the quality of technology that supports the business and the integrity of the security framework for that technology; (g) evaluating the quality of personnel, management, and board oversight; (h) evaluating the quality of policies and procedures and testing for adherence to these policies and procedures; (i) critiquing the quality of counterparty credit risk analysis and maintenance of the ongoing analysis; (j) proctoring the implementation of FAS 133 and ongoing compliance; (k) making recommendations that can strengthen systems, processes and practices; and (l) requiring remedial actions to address weaknesses, where appropriate.
The following table highlights selected observations from OFHEO’s testing and verification work that is regularly conducted on Fannie Mae’s derivative activities. The information in this table augments the overall opinions on derivatives that are expressed on page 22.
to lower debt costs Its goals for using derivatives are:
In pursuing these goals, Fannie Mae enters into derivative contracts
Derivative activities Management does not speculate with derivatives.
Notional principal amount is a commonly used measure for
A better measure for the exposure to risk in
On December 31, 2001, Fannie Mae had a replacement
Derivative
Examiners verify and evaluate a variety of risk management (a) testing
25

CHAPTER THREE - OFHEO’S EXAMINATION PROGRAM AND RESULTS
BOX 3.1. DERIVATIVES - FANNIE MAE
WHAT OFHEO DOES OBSERVATIONS ON FANNIE MAE 3.1.a. Topic: Derivatives activity is governed by sound policies, procedures and effective internal controls and consistent with the prescribed purpose. • OFHEO evaluates the appropriateness of policies,
procedures, internal controls, and reports. • OFHEO evaluates the process for establishing
limits, the appropriateness of limit structures, and the appropriateness of prescribed practices.
• OFHEO evaluates the level of directorate and management oversight and reporting.
• OFHEO’s evaluations reflect, among other things, the perspective gained from years of examination and market experience, comparisons with practices at other large financial intermediaries and end-users, and emerging best practices.
• Management operates with policies and procedures that cover the use of derivatives. (Examiners verify and evaluate.)
• Clear lines of responsibility and accountability exist, including independent risk oversight. (Examiners verify and evaluate.)
• Controls are in place that safeguard the integrity of data used for models, reporting, and decision-making. (Examiners test, verify, and evaluate.)
• Models are independently validated, subject to formal change management, and controlled to preclude unauthorized & untested changes to the models. (Examiners verify and evaluate.)
• Contingency plans and business continuity plans provide for disaster recovery and enable continued monitoring of risk positions in the event of business interruption. (Examiners verify and evaluate.)
• Technology, tracking systems, and records are effective enabling the Enterprise to document, analyze, and monitor risk positions and compliance with risk limits. (Examiners verify and evaluate.)
• Derivative reporting is appropriately comprehensive and tailored to meet the respective audience’s needs. (Examiners test, verify, and evaluate.)
• Management systems and reporting for derivatives are comprehensive and capture the risks and other important attributes for consideration. (Examiners test, verify, and evaluate.)
• Compliance programs and audit coverage are effective in policing compliance with policies, procedures, limits, strategies, and internal controls for derivatives transactions and activities. (Examiners verify and evaluate.)
• There is appropriate separation of duties among personnel working with derivatives and overseeing derivatives activities. Independent risk oversight proctors activities and compliance. There is adherence to risk limits and formal reports are regularly generated that track compliance, usage, and approved exceptions to limits. (Examiners test and verify.)
• Reporting and risk management protocols exist for new initiatives and require detailed tracking, reporting, and analysis to evaluate performance or any unexpected outcomes. (Examiners verify and evaluate.)
26
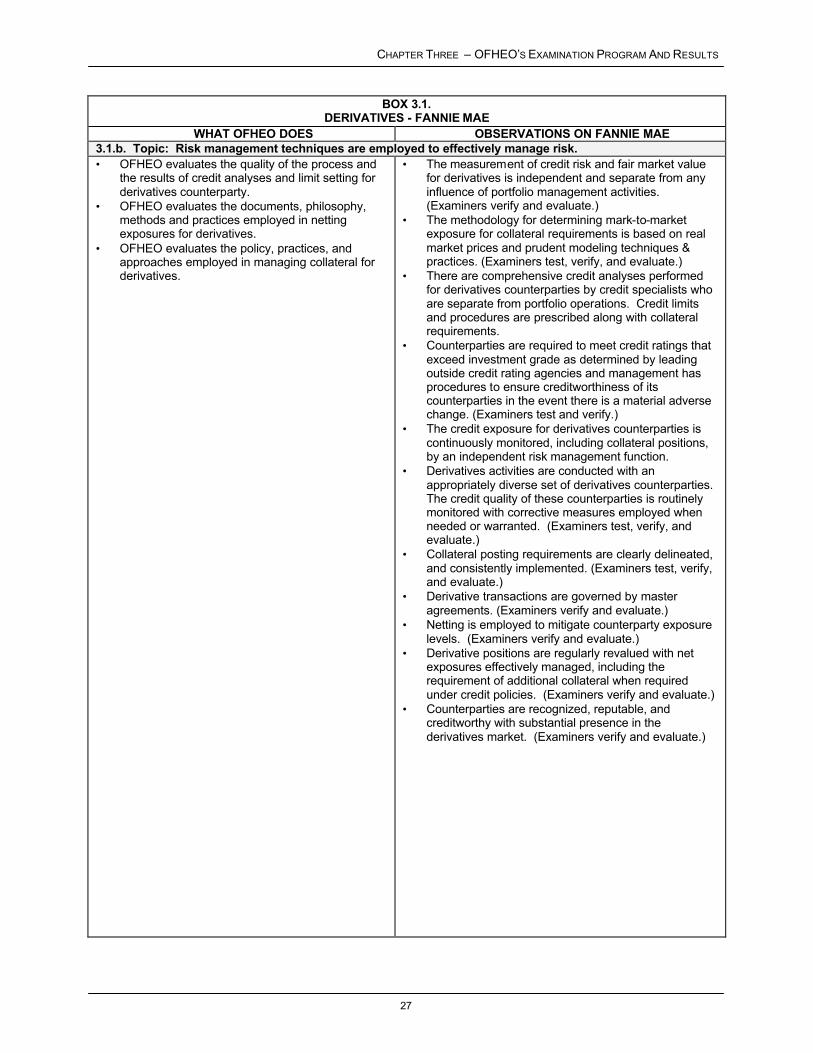
CHAPTER THREE – OFHEO’S EXAMINATION PROGRAM AND RESULTS
BOX 3.1. DERIVATIVES - FANNIE MAE
WHAT OFHEO DOES OBSERVATIONS ON FANNIE MAE 3.1.b. Topic: Risk management techniques are employed to effectively manage risk. • OFHEO evaluates the quality of the process and
the results of credit analyses and limit setting for derivatives counterparty.
• OFHEO evaluates the documents, philosophy, methods and practices employed in netting exposures for derivatives.
• OFHEO evaluates the policy, practices, and approaches employed in managing collateral for derivatives.
• The measurement of credit risk and fair market value for derivatives is independent and separate from any influence of portfolio management activities. (Examiners verify and evaluate.)
• The methodology for determining mark-to-market exposure for collateral requirements is based on real market prices and prudent modeling techniques & practices. (Examiners test, verify, and evaluate.)
• There are comprehensive credit analyses performed for derivatives counterparties by credit specialists who are separate from portfolio operations. Credit limits and procedures are prescribed along with collateral requirements.
• Counterparties are required to meet credit ratings that exceed investment grade as determined by leading outside credit rating agencies and management has procedures to ensure creditworthiness of its counterparties in the event there is a material adverse change. (Examiners test and verify.)
• The credit exposure for derivatives counterparties is continuously monitored, including collateral positions, by an independent risk management function.
• Derivatives activities are conducted with an appropriately diverse set of derivatives counterparties. The credit quality of these counterparties is routinely monitored with corrective measures employed when needed or warranted. (Examiners test, verify, and evaluate.)
• Collateral posting requirements are clearly delineated, and consistently implemented. (Examiners test, verify, and evaluate.)
• Derivative transactions are governed by master agreements. (Examiners verify and evaluate.)
• Netting is employed to mitigate counterparty exposure levels. (Examiners verify and evaluate.)
• Derivative positions are regularly revalued with net exposures effectively managed, including the requirement of additional collateral when required under credit policies. (Examiners verify and evaluate.)
• Counterparties are recognized, reputable, and creditworthy with substantial presence in the derivatives market. (Examiners verify and evaluate.)
27
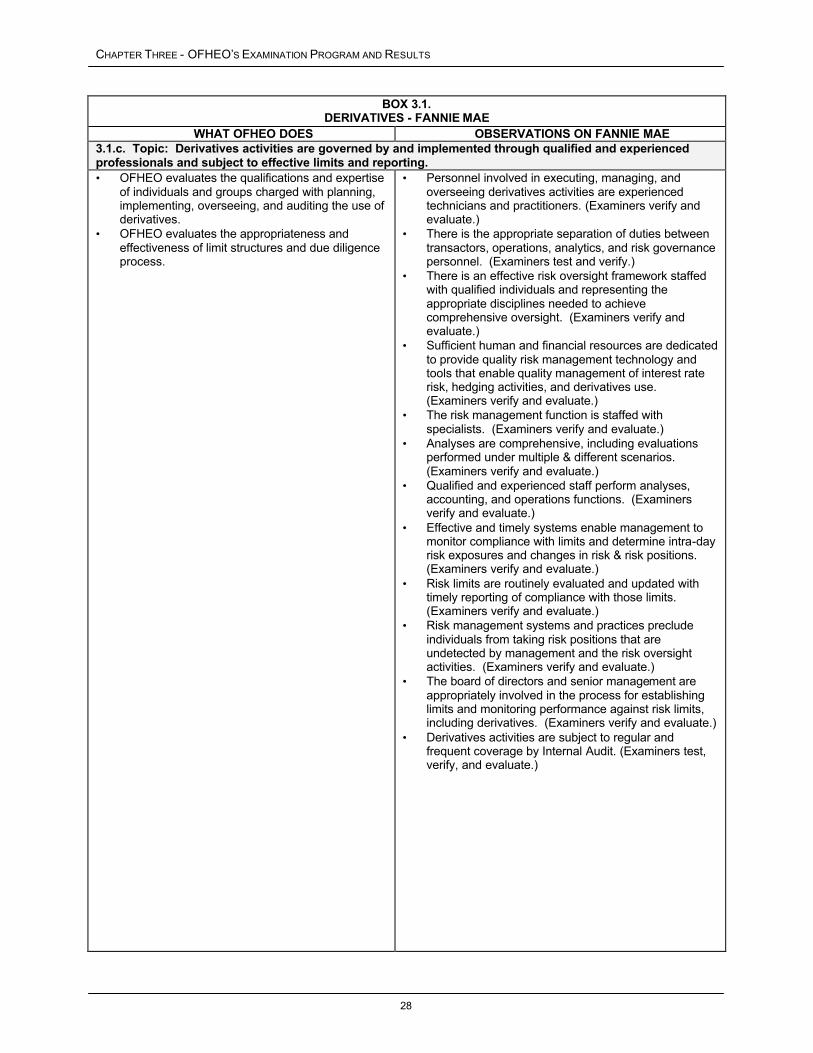
CHAPTER THREE - OFHEO’S EXAMINATION PROGRAM AND RESULTS
BOX 3.1. DERIVATIVES - FANNIE MAE
WHAT OFHEO DOES OBSERVATIONS ON FANNIE MAE 3.1.c. Topic: Derivatives activities are governed by and implemented through qualified and experienced professionals and subject to effective limits and reporting. • OFHEO evaluates the qualifications and expertise
of individuals and groups charged with planning, implementing, overseeing, and auditing the use of derivatives.
• OFHEO evaluates the appropriateness and effectiveness of limit structures and due diligence process.
• Personnel involved in executing, managing, and overseeing derivatives activities are experienced technicians and practitioners. (Examiners verify and evaluate.)
• There is the appropriate separation of duties between transactors, operations, analytics, and risk governance personnel. (Examiners test and verify.)
• There is an effective risk oversight framework staffed with qualified individuals and representing the appropriate disciplines needed to achieve comprehensive oversight. (Examiners verify and evaluate.)
• Sufficient human and financial resources are dedicated to provide quality risk management technology and tools that enable quality management of interest rate risk, hedging activities, and derivatives use. (Examiners verify and evaluate.)
• The risk management function is staffed with specialists. (Examiners verify and evaluate.)
• Analyses are comprehensive, including evaluations performed under multiple & different scenarios. (Examiners verify and evaluate.)
• Qualified and experienced staff perform analyses, accounting, and operations functions. (Examiners verify and evaluate.)
• Effective and timely systems enable management to monitor compliance with limits and determine intra-day risk exposures and changes in risk & risk positions. (Examiners verify and evaluate.)
• Risk limits are routinely evaluated and updated with timely reporting of compliance with those limits. (Examiners verify and evaluate.)
• Risk management systems and practices preclude individuals from taking risk positions that are undetected by management and the risk oversight activities. (Examiners verify and evaluate.)
• The board of directors and senior management are appropriately involved in the process for establishing limits and monitoring performance against risk limits, including derivatives. (Examiners verify and evaluate.)
• Derivatives activities are subject to regular and frequent coverage by Internal Audit. (Examiners test, verify, and evaluate.)
28

CHAPTER THREE – OFHEO’S EXAMINATION PROGRAM AND RESULTS
BOX 3.1. DERIVATIVES - FANNIE MAE
WHAT OFHEO DOES OBSERVATIONS ON FANNIE MAE 3.1.d. Topic: Derivatives strategies and positions are appropriate and well-documented. • OFHEO evaluates hedging strategies, derivatives
transactions, risk exposures, and analysis of hedge effectiveness.
• OFHEO evaluates the process and actions employed to rebalance the portfolio.
• OFHEO evaluates the funding strategies and the use of derivatives to implement those funding strategies.
• OFHEO evaluates the appropriateness of GAAP accounting for derivatives.
• Derivatives are not used for speculative purposes. (Examiners verify and evaluate.)
• Interest rate risk, changes in that risk, and the funding environment are continuously monitored. Management takes prompt action to rebalance and remain within desirable risk tolerances and be in adherence with risk limits. (Examiners verify and evaluate.)
• Strategies are formal and regularly re-evaluated and refined or altered to effectively manage risk positions, including how derivatives are used. (Examiners verify and evaluate.)
• Management considers multiple scenarios, interest rate environments, and market conditions when performing its analyses, and develops comprehensive contingency plans. (Examiners verify and evaluate.)
• Hedge performance and hedge strategies are tracked and compared to expected performance. (Examiners verify and evaluate.)
• Management augments its analyses with ’stress-testing’ and ‘back-testing’ and considers the results of these tests in its planning. (Examiners verify and evaluate.)
• All derivatives are included in risk and sensitivity analyses and cash management forecasts. (Examiners test and verify.)
• The methodology employed in performing valuations for derivatives is sound, and the controls surrounding that independent methodology produces reliable values. (Examiners test, verify, and evaluate.)
• Derivatives are regularly marked-to-market. (Examiners test and verify.)
• FAS 133 implementation has been deliberate and well-documented with the necessary investments made to provide systems needed to ensure ongoing compliance. (Examiners test, verify, and evaluate.)
29
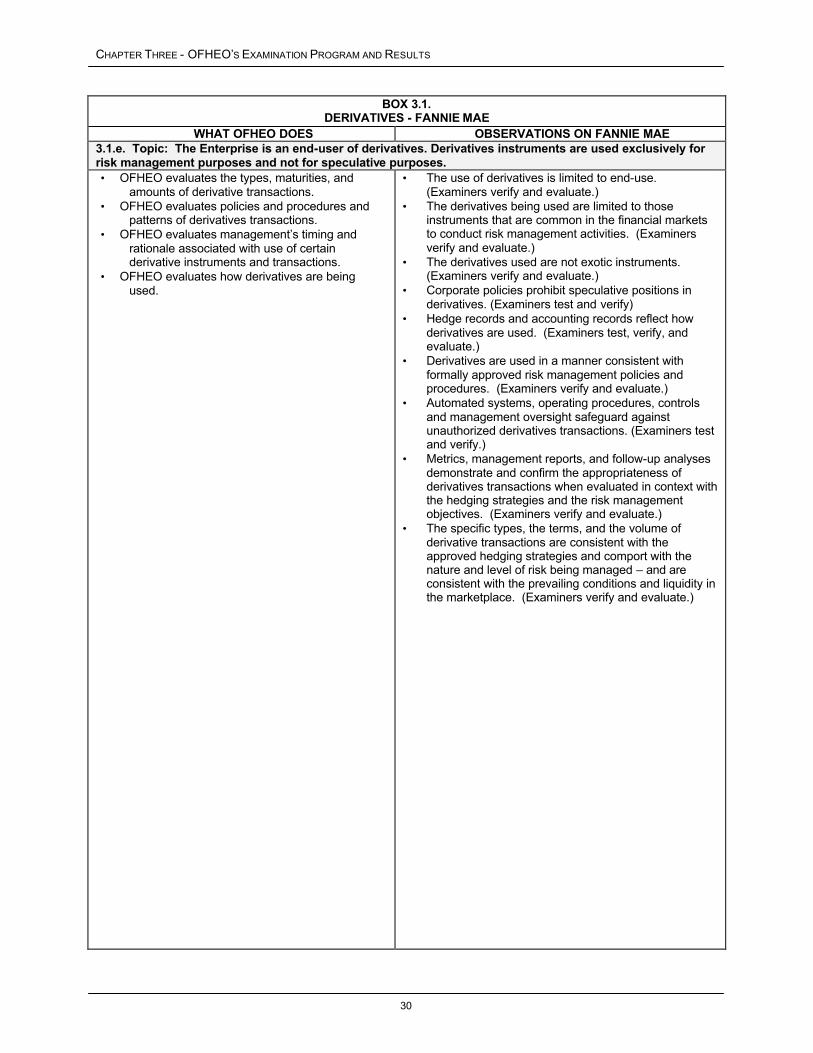
CHAPTER THREE - OFHEO’S EXAMINATION PROGRAM AND RESULTS
BOX 3.1. DERIVATIVES - FANNIE MAE
WHAT OFHEO DOES OBSERVATIONS ON FANNIE MAE 3.1.e. Topic: The Enterprise is an end-user of derivatives. Derivatives instruments are used exclusively for risk management purposes and not for speculative purposes. • OFHEO evaluates the types, maturities, and
amounts of derivative transactions. • OFHEO evaluates policies and procedures and
patterns of derivatives transactions. • OFHEO evaluates management’s timing and
rationale associated with use of certain derivative instruments and transactions.
• OFHEO evaluates how derivatives are being used.
• The use of derivatives is limited to end-use. (Examiners verify and evaluate.)
• The derivatives being used are limited to those instruments that are common in the financial markets to conduct risk management activities. (Examiners verify and evaluate.)
• The derivatives used are not exotic instruments. (Examiners verify and evaluate.)
• Corporate policies prohibit speculative positions in derivatives. (Examiners test and verify)
• Hedge records and accounting records reflect how derivatives are used. (Examiners test, verify, and evaluate.)
• Derivatives are used in a manner consistent with formally approved risk management policies and procedures. (Examiners verify and evaluate.)
• Automated systems, operating procedures, controls and management oversight safeguard against unauthorized derivatives transactions. (Examiners test and verify.)
• Metrics, management reports, and follow-up analyses demonstrate and confirm the appropriateness of derivatives transactions when evaluated in context with the hedging strategies and the risk management objectives. (Examiners verify and evaluate.)
• The specific types, the terms, and the volume of derivative transactions are consistent with the approved hedging strategies and comport with the nature and level of risk being managed – and are consistent with the prevailing conditions and liquidity in the marketplace. (Examiners verify and evaluate.)
30

CHAPTER THREE – OFHEO’S EXAMINATION PROGRAM AND RESULTS
BOX 3.1. DERIVATIVES - FANNIE MAE
WHAT OFHEO DOES OBSERVATIONS ON FANNIE MAE 3.1.f. Topic: A meaningful methodology is employed to quantify and monitor the risks associated with derivatives. • OFHEO evaluates the quality and appropriateness
of valuation methodologies for derivatives. • OFHEO evaluates the quality of analyses and
tools to gauge the future value of derivatives instruments and positions under alternate scenarios.
• Systems for data capture, processing, settlement, and management reporting are prudent and provide accurate and reliable information. (Examiners verify and evaluate.)
• Model assumptions and parameters are independently validated and continuously reviewed for reasonableness. (Examiners test, verify, and evaluate.)
• Changes to model assumptions are thoroughly reviewed, monitored for reasonableness, and revalidated. (Examiners test, verify and evaluate.)
• Management has effective processes and controls to detect and report changes to the model assumptions or operations. Changes to the model’s assumptions or operations are documented and tracked. (Examiners verify and evaluate.)
• Robust tools are employed for pricing and evaluating the effect of changes to interest rates or changes in the shape of the yield curve that cover all categories of the balance sheet, including derivatives. (Examiners verify and evaluate.)
• Robust prepayment models consider a wide variety of factors that can affect prepayment speeds. Performance of prepayment models is regularly evaluated and tracked. (Examiners test, verify, and evaluate.)
• Valuations produced by the model are validated using actual market quotes where appropriate. (Examiners verify and evaluate.)
31

CHAPTER THREE - OFHEO’S EXAMINATION PROGRAM AND RESULTS
Box 3.2. AUDIT PROGRAM – FANNIE MAE
Central to an effective internal control system and the safe and sound operation of any financial organization is an independent and professional audit program. When properly structured and conducted, an audit program provides the directors and senior management with important information about weaknesses in the system of internal controls. board of directors and senior officers to take prompt, remedial action when necessary, and enables a company’s board of directors and senior officers to meet their responsibilities to ensure that the system of controls operates effectively resulting in: (c) compliance with laws, regulations, policies and procedures.
OFHEO, like the banking regulators, reviews and evaluates Fannie Mae’s audit program improvements. conducted by the internal auditors and the external auditors and evaluate: level of independence, (b) the appropriateness of the scope, (c) the quality of the work and its documentation, (d) the quality of communications associated with the results, and (e) the quality of board and senior management action and follow-up.
The following table highlights selected observations from OFHEO’s testing and verification work that is regularly conducted on Fannie Mae’s internal and external audit programs. ons on the audit programs that are expressed on page 23.
An effective audit program positions a company’s
(a) assets being safeguarded, (b) financial reports being reliable, and
needed for recommendations makes necessary, when and In evaluating the audit program, examiners test the work
(a) the
The information in this table augments the overall opini
32
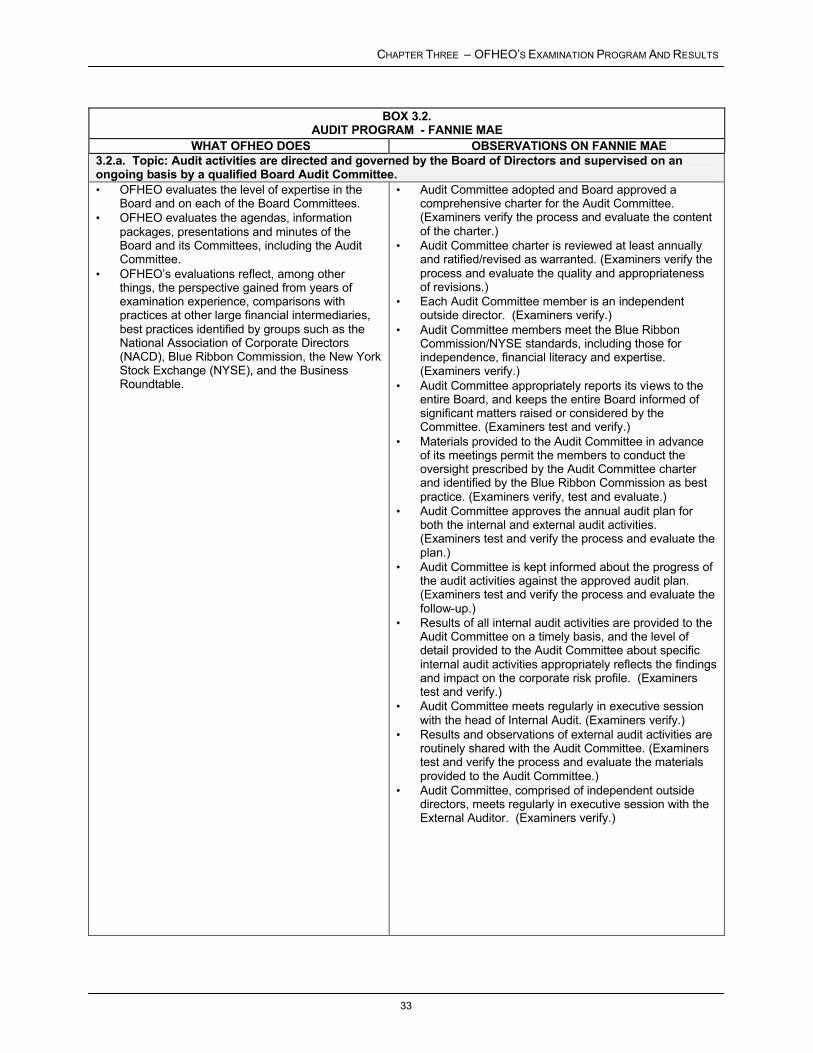
CHAPTER THREE – OFHEO’S EXAMINATION PROGRAM AND RESULTS
BOX 3.2. AUDIT PROGRAM - FANNIE MAE
WHAT OFHEO DOES OBSERVATIONS ON FANNIE MAE 3.2.a. Topic: Audit activities are directed and governed by the Board of Directors and supervised on an ongoing basis by a qualified Board Audit Committee. • OFHEO evaluates the level of expertise in the
Board and on each of the Board Committees. • OFHEO evaluates the agendas, information
packages, presentations and minutes of the Board and its Committees, including the Audit Committee.
• OFHEO’s evaluations reflect, among other things, the perspective gained from years of examination experience, comparisons with practices at other large financial intermediaries, best practices identified by groups such as the National Association of Corporate Directors (NACD), Blue Ribbon Commission, the New York Stock Exchange (NYSE), and the Business Roundtable.
• Audit Committee adopted and Board approved a comprehensive charter for the Audit Committee. (Examiners verify the process and evaluate the content of the charter.)
• Audit Committee charter is reviewed at least annually and ratified/revised as warranted. (Examiners verify the process and evaluate the quality and appropriateness of revisions.)
• Each Audit Committee member is an independent outside director. (Examiners verify.)
• Audit Committee members meet the Blue Ribbon Commission/NYSE standards, including those for independence, financial literacy and expertise. (Examiners verify.)
• Audit Committee appropriately reports its views to the entire Board, and keeps the entire Board informed of significant matters raised or considered by the Committee. (Examiners test and verify.)
• Materials provided to the Audit Committee in advance of its meetings permit the members to conduct the oversight prescribed by the Audit Committee charter and identified by the Blue Ribbon Commission as best practice. (Examiners verify, test and evaluate.)
• Audit Committee approves the annual audit plan for both the internal and external audit activities. (Examiners test and verify the process and evaluate the plan.)
• Audit Committee is kept informed about the progress of the audit activities against the approved audit plan. (Examiners test and verify the process and evaluate the follow-up.)
• Results of all internal audit activities are provided to the Audit Committee on a timely basis, and the level of detail provided to the Audit Committee about specific internal audit activities appropriately reflects the findings and impact on the corporate risk profile. (Examiners test and verify.)
• Audit Committee meets regularly in executive session with the head of Internal Audit. (Examiners verify.)
• Results and observations of external audit activities are routinely shared with the Audit Committee. (Examiners test and verify the process and evaluate the materials provided to the Audit Committee.)
• Audit Committee, comprised of independent outside directors, meets regularly in executive session with the External Auditor. (Examiners verify.)
33

CHAPTER THREE - OFHEO’S EXAMINATION PROGRAM AND RESULTS
BOX 3.2. AUDIT PROGRAM - FANNIE MAE
WHAT OFHEO DOES OBSERVATIONS ON FANNIE MAE 3.2.b. Topic: The Board and Audit Committee are regularly apprised of OFHEO’s view of the quality of the internal and external audit programs, and the quality and effectiveness of management’s follow-up on issues identified through the audit process. • OFHEO regularly communicates with the Board
of Directors to share its results, conclusions, recommendations and follow-up for all areas of the examination.
• OFHEO’s communications specifically address the quality of both the internal and external audit functions, and the level of reliance OFHEO believes is appropriate for the Board and Audit Committee to place on those functions.
• OFHEO’s communications are directed to both the Audit Committee, comprised entirely of independent outside Directors, and to all members of the Board.
• OFHEO conducts meetings with outside Directors.
• OFHEO’s regular communications about examination activities, including those related to internal and external audit functions, are provided to each Board member and are included in the Board packages and official Board records. (Examiners verify.)
• Fannie Mae management shares specific examination observations directed to management with the Board, including observations related to internal and external audit functions. (Examiners test and verify.)
• The Board and Audit Committee discuss and consider OFHEO’s communications about examination activities. (Examiners verify.)
• The Audit Committee, comprised solely of independent outside directors, meets with OFHEO’s Chief Examiner and the substance of the communications are documented. (Examiners verify.)
34
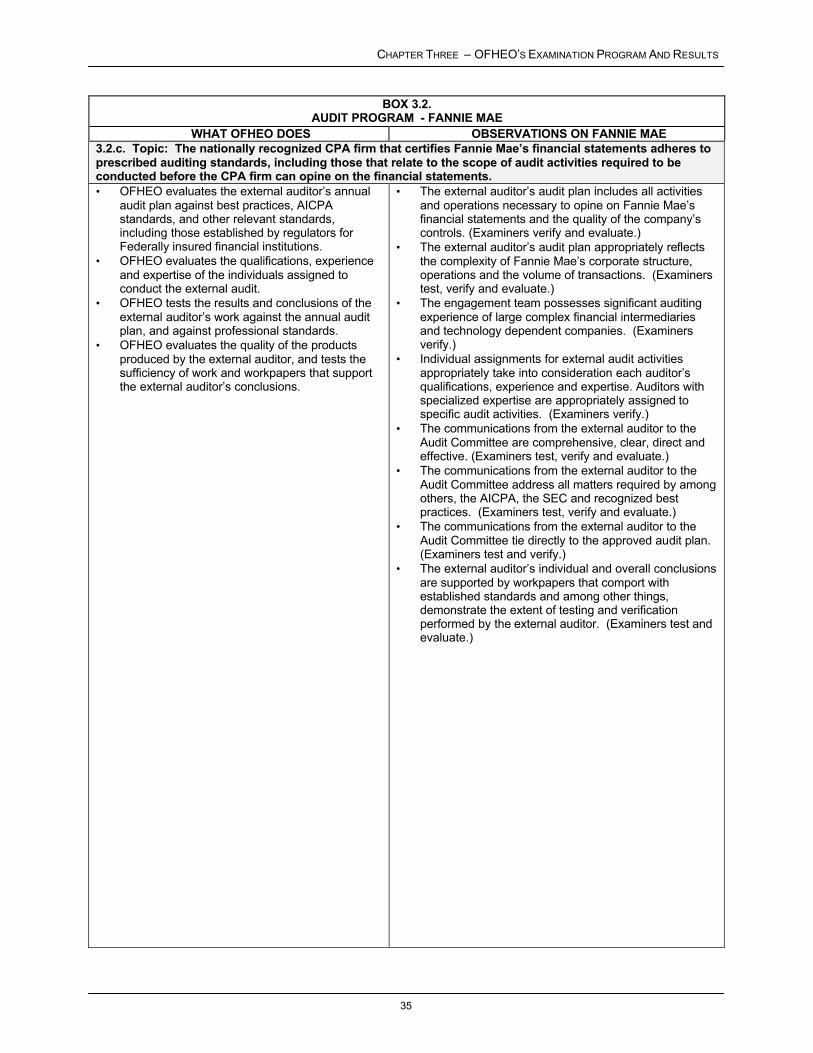
CHAPTER THREE – OFHEO’S EXAMINATION PROGRAM AND RESULTS
BOX 3.2. AUDIT PROGRAM - FANNIE MAE
WHAT OFHEO DOES OBSERVATIONS ON FANNIE MAE 3.2.c. Topic: The nationally recognized CPA firm that certifies Fannie Mae’s financial statements adheres to prescribed auditing standards, including those that relate to the scope of audit activities required to be conducted before the CPA firm can opine on the financial statements. • OFHEO evaluates the external auditor’s annual
audit plan against best practices, AICPA standards, and other relevant standards, including those established by regulators for Federally insured financial institutions.
• OFHEO evaluates the qualifications, experience and expertise of the individuals assigned to conduct the external audit.
• OFHEO tests the results and conclusions of the external auditor’s work against the annual audit plan, and against professional standards.
• OFHEO evaluates the quality of the products produced by the external auditor, and tests the sufficiency of work and workpapers that support the external auditor’s conclusions.
• The external auditor’s audit plan includes all activities and operations necessary to opine on Fannie Mae’s financial statements and the quality of the company’s controls. (Examiners verify and evaluate.)
• The external auditor’s audit plan appropriately reflects the complexity of Fannie Mae’s corporate structure, operations and the volume of transactions. (Examiners test, verify and evaluate.)
• The engagement team possesses significant auditing experience of large complex financial intermediaries and technology dependent companies. (Examiners verify.)
• Individual assignments for external audit activities appropriately take into consideration each auditor’s qualifications, experience and expertise. Auditors with specialized expertise are appropriately assigned to specific audit activities. (Examiners verify.)
• The communications from the external auditor to the Audit Committee are comprehensive, clear, direct and effective. (Examiners test, verify and evaluate.)
• The communications from the external auditor to the Audit Committee address all matters required by among others, the AICPA, the SEC and recognized best practices. (Examiners test, verify and evaluate.)
• The communications from the external auditor to the Audit Committee tie directly to the approved audit plan. (Examiners test and verify.)
• The external auditor’s individual and overall conclusions are supported by workpapers that comport with established standards and among other things, demonstrate the extent of testing and verification performed by the external auditor. (Examiners test and evaluate.)
35
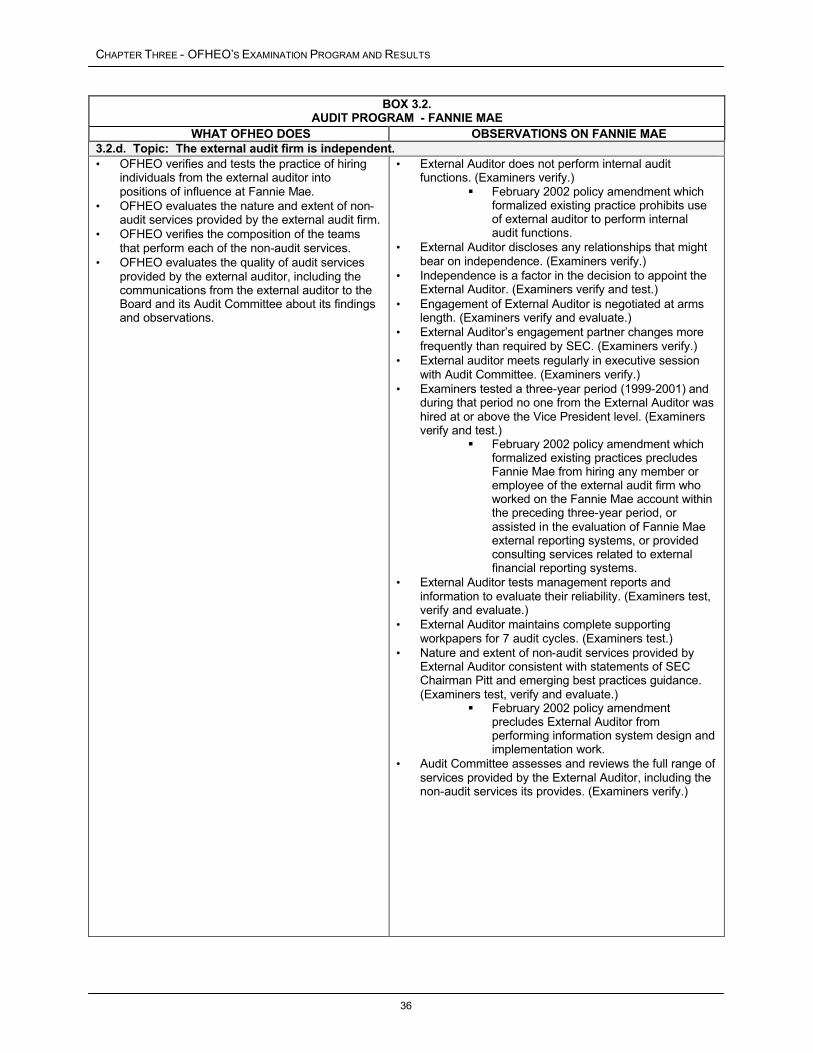
CHAPTER THREE - OFHEO’S EXAMINATION PROGRAM AND RESULTS
BOX 3.2. AUDIT PROGRAM - FANNIE MAE
WHAT OFHEO DOES OBSERVATIONS ON FANNIE MAE 3.2.d. Topic: The external audit firm is independent. • OFHEO verifies and tests the practice of hiring
individuals from the external auditor into positions of influence at Fannie Mae.
• OFHEO evaluates the nature and extent of non-audit services provided by the external audit firm.
• OFHEO verifies the composition of the teams that perform each of the non-audit services.
• OFHEO evaluates the quality of audit services provided by the external auditor, including the communications from the external auditor to the Board and its Audit Committee about its findings and observations.
• External Auditor does not perform internal audit functions. (Examiners verify.)
� February 2002 policy amendment which formalized existing practice prohibits use of external auditor to perform internal audit functions.
• External Auditor discloses any relationships that might bear on independence. (Examiners verify.)
• Independence is a factor in the decision to appoint the External Auditor. (Examiners verify and test.)
• Engagement of External Auditor is negotiated at arms length. (Examiners verify and evaluate.)
• External Auditor’s engagement partner changes more frequently than required by SEC. (Examiners verify.)
• External auditor meets regularly in executive session with Audit Committee. (Examiners verify.)
• Examiners tested a three-year period (1999-2001) and during that period no one from the External Auditor was hired at or above the Vice President level. (Examiners verify and test.)
� February 2002 policy amendment which formalized existing practices precludes Fannie Mae from hiring any member or employee of the external audit firm who worked on the Fannie Mae account within the preceding three-year period, or assisted in the evaluation of Fannie Mae external reporting systems, or provided consulting services related to external financial reporting systems.
• External Auditor tests management reports and information to evaluate their reliability. (Examiners test, verify and evaluate.)
• External Auditor maintains complete supporting workpapers for 7 audit cycles. (Examiners test.)
• Nature and extent of non-audit services provided by External Auditor consistent with statements of SEC Chairman Pitt and emerging best practices guidance. (Examiners test, verify and evaluate.)
� February 2002 policy amendment precludes External Auditor from performing information system design and implementation work.
• Audit Committee assesses and reviews the full range of services provided by the External Auditor, including the non-audit services its provides. (Examiners verify.)
36

CHAPTER THREE – OFHEO’S EXAMINATION PROGRAM AND RESULTS
BOX 3.2. AUDIT PROGRAM - FANNIE MAE
WHAT OFHEO DOES OBSERVATIONS ON FANNIE MAE 3.2.e. Topic: The qualified Fannie Mae professionals who perform the internal audit function report, through the head of Internal Audit, to the Board’s Audit Committee. • OFHEO evaluates the structure and reporting
relationship of the Internal Audit unit against, among others, the Institute of Internal Auditors (IIA) and other professional standards, best practices and guidance provided by regulators of Federally insured financial institutions.
• OFHEO evaluates the qualifications, experience and expertise of the Internal Audit staff and management
• OFHEO evaluates the quality of the management of the Internal Audit function, including the appropriateness and effectiveness of the annual audit plan.
• OFHEO evaluates the quality of the audit reports generated by the Internal Audit staff
• OFHEO evaluates the quality and sufficiency of the Internal Audit workpapers
• Head of Internal Audit regularly meets in executive session with Audit Committee and separately with the Chair of Audit Committee prior to each Audit Committee meeting. (Examiners verify.)
• Audit Committee oversees and evaluates the performance of the head of Internal Audit. (Examiners verify and evaluate.)
• Internal Audit Reports contain the weaknesses and control deficiencies identified in audit activities. (Examiners test and verify.)
• Internal Audit informs senior management and the Board about the weaknesses and control deficiencies identified in audit activities. (Examiners test and verify.)
• Management’s views about the Internal Audit findings are documented and shared with Audit Committee. (Examiners test, verify and evaluate.)
• Internal Audit follows up on and tracks management’s actions to address control deficiencies and weaknesses, and routinely provides this information to the Audit Committee. (Examiners test, verify and evaluate.)
• Internal audit practices adhere to IIA standards. (Examiners test and verify.)
• Internal Audit’s risk assessment process covers all business units and processes. (Examiners verify and evaluate.)
• Business units do not control ordirect the timing or scope of audit work. (Examiners test and verify.)
• Fannie Mae budgets sufficient resources to complete all planned internal audit activities, and to conduct significant additional, unanticipated audit activities. (Examiners verify and evaluate.)
37
CHAPTER THREE - OFHEO’S EXAMINATION PROGRAM AND RESULTS
Box 3.3.BOARD GOVERNANCE – FANNIE MAE
Central to the safe and sound operation of any financial organization is an independent and effective board of directors. Fannie Mae’s directors are placed in positions of trust either by the shareholders or by the President of the United States. Responsibility for the prudential operations of the company rests squarely with the board of directors. The board should delegate the day-to-day conduct of business to the Enterprise’s officers and employees, but the board cannot delegate its responsibility for the consequences of unsound or imprudent policies and practices.
Recognizing the importance of an independent and effective board of directors, OFHEO reviews and evaluates the way and means by which the directors discharge their duties and responsibilities. Examiners review and evaluate the processes employed by the board and its committees including: (a) the communication flows between senior management and the board, (b) the communications with the auditors or consultants engaged by the board, (c) the information and presentations that are provided to the board, (d) the planning and execution of board agendas, and (e) the documentation materials and follow-up process for open items. In evaluating the effectiveness of the board of directors, examiners consider a variety of governance features, including but not limited to: the process for director recruitment, training and selection; the independence exercised by the board and its committees; the process for selecting executive officers and the process and measures for how these officers are compensated and held accountable for performance; the process and tools used to supervise Fannie Mae’s affairs; the role and involvement of the board in adopting, monitoring and enforcing adherence to sound policies and objectives; the methods employed to identify and proctor ethical conduct; and the efforts to ensure the maintenance of a sound system of internal controls.
The following table highlights selected observations covering OFHEO’s routine examination activities of Fannie Mae’s board governance. The information in this table augments the overall opinion on board governance that is expressed on pages 23 – 24.
38

CHAPTER THREE – OFHEO’S EXAMINATION PROGRAM AND RESULTS
BOX 3.3. BOARD GOVERNANCE - FANNIE MAE
WHAT OFHEO DOES OBSERVATIONS ON FANNIE MAE 3.3.a. Topic: Board governance is performed by a capable and knowledgeable group of Directors. • OFHEO evaluates the processes used to identify
and nominate potential shareholder elected Directors.
• OFHEO evaluates the Nominating and Corporate Governance Committee’s charter.
• OFHEO evaluates the actions of the Nominating and Corporate Governance Committee and the support and rationale for its recommendations.
• OFHEO assesses the experience, expertise and capabilities of the Board as a whole, of each of the Board committees, and of each Director.
• The Nominating and Corporate Governance Committee is comprised solely of outside directors. (Examiners verify.)
• The Nominating and Corporate Governance Committee appropriately considers the current make up of the Board, Fannie Mae’s current operations and its future plans when identifying potential nominees to the Board. (Examiners verify and evaluate.)
• The Board and each of its committees are comprised of individuals with appropriate experience and expertise, including expertise in housing, finance, control, audit and board governance. (Examiners verify and evaluate.)
3.3.b. Topic: Fannie Mae’s Board of Directors is appropriately informed of the company’s condition, activities and operations. • OFHEO evaluates the scope, quality and timeliness
of materials provided to the Board and to its Committees.
• OFHEO evaluates the agendas, information packages, presentations and minutes of the meetings of the Board and its committees.
• OFHEO evaluates the Board’s opinion about the scope, quality and timeliness of materials provided to the Board and its Committees.
• Comprehensive, yet meaningful and manageable materials about Fannie Mae’s condition, activities and operations are provided sufficiently in advance of all Board and Committee meetings. (Examiners verify and evaluate.)
• Information provided to the Board and its committees comes from appropriate sources within the company, and from appropriate external sources. (Examiners verify.)
• The Board and its committees are provided point-in-time, trend and forecasted information. (Examiners verify, test and evaluate.)
• The Board and its committees are provided both financial and non-financial information about Fannie Mae’s condition, activities, operations and controls. (Examiners verify and evaluate.)
• Materials provided to the Board and its committees include information and metrics related to risks and risk management within particular business units and/or processes as well as to risks and risk management across the company. (Examiners verify, test and evaluate.)
• The Board is appropriately informed about progress against annual and multi-year plans. (Examiners verify and test.)
• OFHEO’s Chief Examiner communicates regularly with the Board and meets with the Directors.
39

CHAPTER THREE - OFHEO’S EXAMINATION PROGRAM AND RESULTS
BOX 3.3. BOARD GOVERNANCE - FANNIE MAE
WHAT OFHEO DOES OBSERVATIONS ON FANNIE MAE 3.3.c. Topic: Fannie Mae’s Board of Directors is appropriately informed about compliance with the company’s Code of Business Conduct. • OFHEO evaluates the Code of Business Conduct
and compares it to best practices. • OFHEO evaluates the processes surrounding the
administration of the Code of Business Conduct, including the type, frequency and effectiveness of communications about the Code of Business Conduct and its provisions.
• OFHEO evaluates the reporting processes related to the Code of Business Conduct .
• OFHEO evaluates the number and nature of violations of the Code of Business Conduct.
• OFHEO evaluates the quality and timeliness of information provided to the Board about compliance with the Code of Business Conduct.
• Fannie Mae has a comprehensive and rigorous Code of Business Conduct that embodies best practices and includes strong and comprehensive restrictions on actual and potential conflicts of interest. (Examiners verify, test and evaluate.)
• The Code of Business Conduct is supported by effective administrative processes that reinforce the specific provisions of the Code as well as its general intent. (Examiners verify and evaluate.)
• Actual and potential conflicts of interest are reported accurately and in a timely manner. (Examiners verify and test.)
• Appropriate restrictions are placed on individuals with actual or potential conflicts. (Examiners verify and test.)
• Violations of the Code of Business Conduct are infrequent, but are dealt with quickly and seriously. (Examiners verify, test and evaluate management and Board actions.)
• The Audit Committee regularly receives accurate reports about compliance with the Code of Business Conduct and about violations, including management’s response to violations. (Examiners verify and test.)
• The Audit Committee appropriately reports to the full Board significant matters relating to: the Code of Business Conduct and its administration; compliance with the Code of Business Conduct; and violations of the Code of Business Conduct. (Examiners verify and test.)
40
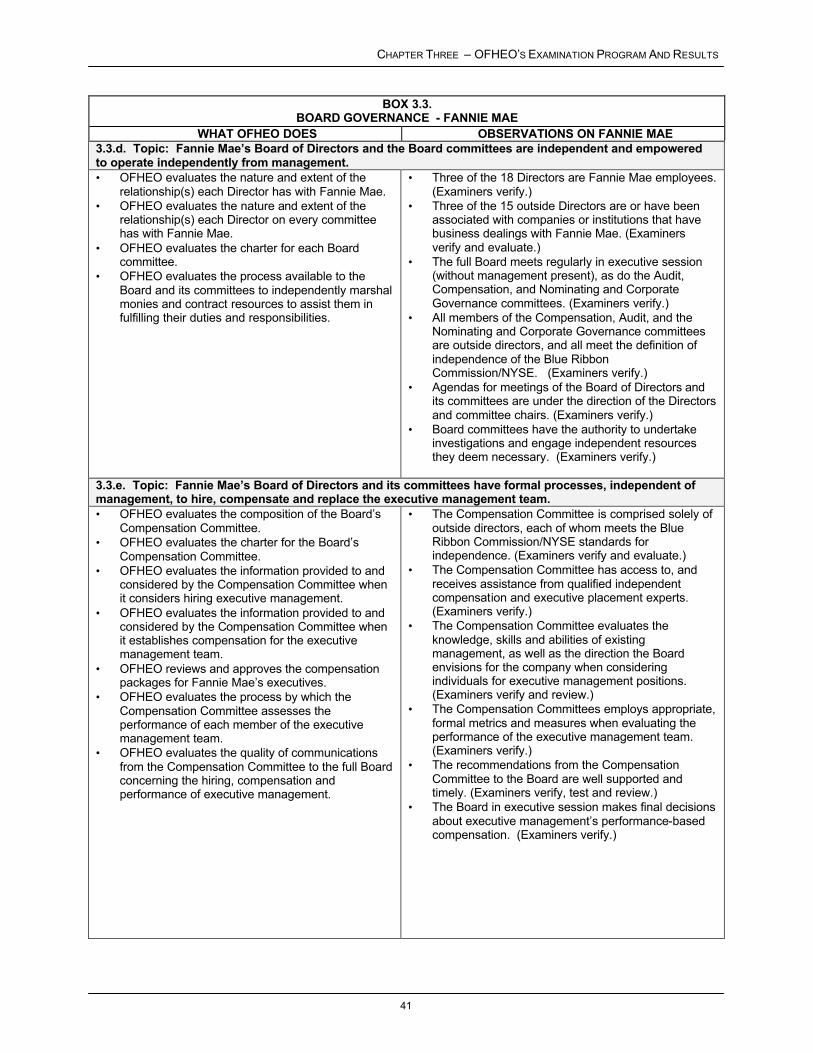
CHAPTER THREE – OFHEO’S EXAMINATION PROGRAM AND RESULTS
BOX 3.3. BOARD GOVERNANCE - FANNIE MAE
WHAT OFHEO DOES OBSERVATIONS ON FANNIE MAE 3.3.d. Topic: Fannie Mae’s Board of Directors and the Board committees are independent and empowered to operate independently from management. • OFHEO evaluates the nature and extent of the
relationship(s) each Director has with Fannie Mae. • OFHEO evaluates the nature and extent of the
relationship(s) each Director on every committee has with Fannie Mae.
• OFHEO evaluates the charter for each Board committee.
• OFHEO evaluates the process available to the Board and its committees to independently marshal monies and contract resources to assist them in fulfilling their duties and responsibilities.
• Three of the 18 Directors are Fannie Mae employees. (Examiners verify.)
• Three of the 15 outside Directors are or have been associated with companies or institutions that have business dealings with Fannie Mae. (Examiners verify and evaluate.)
• The full Board meets regularly in executive session (without management present), as do the Audit, Compensation, and Nominating and Corporate Governance committees. (Examiners verify.)
• All members of the Compensation, Audit, and the Nominating and Corporate Governance committees are outside directors, and all meet the definition of independence of the Blue Ribbon Commission/NYSE. (Examiners verify.)
• Agendas for meetings of the Board of Directors and its committees are under the direction of the Directors and committee chairs. (Examiners verify.)
• Board committees have the authority to undertake investigations and engage independent resources they deem necessary. (Examiners verify.)
3.3.e. Topic: Fannie Mae’s Board of Directors and its committees have formal processes, independent of management, to hire, compensate and replace the executive management team. • OFHEO evaluates the composition of the Board’s
Compensation Committee. • OFHEO evaluates the charter for the Board’s
Compensation Committee. • OFHEO evaluates the information provided to and
considered by the Compensation Committee when it considers hiring executive management.
• OFHEO evaluates the information provided to and considered by the Compensation Committee when it establishes compensation for the executive management team.
• OFHEO reviews and approves the compensation packages for Fannie Mae’s executives.
• OFHEO evaluates the process by which the Compensation Committee assesses the performance of each member of the executive management team.
• OFHEO evaluates the quality of communications from the Compensation Committee to the full Board concerning the hiring, compensation and performance of executive management.
• The Compensation Committee is comprised solely of outside directors, each of whom meets the Blue Ribbon Commission/NYSE standards for independence. (Examiners verify and evaluate.)
• The Compensation Committee has access to, and receives assistance from qualified independent compensation and executive placement experts. (Examiners verify.)
• The Compensation Committee evaluates the knowledge, skills and abilities of existing management, as well as the direction the Board envisions for the company when considering individuals for executive management positions. (Examiners verify and review.)
• The Compensation Committees employs appropriate, formal metrics and measures when evaluating the performance of the executive management team. (Examiners verify.)
• The recommendations from the Compensation Committee to the Board are well supported and timely. (Examiners verify, test and review.)
• The Board in executive session makes final decisions about executive management’s performance-based compensation. (Examiners verify.)
41

CHAPTER THREE - OFHEO’S EXAMINATION PROGRAM AND RESULTS
BOX 3.3. BOARD GOVERNANCE - FANNIE MAE
WHAT OFHEO DOES OBSERVATIONS ON FANNIE MAE 3.3.f. Topic: Fannie Mae has a comprehensive, formal orientation program for new directors and a process for any director to obtain more information or knowledge about any topic. • OFHEO evaluates the orientation process and
materials for new directors. • OFHEO evaluates the opportunities Fannie Mae
provides its directors to enhance their knowledge about matters related to their duties and responsibilities as directors.
• Orientation for new directors is comprehensive and includes information about directors’ roles and responsibilities – including their ethical and legal responsibilities – as well as information about Fannie Mae’s activities, condition and operating environment. (Examiners verify and evaluate.)
• The materials provided during director orientation are comprehensive and current, and serve as a valuable reference tool. (Examiners verify and evaluate.)
• The orientation programs for new directors are the same, whether the directors are shareholder-elected or Presidential appointees. (Examiners test and verify.)
• ‘Continuing education’ opportunities are provided for all directors. Board members have easy access to additional information and/or Fannie Mae personnel about any aspect of Fannie Mae’s operations or any aspect of board governance. (Examiners verify.)
42

CHAPTER THREE – OFHEO’S EXAMINATION PROGRAM AND RESULTS
Freddie Mac Examination Results and Conclusions
Freddie Mac’s credit risk management and credit risk management framework exceed safety and soundness standards, and they have resulted in a high-quality portfolio and manageable credit exposure. The portfolio is diversified and the credit risk profile is in compliance with the internally prescribed limits that examiners have deemed to be appropriate. Policies, procedures, internal controls and management reporting for the credit function are effective. Freddie Mac is adequately compensated for the credit risk it assumes and its credit risk models produce reliable results. Management prudently manages counterparty exposure. New products and initiatives are well researched prior to implementation. The process for determining the reserve for credit losses, the credit risk sharing strategies, and the credit risk management tools all are effective. Freddie Mac effectively identifies, quantifies and tracks its credit risk exposures. Management has an effective means for following up on credit-related issues. The technology and controls supporting the credit risk management function are effective. Management effectively reconciles differences between actual and expected credit portfolio performance.
Freddie Mac’s interest rate risk management exceeds safety and soundness standards. The policies, procedures, internal controls and management reporting relating to interest rate risk are appropriate and effective. Management has a meaningful methodology for quantifying and monitoring the level and nature of interest rate risk. Freddie Mac’s management effectively follows up on issues related to interest rate risk. Freddie Mac appropriately researches and controls the extent to which new products and initiatives may impact the interest rate risk profile. The technology and controls supporting the interest rate risk management function are effective. The tools used to model interest rate risk and the strategies to alter the exposures to interest rates are prudent and effective. Management effectively incorporates tactical and strategic issues into the management of interest rate risk. The responsibilities for the strategy and the analytics functions are appropriately separated from those for the execution functions. Derivative instruments are used prudently for hedging risks and in accordance with the standards used by other large financial intermediaries. (Box 3.4.)
Freddie Mac’s liquidity management framework exceeds safety and soundness standards. The policies, procedures, internal controls and management reporting relating to liquidity management are deemed to be appropriate and effective. Management has an effective methodology for quantifying and monitoring liquidity, and management appropriately evaluates the impact of various events and alternative environments when developing and updating contingency plans. The planning process for liquidity management is effective. Freddie Mac appropriately considers the impact new products and initiatives may have on liquidity. Management effectively follows up on issues and initiatives that influence liquidity. Technology and controls for liquidity management are prudent and effective. The quality of tools Freddie Mac uses to manage and monitor liquidity, and the quality of tools used to perform scenario analyses are comprehensive and effective. An appropriate separation of duties exists between the strategy and analytics functions and the execution function. Freddie Mac effectively analyzes and is well positioned to respond to trends and anomalies in market and funding spreads. Liquidity management is appropriately integrated with other management and with financial performance issues.
43

CHAPTER THREE - OFHEO’S EXAMINATION PROGRAM AND RESULTS
The information technology infrastructure and surrounding risk management framework exceed safety and soundness standards. Operating processes are in place to ensure secure, effective and efficient data center processing and problem management. There are effective policies and processes in place to ensure that data, information and computing resources are secure and accessed only by authorized users and that the conduct of E-commerce is secure. There are effective policies and processes in place to ensure the timely and appropriate resumption of business in the event of a disaster and these are routinely tested and enhanced. Management has processes in place to ensure information technology plans effectively address business unit and corporate objectives. Effective processes are in place to ensure appropriate controls are implemented and maintained. Documentation for system development and maintenance is complete. The controls over end-user computing are effective and there are controls that secure networks and firewalls from inappropriate or unauthorized actions with an appropriate level of testing conducted on these controls. Freddie Mac has processes in place to ensure data and information are processed accurately and in a timely manner.
The internal control framework and the management of that framework exceed safety and soundness standards. Management has an accurate and reliable process for identifying risks to business processes and implementing appropriate controls. Implemented controls properly address risks assessed by management. Management has a reliable process for ensuring the timely resolution of control related issues. Internal Audit appropriately identifies and communicates control deficiencies to management and the Board of Directors. There are established policies and procedures that delineate internal control process and standards resulting in a sound control environment. Management routinely tests and ensures compliance with established internal controls.
Business process controls exceed safety and soundness standards. Freddie Mac’s corporate environment fosters the introduction of new ideas and values intellectual capital. The process and control environment used when considering or developing new or substantially revised business initiatives is effective. The criteria Freddie Mac uses to subject a business initiative to review as new or substantially revised are comprehensive and appropriate. The analysis and review of new or substantially revised business initiatives are effective. Pilot programs are effectively used and the analysis and review conducted after the launch of a new or substantially revised business initiative is thorough and appropriate. The communications associated with new or substantially revised business initiatives are effective. Freddie Mac appropriately balances risk management, internal controls and the pressure to deliver new or substantially revised business initiatives.
The audit functions exceed safety and soundness standards. (Box 3.5.) The Internal and External Audit functions have the appropriate independence. Auditors performing the work possess appropriate professional proficiency. The scope of Internal and External Audit work performed is appropriate and comprehensive, and the audit work is documented and complete. The management of the Internal Audit department is effective. Executive management and the Board of Directors are appropriately involved with and follow up on identified audit issues. The auditor’s risk assessment process is effective. Internal Audit is appropriately involved in new products and new initiatives.
44

CHAPTER THREE – OFHEO’S EXAMINATION PROGRAM AND RESULTS
The Board discharges its duties and responsibilities in a manner that exceeds safety and soundness standards. (Box 3.6.) In discharging its duties and responsibilities, the Board of Directors operates with the appropriate independence. The Board is appropriately engaged in the development of a strategic direction for the company and ensures that management appropriately defines the operating parameters and risk tolerances of the Enterprise in a manner consistent with the strategic direction; legal standards; and ethical standards. The Board has an effective process for hiring and maintaining a quality executive management team, and has processes in placed designed to hold the executive management team accountable for achieving the defined goals and objectives. The Board is appropriately informed of the condition, activities and operations of the Enterprise, and has sufficient, well-organized time to carry out its responsibilities.
The framework used to produce timely, accurate and reliable reports exceeds safety and soundness standards. Management and the Board of Directors receive complete and comprehensive reports on Freddie Mac’s performance relative to established goals and objectives. Management reporting provides the levels of management with the necessary information to carry out their responsibilities efficiently and effectively. Management reporting permits management to evaluate and gauge the quality of their decisions. Information systems are linked to Freddie Mac’s overall strategy, and are developed and refined consistent with the strategic direction and plan. The reports management uses for decision making are accurate. There are communications across the company and management communicates Enterprise strategy, roles and responsibility. Employees have effective channels of communication to provide feedback, report suspected improprieties and suggest enhancements.
Key management processes that influence corporate-wide behaviors exceed safety and soundness standards. The strategic planning process is comprehensive and dynamic. Business unit goals are effective and implementation efforts reflect changing priorities. Management has the ability to monitor and manage change. Key performance measures are appropriate, effective and align with strategy. The behavior management programs are effectively designed to achieve corporate goals and objectives. Freddie Mac has programs for career and management development, and for identifying and recruiting competent people. Freddie Mac’s proprietary risk management programs and systems are effective. Management effectively conveys an appropriate message of integrity and ethical values. Management’s philosophy and operating style have a pervasive effect on the company. The organizational structure and the assignment of responsibility provide for accountability and sound controls.
45

CHAPTER THREE - OFHEO’S EXAMINATION PROGRAM AND RESULTS
Box 3.4.DERIVATIVES – FREDDIE MAC
Freddie Mac is an end-user of derivatives to manage its business more effectively and mitigate financial risks. Its goals for using derivatives are: to lower debt costs associated with the purchase of mortgage assets; to reduce market risks associated with the issuance of debt; and to effectively match the Enterprise’s funding composition with changes occurring in the interest-rate characteristics of its mortgage assets that results from changes occurring in the overall interest rate environment. In pursuing these goals, Freddie Mac enters into derivative contracts that are common in the financial markets and widely used for risk management activities – both OTC derivatives and exchange-traded options. Management does not speculate with derivatives. Derivative activities are transacted in accordance with approved policies and procedures and closely supervised and scrutinized by senior management and the Board of Directors.
Derivatives are important instruments for Freddie Mac’s management of its business and risk exposures. The volume of derivatives increased from $474.5 billion notional amount on December 31, 2000 to $1,052.4 billion notional amount on December 31, 2001. Notional principal amount is a commonly used measure for the volume of derivatives, but it does not accurately reflect the market and credit risk associated with derivatives. A better measure for the exposure to risk in derivatives is the “replacement cost” for the economic value of contracts. Replacement cost for derivatives positions will regularly fluctuate along with changes in the market. On December 31, 2001, Freddie Mac had a replacement cost of $69 million for its $1,052.4 billion notional principal amount in derivatives.
OFHEO carefully scrutinizes Freddie Mac’s use of derivatives. Derivative exposures are incorporated into regulatory capital requirements, both minimum and risk-based, and OFHEO conducts on-site examinations that include a review of derivatives activity. Examiners verify and evaluate a variety of risk management strategies and practices during on-site examinations, which includes: (a) testing transactions and controls; (b) evaluating strategies and their implementation; (c) evaluating the quality of tools used to identify, measure, and monitor risk – including the tools and methodology for valuing derivatives and the off-setting cash positions; (d) testing for the level of compliance with limit structures and for the quality of analyses that forms and defines the limit structure; (e) testing the integrity of the audit program and the accuracy of financial records; (f) evaluating the quality of technology that supports the business and the integrity of the security framework for that technology; (g) evaluating the quality of personnel, management, and board oversight; (h) evaluating the quality of policies and procedures and testing for adherence to these policies and procedures; (i) critiquing the quality of counterparty credit risk analysis and maintenance of the ongoing analysis; (j) proctoring the implementation of FAS 133 and ongoing compliance; (k) making recommendations that can strengthen systems, processes and practices; and (l) requiring remedial actions to address weaknesses, where appropriate.
The following table highlights selected observations from OFHEO’s testing and verification work that is regularly conducted on Freddie Mac’s derivative activities. The information in this table augments the overall opinions on derivatives that are expressed on page 43.
46

CHAPTER THREE – OFHEO’S EXAMINATION PROGRAM AND RESULTS
BOX 3.4. DERIVATIVES – FREDDIE MAC
WHAT OFHEO DOES OBSERVATIONS ABOUT FREDDIE MAC 3.4.a. Topic: Derivatives activities are governed by sound policies, procedures and effective internal controls and consistent with the prescribed purpose.
• OFHEO evaluates the appropriateness of policies, procedures, internal controls, and reports.
• OFHEO evaluates the process for establishing limits, the appropriateness of limit structures, and the appropriateness of prescribed practices.
• OFHEO evaluates the level of directorate and management oversight and reporting.
• OFHEO’s evaluations reflect, among other things, the perspective gained from years of examination and market experience, comparisons with practices at other large financial intermediaries and end-users, and emerging best practices.
• Management operates with policies and procedures that cover the use of derivatives. (Examiners verify and evaluate.)
• Responsibility and accountability, including independent risk oversight, are clearly communicated. (Examiners verify and evaluate.)
• The integrity of data used for models, reporting and decision-making are safeguarded with appropriate controls. (Examiners test, verify, and evaluate.)
• Models are independently validated, subject to formal change management, and controlled to preclude unauthorized & untested changes to the models. (Examiners verify and evaluate.)
• Contingency plans and business continuity plans provide for disaster recovery and enable continued monitoring of risk positions in the event of business interruption. (Examiners verify and evaluate.)
• The Enterprise documents, analyzes and monitors risk positions and risk limit compliance through effective technology, tracking systems, and reliable records. (Examiners verify and evaluate.)
• Comprehensive derivative reporting is tailored appropriately to meet the respective audience’s needs. (Examiners test, verify, and evaluate.)
• Management systems and reporting for derivatives are comprehensive and capture the risks and other important attributes for consideration. (Examiners test, verify, and evaluate.)
• Compliance with policies, procedures, limits, strategies and internal controls for derivatives activities and transactions are policed through effective compliance programs and audit coverage. (Examiners verify and evaluate.)
• Appropriate separation of duties exists among derivatives personnel. Derivatives activities and compliance with policies and limits are monitored by a qualified and independent risk oversight function. (Examiners test and verify.)
• The enterprise has a framework for evaluating the impact of new initiatives. The framework requires detailed tracking, reporting and analysis of performance and/or unexpected outcomes. (Examiners verify and evaluate.)
47

CHAPTER THREE - OFHEO’S EXAMINATION PROGRAM AND RESULTS
BOX 3.4. DERIVATIVES – FREDDIE MAC
WHAT OFHEO DOES OBSERVATIONS ABOUT FREDDIE MAC 3.4.b. Topic: Risk management techniques are employed to effectively manage risk.
• OFHEO evaluates the quality of the process and the results of credit analyses and limit setting for derivatives counterparty.
• OFHEO evaluates the documents, philosophy, methods and practices employed in netting exposures for derivatives.
• OFHEO evaluates the policy, practices, and approaches employed in managing collateral for derivatives.
• Measurement and monitoring of credit risk and fair market value for derivatives is independent and separate from any influence of portfolio management activities. (Examiners verify and evaluate.)
• Collateral is independently marked-to-market based on actual market prices and prudent modeling techniques & practices. (Examiners test, verify, and evaluate.)
• Comprehensive credit analyses of derivatives counterparties are performed by credit specialists who are separate from portfolio operations. Credit limits and procedures are prescribed along with collateral requirements. (Examiners verify and evaluate.)
• Counterparties are required to meet credit ratings that exceed minimum investment grade as determined by leading outside credit rating agencies and management has procedures to ensure the creditworthiness of its counterparties in the event there is a material adverse change. (Examiners test and verify.)
• Prudent credit limits, procedures, and collateral requirements are clearly delineated, and consistently implemented. (Examiners test, verify, and evaluate)
• An independent risk management function monitors and tracks the credit exposure for derivatives counterparties, including collateral positions. (Examiners verify and evaluate.)
• Derivatives activities are conducted with an appropriately diverse set of derivatives counterparties. The credit quality of these counterparties is routinely monitored with corrective measures employed when needed or warranted. (Examiners test, verify, and evaluate)
• Collateral posting requirements are clearly delineated, and consistently implemented. (Examiners verify and evaluate.)
• Derivative transactions are governed by master agreements. (Examiners verify and evaluate.)
• Netting is employed to mitigate counterparty exposure levels. (Examiners verify and evaluate.)
• Derivative positions are regularly revalued with net exposures effectively managed, including the requirement additional collateral when required under credit policies. (Examiners verify and evaluate.)
• Counterparties are recognized, reputable, and creditworthy with substantial presence in the derivatives market. (Examiners verify and evaluate.)
48
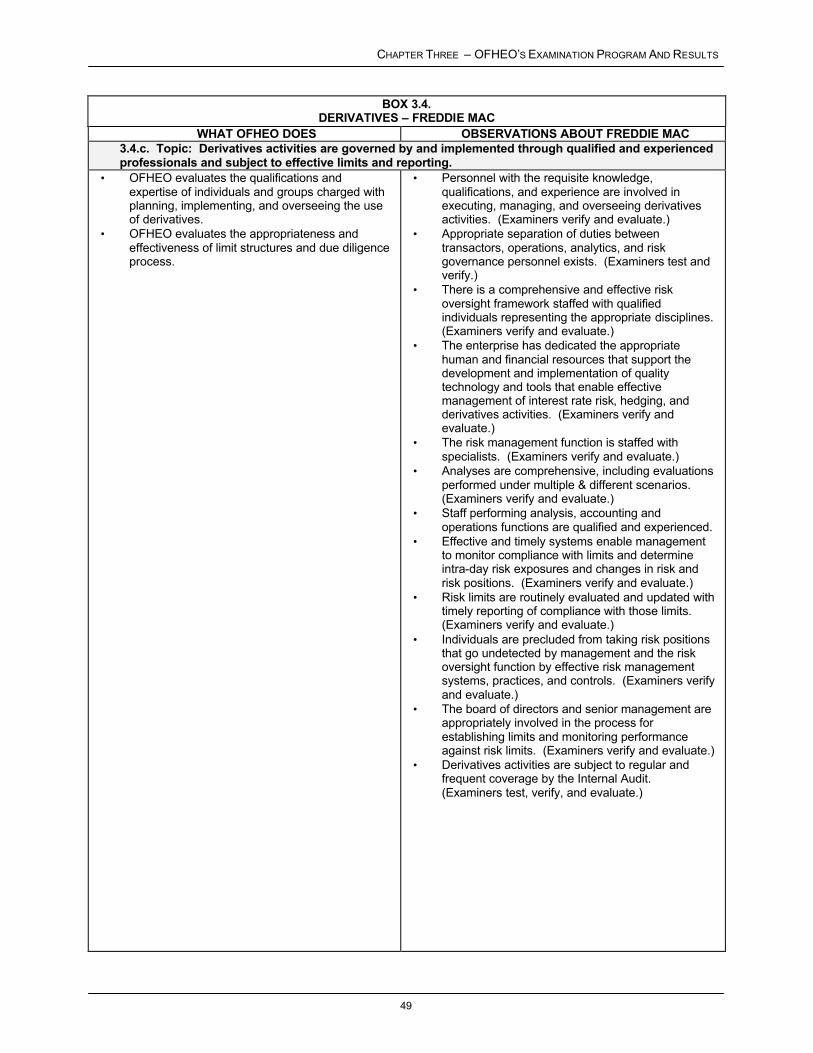
CHAPTER THREE – OFHEO’S EXAMINATION PROGRAM AND RESULTS
BOX 3.4. DERIVATIVES – FREDDIE MAC
WHAT OFHEO DOES OBSERVATIONS ABOUT FREDDIE MAC 3.4.c. Topic: Derivatives activities are governed by and implemented through qualified and experienced professionals and subject to effective limits and reporting.
• OFHEO evaluates the qualifications and expertise of individuals and groups charged with planning, implementing, and overseeing the use of derivatives.
• OFHEO evaluates the appropriateness and effectiveness of limit structures and due diligence process.
• Personnel with the requisite knowledge, qualifications, and experience are involved in executing, managing, and overseeing derivatives activities. (Examiners verify and evaluate.)
• Appropriate separation of duties between transactors, operations, analytics, and risk governance personnel exists. (Examiners test and verify.)
• There is a comprehensive and effective risk oversight framework staffed with qualified individuals representing the appropriate disciplines. (Examiners verify and evaluate.)
• The enterprise has dedicated the appropriate human and financial resources that support the development and implementation of quality technology and tools that enable effective management of interest rate risk, hedging, and derivatives activities. (Examiners verify and evaluate.)
• The risk management function is staffed with specialists. (Examiners verify and evaluate.)
• Analyses are comprehensive, including evaluations performed under multiple & different scenarios. (Examiners verify and evaluate.)
• Staff performing analysis, accounting and operations functions are qualified and experienced.
• Effective and timely systems enable management to monitor compliance with limits and determine intra-day risk exposures and changes in risk and risk positions. (Examiners verify and evaluate.)
• Risk limits are routinely evaluated and updated with timely reporting of compliance with those limits. (Examiners verify and evaluate.)
• Individuals are precluded from taking risk positions that go undetected by management and the risk oversight function by effective risk management systems, practices, and controls. (Examiners verify and evaluate.)
• The board of directors and senior management are appropriately involved in the process for establishing limits and monitoring performance against risk limits. (Examiners verify and evaluate.)
• Derivatives activities are subject to regular and frequent coverage by the Internal Audit. (Examiners test, verify, and evaluate.)
49
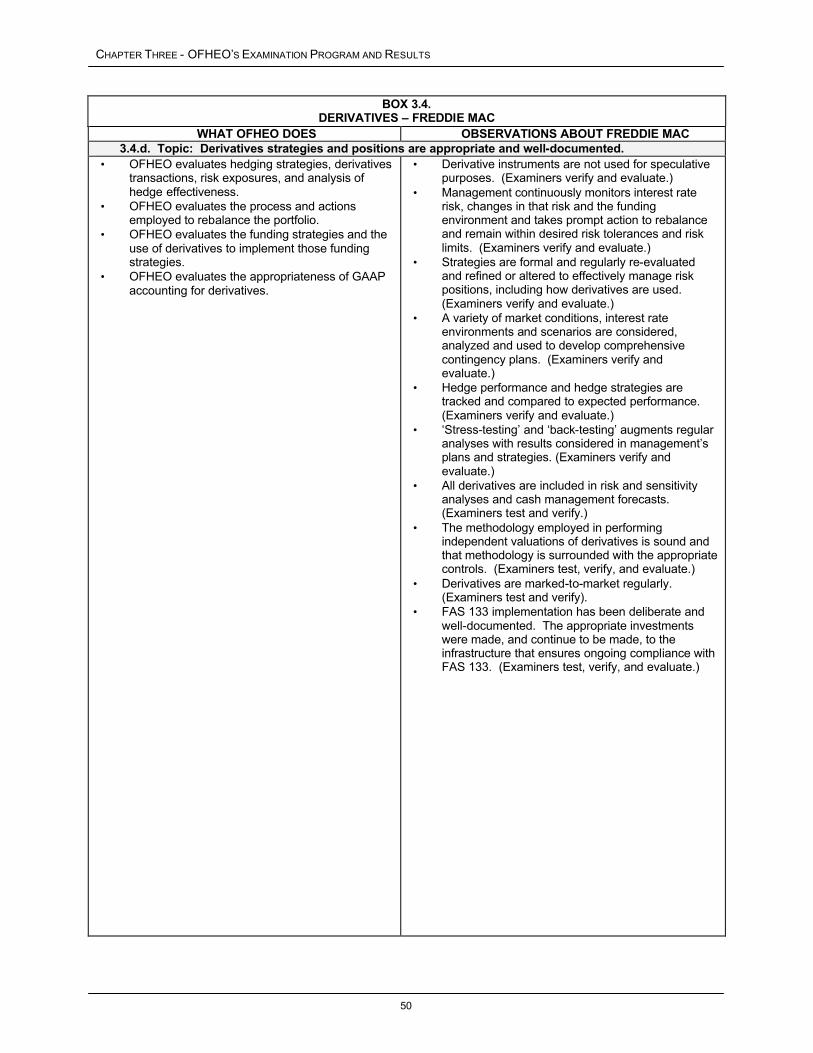
CHAPTER THREE - OFHEO’S EXAMINATION PROGRAM AND RESULTS
BOX 3.4. DERIVATIVES – FREDDIE MAC
WHAT OFHEO DOES OBSERVATIONS ABOUT FREDDIE MAC 3.4.d. Topic: Derivatives strategies and positions are appropriate and well-documented.
• OFHEO evaluates hedging strategies, derivatives transactions, risk exposures, and analysis of hedge effectiveness.
• OFHEO evaluates the process and actions employed to rebalance the portfolio.
• OFHEO evaluates the funding strategies and the use of derivatives to implement those funding strategies.
• OFHEO evaluates the appropriateness of GAAP accounting for derivatives.
• Derivative instruments are not used for speculative purposes. (Examiners verify and evaluate.)
• Management continuously monitors interest rate risk, changes in that risk and the funding environment and takes prompt action to rebalance and remain within desired risk tolerances and risk limits. (Examiners verify and evaluate.)
• Strategies are formal and regularly re-evaluated and refined or altered to effectively manage risk positions, including how derivatives are used. (Examiners verify and evaluate.)
• A variety of market conditions, interest rate environments and scenarios are considered, analyzed and used to develop comprehensive contingency plans. (Examiners verify and evaluate.)
• Hedge performance and hedge strategies are tracked and compared to expected performance. (Examiners verify and evaluate.)
• ‘Stress-testing’ and ‘back-testing’ augments regular analyses with results considered in management’s plans and strategies. (Examiners verify and evaluate.)
• All derivatives are included in risk and sensitivity analyses and cash management forecasts. (Examiners test and verify.)
• The methodology employed in performing independent valuations of derivatives is sound and that methodology is surrounded with the appropriate controls. (Examiners test, verify, and evaluate.)
• Derivatives are marked-to-market regularly. (Examiners test and verify).
• FAS 133 implementation has been deliberate and well-documented. The appropriate investments were made, and continue to be made, to the infrastructure that ensures ongoing compliance with FAS 133. (Examiners test, verify, and evaluate.)
50

CHAPTER THREE – OFHEO’S EXAMINATION PROGRAM AND RESULTS
BOX 3.4. DERIVATIVES – FREDDIE MAC
WHAT OFHEO DOES OBSERVATIONS ABOUT FREDDIE MAC 3.4.e. Topic: The Enterprise is an end-user of derivatives. Derivatives instruments are used exclusively for risk management purposes and not for speculative purposes. • OFHEO evaluates the types, maturities, and
amounts of derivative transactions. • OFHEO evaluates policies and procedures and
patterns of derivatives transactions. • OFHEO evaluates management’s timing and
rationale associated with use of certain derivative instruments and transactions.
• OFHEO evaluated how derivatives are being used.
• The derivatives being used are limited to those instruments that are common in the financial markets to conduct risk management activities. (Examiners verify and evaluate.)
• The derivatives being used are not exotic instruments. (Examiners verify and evaluate.)
• The use of derivatives is limited to end-use. (Examiners verify and evaluate.)
• Corporate policies prohibit speculative positions in derivatives. (Examiners test and verify)
• Derivatives are used in a manner consistent with the formally approved risk management policies and procedures. (Examiners verify and evaluate.)
• Hedge records and accounting records reflect how derivatives are used. (Examiners test, verify, and evaluate.)
• Automated systems, operating procedures, controls and management oversight safeguard against unauthorized derivatives transactions. (Examiners test and verify.)
• Metrics, management reports, and follow-up analyses demonstrate and confirm the appropriateness of derivatives transactions when evaluated in context with the hedging strategies and the risk management objectives. (Examiners verify and evaluate.)
• The specific types, the terms, and the volume of derivative transactions are consistent with the approved hedging strategies and comport with the nature and level of risk being managed – and are consistent with the prevailing conditions and liquidity in the marketplace. (Examiners verify and evaluate.)
51
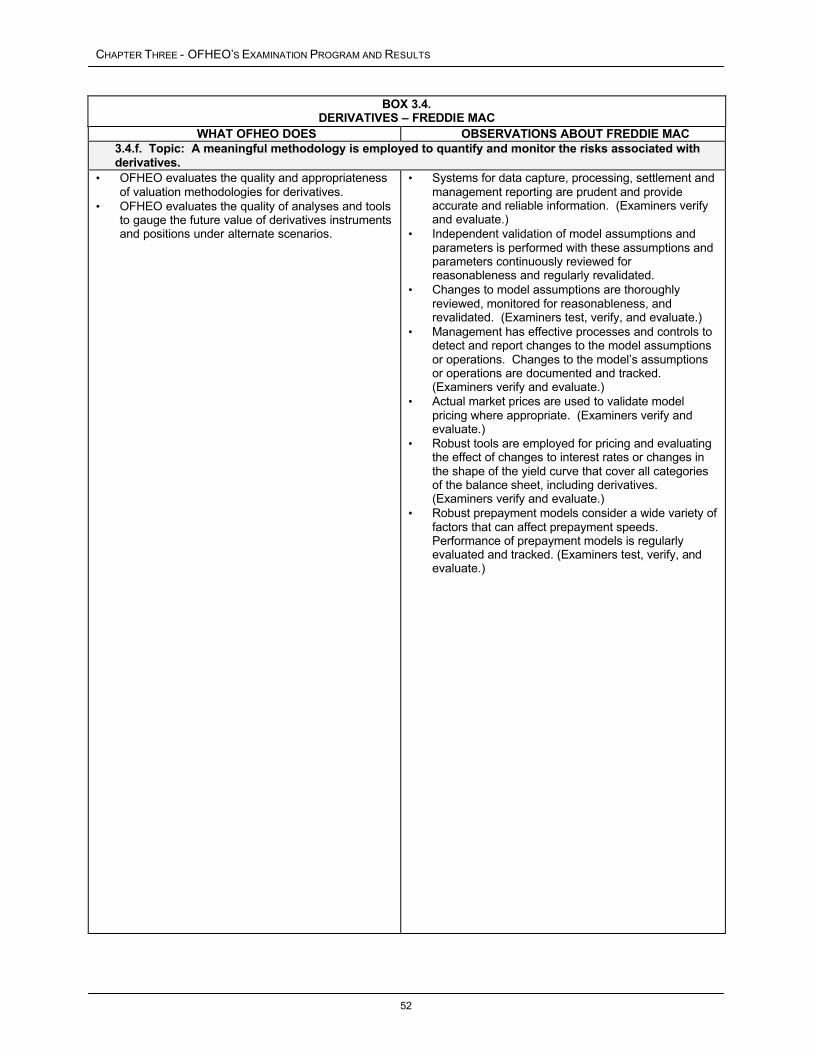
CHAPTER THREE - OFHEO’S EXAMINATION PROGRAM AND RESULTS
BOX 3.4. DERIVATIVES – FREDDIE MAC
WHAT OFHEO DOES OBSERVATIONS ABOUT FREDDIE MAC 3.4.f. Topic: A meaningful methodology is employed to quantify and monitor the risks associated with derivatives.
• OFHEO evaluates the quality and appropriateness of valuation methodologies for derivatives.
• OFHEO evaluates the quality of analyses and tools to gauge the future value of derivatives instruments and positions under alternate scenarios.
• Systems for data capture, processing, settlement and management reporting are prudent and provide accurate and reliable information. (Examiners verify and evaluate.)
• Independent validation of model assumptions and parameters is performed with these assumptions and parameters continuously reviewed for reasonableness and regularly revalidated.
• Changes to model assumptions are thoroughly reviewed, monitored for reasonableness, and revalidated. (Examiners test, verify, and evaluate.)
• Management has effective processes and controls to detect and report changes to the model assumptions or operations. Changes to the model’s assumptions or operations are documented and tracked. (Examiners verify and evaluate.)
• Actual market prices are used to validate model pricing where appropriate. (Examiners verify and evaluate.)
• Robust tools are employed for pricing and evaluating the effect of changes to interest rates or changes in the shape of the yield curve that cover all categories of the balance sheet, including derivatives. (Examiners verify and evaluate.)
• Robust prepayment models consider a wide variety of factors that can affect prepayment speeds. Performance of prepayment models is regularly evaluated and tracked. (Examiners test, verify, and evaluate.)
52
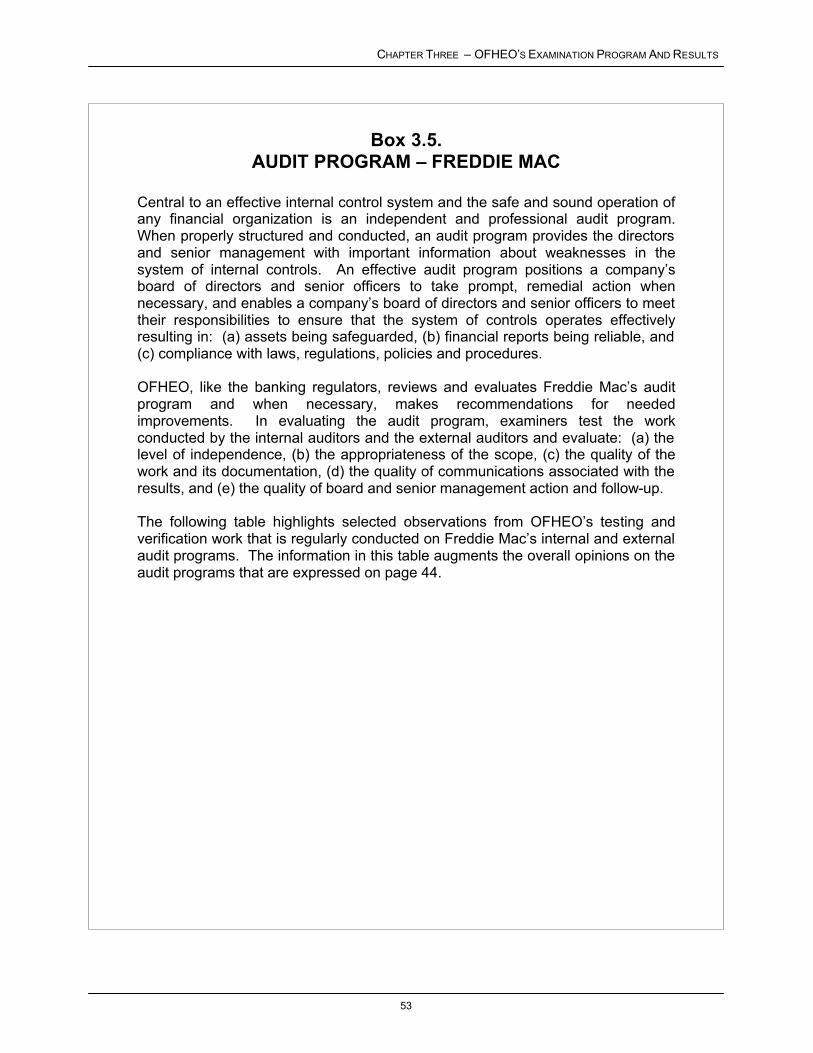
CHAPTER THREE – OFHEO’S EXAMINATION PROGRAM AND RESULTS
Box 3.5.AUDIT PROGRAM – FREDDIE MAC
Central to an effective internal control system and the safe and sound operation of any financial organization is an independent and professional audit program. When properly structured and conducted, an audit program provides the directors and senior management with important information about weaknesses in the system of internal controls. An effective audit program positions a company’s board of directors and senior officers to take prompt, remedial action when necessary, and enables a company’s board of directors and senior officers to meet their responsibilities to ensure that the system of controls operates effectively resulting in: (a) assets being safeguarded, (b) financial reports being reliable, and (c) compliance with laws, regulations, policies and procedures.
OFHEO, like the banking regulators, reviews and evaluates Freddie Mac’s audit program and when necessary, makes recommendations for needed improvements. In evaluating the audit program, examiners test the work conducted by the internal auditors and the external auditors and evaluate: (a) the level of independence, (b) the appropriateness of the scope, (c) the quality of the work and its documentation, (d) the quality of communications associated with the results, and (e) the quality of board and senior management action and follow-up.
The following table highlights selected observations from OFHEO’s testing and verification work that is regularly conducted on Freddie Mac’s internal and external audit programs. The information in this table augments the overall opinions on the audit programs that are expressed on page 44.
53
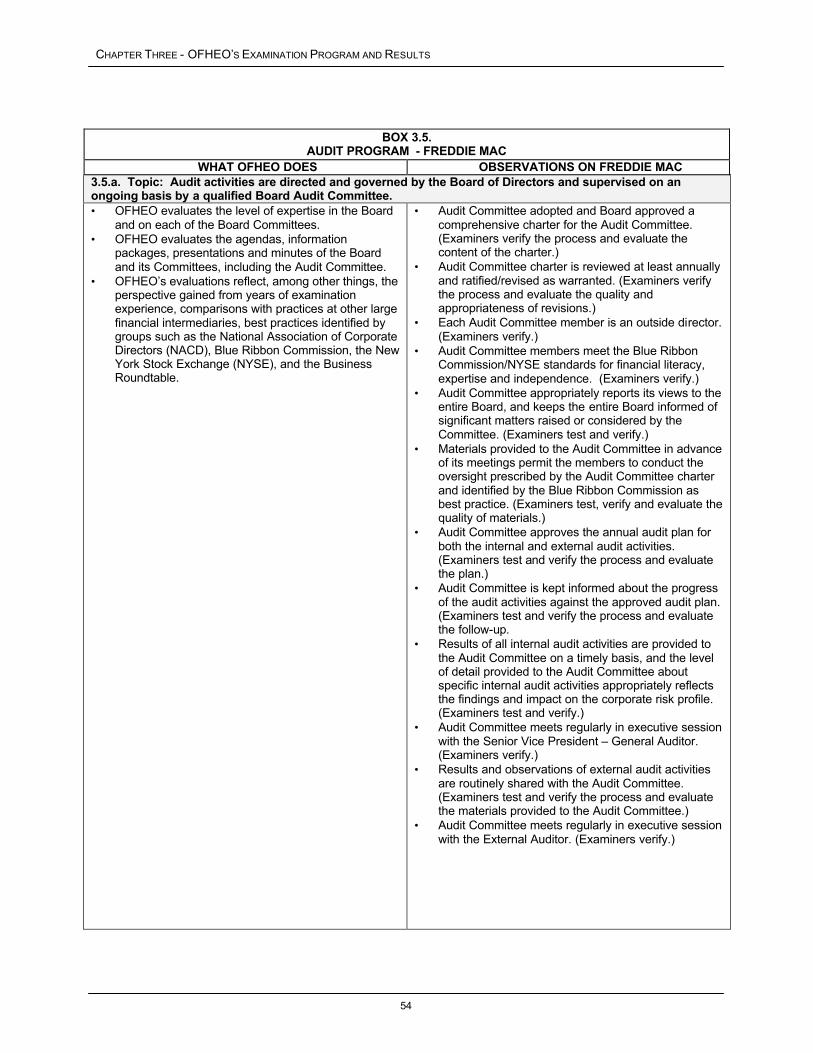
CHAPTER THREE - OFHEO’S EXAMINATION PROGRAM AND RESULTS
BOX 3.5. AUDIT PROGRAM - FREDDIE MAC
WHAT OFHEO DOES OBSERVATIONS ON FREDDIE MAC 3.5.a. Topic: Audit activities are directed and governed by the Board of Directors and supervised on an ongoing basis by a qualified Board Audit Committee. • OFHEO evaluates the level of expertise in the Board
and on each of the Board Committees. • OFHEO evaluates the agendas, information
packages, presentations and minutes of the Board and its Committees, including the Audit Committee.
• OFHEO’s evaluations reflect, among other things, the perspective gained from years of examination experience, comparisons with practices at other large financial intermediaries, best practices identified by groups such as the National Association of Corporate Directors (NACD), Blue Ribbon Commission, the New York Stock Exchange (NYSE), and the Business Roundtable.
• Audit Committee adopted and Board approved a comprehensive charter for the Audit Committee. (Examiners verify the process and evaluate the content of the charter.)
• Audit Committee charter is reviewed at least annually and ratified/revised as warranted. (Examiners verify the process and evaluate the quality and appropriateness of revisions.)
• Each Audit Committee member is an outside director. (Examiners verify.)
• Audit Committee members meet the Blue Ribbon Commission/NYSE standards for financial literacy, expertise and independence. (Examiners verify.)
• Audit Committee appropriately reports its views to the entire Board, and keeps the entire Board informed of significant matters raised or considered by the Committee. (Examiners test and verify.)
• Materials provided to the Audit Committee in advance of its meetings permit the members to conduct the oversight prescribed by the Audit Committee charter and identified by the Blue Ribbon Commission as best practice. (Examiners test, verify and evaluate the quality of materials.)
• Audit Committee approves the annual audit plan for both the internal and external audit activities. (Examiners test and verify the process and evaluate the plan.)
• Audit Committee is kept informed about the progress of the audit activities against the approved audit plan. (Examiners test and verify the process and evaluate the follow-up.
• Results of all internal audit activities are provided to the Audit Committee on a timely basis, and the level of detail provided to the Audit Committee about specific internal audit activities appropriately reflects the findings and impact on the corporate risk profile. (Examiners test and verify.)
• Audit Committee meets regularly in executive session with the Senior Vice President – General Auditor. (Examiners verify.)
• Results and observations of external audit activities are routinely shared with the Audit Committee. (Examiners test and verify the process and evaluate the materials provided to the Audit Committee.)
• Audit Committee meets regularly in executive session with the External Auditor. (Examiners verify.)
54

CHAPTER THREE – OFHEO’S EXAMINATION PROGRAM AND RESULTS
BOX 3.5. AUDIT PROGRAM - FREDDIE MAC
WHAT OFHEO DOES OBSERVATIONS ON FREDDIE MAC 3.5.b. Topic: The Board and Audit Committee are regularly apprised of OFHEO’s view of the quality of the internal and external audit programs, and the quality and effectiveness of management’s follow-up on issues identified through the audit process. • OFHEO regularly communicates with the Board of
Directors to share its results, conclusions, recommendations and follow-up for all areas of the examination.
• OFHEO’s communications specifically address the quality of both the internal and external audit functions, and the level of reliance OFHEO believes is appropriate for the Board and Audit Committee to place on those functions.
• OFHEO’s communications are directed to both the Audit Committee comprised entirely of outside directors, and to all members of the Board.
• OFHEO conducts meetings with outside Directors.
• OFHEO’s regular communications about examination activities, including those related to internal and external audit functions, are provided to each Board member and are included in the Board packages and official Board records. (Examiners verify.)
• Freddie Mac management shares specific examination observations directed to management with the Board, including observations related to internal and external audit functions. (Examiners test and verify.)
• The Board and Audit Committee discuss and consider OFHEO’s communications about examination activities. (Examiners verify.)
• The Audit Committee, comprised solely of outside directors, meets with OFHEO’s Chief Examiner.
55
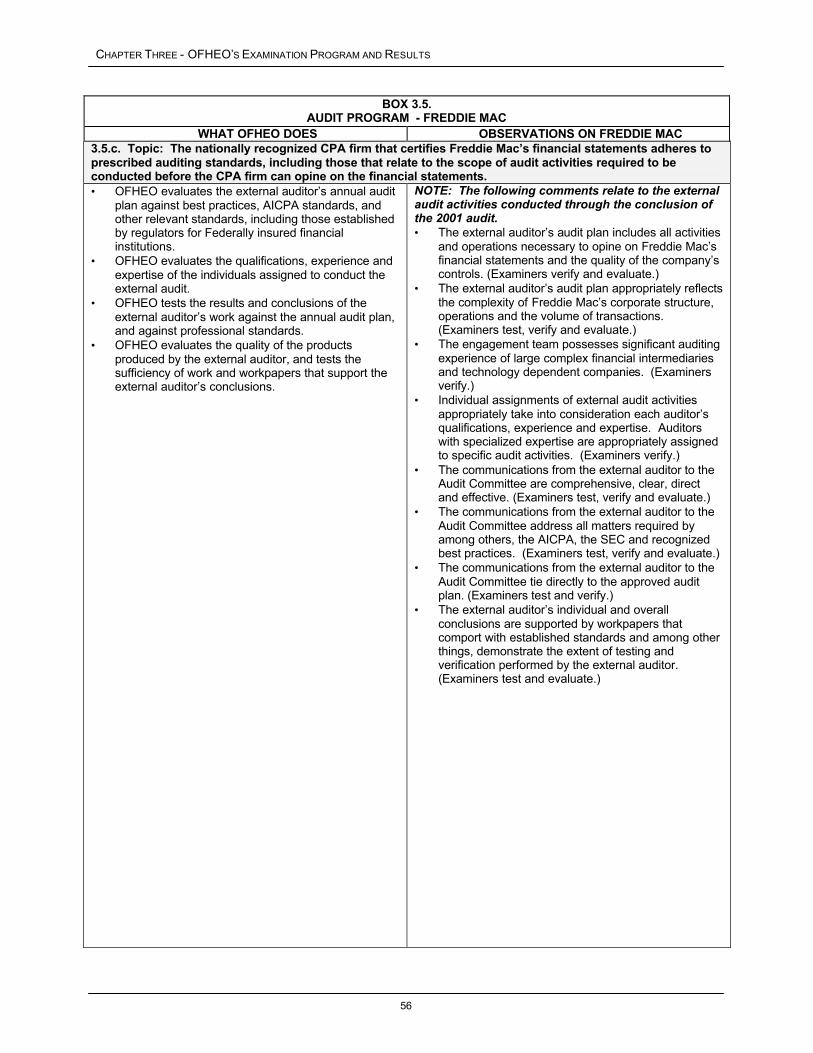
CHAPTER THREE - OFHEO’S EXAMINATION PROGRAM AND RESULTS
BOX 3.5. AUDIT PROGRAM - FREDDIE MAC
WHAT OFHEO DOES OBSERVATIONS ON FREDDIE MAC 3.5.c. Topic: The nationally recognized CPA firm that certifies Freddie Mac’s financial statements adheres to prescribed auditing standards, including those that relate to the scope of audit activities required to be conducted before the CPA firm can opine on the financial statements. • OFHEO evaluates the external auditor’s annual audit
plan against best practices, AICPA standards, and other relevant standards, including those established by regulators for Federally insured financial institutions.
• OFHEO evaluates the qualifications, experience and expertise of the individuals assigned to conduct the external audit.
• OFHEO tests the results and conclusions of the external auditor’s work against the annual audit plan, and against professional standards.
• OFHEO evaluates the quality of the products produced by the external auditor, and tests the sufficiency of work and workpapers that support the external auditor’s conclusions.
NOTE: The following comments relate to the external audit activities conducted through the conclusion of the 2001 audit. • The external auditor’s audit plan includes all activities
and operations necessary to opine on Freddie Mac’s financial statements and the quality of the company’s controls. (Examiners verify and evaluate.)
• The external auditor’s audit plan appropriately reflects the complexity of Freddie Mac’s corporate structure, operations and the volume of transactions. (Examiners test, verify and evaluate.)
• The engagement team possesses significant auditing experience of large complex financial intermediaries and technology dependent companies. (Examiners verify.)
• Individual assignments of external audit activities appropriately take into consideration each auditor’s qualifications, experience and expertise. Auditors with specialized expertise are appropriately assigned to specific audit activities. (Examiners verify.)
• The communications from the external auditor to the Audit Committee are comprehensive, clear, direct and effective. (Examiners test, verify and evaluate.)
• The communications from the external auditor to the Audit Committee address all matters required by among others, the AICPA, the SEC and recognized best practices. (Examiners test, verify and evaluate.)
• The communications from the external auditor to the Audit Committee tie directly to the approved audit plan. (Examiners test and verify.)
• The external auditor’s individual and overall conclusions are supported by workpapers that comport with established standards and among other things, demonstrate the extent of testing and verification performed by the external auditor. (Examiners test and evaluate.)
56
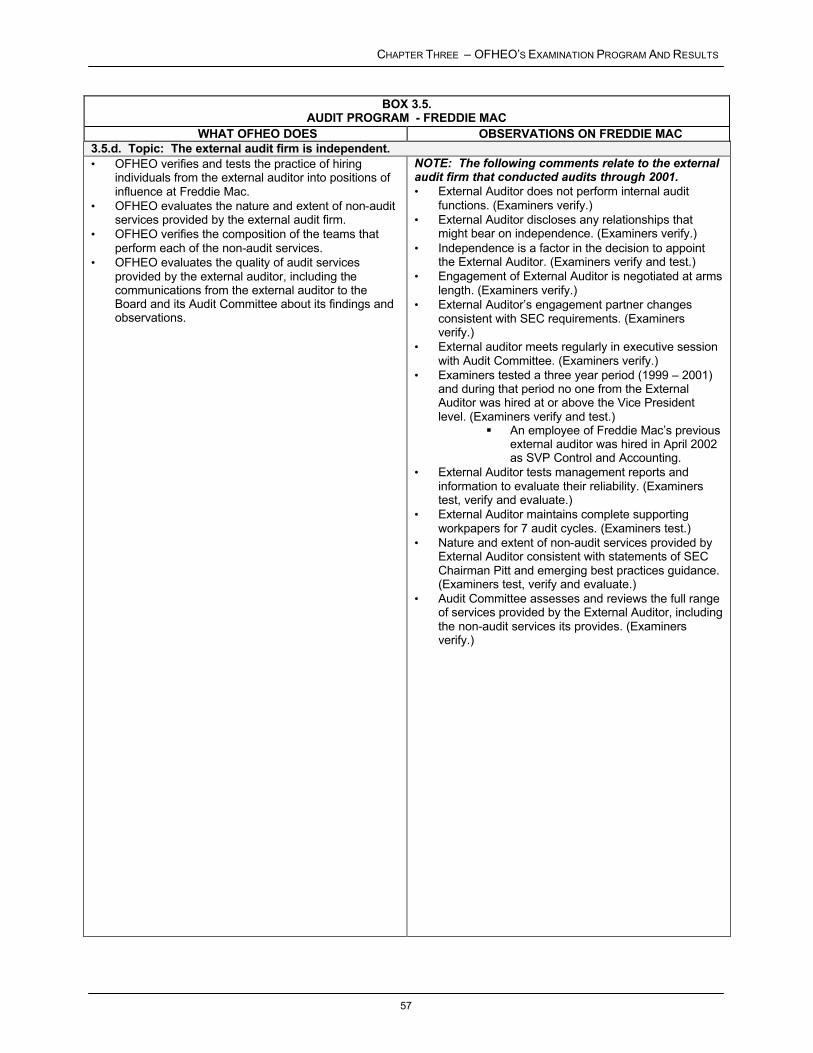
CHAPTER THREE – OFHEO’S EXAMINATION PROGRAM AND RESULTS
BOX 3.5. AUDIT PROGRAM - FREDDIE MAC
WHAT OFHEO DOES OBSERVATIONS ON FREDDIE MAC 3.5.d. Topic: The external audit firm is independent. • OFHEO verifies and tests the practice of hiring
individuals from the external auditor into positions of influence at Freddie Mac.
• OFHEO evaluates the nature and extent of non-audit services provided by the external audit firm.
• OFHEO verifies the composition of the teams that perform each of the non-audit services.
• OFHEO evaluates the quality of audit services provided by the external auditor, including the communications from the external auditor to the Board and its Audit Committee about its findings and observations.
NOTE: The following comments relate to the external audit firm that conducted audits through 2001. • External Auditor does not perform internal audit
functions. (Examiners verify.) • External Auditor discloses any relationships that
might bear on independence. (Examiners verify.) • Independence is a factor in the decision to appoint
the External Auditor. (Examiners verify and test.) • Engagement of External Auditor is negotiated at arms
length. (Examiners verify.) • External Auditor’s engagement partner changes
consistent with SEC requirements. (Examiners verify.)
• External auditor meets regularly in executive session with Audit Committee. (Examiners verify.)
• Examiners tested a three year period (1999 – 2001) and during that period no one from the External Auditor was hired at or above the Vice President level. (Examiners verify and test.)
� An employee of Freddie Mac’s previous external auditor was hired in April 2002 as SVP Control and Accounting.
• External Auditor tests management reports and information to evaluate their reliability. (Examiners test, verify and evaluate.)
• External Auditor maintains complete supporting workpapers for 7 audit cycles. (Examiners test.)
• Nature and extent of non-audit services provided by External Auditor consistent with statements of SEC Chairman Pitt and emerging best practices guidance. (Examiners test, verify and evaluate.)
• Audit Committee assesses and reviews the full range of services provided by the External Auditor, including the non-audit services its provides. (Examiners verify.)
57
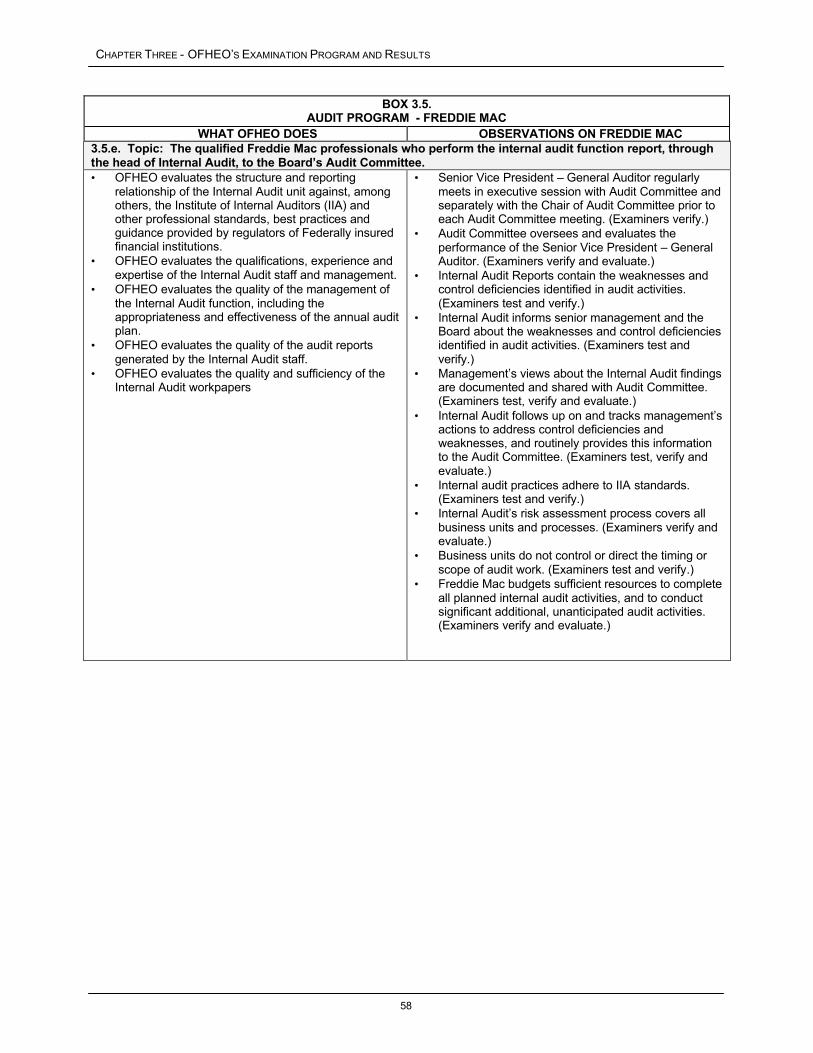
CHAPTER THREE - OFHEO’S EXAMINATION PROGRAM AND RESULTS
BOX 3.5. AUDIT PROGRAM - FREDDIE MAC
WHAT OFHEO DOES OBSERVATIONS ON FREDDIE MAC 3.5.e. Topic: The qualified Freddie Mac professionals who perform the internal audit function report, through the head of Internal Audit, to the Board’s Audit Committee. • OFHEO evaluates the structure and reporting
relationship of the Internal Audit unit against, among others, the Institute of Internal Auditors (IIA) and other professional standards, best practices and guidance provided by regulators of Federally insured financial institutions.
• OFHEO evaluates the qualifications, experience and expertise of the Internal Audit staff and management.
• OFHEO evaluates the quality of the management of the Internal Audit function, including the appropriateness and effectiveness of the annual audit plan.
• OFHEO evaluates the quality of the audit reports generated by the Internal Audit staff.
• OFHEO evaluates the quality and sufficiency of the Internal Audit workpapers
• Senior Vice President – General Auditor regularly meets in executive session with Audit Committee and separately with the Chair of Audit Committee prior to each Audit Committee meeting. (Examiners verify.)
• Audit Committee oversees and evaluates the performance of the Senior Vice President – General Auditor. (Examiners verify and evaluate.)
• Internal Audit Reports contain the weaknesses and control deficiencies identified in audit activities. (Examiners test and verify.)
• Internal Audit informs senior management and the Board about the weaknesses and control deficiencies identified in audit activities. (Examiners test and verify.)
• Management’s views about the Internal Audit findings are documented and shared with Audit Committee. (Examiners test, verify and evaluate.)
• Internal Audit follows up on and tracks management’s actions to address control deficiencies and weaknesses, and routinely provides this information to the Audit Committee. (Examiners test, verify and evaluate.)
• Internal audit practices adhere to IIA standards. (Examiners test and verify.)
• Internal Audit’s risk assessment process covers all business units and processes. (Examiners verify and evaluate.)
• Business units do not control or direct the timing or scope of audit work. (Examiners test and verify.)
• Freddie Mac budgets sufficient resources to complete all planned internal audit activities, and to conduct significant additional, unanticipated audit activities. (Examiners verify and evaluate.)
58

CHAPTER THREE – OFHEO’S EXAMINATION PROGRAM AND RESULTS
Box 3.6.BOARD GOVERNANCE – FREDDIE MAC
Central to the safe and sound operation of any financial organization is an independent and effective board of directors. Freddie Mac’s directors are placed in positions of trust either by the shareholders or by the President of the United States. Responsibility for the prudential operations of the company rests squarely with the board of directors. The board should delegate the day-to-day conduct of business to the Enterprise’s officers and employees, but the board cannot delegate its responsibility for the consequences of unsound or imprudent policies and practices.
Recognizing the importance of an independent and effective board of directors, OFHEO reviews and evaluates the way and means by which the directors discharge their duties and responsibilities. Examiners review and evaluate the processes employed by the board and its committees including: (a) the communication flows between senior management and the board, (b) the communications with the auditors or consultants engaged by the board, (c) the information and presentations that are provided to the board, (d) the planning and execution of board agendas, and (e) the documentation materials and follow-up process for open items. In evaluating the effectiveness of the board of directors, examiners consider a variety of governance features, including but not limited to: the process for director recruitment, training and selection; the independence exercised by the board and its committees; the process for selecting executive officers and the process and measures for how these officers are compensated and held accountable for performance; the process and tools used to supervise Freddie Mac’s affairs; the role and involvement of the board in adopting, monitoring and enforcing adherence to sound policies and objectives; the methods employed to identify and proctor ethical conduct; and the efforts to ensure the maintenance of a sound system of internal controls.
The following table highlights selected observations covering OFHEO’s examination activities of Freddie Mac’s board governance. The information in this table augments the overall opinion on board governance that is expressed on page 45.
59

CHAPTER THREE - OFHEO’S EXAMINATION PROGRAM AND RESULTS
BOX 3.6. BOARD GOVERNANCE - FREDDIE MAC
WHAT OFHEO DOES OBSERVATIONS ON FREDDIE MAC 3.6.a. Topic: Board governance is performed by a capable and knowledgeable group of Directors. • OFHEO evaluates the processes used to identify and
nominate potential shareholder elected Directors. • OFHEO evaluates the Human Resources Committee’s
charter. • OFHEO evaluates the actions of the Human
Resources Committee and the support and rationale for its recommendations.
• OFHEO assesses the experience, expertise and capabilities of the Board as a whole, of each of the Board committees, and of each Director.
• The Human Resources Committee (whose responsibilities include board nominations) is comprised solely of outside directors. (Examiners verify.)
• The Human Resources Committee appropriately considers the current make up of the Board, Freddie Mac’s current operations and its future plans when identifying potential nominees to the Board. (Examiners verify and evaluate.)
• The Board and each of its committees are comprised of individuals with appropriate experience and expertise, including expertise in housing, finance, control, audit and board governance. (Examiners verify and evaluate.)
3.6.b. Topic: Freddie Mac’s Board of Directors is appropriately informed of the company’s condition, activities and operations. • OFHEO evaluates the scope, quality and timeliness of
materials provided to the Board and to its Committees. • OFHEO evaluates the agendas, information packages,
presentations and minutes of the meetings of the Board and its committees.
• OFHEO evaluates the Board’s opinion about the scope, quality and timeliness of materials provided to the Board and its Committees.
• Comprehensive yet manageable and meaningful materials about Freddie Mac’s condition, activities and operations are provided sufficiently in advance of all Board and Committee meetings. (Examiners verify and evaluate.)
• Information provided to the Board and its committees comes from appropriate sources within the company, and from appropriate external sources. (Examiners verify.)
• The Board and its committees are provided point-in-time, trend and forecasted information. (Examiners verify, test and evaluate.)
• The Board and its committees are provided both financial and non-financial information about Freddie Mac’s condition, activities, operations and controls. (Examiners verify and evaluate.)
• Materials provided to the Board and its committees include information and metrics related to risks and risk management within particular business units and/or processes as well as to risks and risk management across the company. (Examiners verify, test and evaluate.)
• The Board is appropriately informed about progress against annual and multi-year plans. (Examiners verify and test.)
• OFHEO’s Chief Examiner communicates regularly with the Board and meets with Directors.
60
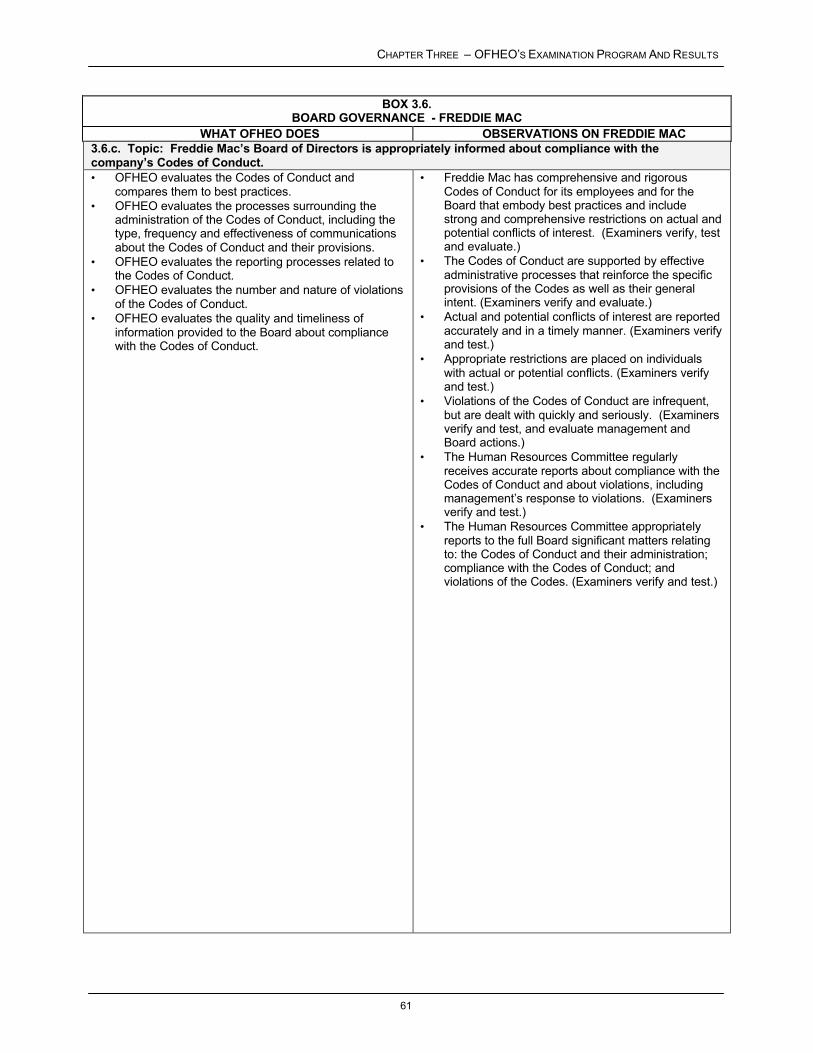
CHAPTER THREE – OFHEO’S EXAMINATION PROGRAM AND RESULTS
BOX 3.6. BOARD GOVERNANCE - FREDDIE MAC
WHAT OFHEO DOES OBSERVATIONS ON FREDDIE MAC 3.6.c. Topic: Freddie Mac’s Board of Directors is appropriately informed about compliance with the company’s Codes of Conduct. • OFHEO evaluates the Codes of Conduct and
compares them to best practices. • OFHEO evaluates the processes surrounding the
administration of the Codes of Conduct, including the type, frequency and effectiveness of communications about the Codes of Conduct and their provisions.
• OFHEO evaluates the reporting processes related to the Codes of Conduct.
• OFHEO evaluates the number and nature of violations of the Codes of Conduct.
• OFHEO evaluates the quality and timeliness of information provided to the Board about compliance with the Codes of Conduct.
• Freddie Mac has comprehensive and rigorous Codes of Conduct for its employees and for the Board that embody best practices and include strong and comprehensive restrictions on actual and potential conflicts of interest. (Examiners verify, test and evaluate.)
• The Codes of Conduct are supported by effective administrative processes that reinforce the specific provisions of the Codes as well as their general intent. (Examiners verify and evaluate.)
• Actual and potential conflicts of interest are reported accurately and in a timely manner. (Examiners verify and test.)
• Appropriate restrictions are placed on individuals with actual or potential conflicts. (Examiners verify and test.)
• Violations of the Codes of Conduct are infrequent, but are dealt with quickly and seriously. (Examiners verify and test, and evaluate management and Board actions.)
• The Human Resources Committee regularly receives accurate reports about compliance with the Codes of Conduct and about violations, including management’s response to violations. (Examiners verify and test.)
• The Human Resources Committee appropriately reports to the full Board significant matters relating to: the Codes of Conduct and their administration; compliance with the Codes of Conduct; and violations of the Codes. (Examiners verify and test.)
61

CHAPTER THREE - OFHEO’S EXAMINATION PROGRAM AND RESULTS
BOX 3.6. BOARD GOVERNANCE - FREDDIE MAC
WHAT OFHEO DOES OBSERVATIONS ON FREDDIE MAC 3.6.d. Topic: Freddie Mac’s Board of Directors and the Board committees are independent and empowered to operate independently from management. • OFHEO evaluates the nature and extent of the
relationship(s) each Director has with Freddie Mac. • OFHEO evaluates the nature and extent of the
relationship(s) each Director on every committee has with Freddie Mac.
• OFHEO evaluates the charter for each Board committee.
• OFHEO evaluates the processes available to the Board and its committees to independently marshal monies and contract resources to assist them in fulfilling their duties and responsibilities.
• Two of the 18 Directors are Freddie Mac employees. (Examiners verify.)
� Note, for part of 2001 a third Freddie Mac employee filled the vacancy caused by the resignation of an outside director and served only until a new outside director was named.
• Three of the 16 outside Directors are or have been associated with companies or institutions that have business dealings with Freddie Mac. (Examiners verify and evaluate.)
• The full Board meets regularly in executive session, as do the Audit and Human Resources committees. (Examiners verify.)
• All members of the Audit and Human Resources committees are outside directors and meet the Blue Ribbon Commission/NYSE requirements. (Examiners verify.)
• Agendas for meetings of the Board of Directors and its committees are under the direction of the Directors and committee chairs. (Examiners verify.)
• Board committees have the authority to undertake investigations and engage independent resources they deem necessary. (Examiners verify.)
62
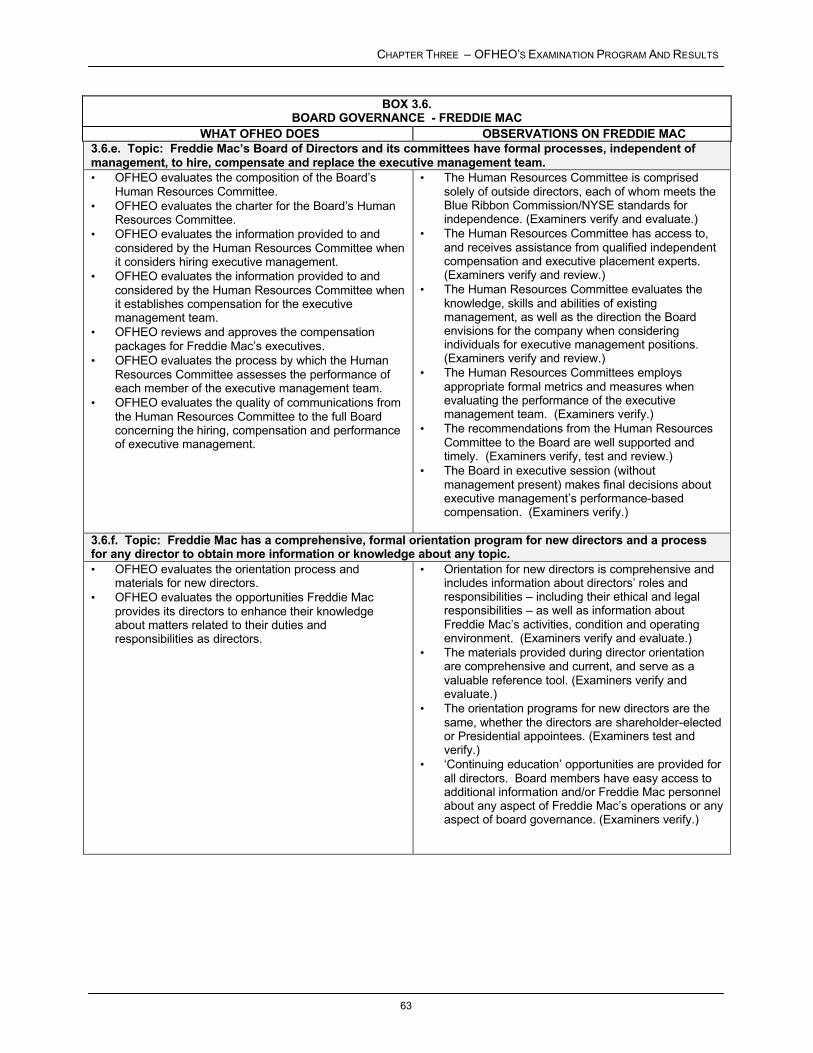
CHAPTER THREE – OFHEO’S EXAMINATION PROGRAM AND RESULTS
BOX 3.6. BOARD GOVERNANCE - FREDDIE MAC
WHAT OFHEO DOES OBSERVATIONS ON FREDDIE MAC 3.6.e. Topic: Freddie Mac’s Board of Directors and its committees have formal processes, independent of management, to hire, compensate and replace the executive management team. • OFHEO evaluates the composition of the Board’s
Human Resources Committee. • OFHEO evaluates the charter for the Board’s Human
Resources Committee. • OFHEO evaluates the information provided to and
considered by the Human Resources Committee when it considers hiring executive management.
• OFHEO evaluates the information provided to and considered by the Human Resources Committee when it establishes compensation for the executive management team.
• OFHEO reviews and approves the compensation packages for Freddie Mac’s executives.
• OFHEO evaluates the process by which the Human Resources Committee assesses the performance of each member of the executive management team.
• OFHEO evaluates the quality of communications from the Human Resources Committee to the full Board concerning the hiring, compensation and performance of executive management.
• The Human Resources Committee is comprised solely of outside directors, each of whom meets the Blue Ribbon Commission/NYSE standards for independence. (Examiners verify and evaluate.)
• The Human Resources Committee has access to, and receives assistance from qualified independent compensation and executive placement experts. (Examiners verify and review.)
• The Human Resources Committee evaluates the knowledge, skills and abilities of existing management, as well as the direction the Board envisions for the company when considering individuals for executive management positions. (Examiners verify and review.)
• The Human Resources Committees employs appropriate formal metrics and measures when evaluating the performance of the executive management team. (Examiners verify.)
• The recommendations from the Human Resources Committee to the Board are well supported and timely. (Examiners verify, test and review.)
• The Board in executive session (without management present) makes final decisions about executive management’s performance-based compensation. (Examiners verify.)
3.6.f. Topic: Freddie Mac has a comprehensive, formal orientation program for new directors and a process for any director to obtain more information or knowledge about any topic. • OFHEO evaluates the orientation process and
materials for new directors. • OFHEO evaluates the opportunities Freddie Mac
provides its directors to enhance their knowledge about matters related to their duties and responsibilities as directors.
• Orientation for new directors is comprehensive and includes information about directors’ roles and responsibilities – including their ethical and legal responsibilities – as well as information about Freddie Mac’s activities, condition and operating environment. (Examiners verify and evaluate.)
• The materials provided during director orientation are comprehensive and current, and serve as a valuable reference tool. (Examiners verify and evaluate.)
• The orientation programs for new directors are the same, whether the directors are shareholder-elected or Presidential appointees. (Examiners test and verify.)
• ‘Continuing education’ opportunities are provided for all directors. Board members have easy access to additional information and/or Freddie Mac personnel about any aspect of Freddie Mac’s operations or any aspect of board governance. (Examiners verify.)
63

CHAPTER FOUR – FINANCING OFHEO’S OPERATIONS
CHAPTER FOUR – Financing OFHEO’s Operations
OFHEO’S BUDGET
OFHEO’s operations are not financed by taxpayer funds. OFHEO’s annual operating budget is, however, subject to the Federal appropriations process and is based on the amount appropriated by Congress and signed into law by the President. The amounts provided for by the appropriations process are collected from Fannie Mae and Freddie Mac in the form of an annual assessment paid semi-annually.
The President’s Budget for Fiscal Year 2003 includes a proposal to remove OFHEO from the appropriations process. OFHEO Director Armando Falcon has continuously stated that the lengthy appropriations process may not allow OFHEO the flexibility necessary to address evolving, dynamic issues before those issues impact the financial safety and soundness of the Enterprises or funding for the housing market. The Administration is seeking the authority for OFHEO to operate like all other financial safety and soundness regulators, such as the Office of the Comptroller of the Currency and the Office of Thrift Supervision. OFHEO’s operations would remain subject to the oversight of Congress, but its budget would be free from the unpredictability of the annual appropriations process.
For fiscal year 2001, OFHEO’s budgetary resources totaled $22,605,000. Budgetary resources represent $22 million appropriated to OFHEO for fiscal year 2001 plus recovery of $605,000 prior year funds. The fiscal year 2001 operating budget supported the completion of a long awaited milestone by publishing the Final Risk-Based Capital regulation. The office continued to conduct comprehensive annual risk-based examinations of Fannie Mae and Freddie Mac, reviewed and classified the capital adequacy of each Enterprise quarterly, and performed other safety and soundness related regulatory activities.
For fiscal year 2002, OFHEO received its full budget request of $27,000,000. OFHEO will use these resources to maintain existing staffing levels, continue current examination and oversight programs and upgrade OFHEO’s computing capacity which is critical to the efficient implementation of the risk-based capital regulation and to support needed research and analysis on the ever-changing risk profiles of the Enterprises.
OFHEO’s fiscal year 2003 budget request totals $30,843,000. These resources will maintain existing oversight activities plus two initiatives. The first initiative is to strengthen OFHEO’s safety and soundness programs. This will be done by bolstering OFHEO’s capacity to oversee Enterprise risk management activities, by improving OFHEO’s capacity to analyze stress test outputs, and by improving OFHEO’s capacity to analyze developments in the mortgage and securities markets. In addition, OFHEO will expand its data warehouse and improve the efficiency of using these data to improve the productivity of regulatory staff. The second initiative is to strengthen OFHEO’s infrastructure. This will be done primarily by creating an integrated administrative and financial management system.
64

CHAPTER FOUR - FINANCING OFHEO’S OPERATIONS
OFHEO CONTINUES TO RECEIVE UNQUALIFIED AUDIT OPINION IN FY 2001
In conjunction with the government’s goal of improved accountability, OFHEO voluntarily prepared financial statements for fiscal year 2001 and subjected these statements and underlying processes to an independent audit. The certified public accounting firm of Dembo, Jones, Healy, Pennington and Marshall audited the statements. The firm issued an unqualified audit opinion on OFHEO’s fiscal year 2001 Financial Statements. The complete audit report follows.
65

Office of Federal Housing Enterprise Oversight
Table of Contents
Page
Management's Discussion and Analysis 1
Independent Auditors' Opinion of the Financial Statements 10
Report of Independent Auditors on Internal Control 12
Report of Independent Auditors on Compliance with Laws and Regulations 14
Financial Statements
Balance SheetsStatements of Net CostStatements of Changes in Net PositionStatements of Budgetary ResourcesStatements of FinancingNotes to Financial StatementsRequired Supplementary Information
16 17 18 19 20 21 29

OFFICE OF FEDERAL HOUSING ENTERPRISE OVERSIGHT
FISCAL YEAR 2001
MANAGEMENT‘S DISCUSSION AND ANALYSIS
Mission Statement
OFHEO promotes housing and a strong economy by ensuring the safety and soundness of Fannie Mae and Freddie Mac and fostering the strength and vitality of the nation‘s housing finance system.
Overview
The Office of Federal Housing Enterprise Oversight (OFHEO) was established by Title XIII of the Housing and Community Development Act of 1992, Public Law Number 102-550, known as the Federal Housing Enterprises Financial Safety and Soundness Act of 1992 (1992 Act). OFHEO is an independent office within the Department of Housing and Urban Development (HUD) with responsibility for examining and regulating the Federal Home Loan Mortgage Corporation (Freddie Mac) and the Federal National Mortgage Association (Fannie Mae) (collectively, the Enterprises) and ensuring that they are adequately capitalized.
A Director appointed by the President and confirmed by the Senate for a five-year term heads OFHEO. In October 1999, Armando Falcon, Jr. was sworn in as OFHEO‘s second Director. Under Director Falcon‘s leadership, during FY 2001, OFHEO continued to effectively regulate the Enterprises through an integrated program of ensuring that the Enterprises were adequately capitalized and operating in a safe and sound manner, promoting an efficient secondary mortgage market through an independent and balanced approach of oversight of the Enterprises and ensuring that the Enterprises comply with all laws under OFHEO‘s jurisdiction.
To ensure that the Enterprises are adequately capitalized, OFHEO is required by law to develop a stress test to determine risk-based capital requirements. During FY 2001, Director Falcon devoted considerable resources to the critical task of completing the Risk-Based Capital Rule and readying the stress test for implementation. OFHEO issued a final Risk-Based Capital Rule in September 2001.
OFHEO is required by law to conduct on-site comprehensive examinations at Fannie Mae and Freddie Mac to determine the overall safety and soundness of the two companies. The examinations are designed to identify the risks in the business activities of the Enterprises, and to determine if those risks are being prudently managed, controlled, and monitored. Director Falcon has maintained focus on OFHEO‘s examination and oversight function and plans to add resources in this area over a three-year period beginning in FY 2003. These additional resources are required to keep pace with the tremendous growth in the size and complexity of the Enterprises‘ operations.
Since OFHEO began operations in 1993, the Enterprises have more than doubled in size and fundamentally shifted their business mix from guarantors of mortage-backed securities to asset managers. In response to more ambitious affordable housing goals and the shift in business strategy, the Enterprises have also expanded business products and structured programs to purchase high loan-to-value mortgages to support the drive to higher rates of homeownership, to promote the expansion of reverse mortgages for elderly homeowners, and to develop the means to reach less credit worthy
1
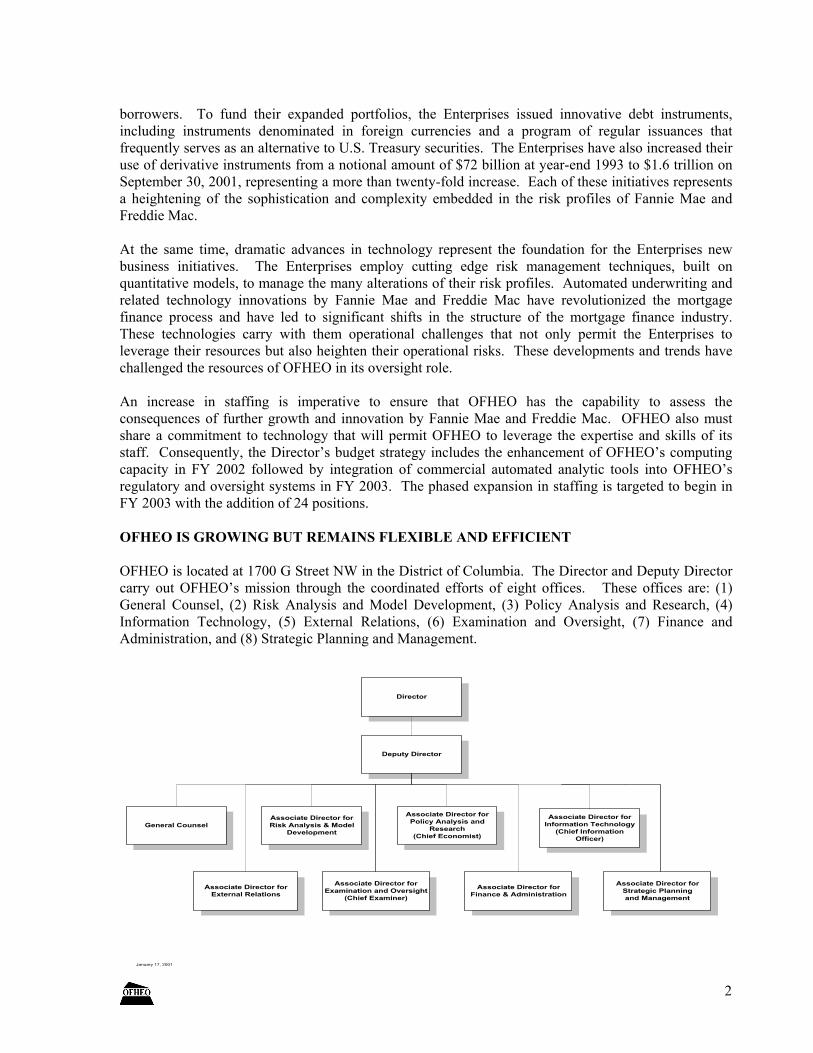
borrowers. To fund their expanded portfolios, the Enterprises issued innovative debt instruments, including instruments denominated in foreign currencies and a program of regular issuances that frequently serves as an alternative to U.S. Treasury securities. The Enterprises have also increased their use of derivative instruments from a notional amount of $72 billion at year-end 1993 to $1.6 trillion on September 30, 2001, representing a more than twenty-fold increase. Each of these initiatives represents a heightening of the sophistication and complexity embedded in the risk profiles of Fannie Mae and Freddie Mac.
At the same time, dramatic advances in technology represent the foundation for the Enterprises new business initiatives. The Enterprises employ cutting edge risk management techniques, built on quantitative models, to manage the many alterations of their risk profiles. Automated underwriting and related technology innovations by Fannie Mae and Freddie Mac have revolutionized the mortgage finance process and have led to significant shifts in the structure of the mortgage finance industry. These technologies carry with them operational challenges that not only permit the Enterprises to leverage their resources but also heighten their operational risks. These developments and trends have challenged the resources of OFHEO in its oversight role.
An increase in staffing is imperative to ensure that OFHEO has the capability to assess the consequences of further growth and innovation by Fannie Mae and Freddie Mac. OFHEO also must share a commitment to technology that will permit OFHEO to leverage the expertise and skills of its staff. Consequently, the Director‘s budget strategy includes the enhancement of OFHEO‘s computing capacity in FY 2002 followed by integration of commercial automated analytic tools into OFHEO‘s regulatory and oversight systems in FY 2003. The phased expansion in staffing is targeted to begin in FY 2003 with the addition of 24 positions.
OFHEO IS GROWING BUT REMAINS FLEXIBLE AND EFFICIENT
OFHEO is located at 1700 G Street NW in the District of Columbia. The Director and Deputy Director carry out OFHEO‘s mission through the coordinated efforts of eight offices. These offices are: (1) General Counsel, (2) Risk Analysis and Model Development, (3) Policy Analysis and Research, (4) Information Technology, (5) External Relations, (6) Examination and Oversight, (7) Finance and Administration, and (8) Strategic Planning and Management.
Director
Deputy Director
Associate Director for External Relations
General Counsel Associate Director for Risk Analysis & Model
Development
Associate Director for Examination and Oversight
(Chief Examiner)
Associate Director for Policy Analysis and
Research (Chief Economist)
Associate Director for Finance & Administration
Associate Director for Information Technology
(Chief Information Officer)
Associate Director for Strategic Planning and Management
January 17, 2001
2

During FY 2001, OFHEO finalized the Risk-Based Capital Rule and strengthened examination and oversight by employing about 105 full time equivalent (FTE) workyears, up 21 percent from FY 2000. The nature of OFHEO‘s mission requires a highly skilled, motivated, and diverse workforce to provide institutional capacity in mission-critical areas at all times. The Director‘s long-term strategy would continue to increase staffing through FY 2006 and strengthen OFHEO‘s capacity to perform oversight of the evolving risk profiles of the Enterprises.
0
50
100
150
63% Staffing Increases Planned from FY 2000 - 2003
Actual FTE 87 105
Planned FTE 118 142
FY 2000 FY 2001 FY 2002 FY 2003
OFHEO OPERATIONS ARE NOT FINANCED BY TAXES
While OFHEO‘s budget is currently subject to the annual congressional appropriations process, it is not funded by tax dollars. Fannie Mae and Freddie Mac bear the full cost of OFHEO‘s operations through an annual assessment based on OFHEO‘s annual operating budget as appropriated. Each Enterprise pays a pro rata share of the annual assessment. The combined assets and off-balance sheet obligations of each Enterprise determine the pro rata shares. OFHEO receives the annual assessment in semi-annual payments each fiscal year. By statute these payments are due to OFHEO October 1, and April 1, of each fiscal year, excluding years when the Enterprises must also pay based on temporary funding resolutions.
The President‘s FY 2003 budget contains an administrative provision that would provide direct funding to OFHEO eliminating the appropriations requirement. Without passage of this provision, OFHEO, unlike most other federal financial regulators, must submit a request for an annual operating budget to the Office of Management and Budget (OMB) and the Congress. This process diminishes the efficiency and effectiveness of OFHEO‘s programs by requiring the Office to predict in advance the resources that it may need to respond to external events that will not arise for over two years. OFHEO has no operating funds for a fiscal year until appropriation legislation is enacted by Congress and signed by the President. OFHEO‘s budget is bundled with the Department of Veterans Affairs (VA), HUD, and a variety of independent agencies such as the National Science Foundation. When the Congress and the Administration are unable to reach timely budget agreements, it results in OFHEO‘s not having an enacted budget until after the fiscal year has commenced. The appropriations process has forced OFHEO to trim operations until large, unrelated budget issues are resolved between the executive and legislative branches.
Director Falcon has repeatedly voiced concern about the potential impacts of OFHEO‘s current funding strategy and has asked Congress to remove OFHEO from the appropriations process. He is concerned that the appropriations process constrains OFHEO‘s ability to respond appropriately to new
3

unanticipated developments that could impair the financial safety and soundness of the Enterprises and prohibit the Enterprises from performing their important public missions. Removal from the appropriations process would put OFHEO on par with bank and thrift regulatory agencies and would allow the office to operate more efficiently and effectively while maintaining vigorous congressional oversight.
KEY FINANCIAL INFORMATION
OFHEO had $22.6 million available for obligation during FY 2001. Obligations represent monies awarded to specific contractors, payroll costs for FY 2001, and other expenses such as equipment purchases and employee travel costs for the fiscal year. All but $6,713 was obligated by the end of the year on September 30, 2001. As required by law, the $6,713 was credited against the FY 2002 annual assessment to be paid by the Enterprises.
Of the $22.6 million obligated during FY 2001, over $14 million (64%) were obligated for purchases that directly support mission activities such as examination and oversight, capital adequacy, and financial research related to housing finance. This is up 2% over the funds obligated in FY 2000 for direct mission activities. The balance of funds were obligated for activities supporting the accomplishment of the mission such as rent, internal financial and administrative management, external relations to the Congress and the public, and non-mission legal support.
Distribution of FY 2001 Re source s Across Programs
Technology 20%
Capital 16%
Exam 16%
All Other 36%
Research6%
Legal 6%
As OFHEO matures and staffing levels expand to meet the demand of regulating the Enterprises, the net cost of OFHEO‘s operations is rising. Net cost represents assessment collections, from Fannie Mae and Freddie Mac, that have been expensed for salaries and operating expenses, including retirement benefits financed by the Office of Personnel Management, to support OFHEO during the fiscal year. The net cost of operations for FY 2001 was over $19.9 million, up about 28% from FY 2000.
4

The nearly $4.4 million increase in net cost is associated with staffing, rent and contract services. Over 61% of the increase is in salary and benefits largely attributable to hiring vacancies to support examination, capital, information technology (IT) and legal programs. The second largest category in the net cost increase is contract services at 33%. The components included in the contract services increase are direct, risk-based capital expenses, the redesign of space, improvements to the IT infrastructure, and miscellaneous support services.
The small increase of net cost associated with rent resulted from advance payments of rent necessary to secure additional space for a growing staff required in the 1700 G Street location. In addition, OFHEO required more space to house its computer systems required to implement the risk-based capital stress test.
61% of the $4.3 Million Increase in Net Cost is Staffing
Other -3%
Rent 9%
Services 33%
Salary & Benefits 61%
FINANCIAL MANAGEMENT ACHIEVEMENTS AND IMPROVEMENTS
Financial Statement Audit. OFHEO has received unqualified audit opinions for the last three years on it‘s financial statements, internal controls and compliance with laws and regulations.
Federal Managers‘ Financial Integrity Act (FMFIA). In letters dated December 13, 2001, Director Falcon advised the President and the Congress that OFHEO was in compliance with FMFIA as of the end of FY 2001 (September 30, 2001). During FY 2001, OFHEO‘s managers continued to monitor internal controls and reported on the effectiveness of controls to the Director. No reportable material weaknesses were identified.
FY 2000 $15,585,647
$4.3 Increase from FY 2000
FY 2001 $19,886,191Net Cost
$0
$10,000,000
$20,000,000
Net Cost Increased 28% During FY 2001
5

Compliance with Prompt Payment Act. OFHEO maintains excellent compliance with the Prompt Payment Act and OMB circular A-125, which focus on improving the cash management practices of the government. OMB defines —on time as those payments made 23 to 30 days after receipt of the invoice, earlier payments where discounts were taken, and earlier payments made in accordance with management guidance.“ This means that OFHEO must pay its bills within a narrow window œ not too early and not late.
During FY 2001, OFHEO further reduced the amount it paid for interest penalties to a miniscule $445 in relation to a growing amount of disbursements, over $6.5 million, covered by the Prompt Payment Act. This reduction follows an outstanding performance in FY 2000 when OFHEO paid only $517 in interest penalties relating to nearly $5 million in disbursements. OFHEO accomplished this reduction in interest penalties by reducing the number of invoices paid late through enhanced tracking procedures for credit card statement payments.
Federal Financial Management Information Act (FFMIA) of 1996
The FFMIA codified in law certain financial management system requirements that were already in place by Executive Branch policies and added one new requirement. The Act established new requirements for auditors to report on agency compliance with system requirements and for agency heads and agency management to correct deficiencies within a reasonable time period.
OFHEO contracts certain administrative and financial services from other government agencies. Since OFHEO is small, these cross servicing arrangements with larger agencies provide a cost-effective means for the use of systems, which are generally expensive to purchase and maintain. OFHEO maintains its financial accounting on a system owned by VA. The National Finance Center (NFC), operated by the Department of Agriculture, provides OFHEO with payroll systems and services. HUD provides personnel action processing services and systems and a human resources data interface with the NFC systems.
FY 2001 MARKS KEY PERFORMANCE ACCOMPLISHMENTS FOR OFHEO
OFHEO‘s FY 2001 Annual Performance Plan and its operations were designed to achieve the Office‘s three strategic goals, described in the FY 1998-2003 Strategic Plan:
1. To effectively regulate the Enterprises by ensuring that they are adequately capitalized and operate in a safe and sound manner;
2. To promote an efficient secondary mortgage market through an independent and balanced approach to regulatory oversight of the Enterprises; and
3. To effectively regulate the Enterprises by ensuring that they comply with all laws under our jurisdiction.
Through the FY 2001 Annual Performance Plan, OFHEO set its performance goals for the year and outlined means and strategies to achieve them. Highlights of the goals and accomplishments that relate to each of these strategic goals are described below. In accordance with the Government Performance and Results Act, the FY 2001 Annual Performance Report will contain a more detailed description of OFHEO‘s performance, and will be issued by March 29, 2002.
6

OFHEO‘s ACCOMPLISHMENTS
At year-end, two of OFHEO‘s major criteria for achieving the mission have been satisfied. OFHEO has classified the Enterprises as adequately capitalized each quarter and determined through examinations that they meet or exceed safety and soundness standards. OFHEO has also achieved a long-awaited milestone by publishing a Final Risk-Based Capital Rule on September 13, 2001.
OFHEO established three strategic goals and 22 performance goals in the FY 2001 Performance Plan that it presented to Congress in February 2000 with the budget request. As FY 2001 began the following October, the enacted budget was less than the requested level, and OFHEO was revising the schedule for promulgating the Risk-Based Capital Rule. While recognizing that the Office would be unable to meet five performance goals as originally set, OFHEO did not revise the performance plan. The year concluded with these expectations met. OFHEO published the capital rule later in the year to achieve one of the goals. Achieving three goals related to the rule‘s implementation would be deferred to FY 2002. The last of these five goals may be considered in a future year, as resources are available.
Strategic Goal 1: To effectively regulate the Enterprises by ensuring that they are adequately capitalized and operate in a safe and sound manner.
During FY 2001, OFHEO completed its comprehensive annual risk-based examinations. Through these examinations for calendar year 2000, OFHEO determined that both Enterprises were financially sound and well managed. As in prior years, before conducting the examinations, the Office established and shared with the Enterprises safety and soundness standards that reflect various components of risk and risk management. For these examinations, OFHEO considers four major areasœcredit risk, market risk, operations risk, and corporate governance. These risk areas contain 10 program areas, such as interest rate risk, liquidity management, and information technology, for which over 100 factors are assessed at the start of the year and updated quarterly to reflect changes. The examination process and results are described in more detail in OFHEO‘s 2001 Report to Congress. Both examinations were completed on schedule and both Enterprises responded appropriately to examination issues. For the calendar year 2001 examination, which OFHEO initiated in FY 2001, OFHEO began implementation of an additional examination program area–exposures arising from the Enterprises‘ use of computer-based financial models. Model risk and OFHEO‘s oversight in this program area are described more fully in OFHEO‘s 2001 Report to Congress. OFHEO accomplished its performance goals in these examination areas.
The Enterprises met applicable capital standards quarterly, and OFHEO met its goal in this area. Each quarter, OFHEO applied the minimum capital standard to each Enterprise‘s financial position and determined that they met the standards. OFHEO also continues to monitor the Enterprises‘ minimum capital levels on a monthly basis. OFHEO is planning to update the minimum capital regulation, and will seek public comments on the proposed amendments during FY 2002.
In September 2001, OFHEO published a final Risk-Based Capital rule, although later than the target date originally set in the performance plan. By law, OFHEO cannot enforce compliance with the risk-based capital regulation until one year after it was issued in final. Until then, the minimum capital standard is the only one used to classify the Enterprises for capital adequacy. Once the Risk-Based Capital Rule is enforceable, OFHEO will calculate Risk-Based Capital levels for each Enterprise on at least a quarterly basis. In FY 2001, after the final rule was announced, OFHEO established a Risk-Based Capital Task Force to facilitate the rule‘s implementation. As part of that effort, OFHEO began
7

working with the Enterprises to ensure that they can run the stress test and have an opportunity to integrate the rule into their risk management framework. OFHEO also began work in FY 2001 to ensure that the Risk-Based Capital Model and Rule are updated and enhanced. In the first quarter of FY 2002, OFHEO published a notice of proposed rulemaking to make improvements that better tie capital to risk. OFHEO‘s performance goals related to implementation of the capital rule are being deferred to FY 2002.
Strategic Goal 2: To promote an efficient secondary mortgage market through an independent and balanced approach to regulatory oversight of the Enterprises.
OFHEO continued to strengthen its independent capacity to analyze the Enterprises and mortgage markets by continuing to bolster its staffing levels in key mission-related areas. OFHEO met its performance goals by continuing to issue internal reports analyzing Enterprise risks throughout FY 2001. The Office met its goals for maintaining the examination cadre‘s objectivity and expertise. Examination staff participated in professional development and training programs, and interagency assignments and forums. Because OFHEO‘s FY 2001 budget was enacted at a lower level than requested, and available resources were diverted to the Risk-Based Capital project, the Office did not meet its performance goal to develop the automated Surveillance and Monitoring System as originally planned.
During FY 2001, OFHEO initiated several research projects, including a study of the systemic risk in the financial markets and the housing markets that the Enterprises may pose and/or mitigate. At the onset of the study, OFHEO sought public comment through its web site and the Federal Register, and then posted on the web site the comments received. During FY 2001, OFHEO developed a preliminary research agenda that it is refining in FY 2002, and established an interdisciplinary Research Council to coordinate research plans and activities. In future years, OFHEO anticipates undertaking additional research and analysis, including exploring issues that arose in comments on the proposed risk-based capital rule and using the risk-based capital stress test to assess alternative stress scenarios to continue to analyze the Enterprises.
Strategic Goal 3: To effectively regulate the Enterprises by ensuring that they comply with all laws under our jurisdiction.
During FY 2001, OFHEO found no violations of the Enterprises‘ Charter Acts or other applicable laws. As part of OFHEO‘s responsibility to prohibit excessive executive compensation at the Enterprises, OFHEO reviewed four termination agreements of executives who left the Enterprises, and found them satisfactory. During FY 2002, OFHEO will conduct a study of executive compensation at the Enterprises by comparing their executives‘ compensation with executive compensation at peer firms. OFHEO met its performance goals in this area.
FY 2002 and the Future
Beginning with FY 2002, OFHEO‘s Annual Performance Plans tie to OFHEO‘s new FY 2000-2005 Strategic Plan. This Plan was developed during the last quarter of FY 2000, in accordance with the Government Performance and Results Act. This plan provides a framework for OFHEO‘s future Annual Performance Plans and operations. Taking OFHEO to its next stage, the plan details OFHEO‘s mission, goals and objectives for the five-year period and provides a blueprint for achieving them.
8
The new plan reflects OFHEO‘s congressional mandate to ensure the safety and soundness of Fannie Mae and Freddie Mac and emphasizes the need to foster the strength and vitality of the nation‘s housing finance system. It also recognizes that success in carrying out this mission promotes a robust housing sector and a strong economy. The strategic objectives continue OFHEO‘s focus on ensuring the Enterprises are adequately capitalized and that they comply with safety and soundness standards and other legal requirements. The objectives also place increased emphasis on enhancing public understanding of the nation‘s housing finance system and contributing to Federal efforts to promote efficient and effective financial markets and homeownership. OFHEO‘s three primary regulatory responsibilities are incorporated in the plan: Ensuring that the Enterprises are adequately capitalized, conducting safety and soundness examinations, and undertaking research and analysis on emerging Enterprise-related matters.
LIMITATIONS OF THE FINANCIAL STATEMENTS
While OFHEO is not specifically covered by the requirements in the CFO Act, the Office has prepared financial statements to report the financial position and results of operations of OFHEO, pursuant to the requirements of 31 U.S.C. 3515(b). The statements have been prepared from the books and records of OFHEO in the format prescribed by OMB. These statements supplement the periodic financial reports used to monitor and control budgetary resources that were prepared from the same books and records. The statements should be read with the realization that they are for a component of the U.S. Government.
The following principal statements present the financial position of OFHEO, an independent office within HUD, as of September 30, 2001, and September 30, 2000. The statements are in conformity with the instructions provided for federal entities by the OMB and comply with Statements of Federal Financial Accounting Standards effective as of September 30, 2001.
9
Dembo, Jones, Healy, Pennington & Marshall, P.C. Certified Public Accountants and Consultants
Independent Auditors’ Opinion on the Financial Statements
Mr. Armando Falcon Director Office of Federal Housing Enterprise Oversight
We have audited the accompanying Principal Statements and related notes of the Office of Federal Housing Enterprise Oversight as of September 30,2001 and 2000, and for the years then ended. These Principal Statements (hereinafter referred to as “-financial statements”) comprised of the balance sheets, the statements of net cost, changes in net position, budgetary resources and financing, and their related notes, are the responsibility of the agency’s management. Our responsibility is to express an opinion on these financial statements based on our audits.
We conducted our audits in accordance with auditing standards generally accepted in the United States of America; Government Auditing Standards, issued by the Comptroller General of the United States; and Oflice of Management and Budget (OMB) Bulletin No. 01-02, “Audit Requirements for Federal Financial Statements.” These standards require that we plan and perform the audits to obtain reasonable assurance about whether the financial statements are free of material misstatement. An audit includes examining, on a test basis, evidence supporting the amounts and disclosures in the financial statements. An audit also includes assessing the accounting principles used and significant estimates made by management, as well as evaluatingthe overall financial statement presentation. We believe that our audits provide a reasonable basis for our opinion.
In our opinion, the financial statements referred to above present fairly, in all material respects, the assets, liabilities, and net position; net costs; changes in net position; budgetary resources; and reconciliation of net costs to budgetary obligations of the Office of Federal Housing Enterprise Oversight as of September 30, 2001 and 2000, and for the years then ended in conformity with accounting principles generally accepted in the United States of America.
The Management Discussion and Analysis and the Required Supplemental Information sections are not required parts of the basic fmancial statements of the Office of Federal Housing Enterprise Oversight but are supplementary information required by the Federal Financial Accounting Standards Board. We have applied certain limited procedures, which consisted principally of inquiries of management regarding the methods of measurement and presentation of the Management Discussion and Analysis and the Required Supplementary Information. However, we did not audit the information and express no opinion on it.
6010 Executive Boulevard - Suite 900 - Rockville, Maryland 20852 30 I 770-5 I00 - 888 283-5472 * Fax 30 I 770-5202 - [email protected]
10 MEMZER: A” I N S T i ” E OF CERTIFIED PUBLIC ACCOUNTANIS AND POUWS I ” A n 0 N A L
In accordance with Governmental Auditing Standards, we have also issued a report dated February 14, 2002, on our consideration of the Office of Federal Housing Enterprise Oversight’s internal control over hancial reporting and a report dated February 14, 2002 on our tests of the Office of Federal Housing Enterprise Oversight’s compliance with certain provisions of laws and regulations. These reports are an integral part of an audit performed in accordance with Government Auditing Standards and should be read in conjunction with this report in considering the results of the audits.
This report is intended solely for the information and use of the management of the Office of Federal Housing Enterprise Oversight, OMB and Congress, and is not intended to be and should not be used by anyone other thanthese specified parties.
February 14, 2002
11 Dembo, Jones,Healy, Pennington & Marshall, P.C. Ceriified Public Accountants and Consultantr
,
Dembo, Jones, Healy, Pennington & Marshall, P.C. Certified Public Accountanis and Consuttants
Report of Independent Auditors on Internal Control
Mr. Armando Falcon Director Office of Federal Housing Enterprise Oversight
We have audited the Principal Statements (bereinafter referred to as “financial statements”) of the Office of Federal Housing Enterprise Oversight as of and for the years ended September 30,2001 and 2000, and have issued our report thereon dated February 14, 2002. We conducted our audits in accordance with auditing standards generally accepted in the United States of America; the standards applicable to financial audits contained in Government Auditing Standards, issued by the Comptroller General of the United States; and Office of Management and Budget (OMB) Bulletin No. 01-02, “Audit Requirements for Federal Financial Statements.”
In planning and performing our audits, we considered the Office of Federal Housing Enterprise Oversight’s internal control over fmancial reporting by obtaining an understanding of the agency’s internal control, determined whether internal controls bad been placed in operation, assessed control risk, and performed tests of controls in order to determine our auditing procedures for the purpose of expressing our opinion on the fmancial statements. We limited our internal control testing to those controls necessav to achieve the objectives described in OMB Bulletin No. 01-02. We did not test all internal controls relevant to operating objectives as broadly defined by the Federal Managers’ Financial Integrity Act of 1982, such as those controls relevant to ensuring efficient operations. The objective of ow audits was not to provide assurance on internal control. Consequently, we do not provide an opinion on internal control.
Our consideration of the internal control over financial reporting would not necessarily disclose all matters in the internal control over financial reporting that might be reportable conditions. Under standards issued by the American Institute of Certified Public Accountants, reportable conditions are matters coming to our attention relating to significant deficiencies in the design or operation of the internal control that, in our judgment, could adversely affect the agency’s ability to record, process, summarize, and report financial data consistent with the assertions by management in the financial statements. Material weaknesses are reportable conditions in which the design or operation of one or more of the internal control components does not reduce to a relatively low level the risk that misstatements in amounts that would be material in relation to the financial statements being audited may occur and not be detected within a timely period by employees in the normal course of performing their assigned functions. Because of inherent limitations in internal controls, misstatements, losses, or noncompliance may nevertheless occur and not be detected. However, we noted no matters involving
6010 Executive Boulevard - Suite 900 * Rockville. Marvland 20852 12~ ~~~ ~ ~
30 I 770-5 I00 - 888 283-5472 - Fax 30 I 770-5202 * [email protected] IvlEhmEn: AKmICAN INmm OF CERTmED PUBLIC ACCOUNTANTSAND POLARlS INTERNATIONAL
the internal control and its operation that we considered to be inaterial weaknesses as defined above. However, we noted other matters involving the internal control over financial reporting, which we have reported to management of the Office of Federal Housing Enterprise Oversight in a separate letter dated February 14,2002.
Finally, with respect to internal control related to performance measures reported in the annual performance plan, we obtained an understanding of the design of significant internal controls relating to the existence and completeness assertions, as required by OMB Bulletin No. 01-02. Our procedures were not designed to provide assurance on internal control over reported performance measures, and, accordingly, we do not provide an opinion on such controls.
This report is intended solely for the information and use of the management of the Office of Federal Housing Enterprise Oversight, OMB and Congress, and is not intended to be and should not be used by anyone other than these specified parties.
Februaly 14,2002
13 Dembo, Jones,Healy, Pennington & Marshall, P.C. Certified Public Accountants and Consultants

Dembo, Jones, Healy, Pennington & Marshall, P.C. Certified Public Accountants and Consuhnts
Report of Independent Auditors on Compliance with Laws and Regulations
Mi. Armando Falcon Director Office of Federal Housing Enterprise Oversight
We have audited the Principal Statements (hereinafter referred to as “financial statements”) of the Office of Federal Housing Enterprise Oversight as of and for the years ended September 30,2001 and 2000, and have issued our report thereon dated February 14, 20002. We conducted our audits in accordance with auditing standards generally accepted in the United States of America; the standards applicable to financial audits contained in Government Auditing Standards, issued by the Comptroller General of the United States; and, Office of Management and Budget (OMB) Bulletin No. 01-02, “Audit Requirements for Federal Financial Statements.”
The management of the Office of Federal Housing Enterprise Oversight is responsible for complying with laws and regulations applicable to the agency. As part of obtaining reasonable assurance about whether the agency’s financial statements are free of material misstatement, we performed tests of its compliance with certain provisions of laws and regulations, noncompliance with which could have a direct and material effect on the determination of financial statement amounts and certain other laws and regulations specified in OMB Bulletin No. 01-02, including the requirements referred to in the Federal Financial Management Improvement Act (FFMIA) of 1996. We limited our tests of compliance to these provisions and we did not test all laws and regulations applicable to the Office of Federal Housing Enterprise Oversight.
The results of our tests of compliance with the laws and regulations described in the preceding paragraph exclusive of FFMIA disclosed no instances of noncompliance that are required to be reported under Government Auditing Standards or OMB Bulletin No. 01-02. OMB Bulletin No. 97-01, “Form and Content of Agency Financial Statements”, as amended, defines the form and content of financial statements of the executive departments and agencies listed in the attachment to the Bulletin. The Offce of Federal Housing Enterprise Oversight is not required to follow OMB Bulletin No. 97-01 but has voluntarily adopted the Bulletin’s requirements.
Under FFMIA, we are required to report whether the agency’s financial management systems substantially comply with the Federal financial management systems requirements, applicable Federal accounting standards, and the United States Government Standard General Ledger at the transaction level. To meet this requirement, we performed tests of compliance with FFMIA section 803(a) requirements.
60 10 Executive Boulevard * Suite 900 * Rockville. Maryland 20852 1 “
30 I 770-5 I00 - 888 283-5472 - Fax 30 I 770-5202 - [email protected] 14
MEMBERAMERICAN INSTITUTEOF CPXlTFED PUBLIC ACCOUNTANTS AND P O W S 1NrERNATION.X

The results of our tests disclosed no instances in which the agency’s financial management systems did not substantially comply with the three requirements discussed in the preceding paragraph.
Providing an opinion on compliance with certain provisions of laws and regulations was not an objective of our audits and, accordingly, we do not express such an opinion.
This report is intended solely for the information of the management of the Office of Federal Housing Enterprise Oversight, OMB and Congress, and is not intended to be and should not be used by anyone other than these specified parties.
February 14, 2002
15 Dembo, Jones,Healy, Pennington & Marshall, P.C. Certified PublicAccountants and Consultants

OFFICE OF FEDERAL HOUSING ENTERPRISE OVERSIGHTBALANCE SHEETS
AS OF SEPTEMBER 30, 2001 AND 2000
2001 2000
ASSETS
Intragovernmental Assets Fund Balance with Treasury - Note 2 $ 4,628,495 $ 5,939,763 Accounts Receivable 46,459 -Advances/Prepayments - Note 3 575,339 460,142
Total Intragovernmental Assets 5,250,293 6,399,905
Accounts Receivable 2,871 -Property, Plant and Equipment, Net - Note 4 15,176,690 10,935,914
TOTAL ASSETS $ 20,429,854 $ 17,335,819
LIABILITIES
Liabilities Covered by Budgetary Resources: Intragovernmental Liabilities
Accrued Liabilities $ 157,304 $ 146,555 Total Intragovernmental Liabilities
Other Payables and Liabilities Accounts Payable Other Liabilities
Total Other Payables and Liabilities - Note 5
Total Liabilities Covered by Budgetary Resources
Liabilities Not Covered by Budgetary Resources: Governmental
Accrued Annual Leave
157,304 146,555
1,433,217 1,349,098 859,872 688,166
2,293,089 2,037,264
2,450,393 2,183,819
890,745 673,519
Total Liabilities Not Covered by Budgetary Resources - Note 6 890,745 673,519 TOTAL LIABILITIES $ 3,341,138 $ 2,857,338
NET POSITION Unexpended Appropriations $ 2,212,149 $ 3,754,738 Cumulative Results of Operations 14,876,567 10,723,743 Total Net Position - Note 7 17,088,716 14,478,481
TOTAL LIABILITIES AND NET POSITION $ 20,429,854 $ 17,335,819
The accompanying notes are an integral part of these statements.
16

OFFICE OF FEDERAL HOUSING ENTERPRISE OVERSIGHTSTATEMENTS OF NET COST
FOR THE FISCAL YEARS ENDEDSEPTEMBER 30, 2001 AND 2000
2001 2000
Program Costs
Production Costs Public Production $ 16,775,503 $ 13,263,439 Federal Production
Total Production Costs - Note 8
Non-Production Costs Imputed Financing Sources - Note 9 Financing Sources Yet to be Provided - Note 10
Total Non-Production Costs
Total Program Costs
2,387,275 2,173,453 19,162,778 15,436,892
506,187 389,794 217,226 (241,039) 723,413 148,755
19,886,191 15,585,647
Net Cost of Operations $ 19,886,191 $ 15,585,647
The accompanying notes are an integral part of these statements.
17

OFFICE OF FEDERAL HOUSING ENTERPRISE OVERSIGHTSTATEMENTS OF CHANGES IN NET POSITION
FOR THE FISCAL YEARS ENDEDSEPTEMBER 30, 2001 AND 2000
2001 2000
Net Cost of Operations $ (19,886,191) $ (15,585,647)
Financing Sources Appropriations Used 23,534,034 18,067,103 Imputed Financing Sources - Note 9 506,187 389,794 Total Financing Sources 24,040,221 18,456,897
Net Change in Cumulative Results of Operations 4,154,030 2,871,250
Increase / (Decrease) in Unexpended Appropriations (1,543,795) 1,415,116
Changes in Net Position 2,610,235 4,286,366
Net Position - Beginning of Period 14,478,481 10,192,115 Net Position - End of Period - Note 7 $ 17,088,716 $ 14,478,481
The accompanying notes are an integral part of these statements.
18

19
OFFICE OF FEDERAL HOUSING ENTERPRISE OVERSIGHTSTATEMENTS OF BUDGETARY RESOURCES
FOR THE FISCAL YEARS ENDEDSEPTEMBER 30, 2001 AND 2000
2001 2000
Budgetary Resources Appropriations $ 22,000,000 $ 19,493,000 Unobligated Balance Brought Forward October 1 9,762 10,780 Adjustments
Recoveries of Prior Year Obligations - Note 11 605,000 133,203 Permanently not available Pursuant to Public Law 102-550 (9,762) (10,780)
Total Budgetary Resources $ 22,605,000 $ 19,626,203
Status of Budgetary Resources Obligations Incurred $ 22,598,287 $ 19,616,441 Unobligated Balance Not Available 6,713 9,762
Total Status of Budgetary Resources $ 22,605,000 $ 19,626,203
Outlays
Obligations Incurred $ 22,598,287 $ 19,616,441 Less: Spending Authority from Collections/Adjustments
Receivable from Federal Sources Actual Recoveries of Prior Year Obligations - Note 11
Obligated Balance, Net - Beginning of Period
Obligated Balance, Net - End of Period Undelivered Orders Accounts Payable
Total Obligated Balance, Net - End of Period
34,047 - (605,000) (133,203)
22,027,334 19,483,238
5,930,001 4,354,541
(2,205,436) (3,746,183) (2,450,393) (2,183,818) (4,655,829) (5,930,001)
Total Outlays $ 23,301,506 $ 17,907,778
Disbursements $ 23,306,279 $ 17,923,953 Collections (4,773) (16,175)
Total Outlays $ 23,301,506 $ 17,907,778
The accompanying notes are an integral part of these statements.
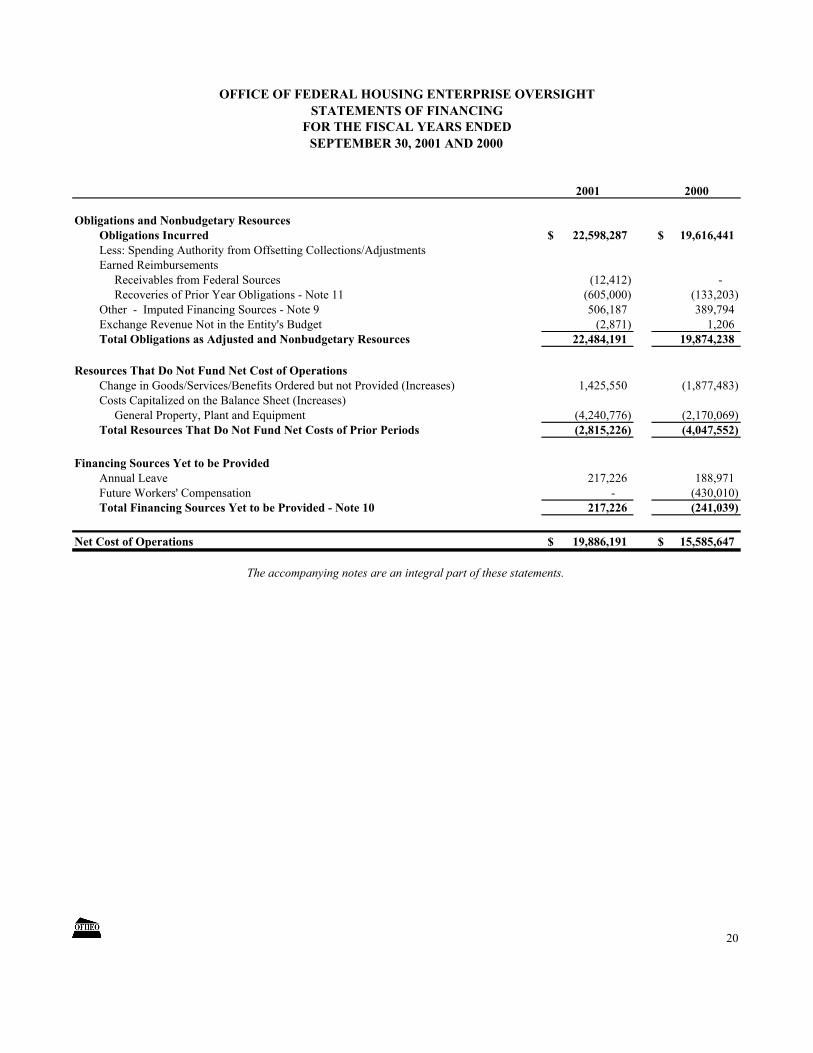
OFFICE OF FEDERAL HOUSING ENTERPRISE OVERSIGHTSTATEMENTS OF FINANCING
FOR THE FISCAL YEARS ENDEDSEPTEMBER 30, 2001 AND 2000
2001 2000
Obligations and Nonbudgetary Resources Obligations Incurred $ 22,598,287 $ 19,616,441 Less: Spending Authority from Offsetting Collections/Adjustments Earned Reimbursements
Receivables from Federal Sources (12,412) -Recoveries of Prior Year Obligations - Note 11 (605,000) (133,203)
Other - Imputed Financing Sources - Note 9 506,187 389,794 Exchange Revenue Not in the Entity's Budget (2,871) 1,206 Total Obligations as Adjusted and Nonbudgetary Resources 22,484,191 19,874,238
Resources That Do Not Fund Net Cost of Operations Change in Goods/Services/Benefits Ordered but not Provided (Increases) 1,425,550 (1,877,483) Costs Capitalized on the Balance Sheet (Increases)
General Property, Plant and Equipment (4,240,776) (2,170,069) Total Resources That Do Not Fund Net Costs of Prior Periods (2,815,226) (4,047,552)
Financing Sources Yet to be Provided Annual Leave 217,226 188,971 Future Workers' Compensation - (430,010) Total Financing Sources Yet to be Provided - Note 10 217,226 (241,039)
Net Cost of Operations $ 19,886,191 $ 15,585,647
The accompanying notes are an integral part of these statements.
20

NOTES TO FINANCIAL STATEMENTS
NOTE 1 œ SUMMARY OF SIGNIFICANT ACCOUNTING POLICIES
• Reporting Entity
The Office of Federal Housing Enterprise Oversight (OFHEO) was established as an independent office within the Department of Housing and Urban Development (HUD) by the Federal Housing Enterprises Financial Safety and Soundness Act of 1992 (title XIII of P.L. 102-550).
Since 1993, Congress has enacted no-year appropriations, which are available for obligation by OFHEO until expended. The appropriation is funded by an annual assessment from two government sponsored enterprises, Fannie Mae and Freddie Mac (the �Enterprises�) and not with taxpayer funds. Beginning with the FY 1998 appropriation, OFHEO receives an appropriation from the U.S. Treasury General Fund each year. OFHEO fully offsets the General Fund appropriation with collections from the assessments of the Enterprises and ensures that taxpayer funds are not used for OFHEO�s operations.
OFHEO�s enabling statute requires that OFHEO return to the Enterprises, in the form of a credit against the next year�s annual assessment, any unobligated assessment funds at the end of the fiscal year. This effectively makes OFHEO operate like a hybrid annual appropriation with no-year authority -- OFHEO�s annual resources are available for obligation and expenditure without regard to any fiscal year limitation. OFHEO reduces the current year�s assessment by the amount of the unobligated balance from the previous year. Consequently, there is no carry over of budget authority from one year to the next and the annual assessment is adjusted by the credit given to the Enterprises each year.
The accompanying financial statements reflect the activities of OFHEO. OFHEO has only entity activities and the financial statements reflect those activities, which include the appropriation received to conduct operations. OFHEO does not perform custodial activities on behalf of other federal agencies.
• Basis of Presentation
OFHEO is not covered by the Chief Financial Officer�s (CFO) Act and is not required to follow the Office of Management and Budget (OMB) Bulletin 97-01, as amended on form and content. However, OFHEO adopted OMB�s requirements for CFO Act financial statements. The principal statements were prepared from the official financial records and general ledger of OFHEO in accordance with Generally Accepted Accounting Principles (GAAP) as established through the Federal Accounting Standards Advisory Board (FASAB) standards.
21
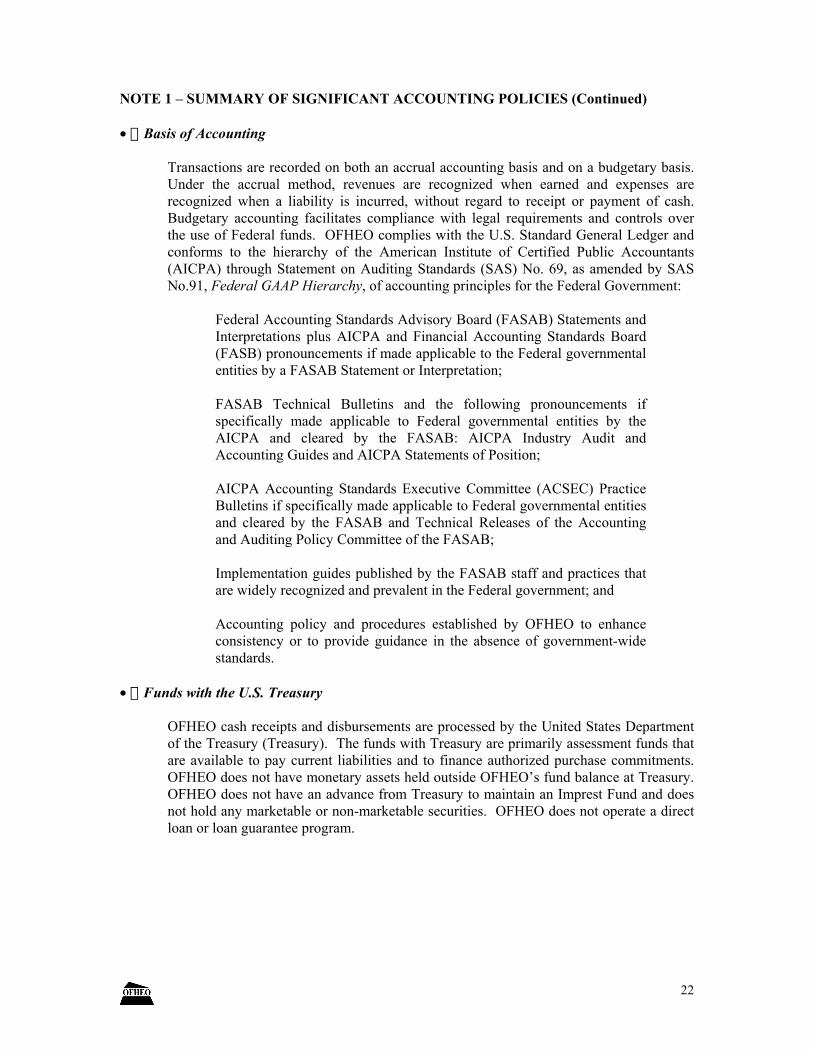
NOTE 1 œ SUMMARY OF SIGNIFICANT ACCOUNTING POLICIES (Continued)
• Basis of Accounting
Transactions are recorded on both an accrual accounting basis and on a budgetary basis. Under the accrual method, revenues are recognized when earned and expenses are recognized when a liability is incurred, without regard to receipt or payment of cash. Budgetary accounting facilitates compliance with legal requirements and controls over the use of Federal funds. OFHEO complies with the U.S. Standard General Ledger and conforms to the hierarchy of the American Institute of Certified Public Accountants (AICPA) through Statement on Auditing Standards (SAS) No. 69, as amended by SAS No.91, Federal GAAP Hierarchy, of accounting principles for the Federal Government:
Federal Accounting Standards Advisory Board (FASAB) Statements and Interpretations plus AICPA and Financial Accounting Standards Board (FASB) pronouncements if made applicable to the Federal governmental entities by a FASAB Statement or Interpretation;
FASAB Technical Bulletins and the following pronouncements if specifically made applicable to Federal governmental entities by the AICPA and cleared by the FASAB: AICPA Industry Audit and Accounting Guides and AICPA Statements of Position;
AICPA Accounting Standards Executive Committee (ACSEC) Practice Bulletins if specifically made applicable to Federal governmental entities and cleared by the FASAB and Technical Releases of the Accounting and Auditing Policy Committee of the FASAB;
Implementation guides published by the FASAB staff and practices that are widely recognized and prevalent in the Federal government; and
Accounting policy and procedures established by OFHEO to enhance consistency or to provide guidance in the absence of government-wide standards.
• Funds with the U.S. Treasury
OFHEO cash receipts and disbursements are processed by the United States Department of the Treasury (Treasury). The funds with Treasury are primarily assessment funds that are available to pay current liabilities and to finance authorized purchase commitments. OFHEO does not have monetary assets held outside OFHEO�s fund balance at Treasury. OFHEO does not have an advance from Treasury to maintain an Imprest Fund and does not hold any marketable or non-marketable securities. OFHEO does not operate a direct loan or loan guarantee program.
22

NOTE 1 œ SUMMARY OF SIGNIFICANT ACCOUNTING POLICIES (Continued)
• Property and Equipment
OFHEO�s property and equipment is recorded at cost and is depreciated using the straight-line method over the estimated service lives of the assets. Service lives have been established as three years for computer related systems and up to 20 years for other equipment. Leasehold improvements are depreciated over the remaining term of the lease agreement. OFHEO has an established capitalization threshold of $5,000 to conform with the materiality approach for the accounting that supports OFHEO�s independent financial statements. Other property items, normal repairs, and maintenance are charged to expense as incurred.
At present, internally developed software is being created at OFHEO. This asset is software under development to support the oversight of the Enterprises. The software supports the development of risk-based capital standards and will be used to implement the final risk-based capital standards. It also supports the examination of the Enterprises. The software is being developed internally. The asset had not been placed in service as of September 30, 2001 and no depreciation has been recorded.
OFHEO has no capitalized leases, no real property holdings, and no heritage assets.
• Prepaid and Deferred Charges
Payments in advance of the receipt of goods and services are recorded as prepaid charges at the time of prepayment and are recognized as expenditures/expenses when the related goods and services are received.
• Accounts Receivable
OFHEO�s Accounts Receivable consists of receivables and reimbursements due from others. No account is estimated as uncollectable.
• Liabilities
Liabilities represent the amount of funds that are likely to be paid by OFHEO as the result of a transaction or event that has already occurred.
OFHEO reports its liabilities under two categories: Liabilities covered by Budgetary Resources and Liabilities Not Covered by Budgetary Resources.
OFHEO�s Liabilities Covered by Budgetary Resources are liabilities that are funded by a current appropriation or other funding source. Both intragovernmental (payable to other federal entities) and governmental liabilities, consist of accounts payable and accrued liabilities. Accounts payable reflect invoices processed for payment during the fiscal year which are yet unpaid as of the end of the fiscal year due to scheduling of payments to reflect prompt payment guidelines. Accrued liabilities consist of both estimates of accounts payable for the value of services received during the fiscal year for which OFHEO had not been billed as of the end of the fiscal year and payroll accruals
23
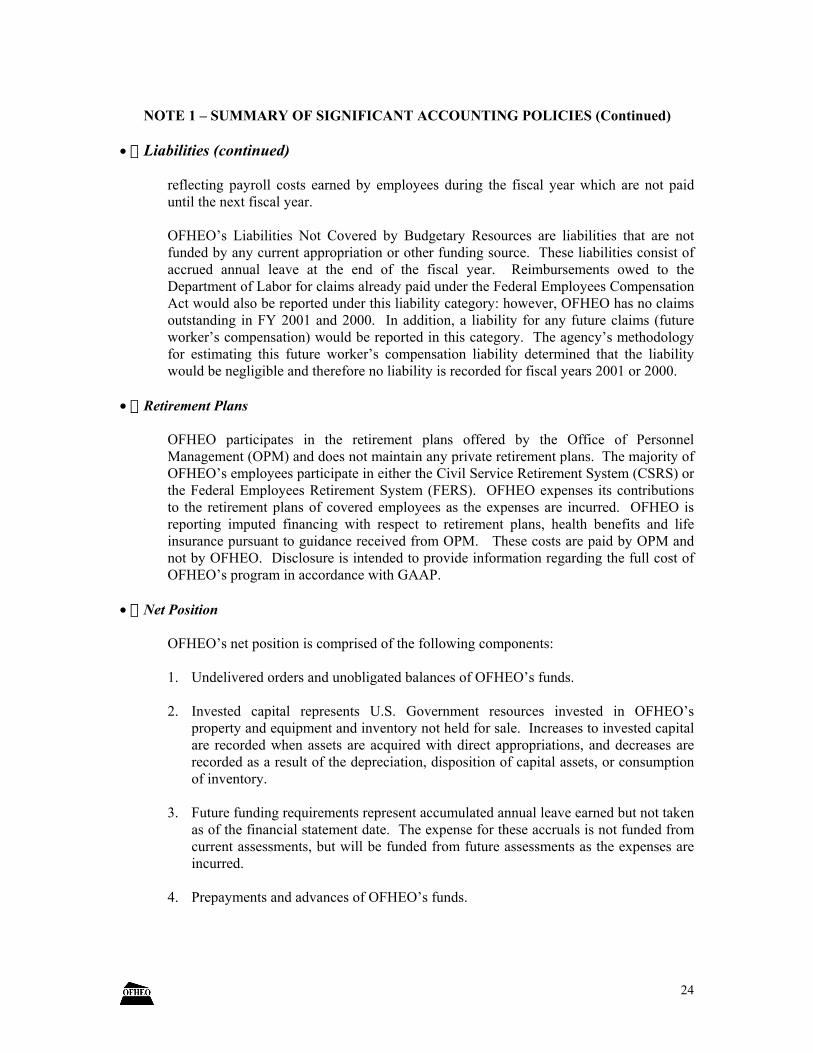
NOTE 1 œ SUMMARY OF SIGNIFICANT ACCOUNTING POLICIES (Continued)
• Liabilities (continued)
reflecting payroll costs earned by employees during the fiscal year which are not paid until the next fiscal year.
OFHEO�s Liabilities Not Covered by Budgetary Resources are liabilities that are not funded by any current appropriation or other funding source. These liabilities consist of accrued annual leave at the end of the fiscal year. Reimbursements owed to the Department of Labor for claims already paid under the Federal Employees Compensation Act would also be reported under this liability category: however, OFHEO has no claims outstanding in FY 2001 and 2000. In addition, a liability for any future claims (future worker�s compensation) would be reported in this category. The agency�s methodology for estimating this future worker�s compensation liability determined that the liability would be negligible and therefore no liability is recorded for fiscal years 2001 or 2000.
• Retirement Plans
OFHEO participates in the retirement plans offered by the Office of Personnel Management (OPM) and does not maintain any private retirement plans. The majority of OFHEO�s employees participate in either the Civil Service Retirement System (CSRS) or the Federal Employees Retirement System (FERS). OFHEO expenses its contributions to the retirement plans of covered employees as the expenses are incurred. OFHEO is reporting imputed financing with respect to retirement plans, health benefits and life insurance pursuant to guidance received from OPM. These costs are paid by OPM and not by OFHEO. Disclosure is intended to provide information regarding the full cost of OFHEO�s program in accordance with GAAP.
• Net Position
OFHEO�s net position is comprised of the following components:
1. Undelivered orders and unobligated balances of OFHEO�s funds.
2. Invested capital represents U.S. Government resources invested in OFHEO�s property and equipment and inventory not held for sale. Increases to invested capital are recorded when assets are acquired with direct appropriations, and decreases are recorded as a result of the depreciation, disposition of capital assets, or consumption of inventory.
3. Future funding requirements represent accumulated annual leave earned but not taken as of the financial statement date. The expense for these accruals is not funded from current assessments, but will be funded from future assessments as the expenses are incurred.
4. Prepayments and advances of OFHEO�s funds.
24

NOTE 2 - FUND BALANCE WITH TREASURY
Fund Balance with Treasury consists of the following as of September 30, 2001 and 2000:
Unobligated Obligated Available Unavailable 2001 2000
General Funds $4,621,782 $6,713 $4,628,495 $5,939,763
The FY 2001 Fund Balance with Treasury reflects an erroneous OPAC that was charged by OTS in error, in the amount of $34,047.
NOTE 3 œ ADVANCES/PREPAYMENTS
The Advances/Prepayments are payments made to the Office of Thrift Supervision (OTS) for additional occupancy space contracted for in fiscal year 2000 but not occupied until fiscal year 2001 and for additional occupancy space contracted for in fiscal year 2001 but not to be occupied until fiscal year 2002.
NOTE 4 - PROPERTY, PLANT AND EQUIPMENT
Property, Plant and Equipment balances as of September 30, 2001 and 2000 are as follows:
2001 2000 Acquisition Accumulated Net Net
Asset Type Cost Depreciation Book Value Book Value Equipment $ $796,600 $ $ Leasehold Improvements 474,997 9,200 465,797 - Information Technology Software 14,005,769 - 14,005,769 10,210,295 Total $15,982,490 $805,800 $15,176,690 $10,935,914
1,501,724 705,124 725,619
NOTE 5 œ OTHER PAYABLES AND LIABILITIES
2001 2000 Accounts Payable in Process $ $ Accrued Accounts Payable 1,243,127 1,085,619 Sub-Total Other Payables and Liabilities $1,433,217 $1,349,098 Accrued Payroll and Benefits 859,872 688,166 Total Other Payables and Liabilities $2,293,089 $2,037,264
190,090 263,479
25
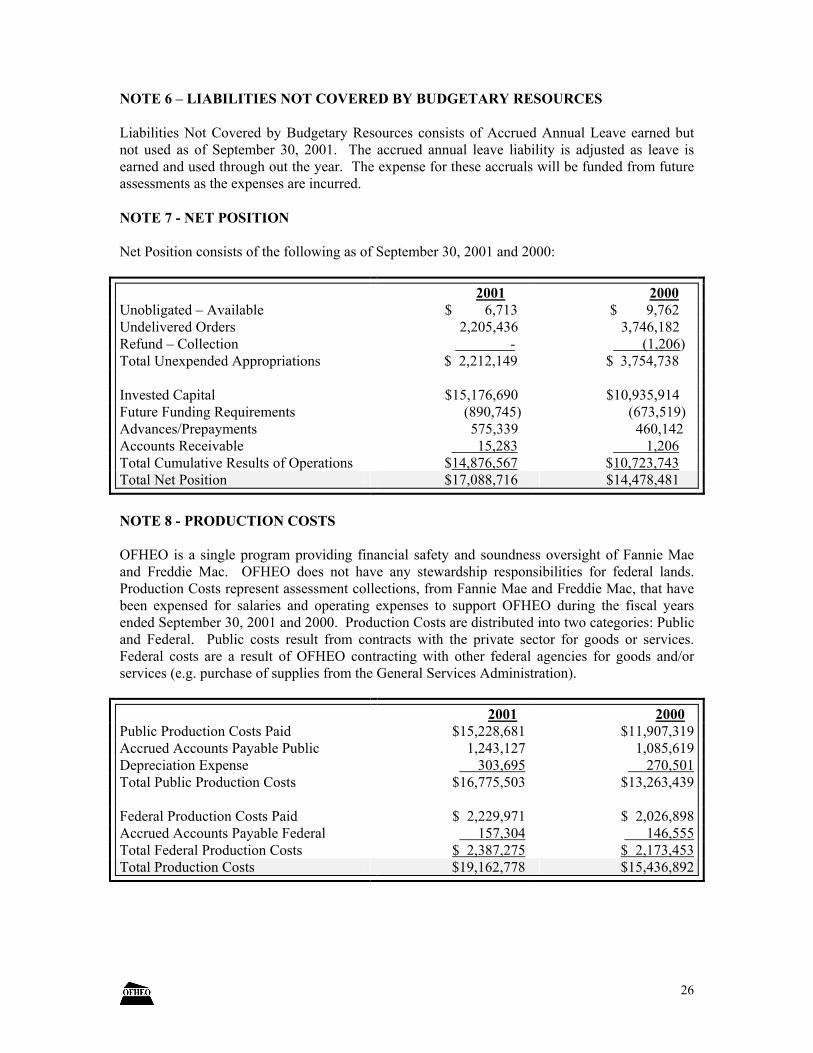
NOTE 6 œ LIABILITIES NOT COVERED BY BUDGETARY RESOURCES
Liabilities Not Covered by Budgetary Resources consists of Accrued Annual Leave earned but not used as of September 30, 2001. The accrued annual leave liability is adjusted as leave is earned and used through out the year. The expense for these accruals will be funded from future assessments as the expenses are incurred.
NOTE 7 - NET POSITION
Net Position consists of the following as of September 30, 2001 and 2000:
2001 2000 Unobligated � Available $ $ Undelivered Orders 2,205,436 3,746,182 Refund � Collection - (1,206) Total Unexpended Appropriations $ $
Invested Capital $15,176,690 $10,935,914 Future Funding Requirements (890,745) (673,519) Advances/Prepayments 575,339 460,142 Accounts Receivable 15,283 1,206 Total Cumulative Results of Operations $14,876,567 $10,723,743 Total Net Position $17,088,716 $14,478,481
6,713 9,762
2,212,149 3,754,738
NOTE 8 - PRODUCTION COSTS
OFHEO is a single program providing financial safety and soundness oversight of Fannie Mae and Freddie Mac. OFHEO does not have any stewardship responsibilities for federal lands. Production Costs represent assessment collections, from Fannie Mae and Freddie Mac, that have been expensed for salaries and operating expenses to support OFHEO during the fiscal years ended September 30, 2001 and 2000. Production Costs are distributed into two categories: Public and Federal. Public costs result from contracts with the private sector for goods or services. Federal costs are a result of OFHEO contracting with other federal agencies for goods and/or services (e.g. purchase of supplies from the General Services Administration).
2001 2000 Public Production Costs Paid $15,228,681 $11,907,319 Accrued Accounts Payable Public 1,243,127 1,085,619 Depreciation Expense 303,695 270,501 Total Public Production Costs $16,775,503 $13,263,439
Federal Production Costs Paid $ $ Accrued Accounts Payable Federal 157,304 146,555 Total Federal Production Costs $ $ Total Production Costs $19,162,778 $15,436,892
2,229,971 2,026,898
2,387,275 2,173,453
26

NOTE 9 - IMPUTED FINANCING
Imputed Financing represents the post retirement benefits funded by OPM for OFHEO employees.
2001 2000 CSRS Imputed $244,098 $198,115 FERS Imputed (5,141) (14,985) CSRS Offset Imputed 14,913 5,776 Life Insurance Imputed 1,630 1,189 Health Insurance Imputed 250,687 199,699 Total Imputed Financing � Post Employment $506,187 $389,794
NOTE 10 - FINANCING SOURCES YET TO BE PROVIDED
Financing Sources Yet to be Provided reflects potential future costs for accrued annual leave and future worker�s compensation (FWC), which are not funded by current budgetary resources. The amounts reported are the net change of the accrued annual leave and the FWC liability from the prior year.
2001 2000 Annual Leave Expense $217,226 $ 188,971 Future Worker�s Compensation - (430,010) Total Financing Sources Yet To Be Provided $217,226 ($241,039)
NOTE 11 - RECOVERIES OF PRIOR YEAR OBLIGATIONS
Recoveries of prior year obligations consist of the reapportionment of prior year funds by OMB. OFHEO requested and received the authority to re-obligate these prior year funds in FY 2001 and also in FY 2000.
NOTE 12 œ PENSION EXPENSE
OFHEO recognizes the full cost of providing future pension benefits to eligible employees while they are working. The excess of total pension expense over the amounts contributed by OFHEO and its employees must be financed by OPM. OFHEO recognizes an imputed financing source equal to this excess amount. Pension expense in FY 2001 and 2000 consisted of the following:
Accumulated 2001 2000 Employer Costs Imputed Total Pension Total Pension
Contributions to OPM Expense Expense Civil Services Retirement $ $259,011 $ $ Federal Employee�s
Retirement 841,929 (5,141) 836,788 634,174
Thrift Savings Plan 317,749 - 317,749 228,722 Total Pension Expense $1,428,444 $253,870 $1,682,314 $1,280,447
268,766 527,777 417,551
27

NOTE 13 œ OPERATING LEASE
OFHEO has an occupancy lease with the Office of Thrift Supervision (OTS) that covers office space and building services which include utilities, security guards, janitorial services, mail delivery, use of the loading dock, garage parking and building operation and maintenance. The initial term of the lease was for five years beginning in 1993, with the option to renew for three 5- year terms. OFHEO has exercised the first of the three option terms. Total rent expense for years ending September 30, 2001 and 2000 was approximately $1.8 million and $1.7 million respectively.
OFHEO may terminate the lease agreement in whole or in part. In the event of a termination at OFHEO�s discretion, OFHEO would be required to pay two months rent, at an approximate cost of $300,000 (based on September 2001 rate). OFHEO�s obligation to make payments ceases on the date that the space is rented. If either party ceases to exist or merge with another entity by operation of law, either party may terminate the rental agreement. In the event of termination under this provision, neither party is liable for further costs, fees, damages or other monies due to the termination, except for payments through the date of termination. During FY 2000 OFHEO rented additional space from OTS, which was not ready for occupancy until FY 2001, also during FY 2001 OFHEO rented additional space from OTS, which will not be ready for occupancy until FY 2002, therefore, OFHEO is reflecting these rental payments as Advances/Prepayments.
28

Office of Federal Housing Enterprise OversightRequired Supplementary Information Intra-governmental Trading Partners As of September 30, 2001 and 2000
Intra-governmental Assets Trading Partner Agency 2001 2000
Department of Treasury1 $ 4,628,495 $ 5,939,763 National Finance Center2 12,412 -Office of Thrift Supervision 3, 4 609,386 460,142
$ 5,250,293 $ 6,399,905
1 Fund balance with Treasury consists of assessment funds that are available to pay current liabilities and to finance authorized purchase commitments.
2 During FY 2001, duplicate award payments to OFHEO employees were processed by the National Finance Center (NFC) and charged to OFHEO. Employees receiving the duplicate payments have submitted checks to NFC for repayment. However, OFHEO is awaiting refund from NFC for the duplicate charge.
3 During FY 2001 OFHEO rented additional space from OTS, this space will not be occupied until FY 2002, therefore, OFHEO reflected this rental payment for additional space as a Prepayment. This amount also includes an erroneous OPAC charge of $34,047, that was rejected on October 1, 2001.
4 During FY 2000 OFHEO rented additional space from OTS, this space was not ready for occupancy until FY 2001. OFHEO began expensing this prepayment during FY 2001 when OFHEO took possession of the additional space.
Intra-governmental Liabilities Trading Partner Agency 2001 2000
Comptroller of the Currency $ 100 $ -Federal Deposit Insurance Corp 46,000 3,248 Department of Treasury 1,592 9,305 Office of Thrift Supervision 15,902 -Department of Veteran's Affairs 44,196 27,397 Department of Housing and Urban Development 40,827 95,827 Federal Reserve Board - 3,500 Department of Commerce 8,507 3,500 Office of Personnel Management - 3,112 Department of State 180 -Department of Agriculture - 666
$ 157,304 $ 146,555
OFHEO's intra-governmental liabilities consist of accrued liabilities for the value of services received during the fiscal year for which OFHEO had not been billed as of the end of the fiscal year.
29
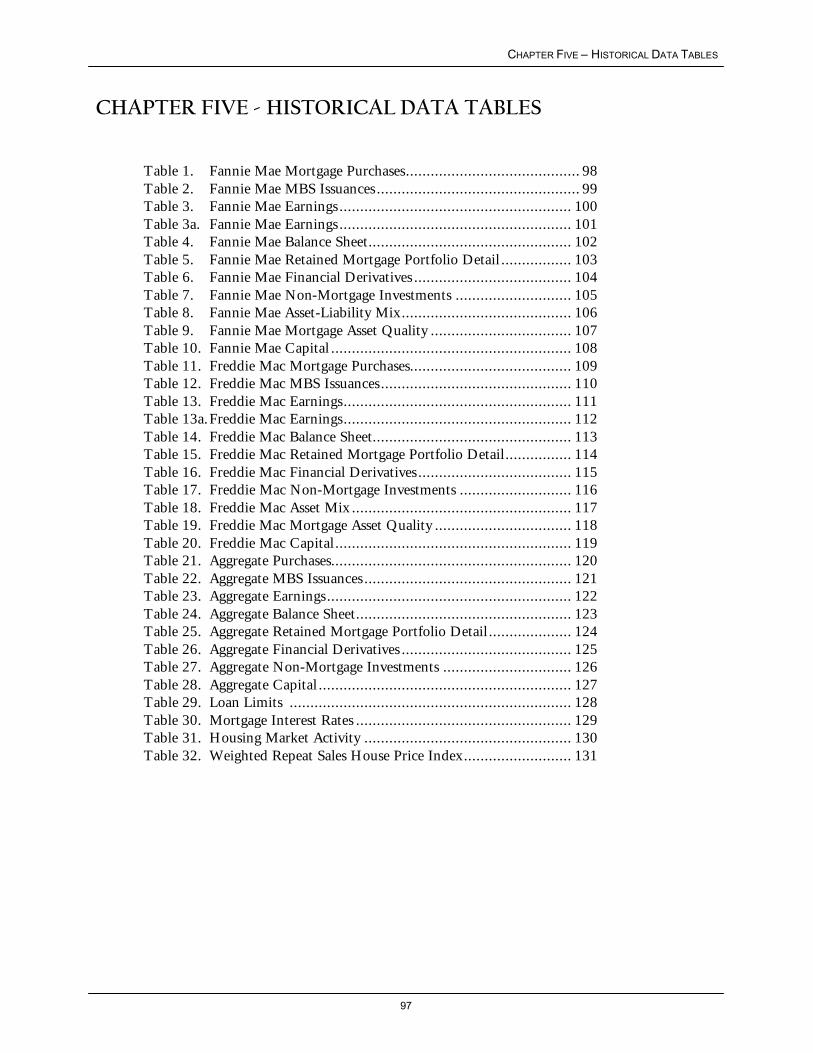
CHAPTER FIVE – HISTORICAL DATA TABLES
CHAPTER FIVE - HISTORICAL DATA TABLES
Table 1. Fannie Mae Mortgage Purchases.......................................... 98Table 2. Fannie Mae MBS Issuances ................................................. 99Table 3. Fannie Mae Earnings ........................................................ 100Table 3a. Fannie Mae Earnings ........................................................ 101Table 4. Fannie Mae Balance Sheet................................................. 102Table 5. Fannie Mae Retained Mortgage Portfolio Detail ................. 103Table 6. Fannie Mae Financial Derivatives ...................................... 104Table 7. Fannie Mae Non-Mortgage Investments ............................ 105Table 8. Fannie Mae Asset-Liability Mix ......................................... 106Table 9. Fannie Mae Mortgage Asset Quality .................................. 107Table 10. Fannie Mae Capital .......................................................... 108Table 11. Freddie Mac Mortgage Purchases....................................... 109Table 12. Freddie Mac MBS Issuances .............................................. 110Table 13. Freddie Mac Earnings....................................................... 111Table 13a.Freddie Mac Earnings....................................................... 112Table 14. Freddie Mac Balance Sheet................................................ 113Table 15. Freddie Mac Retained Mortgage Portfolio Detail ................ 114Table 16. Freddie Mac Financial Derivatives ..................................... 115Table 17. Freddie Mac Non-Mortgage Investments ........................... 116Table 18. Freddie Mac Asset Mix ..................................................... 117Table 19. Freddie Mac Mortgage Asset Quality ................................. 118Table 20. Freddie Mac Capital ......................................................... 119Table 21. Aggregate Purchases.......................................................... 120Table 22. Aggregate MBS Issuances .................................................. 121Table 23. Aggregate Earnings ........................................................... 122Table 24. Aggregate Balance Sheet.................................................... 123Table 25. Aggregate Retained Mortgage Portfolio Detail .................... 124Table 26. Aggregate Financial Derivatives ......................................... 125Table 27. Aggregate Non-Mortgage Investments ............................... 126Table 28. Aggregate Capital ............................................................. 127Table 29. Loan Limits .................................................................... 128Table 30. Mortgage Interest Rates .................................................... 129Table 31. Housing Market Activity .................................................. 130Table 32. Weighted Repeat Sales House Price Index .......................... 131
97
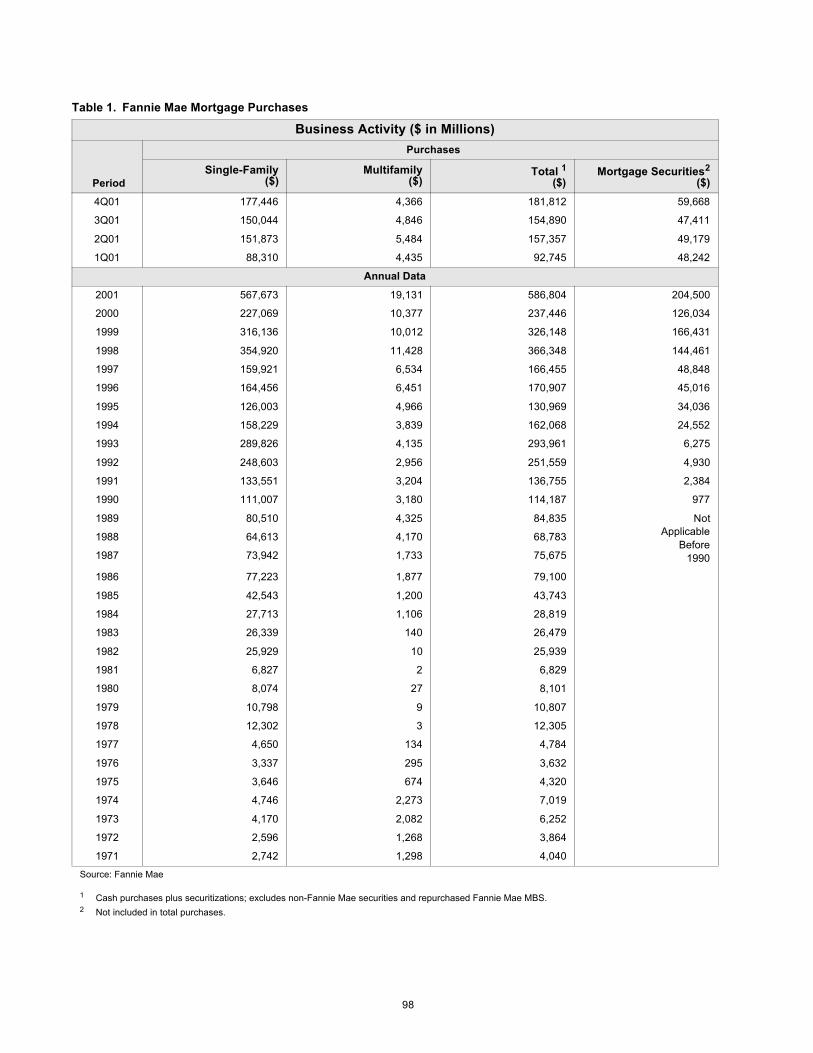
98
Table 1. Fannie Mae Mortgage Purchases
Business Activity ($ in Millions)
Period
Purchases
Single-Family ($)
Multifamily ($)
Total 1
($) Mortgage Securities2
($)
4Q01 177,446 4,366 181,812 59,668
3Q01 150,044 4,846 154,890 47,411
2Q01 151,873 5,484 157,357 49,179
1Q01 88,310 4,435 92,745 48,242
Annual Data
2001 567,673 19,131 586,804 204,500
2000 227,069 10,377 237,446 126,034
1999 316,136 10,012 326,148 166,431
1998 354,920 11,428 366,348 144,461
1997 159,921 6,534 166,455 48,848
1996 164,456 6,451 170,907 45,016
1995 126,003 4,966 130,969 34,036
1994 158,229 3,839 162,068 24,552
1993 289,826 4,135 293,961 6,275
1992 248,603 2,956 251,559 4,930
1991 133,551 3,204 136,755 2,384
1990 111,007 3,180 114,187 977
1989 80,510 4,325 84,835 Not Applicable
Before 1990
1988 64,613 4,170 68,783
1987 73,942 1,733 75,675
1986 77,223 1,877 79,100
1985 42,543 1,200 43,743
1984 27,713 1,106 28,819
1983 26,339 140 26,479
1982 25,929 10 25,939
1981 6,827 2 6,829
1980 8,074 27 8,101
1979 10,798 9 10,807
1978 12,302 3 12,305
1977 4,650 134 4,784
1976 3,337 295 3,632
1975 3,646 674 4,320
1974 4,746 2,273 7,019
1973 4,170 2,082 6,252
1972 2,596 1,268 3,864
1971 2,742 1,298 4,040
Source: Fannie Mae
1 Cash purchases plus securitizations; excludes non-Fannie Mae securities and repurchased Fannie Mae MBS. 2 Not included in total purchases.

99
Table 2. Fannie Mae MBS Issuances
Business Activity ($ in Millions)
Period
MBS Issuances
Single-Family MBS ($)
Multifamily MBS ($)
Total MBS ($)
Multiclass MBS1
($)
4Q01 159,387 2,955 162,342 81,551
3Q01 135,964 3,452 139,416 26,349
2Q01 138,983 4,376 143,359 18,191
1Q01 80,287 3,018 83,305 13,312
Annual Data
2001 514,621 13,801 528,422 139,403
2000 204,066 7,596 211,662 39,544
1999 292,192 8,497 300,689 55,160
1998 315,120 11,028 326,148 84,147
1997 143,615 5,814 149,429 85,415
1996 144,201 5,668 149,869 30,780
1995 106,269 4,187 110,456 9,681
1994 128,385 2,237 130,622 73,365
1993 220,485 959 221,444 210,630
1992 193,187 850 194,037 170,205
1991 111,488 1,415 112,903 112,808
1990 96,006 689 96,695 68,291
1989 66,489 3,275 69,764 41,715
1988 51,120 3,758 54,878 17,005
1987 62,067 1,162 63,229 9,917
1986 60,017 549 60,566 2,400
1985 23,142 507 23,649 Not Issued Before
1986
1984 13,087 459 13,546
1983 13,214 126 13,340
1982 13,970 Not Issued Before
1983
13,970
1981 717 717
Not Issued Before
1981
Not Issued Before
1981
Source: Fannie Mae
The majority qualify as Real Estate Mortgage Investment Conduits (REMICs) and are also known as structured securitizations. 1

Table 3. Fannie Mae Earnings
Earnings ($ in Millions)
Period
Operating Net Interest
Income1
($)
Guarantee Fee
Income
($)
Average Guarantee
Fee Rate
(BasisPoints)
Administrative Expenses
($)
Credit-related Expenses2
($)
Operating Net Income3
($)
4Q01 2,165 398 18.9 251 16 1,438
3Q01 1,892 384 19.2 273 15 1,377
2Q01 1,800 357 18.9 254 18 1,314
1Q01 1,643 343 19.1 239 29 1,238
Annual Data
2001 7,500 1,482 19.0 1,017 78 5,367
2000 5,674 1,351 19.5 905 94 4,448
1999 4,894 1,282 19.3 800 127 3,912
1998 4,110 1,229 20.2 708 261 3,418
1997 3,949 1,274 22.7 636 375 3,056
1996 3,592 1,196 22.4 560 409 2,725
1995 3,047 1,086 22.0 546 335 2,144
1994 2,823 1,083 22.5 525 378 2,132
1993 2,533 961 21.3 443 305 1,873
1992 2,058 834 21.2 381 320 1,623
1991 1,778 675 21.0 319 370 1,363
1990 1,593 536 21.1 286 310 1,173
1989 1,191 408 21.3 254 310 807
1988 837 328 21.6 218 365 507
1987 890 263 22.1 197 360 376
1986 384 175 23.8 175 306 105
1985 139 112 25.6 142 206 (7)
1984 (90) 78 26.2 112 86 (71)
1983 (9) 54 26.3 81 48 49
1982 (464) 16 27.2 60 36 (192)
1981 (429) 0 25.0 49 (28) (206)
1980 21 Not Applicable
Before 1981
Not Applicable
Before 1981
44 19 14
1979 322 46 35 162
1978 294 39 36 209
1977 251 32 28 165
1976 203 30 25 127
1975 174 27 16 115
1974 142 23 17 107
1973 180 18 12 126
1972 138 13 5 96
1971 49 15 4 61
Source: Fannie Mae
1 Interest income net of interest expense, nominal basis, adjusted to remove FAS 133 effects starting in 2001.2 Credit-related expenses are mortgage loan loss provision plus real estate owned expenses.3 Net income adjusted to remove FAS 133 starting in 2001.
100
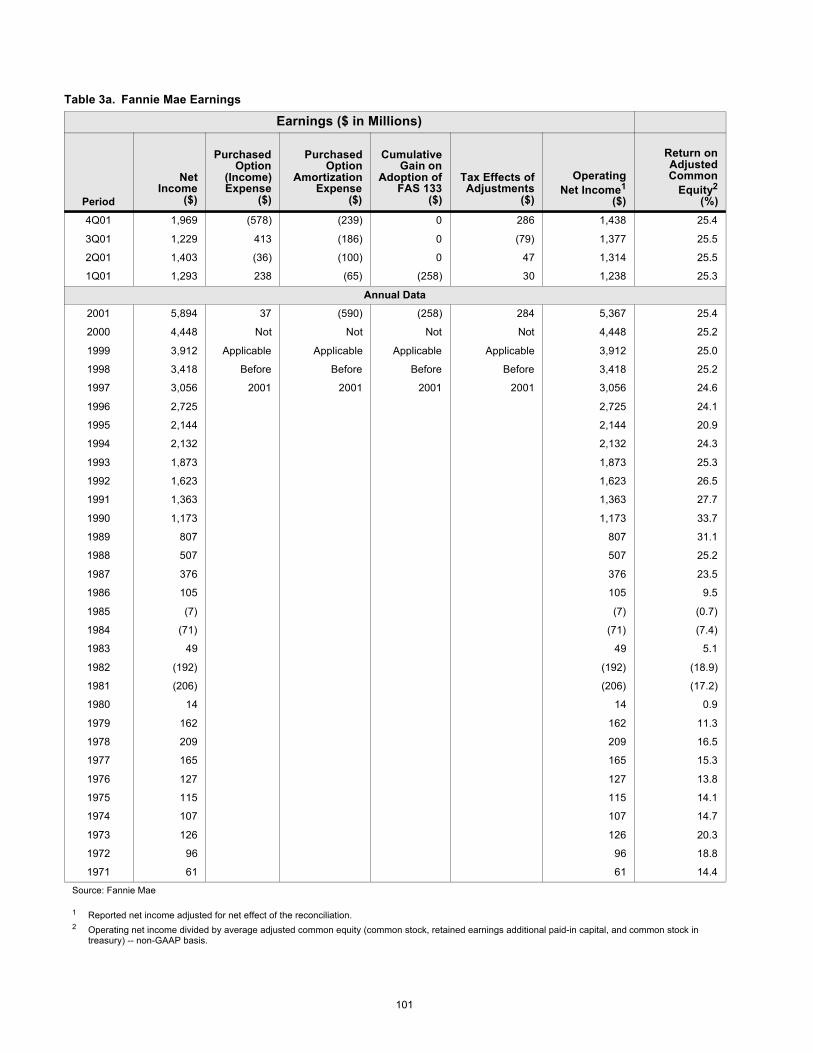
Table 3a. Fannie Mae Earnings
Earnings ($ in Millions)
Period
Net Income
($)
Purchased Option
(Income) Expense
($)
Purchased Option
Amortization Expense
($)
Cumulative Gain on
Adoption of FAS 133
($)
Tax Effects of Adjustments
($)
Operating Net Income1
($)
Return on Adjusted Common
Equity2
(%)
4Q01 1,969 (578) (239) 0 286 1,438 25.4
3Q01 1,229 413 (186) 0 (79) 1,377 25.5
2Q01 1,403 (36) (100) 0 47 1,314 25.5
1Q01 1,293 238 (65) (258) 30 1,238 25.3
Annual Data
2001 5,894 37 (590) (258) 284 5,367 25.4
2000 4,448 Not Not Not Not 4,448 25.2
1999 3,912 Applicable Applicable Applicable Applicable 3,912 25.0
1998 3,418 Before Before Before Before 3,418 25.2
1997 3,056 2001 2001 2001 2001 3,056 24.6
1996 2,725 2,725 24.1
1995 2,144 2,144 20.9
1994 2,132 2,132 24.3
1993 1,873 1,873 25.3
1992 1,623 1,623 26.5
1991 1,363 1,363 27.7
1990 1,173 1,173 33.7
1989 807 807 31.1
1988 507 507 25.2
1987 376 376 23.5
1986 105 105 9.5
1985 (7) (7) (0.7)
1984 (71) (71) (7.4)
1983 49 49 5.1
1982 (192) (192) (18.9)
1981 (206) (206) (17.2)
1980 14 14 0.9
1979 162 162 11.3
1978 209 209 16.5
1977 165 165 15.3
1976 127 127 13.8
1975 115 115 14.1
1974 107 107 14.7
1973 126 126 20.3
1972 96 96 18.8
1971 61 61 14.4
Source: Fannie Mae
1 Reported net income adjusted for net effect of the reconciliation. 2 Operating net income divided by average adjusted common equity (common stock, retained earnings additional paid-in capital, and common stock in
treasury) -- non-GAAP basis.
101
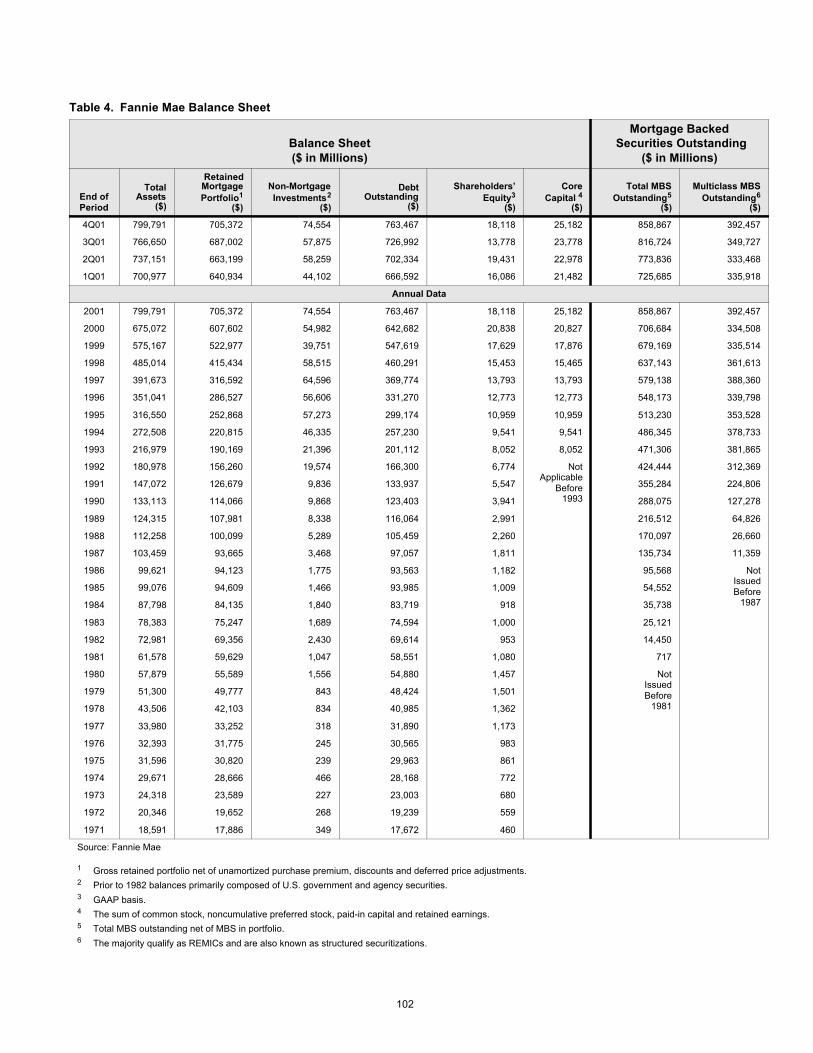
Table 4. Fannie Mae Balance Sheet
Balance Sheet ($ in Millions)
Mortgage Backed Securities Outstanding
($ in Millions)
End of Period
Total Assets
($)
Retained Mortgage Portfolio1
($)
Non-Mortgage Investments2
($)
Debt Outstanding
($)
Shareholders’ Equity3
($)
Core Capital 4
($)
Total MBS Outstanding5
($)
Multiclass MBS Outstanding6
($)
4Q01 799,791 705,372 74,554 763,467 18,118 25,182 858,867 392,457
3Q01 766,650 687,002 57,875 726,992 13,778 23,778 816,724 349,727
2Q01 737,151 663,199 58,259 702,334 19,431 22,978 773,836 333,468
1Q01 700,977 640,934 44,102 666,592 16,086 21,482 725,685 335,918
Annual Data
2001 799,791 705,372 74,554 763,467 18,118 25,182 858,867 392,457
2000 675,072 607,602 54,982 642,682 20,838 20,827 706,684 334,508
1999 575,167 522,977 39,751 547,619 17,629 17,876 679,169 335,514
1998 485,014 415,434 58,515 460,291 15,453 15,465 637,143 361,613
1997 391,673 316,592 64,596 369,774 13,793 13,793 579,138 388,360
1996 351,041 286,527 56,606 331,270 12,773 12,773 548,173 339,798
1995 316,550 252,868 57,273 299,174 10,959 10,959 513,230 353,528
1994 272,508 220,815 46,335 257,230 9,541 9,541 486,345 378,733
1993 216,979 190,169 21,396 201,112 8,052 8,052 471,306 381,865
1992 180,978 156,260 19,574 166,300 6,774 Not Applicable
Before 1993
424,444 312,369
1991 147,072 126,679 9,836 133,937 5,547 355,284 224,806
1990 133,113 114,066 9,868 123,403 3,941 288,075 127,278
1989 124,315 107,981 8,338 116,064 2,991 216,512 64,826
1988 112,258 100,099 5,289 105,459 2,260 170,097 26,660
1987 103,459 93,665 3,468 97,057 1,811 135,734 11,359
1986 99,621 94,123 1,775 93,563 1,182 95,568 Not Issued Before
1987
1985 99,076 94,609 1,466 93,985 1,009 54,552
1984 87,798 84,135 1,840 83,719 918 35,738
1983 78,383 75,247 1,689 74,594 1,000 25,121
1982 72,981 69,356 2,430 69,614 953 14,450
1981 61,578 59,629 1,047 58,551 1,080 717
1980 57,879 55,589 1,556 54,880 1,457 Not Issued Before
1981
1979 51,300 49,777 843 48,424 1,501
1978 43,506 42,103 834 40,985 1,362
1977 33,980 33,252 318 31,890 1,173
1976 32,393 31,775 245 30,565 983
1975 31,596 30,820 239 29,963 861
1974 29,671 28,666 466 28,168 772
1973 24,318 23,589 227 23,003 680
1972 20,346 19,652 268 19,239 559
1971 18,591 17,886 349 17,672 460
Source: Fannie Mae
1 Gross retained portfolio net of unamortized purchase premium, discounts and deferred price adjustments.2 Prior to 1982 balances primarily composed of U.S. government and agency securities.3 GAAP basis.4 The sum of common stock, noncumulative preferred stock, paid-in capital and retained earnings. 5 Total MBS outstanding net of MBS in portfolio.6 The majority qualify as REMICs and are also known as structured securitizations.
102
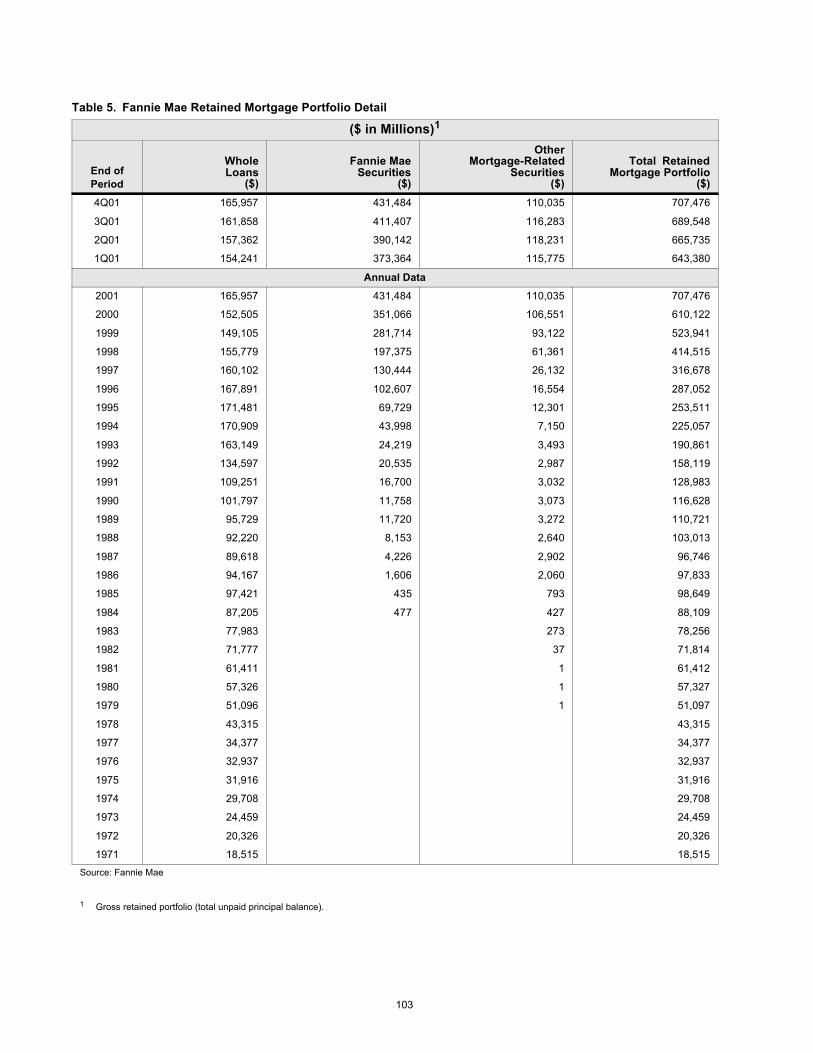
Table 5. Fannie Mae Retained Mortgage Portfolio Detail
($ in Millions)1
End of Period
Whole Loans
($)
Fannie Mae Securities
($)
Other Mortgage-Related
Securities ($)
Total Retained Mortgage Portfolio
($)
4Q01 165,957 431,484 110,035 707,476
3Q01 161,858 411,407 116,283 689,548
2Q01 157,362 390,142 118,231 665,735
1Q01 154,241 373,364 115,775 643,380
Annual Data
2001 165,957 431,484 110,035 707,476
2000 152,505 351,066 106,551 610,122
1999 149,105 281,714 93,122 523,941
1998 155,779 197,375 61,361 414,515
1997 160,102 130,444 26,132 316,678
1996 167,891 102,607 16,554 287,052
1995 171,481 69,729 12,301 253,511
1994 170,909 43,998 7,150 225,057
1993 163,149 24,219 3,493 190,861
1992 134,597 20,535 2,987 158,119
1991 109,251 16,700 3,032 128,983
1990 101,797 11,758 3,073 116,628
1989 95,729 11,720 3,272 110,721
1988 92,220 8,153 2,640 103,013
1987 89,618 4,226 2,902 96,746
1986 94,167 1,606 2,060 97,833
1985 97,421 435 793 98,649
1984 87,205 477 427 88,109
1983 77,983 273 78,256
1982 71,777 37 71,814
1981 61,411 1 61,412
1980 57,326 1 57,327
1979 51,096 1 51,097
1978 43,315 43,315
1977 34,377 34,377
1976 32,937 32,937
1975 31,916 31,916
1974 29,708 29,708
1973 24,459 24,459
1972 20,326 20,326
1971 18,515 18,515
Source: Fannie Mae
1 Gross retained portfolio (total unpaid principal balance).
103

Table 6. Fannie Mae Derivatives
Financial Derivatives - Notional Amount Outstanding ($ in Millions)
End of Period
Interest Rate
Swaps ($)
Interest Rate Caps, Floors, and
Corridors ($)
Foreign Currency
($)
OTC Futures, Options
and Forward
Rate Agreements
($)
Exchange- Traded
Futures, Options,
and Other Derivatives
($) Other
($) Total
($)
4Q01 299,953 75,893 8,493 148,800 0 0 533,139
3Q01 295,990 66,193 8,470 116,165 0 0 486,818
2Q01 285,103 59,443 8,477 101,765 262 600 455,650
1Q01 246,822 53,413 8,526 60,215 2,000 3,335 374,311
Annual Data
2001 299,953 75,893 8,493 148,800 0 0 533,139
2000 227,651 33,663 9,511 48,865 0 0 319,690
1999 192,032 28,950 11,507 41,081 0 1,400 274,970
1998 142,846 14,500 12,995 13,481 0 3,735 187,557
1997 149,673 100 9,968 0 0 1,660 161,401
1996 158,140 300 2,429 0 0 350 161,219
1995 125,679 300 1,224 29 0 975 128,207
1994 87,470 360 1,023 0 0 1,465 90,317
1993 49,458 360 1,023 0 0 1,425 52,265
1992 24,130 0 1,177 0 0 1,350 26,658
1991 9,100 0 Not Available
Before 1992
50 0 1,050 10,200
1990 4,800 0 25 0 1,700 6,525
Source: Fannie Mae
104
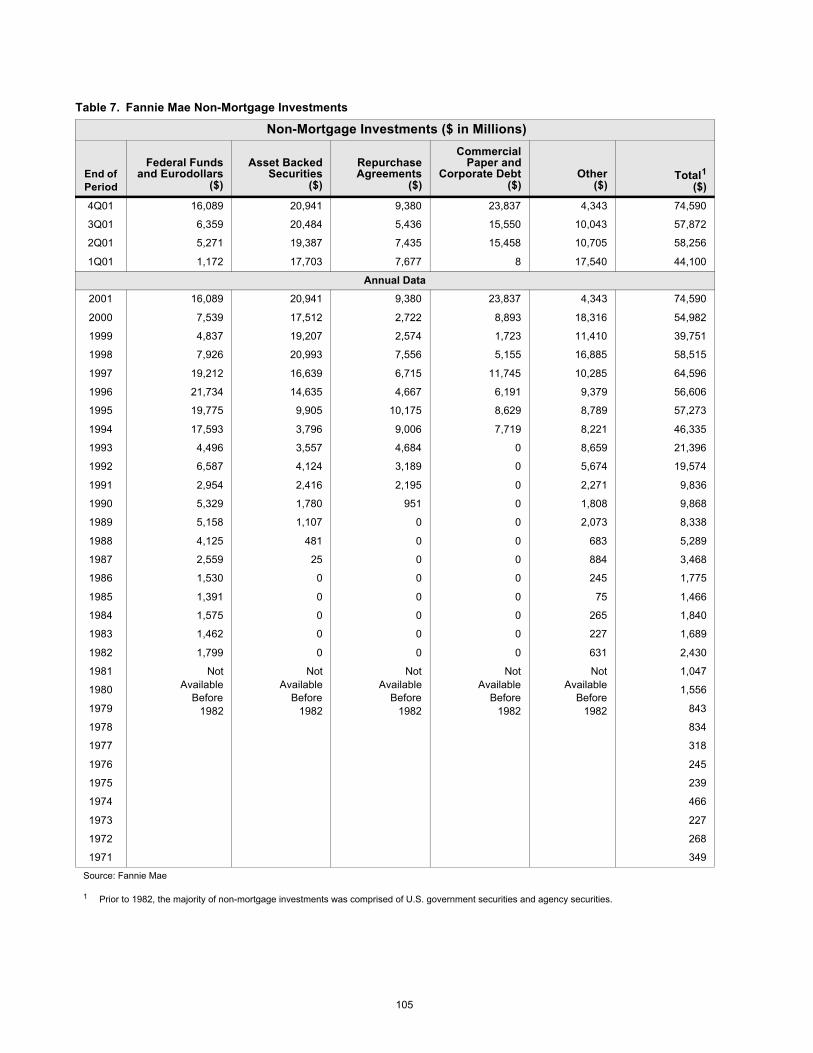
Table 7. Fannie Mae Non-Mortgage Investments
Non-Mortgage Investments ($ in Millions)
End of Period
Federal Funds and Eurodollars
($)
Asset Backed Securities
($)
Repurchase Agreements
($)
Commercial Paper and
Corporate Debt ($)
Other ($)
Total1
($)
4Q01 16,089 20,941 9,380 23,837 4,343 74,590
3Q01 6,359 20,484 5,436 15,550 10,043 57,872
2Q01 5,271 19,387 7,435 15,458 10,705 58,256
1Q01 1,172 17,703 7,677 8 17,540 44,100
Annual Data
2001 16,089 20,941 9,380 23,837 4,343 74,590
2000 7,539 17,512 2,722 8,893 18,316 54,982
1999 4,837 19,207 2,574 1,723 11,410 39,751
1998 7,926 20,993 7,556 5,155 16,885 58,515
1997 19,212 16,639 6,715 11,745 10,285 64,596
1996 21,734 14,635 4,667 6,191 9,379 56,606
1995 19,775 9,905 10,175 8,629 8,789 57,273
1994 17,593 3,796 9,006 7,719 8,221 46,335
1993 4,496 3,557 4,684 0 8,659 21,396
1992 6,587 4,124 3,189 0 5,674 19,574
1991 2,954 2,416 2,195 0 2,271 9,836
1990 5,329 1,780 951 0 1,808 9,868
1989 5,158 1,107 0 0 2,073 8,338
1988 4,125 481 0 0 683 5,289
1987 2,559 25 0 0 884 3,468
1986 1,530 0 0 0 245 1,775
1985 1,391 0 0 0 75 1,466
1984 1,575 0 0 0 265 1,840
1983 1,462 0 0 0 227 1,689
1982 1,799 0 0 0 631 2,430
1981 Not Available
Before 1982
Not Available
Before 1982
Not Available
Before 1982
Not Available
Before 1982
Not Available
Before 1982
1,047
1980 1,556
1979 843
1978 834
1977 318
1976 245
1975 239
1974 466
1973 227
1972 268
1971 349
Source: Fannie Mae
1 Prior to 1982, the majority of non-mortgage investments was comprised of U.S. government securities and agency securities.
105
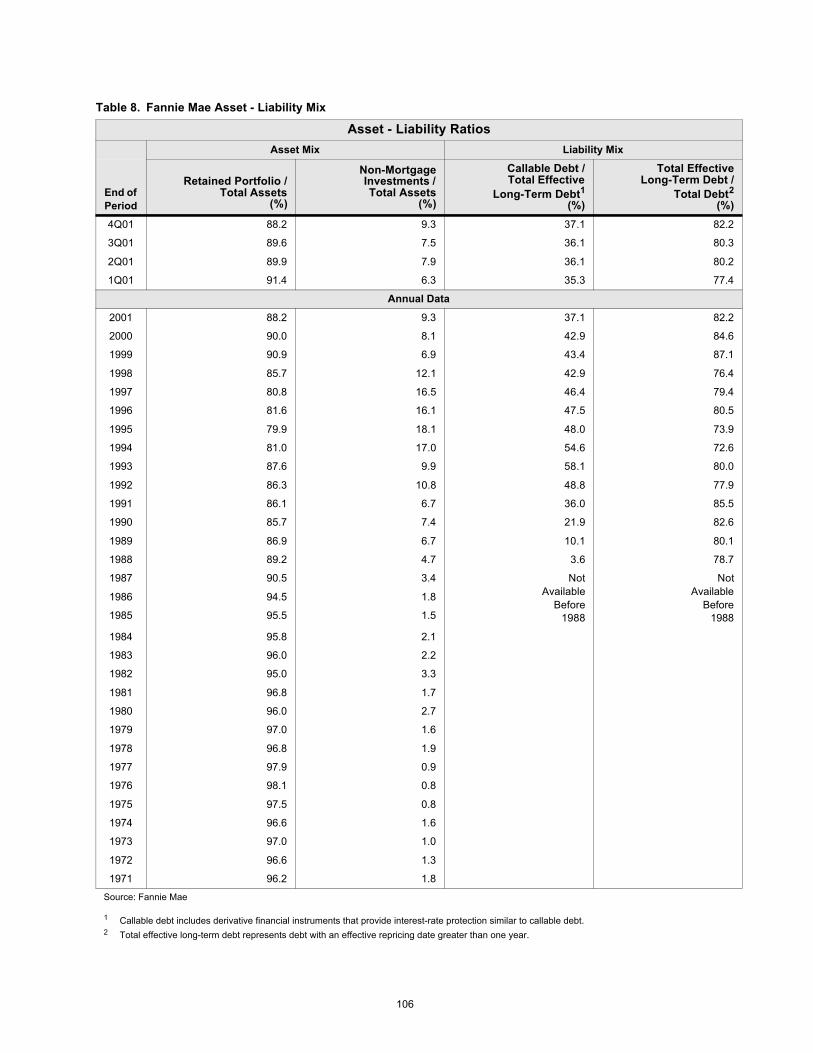
Table 8. Fannie Mae Asset - Liability Mix
Asset - Liability Ratios Asset Mix Liability Mix
End of Period
Retained Portfolio / Total Assets
(%)
Non-Mortgage Investments / Total Assets
(%)
Callable Debt / Total Effective
Long-Term Debt1
(%)
Total Effective Long-Term Debt /
Total Debt2
(%)
4Q01 88.2 9.3 37.1 82.2
3Q01 89.6 7.5 36.1 80.3
2Q01 89.9 7.9 36.1 80.2
1Q01 91.4 6.3 35.3 77.4
Annual Data
2001 88.2 9.3 37.1 82.2
2000 90.0 8.1 42.9 84.6
1999 90.9 6.9 43.4 87.1
1998 85.7 12.1 42.9 76.4
1997 80.8 16.5 46.4 79.4
1996 81.6 16.1 47.5 80.5
1995 79.9 18.1 48.0 73.9
1994 81.0 17.0 54.6 72.6
1993 87.6 9.9 58.1 80.0
1992 86.3 10.8 48.8 77.9
1991 86.1 6.7 36.0 85.5
1990 85.7 7.4 21.9 82.6
1989 86.9 6.7 10.1 80.1
1988 89.2 4.7 3.6 78.7
1987 90.5 3.4 Not Available
Before 1988
Not Available
Before 1988
1986 94.5 1.8
1985 95.5 1.5
1984 95.8 2.1
1983 96.0 2.2
1982 95.0 3.3
1981 96.8 1.7
1980 96.0 2.7
1979 97.0 1.6
1978 96.8 1.9
1977 97.9 0.9
1976 98.1 0.8
1975 97.5 0.8
1974 96.6 1.6
1973 97.0 1.0
1972 96.6 1.3
1971 96.2 1.8
Source: Fannie Mae
1 Callable debt includes derivative financial instruments that provide interest-rate protection similar to callable debt. 2 Total effective long-term debt represents debt with an effective repricing date greater than one year.
106

Table 9. Fannie Mae Mortgage Asset Quality
Mortgage Asset Quality
End of Period
Single-Family Delinquency
Rate1
(%)
Multifamily Delinquency
Rate2
(%)
Credit Losses /Total MBS Outstanding
plus Retained Portfolio3
(%)
REO / Total MBS Outstanding
plus Retained Portfolio4
(%)
Credit-Enhanced Outstanding / Total
MBS Outstanding plus Retained Portfolio5
(%)
4Q01 0.49 0.32 0.01 0.04 15.5
3Q01 0.45 0.10 0.01 0.04 17.0
2Q01 0.43 0.07 0.01 0.04 17.8
1Q01 0.44 0.05 0.01 0.05 19.3
Annual Data
2001 0.49 0.32 0.01 0.04 15.5
2000 0.45 0.05 0.01 0.05 20.3
1999 0.48 0.12 0.01 0.06 20.9
1998 0.58 0.29 0.03 0.08 17.5
1997 0.62 0.37 0.04 0.10 12.8
1996 0.58 0.68 0.05 0.11 10.5
1995 0.56 0.81 0.05 0.08 10.6
1994 0.47 1.21 0.06 0.10 10.2
1993 0.48 2.34 0.04 0.10 10.6
1992 0.53 2.65 0.04 0.09 15.6
1991 0.64 3.62 0.04 0.07 22.0
1990 0.58 1.70 0.06 0.09 25.9
1989 0.69 3.20 0.07 0.14 Not Available
Before 1990
1988 0.88 6.60 0.11 0.15
1987 1.12 Not Available
Before 1988
0.11 0.18
1986 1.38 0.12 0.22
1985 1.48 0.13 0.32
1984 1.65 0.09 0.33
1983 1.49 0.05 0.35
1982 1.41 0.01 0.20
1981 0.96 0.01 0.13
1980 0.90 0.01 0.09
1979 0.56 0.02 0.11
1978 0.55 0.02 0.18
1977 0.46 0.02 0.26
1976 1.58 0.03 0.27
1975 0.56 0.03 0.51
1974 0.51 0.02 0.52
1973 Not Available
Before 1974
0.00 0.61
1972 0.02 0.98
1971 0.01 0.59
Source: Fannie Mae
1 Includes conventional loans for which Fannie Mae has primary risk of loss that are 90 or more days delinquent or are in the process of foreclosure. Data prior to 1992 includes loans in relief or bankruptcy, even if they are less than 90 days delinquent.
2 Includes loans that are two or more months delinquent based on the dollar amount of such loans in the portfolio and underlying MBS. 3 Credit losses are charge-offs plus real estate owned expense; average balances used to calculate ratios subsequent to 1994; quarterly data are
annualized. 4 Real Estate Owned balances reflect end-of-period amounts. Beginning with 1995, data reflect adoption of SFAS 114. 5 The proportion of loans that has additional recourse from a third party to accept some or all of the expected losses on defaulted mortgages.
107
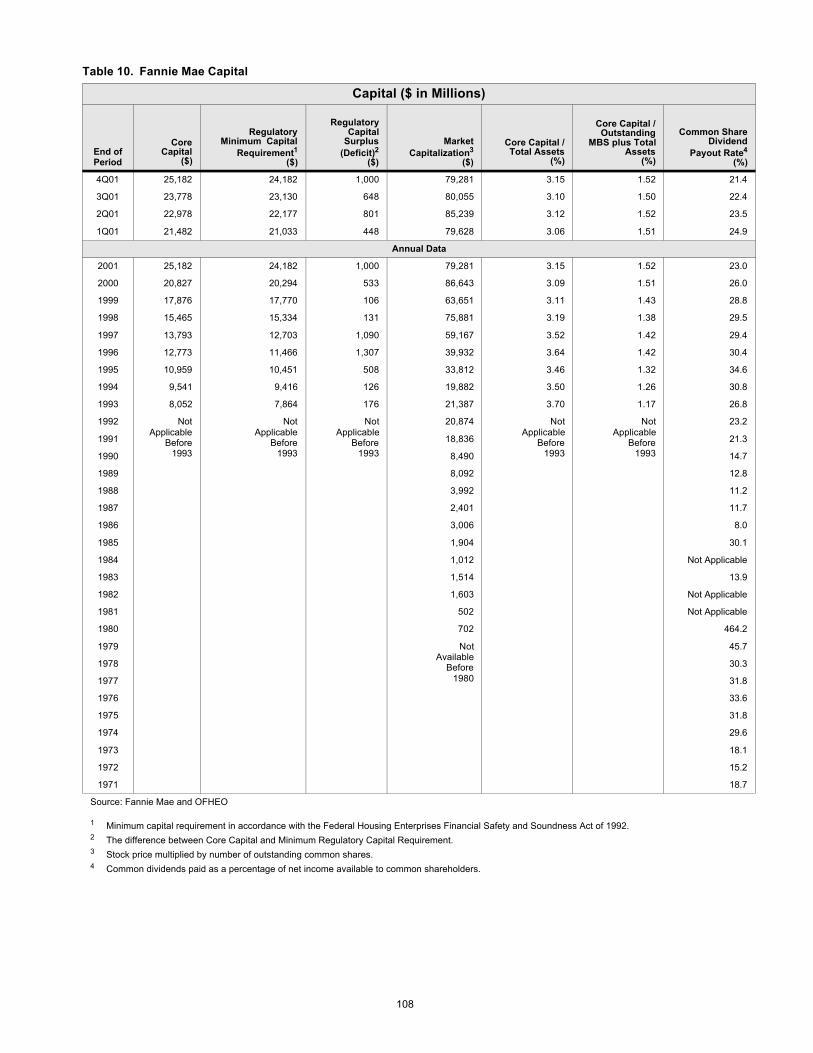
Table 10. Fannie Mae Capital
Capital ($ in Millions)
End of Period
Core Capital
($)
Regulatory Minimum Capital
Requirement1
($)
Regulatory Capital
Surplus (Deficit)2
($)
Market Capitalization3
($)
Core Capital / Total Assets
(%)
Core Capital / Outstanding
MBS plus Total Assets
(%)
Common Share Dividend
Payout Rate4
(%)
4Q01 25,182 24,182 1,000 79,281 3.15 1.52 21.4
3Q01 23,778 23,130 648 80,055 3.10 1.50 22.4
2Q01 22,978 22,177 801 85,239 3.12 1.52 23.5
1Q01 21,482 21,033 448 79,628 3.06 1.51 24.9
Annual Data
2001 25,182 24,182 1,000 79,281 3.15 1.52 23.0
2000 20,827 20,294 533 86,643 3.09 1.51 26.0
1999 17,876 17,770 106 63,651 3.11 1.43 28.8
1998 15,465 15,334 131 75,881 3.19 1.38 29.5
1997 13,793 12,703 1,090 59,167 3.52 1.42 29.4
1996 12,773 11,466 1,307 39,932 3.64 1.42 30.4
1995 10,959 10,451 508 33,812 3.46 1.32 34.6
1994 9,541 9,416 126 19,882 3.50 1.26 30.8
1993 8,052 7,864 176 21,387 3.70 1.17 26.8
1992 Not Applicable
Before 1993
Not Applicable
Before 1993
Not Applicable
Before 1993
20,874 Not Applicable
Before 1993
Not Applicable
Before 1993
23.2
1991 18,836 21.3
1990 8,490 14.7
1989 8,092 12.8
1988 3,992 11.2
1987 2,401 11.7
1986 3,006 8.0
1985 1,904 30.1
1984 1,012 Not Applicable
1983 1,514 13.9
1982 1,603 Not Applicable
1981 502 Not Applicable
1980 702 464.2
1979 Not Available
Before 1980
45.7
1978 30.3
1977 31.8
1976 33.6
1975 31.8
1974 29.6
1973 18.1
1972 15.2
1971 18.7
Source: Fannie Mae and OFHEO
1 Minimum capital requirement in accordance with the Federal Housing Enterprises Financial Safety and Soundness Act of 1992.2 The difference between Core Capital and Minimum Regulatory Capital Requirement.3 Stock price multiplied by number of outstanding common shares.4 Common dividends paid as a percentage of net income available to common shareholders.
108

Table 11. Freddie Mac Mortgage Purchases
Business Activity ($ Millions) Purchases
Period Single-Family
($) Multifamily
($) Total Mortgages1
($) Mortgage Securities2
($)
4Q01 123,151 4,068 127,219 63,791
3Q01 109,665 2,048 111,713 56,853
2Q01 104,935 1,955 106,890 54,985
1Q01 55,404 1,438 56,842 55,285
Annual Data
2001 393,155 9,509 402,664 230,914
2000 168,013 6,030 174,043 91,896
1999 232,612 7,181 239,793 101,898
1998 263,490 3,910 267,400 128,446
1997 115,160 2,241 117,401 35,385
1996 122,850 2,229 125,079 36,824
1995 89,971 1,565 91,536 39,292
1994 122,563 847 123,410 19,817
1993 229,051 191 229,242 Not Available
Before 1994
1992 191,099 27 191,126
1991 99,729 236 99,965
1990 74,180 1,338 75,518
1989 76,765 1,824 78,589
1988 42,884 1,191 44,075
1987 74,824 2,016 76,840
1986 99,936 3,538 103,474
1985 42,110 1,902 44,012
1984 Not Available
Before 1985
Not Available
Before 1985
21,885
1983 22,952
1982 23,671
1981 3,744
1980 3,690
1979 5,716
1978 6,524
1977 4,124
1976 1,129
1975 1,716
1974 2,185
1973 1,334
1972 1,265
1971 778
Source: Freddie Mac
1 Loans purchased from lenders; excluding non-Freddie Mac mortgage securities and repurchased Freddie Mac MBS. 2 Not included in total purchases.
109
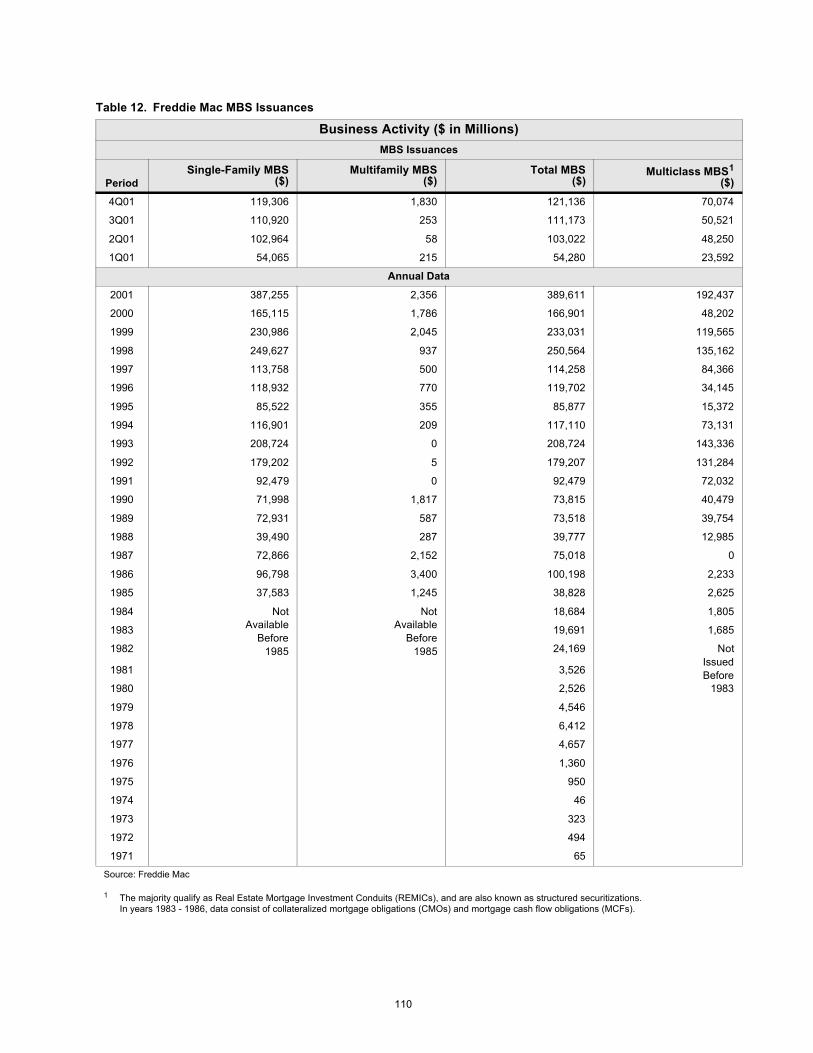
Table 12. Freddie Mac MBS Issuances
Business Activity ($ in Millions) MBS Issuances
Period Single-Family MBS
($) Multifamily MBS
($) Total MBS
($) Multiclass MBS1
($)
4Q01 119,306 1,830 121,136 70,074
3Q01 110,920 253 111,173 50,521
2Q01 102,964 58 103,022 48,250
1Q01 54,065 215 54,280 23,592
Annual Data
2001 387,255 2,356 389,611 192,437
2000 165,115 1,786 166,901 48,202
1999 230,986 2,045 233,031 119,565
1998 249,627 937 250,564 135,162
1997 113,758 500 114,258 84,366
1996 118,932 770 119,702 34,145
1995 85,522 355 85,877 15,372
1994 116,901 209 117,110 73,131
1993 208,724 0 208,724 143,336
1992 179,202 5 179,207 131,284
1991 92,479 0 92,479 72,032
1990 71,998 1,817 73,815 40,479
1989 72,931 587 73,518 39,754
1988 39,490 287 39,777 12,985
1987 72,866 2,152 75,018 0
1986 96,798 3,400 100,198 2,233
1985 37,583 1,245 38,828 2,625
1984 Not Available
Before 1985
Not Available
Before 1985
18,684 1,805
1983 19,691 1,685
1982 24,169 Not Issued Before
1983
1981 3,526
1980 2,526
1979 4,546
1978 6,412
1977 4,657
1976 1,360
1975 950
1974 46
1973 323
1972 494
1971 65
Source: Freddie Mac
1 The majority qualify as Real Estate Mortgage Investment Conduits (REMICs), and are also known as structured securitizations. In years 1983 - 1986, data consist of collateralized mortgage obligations (CMOs) and mortgage cash flow obligations (MCFs).
110

Table 13. Freddie Mac Earnings
Earnings ($ in Millions)
Period
Operating Net Interest
Income1, 2, 3
($)
Guarantee Fee
Income 2,3
($)
Average Guarantee
Fee 2,3
(basis points)
Administrative Expenses
($)
Credit-related Expenses4
($)
Operating Net Income 5
($)
4Q01 1,194 297 18.6 259 24 853
3Q01 1,015 287 18.5 201 18 813
2Q01 904 274 18.8 194 18 769
1Q01 819 272 19.0 190 24 719
Annual Data
2001 3,932 1,130 18.7 844 84 3,154
2000 3,270 1,057 19.3 713 106 2,547
1999 2,926 1,019 19.8 655 159 2,223
1998 2,215 1,019 21.4 578 342 1,700
1997 1,847 1,082 22.9 495 529 1,395
1996 1,705 1,086 23.4 440 608 1,243
1995 1,396 1,087 23.8 395 541 1,091
1994 1,112 1,108 24.4 379 425 983
1993 772 1,009 23.8 361 524 786
1992 695 936 24.7 329 457 622
1991 683 792 23.7 287 419 555
1990 619 654 22.4 243 474 414
1989 517 572 23.4 217 278 437
1988 492 465 21.5 194 219 381
1987 319 472 24.2 150 175 301
1986 299 301 22.4 110 120 247
1985 312 188 22.1 81 79 208
1984 213 158 24.7 71 54 144
1983 125 132 26.2 53 46 86
1982 30 77 24.5 37 26 60
1981 34 36 19.5 30 16 31
1980 54 23 14.3 26 23 34
1979 55 18 13.2 19 20 36
1978 37 14 14.9 14 13 25
1977 31 9 18.9 12 8 21
1976 18 3 13.6 10 (1) 14
1975 31 3 24.8 10 11 16
1974 42 2 25.5 8 33 5
1973 31 2 32.4 7 15 12
1972 10 1 39.4 5 4 4
1971 10 1 Not Available Before 1972
Not Available Before 1972
Not Available Before 1972
6
Source: Freddie Mac
1 Interest income net of interest expense, nominal basis, adjusted to remove FAS 133 effects starting in 2001. 2 Effective 1/1/96, Freddie Mac reports guarantee fees on retained MBS as guarantee fee income. However, in these data, fees on retained
MBS have been estimated and reclassified as interest income for comparability with Fannie Mae. 3 In 1993, Freddie Mac adopted a change in reporting of uncollectible interest on single-family mortgages. Pre-1993 amounts do not reflect this
change. 4 Credit-related expenses are mortgage loan loss provision plus real estate owned expense. From 1988 to 1990, data include real estate
owned disposition loss provisions instead of expense, and before 1988, only mortgage loan loss provision. 5 Net income adjusted to remove FAS 133 effects starting in 2001.
111
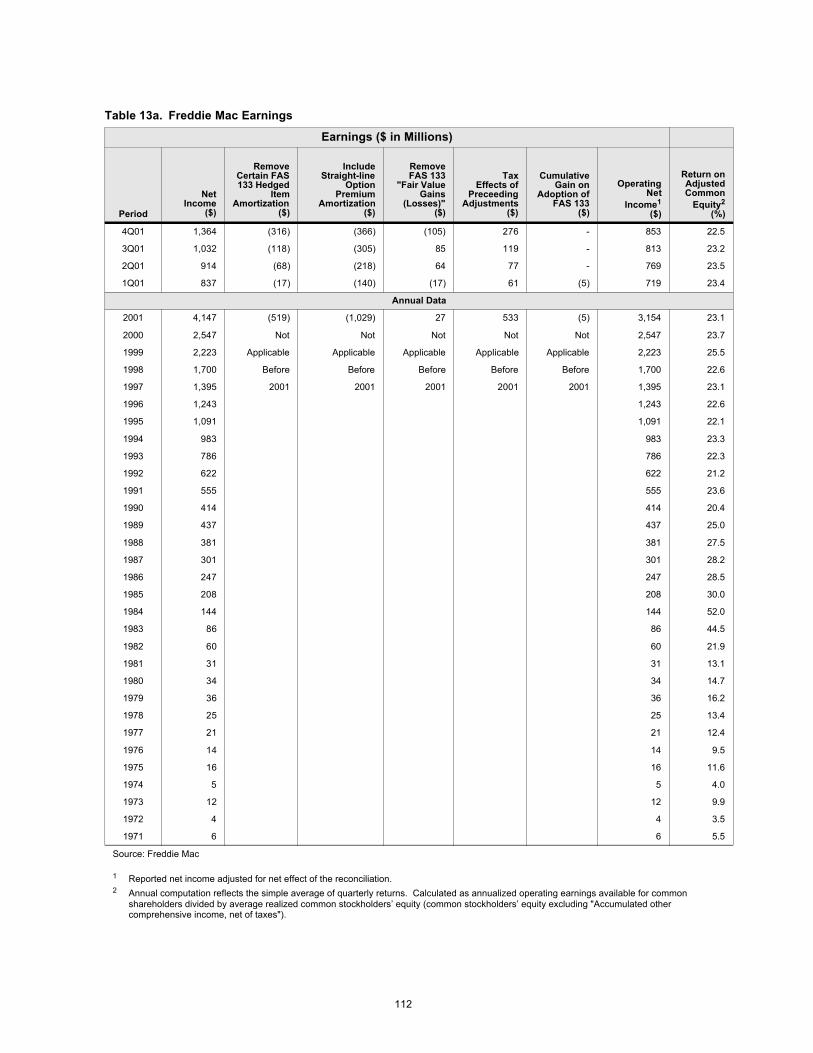
Table 13a. Freddie Mac Earnings
Earnings ($ in Millions)
Period
Net Income
($)
Remove Certain FAS 133 Hedged
Item Amortization
($)
Include Straight-line
Option Premium
Amortization ($)
Remove FAS 133
"Fair Value Gains
(Losses)" ($)
Tax Effects of
Preceeding Adjustments
($)
Cumulative Gain on
Adoption of FAS 133
($)
Operating Net
Income1
($)
Return on Adjusted Common
Equity2
(%)
4Q01 1,364 (316) (366) (105) 276 - 853 22.5
3Q01 1,032 (118) (305) 85 119 - 813 23.2
2Q01 914 (68) (218) 64 77 - 769 23.5
1Q01 837 (17) (140) (17) 61 (5) 719 23.4
Annual Data
2001 4,147 (519) (1,029) 27 533 (5) 3,154 23.1
2000 2,547 Not Not Not Not Not 2,547 23.7
1999 2,223 Applicable Applicable Applicable Applicable Applicable 2,223 25.5
1998 1,700 Before Before Before Before Before 1,700 22.6
1997 1,395 2001 2001 2001 2001 2001 1,395 23.1
1996 1,243 1,243 22.6
1995 1,091 1,091 22.1
1994 983 983 23.3
1993 786 786 22.3
1992 622 622 21.2
1991 555 555 23.6
1990 414 414 20.4
1989 437 437 25.0
1988 381 381 27.5
1987 301 301 28.2
1986 247 247 28.5
1985 208 208 30.0
1984 144 144 52.0
1983 86 86 44.5
1982 60 60 21.9
1981 31 31 13.1
1980 34 34 14.7
1979 36 36 16.2
1978 25 25 13.4
1977 21 21 12.4
1976 14 14 9.5
1975 16 16 11.6
1974 5 5 4.0
1973 12 12 9.9
1972 4 4 3.5
1971 6 6 5.5
Source: Freddie Mac
1 Reported net income adjusted for net effect of the reconciliation. 2 Annual computation reflects the simple average of quarterly returns. Calculated as annualized operating earnings available for common
shareholders divided by average realized common stockholders’ equity (common stockholders’ equity excluding "Accumulated othercomprehensive income, net of taxes").
112

Table 14. Freddie Mac Balance Sheet
Balance Sheet ($ in Millions)
Mortgage-Backed Securities Outstanding ($
in Millions)
End of Period
Total Assets
($)
Retained Mortgage Portfolio1
($)
Non-Mortgage Investments2
($)
Debt Outstanding
($)
Shareholders’ Equity3
($)
Core Capital4
($)
Total MBS Outstanding5
($)
Multiclass MBS Outstanding6
($)
4Q01 617,340 494,585 77,444 565,071 15,373 19,336 646,448 373,552
3Q01 571,907 475,214 61,344 534,434 14,506 17,743 635,844 350,932
2Q01 537,590 442,878 58,953 496,712 13,980 16,870 604,057 329,866
1Q01 497,839 422,085 45,745 461,338 12,821 15,770 572,328 312,246
Annual Data
2001 617,340 494,585 77,444 565,071 15,373 19,336 646,448 373,552
2000 459,297 385,451 43,521 426,899 14,837 14,380 576,101 309,185
1999 386,684 322,914 34,152 360,711 11,525 12,692 537,883 316,168
1998 321,421 255,670 42,160 287,396 10,835 10,715 478,351 260,504
1997 194,597 164,543 16,430 172,842 7,521 7,376 475,985 233,829
1996 173,866 137,826 22,248 156,981 6,731 6,743 473,065 237,939
1995 137,181 107,706 12,711 119,961 5,863 5,829 459,045 246,366
1994 106,199 73,171 17,808 93,279 5,162 5,169 460,656 264,152
1993 83,880 55,938 18,225 49,993 4,437 4,437 439,029 265,178
1992 59,502 33,629 12,542 29,631 3,570 Not Applicable
Before 1993
407,514 218,747
1991 46,860 26,667 9,956 30,262 2,566 359,163 146,978
1990 40,579 21,520 12,124 30,941 2,136 316,359 88,124
1989 35,462 21,448 11,050 26,147 1,916 272,870 52,865
1988 34,352 16,918 14,607 26,882 1,584 226,406 15,621
1987 25,674 12,354 10,467 19,547 1,182 212,635 3,652
1986 23,229 13,093 Not Available
Before 1987
15,375 953 169,186 5,333
1985 16,587 13,547 12,747 779 99,909 5,047
1984 13,778 10,018 10,999 606 70,026 3,214
1983 8,995 7,485 7,273 421 57,720 1,669
1982 5,999 4,679 4,991 296 42,952 Not Issued Before
1983
1981 6,326 5,178 5,680 250 19,897
1980 5,478 5,006 4,886 221 16,962
1979 4,648 4,003 4,131 238 15,316
1978 3,697 3,038 3,216 202 12,017
1977 3,501 3,204 3,110 177 6,765
1976 4,832 4,175 4,523 156 2,765
1975 5,899 4,878 5,609 142 1,643
1974 4,901 4,469 4,684 126 780
1973 2,873 2,521 2,696 121 791
1972 1,772 1,726 1,639 110 444
1971 1,038 935 915 107 64
Source: Freddie Mac
1 Gross retained portfolio net of unamortized purchase premium, discounts and deferred fees. 2 Excludes mortgage-related securities held for trading purposes. 3 GAAP basis. 4 The sum of common stock, noncumulative preferred stock, paid-in capital and retained earnings. 5 Total MBS outstanding net of repurchased MBS in retained portfolio. 6 The majority qualify as REMICs and are also known as structured securitizations. In years 1983 - 1999, data also include original issue CMOs and
MCFs, and structured securitizations and PCs with mandatory purchase obligations.
113

Table 15. Freddie Mac Retained Mortgage Portfolio Detail
($ in Millions)
End of Period
Whole Loans ($)
Freddie Mac Securities
($)
Other Mortgage-Related
Securities ($)
Total Retained Mortgage Portfolio
($)
4Q01 62,792 301,961 129,832 494,585
3Q01 59,639 291,646 123,929 475,214
2Q01 61,542 269,693 111,643 442,878
1Q01 60,111 261,288 100,686 422,085
Annual Data
2001 62,792 301,961 129,832 494,585
2000 59,240 246,209 80,002 385,451
1999 56,676 211,198 55,040 322,914
1998 57,084 168,108 30,478 255,670
1997 48,454 103,400 12,689 164,543
1996 46,504 81,195 11,127 137,826
1995 43,753 56,006 7,947 107,706
1994 Not Available
Before 1995
30,670 Not Available
Before 1995
73,171
1993 15,877 55,938
1992 6,394 33,629
1991 Not Available
Before 1992
26,667
1990 21,520
1989 21,448
1988 16,918
1987 12,354
1986 13,093
1985 13,547
1984 10,018
1983 7,485
1982 4,679
1981 5,178
1980 5,006
1979 4,003
1978 3,038
1977 3,204
1976 4,175
1975 4,878
1974 4,469
1973 2,521
1972 1,726
1971 935
Source: Freddie Mac
114

Table 16. Freddie Mac Financial Derivatives
Financial Derivatives - Notional Amount Outstanding ($ in Millions)
End of Period
Interest Rate
Swaps ($)
Interest Rate Caps,
Floors, and
Corridors ($)
Treasury- Based
Contracts ($)
Foreign Currency
($)
OTC Futures, Options, Forward
Rate Agreements
($)
Exchange- Traded
Futures, Options,
and Other Derivatives
($) Other
($) Total
($)
4Q01 442,769 12,178 13,468 23,995 187,487 369,695 2,802 1,052,394
3Q01 507,976 12,454 8,087 19,606 172,862 369,295 535 1,090,815
2Q01 373,516 12,517 5,986 19,293 151,675 124,471 5,239 692,697
1Q01 355,147 12,610 4,040 14,859 122,332 65,590 1,608 576,186
Annual Data
2001 442,769 12,178 13,468 23,995 187,487 369,695 2,802 1,052,394
2000 277,888 12,819 2,200 10,208 113,064 22,517 35,839 474,535
1999 126,580 19,936 8,894 1,097 172,750 94,987 0 424,244
1998 57,555 21,845 11,542 1,464 63,000 157,832 0 313,238
1997 54,172 21,995 12,228 1,152 6,000 0 0 95,547
1996 46,646 14,095 651 544 0 0 0 61,936
1995 45,384 13,055 24 0 0 0 0 58,463
1994 21,834 9,003 0 0 0 0 0 30,837
1993 17,888 1,500 0 0 0 0 0 19,388
Source: Freddie Mac
115

Table 17. Freddie Mac Non-Mortgage Investments
Non-Mortgage Investments1 ($ in Millions)
End of Period
Federal Funds and Eurodollars
($)
Asset Backed Securities
($)
Repurchase Agreements
($)
Commercial Paper and
Corporate Debt ($)
Other ($)
Total ($)
4Q01 15,846 26,253 5,531 21,424 8,390 77,444
3Q01 12,930 25,966 4,918 13,840 3,690 61,344
2Q01 6,421 24,107 6,173 14,365 7,887 58,953
1Q01 6,150 21,373 6,204 9,545 2,473 45,745
Annual Data
2001 15,846 26,253 5,531 21,424 8,390 77,444
2000 2,267 19,063 7,488 7,302 7,401 43,521
1999 10,545 10,305 4,961 3,916 4,425 34,152
1998 20,524 7,124 1,756 7,795 4,961 42,160
1997 2,750 2,200 6,982 3,203 1,295 16,430
1996 9,968 2,086 6,440 1,058 2,696 22,248
1995 110 499 9,217 1,201 1,684 12,711
1994 7,260 0 5,913 1,234 3,401 17,808
1993 9,267 0 4,198 1,438 3,322 18,225
1992 5,632 0 4,060 53 2,797 12,542
1991 2,949 0 4,437 0 2,570 9,956
1990 1,112 0 9,063 0 1,949 12,124
1989 3,527 0 5,765 0 1,758 11,050
1988 4,469 0 9,107 0 1,031 14,607
1987 3,177 0 5,859 0 1,431 10,467
Source: Freddie Mac
Excludes mortgage-related securities held for trading purposes.
116
1

Table 18. Freddie Mac Asset Mix
Asset Ratios
End of Period
Total Retained Mortgage Portfolio /
Total Assets (%)
Non-Mortgage Investments / Total Assets
(%)
4Q01 80.1 12.5
3Q01 83.1 10.7
2Q01 82.4 11.0
1Q01 84.8 9.2
Annual Data
2001 80.1 12.5
2000 83.9 9.5
1999 83.5 8.8
1998 79.5 13.1
1997 84.6 8.4
1996 79.3 12.8
1995 78.5 9.3
1994 68.9 16.8
1993 66.7 21.7
1992 56.5 21.1
1991 56.9 21.2
1990 53.0 29.9
1989 60.5 31.2
1988 49.2 42.5
1987 48.1 40.8
1986 56.4 Not Available
Before 1987
1985 81.7
1984 72.7
1983 83.2
1982 78.0
1981 81.9
1980 91.4
1979 86.1
1978 82.2
1977 91.4
1976 86.1
1975 82.2
1974 91.5
1973 87.7
1972 97.4
1971 90.1
Source: Freddie Mac
117

Table 19. Freddie Mac Mortgage Asset Quality
Mortgage Asset Quality
End of Period
Single-Family Delinquency
Rate1
(%)
Multifamily Delinquency
Rate2,3
(%)
Credit Losses / Total MBS Outstanding plus
Retained Portfolio4
(%)
REO / Total MBS Outstanding plus
Retained Portfolio5
(%)
Credit-Enhanced Outstanding / Total MBS
Outstanding plus Retained Portfolio6
(%)
4Q01 0.41 0.15 0.01 0.04 29.3
3Q01 0.38 0.03 0.01 0.03 30.4
2Q01 0.36 0.02 0.01 0.03 32.3
1Q01 0.36 0.05 0.01 0.04 32.6
Annual Data
2001 0.41 0.15 0.01 0.04 29.3
2000 0.37 0.04 0.01 0.04 31.8
1999 0.39 0.14 0.02 0.05 29.9
1998 0.50 0.37 0.04 0.08 27.3
1997 0.55 0.96 0.08 0.11 15.9
1996 0.58 1.96 0.10 0.13 10.0
1995 0.60 2.88 0.11 0.14 9.7
1994 0.55 3.79 0.08 0.18 7.2
1993 0.61 5.92 0.11 0.16 5.3
1992 0.64 6.81 0.09 0.12 Not Available
Before 1993
1991 0.61 5.42 0.08 0.14
1990 0.45 2.63 0.08 0.12
1989 0.38 2.53 0.08 0.09
1988 0.36 2.24 0.07 0.09
1987 0.36 1.49 0.07 0.08
1986 0.42 1.07 Not Available
Before 1987
0.07
1985 0.42 0.63 0.10
1984 0.46 0.42 0.15
1983 0.47 0.58 0.15
1982 0.54 1.04 0.12
1981 0.61 Not Available
Before 1982
0.07
1980 0.44 0.04
1979 0.31 0.02
1978 0.21 0.02
1977 Not Available
Before 1978
0.03
1976 0.04
1975 0.03
1974 0.02
Source: Freddie Mac
1 Based on number of mortgages 90 days or more delinquent. 1994 - 2001 data include only loans for which Freddie Mac has assumed primarydefault risk (“at-risk”); includes foreclosures and in process. Excludes loans for which the lender or a third party has retained primary default risk bypledging collateral or agreeing to accept losses on loans that default and securities guaranteed by agencies or subject to subordination agreements. Pre-1994 calculations include both at-risk and non-at-risk loans.
2 1982 - 1987 data based on the number of loans delinquent 60 days or more; calculations subsequent to 1987 based on unpaid principal balance ofloans 60 days or more.
3 Pre-1991 amounts do not reflect change in reporting of multifamily in-substance foreclosures pursuant to adoption of SFAS 114. 4 Credit losses equal to charge-offs plus REO operations expense. Average balances used to calculate ratios subsequent to 1994; quarterly data are
annualized. 5 Beginning with 1992, data reflect adoption of SFAS 114. 6 Includes loans for which the lender or third-party has retained primary default risk by pledging collateral or agreeing to accept losses on loans that
default. Also includes securities guaranteed by agencies or subject to subordination agreements. In some cases, the lender’s or third party’s risk is limited to a specific level of losses at the time the credit enhancement becomes effective.
118

Table 20. Freddie Mac Capital
Capital ($ in Millions)
End of Period
Core Capital
($)
Regulatory Minimum
Capital Requirement1
($)
Regulatory Capital
Surplus (Deficit)2
($)
Market Capitalization3
($)
Core Capital / Total Assets
(%)
Core Capital / Total MBS
Outstanding plus Total
Assets (%)
Common Share
Dividend Payout
Rate4
(%)
4Q01 19,336 18,515 821 45,462 3.13 1.53 17.5
3Q01 17,743 17,335 408 45,179 3.10 1.47 18.4
2Q01 16,870 16,303 567 47,221 3.10 1.48 19.4
1Q01 15,770 15,164 606 44,963 3.17 1.47 20.6
Annual Data
2001 19,336 18,515 821 45,462 3.13 1.53 19.0
2000 14,380 14,178 202 47,702 3.13 1.39 20.0
1999 12,692 12,287 405 32,713 3.28 1.37 20.1
1998 10,715 10,333 382 44,797 3.33 1.34 20.7
1997 7,376 7,082 294 28,461 3.79 1.10 21.0
1996 6,743 6,517 226 19,161 3.88 1.04 21.3
1995 5,829 5,584 245 14,932 4.25 0.98 21.1
1994 5,169 4,884 285 9,132 4.87 0.91 20.5
1993 4,437 3,782 655 9,005 5.29 0.85 21.6
1992 Not Applicable
Before 1993
Not Applicable
Before 1993
Not Applicable
Before 1993
8,721 Not Applicable
Before 1993
Not Applicable
Before 1993
23.1
1991 8,247 21.6
1990 2,925 23.2
1989 4,024 24.3
Not Applicable
Before 1989
Not Available
Before 1989
Source: Freddie Mac and OFHEO
1 Minimum capital requirement in accordance with the Federal Housing Enterprises Financial Safety and Soundness Act of 1992. 2 The difference between Core Capital and Minimum Regulatory Capital Requirement. 3 Stock price multiplied by number of outstanding common shares. 4 Common dividends paid as a percentage of operating net income available to common shareholders.
Annual computations reflect the simple average of quarterly ratios. Quarterly ratios are computed as dividends paid by operating net income availableto common stockholders.
119
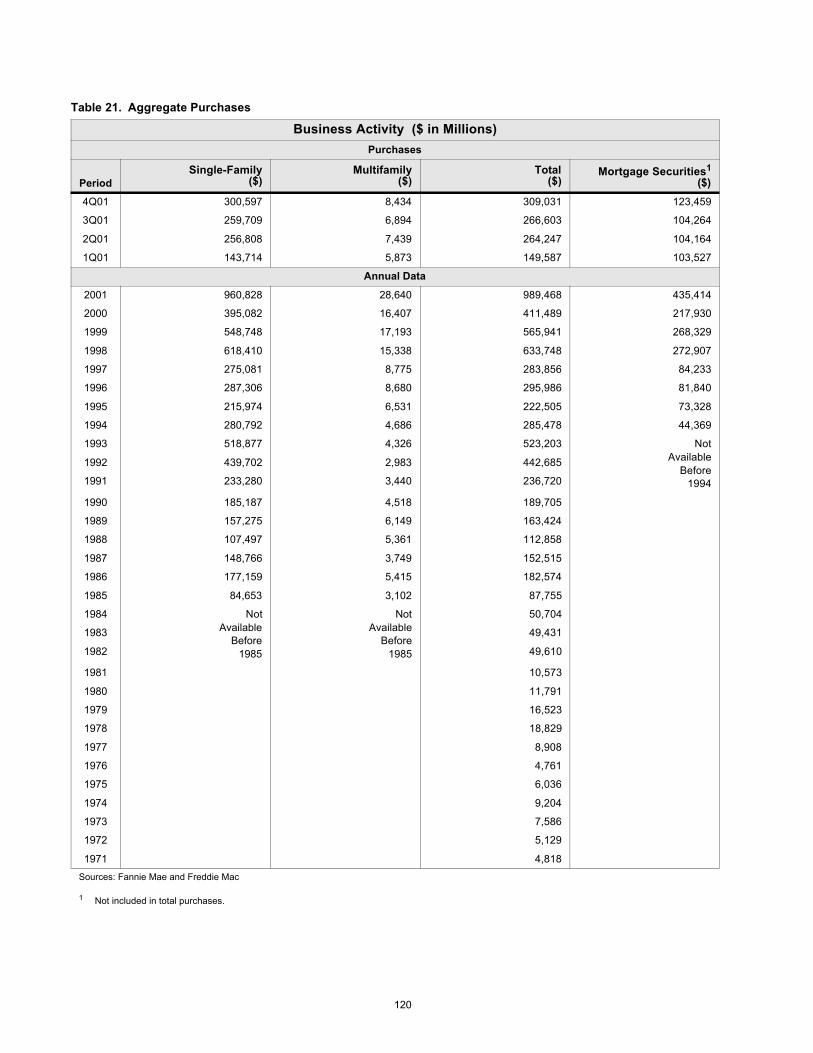
Table 21. Aggregate Purchases
Business Activity ($ in Millions) Purchases
Period Single-Family
($) Multifamily
($) Total
($) Mortgage Securities1
($)
4Q01 300,597 8,434 309,031 123,459
3Q01 259,709 6,894 266,603 104,264
2Q01 256,808 7,439 264,247 104,164
1Q01 143,714 5,873 149,587 103,527
Annual Data
2001 960,828 28,640 989,468 435,414
2000 395,082 16,407 411,489 217,930
1999 548,748 17,193 565,941 268,329
1998 618,410 15,338 633,748 272,907
1997 275,081 8,775 283,856 84,233
1996 287,306 8,680 295,986 81,840
1995 215,974 6,531 222,505 73,328
1994 280,792 4,686 285,478 44,369
1993 518,877 4,326 523,203 Not Available
Before 1994
1992 439,702 2,983 442,685
1991 233,280 3,440 236,720
1990 185,187 4,518 189,705
1989 157,275 6,149 163,424
1988 107,497 5,361 112,858
1987 148,766 3,749 152,515
1986 177,159 5,415 182,574
1985 84,653 3,102 87,755
1984 Not Available
Before 1985
Not Available
Before 1985
50,704
1983 49,431
1982 49,610
1981 10,573
1980 11,791
1979 16,523
1978 18,829
1977 8,908
1976 4,761
1975 6,036
1974 9,204
1973 7,586
1972 5,129
1971 4,818
Sources: Fannie Mae and Freddie Mac
1 Not included in total purchases.
120

Table 22. Aggregate MBS Issuances
Business Activity ($ in Millions) MBS Issuances
Period Single-Family MBS
($) Multifamily MBS
($) Total MBS
($) Multiclass MBS
($)
4Q01 278,693 4,785 283,478 151,625
3Q01 246,884 3,705 250,589 76,870
2Q01 241,947 4,434 246,381 66,441
1Q01 134,352 3,233 137,585 36,904
Annual Data
2001 901,876 16,157 918,033 331,840
2000 369,181 9,382 378,563 87,746
1999 523,178 10,542 533,720 174,725
1998 564,747 11,965 576,712 219,309
1997 257,373 6,314 263,687 169,781
1996 263,133 6,438 269,571 64,925
1995 191,791 4,542 196,333 25,053
1994 245,286 2,446 247,732 146,496
1993 429,209 959 430,168 353,966
1992 372,389 855 373,244 301,489
1991 203,967 1,415 205,382 184,840
1990 168,004 2,506 170,510 108,770
1989 139,420 3,862 143,282 81,469
1988 90,610 4,045 94,655 29,990
1987 134,933 3,314 138,247 9,917
1986 156,815 3,949 160,764 4,633
1985 60,725 1,752 62,477 2,625
1984 Not Available
Before 1985
Not Available
Before 1985
32,230 1,805
1983 33,031 1,685
1982 38,139 Not Issued Before
1983
1981 4,243
1980 2,526
1979 4,546
1978 6,412
1977 4,657
1976 1,360
1975 950
1974 46
1973 323
1972 494
1971 65
Sources: Fannie Mae and Freddie Mac
121
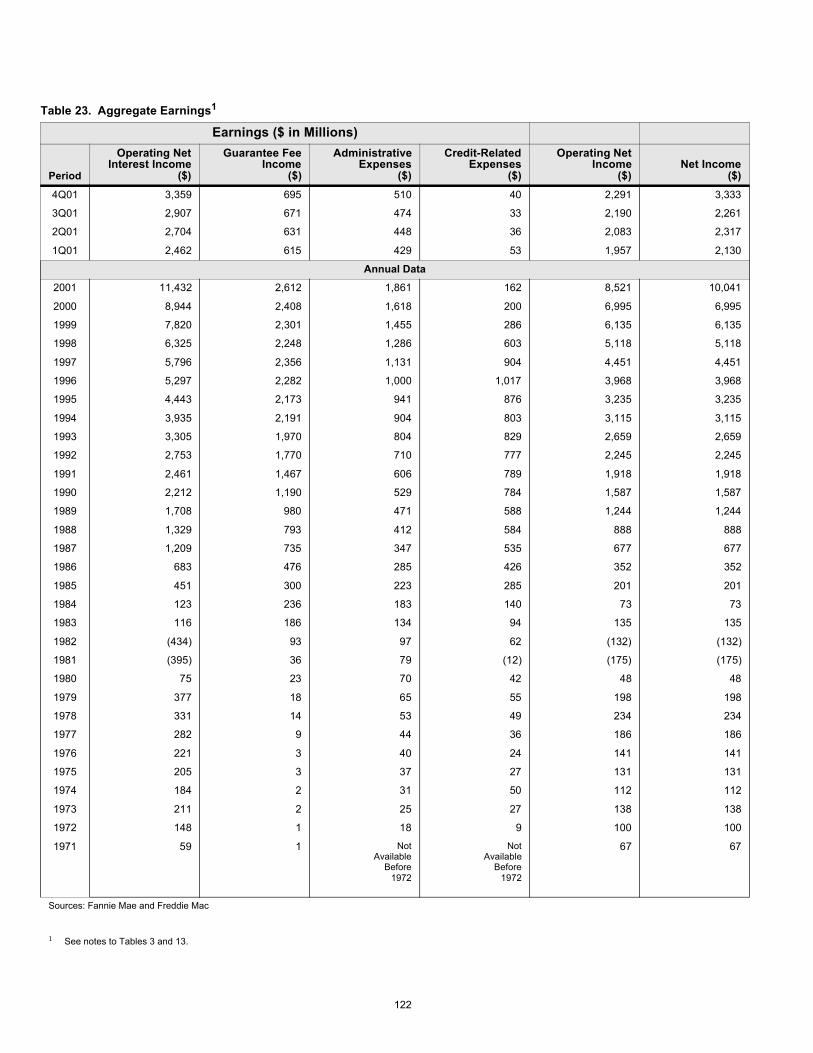
Table 23. Aggregate Earnings1
Earnings ($ in Millions)
Period
Operating Net Interest Income
($)
Guarantee Fee Income
($)
Administrative Expenses
($)
Credit-Related Expenses
($)
Operating Net Income
($) Net Income
($)
4Q01 3,359 695 510 40 2,291 3,333
3Q01 2,907 671 474 33 2,190 2,261
2Q01 2,704 631 448 36 2,083 2,317
1Q01 2,462 615 429 53 1,957 2,130
Annual Data
2001 11,432 2,612 1,861 162 8,521 10,041
2000 8,944 2,408 1,618 200 6,995 6,995
1999 7,820 2,301 1,455 286 6,135 6,135
1998 6,325 2,248 1,286 603 5,118 5,118
1997 5,796 2,356 1,131 904 4,451 4,451
1996 5,297 2,282 1,000 1,017 3,968 3,968
1995 4,443 2,173 941 876 3,235 3,235
1994 3,935 2,191 904 803 3,115 3,115
1993 3,305 1,970 804 829 2,659 2,659
1992 2,753 1,770 710 777 2,245 2,245
1991 2,461 1,467 606 789 1,918 1,918
1990 2,212 1,190 529 784 1,587 1,587
1989 1,708 980 471 588 1,244 1,244
1988 1,329 793 412 584 888 888
1987 1,209 735 347 535 677 677
1986 683 476 285 426 352 352
1985 451 300 223 285 201 201
1984 123 236 183 140 73 73
1983 116 186 134 94 135 135
1982 (434) 93 97 62 (132) (132)
1981 (395) 36 79 (12) (175) (175)
1980 75 23 70 42 48 48
1979 377 18 65 55 198 198
1978 331 14 53 49 234 234
1977 282 9 44 36 186 186
1976 221 3 40 24 141 141
1975 205 3 37 27 131 131
1974 184 2 31 50 112 112
1973 211 2 25 27 138 138
1972 148 1 18 9 100 100
1971 59 1 Not Available
Before 1972
Not Available
Before 1972
67 67
Sources: Fannie Mae and Freddie Mac
1 See notes to Tables 3 and 13.
122
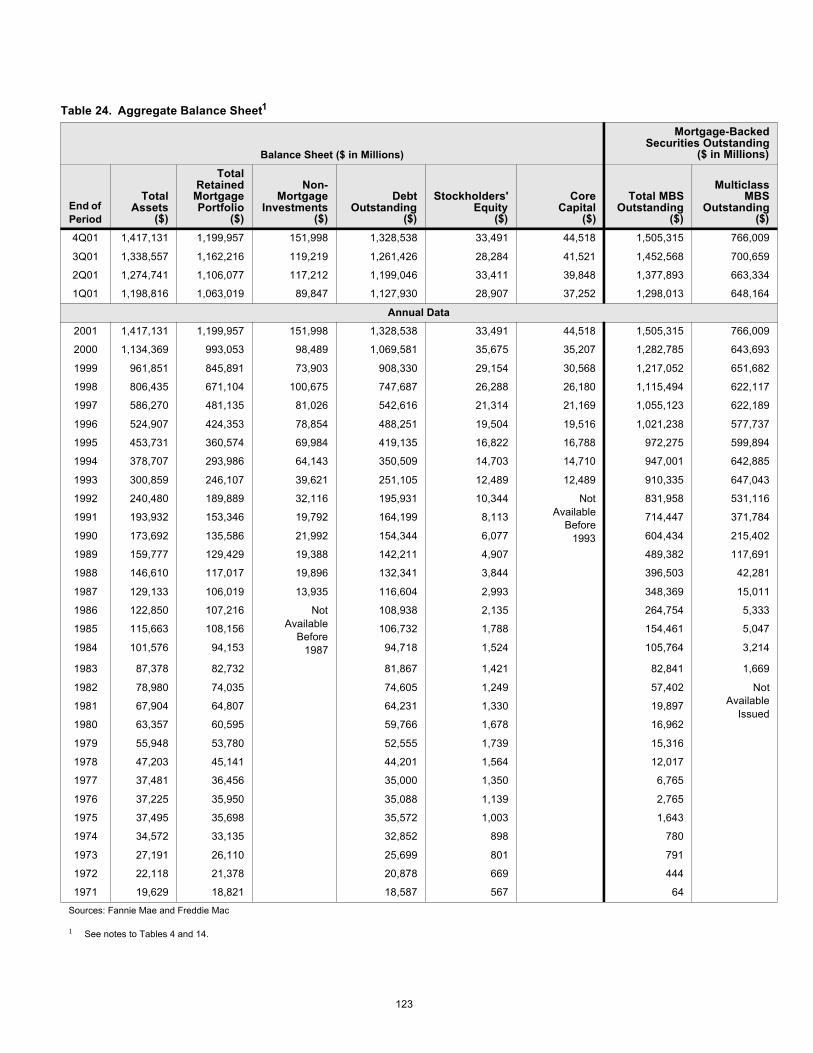
Table 24. Aggregate Balance Sheet1
Balance Sheet ($ in Millions)
Mortgage-Backed Securities Outstanding
($ in Millions)
End of Period
Total Assets
($)
Total Retained
Mortgage Portfolio
($)
Non- Mortgage
Investments ($)
Debt Outstanding
($)
Stockholders' Equity
($)
Core Capital
($)
Total MBS Outstanding
($)
Multiclass MBS
Outstanding ($)
4Q01 1,417,131 1,199,957 151,998 1,328,538 33,491 44,518 1,505,315 766,009
3Q01 1,338,557 1,162,216 119,219 1,261,426 28,284 41,521 1,452,568 700,659
2Q01 1,274,741 1,106,077 117,212 1,199,046 33,411 39,848 1,377,893 663,334
1Q01 1,198,816 1,063,019 89,847 1,127,930 28,907 37,252 1,298,013 648,164
Annual Data
2001 1,417,131 1,199,957 151,998 1,328,538 33,491 44,518 1,505,315 766,009
2000 1,134,369 993,053 98,489 1,069,581 35,675 35,207 1,282,785 643,693
1999 961,851 845,891 73,903 908,330 29,154 30,568 1,217,052 651,682
1998 806,435 671,104 100,675 747,687 26,288 26,180 1,115,494 622,117
1997 586,270 481,135 81,026 542,616 21,314 21,169 1,055,123 622,189
1996 524,907 424,353 78,854 488,251 19,504 19,516 1,021,238 577,737
1995 453,731 360,574 69,984 419,135 16,822 16,788 972,275 599,894
1994 378,707 293,986 64,143 350,509 14,703 14,710 947,001 642,885
1993 300,859 246,107 39,621 251,105 12,489 12,489 910,335 647,043
1992 240,480 189,889 32,116 195,931 10,344 Not Available
Before 1993
831,958 531,116
1991 193,932 153,346 19,792 164,199 8,113 714,447 371,784
1990 173,692 135,586 21,992 154,344 6,077 604,434 215,402
1989 159,777 129,429 19,388 142,211 4,907 489,382 117,691
1988 146,610 117,017 19,896 132,341 3,844 396,503 42,281
1987 129,133 106,019 13,935 116,604 2,993 348,369 15,011
1986 122,850 107,216 Not Available
Before 1987
108,938 2,135 264,754 5,333
1985 115,663 108,156 106,732 1,788 154,461 5,047
1984 101,576 94,153 94,718 1,524 105,764 3,214
1983 87,378 82,732 81,867 1,421 82,841 1,669
1982 78,980 74,035 74,605 1,249 57,402 Not Available
Issued1981 67,904 64,807 64,231 1,330 19,897
1980 63,357 60,595 59,766 1,678 16,962
1979 55,948 53,780 52,555 1,739 15,316
1978 47,203 45,141 44,201 1,564 12,017
1977 37,481 36,456 35,000 1,350 6,765
1976 37,225 35,950 35,088 1,139 2,765
1975 37,495 35,698 35,572 1,003 1,643
1974 34,572 33,135 32,852 898 780
1973 27,191 26,110 25,699 801 791
1972 22,118 21,378 20,878 669 444
1971 19,629 18,821 18,587 567 64
Sources: Fannie Mae and Freddie Mac
1 See notes to Tables 4 and 14.
123
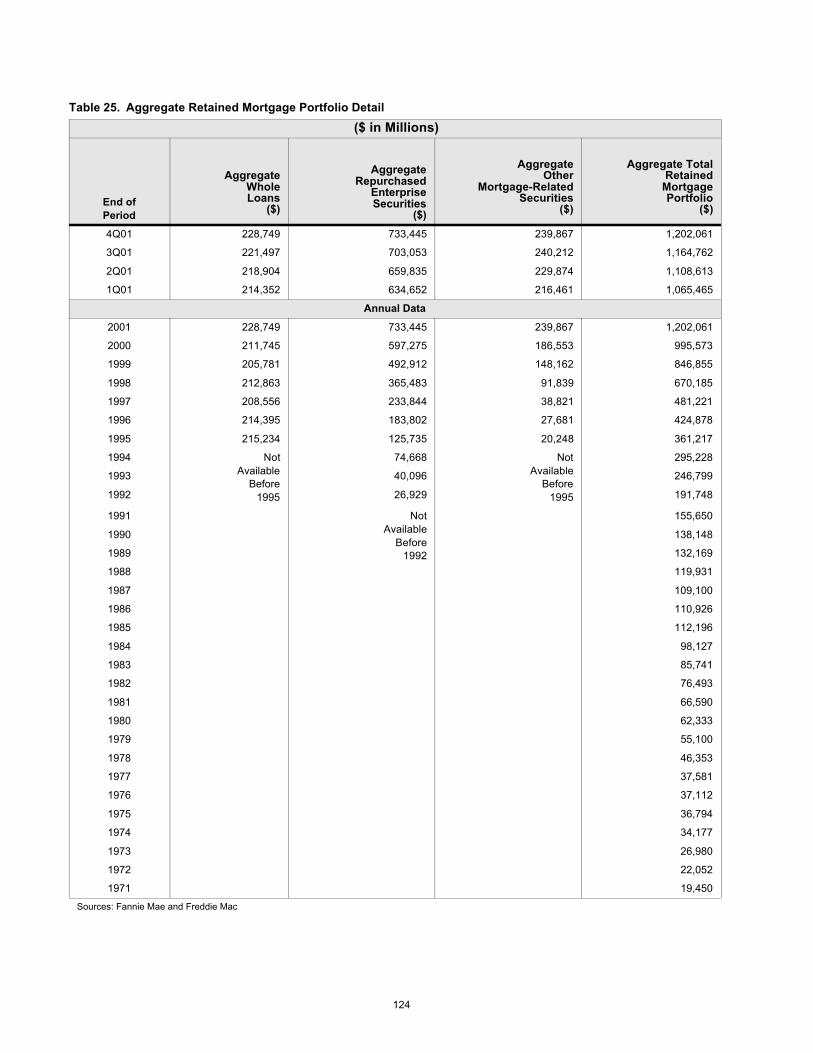
Table 25. Aggregate Retained Mortgage Portfolio Detail
($ in Millions)
End of Period
Aggregate Whole Loans
($)
Aggregate Repurchased
Enterprise Securities
($)
Aggregate Other
Mortgage-Related Securities
($)
Aggregate Total Retained
Mortgage Portfolio
($)
4Q01 228,749 733,445 239,867 1,202,061
3Q01 221,497 703,053 240,212 1,164,762
2Q01 218,904 659,835 229,874 1,108,613
1Q01 214,352 634,652 216,461 1,065,465
Annual Data
2001 228,749 733,445 239,867 1,202,061
2000 211,745 597,275 186,553 995,573
1999 205,781 492,912 148,162 846,855
1998 212,863 365,483 91,839 670,185
1997 208,556 233,844 38,821 481,221
1996 214,395 183,802 27,681 424,878
1995 215,234 125,735 20,248 361,217
1994 Not Available
Before 1995
74,668 Not Available
Before 1995
295,228
1993 40,096 246,799
1992 26,929 191,748
1991 Not Available
Before 1992
155,650
1990 138,148
1989 132,169
1988 119,931
1987 109,100
1986 110,926
1985 112,196
1984 98,127
1983 85,741
1982 76,493
1981 66,590
1980 62,333
1979 55,100
1978 46,353
1977 37,581
1976 37,112
1975 36,794
1974 34,177
1973 26,980
1972 22,052
1971 19,450
Sources: Fannie Mae and Freddie Mac
124
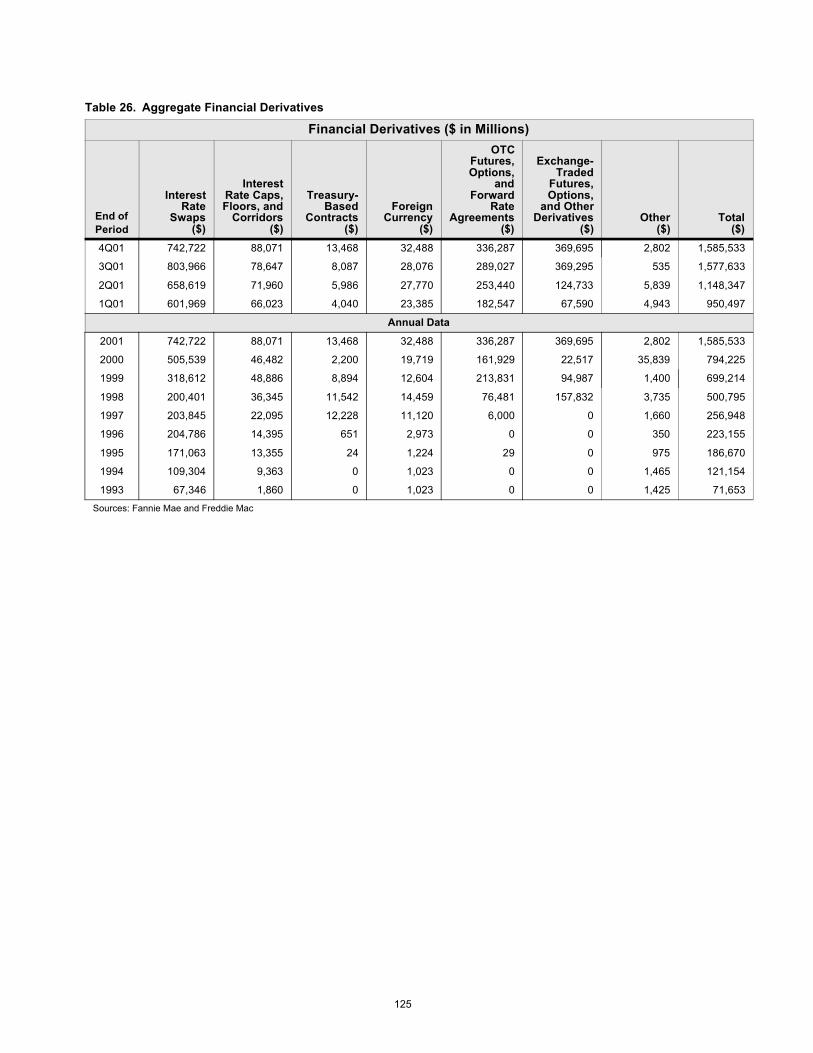
Table 26. Aggregate Financial Derivatives
Financial Derivatives ($ in Millions)
End of Period
Interest Rate
Swaps ($)
Interest Rate Caps, Floors, and
Corridors ($)
Treasury- Based
Contracts ($)
Foreign Currency
($)
OTC Futures, Options,
and Forward
Rate Agreements
($)
Exchange- Traded
Futures, Options,
and Other Derivatives
($) Other
($) Total
($)
4Q01 742,722 88,071 13,468 32,488 336,287 369,695 2,802 1,585,533
3Q01 803,966 78,647 8,087 28,076 289,027 369,295 535 1,577,633
2Q01 658,619 71,960 5,986 27,770 253,440 124,733 5,839 1,148,347
1Q01 601,969 66,023 4,040 23,385 182,547 67,590 4,943 950,497
Annual Data
2001 742,722 88,071 13,468 32,488 336,287 369,695 2,802 1,585,533
2000 505,539 46,482 2,200 19,719 161,929 22,517 35,839 794,225
1999 318,612 48,886 8,894 12,604 213,831 94,987 1,400 699,214
1998 200,401 36,345 11,542 14,459 76,481 157,832 3,735 500,795
1997 203,845 22,095 12,228 11,120 6,000 0 1,660 256,948
1996 204,786 14,395 651 2,973 0 0 350 223,155
1995 171,063 13,355 24 1,224 29 0 975 186,670
1994 109,304 9,363 0 1,023 0 0 1,465 121,154
1993 67,346 1,860 0 1,023 0 0 1,425 71,653
Sources: Fannie Mae and Freddie Mac
125
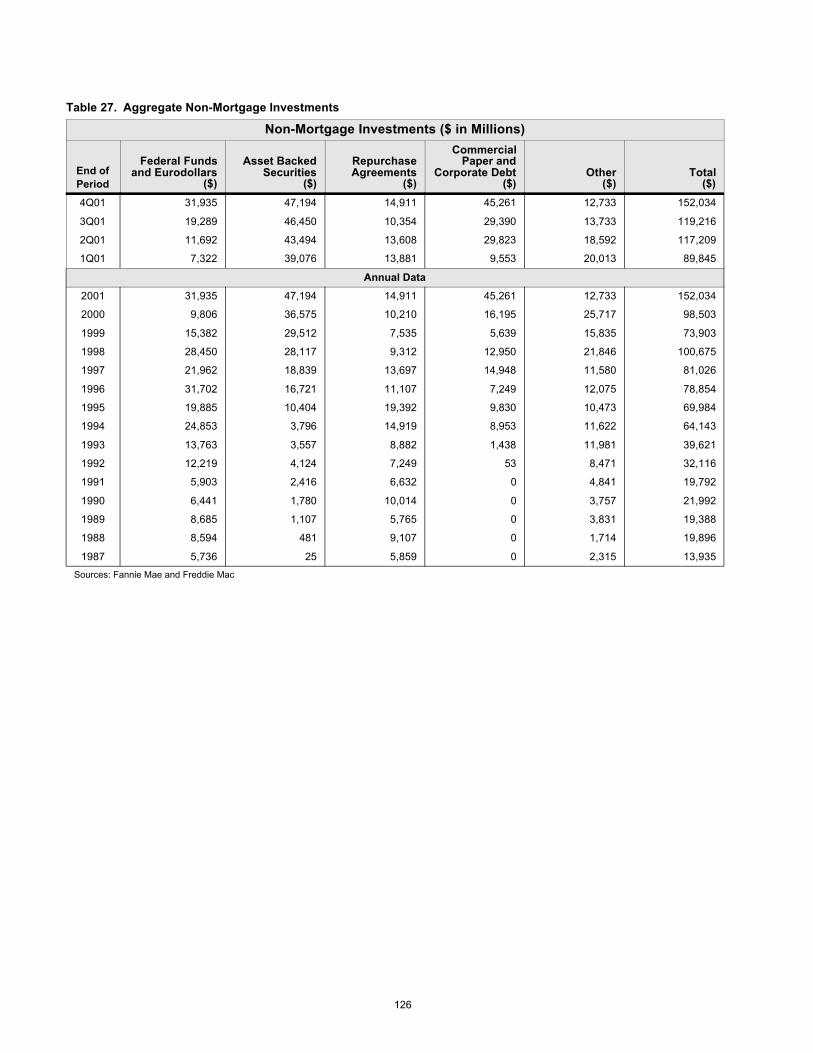
Table 27. Aggregate Non-Mortgage Investments
Non-Mortgage Investments ($ in Millions)
End of Period
Federal Funds and Eurodollars
($)
Asset Backed Securities
($)
Repurchase Agreements
($)
Commercial Paper and
Corporate Debt ($)
Other ($)
Total ($)
4Q01 31,935 47,194 14,911 45,261 12,733 152,034
3Q01 19,289 46,450 10,354 29,390 13,733 119,216
2Q01 11,692 43,494 13,608 29,823 18,592 117,209
1Q01 7,322 39,076 13,881 9,553 20,013 89,845
Annual Data
2001 31,935 47,194 14,911 45,261 12,733 152,034
2000 9,806 36,575 10,210 16,195 25,717 98,503
1999 15,382 29,512 7,535 5,639 15,835 73,903
1998 28,450 28,117 9,312 12,950 21,846 100,675
1997 21,962 18,839 13,697 14,948 11,580 81,026
1996 31,702 16,721 11,107 7,249 12,075 78,854
1995 19,885 10,404 19,392 9,830 10,473 69,984
1994 24,853 3,796 14,919 8,953 11,622 64,143
1993 13,763 3,557 8,882 1,438 11,981 39,621
1992 12,219 4,124 7,249 53 8,471 32,116
1991 5,903 2,416 6,632 0 4,841 19,792
1990 6,441 1,780 10,014 0 3,757 21,992
1989 8,685 1,107 5,765 0 3,831 19,388
1988 8,594 481 9,107 0 1,714 19,896
1987 5,736 25 5,859 0 2,315 13,935
Sources: Fannie Mae and Freddie Mac
126

Table 28. Aggregate Capital
Capital ($ in Millions)
End of Period
Core Capital
($)
Minimum Regulatory
Capital Requirements
($)
Regulatory Capital
Surplus (Deficit)
($)
Market Capitalization
($)
4Q01 44,518 42,697 18,21 124,743
3Q01 41,521 40,465 1,056 125,234
2Q01 39,848 38,480 1,368 132,460
1Q01 37,252 36,197 1,054 124,591
Annual Data
2001 44,518 42,697 1,821 124,743
2000 35,207 34,472 735 134,345
1999 30,568 30,057 511 96,364
1998 26,180 25,667 513 120,678
1997 21,169 19,785 1,384 87,628
1996 19,516 17,983 1,533 59,093
1995 16,788 16,035 753 48,744
1994 14,710 14,300 411 29,014
1993 12,489 11,658 831 30,392
1992 Not Applicable
Before 1993
Not Applicable
Before 1993
Not Applicable
Before 1993
29,595
1991 27,083
1990 11,415
1989 12,116
1988 3,992
1987 2,401
1986 3,006
1985 1,904
1984 1,012
1983 1,514
1982 1,603
1981 502
1980 702
Sources: Fannie Mae, Freddie Mac, and OFHEO
127
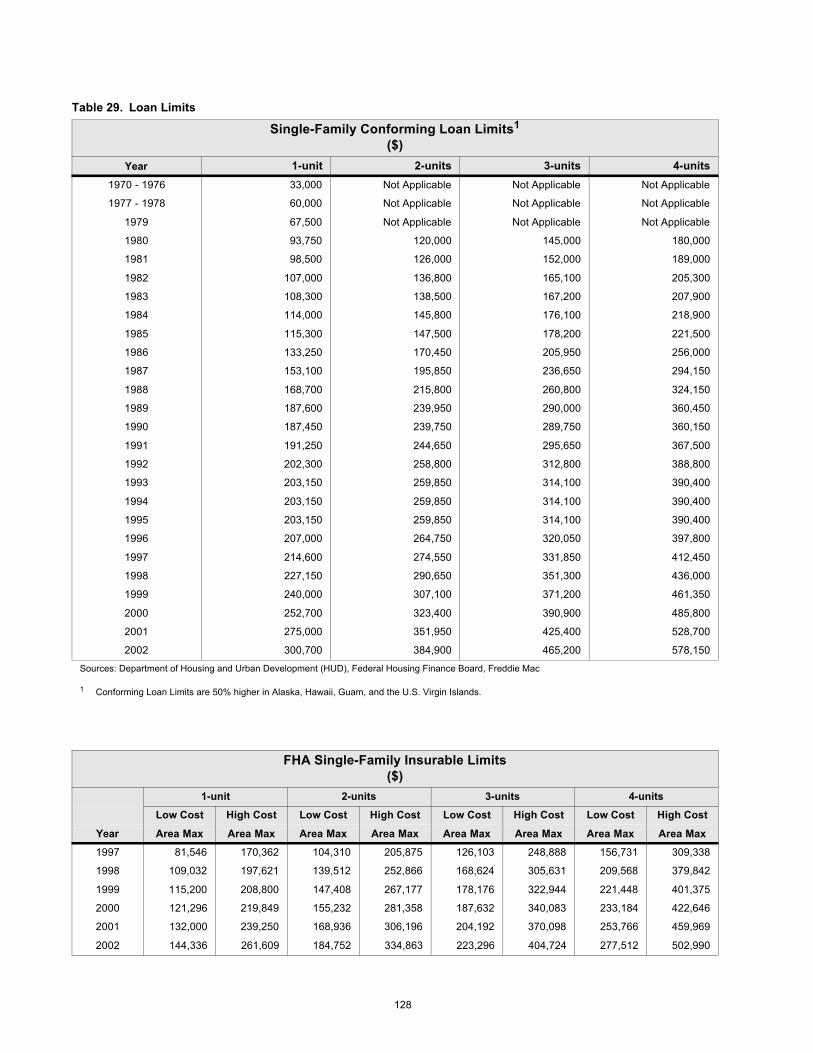
Table 29. Loan Limits
Single-Family Conforming Loan Limits1 ($)
Year 1-unit 2-units 3-units 4-units
1970 - 1976 33,000 Not Applicable Not Applicable Not Applicable
1977 - 1978 60,000 Not Applicable Not Applicable Not Applicable
1979 67,500 Not Applicable Not Applicable Not Applicable
1980 93,750 120,000 145,000 180,000
1981 98,500 126,000 152,000 189,000
1982 107,000 136,800 165,100 205,300
1983 108,300 138,500 167,200 207,900
1984 114,000 145,800 176,100 218,900
1985 115,300 147,500 178,200 221,500
1986 133,250 170,450 205,950 256,000
1987 153,100 195,850 236,650 294,150
1988 168,700 215,800 260,800 324,150
1989 187,600 239,950 290,000 360,450
1990 187,450 239,750 289,750 360,150
1991 191,250 244,650 295,650 367,500
1992 202,300 258,800 312,800 388,800
1993 203,150 259,850 314,100 390,400
1994 203,150 259,850 314,100 390,400
1995 203,150 259,850 314,100 390,400
1996 207,000 264,750 320,050 397,800
1997 214,600 274,550 331,850 412,450
1998 227,150 290,650 351,300 436,000
1999 240,000 307,100 371,200 461,350
2000 252,700 323,400 390,900 485,800
2001 275,000 351,950 425,400 528,700
2002 300,700 384,900 465,200 578,150
Sources: Department of Housing and Urban Development (HUD), Federal Housing Finance Board, Freddie Mac
Conforming Loan Limits are 50% higher in Alaska, Hawaii, Guam, and the U.S. Virgin Islands.
FHA Single-Family Insurable Limits ($)
1-unit 2-units 3-units 4-units
Low Cost High Cost Low Cost High Cost Low Cost High Cost Low Cost High Cost
Year Area Max Area Max Area Max Area Max Area Max Area Max Area Max Area Max
1997 81,546 170,362 104,310 205,875 126,103 248,888 156,731 309,338
1998 109,032 197,621 139,512 252,866 168,624 305,631 209,568 379,842
1999 115,200 208,800 147,408 267,177 178,176 322,944 221,448 401,375
2000 121,296 219,849 155,232 281,358 187,632 340,083 233,184 422,646
2001 132,000 239,250 168,936 306,196 204,192 370,098 253,766 459,969
2002 144,336 261,609 184,752 334,863 223,296 404,724 277,512 502,990
128
1
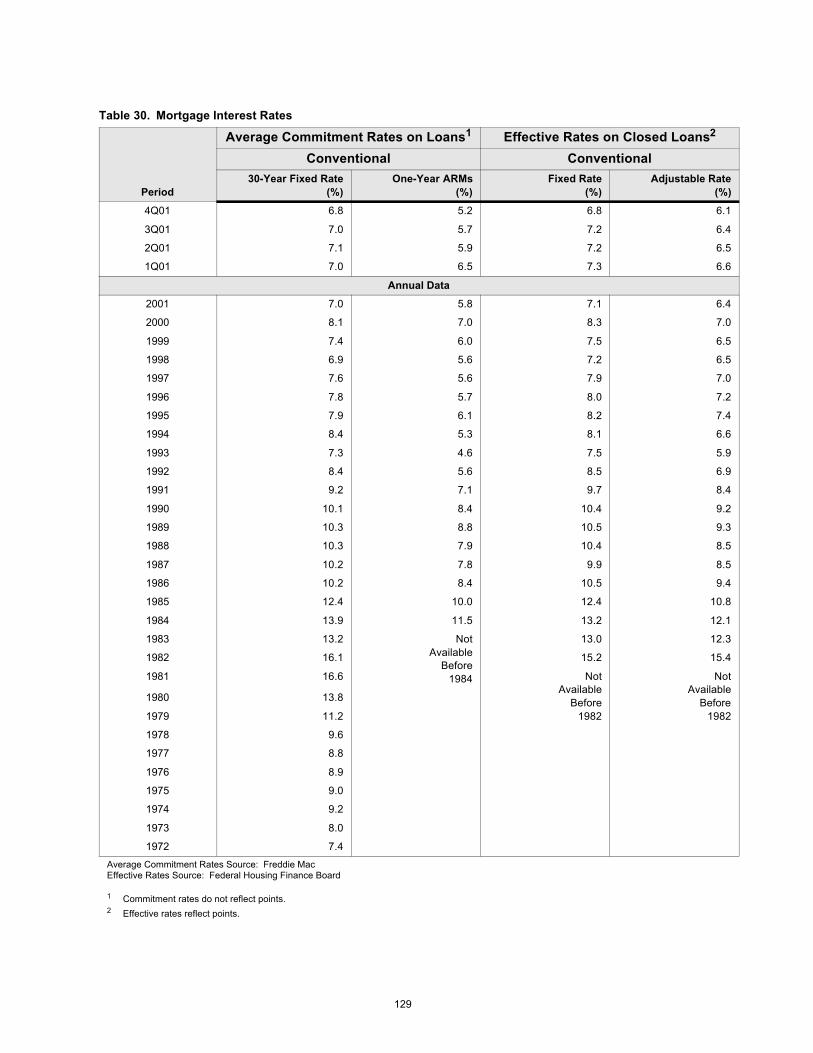
Table 30. Mortgage Interest Rates
Period
Average Commitment Rates on Loans1 Effective Rates on Closed Loans2
Conventional Conventional 30-Year Fixed Rate
(%) One-Year ARMs
(%) Fixed Rate
(%) Adjustable Rate
(%)
4Q01 6.8 5.2 6.8 6.1
3Q01 7.0 5.7 7.2 6.4
2Q01 7.1 5.9 7.2 6.5
1Q01 7.0 6.5 7.3 6.6
Annual Data
2001 7.0 5.8 7.1 6.4
2000 8.1 7.0 8.3 7.0
1999 7.4 6.0 7.5 6.5
1998 6.9 5.6 7.2 6.5
1997 7.6 5.6 7.9 7.0
1996 7.8 5.7 8.0 7.2
1995 7.9 6.1 8.2 7.4
1994 8.4 5.3 8.1 6.6
1993 7.3 4.6 7.5 5.9
1992 8.4 5.6 8.5 6.9
1991 9.2 7.1 9.7 8.4
1990 10.1 8.4 10.4 9.2
1989 10.3 8.8 10.5 9.3
1988 10.3 7.9 10.4 8.5
1987 10.2 7.8 9.9 8.5
1986 10.2 8.4 10.5 9.4
1985 12.4 10.0 12.4 10.8
1984 13.9 11.5 13.2 12.1
1983 13.2 Not Available
Before 1984
13.0 12.3
1982 16.1 15.2 15.4
1981 16.6 Not Available
Before 1982
Not Available
Before 1982
1980 13.8
1979 11.2
1978 9.6
1977 8.8
1976 8.9
1975 9.0
1974 9.2
1973 8.0
1972 7.4
Average Commitment Rates Source: Freddie Mac Effective Rates Source: Federal Housing Finance Board
1 Commitment rates do not reflect points. 2 Effective rates reflect points.
129

Table 31. Housing Market Activity
Period
Housing Starts units in thousands
Home Sales units in thousands
Single-Family Housing
Starts
Multifamily Housing
Starts
Total Housing
Starts
New Single-Family
Home Sales
Existing Single-Family
Home Sales
4Q01* 1,285 286 1,571 928 5,240
3Q01* 1,313 288 1,601 867 5,267
2Q01* 1,330 294 1,624 890 5,330
1Q01* 1,312 313 1,660 950 5,327
Annual Data
2001 1,309 292 1,602 906 5,296
2000 1,298 295 1,593 898 5,031
1999 1,367 300 1,667 907 5,197
1998 1,314 303 1,617 886 4,970
1997 1,179 296 1,474 804 4,382
1996 1,206 271 1,477 757 4,196
1995 1,110 244 1,354 667 3,888
1994 1,233 224 1,457 670 3,916
1993 1,155 133 1,288 666 3,786
1992 1,061 139 1,200 510 3,479
1991 876 138 1,014 509 3,186
1990 932 260 1,193 534 3,219
1989 1,059 318 1,376 650 3,325
1988 1,140 348 1,488 676 3,513
1987 1,212 409 1,621 671 3,436
1986 1,263 542 1,805 750 3,474
1985 1,166 576 1,742 688 3,134
1984 1,206 544 1,750 639 2,829
1983 1,181 522 1,703 623 2,697
1982 743 320 1,062 412 1,991
1981 796 288 1,084 436 2,419
1980 962 331 1,292 545 2,973
1979 1,316 429 1,745 709 3,827
1978 1,558 462 2,020 817 3,986
1977 1,573 414 1,987 819 3,650
1976 1,248 289 1,538 646 3,064
1975 956 204 1,160 549 2,476
1974 956 382 1,338 519 2,272
1973 1,250 795 2,045 634 2,334
1972 1,451 906 2,357 718 2,252
1971 1,271 781 2,052 656 2,019
Components may not add to totals due to rounding.*Adjusted Annual RatesHousing Starts Source and New Single-Family Home Sales Source: Bureau of the Census Existing Single-Family Home Sales Source: National Association of Realtors
130

Table 32. Weighted Repeat Sales House Price Index
Weighted Repeat Sales House Price Index (Annual Data)1
USA New
England Mid-
Atlantic South
Atlantic
East North
Central
West North
Central
East South
Central
West South
Central Mountain Pacific
1Q02 6.05 9.57 7.88 6.26 4.76 6.53 3.58 3.21 4.28 6.64
4Q01 7.41 10.60 8.68 8.17 4.98 7.16 5.22 5.90 6.43 8.73
3Q01 8.89 12.04 9.91 9.18 6.22 8.46 6.10 6.90 8.26 11.63
2Q01 9.01 12.10 9.51 8.90 6.45 8.17 6.25 7.38 8.47 12.57
1Q01 9.33 12.92 9.84 8.81 6.81 8.41 6.29 7.75 8.82 13.24
Annual Data
2001 7.41 10.60 8.68 8.17 4.98 7.16 5.22 5.90 6.43 8.73
2000 8.61 13.42 9.10 7.58 6.86 8.28 4.77 5.84 7.95 12.43
1999 5.93 10.41 5.71 4.84 5.81 7.74 3.12 5.04 5.17 6.47
1998 5.19 6.70 4.38 4.77 4.15 4.69 5.03 5.21 4.28 7.62
1997 4.62 4.70 3.31 4.52 5.23 5.01 4.84 3.87 4.95 5.23
1996 2.57 1.70 0.26 2.22 5.03 4.12 4.05 2.29 4.31 0.92
1995 4.45 4.09 3.13 4.27 6.01 5.23 5.47 4.07 7.42 2.77
1994 0.89 -2.89 -3.19 0.11 5.14 5.48 4.91 1.61 9.30 -3.40
1993 2.01 0.36 1.33 1.90 3.55 3.80 3.99 3.98 7.85 -1.95
1992 1.86 -1.07 1.70 2.11 3.88 3.02 3.30 3.42 5.35 -1.39
1991 2.56 -2.25 1.50 3.04 4.58 3.81 4.08 3.69 4.73 1.36
1990 0.15 -7.64 -2.88 0.12 3.73 0.54 0.69 0.42 1.81 2.86
1989 6.06 0.73 2.33 5.08 6.04 3.20 3.07 2.84 2.78 19.48
1988 6.22 3.68 6.08 6.86 6.74 2.42 2.64 -2.15 0.28 17.47
1987 6.79 13.23 16.03 6.81 8.00 2.42 3.94 -8.67 -2.83 9.57
1986 8.23 20.93 17.87 6.05 7.26 4.19 5.81 -0.57 3.23 7.25
1985 6.69 24.95 14.34 5.56 4.89 4.38 4.59 -1.23 2.33 4.89
1984 5.46 17.64 13.50 4.26 2.75 4.63 4.40 -0.06 1.88 5.19
1983 4.14 16.28 9.91 3.39 4.35 4.61 4.55 0.72 -2.62 1.14
1982 2.29 4.14 4.74 4.69 -5.04 0.04 4.03 5.91 7.36 0.79
1981 4.39 5.49 0.18 5.60 2.48 0.33 -0.43 12.00 6.37 5.96
1980 6.77 5.82 9.14 8.40 1.50 3.60 7.17 7.53 6.76 11.32
1979 11.93 10.91 15.49 11.11 9.31 9.34 5.31 13.48 15.92 16.34
1978 13.07 17.76 6.51 10.71 13.77 12.74 11.41 16.82 17.67 15.62
1977 13.13 8.81 11.41 7.41 13.28 14.72 11.28 11.20 17.74 25.66
1976 7.66 3.31 2.34 5.02 8.06 6.31 5.39 9.75 9.80 20.21
Regional Divisions:New England: CT, MA, ME, NH, RI, VTMid-Atlantic: NJ, NY, PASouth Atlantic: DC, DE, FL, GA, MD, NC, SC, VA, WVEast North Central: IL, IN, MI, OH, WI, ND, SD, NEEast South Central: AL, KY, MS, TNWest South Central: AR, LA, OK, TXMountain: AZ, CO, ID, MT, NM, NV, UT, WYPacific: AK, CA, HI, OR, WA
1 All data are measured based on percentage change over the previous four quarters. Data from 1976 - 2001 are measured based on fourth quarterto fourth quarter percentage change.
131