Embed Size (px)
Citation preview
Department of Health and Human Services
OFFICE OF INSPECTOR GENERAL
REVIEW OF GRADUATE MEDICAL EDUCATION
AND INDIRECT MEDICAL EDUCATION COSTS AT SHANDS HOSPITAL AT
UNIVERSITY OF FLORIDA
JANET REHNQUIST INSPECTOR GENERAL
MAY 2002 A-04-01-01002
- ,*II.~ICII { //j$ DEPARTMENT OF HEALTH & HUMAN SERVICES Office of Inspector General Office of Audit Services
__ Of+,,>
REGION IV . - “*n.
Room3T41 - - 61 Forsyth Street, S.W.
- Atlanta, Georgia 30303-8909
MA‘/ I 0 2002
- GIN: A-04-0 1-0 1002
Mr. Timothy Goldfarb, CEO Shands Hospital at the University of Florida 1600 S.W. Archer Road, Room10226 Gainesville, Florida 326 10
Dear Mr. Goldfarb:
This report provides you with the results of an Office of Inspector General, Office of Audit Services’ review entitled, Review of Graduate Medical Education and Indirect Medical Education Costs at Shands Hospital at the University of Florida. The purpose of our review was to determine the accuracy of resident Full-Time Equivalents (FTEs) used by the Shands at the University of Florida (the Hospital) for claiming Direct Graduate Medical Education (GME) and Indirect Graduate Medical Education (ME) for the Fiscal Years (FY) 1999 and 2000 Medicare cost reports.
The review showed that the Hospital did not use accurate data when reporting FTEs for claiming GME and IME. The Hospital (1) did not support all FTEs claimed, (2) included time spent in unallowable activities and areas, and (3) inappropriately classified specialty residents as primary care residents. Hospital officials reported FTEs for IME inaccurately because they experienced difficulty using revised software for electronic cost reporting. Had Hospital officials used the correct FTE numbers, the reimbursement amount derived within the cost report would have been much less than what was calculated using a separate spreadsheet model. Correction of the cost reports would result in increasing the Hospital’s 2-year claim for IME by $1,47 1,80 1 and reducing the 2-year claim for GME by $575,62 1. Hospital officials also reported that they have implemented procedures, where needed, to identify time spent in unallowable activities and areas.
INTRODUCTION
BACKGROUND
The Hospital is a 576-bed private, not-for-profit hospital located in the City of Gainesville, Florida. It is one of the most comprehensive in the Southeast, specializing in tertiary care and critically ill patients. The Hospital is also the primary teaching hospital for the University of Florida Colleges of Medicine and Dentistry. More than 500 resident physicians representing 1 10 medical specialties provide care to the patients at the Hospital.
Page 2- Mr. Timothy Goldfarb
Types of Education Since the inception of Medicare in 1965, the program has shared in the costs of educational activities incurred by participating providers. Medicare now makes two different types of payments – GME and IME. Under sections 1886 (a)(4) and (d)(1)(A) of the Social Security Act (the Act) and 42 Code of Federal Regulations (CFR) 412.113, GME costs are excluded from the definition of a hospital’s operating costs and, accordingly, are not included in the calculation of payment rates under the hospital inpatient prospective payment system (PPS) or in the calculation of the rate-of-increase limit for hospitals excluded from the PPS. Regulations at 42 CFR 413.85 (b) define approved educational activities to mean formally organized or planned programs of study usually engaged in by providers in order to enhance the quality of patient care in an institution. These activities include approved training programs for physicians, nurses, and certain allied health professionals. Under section 1886(h) of the Act and 42 CFR 413.86, hospitals are paid for direct GME costs based on Medicare’s share of a hospital-specific per resident amount multiplied by the number of FTE residents. The IME payments are oriented towards services to Medicare patients. Medicare has made payments to hospitals under section 1886(d) of the Act on the basis of the PPS since 1983. Under the PPS, hospitals receive a predetermined payment for each Medicare discharge. Section 1886(d)(5)(B) of the Act specifically directs the Secretary to provide an additional payment under the inpatient PPS to hospitals for IME. This additional payment, which reflects the higher operating costs associated with medical education, is based in part on the applicable indirect IME adjustment factor. The adjustment factor is calculated by using a hospital’s ratio of residents-to-beds in the formula set forth at section 1886(d)(5)(B) and specified in regulations at 42 CFR 412.105. The IME payment is usually viewed as an “add-on” to the basic PPS payment. Both GME and IME payments are calculated annually for hospitals based on formulas, which are driven, by the number of FTEs and the proportion of Medicare days of care. Thus, the amount of Medicare funds received by each hospital is determined, in large part, by the number of FTE residents at each hospital and the proportion of training time residents spend in the institution.
OBJECTIVE, SCOPE, AND METHODOLOGY The objective of this audit was to determine the accuracy of resident FTEs used by the Hospital for claiming GME and IME on the FY 1999 and 2000 Medicare cost reports. We conducted our audit during the period of November 2000 through May 2001 at the Hospital in Gainesville, Florida and at its Fiscal Intermediary’s (FI) offices in Orlando and Jacksonville, Florida. The audit covered FYs 1999 and 2000. The audit was conducted in accordance with generally accepted government auditing standards.
Page 3- Mr. Timothy Goldfarb
We limited consideration of the internal control structure to those controls concerning the accumulation of FTEs reported on the Hospital’s cost report because the objective of our review did not require a complete understanding or assessment of the internal control structure at the Hospital. To determine the accuracy of the FTE residents reported on the cost reports, we first reconciled the FTEs reported on the FY 1999 and the FY 2000 cost reports to supporting documentation. After that, for each resident on the rotation schedules, we verified:
• participation in an approved teaching program;
• foreign medical graduate eligibility (if applicable);
• time spent in allowable areas and activities;
• the appropriate proportion of total time;
• the appropriate initial residency weighing factor;
• classifications for primary care and specialty residency programs; and
• the final FTE count.
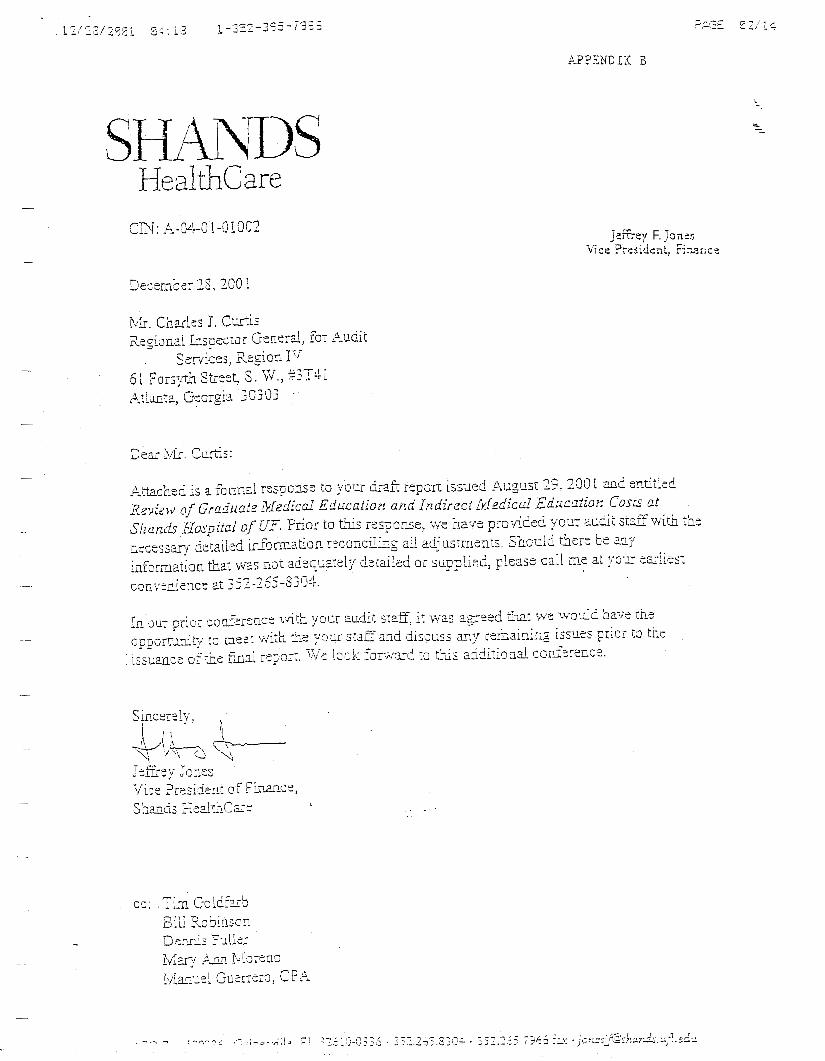
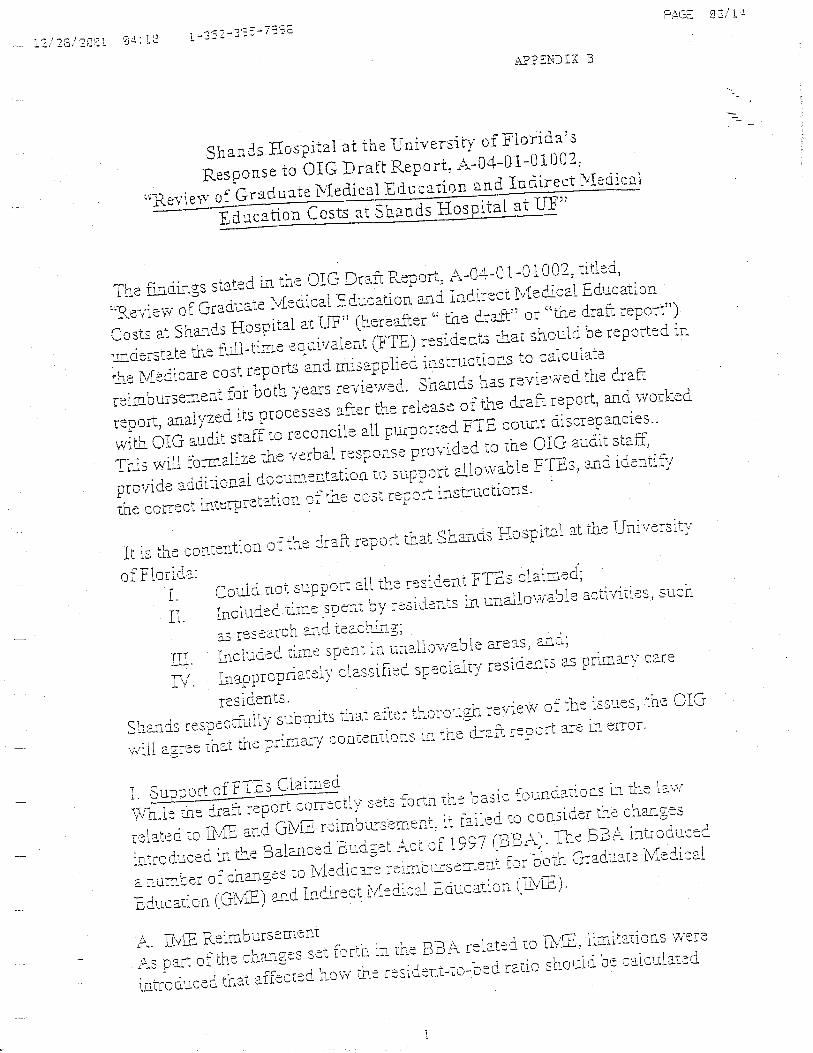
We obtained the Hospital’s comments on the draft report and revised our report to reflect additional information provided by the Hospital. The Hospital’s comments are summarized in the body of the report and enclosed as an Appendix to this report.
FINDINGS AND RECOMMENDATIONS FINDINGS For the period of our review, the Hospital did not use accurate data when calculating FTEs for claiming GME and IME. We found that the Hospital (1) did not support all FTEs claimed, (2) included time spent in unallowable activities and areas, and (3) inappropriately classified specialty residents as primary care residents. This would increase the Hospital’s s 2-year claim for IME by $1,471,801 and reduce the 2-year claim for GME by $575,621 (see Appendix A). FTEs Not Supported In completing its FY 1999 cost report, the Hospital reported FTEs, which could not be verified to supporting schedules and documentation. The 42 CFR 105(f)(2)(i) states that to include a resident in the IME FTE count for a particular cost reporting period, a hospital must furnish
Page 4- Mr. Timothy Goldfarb
information including, but not limited to: name, social security number, type of residency, years in program, dates assigned to the hospital or other providers. The hospital claimed 502 FTEs for IME in the FY 1999 cost report, while the rotation schedules supported 452 FTEs. Thus, 50 FTEs were not supported. The Hospital uses rotation schedules to track residents for accounting purposes. These rotation schedules compiled by the Hospital are based on assignment sheets prepared by the various departments within the College of Medicine and the College of Dentistry. They list all the residents by location, residency, and percentage of time spent at each location. Our testing showed the rotation schedules to be accurate. During our audit we could not determine the source of the numbers used by the Hospital in computing IME claimed for reimbursement on the FY 1999 cost report. In response to the draft report, the Hospital provided us with an explanation for the reported number. The response stated:
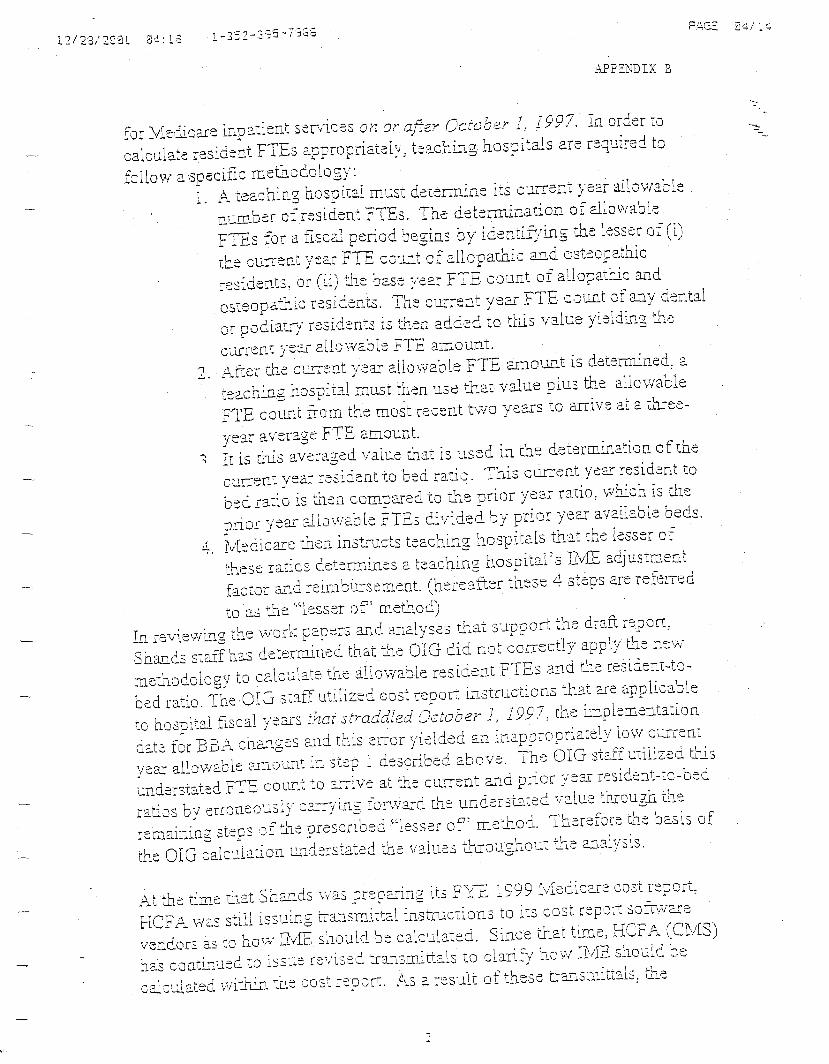
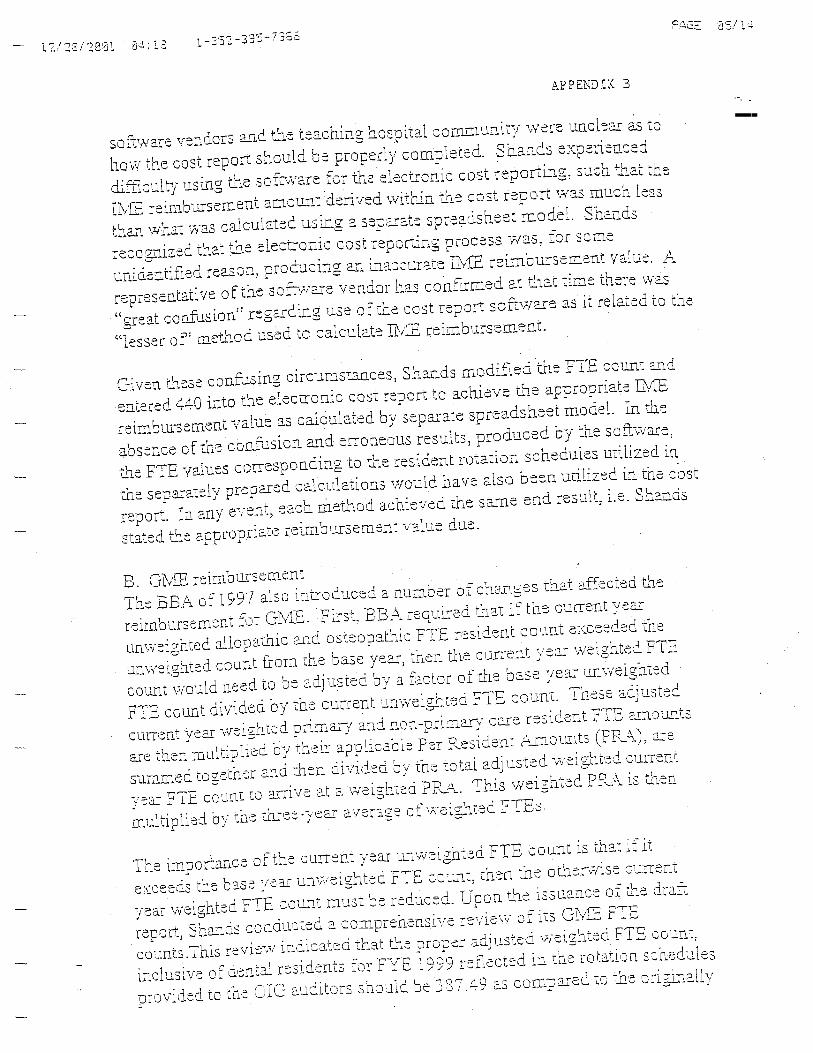
At the time that Shands was preparing its FYE 1999 Medicare cost report, HCFA was still issuing transmittal instructions to its cost report software vendors as to how IME should be calculated. Since that time, HCFA (CMS) has continued to issue revised transmittals to clarify how IME should be calculated within the cost report. As a result of these transmittals, the software vendors and the teaching hospital community were unclear as to how the cost report should be properly completed. Shands experienced difficulty using the software for the electronic cost reporting, such that the IME reimbursement amount derived within the cost report was much less than what was calculated using a separate spreadsheet model. Shands recognized that the electronic cost reporting process was, for some unidentified reason, producing an inaccurate IME reimbursement value.
Thus, the FTEs reported were based on the number of FTEs needed to achieve the appropriate reimbursement amount. Time In Unallowable Activities The Hospital did not reduce the reported and supported FTEs for time spent in non-patient care activities or activities funded by other sources. The computation of allowable FTEs is somewhat complex. The 42 CFR 412.105 (f)(ii) provides that time spent by residents in a non-hospital setting is not allowed for purposes of counting FTEs for IME unless the time is spent in patient care activities. Additionally, the Federal Register, Volume 66, Number 87 excludes time spent in research not specifically associated with the care and treatment of a particular patient of the hospital from inclusion in the computation of FTEs for IME. In computing allowable FTEs for GME, the time spent in research is allowed if required by the residency program.
Page 5- Mr. Timothy Goldfarb
Additionally, for time spent by residents in non-provider settings, 42 CFR 413.86(f) requires that a hospital have a written agreement with the entity for whom the work is to be done and incurs the cost of the resident and related supervision (all or substantially all of the costs for the training). The written agreement must specify that the hospital is bearing the costs and the amount of such costs. For FY 1999 and FY 2000, the Hospital included in the cost report time spent by residents in unallowable activities including research, medical school, and non-provider settings. As a result, IME FTEs were overstated by 16.12 in 1999, 21.44 in 2000 while GME FTEs were overstated by 12.43 in 1999, and 17.49 in 2000. The Hospital agreed with the finding, which resulted primarily from the confusion, related to the electronic cost report calculation. The hospital’s rotation schedules can identify time spent in research, medical school and non-provider settings. Time In Unallowable Areas The Hospital did not reduce the reported FTEs for time spent in non-PPS areas of the hospital. For purposes of counting FTEs for IME, 42 CFR 412.105 (f)(ii) provides that the resident must be assigned to the portion of the hospital subject to PPS or the outpatient area of the hospital. For FY 1999 and FY 2000, the Hospital included, in the cost report, time spent by residents in the two non-PPS areas of the Hospital – the burn unit and the psychiatric unit. This resulted in IME FTEs being overstated by 4.39 in 1999 and 3.61 in 2000. In response to the draft report, Shands has developed a rotation assignment to track time spent in non-PPS areas. Misclassification of Specialty Residents In its cost reports, the Hospital claimed specialty residents at a higher rate established for primary care residents. The reimbursement for direct GME costs is higher for primary care residents and obstetrics and gynecology residents. The Hospital treated certain specialties on its rotation schedules as primary care residencies. These specialties were listed on the rotation schedules under general internal medicine and pediatrics, which are primary care residencies. The specialties included, among others, cardiology, hematology, nephrology, and oncology. The 42 CFR 413.86(b) states that primary care residents are those enrolled in approved medical residency training programs in family medicine, general internal medicine, general pediatrics, preventive medicine, geriatric medicine, or osteopathic general practice. In addition, CMS
Page 6- Mr. Timothy Goldfarb
clarified which residencies are considered primary care in a letter addressed to the FI dated September 30, 1996. The Hospital misclassified, as primary care residencies, 44.87 GME FTEs in FY 1999 and 45.81 GME FTEs in FY 2000. In response to the draft report, the Hospital stated that their classification has been in accordance with historical direction provided by the Fiscal Intermediary. However, the Hospital agreed to take steps to ensure it assigns residents as primary and nonprimary care FTEs in accordance with the CMS clarification.
RECOMMENDATIONS We recommend that the Hospital revise its claims for FY 1999 and FY 2000 by using the audit results. This would increase the Hospital’s s 2-year claim for IME by $1,471,801 and reduce the 2-year claim for GME by $575,621. We will provide the results of our review to the FI, so it can use our adjustments in adjudicating the respective Medicare cost reports. We also recommend the Hospital strengthen its procedures to ensure that future reported FTEs include only (1) residents who are included on the Hospital’s rotation schedules or otherwise supported, and (2) time spent in allowable activities and areas. The Hospital has already implemented corrective actions. In addition, we recommend the Hospital appropriately classify specialty residents in accordance with CMS’s clarification of the regulations.
OTHER MATTERS During our review of the FY 1999 data, we noted that the FTEs reported to CMS by the Hospital as part of the Intern and Resident Information System (IRIS) did not agree with the FTEs included on the Hospital’s rotation schedules. The Hospital omitted 80 residents from their IRIS data in 1999. The IRIS was developed by CMS to monitor resident activity affecting Medicare GME and IME payments. The purpose of the IRIS program is to capture information required by 42 CFR 413.86 and 42 CFR 412.105 about residents in approved programs that work at hospitals that participate in the Medicare program. This information is needed to determine Medicare payments. The IRIS records contain information on training rotations of residents, including chief residents and fellows. Among other things, each record includes information on the type of residency, year of residency, location of training, and percentage of time working at that location.
Page 7- Mr. Timothy Goldfarb - -
In addition to validating the data when they are received from the FIs, CMS edits the national database to assure that no resident is counted as more than one FTE, as required by regulations. Without accurate IRIS data, CMS cannot be assured the residents are not being claimed by more than one provider for a total exceeding one FTE.
We asked CMS to compare the 80 residents omitted from the Hospital’s IRIS data to the national database and learned that 11 of the residents had FTEs also reported by other hospitals. We plan to shortly start a new audit to determine the extent of reporting problems and their financial implications.
INSTRUCTIONS FOR AUDITEE RESPONSE
Final determinations as to actions to be taken on all matters reported will be made by the CMS Action Official identified below. We request that you respond to the recommendation in this report within 30 days from the date of this report to the CMS action official, presenting any comments or additional information that you believe may have a bearing on final determination.
In accordance with the principles of the Freedom of Information Act, 5 United States Code 552, as amended by Public Law 1004-23 1, Office of Inspector General, Office of Audit Services reports are made available to the public to the extent information contained therein is not subject to exemptions in the Act (see CFR Part 5). As such, within 10 business days after the final report issued, it will be posted on the World Wide Web at http://oi,. 0 hhs.gov/.
Sincerely yours,
Enclosures
Charles J. Curtis Regional Inspector General
for Audit Services, Region IV
CMS Action Official: Mr. Dale Kendrick Associate Regional Commissioner Centers for Medicare & Medicaid Services U.S. Department of Health and Human Services Sam Nunn Atlanta Federal Center 61 Forsyth Street, S.W., Suite 4T20 Atlanta, Georgia 30303-8909
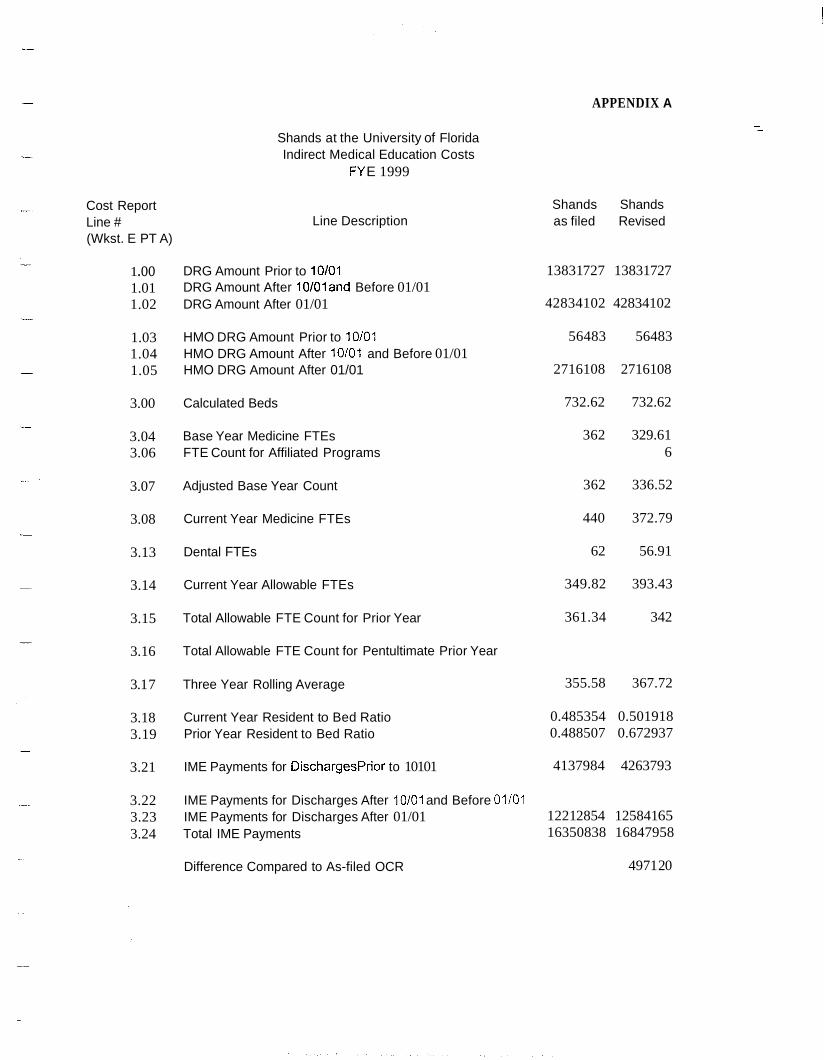
APPENDIX A
Cost Report Line # (Wkst. E PT A)
1 .oo 1.01 1.02
1.03 1.04 1.05
3.00
3.04 3.06
3.07
3.08
3.13
3.14
3.15
3.16
3.1 7
3.18 3.19
3.21
3.22 3.23 3.24
Shands at the University of Florida Indirect Medical Education Costs
FY E 1999
Line Description
DRG Amount Prior to 10/01 DRG Amount After 10/01and Before 01/01 DRG Amount After 01/01
HMO DRG Amount Prior to 10/01 HMO DRG Amount After 10/01 and Before 01/01 HMO DRG Amount After 01/01
Calculated Beds
Base Year Medicine FTEs FTE Count for Affiliated Programs
Adjusted Base Year Count
Current Year Medicine FTEs
Dental FTEs
Current Year Allowable FTEs
Total Allowable FTE Count for Prior Year
Total Allowable FTE Count for Pentultimate Prior Year
Three Year Rolling Average
Current Year Resident to Bed Ratio Prior Year Resident to Bed Ratio
IME Payments for DischargesPrior to 10101
IME Payments for Discharges After 10/01 and Before 01/01 IME Payments for Discharges After 01/01 Total IME Payments
Difference Compared to As-filed OCR
Shands Shands as filed Revised
13831 727 13831 727
42834102 42834102
56483 56483
2716108 2716108
732.62 732.62
362 329.61 6
362 336.52
440 372.79
62 56.91
349.82 393.43
361.34 342
355.58 367.72
0.485354 0.501918 0.488507 0.672937
4137984 4263793
1221 2854 125841 65 16350838 16847958
4971 20
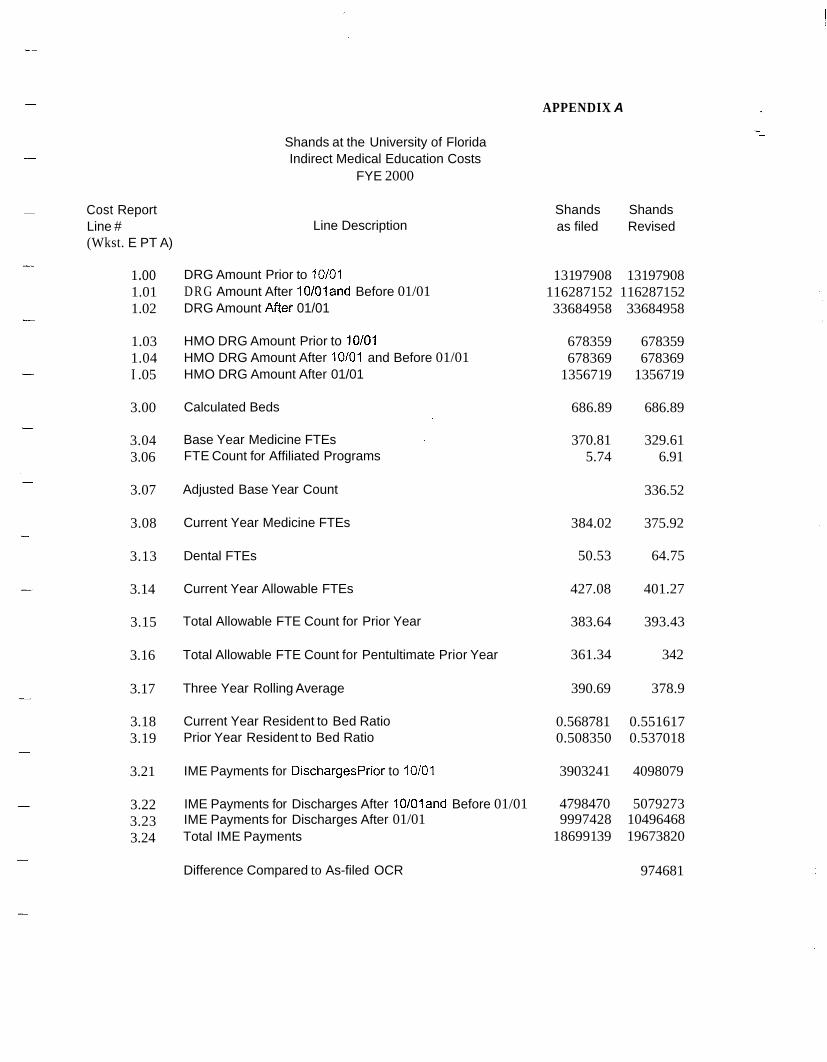
APPENDIX A
Shands at the University of Florida Indirect Medical Education Costs
FYE 2000
- Cost Report Line # (Wkst. E PT A)
1 .oo 1.01 1.02
1.03 1.04 I .05
3.00
3.04 3.06
3.07
3.08
3.13
3.14
3.15
3.16
3.17
3.18 3.19
3.21
3.22 3.23 3.24
Line Description Shands Shands as filed Revised
DRG Amount Prior to 10/01 131 97908 131 97908 DRG Amount After 10101and Before 01/01 116287152 116287152 DRG Amount After 01/01 33684958 33684958
HMO DRG Amount Prior to 10/01 678359 678359 HMO DRG Amount After 10101 and Before 01/01 678369 678369 HMO DRG Amount After 01/01 135671 9 135671 9
Calculated Beds 686.89 686.89
Base Year Medicine FTEs 370.81 329.61 FTE Count for Affiliated Programs 5.74 6.91
Adjusted Base Year Count 336.52
Current Year Medicine FTEs 384.02 375.92
Dental FTEs 50.53 64.75
Current Year Allowable FTEs 427.08 401.27
Total Allowable FTE Count for Prior Year 383.64 393.43
Total Allowable FTE Count for Pentultimate Prior Year 361.34 342
Three Year Rolling Average 390.69 378.9
Current Year Resident to Bed Ratio 0.568781 0.551617 Prior Year Resident to Bed Ratio 0.508350 0.537018
IME Payments for DischargesPrior to 10/01 3903241 4098079
IME Payments for Discharges After 10101and Before 01/01 4798470 5079273 IME Payments for Discharges After 01/01 9997428 10496468 Total IME Payments 186991 39 19673820
Difference Compared to As-filed OCR 974681
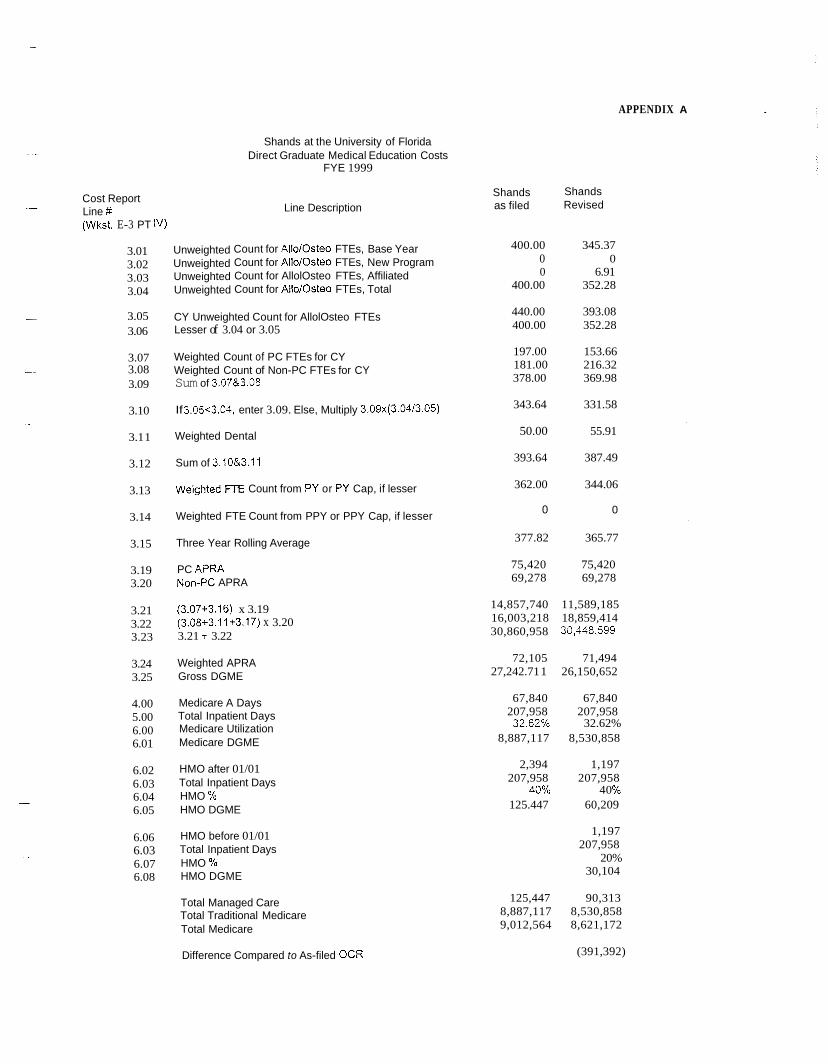
APPENDIX A
Shands at the University of Florida Direct Graduate Medical Education Costs
FYE 1999 -
Cost Report Line #t -
(Wkst. E-3 PT IV)
3.01 3.02 3.03 3.04
- 3.05 3.06
3.07 - 3.08
3.09
3.10
3.1 1 -
3.12 -
3.13
3.14
3.15
3.19 3.20
3.21 3.22 3.23
3.24 3.25
4.00 5.00 6.00 6.01
6.02 6.03 6.04 6.05
6.06 6.03 6.07 6.08
Unweighted Unweighted Unweighted Unweighted
Line Description
Count for AllolOsteo FTEs, Base Year Count for AllolOsteo FTEs, New Program Count for AllolOsteo FTEs, Affiliated Count for AllolOsteo FTEs, Total
CY Unweighted Count for AllolOsteo FTEs Lesser of 3.04 or 3.05
Weighted Count of PC FTEs for CY Weighted Count of Non-PC FTEs for CY Sum of 3.07&3.08
If 3.0563.04, enter 3.09. Else, Multiply 3.09x(3.04/3.05)
Weighted Dental
Sum of 3.10&3.11
Weighted FTE Count from PY or PY Cap, if lesser
Weighted FTE Count from PPY or PPY Cap, if lesser
Three Year Rolling Average
PC APRA Non-PC APRA
(3.07+3.16) x 3.19 (3.08+3.11+3.17) x 3.20 3.21 + 3.22
Weighted APRA Gross DGME
Medicare A Days Total Inpatient Days Medicare Utilization Medicare DGME
HMO after 01/01 Total Inpatient Days
HMO DGME HMO %
HMO before 01/01 Total Inpatient Days HMO Yo HMO DGME
Total Managed Care Total Traditional Medicare Total Medicare
Difference Compared to As-filed OCR
Shands Revised
Shands as filed
400.00 345.37 0 0 0 6.91
400.00 352.28
440.00 393.08 400.00 352.28
197.00 153.66 181.00 216.32 378.00 369.98
343.64 331.58
50.00 55.91
393.64 387.49
362.00 344.06
0 0
377.82 365.77
75,420 75,420 69,278 69,278
14,857,740 11,589,185 16,003,218 18,859,414 30,860,958 30,448,599
72,105 71,494 27,242.71 1 26,150,652
67,840 67,840 207,958 207,958
8,887,117 8,530,858
2,394 1,197 207,958 207,958
125.447 60,209
32.62% 32.62%
40% 4 0 %
1,197 207,958
20% 30,104
125,447 90,313 8,887,117 8,530,858 9,012,564 8,621,172
(391,392)
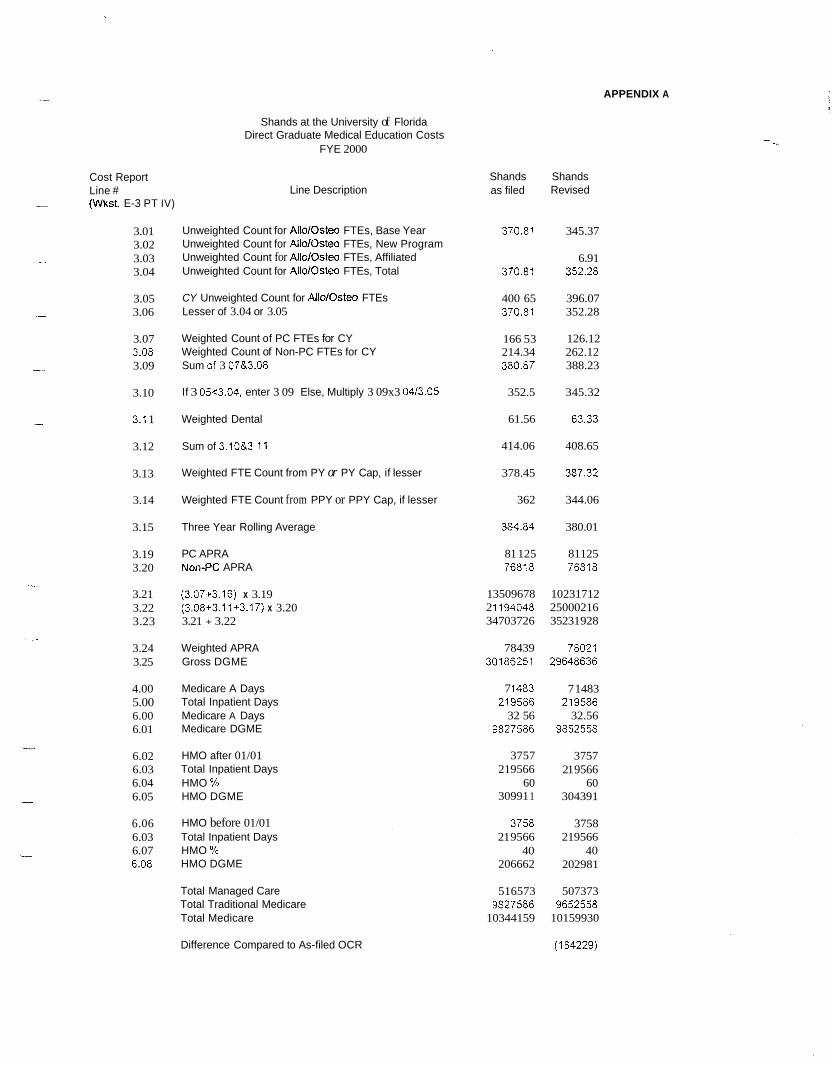
APPENDIX A
Cost Report Line #
- (Wkst. E-3 PT IV)
3.01 3.02 3.03 3.04
3.05 3.06
3.07
3.09 3.08
3.10
3.1 1
3.12
3.13
3.14
3.15
3.19 3.20
3.21 3.22 3.23
3.24 3.25
4.00 5.00 6.00 6.01
6.02 6.03 6.04 6.05
6.06 6.03 6.07 6.08
Shands at the University of Florida Direct Graduate Medical Education Costs
FYE 2000
Line Description
Unweighted Count for AlloiOsteo FTEs, Base Year Unweighted Count for AIlolOsteo FTEs, New Program Unweighted Count for AlloiOsteo FTEs, Affiliated Unweighted Count for AlloiOsteo FTEs, Total
CY Unweighted Count for Allo/Osteo FTEs Lesser of 3.04 or 3.05
Weighted Count of PC FTEs for CY Weighted Count of Non-PC FTEs for CY Sum Gf 3 07&3.08
If 3 05~3.04, enter 3 09 Else, Multiply 3 09x3 04/3.05
Weighted Dental
Sum of 3.10&3 I1
Weighted FTE Count from PY or PY Cap, if lesser
Weighted FTE Count from PPY or PPY Cap, if lesser
Three Year Rolling Average
PC APRA NOn-PC APRA
(3.07+3.16) x 3.19 (3.08+3.11+3.17) x 3.20 3.21 + 3.22
Weighted APRA Gross DGME
Medicare A Days Total Inpatient Days Medicare A Days Medicare DGME
HMO after 01/01 Total Inpatient Days HMO Yo HMO DGME
HMO before 01/01 Total Inpatient Days
HMO DGME HMO %
Total Managed Care Total Traditional Medicare Total Medicare
Difference Compared to As-filed OCR
Shands as filed
370.81
370.81
370.81 400 65
166 53 214.34 380.87
352.5
61.56
414.06
378.45
362
384.84
76818
2 i 194048
78439 30186251
7 I 483 21 9586
9827586
81 125
13509678
34703726
32 56
3757 219566
60 30991 1
3758 21 9566
40 206662
516573
10344159 9827586
Shands Revised
345.37
6.91 352.28
396.07 352.28
126.12 262.12 388.23
345.32
63.33
408.65
387.32
344.06
380.01
81125 76818
10231712 25000216 35231 928
78021 29648636
219586
98.52558
7 1483
32.56
3757 21 9566
60 304391
3758 219566
40 202981
507373
10159930 965x58
(1 84229)
Healthcare Jefiey F. Jones
Vice P x s i d m t , Fimnce
-. -7
L _ . ..
---
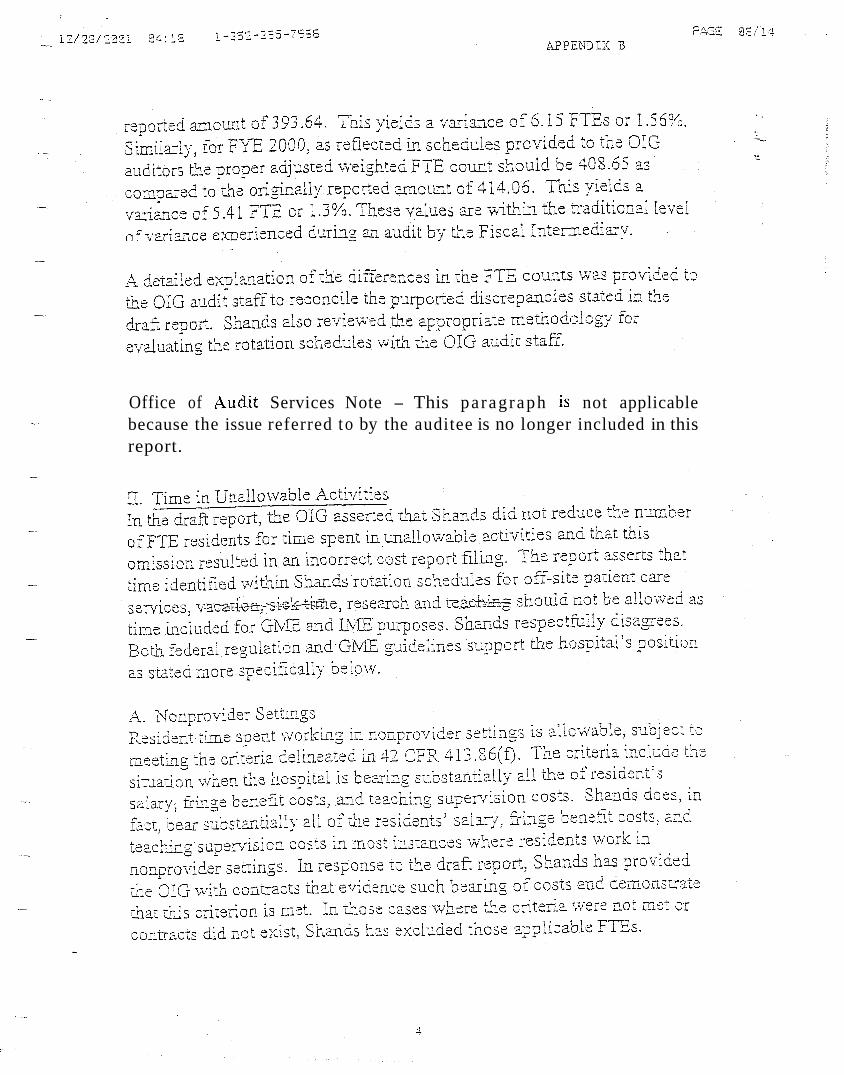
Office of ,4udit Services Note - This pa ragraph is not applicable because the issue referred to by the auditee is no longer included in this report.
APPENDIX B
..
Office of Audit Services Note - This paragraph is not applicable because the issue referred to by the auditee is no longer included in this report.
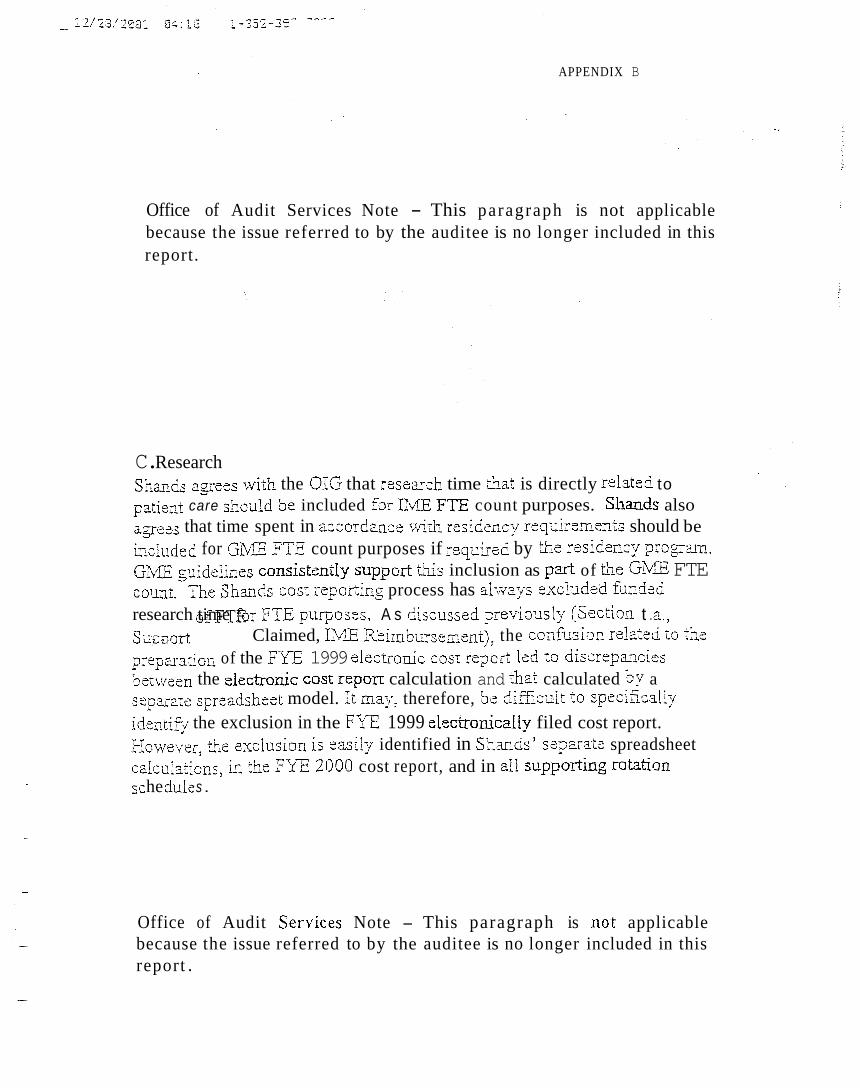
C. Research S h a d s agrees with the OIG that resexch time thar. is directly rzlated to pztient care should be included for IME FTE count purposes. Shanids also a p e s that time spent in accordancs wirh rzsidcncy requirzments should be blcluded for Gi43E FTE count purposes if rsquirei! by the rssidency p r o g a n . G b E guidelines consistcndy stlpport L h s inclusion as p d of Lhe GME FTE C O u T t . The Shands cost reporting process has always exc,llJd3d fundzd research time for FTE p ~ ~ r p o s ~ : s , A s dlscussed preiiiously (Section t -a., Supnofl - A of FTE Claimed, Ilvl%, Reimburseme-'lt), the confusisn d a t e d to ths prepaxion of the FIT 1999 elccuonic GOST report lzd t o discrepmcies bemeen the zlectronic COST repon calculation and &tat calculated by a sepa;aIe sprmdsheet model. Xt may, therefore, be diE1cult t o specifically identipj the exclusion in the FYE! 1999 elscrraScally filed cost report. I - lowev~~, the e:cclusion is zasily identified in Shmds' separzt-te spreadsheet caiculations, in thc F'fE 2000 cost report, and in sli supPofling rotatian s i; he d d e s .
Office of Audit Services Note - This paragraph is not applicable because the issue referred to by the auditee is no longer included in this report .
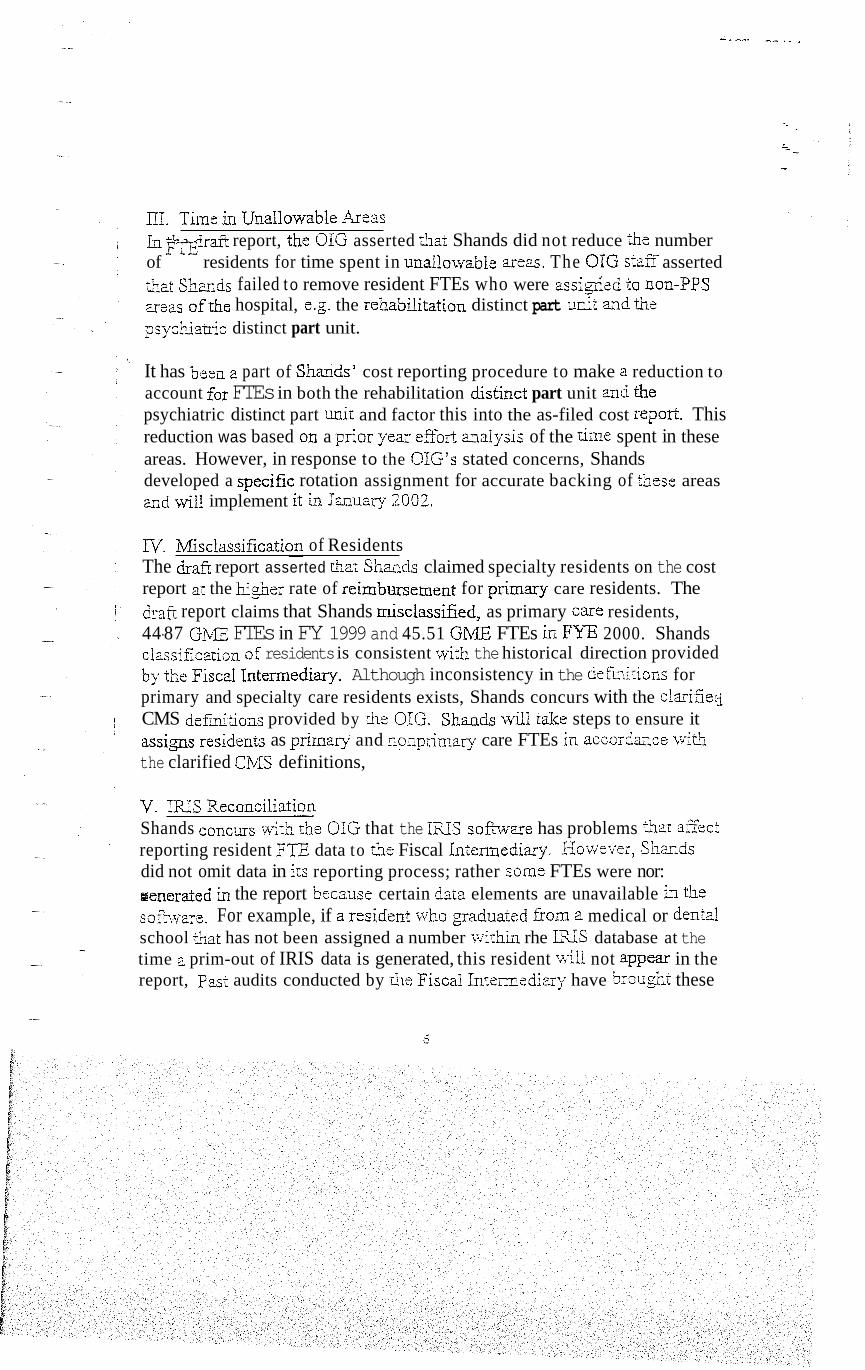
XI. Time in Unallowable Areas In the drah report, the OIG asserted that Shands did not reduce the number of F a residents for time spent in unallowable seas. The OTG stafr’ asserted h z t SE,mds failed t o remove resident FTEs who were assig$ed ta non-PPS Ueas ofthe hospital, e.g. the rehabiiiIation distinct part u r d and the psyc’;Uauic distinct part unit.
It has been i! part of Shands: cost reporting procedure to make a reduction to account for FTEs in both the rehabilitation hstinct part unit and rhe psychiatric distinct part unit and factor this into the as-filed cost report This reduction was based oil a prior year effcn malysis of the time spent in these areas. However, in response to the OIG’s stated concerns, Shands developed a specific rotation assignment for accurate backing of these areas and will implement it h J ~ U X ~ 2002,
W. Wfisclassification of Residents The &afi report asserted h a t Shands claimed specialty residents on the cost report a1 the h&er rate of reimbursement for primay- care residents. The dTafi report claims that Shands misclassified, as primary c3zz residents, 44-87 G b E FTEs in FY 1999 and 45.51 CME. FTEs iE FSiTE 2000. Shands classificzirion of residents is consistent 56th the historical direction provided by The Fiscal Interrnediasy. Although inconsistency in the defmitions for primary and specialty care residents exists, Shands concurs with the clarifizc CMS deflnitions provided by the OIG. Shands \xiill take steps to ensure it assigns residenrs as primvy and nonprimzry care FTEs in Z C C O T ~ ~ ~ ; ~ with the clarified CMS definitions,
V. INS Reconciliation Shands c m c u r s with thPv OIG that the I N S sofnvzre has problems that a5ccr. reporting resident F E data to the Fiscal Intenxeciiay. Hotvever, Shmds did not omit data in in reporting process; rather some FTEs were nor: d osnerated Li the report because certain data elements are unavailable in the solti.uare. For example, if a residznt who graduatzd fiom a medical or dental school that has not been assigned a number ivichin rhe m S database at the time a prim-out of IRIS data is generated, this resident will not appex in the report, P a s audits conducted by die Fiscal Intemediay have brou& these
APPENDIX B
I
Office of Audit Services because the issue referred report.
N o t e - This paragr.clph is not applicable t o bv the auditee is no longer included in this
-I 1