Embed Size (px)
Citation preview

OFFICE OF INSPECTOR GENERAL
Catalyst for Improving the Environment
Special Report
Congressional Request onFunding Needs forNon-Federal Superfund Sites
Report 2004-P-00001
January 7, 2004

Abbreviations
AOA Advice of Allowance
CERCLIS Comprehensive Environmental Response, Compensation, andLiability Information System
EPA U.S. Environmental Protection Agency
FY Fiscal Year
LTRA Long-Term Response Action
NPL National Priorities List
NTCRA Non-time Critical Removal Action
OIG Office of Inspector General
OU Operable Unit
OSRTI Office of Site Remediation and Technology Innovation
PRP Potentially Responsible Party
RA Remedial Action
RPM Remedial Project Manager

1
UNITED STATES ENVIRONMENTAL PROTECTION AGENCY WASHINGTON, D.C. 20460
INSPECTOR GENERAL
The Honorable Barbara BoxerRanking MemberSubcommittee on Superfund and Waste ManagementU.S. SenateWashington, D.C. 20510
Dear Senator Boxer:
This report responds to your May 23, 2003, request of the Environmental Protection Agency(EPA) Office of Inspector General (OIG) to provide information concerning funding needs fornon-Federal Superfund sites. We are sending identical reports to the cosigners of the letter: Senator Jeffords, Representative Dingell, and Representative Solis. Your letter requested that weaddress the sufficiency of funding for non-Federal sites at all stages of the site cleanup process,including a more detailed review of a limited number of sites to determine if cleanup actions arebeing stretched out over a greater number of years because of inadequate funding.
The body of this report and enclosures 1 through 5 address funding for Fiscal Year (FY) 2003. The attachment to your letter posed a series of questions relating to our October 25, 2002, letteron FY 2002 funding needs for non-Federal Superfund sites. Our responses to those questions arein enclosures 6 through 11. Please note that given the volume of data requested, we areproviding certain requested financial information via the enclosed disk.
In summary, during FY 2003, limited funding prevented EPA from beginning construction at allsites or providing additional funds needed to address sites in a manner believed necessary byregional officials, and caused projects to be segmented into phases and/or scaled back toaccommodate available funding. Within this context, regional officials told us that theyconsidered FY 2003 funding sufficient to address most sites. However, as discussed in the bodyof this report and in the enclosures, sufficient funds were not available to address a limitednumber of removal, pipeline, and remedial action sites. We estimate that the FY 2003 site-specific funding shortfall was $174.9 million. Our estimate of shortfall only considers theregions’ use of extramural resources (those resources that are used to fund work by the ArmyCorps of Engineers or contractors) applied to site-specific work. This report does not addressintramural resources, or those obligations involving the labor and travel of EPA personnel thatare obligated to specific Superfund sites.
Our October 25, 2002, letter on FY 2002 funding needs was limited to two phases of the cleanupprocess for Superfund sites - those sites requiring remedial action and those requiring long-term
2
response actions (LTRA). Your May 23, 2003, request letter asked us to inquire about all stagesof the process. Accordingly, in addition to discussing funding for remedial action and LTRAsites, the enclosed information for FY 2003 addresses sites requiring (1) time critical removalactions, and (2) preconstruction activities (referred to as pipeline activities), such as remedialinvestigation/feasibility studies and remedial design work.
The Superfund Funding Process for FY 2003
The Office of Site Remediation and Technology Innovation (OSRTI) within the Office of SolidWaste and Emergency Response provides funds for EPA regions to conduct site cleanupactivities using three Advices of Allowance (AOA):
Removal Funding
The Removal AOA funds emergency and time-critical removal actions at those sites where it isdetermined that the contaminants present an immediate threat to human health and theenvironment. The regions do not request funds from Headquarters on a site-by-site basis prior tothe start of a fiscal year because the nature of this work requires an immediate response tounanticipated conditions. Instead, OSRTI provides funds to the regions based on historicalallocations for the emergency removal program.
Pipeline Funding
The Pipeline AOA provides the regions funds for pre-construction activities, such as conductingremedial investigation/feasibility studies that characterize the nature of the contaminants at a site;selection of the remedy, which is documented in the Record of Decision; the design of theconstruction work to address the contaminants; and non-site-specific work, such as communityinvolvement activities, records management, and State program development. The regions donot request funds on a site-specific basis from Headquarters for pipeline activities.
Prior to receiving funds, the regions input information on pipeline activities accomplished in theprior year and those planned for the current year into the Comprehensive EnvironmentalResponse, Compensation, and Liability Information System CERCLIS), the Superfundinformation system. During this process, the regions identify or “target” activities in certaincategories they believe can be initiated with funding amounts from OSRTI. OSRTI thenallocates funds to each region using a formula that considers historical allocations and pipelineactivities accomplished in the prior year and work planned for the current year (i.e., the targetedactivities). The regions then apply pipeline funds to targeted activities for sites or allocate anamount of money to contracts that will later be used to conduct pipeline activities. The latterprocess is known as “bulk funding.” Under bulk funding, site-specific obligations are notrecorded in the Agency’s financial management system until the contractor is instructed toperform a pipeline activity for a particular site.

3
Remedial Funding
The Remedial AOA funds remedial construction, LTRA activities, non-time critical removals,and five-year reviews. LTRAs involve continuing treatment activities after construction iscomplete. Groundwater monitoring is an example of an LTRA. The regions annually requestfunds from Headquarters for remedial, non-time critical removal, and LTRAs on a site-specificbasis. Regions input cost estimates into CERCLIS, and complete Project Evaluation forms forongoing and new start projects with estimated costs of $600,000 or more. The ProjectEvaluation forms enable the regions to provide a desired amount of funding, a minimum amount,and a description of the known hazards present at the site and the impacts of not providingfunding. New construction starts are evaluated by the National Risk Based Priority Panel, agroup of senior Headquarters and regional officials whose analysis is used by management tomake funding decisions
Once the regional information is available, OSRTI and the regions begin discussions aboutregional requests and eventually arrive at an initial allocation of funds for each site. Following amethodology from FY 2002, projects with estimated costs of less than $5 million were generallyfunded at the amount requested by the regions, while the amounts allocated for higher cost sitesrepresent the amounts mutually agreed to by Headquarters and the region. OSRTI issued itsinitial funding memorandum for FY 2003 on October 30, 2002. OSRTI officials indicated to usthat the allocation of funds is a dynamic process that continues throughout the year. (We foundthis to be the case. For example, as shown on enclosures 3 and 4, regions reported not needingfunds they initially requested from OSRTI based on various factors such as delays and being ableto use funds from prior year appropriations. On the other hand, some sites required and receivedadditional funds beyond the amounts estimated for FY 2003.)
In addition to funds provided by OSRTI, the regions obligate funds from two other sources. Funds are obligated from monies provided by States as matching funds for construction activitiesand from “Special Account” monies provided by Potentially Responsible Parties (PRPs) inaccordance with Consent Decrees.
FY 2003 Emphasis on Ongoing Remedial Actions
For FY 2003, OSRTI transferred $10 million of pipeline funds to remedial construction. In itsOctober 30, 2002, memorandum discussing initial FY 2003 funding decisions, OSRTI stated that“Because of the limited resources available for construction, regions have the discretion tominimize new Fund-financed remedial investigation/feasibility study (RI/FS) and remedialdesign (RD) work.” OSRTI also revised its deobligation policy to direct that 75 percent ofdeobligations become part of the national pool for reobligation.
As with FY 2002, OSRTI emphasized funding ongoing construction over new constructionstarts. For FY 2003, the National Risk Based Priority Panel considered 35 new start projects anddetermined that 9 should receive remedial funds. Of the remaining 26, 15 did not receiveremedial funds, and 11 were, according to an OSRTI official, determined not ready for variousreasons, including enforcement issues, changed site conditions, or design complications. Two of

4
the sites not receiving remedial funds - Elizabeth Mine in Region 1 and the WashingtonRecreation portion of Operable Unit #3 of the Bunker Hill site in Region 10 - did receiveremoval and pipeline funds, respectively.
Results of OIG Review
Regional officials told us that they had sufficient funding for the majority of sites for FY 2003. However, a limited number of removal, pipeline, and remedial action sites did not. Whenfunding is not sufficient, construction at National Priority List (NPL) sites cannot begin; cleanupsare performed in less than an optimal manner; and/or activities are stretched over longer periodsof time. As a result, total project costs may increase and actions needed to fully address thehuman health and environmental risk posed by the contaminants are delayed. We estimate thatthe FY 2003 funding shortfall was $174.9 million as summarized in the following table.
CategoryEstimated FY 2003
Funding Shortfall (millions) Enclosure
FY 2003 new start construction projects not funded $118.5 3
FY 2003 remedial projects not sufficiently funded $40.8 3
FY 2003 removal projects not sufficiently funded $9.4 1
FY 2003 pipeline projects not sufficiently funded $6.1 2
Total (difference due to rounding) $174.9
In analyzing whether funding was sufficient for a given site, we began by asking regionalSuperfund officials/Remedial Project Managers (RPMs) whether they developed their estimate for FY 2003 without consideration of budget limitations (i.e., whether their estimate was basedon the work that needed to be done from an engineering standpoint to address the site in anoptimal way in FY 2003). In response to our questions about how site cleanup estimates aredeveloped, some regional officials told us that expected budget limitations were a factor indeveloping their estimates for FY 2003. Some regional officials informed us that cleanup workis conducted differently than it was conducted when full funding was available. Limited fundingforces work at certain sites to be phased and/or scaled back to accommodate available funding. We then asked regional officials whether the amount obligated was sufficient to proceed in anoptimal way. Their responses are noted in enclosures 1 through 4 under the Sufficient Fundingcolumn.
We also inquired about 15 sites in greater detail. These sites are summarized in enclosure 5. For these sites, in addition to discussing them with regional Superfund officials, we obtainedinformation such as the nature and extent of contamination and the status of cleanup fromCERCLIS. OIG engineers assisted in our review of these sites and provided their opinion ofwhether EPA’s funding decisions were appropriate given the unique nature of each site. Weconsidered four of the 15 sites to be insufficiently funded for FY 2003.

5
Removal Funding
Financial information provided by OSRTI indicated that the regions obligated $128.1millionfrom the FY 2003 and prior-year appropriations and an additional $32.2 million from StateSuperfund contracts and amounts provided by PRPs in response to Consent Decrees for a total of$160.3 million. Enclosure 1 lists those removal actions that were not fully funded in FY 2003.
Regions generally reported having sufficient funds to address emergency removals. However,several regions said that because of the amount of removal funds available to them, they madedecisions to modify the type and extent of the removal, or partially fund sites. Examples follow:
• Region 1 officials said that friable asbestos in buildings on the Inter Royal site wasnot completely dismantled. Further work may be needed in the future as thebuildings degenerate.
• Region 3 reported having sufficient funds for removal actions but stated that it hadchanged its approach for the removal program because of limited funding over time. Region 3 now focuses on stabilization of sites (for example, erecting a fence and/orenclosing leaking drums to control spread of the contaminant) rather than on completecleanups.
• Region 5 officials reported that three sites requiring removal actions were notsufficiently funded - Kip Nelson Properties, Hog Hollow, and the Circle SmeltingSite. The Circle Smelting site needs a time critical removal action to mitigate thethreat to public health and the environment from lead contamination at an estimatedcost of $8.3 million. However, the Region was only able to obligate a total of$1.6 million from appropriated funds and Special Accounts during FY 2003. Regional officials also told us that they reduced the extent of cleanup in some time-critical removal cases. For example, a site might be fenced and leaking drums placedin sealed containers instead of removing the contaminated soil.
• Regions 6 and Region 7 reported that they were involved with the Columbia Shuttledisaster for approximately three months during FY 2003. Interviews with Regions 6and 7 Removal Team staff indicated that if this had not been the case, they wouldhave investigated other sites that probably would have needed removal actions. Region 6 officials told us that addressing other removal actions “ . . . would haveoverwhelmed our removal Advice of Allowance.”
Pipeline Funding
Financial information provided by OSRTI indicated that the regions obligated a total of $107.6million from current year appropriations, prior-year appropriations, State Superfund contracts,and amounts provided by PRPs in response to Consent Decrees to site-specific pipeline activitiesin FY 2003. As discussed below, the amounts obligated for a limited number of sites were notsufficient to conduct pipeline activities in the manner considered necessary by regional officials.

6
When Regions responded to our questions about the sufficiency of pipeline funding, theygenerally said the amounts obligated to specific sites were sufficient for targeted sites forFY 2003. However, some appeared to base their answers on whether they were able to makesome progress with the funding received. For example, Region 2 considered funding sufficient ifthe funding allowed the Region to address the site in a manner the Region described as“minimally sufficient.” Region 4 officials considered funding sufficient because the work can bephased (divided into segments) to accommodate available funds spread over as many projects aspossible. Region 7 officials told us that they instructed their RPMs to reduce the scope, phase, ordelay planned activities where possible. As a result, for some sites the Region reduced thenumber of samples collected, limited the number of contaminants analyzed, and reduced thenumber of monitoring wells installed. Region 8 officials indicated that the Region cut allpipeline activities by 10 percent and incrementally funded cooperative agreements at 50 percentto free up funds for remedial investigation/feasibility studies and remedial design work for NPLsites. Thus, some regional officials considered funding sufficient within the constraints imposedby limited funding.
However, some pipeline activities were not sufficiently funded. Enclosure 2 is a list of non-Federal Superfund sites with funding shortfalls for pipeline activities during FY 2003 totaling$6.1 million. Examples of funding concerns for pipeline sites follow:
• Region 7 estimated $2.5 million for the Omaha Mining site for FY 2003 but onlyobligated $1 million. As a result, fewer residences were sampled for leadcontamination.
• The remedial investigation/feasibility study for the Annapolis Mine site in Region 7,estimated to cost $400,000, was not started.
• The RPM for the Libby, Montana site in Region 8 indicated that an additional$740,000 was needed to take additional samples, analyze the samples taken, andconduct a study to determine a cost-effective method for quantifying the amount ofasbestos in the soil.
• Region 10 officials told us that pipeline operations were significantly cut for theremedial design for the Bunker Hill site and for various community involvementprojects. For the Bunker Hill site, the Region obligated $3.9 million versus itsestimate of $7.05 million for pipeline activities.
Remedial Funding
Enclosures 3 and 4 list non-Federal Superfund NPL sites for which FY 2003 remedial fundingwas requested or obligated. For FY 2003, OSRTI allocated $224.4 million for site-specificremedial work. Considering amounts obligated from the FY 2003 appropriation, prior-yearsappropriations, State Superfund contracts, and amounts provided by PRPs in response to ConsentDecrees. Financial information supplied by OSRTI indicated that the regions obligated a total of$369.3 million during FY 2003.

7
To obtain the views of regional officials on the sufficiency of FY 2003 funding, we askedregional Superfund officials, including RPMs, whether the amount allocated to a site wassufficient to address that site in an optimal way without consideration of budget limitations.Generally speaking, the regions reported that there was sufficient funding in FY 2003 forongoing remedial construction and LTRA projects. However, some Regions reported theirdecision about sufficiency of funds rested on whether funding was sufficient for site work tocontinue as planned, even if phased, without additional delays or work stoppage. Regionalofficials consider every LTRA site listed in enclosure 4 to be sufficiently funded for FY 2003.
Specific planned site work and funding was the result of a series of discussions betweenHeadquarters and the regions. During these work planning discussions, a number of factors areconsidered, such as what sites are the highest priority for funding, what specific site work couldbe achieved with available funds in the fiscal year, and when the funding is needed. Regionsalso told us that because of limited funding, they sometimes “phase” and “scale back” work, donot start new remedial actions, and experience delays. Phasing is the division of a project intosmaller work elements, which, according to OSRTI, allows more projects to get funded. However, several RPMs told us that phasing work is not as efficient as up-front funding forremedial actions. For example, as discussed below, at Region 1's Atlas Tack site, remedialaction work was partitioned into three phases because there was not enough money to fully fundthe site:
• Phase I was the planned work for FY 2002 – if funding was available, the building onthe site would have been demolished. The cost estimate was $1.8 million, butfunding was not available.
• Phase II would have occurred during FY 2003, if Phase I was completed in FY 2002. Phase II involves cleaning up the site and preparing it for future use. The estimatedcost for this phase is $11.3 million (Region 1’s estimate for FY 2003 was $13.1million for Phases I and II). However, the site received no funding in FY 2003.
• Phase III is being designed at this time and will not be ready for funding untilFY 2005. The current cost estimate is $4.3 million.
A Region 1 official indicated that had sufficient funds been available in FY 2002 the work forPhases I and II could have been completed in 6 to 9 months.
Scaling back site work is the reduction of the amount and extent of the work. For example, theRPM for Region 2's Welsbach site stated that this site received the requested funding to excavatethree study areas during FY 2003. However, when digging began at the primary study area, thecontamination was determined to be substantially greater than anticipated. Since additionalfunding could not be obtained, work was scaled back at the primary work site and postponed atthe two other areas. The RPM said that construction delays at this site could increaseconstruction costs, increase the number of days required for road closures, lengthen the timerequired before eight displaced families can move back into their homes, and negatively affectthe ability of a private swim club to stay in business. The Region reported that the delayedcleanup cannot be associated with an increased health risk at this time.

8
We asked regional officials how site estimates were developed. We were told that RPMs’requests are generally based on Independent Government Cost Estimates for contractor servicesand developed in collaboration with supervisors. Some regional officials told us that they didconsider the limited budget when preparing site estimates. Region 10 told us that estimates werebased on the Headquarters’ predicted allocation of the money that would be available during FY2003. Region 10 officials said that OSRTI informed them in advance that OSRTI would cutback any requested amounts over $5 million for a particular site due to limited funds. Withoutthat direction, Region 10 staff we interviewed stated that they would have requested more fundsfor the Bunker Hill site.
Our estimate of the remedial funding shortfall for FY 2003 is comprised of sites whereconstruction could not begin and sites with ongoing construction where the need exceededavailable funds. Following are the sites where construction activities were ready to begin but nofunding was available because the sites were not ranked high enough by the National PriorityPanel:
Region State Sites Not Funded in FY 2003 FY 2003 Site
estimate (millions)
1 * Massachusetts Atlas Tack $13.1
1 New Hampshire Mohawk Tannery 6
1 * Vermont Elizabeth Mine 8
1 New Hampshire New Hampshire Plating 3.5
5* Indiana Continental Steel 39.1
5 Illinois Jennison Wright 12.5
6 Louisiana Marion Pressure Treating 9
6 New Mexico North Railroad Ave. Plume 6.5
6 Texas Hart Creosoting 9.9
6 Texas Jasper Creosoting 6.2
10 Oregon McCormick and Baxter 4.7
Total $118.5
*NOTE: site involves multiple operating units
In addition, some sites received less funding than the region requested or, in the view of regionalofficials, were not sufficiently funded. Some examples of sites not sufficiently funded are:
• The Bunker Hill site in Region 10 – The Region estimated $37.8 million andobligated $15.0 million. The entire shortfall involves Operable Unit #3. The impactof reduced funds for the Bunker Hill site is associated with risk to human health,particularly for young children and pregnant women, from lead contamination in aresidential area. The future costs are expected to increase as work is delayed.

9
• The Roebling Steel site in Region 2 – The Region requested $5 million from OSRTIto demolish a building with asbestos during FY 2003. When OSRTI did not providethe funds, the Region looked to other sources and obligated a total of $4.3 millionfrom prior year deobligations and State Superfund contracts in September 2003. However, because funding was not available earlier, demolition could not begin inFY 2003.
• The Welsbach site in Region 2 – Region 2 obligated a total of $20.5 million but theRPM told us that the extent of contamination was greater than expected and work wasscaled back at the primary work site and postponed at other areas. The RPMestimated an additional $7 million were needed for FY 2003.
• The Libby Mine site in Region 8 – Region 8 officials discussed the Libby, Montanasite, a non-time critical removal, that poses a cancer health threat to residents in thetowns of Libby and Troy. The region requested funds for operable units involving thetown of Libby, the town of Troy, and the mine itself (Libby Mine). Funding wasobtained for the Libby operable unit, but not for Troy or for the Libby Mine. Region8 officials indicated that the Region could have used another $3.7 million. Theadditional funds would have enabled the Region to analyze more samples to helpcharacterize the site and to conduct a study to determine how clean the site should be.
• The Upper Tenmile Creek site in Region 8 – Region 8 obligated $3.8 million but theRPM indicated that an additional $1.3 million was needed to clean up two additionalareas and begin installation of an alternate water supply and treatment system.
The request letter also asked that we provide expenditure data by date and the unobligated sitebalances at the end of FY 2003. Enclosure 3 contains this information for the two sites in eachregion with the highest total obligations in FY 2003. Because of the volume of data involved, weare providing this information for other sites on the enclosed disk.
High Cost Sites
Enclosure 5 summarizes the work conducted for a limited number of sites with large estimates ofoverall costs. We judgmentally selected these sites based on information included in our October 25, 2002, letter on FY 2002 funding. Our selection was primarily based on sites withhigh overall project costs with comparatively low total obligations at the end of FY 2002. Wefocused on these sites to inquire in greater depth about how the region arrived at its estimate forFY 2003 and whether, in our opinion, the amount requested appeared appropriate to addressthese site in an optimal way in FY 2003. For these sites, in addition to discussing them withregional Superfund officials, we obtained information such as the nature and extent ofcontamination and the status of cleanup from EPA’s Superfund information system, CERCLIS. OIG engineers assisted in our review of these sites and provided their opinions of whether EPA’sfunding decisions were appropriate given the unique nature of each site. In summary, we

10
identified funding concerns for 4 of the 15 sites reviewed – the Welsbach site in Region 2, theUpper Tenmile Creek and Libby sites in Region 8, and the Bunker Hill site in Region 10. Thesesites are discussed above and in enclosure 5.
In analyzing funding for remedial action sites, we noted that the demands of a limited number ofhigh-cost, complex sites limit OSRTI’s ability to fully fund all ongoing sites and new starts. Forexample, approximately half of the FY 2003 Remedial AOA funding for remedial action, non-time critical removals, and LTRAs went to 8 sites out of a total of 94 sites receiving funding. Inaddition, the funding demands for some sites will grow. For example, the RPM for the NewBedford site in Region 1 indicated that the site will require at least $15 million per yearbeginning in FY 2004 but could need as much as $80 million per year for optimal cleanup. TheRPM for the Woolfolk Chemical site in Region 4 indicated that if funding of an estimated$25 million is not available over the next 2 to 3 years there could be increased risk to humanhealth and the environment from the continued migration of contaminants to the groundwater. Such high-cost sites, in addition to sites discussed above such as Continental Steel that did notreceive any funding in FY 2003, will continue to pose significant funding challenges for EPA.
Scope and Methodology
We interviewed OSRTI and regional officials, including RPMs, about the FY 2003 process forfunding Superfund sites and reviewed documentation relating to FY 2003 funding. During theinterviews, we asked regional officials if they prepared cost estimates for sites withoutconsidering budget limitations and whether the funding available to them was sufficient toaddress sites in an optimal way for FY 2003. To calculate funding shortfalls, we verified withregional officials and RPMs those sites they had designated as insufficiently funded andconfirmed with them our estimate of shortfall. We also asked regional officials whether notobligating funds until late in the fiscal year limited the amount of site cleanup activity.
For the financial information in enclosures 1 through 4, we relied on information supplied byOSRTI and regional Superfund officials. To obtain the desired financial information by site,special queries of EPA’s Integrated Financial Management System were developed for us byOSRTI and financial management officials. Prior to giving the information to us, OSRTIcorrected errors and modified certain data to meet our reporting needs. Given time constraints,we were not able to test whether the queries extracted the data in the manner desired. Further,because unique queries were developed, we were not able to rely on the transaction testingconducted during our audit of EPA’s financial statements. However, prior to finalizing thisletter, we asked regional officials to confirm the accuracy and completeness of the data providedfor the information appearing in enclosures 1 through 4 which they did.
In addition to the above limitation, we did not test the controls governing certain activities, suchas the work of the National Risk Based Priority Panel, or the process used to deobligate andreobligate funds. For theses reasons, our work does not represent an audit conducted inaccordance with Government Auditing Standards.
11
Because of OSRTI’s emphasis on remedial action funding during FY 2003, enclosures 3 and 4contain obligation information for all sites with FY 2003 extramural obligations. However,given the volume of data involved, enclosures 1 (removal) and 2 (pipeline) only list those siteswith an identified funding shortfall for FY 2003. Information on other sites is included on theenclosed disk.
To answer the questions in the attachment to your request letter, we obtained information fromOSRTI and regional officials in writing and through interviews. This information is provided inenclosures 6 through 11.
As I’m sure you are aware, the Conference Committee on the FY 2004 Omnibus AppropriationsAct directed the OIG to conduct an evaluation of how to increase cleanups and reduceadministrative costs within the Superfund program. This will provide yet another opportunity forthe OIG to provide the Congress with additional information on the Superfund program. Weplan to begin this work early in 2004.
If you or your staff have any questions, feel free to call me on (202) 566-0847, or EileenMcMahon, Assistant Inspector General for Congressional and Public Liaison, on (202) 566-2546.
Sincerely,
Nikki L. Tinsley
Enclosures

Listing of Enclosures
1 Non-Federal Facility Sites with Removal Funding Shortfalls for FY 2003
2 Non-Federal Facility Sites with Pipeline Funding Shortfalls for FY 2003
3 Non-Federal Facility Fund-financed Remedial Actions - FY 2003
4 Non-Federal Facility Fund-financed Long-term Response Actions - FY 2003
5 Summary of Sites Selected for Focused Review by OIG
6 OIG Response to Attachment Question 1
7 OIG Response to Attachment Question 2
8 OIG Response to Attachment Question 3
9 OIG Response to Attachment Question 4
10 OIG Response to Attachment Question 5
11 OIG Response to Attachment Question 6

ENCLOSURE 1 - NON-FEDERAL FACILITY SITES WITHREMOVAL FUNDING SHORTFALLS FOR FY 2003

Non-Federal Facility Fund-Financed Removal Actions - FY03 Enclosure 1Page 1 of 1
Region State Site Name
National Priorities List
Site (Y/N)FY03 Regional
EstimateFY03 Obligated Amount
From Removal AOA*Date of
Obligation Special AccountsDate of
Obligation
Total FY03 Amount Obligated (sum of prior 3
columns)Sufficient
Funding (Y/N) Notes1 CT Inter Royal Corp N 150,000 1/14/2003 150,000 N 1
5 IL Circle Smelting N 8,298,423 500,000 04/09/03 550,000 09/05/03 N 2500,000 07/10/03
1,000,000 550,000 1,550,000
5 IN Hog Hollow N 243,000 100,000 06/05/03 100,000 N 3
5 WI Kip Nelson Properties N 1,172,384 168,000 09/30/03 168,000 N 4
4 TOTAL 9,713,807 1,418,000 550,000 1,968,000 N
* - includes prior year fund appropriation obligationsNote: PRP oversight costs are not included above.
Notes:1
2 This site is in need of additional funding to continue to mitigate the threat to public health and the environment from lead contamination. FY2003 funding shortfall amount: $6,748,423.3 This site needs a time critical removal to mitigate the threat to public health and the environment from contamination. FY2003 funding shortfall amount: $143,0004 Work at this site has been started. However, insufficient funding is available to complete the clean up action in a timely fashion. FY2003 funding shortfall amount: $1,004,384.
Due to limited funds the scope was limited to fencing the property and removing the bulk of friable asbestos that could blow out of the building. With more funds the Region would consider removal of entire structure as a permanent solution. The impact now is the abandoned building remains a potential fire threat that could release asbestos to the surrounding area. FY2003 funding shortfall amount is estimated at: $1,500,000.

ENCLOSURE 2 - NON-FEDERAL FACILITY SITES WITHPIPELINE FUNDING SHORTFALLS FOR FY 2003

Non-Federal Facility Fund-Financed Pipeline Operations - FY03 Enclosure 2Page 1 of 3
Region State Site Name
National Priorities List Site
(Y/N)FY03 Regional
Estimate
FY03 Obligated Amount From Pipeline AOA*
Date of Obligation
Total FY03 Amount Obligated (sum of prior 3 columns)
Sufficient Funding
(Y/N) Notes7 MO Annapolis Lead N 400,000 N 1
7 MO Union Electric - Campbell N 50,000 N 2
7 NE Omaha Lead Y 2,500,000 14,000 12/19/02 N 31,068 07/09/03
1,000,000 07/30/031,015,068 1,015,068
3 TOTALS 2,950,000 1,015,068 1,015,068 N
Note: Potentially Responsible Party oversight costs are not included above. Pipeline Operations include site assessments, remedial investigations/feasibility studies, remedial design, and community involvement.* includes prior year fund appropriation obligations
Notes:1 Unable to fund Remedial Investigation due to Pipeline AOA shortfall for FY 2003. FY2003 funding shortfall amount: $400,000.2 Completed work using Regional Employee. FY2003 funding shortfall amount: $50,000.3 Sampling could have started earlier and been more extensive if the full request was received.
This resulted in 5,000-7,000 residential yards not being sampled for lead contamination. FY2003 funding shortfall amount: $ 1,500,000.

Non-Federal Facility Fund-Financed Pipeline Operations - FY03 Enclosure 2Page 2 of 3
Region State Site Name
National Priorities List Site
(Y/N)FY03 Regional
Estimate
FY03 Obligated Amount From Pipeline AOA*
Date of Obligation
Total FY03 Amount Obligated (sum of prior 3 columns)
Sufficient Funding
(Y/N) Notes8 MT Barker Hughesville Mining District Y 150,000 150,000 09/10/03 150,000 N 1
8 MT Libby Asbestos Site Y 4,050,000 250,000 01/09/03 N 250,000 03/04/03
750,000 03/12/0330,000 04/02/038,000 04/07/03
100,000 05/01/03(8,000) 05/27/038,000 05/29/03
500,000 06/03/03200,000 07/14/0319,274 07/28/03
1,200,000 08/25/03200,000 09/29/03
3,307,274 3,307,274
2 Total 4,200,000 3,457,274 3,457,274 N
Potentially Responsible Party oversight costs are not included above. Pipeline operations include site assessments, Remedial investigations/Feasibility studies,
remedial design, and community involverment activities.
* - inludes prior year fund appropriation obligations
NOTES:1 Pipeline work on this site was scaled back or completion timeframes extended due to the overall pipeline funding shortfall.
FY2003 funding shortfall amount: $200,000.2 Pipeline work on this site was scaled back or completion timeframes extended due to the overall pipeline funding shortfall.
FY2003 funding shortfall amount: $740,000.

Non-Federal Facility Fund-Financed Pipeline Operations - FY03 Enclosure 2Page 3 of 3
Region State Site Name
National Priorities List
Site (Y/N)FY03 Regional
Estimate
FY03 Obligated Amount From Pipeline AOA*
Date of Obligation
Total FY03 Amount Obligated (sum of prior 3
columns)Sufficient
Funding (Y/N) Notes
10 ID Bunker Hill Mining & Metallurgical Y 7,050,000 188 09-Oct-02 N 1104 29-Oct-0299 01-Nov-02
125 20-Nov-023 09-Dec-02
156 10-Dec-0279,635 23-Dec-021,351 13-Jan-03
215 21-Jan-03234 05-Feb-03
29,948 20-Mar-03631,228 31-Mar-03400,000 14-Apr-0325,000 07-May-03
960 08-May-03149,854 13-May-03200,000 15-May-03125,000 19-May-03
1,447,448 29-May-0333,000 19-Jun-03
175,000 20-Jun-0380,000 02-Jul-0319,795 24-Jul-03
518 19-Aug-03440 20-Aug-03
460,000 17-Sep-03 3,860,301 3,860,301
1 TOTAL 7,050,000 3,860,301 3,860,301 N
Note: Potentially Responsible Party oversight costs are not included above. Pipeline operations include site assessments, Remedial investigations/Feasibility studies, remedial design, and community involverment activities.* - inludes prior year fund appropriation obligations
Notes:1 The Region cut its planned FY03 obligations for this site in half because of insufficient funding. Consequently, it reduced management and technical assistance funding;
reduced the Minewater remedial design because the state was not going to sign a State Superfund contract to cover the remedial action work; postponed starts of some remedial designs (ecological designs) because it was hearing that the ecological remedial action funding would not be available. FY2003 funding shortfall amount: $3,189,699.

ENCLOSURE 3 - NON-FEDERAL FACILITY FUND-FINANCED REMEDIAL ACTIONS - FY 2003
(INCLUDES NON-TIME CRITICAL REMOVAL ACTIONS)

Non-Federal Facility Fund-Financed Remedial Actions - FY03 Enclosure 3Page 1 of 24
Region State Site NameFY03 Amount Initially Requested by Region
FY03 Initial Funding Plan Amount from HQ October
2002 Funding DecisionFY03 Obligated Amount
From HQ RA AOA*Date of
Obligation Special AccountsDate of
Obligation State SF ContractsDate of
Obligation
Total FY03 Amount Obligated
(sum of prior 3 columns)
Total FY03 Expenditures for
Remedial Action** Date of
ExpenditureEstimated Total Costs for Remedial Action***
Total Funds Obligated through 9/30/03
Total Funds Expended through
9/30/03Unexpended Balance at
9/30/03
Sufficient Funding
(Y/N) Notes1 MA Atlas Tack Co. 13,100,000 18,600,000 N 1
1 ME Eastland Woolen Mill 5,000,000 5,000,000 132 01/08/03 Y5,000,000 03/10/03
7 09/26/035,000,139 5,000,139
1 VT Elizabeth Mine 8,000,000 N 2
1 NH Mohawk Tannery 6,000,000 N 3
1 MA New Bedford 13,500,000 10,000,000 10,000,000 05/06/03 675,000 05/06/03 1,400,000 05/06/03 18,331 10/28/02 130,000,000 106,499,530 79,649,785 26,849,745 Y 4520,700 08/04/03 74,232 10/30/02325,000 09/26/03 1,433,741 11/13/02
9,511 11/18/0276,077 11/22/0210,852 12/10/02
2,504,167 12/17/02327,935 12/24/02206,634 12/30/02
1,671,244 01/14/03177,668 01/28/03
1,970,733 02/11/033,193 02/14/03
205,823 03/07/031,399,011 03/13/03
26,494 03/21/03135,657 04/04/03
2,020,213 04/17/03184,958 05/02/03
2,665,464 05/09/03146,536 05/23/03
3,061 06/03/031,989,847 06/05/03
149,215 06/19/034,790 07/08/03
1,375,634 07/09/03177,379 07/11/03
3,342 07/31/031,495,022 08/06/03
188,223 08/22/031,585 08/26/03
1,246,067 09/03/0323,099 09/04/03
875,578 09/18/03227,905 09/22/03
1,585 09/30/0310,000,000 1,520,700 1,400,000 12,920,700 23,030,806
1 NH New Hampshire Plating Co. 3,500,000 15,400,000 N 5
1 VT Pownal Tannery x 2,400,000 07/23/03 581 09/19/03 8,800,000 9,500,000 581 9,499,419 Y 6 6,400,000 08/21/03
700,000 09/29/03 9,500,000 9,500,000 581
1 NH Savage Municipal Water Supply x 49 05/30/03 15,500,000 Y7
249,968 08/27/0311 09/17/03
250,028 250,028
8 Total 49,100,000 15,000,000 24,750,167 1,520,700 1,400,000 27,670,867 23,031,387 188,300,000 115,999,530 79,650,367 36,349,164 N
* - inludes prior year fund appropriation obligations** - can involve amounts obligated in prior years as well as Special Accunts and State SF Contracts.*** - refelcts estimated total costs for remedial actions for sites with Records of Decision. Some future costs may be borne by responsible parties.
x OSRTI records do not indicate a Regional request for these sites.

Non-Federal Facility Fund-Financed Remedial Actions - FY03 Enclosure 3Page 2 of 24
Notes:1 Site was not approved for funding by the National Priority Panel. FY2003 funding shortfall amount: $13,100,000.2 Remedial Action funding was not approved for this site. However, this site did receive emergency removal funds to stabilize the site. FY2003 funding shortfall amount: $8,000,000.3 Site was not approved for funding by the National Priority Panel. FY2003 funding shortfall amount: $6,000,000.4 This site was funded sufficiently to continue FY03 actions.5 Site was not approved for funding by the National Priority Panel. FY2003 funding shortfall amount: $3,500,000.6 The Region did not request funds for FY03 based on work schedule, however during the year, the Region requested and HQ provided the monies listed. 7 These funds were for an unplanned site optimization project that will allow the state to take the lead for this site.
Additional:There were two sites listed on the FY02 Remedial Actions spreadsheet that are not included here. They are:Eastern Surplus - This site received Long Term Response Funding in FY03, $1.2 million from Special Accounts.Ottati Goss - This site was obligated $529,355 in Pipeline Funding.

Non-Federal Facility Fund-Financed Remedial Actions - FY03 Enclosure 3Page 3 of 24
Region State Site Name
FY03 Amount Initially Requested
by Region
FY03 Initial Funding Plan
Amount from HQ October 2002
Funding Decision
FY03 Obligated Amount From HQ RA AOA*
Date of Obligation
Special Accounts
Date of Obligation
State SF Contracts
Date of Obligation
Total FY03 Amount
Obligated (sum of prior 3 columns)
Total FY03 Expenditures for
Remedial Action**Date of
Expenditure
Estimated Total Costs for Remedial
Action***
Total Funds Obligated through
9/30/03
Total Funds Expended through
9/30/03
Unexpended Balance at
9/30/03
Sufficient Funding
(Y/N) Notes2 NJ Asbestos Dump x 450,000 06/24/03 450,000 Y 1
2 NJ Brook Industrial Park x 300,000 07/17/03 300,000 Y 2
2 NJ Chemical Insecticide Corp. x 38 07/25/03 2,275,304 09/30/03 Y 35,000,000 09/30/035,000,038 2,275,304 7,275,342
2 NY Claremont Polychemical 1,600,000 1,600,000 1,100,000 07/03/03 1,600,000 Y 4 500,000 07/18/03 200,000 09/08/03 1,800,000 1,800,000
2 NJ Combe Fill South Landfill 3,000,000 3,000,000 8,000,000 09/25/03 8,000,000 Y 5
2 NJ De Rewal Chemical Co. 2,320,000 2,320,000 1,320,000 07/03/03 680,000 07/03/03 2,000,000 2,000,000 Y 6
2 NJ Federal Creosote - LAG A 25,000,000 20,000,000 10,000,000 02/03/03 2,240,000 08/26/03 1,855,814 10/18/02 77,800,000 116,518,872 84,584,091 31,934,781 Y 7 5,000,000 03/26/03 1,200,000 09/29/03 3,418,159 10/21/02 5,000,000 05/16/03 774 10/24/02 1,460,000 08/26/03 40,662 11/05/02 3,800,000 09/29/03 31,660 11/06/02
3,330,836 11/19/022,191,116 11/26/02
2,057 12/04/022,404,550 12/16/02
97,187 01/06/031,532,948 01/09/032,574,567 01/29/032,504,633 01/31/031,076,535 02/19/03
97,111 02/24/031,690,932 03/14/03
90,047 03/28/03107,370 04/16/03
1,153,122 04/28/031,153,360 05/15/03
119,844 05/20/034,692,227 06/10/031,119,819 06/24/03
191,041 07/03/031,494,200 07/14/03
874,521 07/15/03150,590 07/23/03
7,397 07/31/031,738,209 08/22/03
109,213 09/03/03901,444 09/12/03416,402 09/22/03
3,748 09/26/03 25,260,000 3,440,000 28,700,000 37,172,095
2 NY GCL Tie & Treating Inc. 2,000,000 2,000,000 2,000,000 09/03/03 2,000,000 5,000,000 Y
2 NY Li Tungsten Corp. x 13 11/26/02 400,000 06/06/03 400,013 Y 8
2 NY Marathon Battery Corp. x 608,800 06/24/03 608,800 Y 9
2 NYMohonk Road Industrial Plant 925,000 350,000 925,000 04/02/03 925,000 Y
2 NJ Nascolite Corp. 5,000,000 5,000,000 5,000,000 05/08/03 350,000 05/08/03 11,300,000 Y 1058 06/27/03 500,000 09/25/0388 07/14/03
3,500,000 07/17/03 1,150,000 08/26/03 800,000 09/05/03 174 09/11/03 57 09/30/03 10,450,377 850,000 11,300,377

Non-Federal Facility Fund-Financed Remedial Actions - FY03 Enclosure 3Page 4 of 24
Region State Site Name
FY03 Amount Initially Requested
by Region
FY03 Initial Funding Plan
Amount from HQ October 2002
Funding Decision
FY03 Obligated Amount From HQ RA AOA*
Date of Obligation
Special Accounts
Date of Obligation
State SF Contracts
Date of Obligation
Total FY03 Amount
Obligated (sum of prior 3 columns)
Total FY03 Expenditures for
Remedial Action**Date of
Expenditure
Estimated Total Costs for Remedial
Action***
Total Funds Obligated through
9/30/03
Total Funds Expended through
9/30/03
Unexpended Balance at
9/30/03
Sufficient Funding
(Y/N) Notes2 NY Olean Well Field x 800,000 09/30/03 800,000 Y 11
2 NJWelsbach & General Gas Mantle (Camden) 15,659,510 15,659,500 76 12/06/02 1,340,490 03/20/03 131,845 10/15/02 54,480,000 39,925,153 22,407,209 17,517,944 N 12
10,000,037 05/15/03 1,500,000 07/22/03 1,110,662 10/28/0257 06/27/03 2,020,000 09/25/03 1,868 11/20/0238 09/11/03 947,846 11/22/02
5,659,510 09/16/03 201,296 11/25/0269 09/17/03 336 11/29/02
174 09/30/03 76 12/10/02422 12/12/02216 12/18/02
73,028 01/02/03336 01/03/03425 01/15/03
1,091,939 01/16/03326,936 01/23/03976,763 01/29/03
216 01/30/03410 02/04/03
1,241,212 02/06/03336 02/11/03
248,508 02/25/03430 03/03/03336 03/18/03
1,183,575 03/27/03158,163 03/28/03
425 04/01/03591 04/15/03335 04/22/03
921,455 04/23/03426 04/28/03
735,263 04/29/03745,808 05/05/03
192 05/06/03408 05/13/0337 05/15/03
135,954 05/22/03504 05/27/03158 06/03/03546 06/10/03
716,455 06/16/03192 06/17/03
368,815 06/24/03312 06/25/0357 06/27/03
1,227,992 07/11/03155,505 07/22/03134,097 07/23/03
266 08/13/03148,528 08/18/03
1,259,160 08/20/03281 08/29/03266 09/09/03
1,381,568 09/11/03273 09/16/0369 09/17/03
532,168 09/22/03273 09/29/03
15,659,961 4,860,490 20,520,451 16,165,558
2 NJ Roebling Steel Co. 5,000,000 5,000,000 105 06/18/03 772,723 09/15/03 9,000,000 N 13 3,502,799 09/30/03 3,502,904 772,723 4,275,627
2 NY Sarney Farm x 550,000 06/24/03 550,000 Y 14

Non-Federal Facility Fund-Financed Remedial Actions - FY03 Enclosure 3Page 5 of 24
Region State Site Name
FY03 Amount Initially Requested
by Region
FY03 Initial Funding Plan
Amount from HQ October 2002
Funding Decision
FY03 Obligated Amount From HQ RA AOA*
Date of Obligation
Special Accounts
Date of Obligation
State SF Contracts
Date of Obligation
Total FY03 Amount
Obligated (sum of prior 3 columns)
Total FY03 Expenditures for
Remedial Action**Date of
Expenditure
Estimated Total Costs for Remedial
Action***
Total Funds Obligated through
9/30/03
Total Funds Expended through
9/30/03
Unexpended Balance at
9/30/03
Sufficient Funding
(Y/N) Notes
2 NJVineland Chemical Co., Inc. - Soil Excavation/treament 10,000,000 10,000,000 99 11/06/02 2,000,000 09/17/03 32,000,000 Y 15
96 11/18/02478 12/05/02229 12/20/02293 01/06/03167 01/07/0399 01/30/03
304 02/20/0392 03/19/03
269 03/27/0398 03/28/03
204 04/14/0398 04/18/03
157 05/09/03386 05/14/0398 05/20/03
271 06/04/0398 06/25/03
267 06/27/03196 07/02/0398 07/14/03
399 07/29/0398 08/27/0372 09/05/03
6,000,000 09/17/03 6,004,666 2,000,000 8,004,663
2 NY Wide Beach Development x 1,469,965 06/24/03 1,469,965 Y 16
18 Totals 70,504,510 64,929,500 80,722,959 700,000 17,957,282 99,380,241 53,337,653 193,180,000 156,444,025 106,991,300 49,452,725 N
* - inludes prior year fund appropriation obligations** - can involve amounts obligated in prior years as well as Special Accunts and State SF Contracts.*** - refelcts estimated total costs for remedial actions for sites with Records of Decision. Some future costs may be borne by responsible parties.
x OSRTI records do not indicate a Regional request for these sites.
1 The region did not submit a request for funding as it expected State Superfund Contract funds.2 The region did not submit a request for funding as it expected Special Account funds.3 FY03 activities were funded in FY02. This obligation is for work to be done the first quarter of FY04.4 Additional funding is for FY04 first quarter activities.5 This was an unplanned Court ordered settlement for a construction claim. The increase is based on the amount settled and the balance of Remedial Action funds remaining on the State grant after construction was completed.6 Final cost estimate for EPA's portion was $1million less than originally anticipated.7 Site cost overruns were greater than expected. The Region diverted some funds from the Vineland site to cover the Region's shortfall. 8 The region did not submit a request for funding as it expected the Special Account funds.9 This site was completed in a prior year, the amount above reflects an administrative closing.
10 Additional contamination found during excavation, therefore additional funding was necessary. 11 FY02 obligations were sufficient to complete actions in FY02 and FY03. This amount reflects need for first quarter FY04.12 The Region indicated that additional contamination was discovered at the site and funds for planned activities had to be diverted to address this new situation.
The result is that work was scaled back at the primary worksite, and postponed at two other planned areas because sufficient additional funds were notavailable to address this situation, causing the site to be insufficiently funded for FY03. FY2003 funding shortfall amount: $7,000,000.
13 This site was delayed due to funding constraints. Work was stopped at this site in November 2002 and was not resumed until FY2004 due to the timing of the funding. FY2003 funding shortfall amount: $5,000,000.14 This site was completed in a prior year, the amount above reflects an administrative closing.15 Work was slowed on this site due to a new process that includes multiple monitoring techniques. These techniques reduced costs in FY03.16 This funding was received for an administrative closing.
AdditionalThe following list provides those sites that received funding in FY02 but not in FY03:Burnt Fly Bog This is a state lead, fully funded in FY02. Montgomery Township This site was previously fully funded and will require additional funding only in the event of cost overruns.Rocky Hill This site was previously fully funded and will require additional funding only in the event of cost overruns.Vestal Water Supply Well This site was previously fully funded and will require additional funding only in the event of cost overruns.Tutu Wellfield This site was previously fully funded and will require additional funding only in the event of cost overruns.Imperial Oil Previously funded $42 million contingency for new wells later deemed not necessary.Cosden Chemical Coatings This new start was planned but not possible because a timely agreement could not be reached with the State.Fried Industries Planned work could not take place because the design required extended testing.U.S. Radium The final design did not call for remediation as expected. Funds were not needed.

Non-Federal Facility Fund-Financed Remedial Actions - FY03 Enclosure 3Page 6 of 24
Region State Site Name
FY03 Amount Initially
Requested by Region
FY03 Initial Funding Plan
Amount from HQ October 2002
Funding Decision
FY03 Obligated
Amount From HQ RA AOA*
Date of Obligation
Special Accounts
Date of Obligation
State SF Contracts
Date of Obligation
Total FY03 Amount
Obligated (sum of prior 3 columns)
Total FY03 Expenditures for Remedial
Action**Date of
Expenditure
Estimated Total Costs for Remedial Action***
Total Funds Obligated through
9/30/03
Total Funds Expended
through 9/30/03
Unexpended Balance at
9/30/03
Sufficient Funding
(Y/N) Notes3 PA Crossley Farm x 46,425 04/04/03 Y 1
44,793 09/12/03 91,218 91,218
3 PA Croydon TCE 24,000 24,000 Y 2
3 PA Drake Chemical x 7,192,257 03/12/03 7,192,257 Y 3
3 PA East Mount Zion x 130,000 03/18/03 Y 43,665 09/12/03
133,665 133,665
3 VA Kim-Stan Landfill x 28,906 07/08/03 28,906 Y 5
3 VA Matthews Electroplating x 22,790 07/24/03 22,790 Y 6
3 PA Mill Creek Dump x 881,353 03/27/03 881,353 Y 7
3 PA North Penn - Area 6 200,000 200,000 200,000 09/27/03 200,000 1,171 10/09/02 1,700,000 2,153,000 990,424 1,162,576 Y 8480 11/05/02645 11/07/02545 12/05/02367 12/12/02329 01/03/03385 02/07/03
(645) 02/24/03539 03/05/03
(9,366) 03/07/03(1,756) 03/10/03
434 04/03/03540 05/09/03
3,310 06/06/03907 07/08/03
(112) 08/11/037,125 09/29/03
200,000 200,000 4,898
3 PA Raymark 50,000 50,000 50,000 08/07/03 50,000 1,140,000 Y
3 VA Rhinehart Tire Fire Dump x 267,270 03/14/03 Y 980,000 04/04/03
347,270 347,270
3 VA Saunders Supply Co. 16,000 16,000 18,581 01/14/03 83,416 09/12/03 101,997 13,883,200 Y 10
3 MD Southern Maryland Wood 15,000 15,000 40,493 01/09/03 700,000 06/18/03 21,973 10/17/02 61,468,905 64,774,224 63,082,936 1,691,288 Y 1121,820 06/20/03 6,111 10/30/02
1,462 12/04/025,550 12/24/021,936 01/27/03
29,217 02/24/03557 02/26/03
8,683 03/28/0339,206 04/10/03
1,535 04/29/0310,267 06/09/03
152 06/13/031,657 06/27/03
226 07/08/031,749 07/22/03
114 08/21/031,507 09/03/03
62,313 700,000 762,313 131,902
3 PA Strasburg Landfill x 158,911 09/12/03 158,911 Y 12

Non-Federal Facility Fund-Financed Remedial Actions - FY03 Enclosure 3Page 7 of 24
Region State Site Name
FY03 Amount Initially
Requested by Region
FY03 Initial Funding Plan
Amount from HQ October 2002
Funding Decision
FY03 Obligated
Amount From HQ RA AOA*
Date of Obligation
Special Accounts
Date of Obligation
State SF Contracts
Date of Obligation
Total FY03 Amount
Obligated (sum of prior 3 columns)
Total FY03 Expenditures for Remedial
Action**Date of
Expenditure
Estimated Total Costs for Remedial Action***
Total Funds Obligated through
9/30/03
Total Funds Expended
through 9/30/03
Unexpended Balance at
9/30/03
Sufficient Funding
(Y/N) Notes3 DE Tybouts Corner Landfill x 500,000 09/08/03 500,000 Y 13
14 Totals 305,000 305,000 359,800 500,000 9,610,880 10,470,680 136,800 78,192,105 66,927,224 64,073,361 2,853,864 Y
* - includes prior year fund appropriation obligations** - includes amounts obligated in prior years*** - refelcts estimated total costs for remedial actions for sites with Records of Decision. Some future costs may be borne by responsible parties.
x OSRTI records do not indicate a Regional request for these sites.
Notes:1 The region did not submit a request for funding as it expected State Superfund Contract funds.2 This amount was requested for a State cooperative agreement. However, it was not funded as the state did not submit the application.3 The region did not submit a request for funding as it expected State Superfund Contract funds.4 The region did not submit a request for funding as it expected State Superfund Contract funds.5 This obligation was for an unplanned cooperative agreement with the state to support agency Remedial Action work.6 The region did not submit a request for funding as it expected State Superfund Contract funds.7 The region did not submit a request for funding as it expected State Superfund Contract funds.8 Though funding was received late in the fiscal year, site activities were not interrupted or delayed.9 The region did not submit a request for funding as it expected State Superfund Contract funds.
10 Original estimate was short of required funding for operation and maintenance of the facility.11 Additional monies were needed for a cooperative agreement to a state agency allowing them to monitor site activity.12 The region did not submit a request for funding as it expected State Superfund Contract funds.13 The region did not submit a request for funding as it expected Special Account funds.
Additional:Two sites were funded in FY02 that were not funded in FY03. They are Berkeley Products and Walsh Landfill.These two sites did not have planned estimates for FY02 but were funded due to unexpected construction needs.These two sites were not at a stage that required action in FY2003. Neither had estimates, nor received funding in FY03.

Non-Federal Facility Fund-Financed Remedial Actions - FY03 Enclosure 3Page 8 of 24
Region State Site Name
FY03 Amount Initially Requested
by Region
FY03 Initial Funding Plan
Amount from HQ October 2002
Funding Decision
FY03 Obligated Amount From HQ RA AOA*
Date of Obligation
Special Accounts
Date of Obligation
State SF Contracts
Date of Obligation
Total FY03 Amount
Obligated (sum ofprior 3 columns)
Total FY03 Expenditures for
Remedial Action**
Date of Expenditure
Estimated Total Costs for Remedial
Action***
Total Funds Obligated through
9/30/03
Total Funds Expended
through 9/30/03
Unexpended Balance at
9/30/03
Sufficient Funding
(Y/N) Notes4 FL Alaric Area Groundwater 1,700,000 1,700,000 1,700,000 05/21/03 1,700,000 3,500,000 3,800,000 Y
4 FLAmerican Creosote Works (Pensacola) 3,000,000 3,000,000 300,000 09/30/03 300,000 21,000,000 7,300,000 Y 1
4 NC Benfield Industries, Inc. x 138,071 02/11/03 138,071 13,000,000 6,400,000 Y 2
4 NC Cape Fear Wood Preserving x 1,508,697 02/24/03 1,508,697 38,400,000 22,400,000 Y 3
4 NC Carolina Transformer Co. x 300,000 08/22/03 600,000 06/23/03 22,300,000 18,700,000 Y 4 40,000 09/19/03 225,000 07/23/03 160,000 09/27/03 200,000 08/11/03
156,561 08/20/03500,000 1,181,561 1,681,561
4 FL City Industries x 412,000 12/12/02 412,000 3,800,000 3,000,000 Y 5
4 FLColeman-Evans Wood Preserving Co. 4,850,000 4,850,000 4,500,000 03/03/03 574,262 10/03/02 64,700,000 60,538,450 53,699,603 6,838,847 Y 6
5,200,000 03/19/03 362,024 10/15/02 5,700,000 05/07/03 127,232 10/17/02 3,300,000 08/20/03 230,008 10/18/02 2,250,000 09/25/03 71,629 10/25/02
389,502 11/07/0238,622 11/25/02
349,531 11/27/02660 12/03/02
258,789 12/04/02578,965 12/09/02370,205 12/17/02267,455 12/20/02546,030 01/10/0356,972 01/21/03
394,486 01/24/03124,169 01/28/03345,746 02/12/0348,819 02/19/03
310,673 02/21/03207 03/03/03
691,426 03/04/03294 03/07/03
5,200,000 03/17/03214,318 03/19/0347,475 03/26/03
315 04/02/03608,974 04/03/03457,533 04/17/0359,580 04/28/03
3,132,842 04/30/03386,282 05/22/03607,073 06/06/03284,245 06/25/03795,684 06/30/03153,308 07/25/03
1,500,000 07/28/03134,993 07/31/03686,687 08/04/0348,715 08/25/03
209,864 08/26/03306,914 08/27/03796,666 09/08/03198,370 09/09/03
514 09/10/0363,899 09/22/03
184,381 09/23/03296 09/24/03
1,115,012 09/29/03 20,950,000 20,950,000 23,331,646

Non-Federal Facility Fund-Financed Remedial Actions - FY03 Enclosure 3Page 9 of 24
Region State Site Name
FY03 Amount Initially Requested
by Region
FY03 Initial Funding Plan
Amount from HQ October 2002
Funding Decision
FY03 Obligated Amount From HQ RA AOA*
Date of Obligation
Special Accounts
Date of Obligation
State SF Contracts
Date of Obligation
Total FY03 Amount
Obligated (sum ofprior 3 columns)
Total FY03 Expenditures for
Remedial Action**
Date of Expenditure
Estimated Total Costs for Remedial
Action***
Total Funds Obligated through
9/30/03
Total Funds Expended
through 9/30/03
Unexpended Balance at
9/30/03
Sufficient Funding
(Y/N) Notes4 KY Distler Brickyard x 133,048 03/20/03 133,048 Y 7
4 FL Escambia Wood Preserving 500,000 500,000 523,027 05/07/03 523,027 28,000,000 Y 8
4 NC FCX, Inc. (Statesville Plant) x 3,071 01/31/03 3,071 7,500,000 6,820,000 Y 9
4 NC North Belmont PCE x 31,835 02/20/03 31,835 Y 10
4 TN Ross Metals Inc 3,000,000 3,000,000 2,000,000 01/02/03 714,253 03/07/03 72,356 10/11/02 10,000,000 8,626,083 6,212,814 2,413,269 Y 11 285,747 03/07/03 20,000 08/04/03 115,745 10/24/02 61,400 03/11/03 74,000 08/11/03 1,122 11/04/02 340,000 06/11/03 62,000 09/23/03 130,800 11/08/02 726,000 08/11/03 18,612 11/13/02 1,018,475 09/29/03 (18,612) 11/14/02
128,812 11/21/02508 11/26/02
19,971 11/29/02(19,971) 12/11/02
770 12/18/02163,391 12/20/02
344 12/27/02126,961 12/31/0223,555 01/03/03
(23,555) 01/09/03118,949 01/13/03145,397 01/17/0323,933 02/05/03
523 02/11/03244,948 02/13/03
805 02/18/03152,644 02/19/0322,962 03/06/03
311,342 03/07/03384 03/18/03
422,129 03/20/0322,132 03/26/03
733 04/03/03(46,065) 04/07/03822,708 04/25/0316,238 05/02/03
(15,728) 05/12/03273,681 05/13/03416,108 05/22/03196,410 06/03/0318,831 06/04/03
365 06/09/03(18,831) 06/11/03
490 06/23/0316,825 06/24/03
278,317 06/30/03(16,825) 07/03/03216,178 07/09/03508,360 07/25/03137,983 08/05/03(24,016) 08/06/03
560 08/11/03372,764 08/27/03
719 08/28/0317,691 09/02/03
(17,691) 09/04/03356,392 09/19/03
734 09/29/03 4,431,622 870,253 5,301,875 5,719,888
4 FL Solitron Microwave 2,100,000 2,100,000 500,000 09/25/03 500,000 10,840,000 2,430,000 Y 12
4 FL Tower Chemical Co. 400,000 400,000 10,000,000 1,600,000 Y 13

Non-Federal Facility Fund-Financed Remedial Actions - FY03 Enclosure 3Page 10 of 24
Region State Site Name
FY03 Amount Initially Requested
by Region
FY03 Initial Funding Plan
Amount from HQ October 2002
Funding Decision
FY03 Obligated Amount From HQ RA AOA*
Date of Obligation
Special Accounts
Date of Obligation
State SF Contracts
Date of Obligation
Total FY03 Amount
Obligated (sum ofprior 3 columns)
Total FY03 Expenditures for
Remedial Action**
Date of Expenditure
Estimated Total Costs for Remedial
Action***
Total Funds Obligated through
9/30/03
Total Funds Expended
through 9/30/03
Unexpended Balance at
9/30/03
Sufficient Funding
(Y/N) Notes4 FL Trans Circuits, Inc. 700,000 700,000 1,000,000 09/25/03 4,800,000 2,375,000 Y 14
60,000 09/29/031,060,000 1,060,000
4 GA Woolfolk Chemical Works 1,300,000 1,300,000 1,300,000 09/30/03 1,300,000 35,000,000 4,750,000 Y 15
12 TOTAL 13,050,000 13,050,000 30,744,693 1,282,253 3,516,239 35,543,185 29,051,534 212,200,000 137,584,533 59,912,417 9,252,116 Y
* - inludes prior year fund appropriation obligations** - includes amounts obligated in prior years*** - reflects estimated total costs for remedial actions for sites with Records of Decision. Some future costs may be borne by responsible parties.
x OSRTI records do not indicate a Regional request for these sites.
Notes:1 Community objections to the design delayed the start of activity. This amount reflects the amount needed to obtain consensus and modify the design.2 No 2003 Remedial Action funds requested or needed at this site. The above funds were used to pay 1996 expenditures at this site that had been previously funded from Trust account monies.3 No Remedial Action funding was needed in FY2003. Remedial Design funding was requested to cover the cost of conducting a pilot scale treatability study at the site on technologies to enhance
the removal of residual DNAPL. Remedial Action was completed in 2003.4 The region did not submit a request for funding as it expected Special Account and State Superfund Contract funds. The AOA obligation was for an unplanned need at the site.5 The region did not submit a request for funding as it expected Special Account funds.6 Increase in cost for the Coleman-Evans Remedial Action is attributable to two causes: a three fold increase in the volume of contaminated soil requiring treatment;
and, settlement of a contract dispute with the contractor performing the Remedial Action. 7 The region did not submit a request for funding as it expected State Superfund Contract funds.8 The Remedial Investigation/Feasibility Study has not been completed on this site and the site is not yet ready for Remedial Action.
The State Superfund Contract funds received were for moving the last residents from the site and maintaining the grass cover over the contaminated soil and debris.9 2003 Remedial Action allocation was for a consultant geologist from Northwinds Environmental to review and make recommendations for optimizing the groundwater “pump and treat” remedy
ongoing at the site. This site was also funded under LTRA.10 The obligation was not for 2003 Remedial Action activity at the site, it was needed to pay 2000 expenditures at this site that had been previously paid from Trust Account monies.11 Insufficient funding in prior years lead to a 15 month delay of this site. 2003 funding increased
for this site due to flooding and wet weather which delayed cleanup and maintenance crews required to stay on-site.12 Funding was reduced because of technical problems with implementing a portion of the remedy.13 No obligations for Tower Chemical could be made until late 09/03 because of problems with getting State to sign State Superfund Contract. However, RPM was still not willing to obligate
Remedial Action funds until analytical and technical problems are resolved at the site.14 The funding increase was largely due to the fact that the location of the new municipal supply well was nearly twice the distance from the water plant than what was originally estimated.15 Cleanup of Woolfolk Chemical site was originally a PRP-lead. The PRP costs are not reflected above
and are one reason for the large variance between total estimated remedial action costs and obligations to date columns.Remedial Action obligation for Woolfolk Chemical was delayed until 09/30/03 because of problems getting State to sign State Superfund Contract.
Additional:Five sites from FY02 were not listed on the FY03 spreadsheet. One was listed on the FY03 LTRA sheet as receiving funding - Elmore Waste Disposal.Hollingsworth - Funds were not required in FY03 for this site. This site is still in the Remedial Design phase.Southern Solvents - FY02 funds were for a soil vapor extraction system and treatability study. Funds were not needed in FY03. The State was unwilling to implement additional clean up action in 2003 until the prior study was completed.ABC One Hour Cleaners - Prior year funds were sufficient for FY03 actions as well.Wrigley Charcoal Plant - FY02 funding was for well replacement and debris removal. Funds were not needed in FY03.

Non-Federal Facility Fund-Financed Remedial Actions - FY03 Enclosure 3Page 11 of 24
Region State Site Name
FY03 Amount Initially
Requested by Region
FY03 Initial Funding Plan
Amount from HQ October 2002
Funding Decision
FY03 Obligated Amount From HQ RA
AOA*Date of
ObligationSpecial
AccountsDate of
ObligationState SF Contracts
Date of Obligation
Total FY03 Amount
Obligated (sum of prior 3 columns)
Total FY03 Expenditures for Remedial
Action**Date of
Expenditure
Estimated Total Costs for Remedial Action***
Total Funds Obligated through 9/30/03
Total Funds Expended
through 9/30/03
Unexpended Balance at
9/30/03
Sufficient Funding
(Y/N) Notes
5 MIAircraft Components (OU1 & 2) 4,000,000 3,848,000 550,000 12/13/02 4,186 11/14/02 5,600,000 5,822,000 2,051,438 3,770,562 Y 1
272,000 04/17/03 5 11/21/023,500,000 08/25/03 21,931 12/19/02
6 12/27/0279,761 01/15/03
237,745 02/14/03353,323 03/17/03330,819 04/16/03407,135 05/16/03415,650 06/19/03
4,119 07/15/03193,687 08/13/03
3,082 09/12/03 4,322,000 4,322,000 2,051,449
5 MNArrowhead Refinery Co (RA002) 100,000 100,000 200,000 Y 2
5 MI Bofors Nobel, Inc. x 937,069 04/08/03 937,069 Y 3
5 OH Bowers Ldfl Oh x 407,452 05/08/03 407,452 Y 4
5 MI Velsicol Chemical Corp. 11,000,000 11,000,000 4,100,000 12/26/02 3,215,210 05/06/03 1,447 10/03/02 60,000,000 46,184,355 33,924,335 12,260,020 Y 5178,234 04/16/03 2,032,256 10/18/02
3,215,210 05/30/03 922 10/24/023,973,928 07/30/03 702 11/04/02
155,000 08/20/03 897 11/05/025,340 11/08/02
1,032,130 11/14/02343,294 11/18/02
366 11/21/02264,474 12/16/02406,716 12/17/02
7,421 01/03/03189,020 01/08/03
2,402 01/13/03516,665 01/14/03
134 01/28/03(765) 01/29/03
215,223 02/13/03130,739 03/03/03
77 03/11/0364,447 03/17/03
479 03/19/0399,666 03/24/03
653 03/27/031,248 04/09/03
206,346 04/14/0329,638 05/13/0394,614 05/15/03
338 06/09/0328,546 06/12/0376,543 06/13/03
360 07/03/03553,575 07/16/03110,270 07/23/03
129 07/24/03546 08/06/03
503,766 08/14/03(6,687) 08/28/03
127,261 09/03/03(4,165) 09/04/03
1,398,820 09/12/03237 09/16/03
230,510 09/25/0311,622,372 3,215,210 14,837,582 8,666,600

Non-Federal Facility Fund-Financed Remedial Actions - FY03 Enclosure 3Page 12 of 24
Region State Site Name
FY03 Amount Initially
Requested by Region
FY03 Initial Funding Plan
Amount from HQ October 2002
Funding Decision
FY03 Obligated Amount From HQ RA
AOA*Date of
ObligationSpecial
AccountsDate of
ObligationState SF Contracts
Date of Obligation
Total FY03 Amount
Obligated (sum of prior 3 columns)
Total FY03 Expenditures for Remedial
Action**Date of
Expenditure
Estimated Total Costs for Remedial Action***
Total Funds Obligated through 9/30/03
Total Funds Expended
through 9/30/03
Unexpended Balance at
9/30/03
Sufficient Funding
(Y/N) Notes
5 INContinental Steel (RA001 and RA002) 39,100,000 N 6
5 IL Jennison Wright 12,500,000 N 7
5 MI Lower Ecorse Creek Dump 50,000 50,000 19,883 01/13/03 19,883 3,050,000 Y 8
5 MNMacgillis & Gibbs Co (RA004) 150,000 150,000 50,000 05/20/03 1,311,030 05/08/03 1,361,030 17,751,950 Y 9
5 MI Ott/Story/Cordova x 591,836 05/20/03 591,836 Y 4
5 MI Parsons Chemical 90,921 90,921 Y 10
5 MI Peerless Plating x 11,000 12/13/02 11,000 Y
5 WI Stoughton Wi x 1,000,000 05/09/03 1,000,000 Y 4
5 MI Torch Lake Mi x 506,667 05/20/03 506,667 Y 11
5 MI US Aviex (RA001) 200,000 Y 12
15 Total 67,190,921 15,238,921 16,025,255 937,069 7,032,195 23,994,519 10,718,049 86,601,950 52,006,355 35,975,773 16,030,582 N
* includes prior year fund appropriation obligations** includes amounts obligated in prior years*** reflects estimated total costs for remedial actions for sites with Records of Decision. Some future costs may be borne by responsible parties.
x OSRTI records do not indicate a Regional request for these sites.
Notes:1 Additional asbestos contamination was discovered at this site and cleanup costs increased.2 This amount was set aside to repay the state. However, EPA decided to repay the state later when LTRA ends.3 BOFORS special account money is disbursed to the PRPs performing the remedy. The source of the money is an earlier deminimis settlement with "small" PRPs who are not part of the PRP group performing the remedy.4 Region received this State Superfund Contract funding for work which was completed in another year. This site is construction complete.5 Funding was sufficient since field conditions only allow this amount of dredging.6 This site received no funding from the Prioritization Panel. The Region plans to begin a phased funding approach at this site in FY2004.
This site has been on the NPL since 1989. FY2003 funding shortfall amount: $39,100,000.7 This site received no funding from the Prioritization Panel. FY2003 funding shortfall amount: $12,500,000.8 The early estimate of $50,000 to cover newly-discovered contaminated soil was revised because only $19,883 was needed to clean up the soil.9 The Regional request was in case there were finalizations for construction and engineering costs. These were not needed. The $50,000 is for contingencies. State Superfund Contract monies are not included in Regional requests.
10 The state and EPA decided $90,921 was not needed because no more work was done at the site. 11 Region received this State Superfund Contract money for work which was completed in another year. 12 The $200,000 was an early estimate and was not needed because the State's contract contained sufficient funding to cover the site's operation.
Additional:All sites funded in FY03 appear in the above schedule.

Non-Federal Facility Fund-Financed Remedial Actions - FY03 Enclosure 3Page 13 of 24
Region State Site Name
FY03 Amount Initially Requested
by Region
FY03 Initial Funding Plan
Amount from HQ October 2002
Funding Decision
FY03 Obligated Amount From HQ
RA AOA*Date of
ObligationSpecial
AccountsDate of
ObligationState SF Contracts
Date of Obligation
Total FY03 Amount Obligated
(sum of prior 3 columns)
Total FY03 Expenditures for
Remedial Action**
Date of Expenditure
Estimated Total Costs for Remedial Action***
Total Funds Obligated through
9/30/03
Total Funds Expended
through 9/30/03
Unexpended Balance at
9/30/03
Sufficient Funding
(Y/N) Notes
6 LAAmerican Creosote Works, Inc. x 35,500 12/23/02 Y 1
7,918 01/16/03 43,418 43,418
6 LA Central Wood Preserving Co. 9,000,000 1,000,000 07/22/03 - 9,000,000 7,200,000 0 7,200,000 Y 2 4,000,000 08/25/03
2,200,000 09/29/037,200,000 7,200,000
6 TX City of Perryton Well No. 2 x 100,000 06/24/03 302,347 05/13/03 402,347 3,519,124 3,333,333 Y 3
6 LA Delatte Metals 1,000,000 726,656 05/19/03 15,758,232 15,711,999 Y 41,031,576 08/25/03
1,758,232 1,758,232
6 NM Fruit Avenue 5,000,000 4,000,000 09/03/03 4,000,000 6,050,000 4,000,000 Y 5
6 AR Gurley Pit x 685,575 08/05/03 685,575 Y
6 TX Hart Creosoting 9,880,000 N 6
6 OK Hudson Refinery 5,220,000 5,220,000 4,200,000 02/24/03 300,000 02/24/03 Y 790 02/28/03 300,000 08/26/0354 04/02/03
145 05/01/03451 07/28/03
4,200,740 600,000 4,800,740
6 TX Jasper Creosoting 6,240,000 N 8
6 LA Kriger Battery 400,000 N 9
6 LA Mallard Bay 1,000,000 750,000 06/03/03 2,687,611 2,687,611 Y 10 165,794 06/10/03 484,206 07/02/03 341,464 07/21/03 258,414 07/29/03 687,733 08/18/03
2,687,611 2,687,611
6 LA Marion Pressure Treating 9,000,000 24,500,000 N 11
6 NM North Railroad Avenue Plume 6,500,000 6,500,000 N 12
6 LA Point Coupee 300,000 N 13
6 TX RSR Corporation x 1,000,000 09/03/03 1,000,000 Y 14
6 OK S&K Industries 400,000 N 15
6 TX Sprague Rd GW 4,000,000 4,000,000 3,048,091 12/20/02 783,121 06/10/03 8,478,734 7,831,212 Y 16 357,919 09/30/03
3,406,010 783,121 4,189,131
6 TX Tex-Tin Corp. (OU4) x 150,000 02/18/03 3,150,000 3,150,000 Y 17 3,000,000 05/08/03
3,150,000 3,150,000

Non-Federal Facility Fund-Financed Remedial Actions - FY03 Enclosure 3Page 14 of 24
Region State Site Name
FY03 Amount Initially Requested
by Region
FY03 Initial Funding Plan
Amount from HQ October 2002
Funding Decision
FY03 Obligated Amount From HQ
RA AOA*Date of
ObligationSpecial
AccountsDate of
ObligationState SF Contracts
Date of Obligation
Total FY03 Amount Obligated
(sum of prior 3 columns)
Total FY03 Expenditures for
Remedial Action**
Date of Expenditure
Estimated Total Costs for Remedial Action***
Total Funds Obligated through
9/30/03
Total Funds Expended
through 9/30/03
Unexpended Balance at
9/30/03
Sufficient Funding
(Y/N) Notes6 OK Tar Creek 5,000,000 5,000,000 5,000,000 03/03/03 1,660,042 03/03/03 11,304 10/04/02 95,000,000 62,266,290 51,111,627 11,154,663 Y 18
1,070,000 07/15/03 1,405 10/07/021,232 10/16/02
299,597 10/18/02333 10/25/02120 10/29/02
1,826 10/31/021,361 11/04/02
790,434 11/14/02680 11/21/02
14,442 11/26/021,866 11/29/02
919 12/13/02475,941 12/16/02
2,521 12/24/021,952 12/31/02
523 01/02/03673 01/07/03
2,325 01/10/032,513 01/16/03
331,709 01/17/031,104 01/22/032,038 01/27/03
92 02/06/0391,815 02/10/03
356,383 02/13/03543 02/14/03951 02/18/03
1,877 02/19/03(304) 02/21/03
1,082 02/24/0345,448 02/26/03
421 02/27/03657 03/06/03
2,380 03/07/031,029 03/11/031,230 03/17/03
687 03/18/03521,999 03/21/03
1,153 03/24/03466 03/25/03192 03/27/03192 04/01/03682 04/02/03667 04/15/03
403,077 04/17/03673 04/21/03
9,330 04/24/03(27,198) 04/28/03
6,593 04/29/031,271 04/30/034,187 05/01/03
964 05/05/03762 05/06/03
1,444 05/09/03741 05/14/03
648,293 05/19/035,108 06/03/03
722 06/04/03

Non-Federal Facility Fund-Financed Remedial Actions - FY03 Enclosure 3Page 15 of 24
Region State Site Name
FY03 Amount Initially Requested
by Region
FY03 Initial Funding Plan
Amount from HQ October 2002
Funding Decision
FY03 Obligated Amount From HQ
RA AOA*Date of
ObligationSpecial
AccountsDate of
ObligationState SF Contracts
Date of Obligation
Total FY03 Amount Obligated
(sum of prior 3 columns)
Total FY03 Expenditures for
Remedial Action**
Date of Expenditure
Estimated Total Costs for Remedial Action***
Total Funds Obligated through
9/30/03
Total Funds Expended
through 9/30/03
Unexpended Balance at
9/30/03
Sufficient Funding
(Y/N) Notes6 OK Tar Creek 709 06/10/03
Continued 1,260 06/12/03960 06/16/03
407,770 06/17/03939 06/27/03
1,322 06/30/032,263 07/15/03
941 07/17/031,423,087 07/21/03
535 07/22/031,976 07/24/03
958 08/04/0386,717 08/08/03
997 08/14/031,041,818 08/18/03
1,274 08/19/031,284 08/28/03
685 09/04/03373 09/05/03
1,294 09/09/03429 09/12/03281 09/16/03836 09/17/03
1,458,055 09/19/03528 09/22/03
1,151 09/23/032,047 09/25/03
921 09/30/035,000,000 2,730,042 7,730,042 8,473,837
20 Totals 62,940,000 14,220,000 28,396,011 4,150,000 5,101,085 37,647,096 8,473,837 174,643,701 106,180,445 51,111,627 18,354,663 N
* includes prior year fund appropriation obligations** includes amounts obligated in prior years*** reflects estimated total costs for remedial actions for sites with Records of Decision. Some future costs may be borne by responsible parties.
x OSRTI records do not indicate a Regional request for these sites.
Notes:1 Region 6 stated that the funding listed here should be included with the LTRA Regional request and obligations. 2 There were no expenditures as the design for this site had to be updated. Also, the contractor began the bidding process for subcontracts in FY03, but expenses will not be incurred until FY04.3 Region had additional money so it applied it to this site to ensure funding into the first quarter of FY04.4 Additional contaminant was discovered at the site leading to additional waste disposal costs.5 RPM requested entire amount for Remedial Action, the amount obligated reflects actual costs for FY03.6 This site was not approved for funding by the Priority Panel. Estimated Total Amount For Remedial Action equals request as this site is a Non-Time Critical Removal. FY2003 funding shortfall amount: $9,880,000.7 This site did not need the full amount of the funding request.8 This site was not approved for funding by the Priority Panel. Estimated Total Amount For Remedial Action equals request as this site is a Non-Time Critical Removal. FY2003 funding shortfall amount: $6,240,000.9 This site was identified as ready for actions but it was not funded. FY2003 funding shortfall amount: $400,000.
10 Additional funding was requested to complete the action within one year.11 This site was not approved for funding by the Priority Panel. Also there were design dalays making the site not ready for FY03 RA funding. FY2003 funding shortfall amount: $9,000,000.12 This site was not approved for funding by the Priority Panel. Also there were design dalays making the site not ready for FY03 RA funding. FY2003 funding shortfall amount: $6,500,000.13 This site was identified as ready for actions but it was not funded. FY2003 funding shortfall amount: $300,000.14 Region did not request funding as it expected Special Account funding in FY03.15 This site was identified as ready for actions but it was not funded. FY2003 funding shortfall amount: $400,000.16 This site was completed for less than the estimated costs.17 Region did not request funding as it expected Special Account funding in FY03.18 Site received what they expected.
Additional:There were 3 sites funded in FY02 but not in FY03.Highland Acid Pit - site activities finished February 28, 2003, future obligations will cover operation and maintenance of the facility.Midland Products, and North Cavacade Street - remedial actions are currently under review.

Non-Federal Facility Fund-Financed Remedial Actions - FY03 Enclosure 3Page 16 of 24
Region State Site Name
FY03 Amount Initially Requested
by Region
FY03 Initial Funding Plan
Amount from HQ October 2002
Funding DecisionFY03 Obligated Amount
From HQ RA AOA* Date of ObligationSpecial
AccountsDate of
ObligationState SF Contracts
Date of Obligation
Total FY03 Amount
Obligated (sum ofprior 3 columns)
Total FY03 Expenditures for Remedial
Action**Date of
Expenditure
Estimated Total Costs for Remedial Action***
Total Funds Obligated through
9/30/03
Total Funds Expended
through 9/30/03
Unexpended Balance at
9/30/03
Sufficient Funding
(Y/N) Notes7 NE 10th Street "TC" 700,000 1,150,000 300,000 02/24/03 4,334 12/17/02 1,980,100 2,850,000 275,196 2,574,804 Y
550,000 06/03/03 2,215 01/15/03300,000 09/10/03 3,968 02/19/03
2,147 03/20/033,172 04/10/03
470 04/28/0321,033 05/15/0315,245 06/12/03
603 06/26/0312,971 07/16/03
192,052 08/18/03268 08/27/0397 09/09/03
18,058 09/19/03268 09/25/03
1,150,000 1,150,000 276,901
7 KS57th and North Broadway Streets Site x 154,899 07/31/03 154,899 Y 1
7 KS Ace Services x 572,800 72,825 03/14/03 6,805,437 Y 2500,000 07/02/03572,825 572,825
7 NE Cleburn Street Well x 69,800 07/31/03 69,800 Y 3
7 NE Hastings 2nd Street 500,000 Y 4
7 IA Mid-America Tanning Co. x 96,062 07/31/03 96,062 Y 5
7 MO Newton County Mine Tailings 1,000,000 400,000 400,000 09/30/03 400,000 Y 6
7 MO Oronogo-Duenweg OU 2 x 114,000 12/27/02 16,233 10/03/02 31,294,125 29,951,212 28,151,818 1,799,394 Y 775,034 01/23/03 23,800 10/04/02
652,167 01/28/03 21,358 10/07/02144 03/20/03 216,033 10/25/02
1,636,937 07/22/03 2,263 11/18/02168 11/26/02
29,774 11/27/024,989 11/29/02
175 12/11/02144 01/06/03
23,000 01/08/031,100 01/29/03
75,034 02/07/03202,561 02/11/03
4,663 03/05/03144 03/21/03
18,298 04/02/036,859 04/14/03
387 04/29/03170,493 05/08/03133,869 06/05/03
334 06/09/0398,201 07/10/038,168 09/30/03
2,478,282 2,478,282 1,058,048
8 TOTALS 2,200,000 2,122,800 2,122,825 2,478,282 320,761 4,921,868 1,334,949 40,079,662 32,801,212 28,427,014 4,374,198 Y
* includes prior year fund appropriation obligations** includes amounts obligated in prior years*** reflects estimated total costs for remedial actions for sites with Records of Decision. Some future costs may be borne by responsible parties.
x OSRTI records do not indicate a Regional request for these sites.

Non-Federal Facility Fund-Financed Remedial Actions - FY03 Enclosure 3Page 17 of 24
Notes:1 Region did not request FY03 funding as it expected State Superfund Contract funds.2 Funds for this site were requested under Long-Term Remedial Actions. The sum of the Long-Term and the Remedial Action obligations equal the Region's request for FY03.3 Region did not request FY03 funding as it expected State Superfund Contract funds.4 Planned funds not needed in FY03 as Investigation and site design were not yet complete.5 Region did not request FY03 funding as it expected State Superfund Contract funds.6 This site's project implementation strategy changed. The listed obligation was submitted to priority panel during the year, and the site received the obligation to begin the project.7 Region did not request FY03 funding as it expected Special Account funding.
Additional:There was one site funded in FY02 that does not appear above, Cherokee County received Pipeline Funding in FY03.

Non-Federal Facility Fund-Financed Remedial Actions - FY03 Enclosure 3Page 18 of 24
Region State Site Name
FY03 Amount Initially
Requested by Region
FY03 Initial Funding Plan
Amount from HQ October 2002
Funding Decision
FY03 Obligated Amount From HQ RA AOA*
Date of Obligation Special Accounts
Date of Obligation
State SF Contracts
Date of Obligation
Total FY03 Amount Obligated
(sum of prior 3 columns)
Total FY03 Expenditures for
Remedial Action**Date of
Expenditure
Estimated Total Costs for Remedial
Action***
Total Funds Obligated through
9/30/03
Total Funds Expended
through 9/30/03
Unexpended Balance at
9/30/03
Sufficient Funding
(Y/N) Notes8 MT Basin Mining Area 2,600,000 2,600,000 2,600,000 02/19/03 2,600,000 5,698,984 Y
8 CO Broderick Wood Products x 163,672 08/20/03 163,672 Y 1
8 CO California Gulch 2,700,000 2,700,000 25,000 12/04/02 Y 2200,000 03/07/03
340 08/20/03300,000 09/25/03
6,000 09/26/03531,340 531,340
8 CO Chemical Sales Co. x 250,000 07/22/03 250,000 Y
8 CO Denver Radium Site 10,000,000 5,000,000 1,695 05/05/03 2,900,000 09/22/03 65,449 10/16/02 45,000,000 114,564,048 98,635,088 15,928,960 Y 33,900,000 08/21/03 28,012 10/25/02
314,709 11/19/0228,074 11/20/0225,385 12/03/02
314,630 12/18/0224,172 12/30/02
1,430,893 01/13/03809 01/27/03
24,346 01/28/03304,583 01/31/03591,938 02/18/03
30,028 02/25/03661,816 03/26/03551,641 03/28/03145,705 04/10/03
38,153 04/22/03793,258 05/08/03123,605 05/09/03885,413 05/27/03
30,720 05/28/03457,358 06/11/03440,574 06/18/03
30,542 06/23/03350 07/16/03
531,318 07/22/03178,067 07/23/03413,428 07/31/03527,536 08/15/03599,035 08/26/03
41,826 08/27/03223,532 09/18/03
1,503,343 09/25/033,901,695 2,900,000 6,801,695 11,360,248
8 MT East Helena Site 475,000 475,000 Y 4
8 UT Eureka Mills x 7,200,000 09/16/03 7,200,000 62,475,310 $7,200,000 7,200,000 Y 5
8 SD Gilt Edge Mine 4,100,000 4,100,000 306,815 01/30/03 30,578,000 Y 644,000 02/26/03
700,000 03/12/03684,029 04/16/03200,000 07/16/03
1,615,971 08/04/031,400,000 08/15/03
249,185 08/22/03100,000 09/30/03
5,300,000 5,300,000

Non-Federal Facility Fund-Financed Remedial Actions - FY03 Enclosure 3Page 19 of 24
Region State Site Name
FY03 Amount Initially
Requested by Region
FY03 Initial Funding Plan
Amount from HQ October 2002
Funding Decision
FY03 Obligated Amount From HQ RA AOA*
Date of Obligation Special Accounts
Date of Obligation
State SF Contracts
Date of Obligation
Total FY03 Amount Obligated
(sum of prior 3 columns)
Total FY03 Expenditures for
Remedial Action**Date of
Expenditure
Estimated Total Costs for Remedial
Action***
Total Funds Obligated through
9/30/03
Total Funds Expended
through 9/30/03
Unexpended Balance at
9/30/03
Sufficient Funding
(Y/N) Notes8 MT Libby Asbestos Site $21,100,000 17,600,000 1,000,000 12/18/02 N 7
550,000 04/01/03600,000 04/17/03
1,000,000 05/22/03500,000 06/12/03
1,400,000 06/16/03580,011 07/09/03
2,700,000 07/14/032,100,000 07/23/032,019,990 08/25/03
419,989 09/10/031,600,000 09/16/03
900,000 09/19/03381,000 09/25/03
3,627,000 09/30/0319,377,990 19,377,990
8 CO Summitville Mine x 2,900,000 03/12/03 2,900,000 Y 8
8 MT Upper Tenmile Creek 5,000,000 3,700,000 450,000 04/30/03 73,963 06/30/03 24,363,000 N 93,250,000 05/05/033,700,000 73,963 3,773,963
11 TOTAL 45,975,000 36,175,000 42,611,025 6,123,963 163,672 48,898,660 11,360,248 168,115,294 121,764,048 98,635,088 23,128,960 N
* includes prior year fund appropriation obligations** includes amounts obligated in prior years*** reflects estimated total costs for remedial actions for sites with Records of Decision. Some future costs may be borne by responsible parties.
x OSRTI records do not indicate a Regional request for these sites.
Notes:1 The Region did not request FY03 funding as it expected State Superfund Contract funds.2 Non-Time Critical Removal was funded sufficiently, and as RA funding was not need for Cal Gulch in FY 03. Region 8 obtained authority to redirect the funds to Guilt Edge Mine. 3 The initial estimate was high, and the amount received was sufficient to keep the work going at the desired pace.4 Received these funds from the ASARCO settlement. This was a contingency request.5 This site was not in R8's initial request, but received funding late in FY 03. There were no expenditures in FY03.
The obligation on 9/16/03 was the first Remedial Action Obligation, prior funds expended were in the Removal category.6 The Region does not appear to distinguish between LTRA and RA funding. This site is sufficiently funded as combined funding for the site matches the combined requested amount.7 RPM stated that this site needed $2 million in addition to the estimate that was not requested translating into a shortfall of $3.7 million. 8 Region did not request FY03 funding as it expected Special Account funding.9 An impact of the funding shortfall is the overall delay of the project, and the increased time residents live near contamination. FY2003 funding shortfall amount: $1,300,000.
Additional:One site was listed in the FY02 sheet that is not listed in the FY03 sheet.Vasquez Boulevard and I-70 - This site received Pipeline funding in FY03.

Non-Federal Facility Fund-Financed Remedial Actions - FY03 Enclosure 3Page 20 of 24
Region State Site Name
FY03 Amount Initially
Requested by Region
FY03 Initial Funding Plan
Amount from HQ October 2002
Funding Decision
FY03 Obligated
Amount From HQ RA AOA*
Date of Obligation
Special Accounts
Date of Obligation
State SF Contracts
Date of Obligation
Total FY03 Amount Obligated
(sum of prior 3 columns)
Total FY03 Expenditures for
Remedial Action**
Date of Expenditure
Estimated Total Costs for Remedial Action***
Total Funds Obligated through
9/30/03
Total Funds Expended
through 9/30/03
Unexpended Balance at
9/30/03
Sufficient Funding
(Y/N) Notes
9 CA Del Norte Pesticide Storage x 259,468 07/07/03 259,468 Y 1
9 CA Frontier Fertilizer x 500,000 06/09/03 Y218,400 09/26/03
718,400 718,400
9 AZ Indian Bend Wash Area 135,000 135,000 100,000 12/16/03 140,000,000 23,213,453 Y 235,000 06/09/03
135,000 135,000
9 CA Iron Mountain Mine 5,000,000 5,000,000 2,000,000 02/18/03 400,000 05/12/03 377 10/04/02 990,000,000 53,929,693 38,702,208 15,227,485 Y 3600 03/14/03 100,000 09/16/03 440,031 10/09/02
2,500,000 09/16/03 1,544,462 10/21/02932 10/30/02
1,214,808 11/18/02295 12/16/02
820,847 12/18/0213,251 01/03/03
1,595,229 01/07/031,577,746 01/22/031,040,477 02/19/03
797 02/20/03917,112 03/19/03629,464 04/24/03
869 04/28/03251,307 04/30/03
1,417 05/15/03996,150 05/16/03
653 05/21/03796 06/06/03730 06/11/03
648,298 06/17/03973 07/02/03
1,525,799 07/18/031,399,310 08/15/03
881 08/21/03235,150 09/15/03826,804 09/19/03
4,500,600 500,000 5,000,600 15,684,965
9 CA Jibboom Junkyard x 283,675 07/07/03 283,675 Y 4
9 CA Lorentz Barrel & Drum x 450,275 03/31/03 450,275 7,500,000 3,334,725 Y 5
9 CAMccormick & Baxter Creosoting Co. 2,000,000 2,000,000 2,000,000 03/31/03 2,000,000 604 12/30/02 36,500,000 5,105,000 1,612,378 3,492,622 Y
10,130 03/04/03235,672 03/24/03451,540 03/31/03390,954 04/21/03
3,350 05/05/03355,044 05/19/03168,435 09/08/03
2,000,000 2,000,000 1,615,729
9 CAModesto Ground Water Contamination 520,000 520,000 520,000 07/08/03 105,000 07/08/03 625,000 26,000,000 10,882,569 Y 6
9 CANewmark Ground Water Contamination x 250 06/12/03 109,000,000 54,172,830 Y 7
21,637 03/06/0350,000 02/18/0371,887 71,887
9 Totals 7,655,000 7,655,000 7,945,887 450,275 1,148,143 9,544,305 17,300,694 1,309,000,000 150,638,270 40,314,586 18,720,107 Y
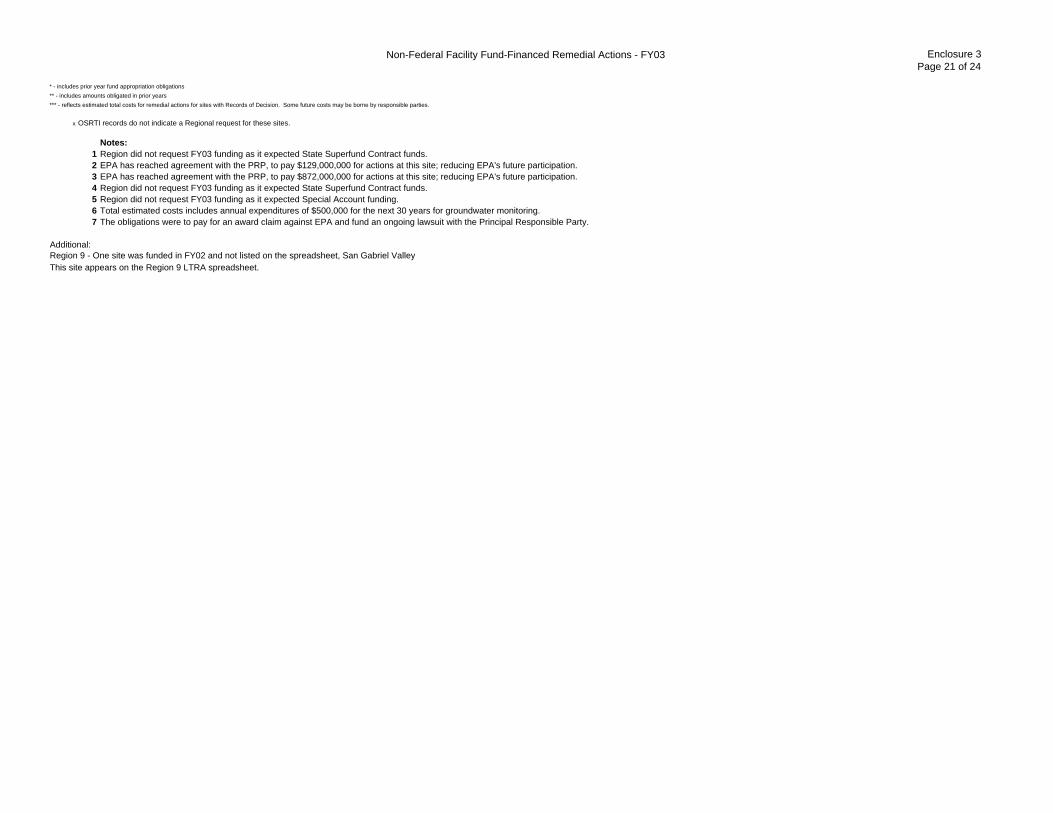
Non-Federal Facility Fund-Financed Remedial Actions - FY03 Enclosure 3Page 21 of 24
* - includes prior year fund appropriation obligations** - includes amounts obligated in prior years*** - reflects estimated total costs for remedial actions for sites with Records of Decision. Some future costs may be borne by responsible parties.
x OSRTI records do not indicate a Regional request for these sites.
Notes:1 Region did not request FY03 funding as it expected State Superfund Contract funds.2 EPA has reached agreement with the PRP, to pay $129,000,000 for actions at this site; reducing EPA's future participation.3 EPA has reached agreement with the PRP, to pay $872,000,000 for actions at this site; reducing EPA's future participation.4 Region did not request FY03 funding as it expected State Superfund Contract funds.5 Region did not request FY03 funding as it expected Special Account funding.6 Total estimated costs includes annual expenditures of $500,000 for the next 30 years for groundwater monitoring.7 The obligations were to pay for an award claim against EPA and fund an ongoing lawsuit with the Principal Responsible Party.
Additional:Region 9 - One site was funded in FY02 and not listed on the spreadsheet, San Gabriel ValleyThis site appears on the Region 9 LTRA spreadsheet.

Non-Federal Facility Fund-Financed Remedial Actions - FY03 Enclosure 3Page 22 of 24
Region State Site Name
FY03 Amount Initially
Requested by Region
FY03 Initial Funding Plan
Amount from HQ October 2002
Funding Decision
FY03 Obligated Amount From HQ RA AOA*
Date of Obligation
Special Accounts
Date of Obligation
State SF Contracts
Date of Obligation
Total FY03 Amount
Obligated (sum of prior 3 columns)
Total FY03 Expenditures for
Remedial Action**
Date of Expenditure
Estimated Total Costs for Remedial Action***
Total Funds Obligated
through 9/30/03
Total Funds Expended through
9/30/03
Unexpended Balance at
9/30/03
Sufficient Funding
(Y/N) Notes10 ID Bunker Hill Mining & Metallurgical 42,250,000 7,250,000 100,000 11/21/02 1,502,703 09/16/03 437,396 10/04/02 564,324,941 153,651,234 129,298,451 24,352,783 N 1
100,000 12/13/02 269,978 09/17/03 3,550 10/07/02100,000 05/07/03 54,497 10/08/02
5,300,000 09/16/03 13,121 10/09/027,000,000 09/17/03 (18,117) 10/11/02
708,538 09/19/03 3,550 10/16/0236,441 10/17/02
(56,402) 10/18/02230,984 10/21/02(32,793) 10/22/02141,596 11/05/0242,714 11/13/0282,155 11/14/02
(74,930) 11/19/0235,578 11/21/0299,654 11/22/02
123,918 11/25/02903 12/11/02
3,550 12/20/027,784 12/31/02
384,521 01/02/03610 01/07/03
9,133 01/08/031,507 01/09/03
16,694 01/10/0386,219 01/13/0326,275 01/14/033,550 01/21/03
(25,238) 01/24/0357,662 01/27/039,957 01/29/03
545 02/03/038,831 02/07/03
143,781 02/10/03(132,170) 02/12/03149,745 02/18/03
3,550 02/24/03190,305 02/25/03
528 02/26/03660 03/04/03
31,952 03/10/03258 03/11/03
103,033 03/12/03254 03/14/03
1,260 03/17/032,214 03/21/03
345 03/26/0322,683 03/28/03
352 04/01/03259 04/03/03
88,461 04/11/03343,790 04/15/03103,283 04/25/03(53,980) 04/30/0324,859 05/02/0368,031 05/12/03(4,882) 05/14/03
106,447 05/23/0392,805 06/06/03
165,933 06/13/0381,288 06/16/03
(66,658) 06/17/031,377 06/18/03
400 06/19/03137,599 06/26/03153,033 07/08/03
5,564 07/14/0369,259 07/17/03
220,954 07/18/033,550 07/21/03
144,929 07/23/03137 07/28/03590 08/04/03

Non-Federal Facility Fund-Financed Remedial Actions - FY03 Enclosure 3Page 23 of 24
Region State Site Name
FY03 Amount Initially
Requested by Region
FY03 Initial Funding Plan
Amount from HQ October 2002
Funding Decision
FY03 Obligated Amount From HQ RA AOA*
Date of Obligation
Special Accounts
Date of Obligation
State SF Contracts
Date of Obligation
Total FY03 Amount
Obligated (sum of prior 3 columns)
Total FY03 Expenditures for
Remedial Action**
Date of Expenditure
Estimated Total Costs for Remedial Action***
Total Funds Obligated
through 9/30/03
Total Funds Expended through
9/30/03
Unexpended Balance at
9/30/03
Sufficient Funding
(Y/N) Notes10 ID Bunker Hill Mining & Metallurgical 298,767 08/06/03
Continued 279,110 08/07/03197,382 08/11/03
3,066 08/12/03(6,788) 08/13/033,550 08/14/03
470,709 08/20/0348,964 08/26/0315,643 08/28/03
131,996 08/29/03399 09/05/03
585,576 09/11/03317,633 09/12/03
(1,088) 09/15/0317,257 09/16/03
333,954 09/17/03251 09/19/03188 09/24/03
176,133 09/25/03226,395 09/26/03121,411 09/29/03
302 09/30/0313,308,538 1,772,681 15,081,219 7,142,003
10 WA Frontier Hard Chrome, Inc. 4,000,000 4,000,000 215,743 01/27/03 280,000 10/04/02 7,049,743 7,049,743 1,951,759 5,097,984 Y 2124,000 02/03/03 7,555 12/19/02
2,500,000 02/24/03 10,391 01/15/033,680,000 05/09/03 215,743 01/27/03
10,567 02/14/039,093 03/17/03
36 03/24/0320,824 04/16/03
145 04/18/03153,515 05/16/03
36 05/23/0323,420 06/19/03
108,251 07/15/0367 07/28/03
321,177 08/13/03791,329 09/12/03
70 09/29/036,519,743 6,519,743 1,952,219
10 ORMcCormick & Baxter Creosoting Co. 5,087,700 498,733 225,000 09/29/03 225,000 30,900,000 14,700,000 N 3
10 OR Northwest Pipe & Casing 4,000,000 4,000,000 10 12/02/02 10,000 03/31/03 6,103,721 6,103,721 Y 41,650 04/22/03 450,000 06/16/03
75 04/24/032,126,353 06/16/03
237,368 06/17/03195 08/28/03
59,475 09/08/03106 09/17/03123 09/29/03
2,425,355 460,000 2,885,355
10 WA Pacific Sound Resources x 5,650,000 06/02/03 5,650,000 Y 5
10 WA Palermo Well Field x 10,000 11/21/02 10,000 784,431 784,431 Y 6
10 WA Wyckoff Co./Eagle Harbor x 800,000 02/24/03 500,000 09/16/03 125,412,744 52,912,744 Y 715,000 03/31/03
235,000 05/07/03540,744 06/30/03
1,322,000 09/16/032,912,744 500,000 3,412,744
8 Totals 55,337,700 15,748,733 22,488,636 10,795,425 500,000 33,784,061 9,094,222 734,575,580 235,201,873 131,250,210 29,450,768 N

Non-Federal Facility Fund-Financed Remedial Actions - FY03 Enclosure 3Page 24 of 24
** - includes amounts obligated in prior years* - includes prior year fund appropriation obligations*** - reflects estimated total costs for remedial actions for sites with Records of Decision. Some future costs may be borne by responsible parties.
x OSRTI records do not indicate a Regional request for these sites.
NOTES1 A new operable unit start at this site was not sufficiently funded. FY2003 funding shortfall amount: $22,729,781.2 Site needed more funding than was estimated.3 A portion of this site was a new start, however, the Priority Panel did not issue funding. FY2003 funding shortfall amount: $4,727,300.4 Site needed less funding than was estimated.5 Site received only Special Accounts funding, so it was not included in funding requests. 6 No funding needs were anticipated, however, $10,000 was needed to settle a contractor dispute.7 The region did not submit a request for funding as it expected Special Account and State Superfund Contract funds.
Additional:All sites funded in FY03 appear in the above schedule.

ENCLOSURE 4 - NON-FEDERAL FACILITY FUND-FINANCED LONG-TERM RESPONSE ACTIONS - FY 2003

Non-Federal Facility Fund-financed Long-Term Response Actions - FY03 Enclosure 4Page 1 of 12
Region State Site Name
FY03 Amount Initially Requested
by Region
FY03 Initial Funding Plan Amount from HQ October 2002 Funding Decision
FY03 Obligated Amount From HQ
RA AOA*Date of
Obligation Special AccountsDate of
Obligation State SF ContractsDate of
Obligation
Total FY03 Amount Obligated (sum of prior 3 columns)
Sufficient Funding
(Y/N) Notes1 MA Baird & McGuire x 300,067 01/30/03 Y
350,000 09/29/03 1650,067 650,067
1 MACharles-George Reclamation Landfill 310,000 310,000 Y 2
1 ME Eastern Surplus x 1,200,000 06/25/03 1,200,000 Y 3
1 MA Groveland Wells 540,000 540,000 540,000 02/25/03 540,000 Y
1 NH Kearsarge Metallurgical Co 300,000 300,000 1,062,612 04/24/03 1,062,612 Y 4
1 NHKeefe Environmental Services x 350,350 09/09/03 350,350 Y 5
1 NH Mottolo Pig Farm 5,000 5,000 2,120 04/02/03 1,200 04/02/03 3,320 Y 6
1 NHSavage Municipal Water Supply 450,000 450,000 500,032 08/27/03 500,032 Y 7
1 MA Silresim Chemical Corp. x 100,000 03/10/03 Y 8210,000 06/20/03310,000 310,000
9 Totals 1,605,000 1,605,000 1,604,732 2,360,382 651,267 4,616,381 Y
* - inludes prior year fund appropriation obligations
x OSRTI records do not indicate a Regional request for these sites.
Notes:1 No FY03 request due to State Superfund Contract funding. Though received late in the FY, funds were sufficient to complete FY03 activities.2 The Regional Project Officer reevaluated the contract needs and determined that funds were not needed this year.3 No FY03 request due to Special Account funding.4 Additional funds were needed for an optimization project and a five-year review.5 No FY03 request due to Special Account funding. Though received late in the FY, funds were sufficient to complete FY03 activities.6 Actual funding need was less than anticipated.7 Additional funds were needed for an optimization project.8 No FY03 request due to Special Account funding.
Additional:All sites funded in FY02 appear in the above schedule.

Non-Federal Facility Fund-Financed Long-Term Response Actions - FY03 Enclosure 4Page 2 of 12
Region State Site NameFY03 Amount Initially Requested by Region
FY03 Initial Funding Plan Amount from HQ October 2002 Funding Decision
FY03 Obligated AmountFrom HQ RA AOA*
Date of Obligation Special Accounts Date of Obligation State SF Contracts
Date of Obligation
Total FY03 Amount Obligated (sum of prior 3 columns)
Sufficient Funding
(Y/N) Notes2 NJ Bog Creek Farm 1,000,000 1,000,000 200,000 04/10/03 100,000 09/25/03 Y 1
800,000 09/25/03 1,000,000 100,000 1,100,000
2 NY Brewster Well Field 600,000 600,000 600,000 03/07/03 600,000 Y
2 NY Circuitron Corp. 585,000 585,000 585,000 09/11/03 585,000 Y 1
2 NY Claremont Polychemical 1,000,000 1,000,000 1,000,000 05/06/03 1,000,000 Y
2 NJ Garden State Cleaners Co. 450,000 450,000 450,000 05/06/03 50,000 05/06/03 500,000 Y
2 NJ Higgins Farm 1,500,000 1,500,000 1,500,000 04/25/03 1,500,000 Y
2 NJ Lang Property 1,170,000 1,170,000 1,040,000 09/08/03 260,000 09/08/03 1,300,000 Y 1
2 NJ Lipari Landfill x 4,100,000 02/25/03 4,100,000 Y 2
2 NY SMS Instruments, Inc. 350,000 350,000 350,000 01/08/03 350,000 Y
2 NJ South Jersey Clothing Co. 450,000 450,000 450,000 05/06/03 50,000 05/06/03 500,000 Y
2 NYStanton Cleaners Area Ground Water Cont. 650,000 650,000 370,000 05/16/03 Y
280,000 09/17/03 650,000 650,000
2 NY Vestal Water Supply Well 750,000 750,000 750,000 09/04/03 750,000 Y 1
2 NJ Vineland Chemical Co., Inc. - Groundwater Operable Unit 4,000,000 4,000,000 3,200,000 06/04/03 3,200,000 Y 3
13 Totals 12,505,000 12,505,000 11,575,000 4,100,000 460,000 16,135,000 Y
* - inludes prior year fund appropriation obligations
x OSRTI records do not indicate a Regional request for these sites.
Notes:1 Though recevied late in the fiscal year, funds were sufficient for FY03 activities.2 No funds requested for FY03 as this site has a $19 million trust fund settlement designated.3 The $800,000 difference was diverted to another site. The movement of funds did not affect FY03 activities as the money had been allocated for pump & treat work scheduled for FY04.
Additional:Two sites received funding in FY02 but did not in FY03. They are Ellis Property and American Thermostat.Both sites received enough funding in FY02 to continue activities through FY03.

Non-Federal Facility Fund-Financed Long-Term Response Actions - FY03 Enclosure 4Page 3 of 12
Region State Site Name
FY03 Amount Initially
Requested by Region
FY03 Initial Funding Plan Amount from HQ October 2002 Funding Decision
FY03 Obligated Amount From HQ
RA AOA*Date of
ObligationSpecial
AccountsDate of
ObligationState SF Contracts
Date of Obligation
Total FY03 Amount Obligated (sum of prior 3 columns)
Sufficient Funding
(Y/N) Notes
3 PAA.I.W. Frank/Mid-County Mustang 275,000 275,000 150,000 09/29/03 150,000 Y 1
3 PA Berks Sand Pit 200,000 200,000 155,700 07/23/03 44,300 07/23/03 200,000 Y
3 PA Butz Landfill 200,000 200,000 15,000 11/19/02 Y188,000 09/29/03203,000 203,000
3 PA Croydon TCE 250,000 250,000 212,983 09/27/03 37,017 09/27/03 250,000 Y 2
3 PA Cryochem, Inc. 250,000 250,000 47,984 02/03/03 Y 3150,000 07/02/03197,984 197,984
3 VA Greenwood Chemical Co. 500,000 500,000 240,000 02/25/03 Y 4760,000 09/27/03
1,000,000 1,000,000
3 PA Havertown PCP 1,000,000 1,000,000 400,000 12/20/02 Y413,941 04/17/03 186,059 04/17/03813,941 186,059 1,000,000
3 PAHellertown Manufacturing Co. 260,000 260,000 130,000 12/18/02 Y
130,000 06/05/03260,000 260,000
3 PA North Penn - Area 1 21,000 21,000 0 Y 5
3 PA North Penn - Area 6 550,000 550,000 550,000 09/27/03 550,000 Y 6
10 Totals 3,506,000 3,506,000 3,543,608 0 267,376 3,810,984 Y
* - includes prior year fund appropriation obligations

Non-Federal Facility Fund-Financed Long-Term Response Actions - FY03 Enclosure 4Page 4 of 12
Notes:1 The RPM lowered the required amount during the year when better information regarding actual costs was obtained.
Though funds were received late in the fiscal year, activities were not delayed or interrupted.2 Though funds were received late in the fiscal year, activities were not delayed or interrupted.3 The RPM lowered the required amount during the year when better information regarding actual costs was obtained.4 The RPM asked for additional monies for unplanned construction.5 The RPM did to need these planned funds as prior activities have not been completed as yet.6 Though funds were received late in the fiscal year, activities were not delayed or interrupted.
Additional:All sites funded in FY02 appear in the above schedule.

Non-Federal Facility Fund-Financed Long-Term Response Actions - FY03 Enclosure 4Page 5 of 12
Region State Site Name
FY03 Amount Initially Requested
by Region
FY03 Initial Funding Plan
Amount from HQ October 2002
Funding Decision
FY03 Obligated Amount From HQ
RA AOA*Date of
ObligationSpecial
AccountsDate of
ObligationState SF Contracts
Date of Obligation
Total FY03 Amount Obligated
(sum of prior 3 columns)
Sufficient Funding
(Y/N) Notes4 NC Benfield Industries, Inc x 100,000 09/29/03 100,000 Y 1
4 KY Distler Brickyard x 4,000 03/19/03 4,000 Y 2
4 SC Elmore Waste Disposal 500,000 500,000 500,000 09/25/03 500,000 Y 3
4 NC FCX, Inc. (Statesville Plant) x 300,000$ 02/03/03 300,000 Y 4
4 SC Palmetto Wood Preserving 150,000 150,000 150,000 03/28/03 Y 5175,000 04/17/03100,000 09/30/03425,000 425,000
5 Totals 650,000 650,000 1,025,000 4,000 300,000 1,329,000 Y
* - inludes prior year fund appropriation obligations
x OSRTI records do not indicate a Regional request for these sites.
Notes:1 RPM indicated that no LTRA operating funds were requested thus far in 2003 for Benefiled site. However, RA money was requested for installation of additional extraction wells.
The RA money was obligated as LTRA funds, thus they are shown here. Carryover LTRA operating funds were sufficient for 2003 expenses. 2 RPM indicated that LTRA activities are undertaken by the State on this site under a Fund-Financed State-Lead Cooperative Agreement which currently has sufficient money. 3 2002 funding was sufficient through 2003 for LTRA operation. This $500,000 obligation will ensure adequate funding through 2006.4 No FY03 request due to State Superfund Contract funding. 5 The $150,000 estimate was inadvertantly entered into CERCLIS, actual LTRA operating costs are in excess of $325,000 per year.
The increase in funding was made to cover the actual operating cost of the system.
Additional:All sites funded in FY02 appear in the above schedule.

Non-Federal Facility Fund-Financed Long-Term Response Actions - FY03 Enclosure 4Page 6 of 12
Region State Site Name
FY03 Amount Initially
Requested by Region
FY03 Initial Funding Plan
Amount from HQ October 2002
Funding Decision
FY03 Obligated Amount From HQ RA
AOA*Date of
ObligationSpecial
AccountsDate of
ObligationState SF Contracts
Date of Obligation
Total FY03 Amount Obligated
(sum of prior 3 columns)
Sufficient Funding
(Y/N) Notes
5 MN Arrowhead Refinery (LR001) 80,000 80,000 Y 1
5 WI Better Brite Plating Chrome 175,000 175,000 Y 2
5 IN Douglass Road/Uniroyal 200,000 200,000 200,000 06/19/03 Y 375,000 08/20/0385,000 09/26/03
360,000 360,000
5 MNMacGillis & Gibbs Co.(LR006) 1,300,000 1,300,000 245,635 12/26/02 Y 4
283,365 01/22/03721,000 08/07/03300,000 08/20/03179,000 09/26/03
1,729,000 1,729,000
5 WI Oconomowoc Electroplating 675,000 675,000 71,844 03/24/03 Y575,000 09/26/03646,844 646,844
5 WI Onalaska Municipal Landfill 200,000 200,000 Y 5
5 MIOtt/Story/Cordova Chemical (LR001) 3,000,000 3,000,000 2,500,000 07/30/03 2,500,000 Y 6
5 MI Peerless Plating (LR001) 375,000 375,000 375,000 12/13/02 Y200,000 07/31/03 7575,000 575,000
5 WI Penta Wood Products 500,000 500,000 150,000 04/04/03 Y 81,075,000 08/20/031,225,000 1,225,000
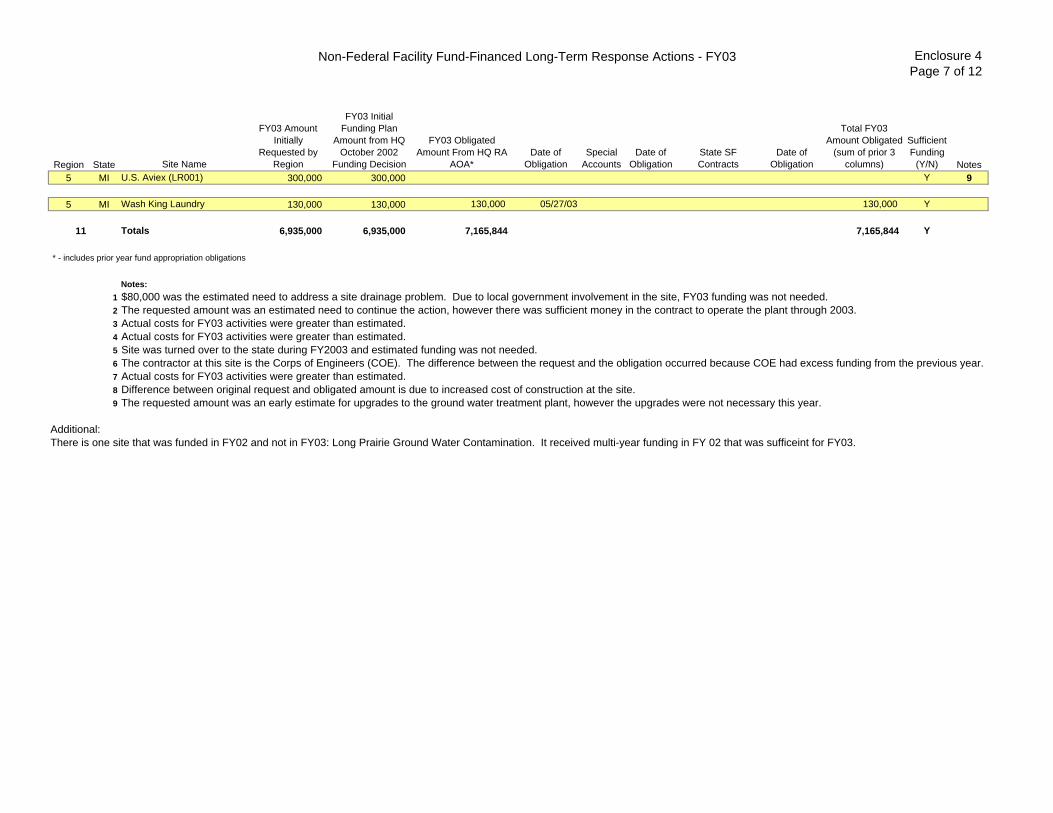
Non-Federal Facility Fund-Financed Long-Term Response Actions - FY03 Enclosure 4Page 7 of 12
Region State Site Name
FY03 Amount Initially
Requested by Region
FY03 Initial Funding Plan
Amount from HQ October 2002
Funding Decision
FY03 Obligated Amount From HQ RA
AOA*Date of
ObligationSpecial
AccountsDate of
ObligationState SF Contracts
Date of Obligation
Total FY03 Amount Obligated
(sum of prior 3 columns)
Sufficient Funding
(Y/N) Notes5 MI U.S. Aviex (LR001) 300,000 300,000 Y 9
5 MI Wash King Laundry 130,000 130,000 130,000 05/27/03 130,000 Y
11 Totals 6,935,000 6,935,000 7,165,844 7,165,844 Y
* - includes prior year fund appropriation obligations
Notes:1 $80,000 was the estimated need to address a site drainage problem. Due to local government involvement in the site, FY03 funding was not needed.2 The requested amount was an estimated need to continue the action, however there was sufficient money in the contract to operate the plant through 2003.3 Actual costs for FY03 activities were greater than estimated.4 Actual costs for FY03 activities were greater than estimated.5 Site was turned over to the state during FY2003 and estimated funding was not needed.6 The contractor at this site is the Corps of Engineers (COE). The difference between the request and the obligation occurred because COE had excess funding from the previous year.7 Actual costs for FY03 activities were greater than estimated.8 Difference between original request and obligated amount is due to increased cost of construction at the site.9 The requested amount was an early estimate for upgrades to the ground water treatment plant, however the upgrades were not necessary this year.
Additional:There is one site that was funded in FY02 and not in FY03: Long Prairie Ground Water Contamination. It received multi-year funding in FY 02 that was sufficeint for FY03.

Non-Federal Facility Fund-Financed Long-Term Response Actions - FY03 Enclosure 4Page 8 of 12
Region State Site Name
FY03 Amount Initially Requested
by Region
FY03 Initial Funding Plan Amount from HQ October 2002 Funding Decision
FY03 Obligated Amount From HQ
RA AOA*Date of
ObligationSpecial
AccountsDate of
ObligationState SF Contracts
Date of Obligation
Total FY03 Amount Obligated (sum of prior 3 columns)
Sufficient Funding
(Y/N) Notes6 LA American Creosote 715,000 715,000 41,691 04/22/03 Y 1
422,240 08/25/03 463,931 463,931
6 NM Cimarron Mining 150,000 150,000 100,000 09/23/03 100,000 Y 2
6 OK Double Eagle 62,500 62,500 08/21/03 62,500 Y
6 OK Fourth Street 137,500 137,500 62,500 08/21/03 62,500 Y 3
6 TX Odessa Chromium 485,000 Y 4
5 Totals 1,550,000 1,002,500 626,431 62,500 688,931 Y
* - includes prior year fund appropriation obligations
Notes:1 Due to changes in the current contract, funds required for FY03 were reduced. 2 There is a dispute with the State over the remedy. Actual costs for FY03 activities were less than estimated.3 The estimate for this site for FY03 was higher than actual costs for FY03 activities.4 Prior to the start of FY03, the Region determined that FY03 activities could be funded through a previous Cooperative Agreement.
Additional:All sites funded in FY02 appear in the above schedule.
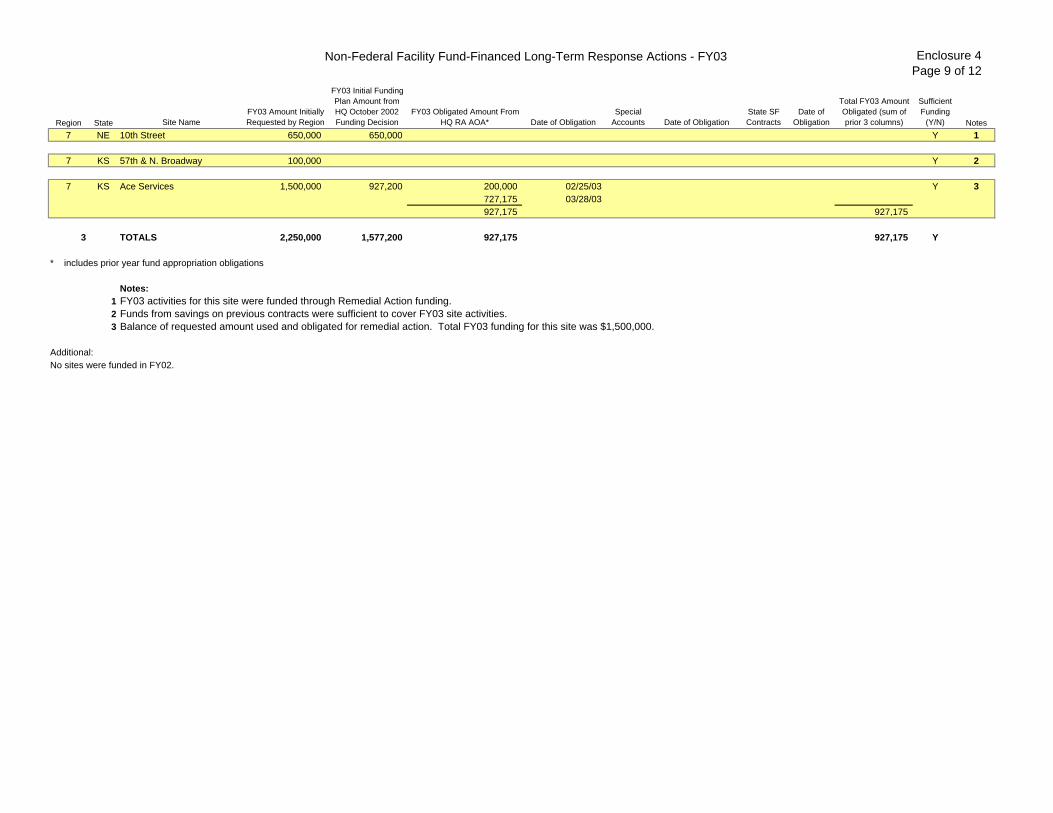
Non-Federal Facility Fund-Financed Long-Term Response Actions - FY03 Enclosure 4Page 9 of 12
Region State Site NameFY03 Amount Initially Requested by Region
FY03 Initial Funding Plan Amount from HQ October 2002 Funding Decision
FY03 Obligated Amount From HQ RA AOA* Date of Obligation
Special Accounts Date of Obligation
State SF Contracts
Date of Obligation
Total FY03 Amount Obligated (sum of prior 3 columns)
Sufficient Funding
(Y/N) Notes7 NE 10th Street 650,000 650,000 Y 1
7 KS 57th & N. Broadway 100,000 Y 2
7 KS Ace Services 1,500,000 927,200 200,000 02/25/03 Y 3727,175 03/28/03927,175 927,175
3 TOTALS 2,250,000 1,577,200 927,175 927,175 Y
* includes prior year fund appropriation obligations
Notes:1 FY03 activities for this site were funded through Remedial Action funding. 2 Funds from savings on previous contracts were sufficient to cover FY03 site activities.3 Balance of requested amount used and obligated for remedial action. Total FY03 funding for this site was $1,500,000.
Additional:No sites were funded in FY02.

Non-Federal Facility Fund-Financed Long-Term Response Actions - FY03 Enclosure 4 Page 10 of 12
Region State Site Name
FY03 Amount Initially
Requested by Region
FY03 Initial Funding Plan Amount from HQ October 2002 Funding Decision
FY03 Obligated Amount From HQ
RA AOA*Date of
Obligation Special AccountsDate of
ObligationState SF Contracts
Date of Obligation
Total FY03 Amount Obligated (sum of prior 3 columns)
Sufficient Funding
(Y/N) Notes
8 CO Central City, Clear Creek 1,100,000 1,100,000 600,000 03/24/03 600,000 Y 1
8 CO Chemical Sales Co. x 250,000 12/09/02 250,000 Y 2
8 SD Gilt Edge Mine 2,450,000 2,450,000 250,000 12/20/02 Y 3
400,000 02/26/03
300,000 06/03/03
950,000 950,000
8 CO Summitville Mine x 384,860 04/14/03 Y 4315,000 06/05/03200,000 09/10/03899,860 899,860
4 TOTAL 3,550,000 3,550,000 1,550,000 1,149,860 2,699,860 Y
* includes prior year fund appropriation obligations
x OSRTI records do not indicate a Regional request for these sites.
Notes:1 $500,000 was diverted to Gilt Edge Mine with approval from OSTRI. This action was due to an over estimate of what Central City really required in FY 03.2 No funds were requested because this site was funded with Special Accounts.3 Region 8 does not appear to distinguish between LTRA and RA funding. This site is sufficiently funded as combined funding for the site matches the combined requested amount. 4 No funds were requested because this site was funded with Special Accounts.
Additional:All sites funded in FY02 appear in the above schedule.

Non-Federal Facility Fund-Financed Long-Term Response Actions - FY03 Enclosure 4Page 11 of 12
Region State Site Name
FY03 Amount Initially
Requested by Region
FY03 Initial Funding Plan Amount from HQ October 2002 Funding Decision
FY03 Obligated Amount From HQ RA AOA*
Date of Obligation
Special Accounts
Date of Obligation
State SF Contracts
Date of Obligation
Total FY03 Amount Obligated (sum of prior 3 columns)
Sufficient Funding
(Y/N) Notes
9 CASan Gabriel Valley Area 1 - W.Narrows 1,200,000 1,200,000 Y 1
9 CANewmark Ground Water Contamination 500,000 500,000 200,000 03/19/03 Y 2
249,750 07/09/03 449,750 449,750
9 CA Selma Treating Co. 500,000 500,000 Y 3
3 Total 2,200,000 2,200,000 449,750 449,750 Y
* includes prior year fund appropriation obligations
Notes:1 RPM had carry over money from prior year, funding was not needed in FY03.2 Additional $50,000 requested was funded through RAC bulk-funded contract in FY 2003.3 Recovered response and oversight costs were sufficient to fund FY03 activities.
The sampling and modelling needed for decisionmaking did not progress to the point where R9 was able to make decisions on placement of new extraction wells planned for FY03. The new monitoring wells are now planned for later in FY 2004.
Additional:One site was funded in 2002 but not in 2003: Fairchild Semiconductor Corp. (CAD95989778). In FY 2003, EPA received $178,183.60 in recovered response and oversight costs. This money was used in a special account "09M6" to fund site-related costs (i.e., oversight) instead of relying on Trust Fund money. In FY 2004, EPA anticipates receipt of approximately $335,000 of recovered response and oversight costs, which will be placed in the special account "09M6".

Non-Federal Facility Fund-Financed Long-Term Response Actions - FY03 Enclosure 4Page 12 of 12
Region State Site Name
FY03 Amount Initially
Requested by Region
FY03 Initial Funding Plan Amount from HQ October 2002 Funding Decision
FY03 Obligated Amount From HQ RA AOA*
Date of Obligation
Special Accounts
Date of Obligation
State SF Contracts
Date of Obligation
Total FY03 Amount Obligated (sum of prior 3 columns)
Sufficient Funding
(Y/N) Notes
10 WACommencement Bay, South Tacoma Channel 2,000,000 2,000,000 759 03/06/03 759 Y 1
10 OR McCormick & Baxter Creosoting Co. 289,383 289,383 Y 2
10 OR Northwest Pipe & Casing 150,000 150,000 Y 2
3 Totals 2,439,383 2,439,383 759 759 Y
* - includes prior year fund appropriation obligations
NOTES1 Funding not needed in FY 2003 because funding was carried over from FY 2002, $759 was a small award fee.2 These two sites were behind schedule and not ready for Long Term Response funding. They both received funding for ongoing remedial actions.
Additional:All sites funded in FY02 appear in the above schedule.
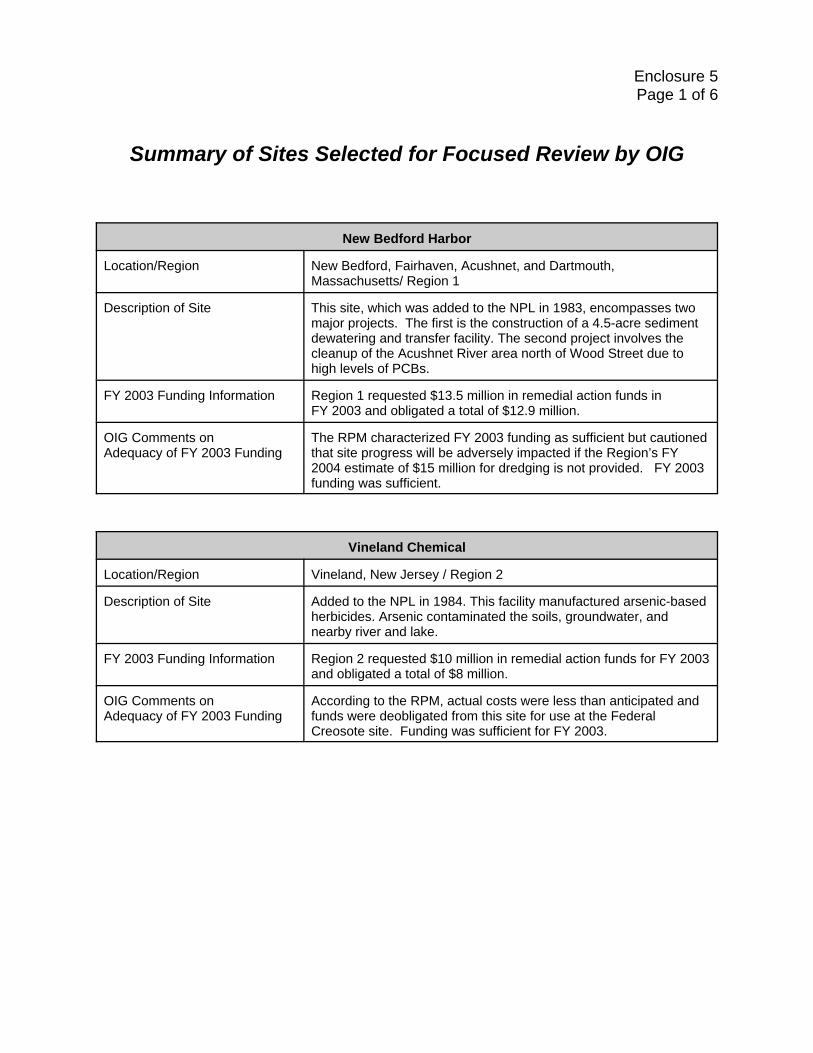
Enclosure 5Page 1 of 6
Summary of Sites Selected for Focused Review by OIG
New Bedford Harbor
Location/Region New Bedford, Fairhaven, Acushnet, and Dartmouth,Massachusetts/ Region 1
Description of Site This site, which was added to the NPL in 1983, encompasses twomajor projects. The first is the construction of a 4.5-acre sedimentdewatering and transfer facility. The second project involves thecleanup of the Acushnet River area north of Wood Street due tohigh levels of PCBs.
FY 2003 Funding Information Region 1 requested $13.5 million in remedial action funds inFY 2003 and obligated a total of $12.9 million.
OIG Comments on Adequacy of FY 2003 Funding
The RPM characterized FY 2003 funding as sufficient but cautionedthat site progress will be adversely impacted if the Region’s FY2004 estimate of $15 million for dredging is not provided. FY 2003funding was sufficient.
Vineland Chemical
Location/Region Vineland, New Jersey / Region 2
Description of Site Added to the NPL in 1984. This facility manufactured arsenic-basedherbicides. Arsenic contaminated the soils, groundwater, andnearby river and lake.
FY 2003 Funding Information Region 2 requested $10 million in remedial action funds for FY 2003and obligated a total of $8 million.
OIG Comments on Adequacy of FY 2003 Funding
According to the RPM, actual costs were less than anticipated andfunds were deobligated from this site for use at the FederalCreosote site. Funding was sufficient for FY 2003.

Enclosure 5Page 2 of 6
Welsbach & General Gas Mantle
Location/Region Camden and Gloucester City, New Jersey / Region 2
Description of Site Added to the NPL in 1996. Facilities at this site manufactured gasmantles using thorin, a radionuclide that emits gamma radiationduring decay.
FY 2003 Funding Information Region 2 requested $15.7 million in remedial action funds forFY 2003 and obligated $20.5 million.
OIG Comments on Adequacy of FY 2003 Funding
Despite obligating more funds than estimated, the RPM stated thatfunding for this site was not sufficient. The extent of contaminationwas greater than expected. As a result, work was slowed downduring FY 2003 at the primary work site and postponed at otherareas. The RPM estimated an additional $7 million was needed forFY 2003. Funding was not sufficient for this site.
American Creosote
Location/Region Pensacola, Florida / Region 4
Description of Site This wood treating facility was added to the NPL in 1983. Majorcontaminants in the soil, sediment, and groundwater includedVolatile Organic Compounds and dioxin.
FY 2003 Funding Information Region 4 initially requested $3 million in remedial action funds forFY 2003 and obligated $300,000.
OIG Comments on Adequacy of FY 2003 Funding
Community disagreement concerning the site’s future useprevented planned remedial actions from occurring. Region 4expects to implement remedial action activities in 2004/2005consistent with the future use of the property. The site was notimpacted by funding concerns in FY 2003. According to the RPM,the site does not present an immediate danger to human health. FY 2003 funding was sufficient.

Enclosure 5Page 3 of 6
Coleman-Evans
Location/Region Whitehouse, Florida / Region 4
Description of Site This wood preserving facility was added to the NPL in 1983. Soil,sediment, and shallow groundwater in the residential area adjacentto the site was found to be contaminated with dioxin.
FY 2003 Funding Information Region 4 requested $4.9 million in remedial action funds forFY 2003 and obligated a total of $21 million.
OIG Comments on Adequacy of FY 2003 Funding
The RPM indicated that more funds were needed than originallyestimated to address a three-fold increase in the volume ofcontaminated soil and for the settlement of a contract disputeinvolving $13 million. FY 2003 funding was sufficient for this site.
Tower Chemical
Location/Region Lake County, Florida / Region 4
Description of Site This abandoned pesticide manufacturing facility was added to theNPL in 1983. The site is located in a mixed agricultural, industrial,and residential area. High levels of DDT and other contaminantswere found at the main facility. Groundwater plumes of pesticidesand other organic contaminants exist on site.
FY 2003 Funding Information Region 4 requested and received $400,000 in remedial funds butthe site was not ready for remedial action. Instead, Region 4obligated $500,800 of pipeline funds during FY 2003.
OIG Comments on Adequacy of FY 2003 Funding
The RPM indicated that funding was not a concern at this site forFY 2003. Technical problems and characterization of thecontaminants must be done before the remedial action canproceed. Work will be funded from State Superfund contract funds. FY 2003 funding was sufficient.
Woolfolk Chemical
Location/Region Fort Valley, Georgia / Region 4
Description of Site This facility, which manufactured pesticides, herbicides, andinsecticides, was added to the NPL in 1990.
FY 2003 Funding Information Region 4 requested and obligated $1.3 million in FY 2003.
OIG Comments on Adequacy of FY 2003 Funding
According to the RPM, funds were sufficient to resolve problemswith the groundwater treatment facility and for determining theextent of the plume to be treated. Delays were due to negotiationand litigation with PRPs and not to lack of funding. FY 2003 fundingwas sufficient.

Enclosure 5Page 4 of 6
Velsicol
Location/Region St. Louis, Michigan / Region 5
Description of Site From 1936 until 1978, the Velsicol Chemical Corporation producedvarious chemical compounds. Groundwater, soil, and sediments ofthe Pine River are contaminated with various chemicals.
FY 2003 Funding Information Region 5 requested $11 million and obligated $19 million inFY 2003.
OIG Comments on Adequacy of FY 2003 Funding
FY 2003 funding was sufficient for this site.
Sprague Road
Location/Region Ector County, Texas / Region 6
Description of Site Site was added to the NPL in 1997. Past chrome plating operationsare potential sources of a groundwater contaminant plumecontaining chromium. The groundwater serves as a source ofdrinking water.
FY 2003 Funding Information Region 6 requested $4 million of remedial action funds for FY 2003and obligated $4.1 million.
OIG Comments on Adequacy of FY 2003 Funding
FY 2003 funding was sufficient.
Tar Creek
Location/Region Ottowa County, Oklahoma / Region 6
Description of Site This site, which represents multiple mining facilities, was added tothe NPL in 1983. The primary pollutants are lead, cadmium, andzinc.
FY 2003 Funding Information For FY 2003, Region 6 requested $5 million and obligated$7.7 million.
OIG Comments on Adequacy of FY 2003 Funding
FY 2003 funding was sufficient.

Enclosure 5Page 5 of 6
Upper Ten Mile Creek
Location/Region Helena, Montana / Region 8
Description of Site A mining area affected by lead and arsenic contamination. Theprimary focus of remedial action is the cleanup of waste in closeproximity to the water source.
FY 2003 Funding Information Region 8 requested $ 5million and obligated $3.7 million in FY2003.
OIG Comments on Adequacy of FY 2003 Funding
The RPM indicated additional funds were needed. The additionalfunds could have cleaned up two additional areas, and began theinstallation of an alternate water supply and treatment system. FY 2003 funding was not sufficient. The RPM further indicated thatthe Record of Decision, which contains a 10-year time frame forcleanup, was impacted by limited funding. The RPM stated thework could be completed sooner if additional funds were available.
Libby
Location/Region Libby, Montana / Region 8
Description of Site This is a large removal action being funded with remedial funds.Primary concern at this site is the cancer risk from exposure toasbestos.
FY 2003 Funding Information Region 8 obligated $19.4 million during FY 2003.
OIG Comments on Adequacy of FY 2003 Funding
According to the RPM, funding is not sufficient to address alloperable units and completely characterize site conditions. Workwas “scaled back” at this site. Instead of analyzing all the samplescollected, EPA analyzed the minimum number to gain anunderstanding of site conditions. FY 2003 funding was notsufficient at this site.
Indian Bend
Location/Region Maricopa County, Arizona / Region 9
Description of Site Site was added to the NPL in 1983. Numerous industrial facilitiesdisposed of industrial solvents directly onto the ground or in drywells contaminating the soil and groundwater
FY 2003 Funding Information Region 9 requested and obligated $135,000 in FY 2003.
OIG Comments on Adequacy of FY 2003 Funding
Majority of costs will be borne by the PRP. The PRP has signed aConsent Decree to pay $129 million of the $140 million estimatedcosts. FY 2003 funding was sufficient.

Enclosure 5Page 6 of 6
Iron Mountain Mine
Location/Region Shasta County, California / Region 9
Description of Site Site was added to the NPL in 1983. Mine runoff has contaminatednearby water bodies with heavy metals.
FY 2003 Funding Information Region 9 requested and obligated $5 million in FY 2003.
OIG Comments on Adequacy of FY 2003 Funding
PRP has signed Consent Decree to pay $862 million of the totalestimated costs of $880 million. Remedial action work is almostcomplete. FY 2003 funding was sufficient.
Bunker Hill
Location/Region Northern Idaho / Region 10
Description of Site This abandoned lead zinc mine and smelter in Kellogg, Idaho wasadded to the NPL in 1983. Major contaminants in the soil,sediment, and water include lead, mercury, zinc, antimony, andarsenic cadmium. The site includes a 21-square-mile area called“The Box” and the downstream area called “The Basin.”
FY 2003 Funding Information Requested $42,250,000 in remedial action funds and obligated$15,081,219.
OIG Comments on Adequacy of FY 2003 Funding
According to the RPM, funding at a reduced level ($15 million)delays the cleanup significantly. Compared to full funding, the lowerfunding level adds one additional year for cleanup of Box properties,four additional years for cleanup of Basin properties, sevenadditional years for cleanup of recreation areas, and apostponement of ecological projects until 2007. FY 2003 fundingwas not sufficient.

Enclosure 6Page 1 of 3
OIG Response to Attachment Question 1
Question 1 - According to reports in the trade press, the Superfund program director, MikeCook, informed the NACEPT Committee that the shortfall in Superfund funding would exceed$200 million in FY 2002 and continue to grow in future years. Your October 25, 2002, reportidentified seven NPL sites where funding shortfalls totaling $91.8 million prevented cleanupsfrom beginning and an additional shortfall of $17 million for long-term response actions. Thereport also identified four sites that received partial funding but had a shortfall from the neededamount.
Can you reconcile the difference between Mr. Cook’s projection and your findings in theOctober 25, 2002, report? Does the fact that some sites received only partial funding forremedial actions or the fact that your report did not cover funding for remedial design or remedialinvestigation and feasibility studies account for some or all of the differential?
OIG Response - According to Mike Cook, Director of the Office of Site Remediation andTechnology Innovation (OSRTI), the difference was due to the universe of projects beingdiscussed. He described his reference to a “$200 million shortfall” as a “planning estimate”which included (1) FY 2002 funding needs for the seven sites cited in the OIG’s October 25,2002, letter; (2) FY 2003 and FY 2004 funding needs for those projects where the FY 2002 needrepresented only the initial increment of funding; and (3) construction projects at other NPL sitesthat were initially considered for funding during FY 2002 but experienced schedule delays andsubsequently were not ready to proceed by the end of FY 2002. Neither Mr. Cook’s estimate ofthe funding shortfall nor the OIG’s October 2002 letter discussed funding shortfalls for remedialdesign or remedial investigations and feasibility studies.
An OSRTI official indicated that OSRTI did not prepare detailed support for Mr. Cook’s estimate at the time. In response to our questions, the OSRTI official provided the followinginformation as a “rough frame of reference” for the estimate. We added information on theamount obligated during FY 2003 to provide understanding on the extent to which site needswere addressed in FY 2003.

Enclosure 6Page 2 of 3
Site Name(Region/State)
OSRTI CostEstimate(millions)
Amount Obligatedin FY 2003(millions)
Sites Reported by OIG That Did Not Receive Any FY 2002 Funding
Atlas Tack - Phase 1 (Region 1- Massachusetts) $13 $0.0
Elizabeth Mine (Region 1 - Vermont) 15 0.0
Jennison Wright (Region 5 - Illinois) 10 0.0
Continental Steel (Region 5 - Indiana) 28 0.0
Central Wood (Region 6 - Louisiana) 9 7.2
Hart Creosoting (Region 6 - Texas) 10 0.0
Jasper Creosoting (Region 6 - Texas) 6 0.0
Sites Needing Additional Funding in FY 2003/2004
Chemical Insecticide (Region 2 - New Jersey) $20 $7.3
American Creosote (Region 4 - Florida) 3 0.3
Alaric (Region 4 - Florida) 2 1.7
Solitron (Region 4 - Florida) 2 0.5
Trans Circuits (Region 4 - Florida) 1 1.0
Aircraft Components (Region 5 - Michigan) 4 4.3
Hudson Oil (Region 6 - Oklahoma) 5 4.8
Sprague Road (Region 6 - Texas) 4 4.2
10th Street (Region 7 - Nebraska) 1 1.2
Upper Ten Mile Creek (Region 8 - Montana) 4 3.8
Basin Mining (Region 8 - Montana) 3 2.6
Frontier Hard Chrome (Region 10 - Washington) 4 6.5
FY 2002 Sites Not Ready for Construction
Vasquez Boulevard/VB I-70 (Region 8 - Colorado) $16 $0.0*
Davenport & Flagstaff (Region 8 - Utah) 9 0.0*
Roebling Steel (Region 2 - New Jersey) 12 4.3
Eureka Mills (Region 8 - Utah) 28 7.2
Atlas Tack - Phase 2 (Region 1 - Massachusetts) 5 0.0
Total Estimated Needs $214 $56.9 * These sites received pipeline funding in FY 2003

Enclosure 6Page 3 of 3
According to an OSRTI official, the second group of sites above – Sites Needing AdditionalFunding in FY 2003/2004 – represent remedial construction projects started in FY 2002 thatrequired additional funding in subsequent years. The cost estimates reflect the regions’ estimateof need for these projects as reflected in OSRTI’s initial FY 2003 funding decision ofOctober 30, 2002. According to OSRTI, additional funding for the Chemical Insecticide Site isplanned for FY 2004.
Concerning the sites listed in the FY 2002 Sites Not Ready for Construction category, the OSRTIofficial indicated that these five sites were reviewed by the National Risk Based Priority Panel. The regions subsequently determined that these sites were not ready for remedial funds inFY 2002. For example, our October 25, 2002, letter indicated that a delay in signing the Recordof Decision for the Vasquez Boulevard site delayed construction.

Enclosure 7
OIG Response to Attachment Question 2
Question 2 - Please identify each site in FY 2002 where funds were obligated, the date and theamount of obligation, and each site where funds were actually expended in FY 2002 and the dateand amount of expenditures. Also indicate for each site the amount of obligated funds whichwere not expended in FY 2003. Please indicate if each site is on target with the timeline set forthin the Record of Decision.
OIG Response - The charts on the following pages show the date and amount of obligations fornon-Federal Remedial Action and Long-term Response Action sites considered for funding inFY 2002. The charts show the amount obligated and the date for FY 2002 obligations as well asthe total expenditures for FY 2002 and the corresponding year of obligation. The informationprovided is only for those sites identified in our October 25, 2002, letter. OSRTI records showexpenditures for other remedial action and LTRA sites that did not have obligations duringFY 2002.
The OIG has not independently verified the FY 2002 obligation and expenditure informationsupplied by OSRTI officials. Information on obligated funds not expended at the end ofFY 2003 for certain sites are in enclosures 1 through 4. The remaining data is included on theenclosed disk. Information on the sufficiency of FY 2003 site-specific funding is presented onpages 4 through 10 of this letter.

ENCLOSURE 7 - OBLIGATION AND EXPENDITUREINFORMATION FOR REMEDIAL ACTION AND LTRASITES INCLUDED IN OIG'S OCTOBER 25, 2002 LETTER

Enclosure 7Page 2 of 21
Region 1 - Non-Federal NPL Remedial Action Site Funding
Total FY02FY02 Obligated Amount Obligated Total FY02Amount from Special State SF (sum of prior Expenditures ****
RG ST EPA ID Site Name HQ RA AOA** Date Accounts Date Contracts Date 3 columns) Amount Year of Obligation
1 MA MAD980731335 New Bedford Site $6,441,026 09/27/2002 $396,900 02/12/2002 $200,000 03/25/2002 7,037,926100,000 09/27/2002 9,796,493 03/25/2002 9,896,493
2,563,133 07/03/2002 2,563,133310,659 07/25/2002 310,659
1,100,000 09/19/2002 1,100,0001,100,000 09/27/2002 1,100,000
1 ME MED980915474 Eastland Woolen Mill 5,000,000 03/12/2002 0 0 5,000,0001 NH NHD990717647 Ottati & Goss/Kingston Steel Drum 1,000,000 01/03/2002 554,005 04/09/2002 0 1,554,005 $9,925,032 2000
2,700,000 02/12/2002 2,700,000 5,440,089 20024,600,000 04/09/2002 4,600,000
1 ME MED981073711 Eastern Surplus 0 900,000 05/15/2002 0 900,000900,000 09/17/2002 900,000
TOTALS $19,841,026 $17,621,190 $200,000 $37,662,216 $15,365,121
**includes prior year fund appropriation obligations
****The amounts in this column do not relate to the obligation information on the same line.

Enclosure 7Page 3 of 21
Region 2 - Non-Federal NPL Remedial Action Site Funding
Total FY02FY02 Obligated Amount Obligated Total FY02Amount from Special State SF (sum of prior Expenditures ****
RG ST EPA ID Site Name HQ RA AOA** Date Accounts Contracts Date 3 columns) Amount Year of Obligation
2 NJ NJD980504997 Burnt Fly Bog $20,111,271 09/30/2002 $0 $0 $20,111,271 $2,869 19902 NJ NJD980484653 Chemical Insecticide Corp. 19,092,897 09/30/2002 0 0 19,092,897 7,442 19912 NJ NJD094966611 Combe Fill South Landfill 1,150,000 09/30/2002 0 0 1,150,000 3,621,111 19902 NJ NJ0001900281 Federal Creosote 7,600,000 02/12/2002 0 2,000,000 02/12/2002 9,600,000 $526,069 1999
13,400,000 04/25/2002 774,000 09/25/2002 14,174,000 12,700,662 20009,970,000 09/25/2002 3,096,000 09/30/2002 13,066,000 21,564,107 2001
30,000 09/27/2002 30,000 2,690,074 20025,548,872 09/30/2002 5,548,872
2 NJ NJD980785646 Glen Ridge Radium Site 8,250,000 09/25/2002 0 1,750,000 09/25/2002 10,000,000 3,720,735 20002 NJ NJD980654164 Montgomery Township Housing Dev. 2,000,000 09/30/2002 0 0 2,000,0002 NJ NJD980654156 Rocky Hill Municipal Well 2,000,000 09/30/2002 0 0 2,000,0002 NJ NJD073732257 Roebling Steel Co. 2,400,000 04/01/2002 0 0 2,400,000 2,253,101 2000
1,300,000 09/30/2002 1,300,000 2,486,301 20011,376,642 2002
2 NJ NJD980654172 U.S. Radium Corp. 3,000,000 07/23/2002 0 1,840,000 09/30/2002 4,840,000 111,944 19973,160,000 09/30/2002 3,160,000 756,195 1998
1,589,706 20007,506,080 2001
2 NJ NJD002385664 Vineland Chemical Co., Inc. 9,200,000 04/10/2002 0 800,000 04/10/2002 10,000,000 2,192,190 1999446,761 2000268,182 2001
2 NJ NJD986620995 Welsbach & Gen. Gas Mantle (Camden) 7,000,000 07/15/2002 0 0 7,000,000 16,624 20003,848,683 2001
2 NY NYD981566417 GCL Tie & Treating Inc. 2,520,000 09/03/2002 0 480,000 09/03/2002 3,000,000 14,661 20002 NY NYD986882660 Li Tungsten Corp. 1,000,000 05/06/2002 0 0 1,000,000 9,616 2000
1,500,000 05/20/2002 1,500,000 539,777 20022 NY NY0001233634 Little Valley 0 0 114,000 07/16/2002 114,000 18,735 2000
16,705 20012 NY NYD986950012 Mohonk Road Industrial Plant 250,000 09/30/2002 0 0 250,000 181,002 2000
173,006 20012 NY NYD980528657 Olean Well Field 1,400,000 09/30/2002 0 0 1,400,000 3,916 19982 NY NYD047650197 Stanton Cleaners Area Ground Water 330,000 09/30/2002 0 0 330,000 48,533 2000
228,680 20012 NY NYD980763767 Vestal Water Supply Well 1-1 1,286,800 09/06/2002 0 0 1,286,800 467 1990
490 19912 VI VID982272569 Tutu Wellfield 5,600,000 09/23/2002 0 0 5,600,000
TOTALS $129,099,840 $0 $10,854,000 $139,953,840 $68,921,066
**includes prior year fund appropriation obligations
****The amounts in this column do not relate to the obligation information on the same line.

Enclosure 7Page 4 of 21
Region 3 - Non-Federal NPL Remedial Action Site Funding
Total FY02FY02 Obligated Amount Obligated Total FY02Amount from Special State SF (sum of prior Expenditures ****
RG ST EPA ID Site Name HQ RA AOA** Date Accounts Contracts 3 columns) Amount Year of Obligation
3 PA PAD980538649 Berkley Products $257,187 03/22/2002 $0 $0 $257,187 $912,106 2001$4,741 05/03/2002 0 0 $4,741
3 PA PAD980691794 Berks Sand Pit 23,000 08/12/2002 0 0 23,000 219,798 200043,169 09/16/2002 0 0 43,169
3 PA PAD002338010 Havertown 300,000 02/15/2002 0 0 300,000 132,028 199980,038 09/13/2002 0 0 ERR 237,690 2000
1,337,320 20013 PA PAD980829527 Walsh LF 35,000 03/29/2002 0 0 35,000 19,565 1995
15,805 20006,075 2002
3 VA VAD003117389 Saunders Supply 114,550 09/20/2002 0 0 114,550 318,704 199640,359 1999
100 2000
TOTALS $857,685 $0 $0 $857,685 $3,239,550
**includes prior year fund appropriation obligations
****The amounts in this column do not relate to the obligation information on the same line.

Enclosure 7Page 5 of 21
Region 4 - Non-Federal NPL Remedial Action Site Funding
Total FY02FY02 Obligated Amount Obligated Total FY02Amount from Special State SF (sum of prior Expenditures ****
RG ST EPA ID Site Name HQ RA AOA** Date Accounts Date Contracts Date 3 columns) Amount Year of Obligation
4 FL FLD012978862 Alaric Area Groundwater $200,000 09/27/2002 $0 $0 $200,0004 FL FLD008161994 American Creosote Works (Pensacola) 2,471,708 09/30/2002 0 228,292 09/30/2002 2,700,000 7,500 1997
371,852 19994 FL FLD991279894 Coleman-Evans Wood Preserving Co. 4,500,000 03/19/2002 0 2,246,302 09/27/2002 6,746,302 3,745,448 1999
253,698 09/27/2002 253,698 7,903,395 20003,604,888 2001
4 FL FLD004119681 Hollingsworth Solderless Terminal 50,000 02/21/2002 0 0 50,000 173,009 200140,169 2002
4 FL FLD045459526 Solitron Microwave 268,227 09/30/2002 0 0 268,2274 FL FL0001209840 Southern Solvents, Inc. 532,542 09/25/2002 0 0 532,5424 FL FLD004065546 Tower Chemical Co. 100,000 09/27/2002 0 0 100,0004 FL FLD091471904 Trans Circuits, Inc. 442,846 09/27/2002 0 0 442,8464 GA GAD003269578 Woolfolk Chemical Works 300,000 09/28/2002 0 0 300,0004 NC NCD024644494 ABC One Hour Cleaners 300,000 09/06/2002 0 0 300,000 569,086 1996
20,789 1998238,678 1999
4 NC NCD003188828 Cape Fear Wood Preserving 10,000 08/27/2002 0 250,000 09/24/2002 260,000 98,498 19941,030,512 2001
6,330 20024 NC NCD003188844 Carolina Transformer Co. 500,000 02/08/2002 0 266,559 09/30/2002 766,559 1,897,669 1997
1,500,000 02/08/2002 1,500,000 1,309,145 19992,276,287 09/30/2002 2,276,287 1,889,550 2001
300,000 08/16/2002 300,000200,000 08/16/2002 200,000
57,154 09/30/2002 57,1544 SC SCD980839542 Elmore Waste Disposal 1,351 04/09/2002 0 0 1,351 273,589 2000
33,441 20014 TN TND096070396 Ross Metals Inc 50,000 05/06/2002 0 0 50,000 2,605 1999
175,000 09/04/2002 175,000 243 20002,825,000 08/05/2002 2,825,000 494,404 2001
8,077 20024 TN TND980844781 Wrigley Charcoal Plant 0 12,801 09/30/2002 0 12,801
TOTALS $17,313,813 $12,801 $2,991,153 $20,317,767 $23,718,877
**includes prior year fund appropriation obligations
****The amounts in this column do not relate to the obligation information on the same line.

Enclosure 7Page 6 of 21
Region 5 - Non-Federal NPL Remedial Action Site Funding
Total FY02FY02 Obligated Amount Obligated Total FY02Amount from Special State SF (sum of prior Expenditures ****
RG ST EPA ID Site Name HQ RA AOA** Date Accounts Date Contracts 3 columns) Notes Amount Year of Obligation
5 MI INDOO1213503 Continental Steel Corporation $0 $0 $0 $0 (1)5 MI MID980476907 Parsons Chemical 390,921 09/17/2002 0 0 390,9215 MI MI0001119106 Aircraft Components (D & L Sales) 1,500,000 09/25/2002 0 0 1,500,0005 MI MID000722439 Velsicol Chemical Corp (Michigan) 928,000 12/04/2001 0 0 928,000 4,511,539 1999
3,458,446 01/02/2002 3,458,446 810,536 20003,200,000 01/02/2002 3,200,000 2,573,082 20015,613,554 05/03/2002 5,613,554 4,307,294 2002
338,812 09/27/2002 338,812796,326 09/27/2002 796,326
2,299,305 09/27/2002 2,299,30510,000 09/27/2002 10,000
147,250 09/27/2002 147,2505 MI MID006030373 BOFORS NOBEL, INC. 0 643,096 05/09/2002 0 643,096
170,622 07/01/2002 170,6225 MI MID985574227 Lower Ecorse Creek Dump 24,526 08/23/2002 0 0 24,526
25,000 08/23/2002 25,0005 MI MID006031348 Peerless Plating 41,350 02/04/2002 0 0 41,350 91,944 1996
20,000 09/19/2002 20,000 449,005 20015 MI MID980794556 U.S. Aviex 20,850 09/17/2002 0 0 20,850 124,395 1999
350,000 09/17/2002 350,0005 MN MND006192694 MacGillis & Gibbs/Bell Lumber & Pole Co 50,200 06/17/2002 0 0 50,200 10,000 1994
198,050 07/17/2002 198,050 1,566,574 199570,000 09/25/2002 70,000 105,425 2000
91,938 2001
TOTALS $19,482,590 $813,718 $0 $20,296,308 $14,641,732
**includes prior year fund appropriation obligations
****The amounts in this column do not relate to the obligation information on the same line.
Notes Provided by Regional Officials:
(1) Region 5 obligated $50,000 for site security on 01/07/02.
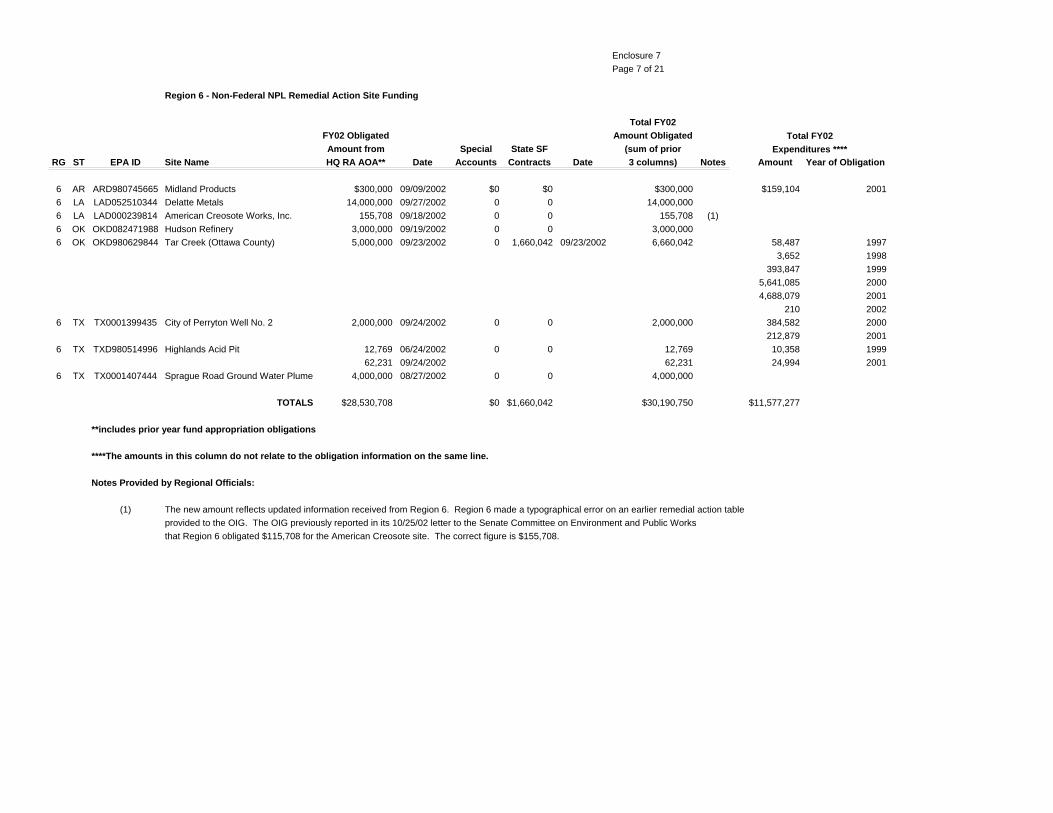
Enclosure 7Page 7 of 21
Region 6 - Non-Federal NPL Remedial Action Site Funding
Total FY02FY02 Obligated Amount Obligated Total FY02Amount from Special State SF (sum of prior Expenditures ****
RG ST EPA ID Site Name HQ RA AOA** Date Accounts Contracts Date 3 columns) Notes Amount Year of Obligation
6 AR ARD980745665 Midland Products $300,000 09/09/2002 $0 $0 $300,000 $159,104 20016 LA LAD052510344 Delatte Metals 14,000,000 09/27/2002 0 0 14,000,0006 LA LAD000239814 American Creosote Works, Inc. 155,708 09/18/2002 0 0 155,708 (1)6 OK OKD082471988 Hudson Refinery 3,000,000 09/19/2002 0 0 3,000,0006 OK OKD980629844 Tar Creek (Ottawa County) 5,000,000 09/23/2002 0 1,660,042 09/23/2002 6,660,042 58,487 1997
3,652 1998393,847 1999
5,641,085 20004,688,079 2001
210 20026 TX TX0001399435 City of Perryton Well No. 2 2,000,000 09/24/2002 0 0 2,000,000 384,582 2000
212,879 20016 TX TXD980514996 Highlands Acid Pit 12,769 06/24/2002 0 0 12,769 10,358 1999
62,231 09/24/2002 62,231 24,994 20016 TX TX0001407444 Sprague Road Ground Water Plume 4,000,000 08/27/2002 0 0 4,000,000
TOTALS $28,530,708 $0 $1,660,042 $30,190,750 $11,577,277
**includes prior year fund appropriation obligations
****The amounts in this column do not relate to the obligation information on the same line.
Notes Provided by Regional Officials:
(1) The new amount reflects updated information received from Region 6. Region 6 made a typographical error on an earlier remedial action tableprovided to the OIG. The OIG previously reported in its 10/25/02 letter to the Senate Committee on Environment and Public Worksthat Region 6 obligated $115,708 for the American Creosote site. The correct figure is $155,708.
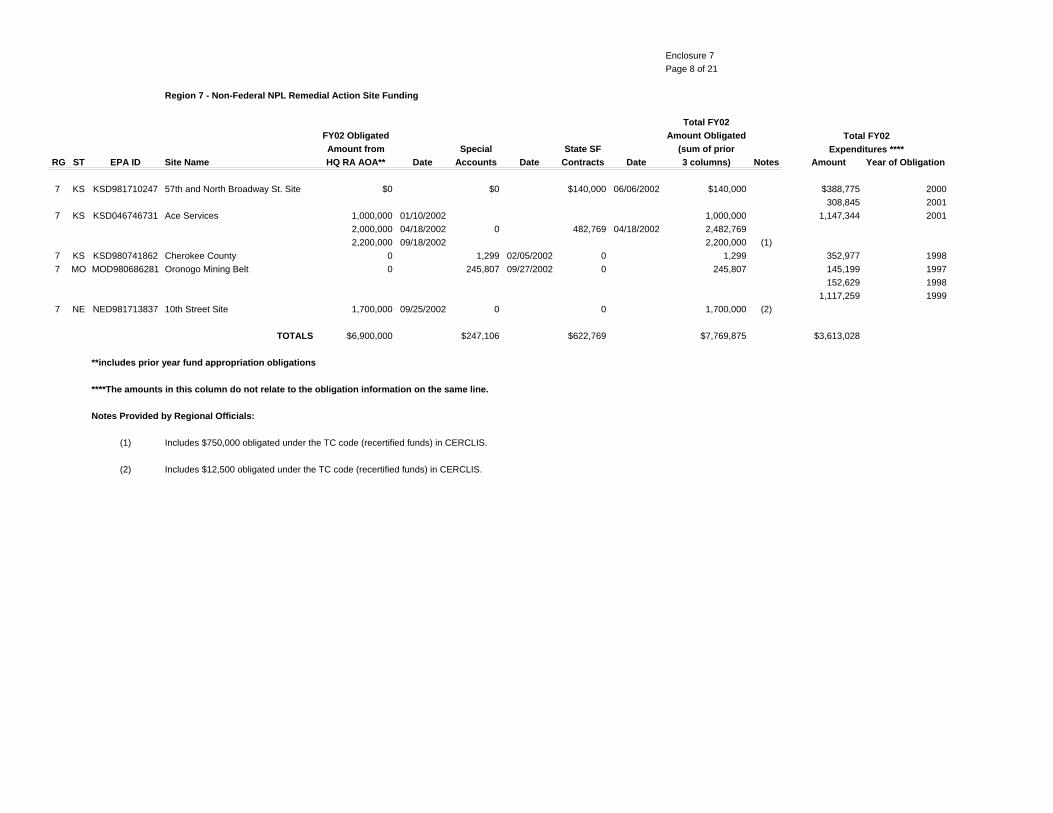
Enclosure 7Page 8 of 21
Region 7 - Non-Federal NPL Remedial Action Site Funding
Total FY02FY02 Obligated Amount Obligated Total FY02Amount from Special State SF (sum of prior Expenditures ****
RG ST EPA ID Site Name HQ RA AOA** Date Accounts Date Contracts Date 3 columns) Notes Amount Year of Obligation
7 KS KSD981710247 57th and North Broadway St. Site $0 $0 $140,000 06/06/2002 $140,000 $388,775 2000308,845 2001
7 KS KSD046746731 Ace Services 1,000,000 01/10/2002 1,000,000 1,147,344 20012,000,000 04/18/2002 0 482,769 04/18/2002 2,482,7692,200,000 09/18/2002 2,200,000 (1)
7 KS KSD980741862 Cherokee County 0 1,299 02/05/2002 0 1,299 352,977 19987 MO MOD980686281 Oronogo Mining Belt 0 245,807 09/27/2002 0 245,807 145,199 1997
152,629 19981,117,259 1999
7 NE NED981713837 10th Street Site 1,700,000 09/25/2002 0 0 1,700,000 (2)
TOTALS $6,900,000 $247,106 $622,769 $7,769,875 $3,613,028
**includes prior year fund appropriation obligations
****The amounts in this column do not relate to the obligation information on the same line.
Notes Provided by Regional Officials:
(1) Includes $750,000 obligated under the TC code (recertified funds) in CERCLIS.
(2) Includes $12,500 obligated under the TC code (recertified funds) in CERCLIS.

Enclosure 7Page 9 of 21
Region 8 - Non-Federal NPL Remedial Action Site Funding
Total FY02FY02 Obligated Amount Obligated Total FY02Amount from Special State SF (sum of prior Expenditures ****
RG ST EPA ID Site Name HQ RA AOA** Date Accounts Contracts Date 3 columns) Notes Amount Year of Obligation
8 CO COD980716955 Denver Radium Site $5,000,000 02/01/2002 $0 $490,000 09/30/2002 $5,490,000 $1,121,605 2001$3,000,000 09/20/2002 $3,000,000
8 CO COD983778432 Summitville Mine 0 0 100,000 01/28/2002 100,000 1,640,450 19982,509,021 1999
543,717 20018 MT MTD982572562 Basin Mining Area 1,238,984 07/26/2002 0 0 1,238,984 22,741 2002
30,000 06/26/2002 30,00030,000 07/08/2002 30,000
8 MT MTSFN7578012 Upper Tenmile Creek Mining Area 850,000 08/23/2002 0 0 850,00050,000 08/14/2002 50,000
100,000 09/26/2002 100,0008 SD SDD987673985 Gilt Edge Mine 1,000,000 04/22/2002 0 3,000,000 04/03/2002 4,000,000 (1) 4,362,094 2001
300,000 07/16/2002 300,000 29,407 2002200,000 08/12/2002 200,000
1,375,000 08/22/2002 1,375,0005,400,000 04/03/2002 5,400,000
500,000 09/25/2002 500,0001,094,802 09/27/2002 1,094,802
9,040 09/27/2002 9,040
TOTALS $20,177,826 $0 $3,590,000 $23,767,826 $10,229,035
**includes prior year fund appropriation obligations
****The amounts in this column do not relate to the obligation information on the same line.
Notes Provided by Regional Officials:
(1) The total for remedial action activities at the Gilt Edge site above is $9,878,842, which is $10,689 less than the amount EPA OIG reportedin its 10/25/02 letter to the Senate Committee on Environment and Public Works. In the 10/25/02 letter, EPA OIG reported a total of $9,889,531 for the Gilt Edge site. Region 8 informed us that they double-counted a transaction. Because of this difference, the FY02 Obligated Amount from HQ RA AOA is smaller here than previously reported in EPA OIG's 10/25/02 letter to the SenateEnvironment and Public Works Committee.

Enclosure 7Page 10 of 21
Region 9 - Non-Federal NPL Remedial Action Site Funding
Total FY02FY02 Obligated Amount Obligated Total FY02Amount from Special State SF (sum of prior Expenditures ****
RG ST EPA ID Site Name HQ RA AOA** Date Accounts Date Contracts 3 columns) Amount Year of Obligation
9 AZ AZD980695969 Indian Bend Wash Area $100,000 01/17/2002 $0 $0 $100,000 $117,124 20009 CA CAD980498612 Iron Mountain Mine 1,500,000 01/17/2002 0 0 1,500,000 48 1996
6,985,489 20009,854,049 09/30/2002 9,854,049 1,256,892 2001
9 CA CAD029295706 Lorentz Barrel & Drum CO. 0 258,539 02/20/2002 0 258,5399 CA CAD009106527 McCormick & Baxter Creosoting Co. 1,100,000 03/27/2002 0 0 1,100,000
305,000 09/17/2002 305,0009 CA CAD981997752 Modesto Ground Water Contamination 368,000 07/16/2002 0 0 368,000 49,843 1999
194,158 2000382,921 2001
9 CA CAD980677355 San Gabriel Valley (Area 1) 600,000 01/17/2002 0 0 600,000 6,685,070 2000600,000 07/09/2002 600,000 580 2001
1,200,000 09/30/2002 1,200,000
Totals $14,027,049 $258,539 $0 $14,285,588 $15,672,125
** - includes prior year fund obligations
****The amounts in this column do not relate to the obligation information on the same line.
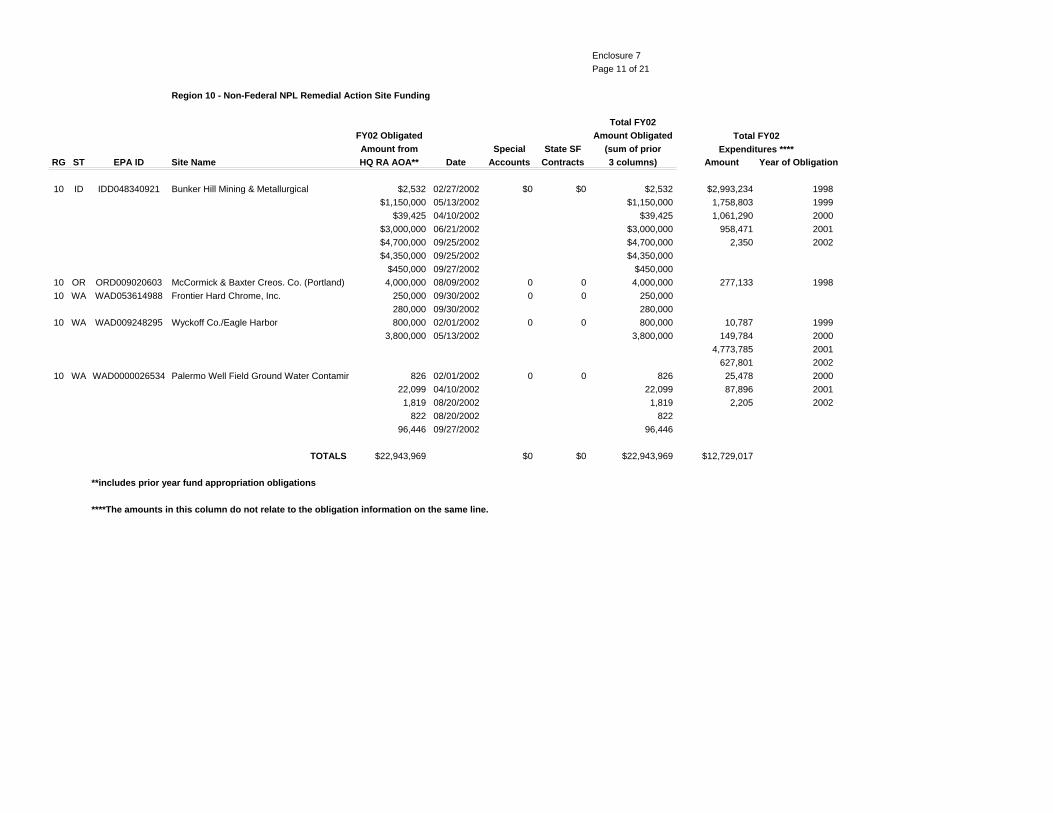
Enclosure 7Page 11 of 21
Region 10 - Non-Federal NPL Remedial Action Site Funding
Total FY02FY02 Obligated Amount Obligated Total FY02Amount from Special State SF (sum of prior Expenditures ****
RG ST EPA ID Site Name HQ RA AOA** Date Accounts Contracts 3 columns) Amount Year of Obligation
10 ID IDD048340921 Bunker Hill Mining & Metallurgical $2,532 02/27/2002 $0 $0 $2,532 $2,993,234 1998$1,150,000 05/13/2002 $1,150,000 1,758,803 1999
$39,425 04/10/2002 $39,425 1,061,290 2000$3,000,000 06/21/2002 $3,000,000 958,471 2001$4,700,000 09/25/2002 $4,700,000 2,350 2002$4,350,000 09/25/2002 $4,350,000
$450,000 09/27/2002 $450,00010 OR ORD009020603 McCormick & Baxter Creos. Co. (Portland) 4,000,000 08/09/2002 0 0 4,000,000 277,133 199810 WA WAD053614988 Frontier Hard Chrome, Inc. 250,000 09/30/2002 0 0 250,000
280,000 09/30/2002 280,00010 WA WAD009248295 Wyckoff Co./Eagle Harbor 800,000 02/01/2002 0 0 800,000 10,787 1999
3,800,000 05/13/2002 3,800,000 149,784 20004,773,785 2001
627,801 200210 WA WAD0000026534 Palermo Well Field Ground Water Contamin 826 02/01/2002 0 0 826 25,478 2000
22,099 04/10/2002 22,099 87,896 20011,819 08/20/2002 1,819 2,205 2002
822 08/20/2002 82296,446 09/27/2002 96,446
TOTALS $22,943,969 $0 $0 $22,943,969 $12,729,017
**includes prior year fund appropriation obligations
****The amounts in this column do not relate to the obligation information on the same line.
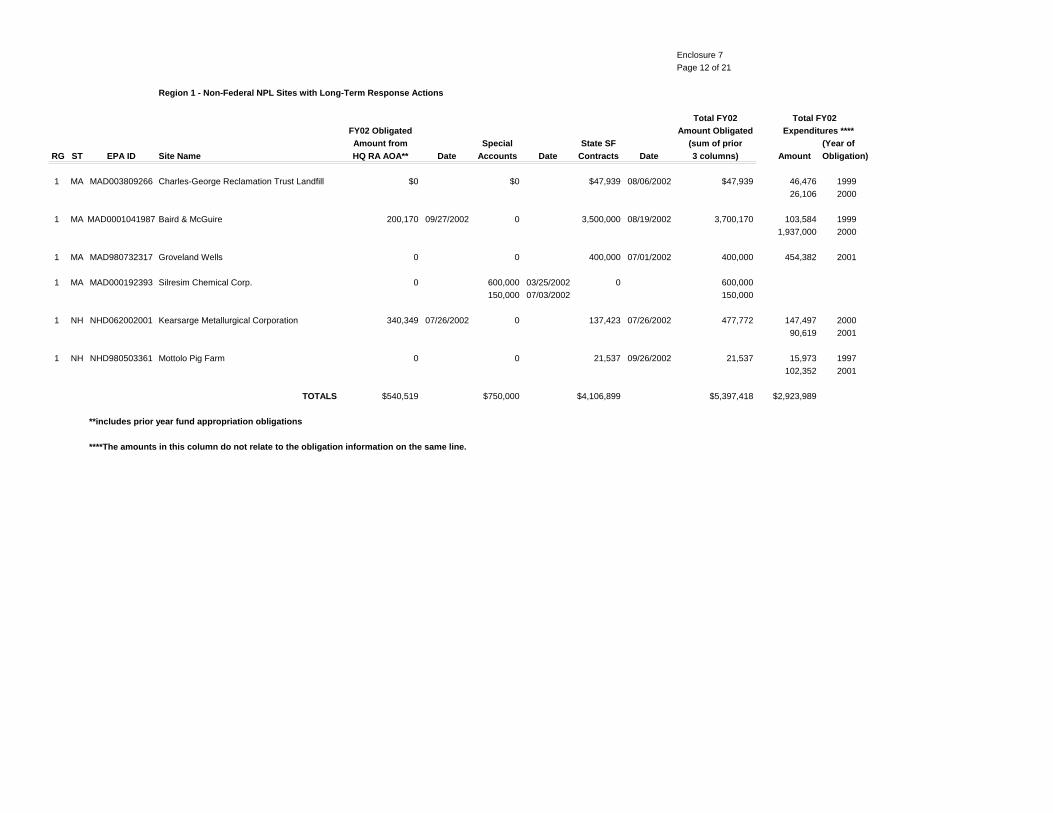
Enclosure 7Page 12 of 21
Region 1 - Non-Federal NPL Sites with Long-Term Response Actions
Total FY02 Total FY02FY02 Obligated Amount Obligated Expenditures ****Amount from Special State SF (sum of prior (Year of
RG ST EPA ID Site Name HQ RA AOA** Date Accounts Date Contracts Date 3 columns) Amount Obligation)
1 MA MAD003809266 Charles-George Reclamation Trust Landfill $0 $0 $47,939 08/06/2002 $47,939 46,476 199926,106 2000
1 MA MAD0001041987 Baird & McGuire 200,170 09/27/2002 0 3,500,000 08/19/2002 3,700,170 103,584 19991,937,000 2000
1 MA MAD980732317 Groveland Wells 0 0 400,000 07/01/2002 400,000 454,382 2001
1 MA MAD000192393 Silresim Chemical Corp. 0 600,000 03/25/2002 0 600,000150,000 07/03/2002 150,000
1 NH NHD062002001 Kearsarge Metallurgical Corporation 340,349 07/26/2002 0 137,423 07/26/2002 477,772 147,497 200090,619 2001
1 NH NHD980503361 Mottolo Pig Farm 0 0 21,537 09/26/2002 21,537 15,973 1997102,352 2001
TOTALS $540,519 $750,000 $4,106,899 $5,397,418 $2,923,989
**includes prior year fund appropriation obligations
****The amounts in this column do not relate to the obligation information on the same line.

Enclosure 7Page 13 of 21
Region 2 - Non-Federal NPL Sites with Long-Term Response Actions
Total FY02 Total FY02FY02 Obligated Amount Obligated Expenditures ****Amount from Special State SF (sum of prior (Year of
RG ST EPA ID Site Name HQ RA AOA** Date Accounts Date Contracts Date 3 columns) Amount Obligation)
2 NJ NJD063157150 Bog Creek Farm $500,000 09/27/2002 $0 $200,000 09/27/2002 $700,000 147,654 1998
2 NJ NJD980529085 Ellis Property 2,699,790 09/30/2002 0 0 2,699,790 133,757 1997
2 NJ NJD053280160 Garden State Cleaners 450,000 09/26/2002 0 50,000 09/26/2002 500,000 4,664 2001
2 NJ NJD981490261 Higgins Farm 900,000 03/26/2002 0 0 900,000 385,251 2001
2 NJ NJD980505416 Lipari Landfill 0 4,500,000 01/09/2002 0 4,500,000200,000 01/11/2002 200,000750,000 06/12/2002 750,000
2 NJ NJD980766828 South Jersey Clothing Co. 450,000 09/26/2002 0 50,000 09/26/2002 500,000
2 NJ NJD002385664 Vineland Chemical Co., Inc. 4,000,000 04/08/2002 0 0 4,000,000 3,512,885 2001
2 NY NYD002066330 American Thermostat Co. 1,500,000 09/24/2002 0 0 1,500,000 604,357 2000
2 NY NYD980652275 Brewster Wellfield 676,000 02/27/2002 0 24,000 02/27/2002 700,000 429,842 2000174,000 09/30/2002 174,000 3,832 2002
2 NY NYD981184229 Circuitron Corp. 390,000 09/27/2002 0 160,000 09/27/2002 550,000 207,055 2001
2 NY NYD002044584 Claremont Polychemical 580,000 05/13/2002 0 0 580,000 439,812 2001420,000 09/30/2002 420,000 301,196 2002
2 NY NYD986950012 Mohonk Road Industrial Plant 350,000 09/30/2002 0 0 350,000 353,355 2001
2 NY NYD001533165 SMS Instruments, Inc. 200,000 01/24/2002 0 0 200,000 5,161 1997100,000 09/20/2002 100,000 15,053 2000
200,000 200137,967 2002
2 NY NYD047650197 Stanton Cleaners Area GW Contamination 150,000 09/30/2002 0 0 150,000
2 NY NYD980763767 Vestal Water Supply Well 1-1 213,200 03/04/2002 0 186,800 03/04/2002 400,000 236,003 1999100,000 04/03/2002 100,000
TOTALS $13,852,990 $5,450,000 $670,800 $19,973,790 $7,017,844
**includes prior year fund appropriation obligations
****The amounts in this column do not relate to the obligation information on the same line.
Notes Provided by Regional Officials:

Enclosure 7Page 14 of 21
Region 3 - Non-Federal NPL Sites with Long-Term Response Actions
Total FY02 Total FY02FY02 Obligated Amount Obligated Expenditures ****Amount from Special State SF (sum of prior (Year of
RG ST EPA ID Site Name HQ RA AOA** Date Accounts Contracts 3 columns) Amount Obligation)
3 PA PAD980691794 Berks Sand Pit $133,903 09/30/2002 $0 $0 $133,903
3 PA PAD981034705 Butz LF 200,000 08/12/2002 0 0 200,000 17,892 1999175,473 2001
3 PA PAD002360444 Cryochem, Inc. 200,000 04/12/2002 0 0 200,000 90,900 200050,000 09/25/2002 50,000 80,135 2001
3 PA PAD002338010 Havertown PCP 220,000 08/13/2002 0 0 220,000 4,804 2002
3 PA PAD002390748 Hellertown Manufacturing Co. 60,000 02/26/2002 0 0 60,000 190,166 200075,000 04/17/2002 75,000 21,772 200275,000 09/24/2002 75,000
3 PA PAD039017694 Raymark 150,000 09/24/2002 0 0 150,000 65,029 2000
3 VA VAD003125374 Greenwood Chemical Co. 350,000 01/14/2002 0 0 350,000 613,080 200025,000 2001
104,210 2002
3 VA VAD003117389 Saunders Supply 200,000 09/20/2002 0 0 200,000237,488 2001
TOTALS $1,713,903 $0 $0 $1,713,903 $1,625,949
**includes prior year fund appropriation obligations
****The amounts in this column do not relate to the obligation information on the same line.

Enclosure 7Page 15 of 21
Region 4 - Non-Federal NPL Sites with Long-Term Response Actions
Total FY02 Total FY02FY02 Obligated Amount Obligated Expenditures ****Amount from Special State SF (sum of prior (Year of
RG ST EPA ID Site Name HQ RA AOA** Date Accounts Date Contracts 3 columns) Amount Obligation)
4 KY KYD980602155 Distler Brickyard $0 $200,000 09/17/2002 $0 $200,000
4 NC NCD981026479 Benfield Industries, Inc. 100,000 05/07/2002 0 0 100,000 3,402 2002
4 SC SCD980839542 Elmore Waste Disposal 150,000 04/27/2002 0 0 150,00036,938 09/17/2002 36,938
4 SC SCD003362217 Palmetto Wood Preserving 150,000 05/14/2002 0 0 150,000
TOTALS $436,938 $200,000 $0 $636,938 $3,402
**includes prior year fund appropriation obligations
****The amounts in this column do not relate to the obligation information on the same line.

Enclosure 7Page 16 of 21
Region 5 - Non-Federal NPL Sites with Long-Term Response Actions
Total FY02 Total FY02FY02 Obligated Amount Obligated Expenditures ****Amount from Special State SF (sum of prior (Year of
RG ST EPA ID Site Name HQ RA AOA** Date Accounts Contracts Date 3 columns) Amount Obligation)
5 MI MID060174240 Ott/Story/Cordova Chemical Co. 925,711 09/25/2002 0 1,574,289 09/25/2002 2,500,000 1,678,578 2000770,115 2001
5 MI MID006031348 Peerless Plating Co. 258,650 02/04/2002 0 0 258,650 23,080 2001
5 MI MID980701247 Wash King Laundry 520,000 03/26/2002 0 0 520,000
5 MN MND980904072 Long Prairie Groundwater Contamination 450,000 06/20/2002 0 0 450,000 354,000 1999
5 MN MND006192694 MacGillis & Gibbs/Bell Lumber & Pole Co. 500,000 12/04/2001 0 0 500,000 542,000 2001250,000 03/29/2002 250,000 282,393 2002
5 WI WID006100275 Oconomowoc Electroplating Co., Inc. 89,972 02/07/2002 0 0 89,972 319,797 200018,990 05/24/2002 18,990 236,317 2001
556,000 09/27/2002 556,00044,000 09/27/2002 44,000
5 WI WID980821656 Onalaska Municipal Landfill 103,281 05/24/2002 0 0 103,281 132,010 199760,166 1998
5 WI WID0006176945 Penta Wood Products 400,000 01/02/2002 0 0 400,000 473,654 2001900,000 01/02/2002 900,000 331,052 2002852,519 09/25/2002 852,519
TOTALS $5,869,123 $0 $1,574,289 $7,443,412 $5,203,162
**includes prior year fund appropriation obligations
****The amounts in this column do not relate to the obligation information on the same line.

Enclosure 7Page 17 of 21
Region 6 - Non-Federal NPL Sites with Long-Term Response Actions
Total FY02 Total FY02FY02 Obligated Amount Obligated Expenditures ****Amount from Special State SF (sum of prior (Year of
RG ST EPA ID Site Name HQ RA AOA** Date Accounts Contracts 3 columns) Amount Obligation)
6 LA LAD000239814 American Creosote $625,000 07/22/2002 $0 $0 $625,000 114,834 2001$135,649 09/30/2002 $135,649
6 NM NMD980749378 Cimarron Mining Corp. 150,000 09/23/2002 0 0 150,000
6 OK OKD007188717 Double Eagle Refinery Co. 62,500 09/25/2002 0 0 62,500
6 OK OKD980696470 Fourth Street Abandoned Refinery 62,500 09/25/2002 0 0 62,500
TOTALS $1,035,649 $0 $0 $1,035,649 $114,834
**includes prior year fund appropriation obligations
****The amounts in this column do not relate to the obligation information on the same line.
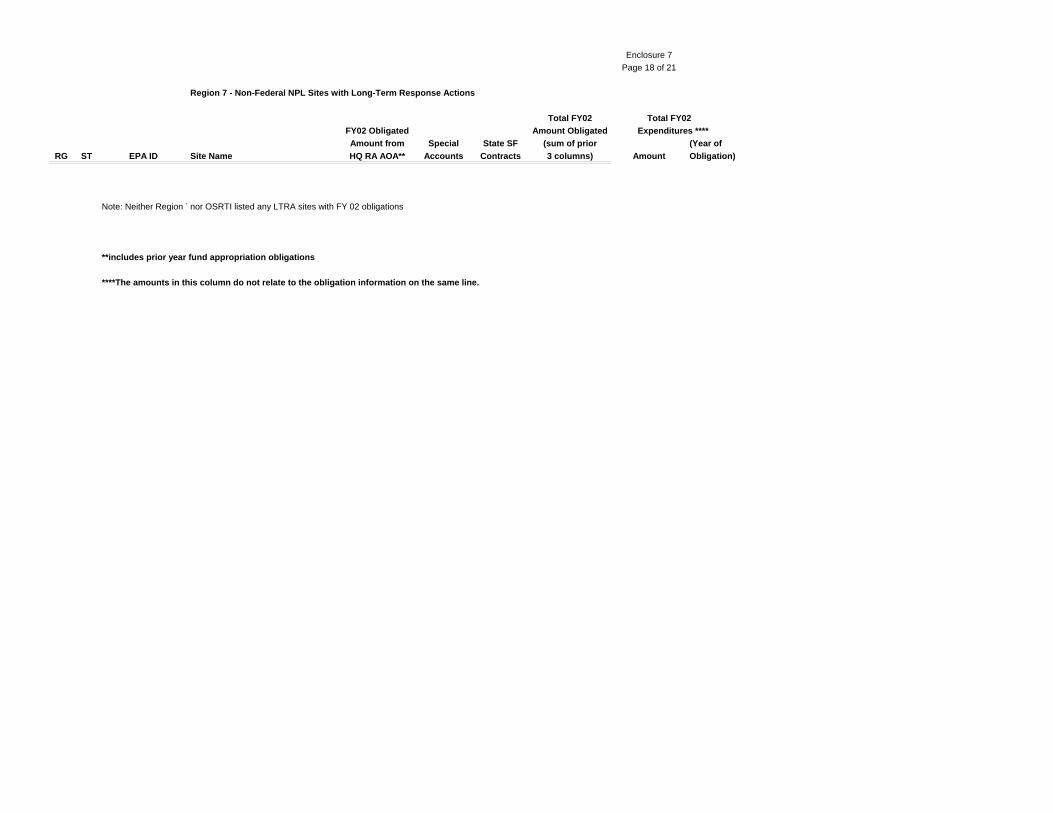
Enclosure 7Page 18 of 21
Region 7 - Non-Federal NPL Sites with Long-Term Response Actions
Total FY02 Total FY02FY02 Obligated Amount Obligated Expenditures ****Amount from Special State SF (sum of prior (Year of
RG ST EPA ID Site Name HQ RA AOA** Accounts Contracts 3 columns) Amount Obligation)
Note: Neither Region 7nor OSRTI listed any LTRA sites with FY 02 obligations
**includes prior year fund appropriation obligations
****The amounts in this column do not relate to the obligation information on the same line.

Enclosure 7Page 19 of 21
Region 8 - Non-Federal NPL Sites with Long-Term Response Actions
Total FY02 Total FY02FY02 Obligated Amount Obligated Expenditures ****Amount from Special State SF (sum of prior (Year of
RG ST EPA ID Site Name HQ RA AOA** Date Accounts Date Contracts 3 columns) Amount Obligation)
8 CO COD980717557 Central City/Clear Creek $1,100,000 04/23/2002 $0 $0 $1,100,000 142,991 20003,000 2002
8 CO COD007431620 Chemical Sales 0 800,000 05/06/2002 0 800,000 22,646 1999
8 CO COD983778432 Summitville Mine 0 2,100,000 03/08/2002 0 2,100,000 335,672 20015,000 05/17/2002 5,000
252,300 08/15/2002 252,300
8 SD SDD987673985 Gilt Edge Mine 19,982 11/28/2001 0 0 19,982 192,520 200129,651 2002
TOTALS $1,119,982 $3,157,300 $0 $4,277,282 $726,480
**includes prior year fund appropriation obligations
****The amounts in this column do not relate to the obligation information on the same line.

Enclosure 7Page 20 of 21
Region 9 - Non-Federal NPL Sites with Long-Term Response Actions
Total FY02 Total FY02FY02 Obligated Amount Obligated Expenditures ****Amount from Special State SF (sum of prior (Year of
RG ST EPA ID Site Name HQ RA AOA** Date Accounts Date Contracts Date 3 columns) Amount Obligation)
9 CA CAD095989778 Fairchild Semiconductor Corp. $0 $36,975 09/26/2002 $0 $36,975
9 CA CAD981434517 Newmark Ground Water Contamination 750,000 06/27/2002 0 0 750,000 883,607 2000
9 CA CAD029452141 Selma Treating Co. 603,095 07/22/2002 0 500,000 09/25/2002 1,103,095
9 CA CAD0902527 Modesto Ground Water Contamination 1,099 1999
TOTALS $1,353,095 $36,975 $500,000 $1,890,070 $884,706
**includes prior year fund appropriation obligations
****The amounts in this column do not relate to the obligation information on the same line.

Enclosure 7Page 21 of 21
Region 10 - Non-Federal NPL Sites with Long-Term Response Actions
Total FY02 Total FY02FY02 Obligated Amount Obligated Expenditures ****Amount from Special State SF (sum of prior (Year of
RG ST EPA ID Site Name HQ RA AOA** Date Accounts Contracts 3 columns) Amount Obligation)
10 WA WAD980726301 Commencement Bay, South Tacoma Channe $400,000 08/14/2002 $0 $0 $400,000 499 1999$444,031 09/27/2002 $444,031 8,806 2000
$59,300 09/27/2002 $59,300 16,475 2001
TOTALS $903,331 $0 $0 $903,331 $25,780
**includes prior year fund appropriation obligations
****The amounts in this column do not relate to the obligation information on the same line.

Enclosure 8
OIG Response to Attachment Question 3
Question 3 - In your October 25, 2002, report you reported that the final need was the same as orequal to the total amount obligated for FY 2002 at many sites where it was significantly less thanthe initial requested amount. Please provide any documentation that substantiates the EPAclaims and identify where there were discrepancies between the information you received fromthe remedial project managers and Headquarters.
OIG Response - Our October 25, 2002, letter stated that Office of Emergency and RemedialResponse officials (now OSTRI) indicated to us that managing uncontrolled hazardous wastesites is inherently uncertain in nature, and site funding needs change frequently based on dynamicsite conditions (see page 2 of our letter). In analyzing the financial information obtained inpreparation for our October 2002 letter, we noted that EPA had obligated funds for certain siteswell above the amount requested at the start of FY 2002. In contrast, some sites, for which fundswere originally requested, received no funding at all. For example, Region 1 originally requested$10,000,000 for the New Bedford site for FY 2002, but by the end of the fiscal year hadobligated $22,008,211, the majority of which came from available funds supplied by PRPs inaccordance with Consent Decrees. Also, Region 6 initially requested $9,880,000 for the HartCreosoting site but did not receive any funding for this site. OSRTI officials told us that amountsthe regions request for sites at the beginning of a fiscal year are “planning estimates.” Thus, thequestion arose for the OIG as to what EPA’s “real funding need” was for each of the remedialand LTRA sites during FY 2002.
To provide some perspective on this issue, at the end of our field work we asked regionalSuperfund officials to provide the final FY 2002 need for each site. We asked regional officialsto indicate an amount for “Final Site Need for FY 2002” on our spreadsheets which became partof our working papers. Given time constraints, we did not request any other supportingdocumentation. The information provided by regional officials is reflected in the column“Final Site Need for FY02" in enclosures 1 and 2 of our October 25, 2002, letter.
During our review, an OSRTI official indicated that he disagreed with Region 5 on the amountneeded for the Continental Steel Corporation site. Region 5 indicated that its final FY 2002 needwas $28.5 million. According to a Region 5 official, this estimate reflected the operating“ground rules” for the Superfund program that a region receives the full Federal share for newconstruction starts. The OSRTI official maintained that the Region did not need all $28.5 millionin FY 2002 given the multi-year nature of this project. That official maintained that the sitecould be addressed by allocating approximately $10 million per year over a 3-year period. TheRegion 5 official agreed that all $28.5 million would not have been spent in the first year ofconstruction but did not believe that the “ground rules” had been changed to support anincremental funding approach. The Region 5 official added that the danger with incrementalfunding is that future funding may not be available when needed to complete the project.

Enclosure 9Page 1 of 5
OIG Response to Attachment Question 4
Question 4 - Please describe the budget formulation and funding process for FY 2003 forSuperfund activities, focusing on remedial investigation, remedial design, remedial construction,and long-term response actions. Please describe the budget formulation and funding process forFY 2002 for these same activities. Please describe any changes to the budget and fundingprocess from FY 2002 to FY 2003. Please provide any background documentation and memos.
OIG Response - OSRTI provided the following information:
EPA manages the allocation of Superfund resources using an AOA structure. For the remedialprogram, response resources (exclusive of payroll, travel and working capital fund) from theSuperfund appropriation are placed in two AOAs. The Remedial Action AOA providesresources for remedial action construction, non-time critical removal construction, LTRAs(e.g., ground water restoration), and five-year reviews scheduled to be performed during the year. These actions are taken at sites on the Superfund NPL. The Pipeline Operations AOA providesresources for a wide variety of program activities including site assessment, remedialinvestigation/feasibility study, remedial design, oversight of responsible party cleanups,community involvement (including technical advisor grants), State involvement, and contractsmanagement. The budget and funding process varies significantly for each AOA.
FY 2003 Budget and Funding Process
Remedial Action AOA
The resources planning and management process for Superfund cleanup construction projects isan ongoing effort throughout the fiscal year. Resources for construction projects are providedfrom the Remedial Action AOA and from the deobligation of unexpended funds from prioryears. The highest priority for funding is given to “ongoing” projects with resource needs,including ongoing construction projects with resource needs to maintain progress or achievecompletion, LTRA, and five-year reviews scheduled to be performed during the year. Afterongoing construction needs are met, any remaining resources from the Remedial Action AOAand deobligations are allocated to sites where new cleanup construction projects are ready toproceed.
EPA began the Remedial Action funding process for FY 2003 during July/August 2002. A workplanning memorandum was issued to the EPA Regional Offices on June 28, 2002. Thememorandum asked the Regions to identify funding needs for ongoing remedial actions andLTRAs and for five-year reviews. The memorandum also requested that the regions

Enclosure 9Page 2 of 5
complete project evaluation forms for each ongoing remedial action project and each LTRAproject (with an estimated annual cost exceeding $600,000) requiring funding during FY 2003. These forms were intended to provide a brief description of the project and the projected resourceneed for the year. Using the project evaluation forms as well as reports pulled from theSuperfund information management system, CERCLIS, initial resource requests for ongoingconstruction projects were identified, as well as candidates for new start construction expected tobe ready to begin work during the fiscal year that the Region planned to present to the NationalRisk Based Priority Panel (see description below). A conference call was subsequentlyscheduled with each Region to review their funding request for each site/project. Thesediscussions confirmed the resource estimates, the timing (fiscal quarter) when resources wereneeded, and whether other sources of funding were potentially available for the site/project (e.g.,reimbursable resources from State cost share payments or responsible party settlementresources). A preliminary estimate of potential deobligations also was obtained from eachRegion. Most ongoing projects require a relatively small amount of funding and are readilyapproved at the amount requested by the Regional Office, while the larger, higher cost projectsundergo a more detailed review. Factors considered in this review include the specific scope,status, and resource needs of the project, the total resource needs for all cleanup projects, theavailable budget for cleanup construction work from the Superfund appropriation, and otherpotential sources of funding. The goal of the program is to provide the resources required tomaintain cleanup progress during the year. This allocation may be less than the amount initiallyrequested by the Regional Office.
Concurrent with the work planning process, senior managers in EPA Headquarters, inconsultation with the Superfund Directors in the Regions, considered options for increasing theavailable funding for cleanup construction. After extensive deliberations, a decision was made totransfer $10 million from the Pipeline Operations AOA to the Remedial Action AOA. Inaddition, the Superfund deobligation policy was revised to direct a larger portion of deobligationresources to the National Deobligation Pool for construction funding. These adjustments wererequired to meet the growing need for resources for cleanup construction.
The FY 2003 Remedial Action AOA funding level, the Superfund deobligation policy, and theinitial funding plan for ongoing remedial action needs were issued in a memorandum to theRegions on October 30, 2002. The Remedial Action AOA was tentatively set at $230 million(subsequently reduced to $227.8 million based on the final appropriation received from Congressand the proposed Agency Operating Plan). The deobligation policy was set with 25 percent ofthe resources retained by the Regions for regional priorities and 75 percent returned toHeadquarters for national priorities, including funding for remedial action needs. Deobligationresources returned to Headquarters are placed in a reserve account called the NationalDeobligation Pool and remain available through the year until reprogrammed back to a Regionfor a specific project. The initial funding plan designated over $220 million from the RemedialAction AOA for more than 180 projects with ongoing funding needs (including cleanupconstruction projects, LTRA’s and five-year reviews).

Enclosure 9Page 3 of 5
Resources were provided to the Regional Offices as funding became available during thecontinuing resolution periods and after enactment of the appropriation, largely in accordancewith the funding plan. During the course of the year, the Regional Offices refined their projectneeds as cleanup work progressed in the field, and EPA Headquarters adjusted the initialallocations as needed. A comprehensive review was conducted at mid-year and a revised planreflecting the updated regional needs was issued on June 5, 2003. Resources were issued inaccordance with the plan over the remainder of the fiscal year.
Concurrent with the work planning process for ongoing projects, EPA Headquarters asked theRegional Offices to submit new start construction project candidates for consideration by theNational Risk Based Priorities Panel. EPA established this Panel to review and evaluateSuperfund cleanup construction projects that are expected to be ready to proceed during a fiscalyear. The Panel is comprised of national program experts from each EPA Regional Office andHeadquarters. The panel uses the following factors to evaluate each project:
• Risk of human exposure;• Stability of the contaminant;• Characteristics of the contaminant, including concentration and volume;• Ecological risk; and• Program Management considerations, such as whether (1) innovative technologies
can be employed, (2) design is complete, (3) the State’s share of cleanup costs isavailable; (4) environmental justice concerns are present, and (5) economicredevelopment may occur.
Each factor receives a score of from 1 to 5 and the project’s overall score is arrived at by addingthe raw scores multiplied by the weight of each factor. For FY 2003, 35 projects were reviewedby the Panel.
New start construction projects are funded depending on the availability of resources. Prioritiesare set based on the relative risk posed by the site as determined by the Panel, and the potentialfor achieving construction completion. Based on a projection of available resources, largely fromthe deobligation of unexpended prior year resources, EPA designated 11 projects to receiveconstruction funding during FY 2003. (OIG Note: one of the projects received removal fundsand another project received pipeline funds.)
Pipeline Operations AOA
EPA Headquarters and the Regional Offices engage in a work planning process for Pipeline AOA resources, but the critical difference is that Pipeline resources are not allocated to the Regions on a site/project-specific basis. For FY 2003, the Pipeline OperationsAOA funding level was initially set at $190 million (after $10 million was shifted to theRemedial Action AOA to augment the construction budget). Similar to the Remedial Action

Enclosure 9Page 4 of 5
AOA, Pipeline funding was subsequently reduced to $187 million following enactment of theSuperfund appropriation.
The Pipeline Operations AOA resources are distributed among the Regions based on the PipelineAllocation Model. A portion of the allocation is based on historical allocations and theremaining portion is based on a work-based scoring system. The work-based scoring systemcontains such factors as the number of completed actions, ongoing actions, and planned actions. Weights are assigned to the categories and differ depending on whether (1) the action will befunded with Federal funds or by the responsible parties, (2) the site is considered a mega site, orsites with estimated costs of $50 million or more, and (3) the site is on the NPL. The variousweights are used to calculate a work-based amount for each region. For FY 2003, the workplanning memorandum issued to the Regions on August 12, 2002, provided general guidanceregarding OSRTI’s projections of the funding that would be available to the Regions through thePipeline Operations AOA. Using this information, each Region planned for the use of its budget,entering its planned obligations and accomplishments for certain actions (e.g., remedialinvestigations/feasibility studies, remedial design, and oversight) into CERCLIS/WasteLAN. Pursuant to work planning discussions conducted during October/November 2002, EPAHeadquarters refined resource allocation projections based on the Pipeline Allocation Model andRegions finalized their planned accomplishments in CERCLIS/WasteLAN. As a result ofuncertainties due to the appropriation continuing resolutions, delays in obtaining an AgencyOperating Plan, and concerns regarding the availability of funds for construction, Headquartersfinalized its decision for distributing the Pipeline Operation AOA in April 2003.
FY 2002 Budget and Funding Process
The Remedial Action AOA planning and resource allocation process for FY 2002 was largely thesame as described above. The methodology for allocating Pipeline AOA resources in FY 2002was also substantially similar to that of FY 2003.
Process Changes from FY 2002 to FY 2003
Process changes from FY 2002 to FY 2003 include the following:
• The Remedial Action AOA was increased by $10 million for FY 2003 and the PipelineOperations AOA reduced by $10 million to address the increased need for cleanupconstruction funding. This decision, as well as the decision on the deobligation policy, wasreached after extensive consultation with the regional Superfund Division Directors.
• The Superfund deobligation policy was revised for FY 2003 to allocate a higher percentageof regional deobligations for cleanup construction to the national deobligations pool. Thisallocation was increased from 50 percent for FY 2002 to 75 percent for FY 2003.

Enclosure 9Page 5 of 5
• For FY 2003, work planning discussions between OSRTI and the regions for cleanupconstruction were done separately from the work planning discussions on all other programactivities. In prior years, construction resource discussions between OSRTI and the regionstook place during the first quarter of the fiscal year as part of the work planning sessions. Because the construction resource discussions for FY 2003 began in the summer of 2002,OSRTI and the regions were able to conduct a more thorough review of regional needs. Because these discussions took place sooner than in prior years, OSRTI was able to issue itsinitial funding plan early in the fiscal year – on October 30, 2002.
• Although not a change in policy, OSRTI issued a memorandum to the Regions onSeptember 20, 2002, reinforcing the need to explore all enforcement options prior toproceeding with a fund-financed cleanup construction project. The memorandum wasreleased during FY 2002, but had its most practical affect during FY 2003.
• The Pipeline Allocation Model was adjusted for FY 2003, including giving greater weight tothe number of pipeline actions completed in the prior year and giving more money to thoseregions that met or exceeded 80 percent of their planned starts for the previous fiscal year.
• The extended Continuing Resolution periods during FY 2003 resulted in increased controlover the allocation of funds to the Regions from both the Pipeline operations and RemedialAction AOAs to ensure critical needs could be met within the limited cash flow ofContinuing Resolution funding. Because each Continuing Resolution lasted for a specifiedperiod of time and only allowed a limited amount of funding to be used, OSRTI and theregions held discussions during each Continuing Resolution to discuss funding needs andcraft a funding plan for that Continuing Resolution.
• The FY 2002 Superfund appropriation included a provision that $100 million of theappropriated amount was not available until September 1, 2002 (referred to as the$100 million hold-back). The hold-back was allocated $60 million to the Remedial ActionAOA and $40 million to the Pipeline Operations AOA. As a result, these resources were notprovided to the regional offices until after September 1, 2002. Congress did not include thisprovision in the FY 2003 appropriation, allowing the Agency more flexibility in allocatingresources and funding projects.
Copies of memoranda relating to FY 2002 and FY 2003 processes are attached.
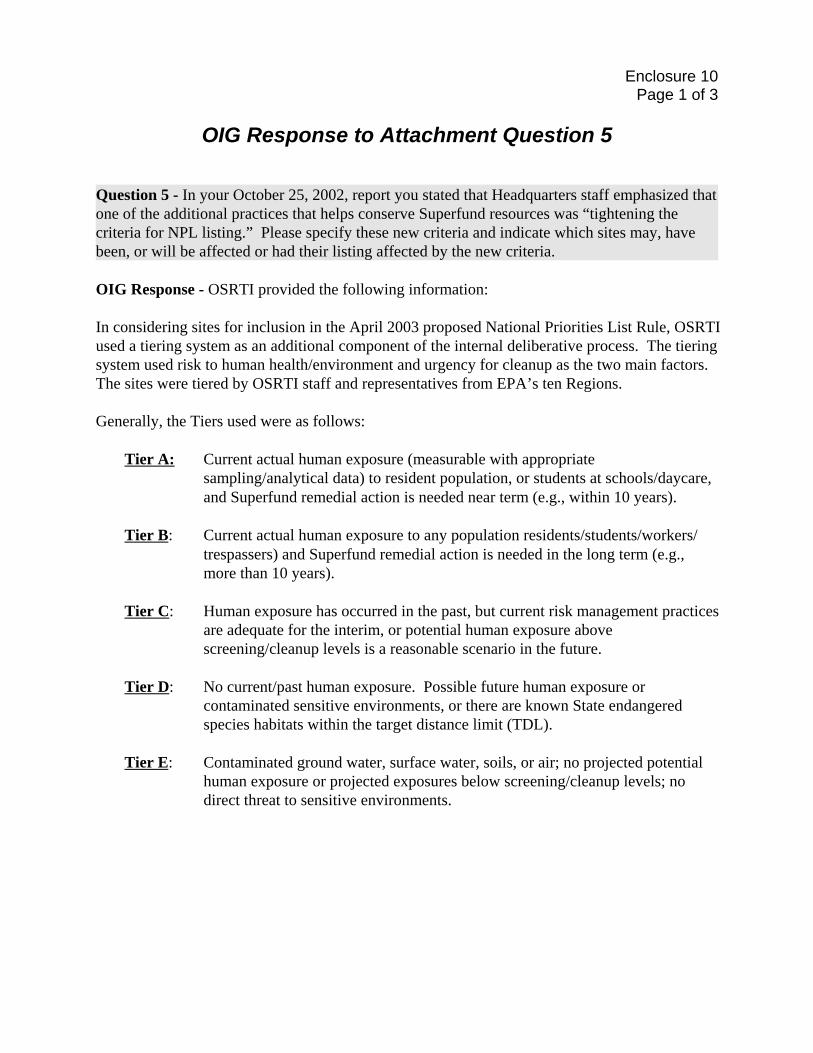
Enclosure 10Page 1 of 3
OIG Response to Attachment Question 5
Question 5 - In your October 25, 2002, report you stated that Headquarters staff emphasized thatone of the additional practices that helps conserve Superfund resources was “tightening thecriteria for NPL listing.” Please specify these new criteria and indicate which sites may, havebeen, or will be affected or had their listing affected by the new criteria.
OIG Response - OSRTI provided the following information:
In considering sites for inclusion in the April 2003 proposed National Priorities List Rule, OSRTIused a tiering system as an additional component of the internal deliberative process. The tieringsystem used risk to human health/environment and urgency for cleanup as the two main factors. The sites were tiered by OSRTI staff and representatives from EPA’s ten Regions.
Generally, the Tiers used were as follows:
Tier A: Current actual human exposure (measurable with appropriatesampling/analytical data) to resident population, or students at schools/daycare,and Superfund remedial action is needed near term (e.g., within 10 years).
Tier B: Current actual human exposure to any population residents/students/workers/trespassers) and Superfund remedial action is needed in the long term (e.g.,more than 10 years).
Tier C: Human exposure has occurred in the past, but current risk management practicesare adequate for the interim, or potential human exposure abovescreening/cleanup levels is a reasonable scenario in the future.
Tier D: No current/past human exposure. Possible future human exposure orcontaminated sensitive environments, or there are known State endangeredspecies habitats within the target distance limit (TDL).
Tier E: Contaminated ground water, surface water, soils, or air; no projected potentialhuman exposure or projected exposures below screening/cleanup levels; nodirect threat to sensitive environments.

Enclosure 10Page 2 of 3
Once the sites potentially eligible for the April 2003 NPL update were identified by EPA regions,the sites were selected for further evaluation by taking the Tiers into account. In selecting sitesfor this rule, EPA considered, in addition to the Tiers:
• the need for a strong enforcement program through cleanups conducted or financed by PRPs;
• the level of State, tribal, community, and congressional delegation support; • estimated cleanup costs;• the timing of the costs and cleanup;• environmental justice issues; • prospects for commercial redevelopment; and• geographic balance.
An OSRTI official indicated that cleanup costs and timing were considered in the aggregate (e.g.,the costs for all Tier A and B sites were presented as an option to management) and were not thecause for a final decision on any site. The official indicated that while the regions had consideredthe factors above for past rulemakings, this was the first time factors other than legal defensibilityhad been considered by Headquarters. These considerations resulted in proposing 14 sites (out of30 sites identified by the regions) to the NPL on April 30, 2003 (68 FR 23094).
The 14 sites proposed were as follows:
Proposed Rule No. 39, General Superfund Section-------------------------------------------------------------------------------------------------------------State Site name City/county ---------------------------------------------------------------------------------------------------------------- CA AMCO Chemical Oakland CO Captain Jack Mill Ward MD 68th Street Dump Baltimore MO Madison County Mines Fredericktown MO Newton County Mine Tailings Newton County NC Ram Leather Care Charlotte NH Troy Mills Landfill Troy NJ Rolling Knolls Landfill Chatham Township NJ Standard Chlorine Chemical Company, Inc. Kearny NJ White Swan/Sun Cleaners GW Contamination Wall Township OH Armco Inc., Hamilton Plant Hamilton OH Peters Cartridge Factory Kings Mills TX Conroe Creosoting Company Conroe TX Jones Road Ground Water Plume Harris County
(EPA considers the 16 sites not proposed to be deliberative and enforcement-sensitiveinformation. Seven sites were added to the NPL in April 2003, but these sites related to prior

Enclosure 10Page 3 of 3
rulemakings and thus were not evaluated using the tiering process described above. Final listingdecisions concerning the 14 sites will occur after the public comment period closes and allrelevant comments are considered and addressed.)
The tiering process only aided in identifying sites that should be a priority for further evaluation. Sites initially identified as candidates for proposed listing may not ultimately beproposed for listing for several reasons. Further technical, legal and policy review may indicatethat certain sites are not ready for proposed listing. For example, EPA postponed decisions onsome sites because States requested additional time to negotiate cleanup agreements or,alternately, EPA plans to negotiate cleanup agreements under the Superfund Alternative Sitesapproach. (Under the Superfund Alternative Sites policy, the listing process is suspended whileresponsible parties are given an opportunity to enter into an agreement to clean up the site in thesame manner as if the site were listed.) Other EPA policies that may affect the decision topropose listing a site on the NPL include EPA’s Resource Conservation and Recovery Actdeferral and State deferral policies. According to OSRTI officials, the Agency will consider allsites identified by the regions as eligible for listing for future NPL proposed rules. While OSRTIwill obtain information on the factors indicated above for the next proposed rulemaking, it hasnot decided how this information will be used.
(OIG note: The U.S. General Accounting Office discussed the tiering process on page 29 of itsJuly 2003 report, “Superfund Program: Current Status and Future Fiscal Challenges,” GAO-03-850.)
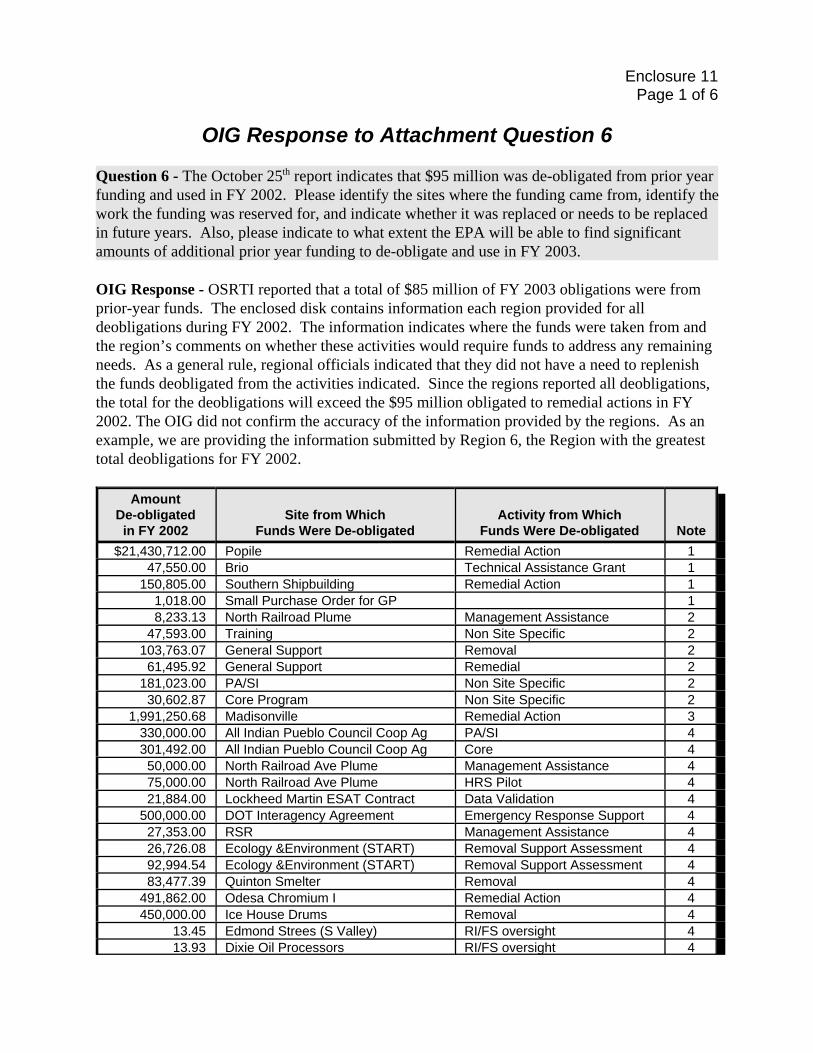
Enclosure 11Page 1 of 6
OIG Response to Attachment Question 6
Question 6 - The October 25th report indicates that $95 million was de-obligated from prior yearfunding and used in FY 2002. Please identify the sites where the funding came from, identify thework the funding was reserved for, and indicate whether it was replaced or needs to be replacedin future years. Also, please indicate to what extent the EPA will be able to find significantamounts of additional prior year funding to de-obligate and use in FY 2003.
OIG Response - OSRTI reported that a total of $85 million of FY 2003 obligations were fromprior-year funds. The enclosed disk contains information each region provided for alldeobligations during FY 2002. The information indicates where the funds were taken from andthe region’s comments on whether these activities would require funds to address any remainingneeds. As a general rule, regional officials indicated that they did not have a need to replenishthe funds deobligated from the activities indicated. Since the regions reported all deobligations,the total for the deobligations will exceed the $95 million obligated to remedial actions in FY2002. The OIG did not confirm the accuracy of the information provided by the regions. As anexample, we are providing the information submitted by Region 6, the Region with the greatesttotal deobligations for FY 2002.
AmountDe-obligatedin FY 2002
Site from WhichFunds Were De-obligated
Activity from Which
Funds Were De-obligated Note$21,430,712.00 Popile Remedial Action 1
47,550.00 Brio Technical Assistance Grant 1150,805.00 Southern Shipbuilding Remedial Action 1
1,018.00 Small Purchase Order for GP 18,233.13 North Railroad Plume Management Assistance 2
47,593.00 Training Non Site Specific 2103,763.07 General Support Removal 261,495.92 General Support Remedial 2
181,023.00 PA/SI Non Site Specific 230,602.87 Core Program Non Site Specific 2
1,991,250.68 Madisonville Remedial Action 3330,000.00 All Indian Pueblo Council Coop Ag PA/SI 4301,492.00 All Indian Pueblo Council Coop Ag Core 450,000.00 North Railroad Ave Plume Management Assistance 475,000.00 North Railroad Ave Plume HRS Pilot 421,884.00 Lockheed Martin ESAT Contract Data Validation 4
500,000.00 DOT Interagency Agreement Emergency Response Support 427,353.00 RSR Management Assistance 426,726.08 Ecology &Environment (START) Removal Support Assessment 492,994.54 Ecology &Environment (START) Removal Support Assessment 483,477.39 Quinton Smelter Removal 4
491,862.00 Odesa Chromium I Remedial Action 4450,000.00 Ice House Drums Removal 4
13.45 Edmond Strees (S Valley) RI/FS oversight 413.93 Dixie Oil Processors RI/FS oversight 4

Enclosure 11Page 2 of 6
AmountDe-obligatedin FY 2002
Site from WhichFunds Were De-obligated
Activity from Which
Funds Were De-obligated Note1.20 Sheridan (cashout) RI/FS oversight 4
2,911.29 PA/SI Non-site 4722.43 Brio Oversight 4376.19 RAB Valley RI/FS 4142.40 Arkwood Oversight 421.47 Ag Street Community Involvement 4
31,677.51 ARCS Contract Management Non-site 423.26 Integrated Assessment Non-site 4
15,000.00 Site Assessment 415,000.00 Tinker AFB RD oversight 419,991.03 South 8th Street Oversight 47,506.22 ATSF-Alburquerque Remedial Analysis 48,174.48 Rinchem Remedial Analysis 4
10,594.14 Tinker AFB RA oversight 4370.04 Remedial Support 4
36,561.26 4th Street Remedial Action 412,437.80 Bailey Waste PRP RA 426,701.28 ARCS Contract Non-site 4
301.54 Sol Lynn Oversight 439,707.46 South Calvacade Oversight 419,873.57 Hardage Oversight 413,664.59 Alcoa/Lavaca Bay Oversight 419,597.92 Koppers Oversight 418,517.12 Mosley Road Oversight 410,286.65 Petrochem Oversight 438,494.07 ATSF-Clovis Oversight 450,040.68 PA/SI Non-site 43,563.92 Alcoa/Lavaca Bay Remedial Analysis 4
235,465.89 06009 Contract Bulk Funding 417,661.68 4th Street RD 43,203.77 South 8th Street RI/FS 4
15,000.00 South 8th Street RD 423,715.35 Integrated Assessment Non-site 419,690.49 PetroChem RD 423,970.47 Double Eagle RA 425,514.13 Double Eagle RD 44,155.21 Ag Street FS 44,470.81 Bayou D'Inde RI/FS 4
280,716.62 06009 Contract Program Management 463,236.94 4th Street RI/FS 41,000.00 Sol Lynn RD 4
39,792.36 Double Eagle RI/FS 43,817.58 North Calvacade RD 48,107.28 Texarkana Wood RD 4
10,908.67 Texarkana Wood RI/FS 4

Enclosure 11Page 3 of 6
AmountDe-obligatedin FY 2002
Site from WhichFunds Were De-obligated
Activity from Which
Funds Were De-obligated Note10,325.10 United Creosoting RD 410,196.28 Bio Ecology RA 442,252.72 Morrison Knudson Program Management 4
1,770,000.00 Tar Creek RI/FS 42,200,000.00 Agriculture Street Landfill Non-time Critical Removal 4
52,846.00 Brio Refining Remedial design 420,035.00 Koppers Remedial Analysis 424,039.00 MOTCO PRP Oversight 414,533.00 Petro Chemical Management Assistance 44,708.00 South Cavalcade PRP Oversight 4
26,409.00 Sprague Road Management Assistance 4200,000.00 Texarkana Wood Remedial Action 4491,347.00 Texarkana Wood Remedial Design 483,000.00 Thermo Labsystems Laboratory Support 430,548.99 Metcalf & Eddy TES Contract Non-site Specific Tech. Supp. 44,103.00 Non-site Specific CORE Program 43,040.00 Non-site Specific PA/SI 4
51,165.00 ATSF-Alburquerque RI/FS Oversight 46,755.00 Cal West Remedial Action 4
13,745.00 Cimarron Mining Management Assistance 412,144.00 Cleveland Mill Management Assistance 46,627.00 ATSF - Clovis Management Assistance 4
12,096.00 Homestake Mining Management Assistance 443,309.00 Molycorp Management Assistance 413,764.00 South Valley Management Assistance 47,273.00 United Nuclear Management Assistance 4
12,075.00 Lee Acres Management Assistance 4181,538.52 A & B Border Contract Non-site Technical Support 4
6,822.70 LaCostex Refining Technical Assistance 411,164.56 R&H Oil Technical Assistance 415,000.00 Tropicana Refinery Technical Assistance 43,096.93 J.C. Elliott Technical Assistance 43,368.20 Brownsville Drums Technical Assistance 42,616.74 Los Ebanos Removal Support 49,678.59 Gulf Coast Paint Technical Assistance 4
775.96 Hazardous Materials Workshop Training 4579,275.00 Many Diversified Interests RI/FS 415,939.00 Sikes Pits Remedial Action 4
494,928.00 Odessa Chromium II Remedial Action 46,743.00 Tex-Tin Management Assistance 4
395,808.00 Jasper Creosoting RI/FS 49,610,864.00 Sikes Pits Remedial Action 4
871,798.00 North Calvacade Remedial Action 421,100.00 Angie Wood Removal 448,500.00 Jasper Creosoting Removal 4

Enclosure 11Page 4 of 6
AmountDe-obligatedin FY 2002
Site from WhichFunds Were De-obligated
Activity from Which
Funds Were De-obligated Note129.83 Southern Shipbuilding Removal 4
19,546.25 Texas Gulf Refining Removal 420,000.05 Sprague Rd GW Plume Removal 4
485.65 Mallard Bay Removal 4436.10 Delatte Metals Removal 4
80,122.26 New Orleans Parathion Removal 457,280.11 Stephenson Bennett Removal 4
316.70 Mylar Fire Removal 429.40 BPS, Inc. Removal 4
68,115.46 Hudson Refinery Removal 437,421.59 Rogers Enterprises Removal 4
112.03 Hot Springs Mercury Removal 420,729.38 Dallas Plating Removal 49,415.56 Texarkana Mercury & Neon Removal 4
39,687.88 Renner Creosoting Removal 43,144.03 Doughty's Treating Plant Removal 4
787.14 Pleasant Hill Pole Plant Removal 4122,707.21 Union Creosoting Removal 4
224.18 Plano Mercury Removal 4154,154.10 R&H Oil Removal 456,708.55 Tropicana Energy Co Removal 4
350.49 Eri Tire Fire Removal 488.05 Limestone Landfill Fire Removal 4
7,030.03 Malone Service Co Removal 4772.70 R&P Electroplating Removal 4448.36 Rockwall Mercury Removal 4448.36 Arabi Mercury Spill Removal 4
80,050.52 Gibson Recyling Tire Fire Removal 425,434.87 Little Bit Rad Site Removal 43,342.66 Old Storm Plastics Facility Removal 4
10,410.07 Southwest Tire Processors Removal 45,031.38 Woods Tank Farm Removal 4
24,000.00 Red River Aluminum Removal 46,110.29 Coastal Radiation Services Removal 4
72,750.02 Gulf States Paint Removal 42,950.40 North Louisiana Chemical Removal 42,095.80 Tar Creek E-P Lab Chemicals Removal 4
46,207.09 Urban Machine Removal 410,516.31 Brownsville Furfural Spill Removal 436,504.64 Dewey Mercury Removal 415,613.36 Sol Lynn Well Plug Removal Removal 417,284.90 Alvin Mercury Removal 464,604.64 ETP Removal 421,944.25 Nonsite Funding for Site Walks Removal 4
602.00 Gulf Coast Vacuum Removal 4

Enclosure 11Page 5 of 6
AmountDe-obligatedin FY 2002
Site from WhichFunds Were De-obligated
Activity from Which
Funds Were De-obligated Note119.00 Vertac Removal 4
1,789.00 Kem Week Control Removal 4334.00 Ella Warehouse Drums Removal 4
1,110.00 Service Circuits Removal 42,228.00 Poly Cycle Removal 41,610.00 Malter Internation Removal 4
567.00 Dempco Paint & MFG Removal 4588.67 Shore Refining Removal 4
1,175.00 Patterson-Edmonson Construction Removal 42,891.00 Okay Trailer Park Removal 4
11,613.32 Glenmora Creosoting Removal 41,376.00 Card/Blanc/Carter Removal 43,169.00 Hillsdale Drums Removal 42,137.00 Marco of Iota Removal 46,300.55 Hi-Chem. Inc. Removal 4
859.00 Macmillan Ring Free Removal 41,033.00 Lithium of Lubbock Removal 41,023.00 Russell Fare Site Removal 4
542.00 Ann T. King Property Removal 48,132.93 Smith Smelter Removal 4
944.00 Oklahoma Furniture Removal 41,023.00 Hardco of Arkansas Removal 4
252.00 Boeck Drums Removal 41,980.00 Rab Valley Removal 4
75,461.88 RSR OU1-Phase II RV Area Removal 41,605.00 Johnson Lumber Removal 45,296.52 Hart Creosoting Removal 4
13,490.96 Central Wood Removal 413,501.21 Tri Container Inc. Removal 41,621.00 Good Latimer Removal 41,450.00 Willie Heard Drum Removal 43,216.00 Hearst Mill Removal 41,333.00 Matagorda Round Up Removal 4
967.18 Waco Drum Removal 42,670.00 Terrell Plating Removal 4
826.00 Reliable Coatings Removal 4714.00 Clearwater Fluids Recycling Removal 4
13,366.16 Robin Boulevard Removal 4185.98 G.P. Drums Removal 4
3,573.11 Ray Quinn Drum Removal 4364.17 Voda Petroleum Removal 4
1,063.00 Cimarron Refining Removal 4915.00 Jacksonville Landfill Removal 4
12,907.59 JC Pennco Waste Oil Removal 41,310.93 Archem Company Removal 4

AmountDe-obligatedin FY 2002
Site from WhichFunds Were De-obligated
Activity from Which
Funds Were De-obligated Note27,079.20 Tar Creek OU2 Removal 43,219.46 Safe Tire Fire Removal 41,199.00 Rogers Road Landfill Removal 43,041.91 Agricultural Street Landfill Removal 4
480.00 Oklahoma Refining Company Removal 4499.00 Oklahoma Refining Removal 4
1,381.00 Tomlinson Drums Removal 41,639.00 King Sales Company Removal 4
274.00 Baldwin Waste Oil Removal 4664.00 T/B Gail Removal 4
17,111.27 CG Empire Tank Barge Removal 41,041.00 Hart Creosoting Removal 41,811.00 Red River Treating Removal 4
$46,547,122.77 Total
Notes 1 The funds deobligated from these projects, especially the Popile Remedial Action, were no longer needed as
the action was complete. The funds were part of the Pipeline Operations AOA to assist the Region with theshortfall in that AOA and were not obligated for these same sites for these same activities.
2 The Cooperative Agreement with the All Indian Pueblo Consortium (AIPC) was closed out. Funds in the amount
of $216,355 were obligated to American Creosote for ongoing Remedial Action and Five-Year Review in FY2002.
3 The funds deobligated from this project were no longer needed as the action was complete. The funds were
part of the Removal Advice of Allowance and obligated on some removal actions and in the START contract forremoval support.
4 Of the total funds recertified to the Region, $6,151,860 was reobligated in FY2002 for the same sites and the
same activities from which the funds were deobligated. These funds were transferred from one funding vehicleto another type. The remaining $8,170,608 was deobligated from projects that were complete and the fundswere no longer needed. These monies were obligated in FY 2002 for the Tar Creek Remedial Action ($5million) and three removal actions.