Embed Size (px)
Citation preview
Department of Health and Human Services
OFFICE OF INSPECTOR GENERAL
DRG 296 VALIDATION UPDATE: NUTRITIONAL AND MISCELLANEOUS
METABOLIC DISORDERS
OCTOBER 1992
OFFICE OF INSPECTOR GENERAL
The mission of the Office of Inspector General (OIG), as mandated by Public Law 95-452, as amended, is to protect the integrity of the Department of Health and Human Services (HHS) programs as well as the health and welfare of beneficiaries served by those programs. This statutory mission is carried out through a nationwide network of audits, investigations, and inspections conducted by three OIG operating components: the Office of Audit Services, the Office of Investigations, and the Office of Evaluations and Inspections. The OIG also informs the Secretary of HHS program and management problems and recommends courses to correct them.
OFFICE OF AUDIT SERVICES
The OIG’S Office of Audit Services (OAS) provides all auditing semices for HHS, either by conducting audits with its own audit resources or by overseeing audit work done by others. Audits examine the performance of HHS programs and/or its grantees and contractors in carrying out their respective responsibilities and are intended to provide independent assessments of HHS programs and operations in order to reduce waste, abuse, and mismanagement and to promote economy and efficiency throughout the Department.
OFFICE OF INVESTIGATIONS
The OIG’S Office of Investigations (01) conducts criminal, civil, and administrative investigations of allegations of wrongdoing in HHS programs or to HHS beneficiaries and of unjust enrichment by providers. The investigative efforts of 01 lead to criminal convictions, administrative sanctions, or civil money penalties. The 01 also oversees State Medicaid fraud control units which investigate and prosecute fraud and patient abuse in the Medicaid program.
OFFICE OF EVALUATION AND INSPECTIONS
The OIG’S Office of Evaluation and Inspections (OEI) conducts short-term management and program evaluations (called inspections) that focus on issues of concern to the Department, the Congress, and the public. The findings and recommendations contained in these inspection reports generate rapid, accurate, and up-to-date information on the efficiency, vulnerability, and effectiveness of departmental programs.
Amy L. Lockwood of BOTEC Analysis Corporation prepared this report with direction from Janet W. Knight, BOTEC Project Director, and David C. Hsia, OIG Project Officer. Contract information and project participants are listed in Appendix A to this inspection.
Department of Health and Human Services
OFFICE OF INSPECTOR GENERAL
DRG 296 VALIDATION UPDATE: NUTRITIONAL AND MISCELLANEOUS
METABOLIC DISORDERS
OCTOBER 1992 OEI-12-89-00195
EXECUTIVE SUMMARY
PURPOSE
This inspection reabstracted on a blinded basis, the International Classification of Diseases, 9th Edition, Clinical Modification codes from a sample of Medicare discharges billed as diagnosis-related group (DRG) 296, nutritional and miscellaneous metabolic disorders. It compared the reabstracted DRG to the hospital-billed DRG for reimbursement changes. The sample was nationally representative and covered all of 1988, the most recent data available.
This inspection updated a previous Office of Inspector General (OIG) study. For 1985, the OIG found 19.3 percent errors among 173 reabstractions, improperly over-reimbursing hospitals by a projected $19.9 million. This inspection used a parallel methodology to make these studies statistically comparable.
FINDINGS
DRG 296 errom not reduced
Of 106 discharges reabstracted for this inspection, 10.4 percent had billing errors. This proportion did not differ statistically from the 19.3 percent errors for DRG 296 discharges in 1985. It also did not differ statistically from the 14.7 percent errors for all discharges in 1988.
DRG 296 erronrrandom
Of 11 bills with DRG errors, 45.5 percent over-reimbursed the hospital. This proportion differed statistically from the 75.0 percent over-reimbursement in 1985.
DRG 296 erron cause no over-reimbursement
The DRG 296 billing errors under-reimbursed hospitals $14.7 million. While not itself statistically different from zero (no under-reimbursement), this result does differ statistically from the $19,9 million over-reimbursement in 1985.
i
TABLE OF CONTENTS
EXECUTIVE SUMMARY . . . . . . . . . . . . . . . . . . . . . . . . . . . . . . . . . . . . . . . . . i
TABLE OF CONTENTS . . . . . . . . . . . . . . . . . . . . . . . . . . . . . . . . . . . . . . . . . . . ii
INTRODU(XION . . . . . . . . . . . . . . . . . . . . . . . . . . . . . . . . . . . . . . . . . . . . . . . . 1
FINDINGS . . . . . . . . . . . . . . . . . . . . . . . . . . . . . . . . . . . . . . . . . . . . . . . . . . . . . 4Errorsnotreduced . . . . . . . . . . . . . . . . . . . . . . . . . . . . . . . . . . . . . . . . . . 4Errors occur randomly . . . . . . . . . . . . . . . . . . . . . . . . . . . . . . . . . . . . . . . . 4Errors cause no over-reimbursement . . . . . . . . . . . . . . . . . . . . . . . . . . . . . 5Reasons for errors . . . . . . . . . . . . . . . . . . . . . . . . . . . . . . . . . . . . . . . . . . . 5
ENDNOTES . . . . . . . . . . . . . . . . . . . . . . . . . . . . . . . . . . . . . . . . . . . . . . . . . . . . 6
APPENDICES . . . . . . . . . . . . . . . . . . . . . . . . . . . . . . . . . . . . . . . . . . . . . . . . . . . 7
A: Project participants . . . . . . . . . . . . . . . . . . . . . . . . . . . . . . . . . . . . . . . . . . . . . 8
B: ICD-9-CM codes in DRG 296..... . . . . . . . . . . . . . . . . . . . . . . . . . . . . . . . 10
C: Sample representativeness. . . . . . . . . . . . . . . . . . . . . . . . . . . . . . . . . . . . . . . 11
D: Proportion of DRG 296 billing errors, 1985 and 1988 . . . . . . . . . . . . . . . . . . . 12
E: DRG296case-mix index change, 1985 and 1988 . . . . . . . . . . . . . . . . . . . . . . 13
INTRODUCTION
Background
Diagnosis-related group (DRG) 296 accepts 58 International Classification of Diseases, %hEdition, Clinical Modification (ICD-9-CM) codes asptincipal diagnoses. These ICD-9-CM codes identify metabolic disorders principally associated with dehydration and fluid-electrolyte imbalances. DRG 297 accepts the same principal diagnoses, but requires a complication. DRGs 296 and 297 do not include admissions for diabetes, the commonest metabolic order. [Appendix B].
DRG 296’s weight increased from 0.8886 in 1985 to 0.9259 in 1988. Beginning in FY 1988, the HCFA altered DRG 296 to drop age over 69 as a complication code. This change shifted billings in one quarter of the data collection period for this inspection.
In a previous study, the OIG found that DRG 296 had an unusually high proportion of billing errors.1 Correct ICD-9-CM coding would have grouped 19.3 percent of its 173 reabstractions to different DRGs in 1985. These billing errors over-reimbursed the hospitals a projected $19.9 million.
This inspection updated the previous study using 1988 data, the most recent available. It used a parallel methodology to make these inspections statistically comparable.
Methodology
This inspection randomly selected 106 DRG 296 discharges. The study populationconsisted of the 191,509 Medicare-reimbursed DRG 296 discharges during calendaryear 1988. The design excluded discharges from specialty institutions such aschildren’s hospitals, tuberculosis units, and psychiatric facilities. It also excludeddischarges in Maryland and New Jersey, which the PPS still exempted in 1988. Finally,it excluded bills for pediatric, obstetric, and psychiatric DRGs (principally drug andalcohol rehabilitation performed by a general hospital).2 Unlike its 1985 predecessor,it included hospitals established since the advent of the PPS in 1983.
The OIG requested that hospitals send complete copies of the sampled medicalrecords to the OIG’S contractor, Baxter-Health Data Institute (HDI) of Lexington,MA. The OIG followed-up missing records and issued subpoenas to compel thecooperation of four hospitals.
The OIG contracted with the American Medical Record Association (AMRA) toreabstract the charts. The AMRA selected ICD-9-CM codes supported by the record,determined the principle diagnosis, and grouped to select the correct DRG. To assurethat the original ICD-9-CM codes and DRGs did not effect the reabstraction, theAMRA coders conducted their work without knowledge of the original ICD-9-CMcodes and DRGs. The coders had instructions not to treat marginal problems or
1
honest differences injudgement about appropriate coding as DRG errors. This standard should have produced a conservative estimate of the proportion of discharges having DRG errors. A series of reliability checks verified the reproducibility and accuracy of the AMRA coding. The AMRA also identified the reasons why a hospital’s bill differed from the correct codes.
BOTEC Analysis Corporation of Cambridge, Massachusetts (BOTEC) edited the AMRA database, checked the sample’s representativeness, and conducted statistical analyses of the correlates and financial consequences of DRG 296 miscoding. It also reweighted the 1985 data to improve comparability with this inspection. The t-test determined whether numeric differences between the 1985 results and 1988 results were real (statistically significant) or could be attributed to random error.
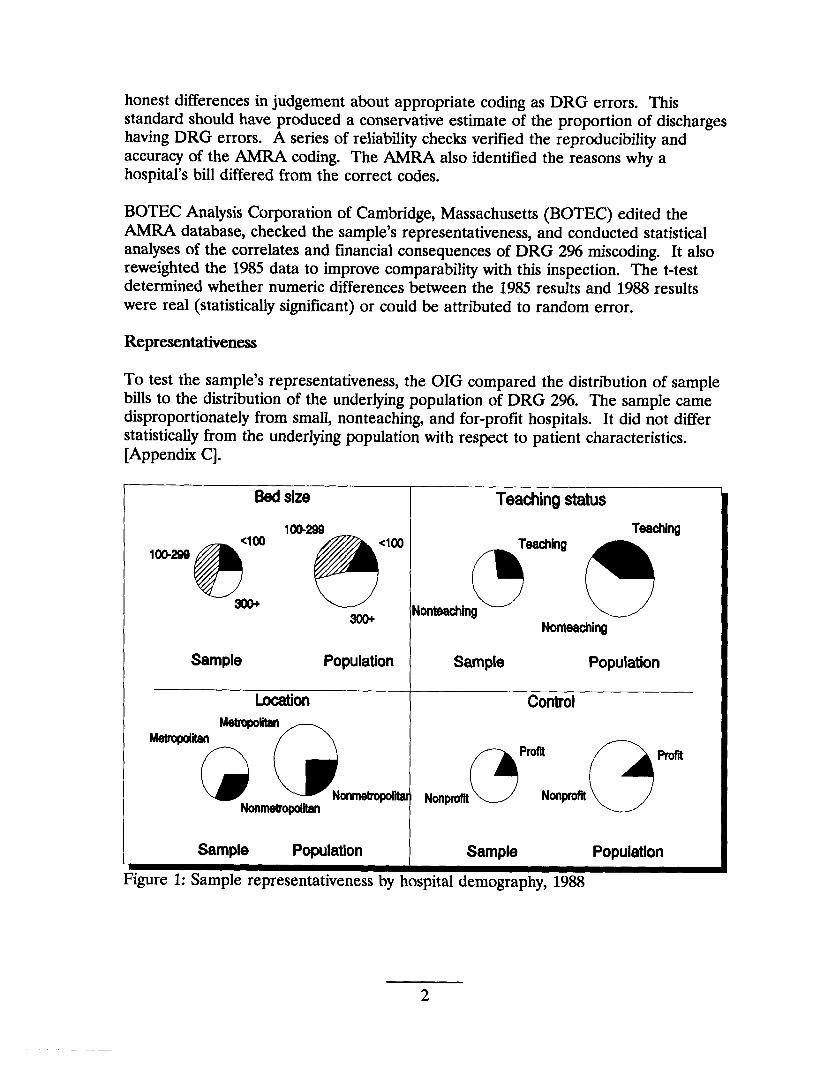
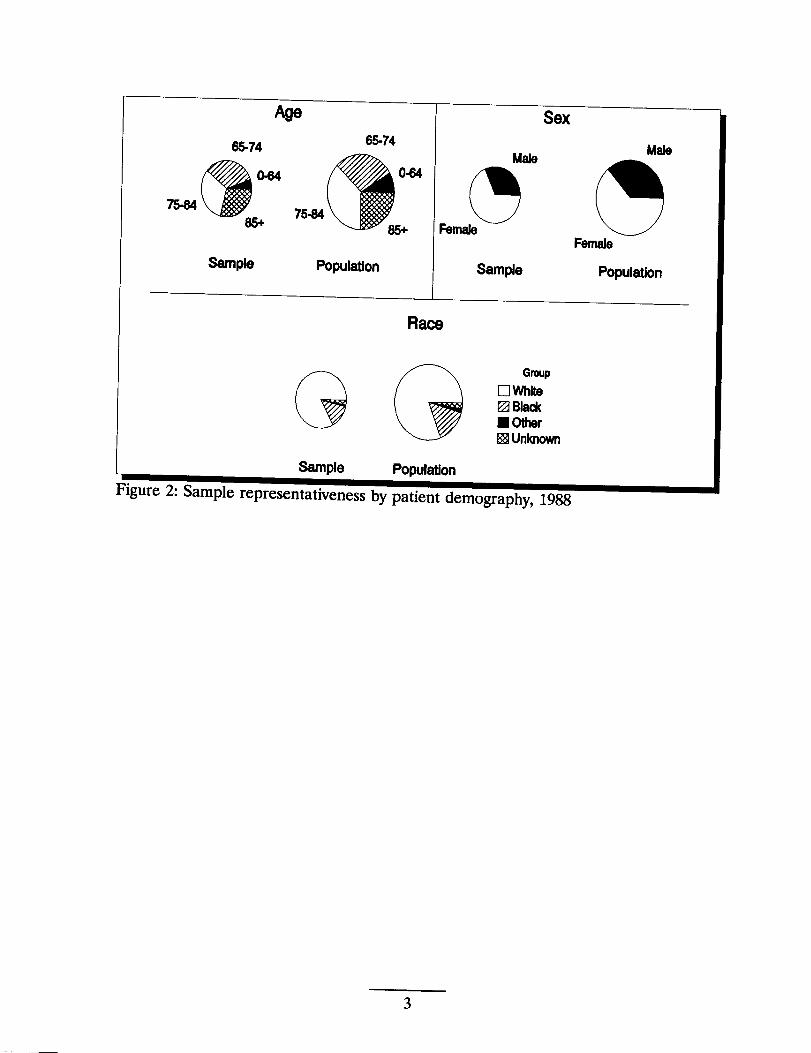
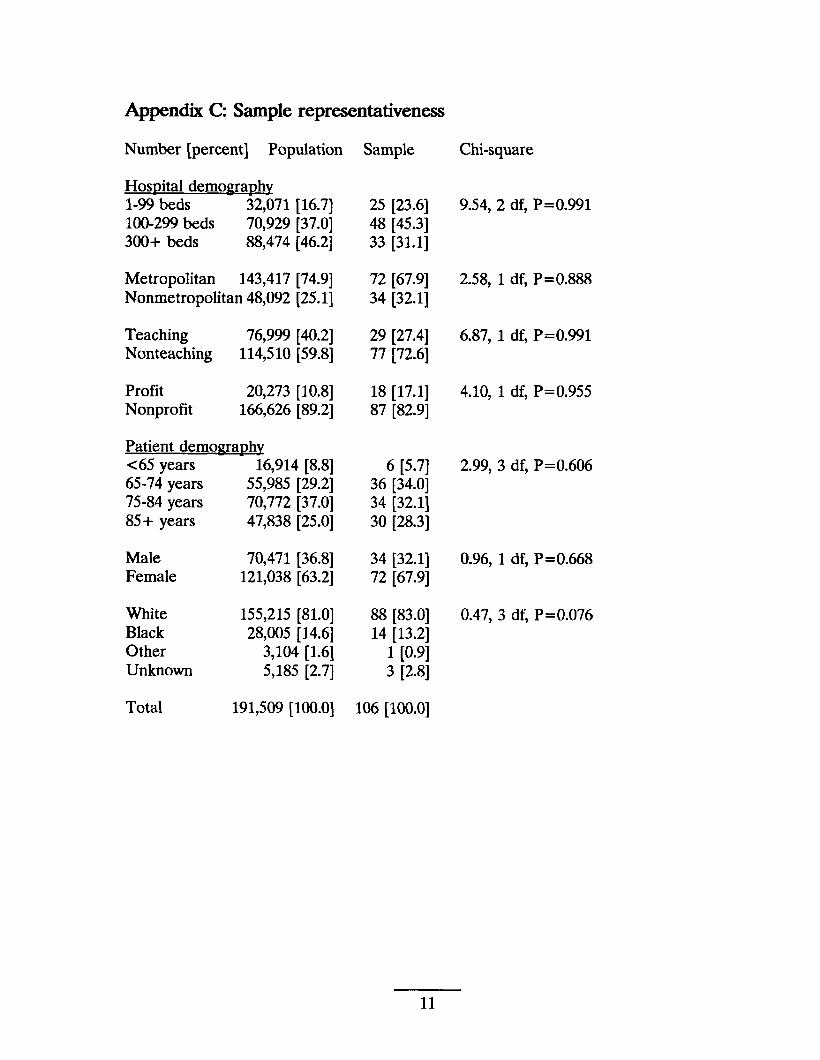
Representativeness
To test the sample’s representativeness, the OIG compared the distribution of sample bills to the distribution of the underlying population of DRG 296. The sample came disproportionately from small, nonteaching, and for-profit hospitals. It did not differ statistically from the underlying population with respect to patient characteristics. [Appendix C].
Bedsize I Teachingstatus
lW-299 Taaching<I(M
100-299
@l!!5* ~<’m ,on.w.~ ~
Nonteachhg
Sample Population Sample Population
Looation Controi
,mm@pr”Nm.(=Jm‘“Q:_QNm..
Sample Population Sample Population
2
Age Sex
Race
3
FINDINGS
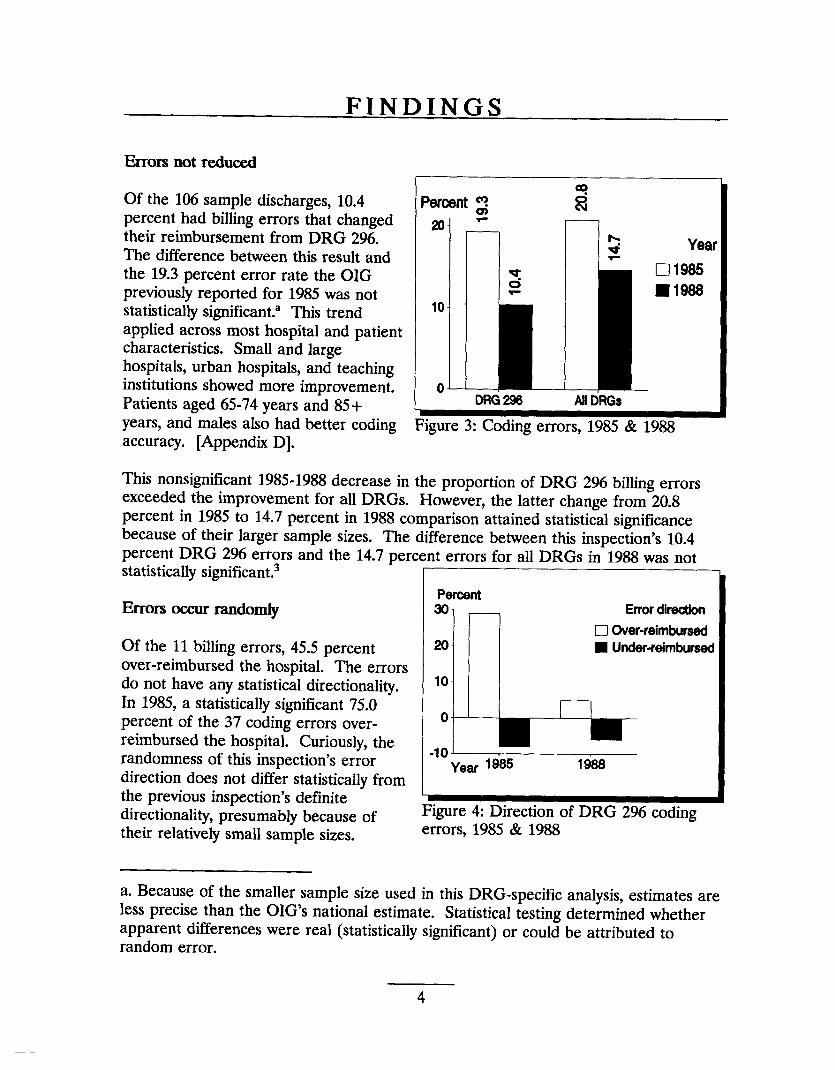
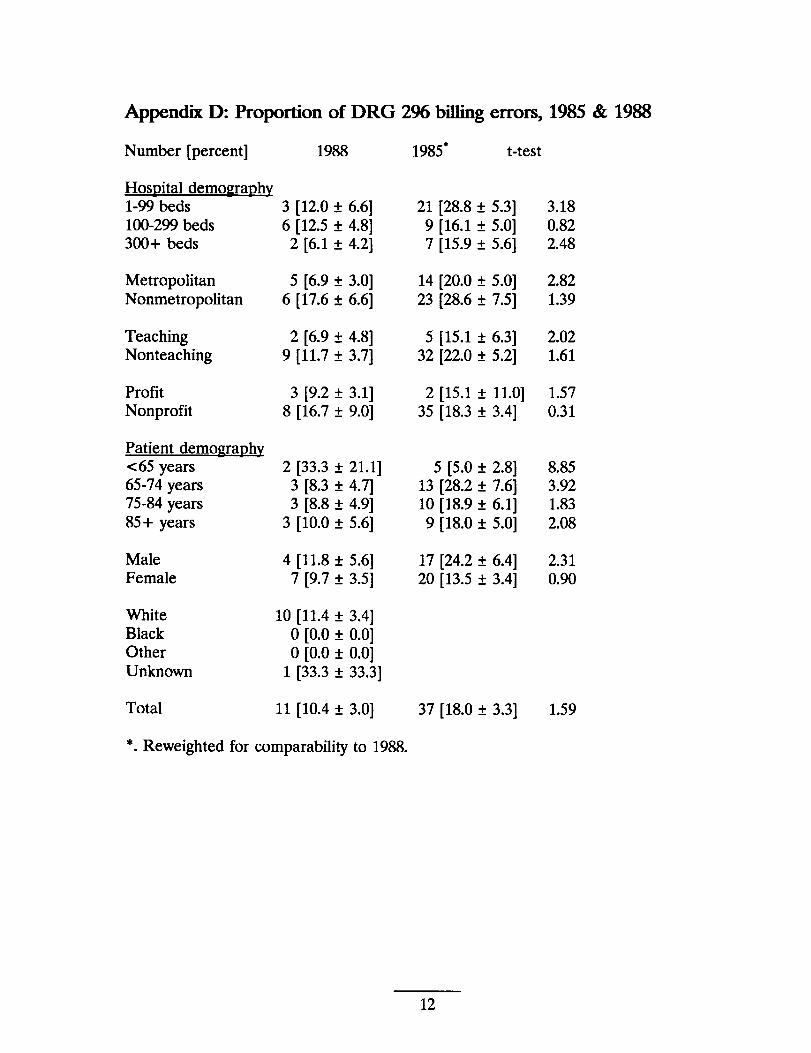
Errors not reduced
Of the 106 sample discharges, 10.4percent had billing errors that changed 20their reimbursement from DRG 296.The difference between this result andthe 19.3 percent error rate the OIGpreviously reported for 1985 was notstatistically significant.a This trend 10
applied across most hospital and patientcharacteristics. Small and largehospitals, urban hospitals, and teaching
+ —
Year
•1 1985
� 1988
institutions showed more improvement. 0i —
Patients aged 65-74 years and 85+years, and males also had better coding Figure 3: Coding errors, 1985 & 1988accuracy. [Appendix D].
This nonsignificant 1985-1988 decrease in the proportion of DRG 296 billing errorsexceeded the improvement for all DRGs. However, the latter change from 20.8percent in 1985 to 14.7 percent in 1988 comparison attained statistical significancebecause of their larger sample sizes. The difference between this inspection’s 10.4percent DRG 296 e~rors and the 14.7 percent errors for all DRGs in-1988 was notstatistically significant.3
&Ol_S occur randomly
Of the 11 billing errors, 45.5 percent over-reimbursed the hospital. The errors do not have any statistical directionality. In 1985, a statistically significant 75.0 percent of the 37 coding errors over-reimbursed the hospital. Curiously, the randomness of this inspection’s error direction does not differ statistically from the previous inspection’s definite
Percent 30- Errordkectlon
� Over-reimbursed 20 � Under-reimbursed
lo-
0-
-1o-Year 1~ 1988
directionality, presumably because of Figure 4: Direction of DRG 296 coding
their relatively small sample sizes. errors, 1985 & 1988
a. Because of the smaller sample size used in this DRG-specific analysis, estimates are less precise than the OIGS national estimate. Statistical testing determined whether apparent differences were real (statistically significant) or could be attributed to random error.
4
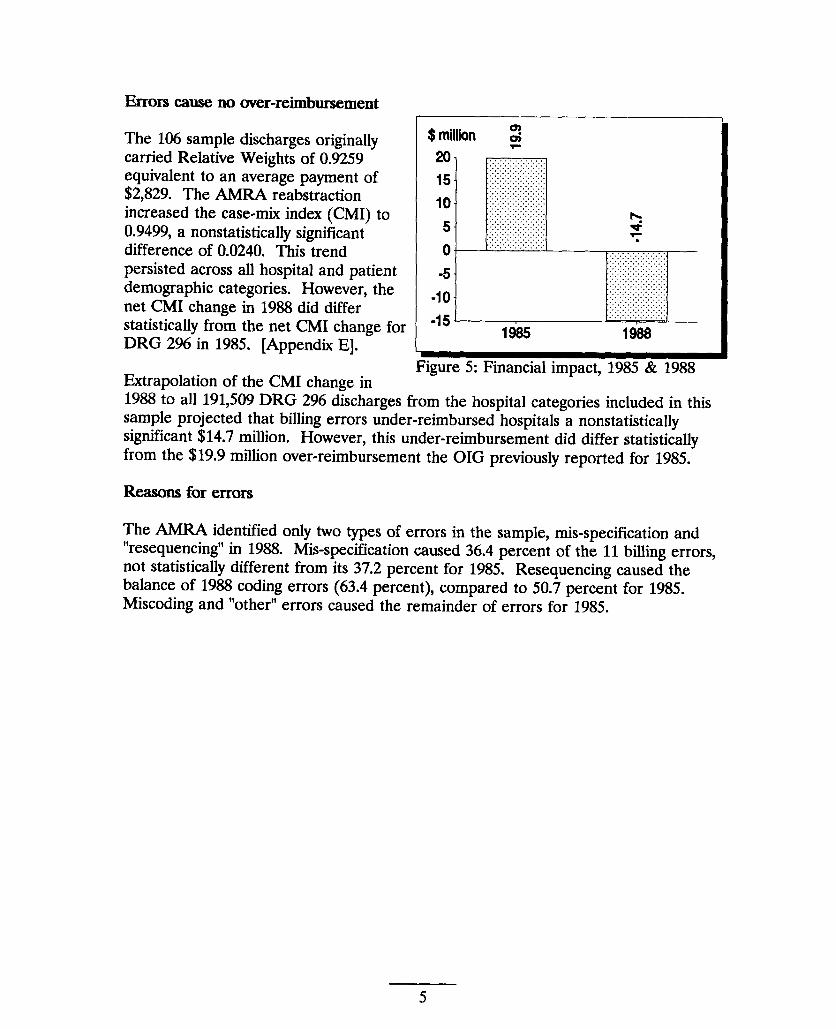
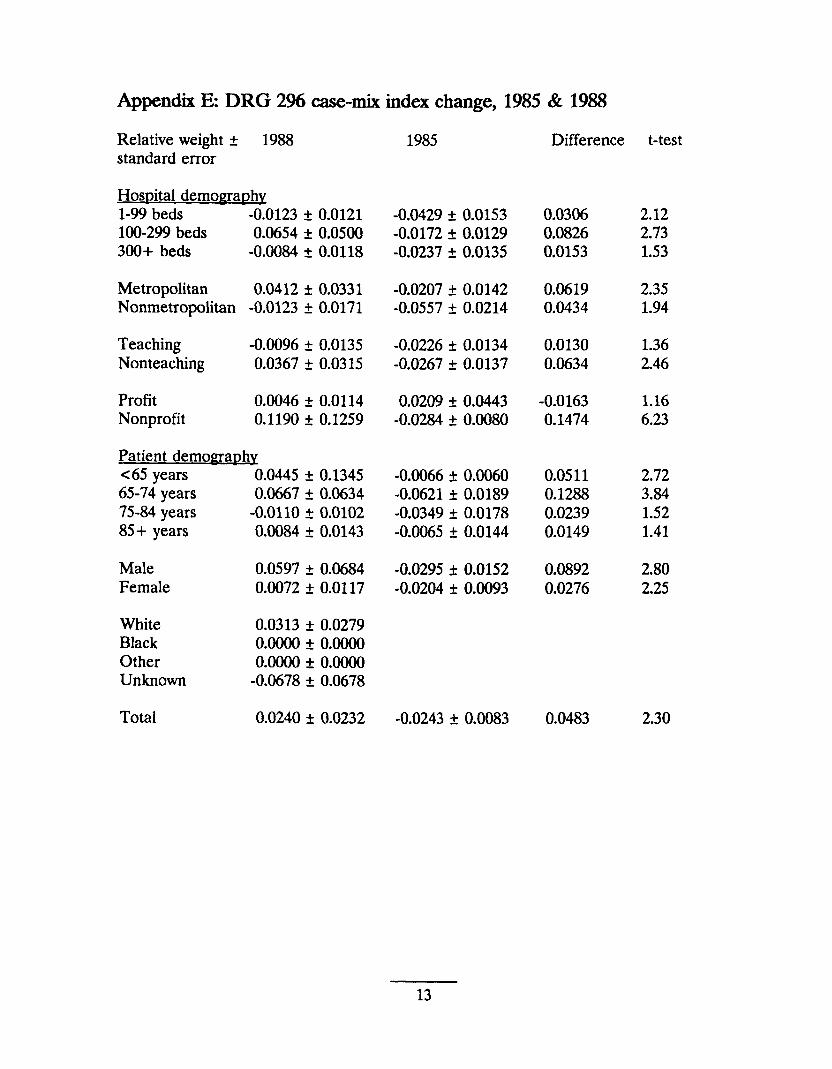
Errors cause no over-reimbursement
The 106 sample discharges originally carried Relative Weights of 0.9259 equivalent to an average payment of $2,829. The AMRA reabstraction increased the case-mix index (CMI) to 0.9499, a nonstatistically significant difference of 0.0240. This trend persisted across all hospital and patient demographic categories. However, the net CMI change in 1988 did differ statistically from the net CMI change for DRG 296 in 1985. [Appendix E].
Extrapolation of the CMI change in 1988 to all 191,509 DRG 296 discharges
$million 2
. Fim.we 5: Financial imnact. 1985 & 19881.
“ from the hospital categories included in this
sample projected that billing errors under-reimbursed hospitals a nonstatistically significant $14.7 million. However, this under-reimbursement did differ statistically from the $19.9 million over-reimbursement the OIG previously reported for 1985.
Reasons for errors
The AMRA identified only two types of errors in the sample, mis-specification and “resequencing” in 1988. Mis-specification caused 36.4 percent of the 11 billing errors, not statistkafiy different from its 37.2 percent for 1985; Resequencing cause~ the balance of 1988 coding errors (63.4 percent), compared to 50.7 percent for 1985. Miscoding and “other” errors caused the remainder of errors for 1985.
5
—
ENDNOTES
1. Stone D, Kleiman M, Meyers M, Schutte J, Lee F, Hsia D, & Krushat M. DRG 296: Nutritional and metabolic disorders. Washington, DC: HHS Office of Inspector General, 1989. Publication no. 0AI-12-88-01150.
2. Knight J W & Hsia D C, eds. National DRG Validation Study Update: Technical Report. Washington, DC: HHSOffice of Inspector General, 1992. Inspection no. OEI-12-90-00191.
3. Knight J W & Hsia D C, eds. National DRG Validation Study Update: Summary Report. Washington, DC HHS Ofilce of Inspector General, 1992. Inspection no. OEI-12-90-00190.
6

APPENDICES
7
Appendix #k Project participants
~
Cathaleen A. Ahern, B.A.Evan J. Buckingham, B.A.David C. Hsia, J.D., M.D., M.P.H.Thomas F. Komaniecki, M.P.A.W. Mark Krushat, M.P.H.Linda M. Moscoe, B.A.Brian P. Ritchie, B.A.Barry L. SteeleybJohn M. Traczyk, B.A.
HCFATimothy F. Greene, M.A., M.B.A.Stephen F. Jencks, M.D.Michael R. McMullan, M.B.A.Harry L. Savitt, Ph.D.Jeanette M. Smith, M.D., M.P.H.’Malcolm A. Sneen, B.S.
RAND Cor~orationHaya P. Rubin, M.D., Ph.Dd
Baxter-Health Data InstituteePatricia J. Baxter, R.N.Patricia Cassidy-Tsnosas, R.N.Annette M. Delaney, R.N., M.A.Ellen B. Inghilleri, R.N.Janet Mathews, A.R.T.Laurie H. Moore, R.R.A.Claire Shannon, A.R.T.Michele A. Wiese, B.A.
AMRA Margret K. Amatayakul, M.B.A., R.R.A.Mary Converse, R.R.A.Nicholas J. Cotsonas, M.D.fLinda Ertl, R.R.A.
b. Now at Health Audit Services, Ellicott City, MD. c. Now at the Journal of the American Medical Association, Chicago, IL. d. Now at Johns Hopkins Medical Institutions. e. Ceased operations February 16, 1990. f. Outside contractor.
8
Rita M. Finnegan, R.R.A.Desla Mantilla, A.R.T.Barbara Manny, R.R.A.Sonia Martyniuk, R.R.A.Toula Nicholas, A.R.T.Charlotte Razor, R.R.A.LouAnn Schraffenberger, R.R.A.Lynn Smetko, R.R.A.Dawn Smith, A.R.T.Joan Zacharias, A.R.T.
BOTEC Analvsis CorporationGeraldine M. Berenhol~ R.R.A.Andrew H. Chalsma, B.A.David P. Cavanagh, M.A., Ph.D.Janet W. Knight, R.N., Ph.D.Amy L. Lockwood, B.A.
Contract information
ContractorBOTEC Analysis Corporation1698 Massachusetts AvenueCambridge, MA 02138
Proiect OfficerDavid Hsia, J.D., M.D., M.P.H.Office of Inspector General330 Independence AvenueWashington, D.C. 20201
ContractHHS-1OO-9O-OO23Firm-fixed price contract$203,257
9
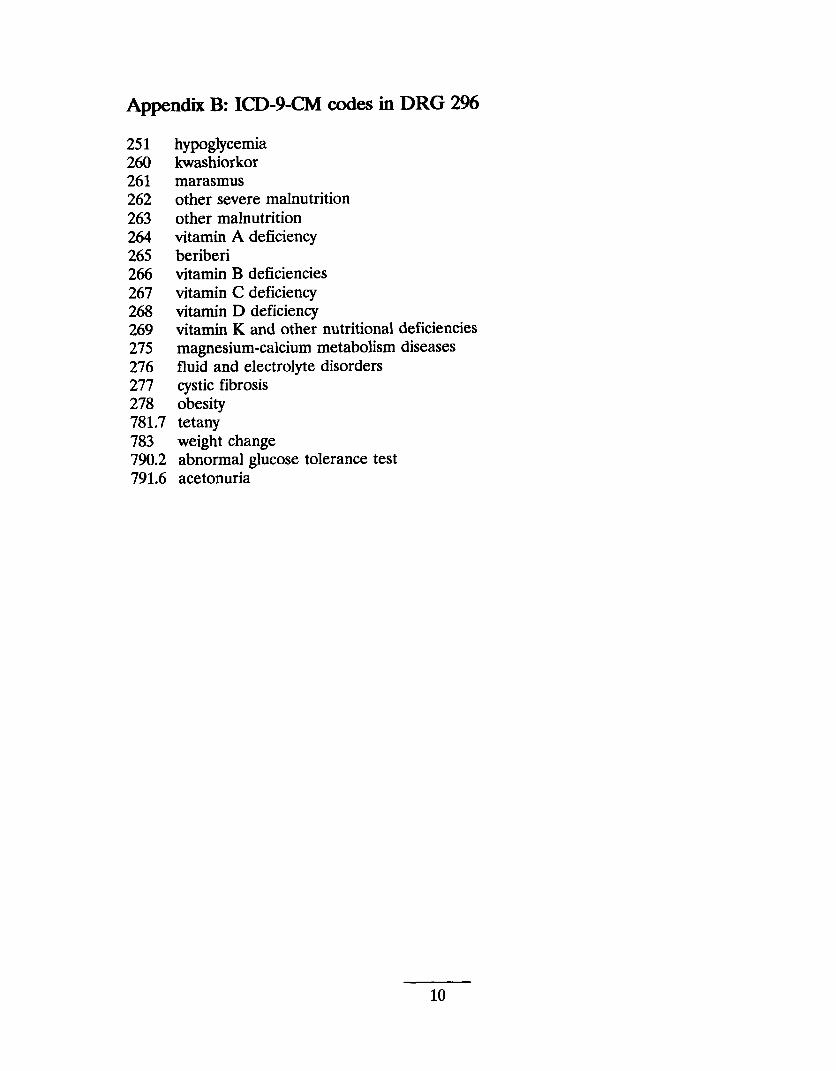
Appendix B: ICD-9-CM codes in DRG 2%
251 hypoglycemia 260 kwashiorkor 261 marasmus 262 other severe malnutrition 263 other malnutrition 264 vitamin A deficiency 265 beriberi 266 vitamin B deficiencies 267 vitamin C deficiency 268 vitamin D deficiency 269 vitamin Kand other nutritional deficiencies 275 magnesium-calcium metabolism diseases 276 fluid and electrolyte disorders 277 cystic fibrosis 278 obesity 781.7 tetany 783 weight change 790.2 abnormal glucose tolerance test 791.6 acetonuria
10
Appendix C Sample representativeness
Number [percent] Population Sample
Hos~ital demoma~hv 1-99 beds 32,071 [16.7] 25 [23.6] 100-299 beds 70,929 [37.0] 48 [45.3] 300+ beds 88,474 [46.2] 33 [31.1]
Metropolitan 143,417 [74.9] 72 [67.9] Nonmetropolitan 48,092 [25.1] 34 [32.1]
Teaching 76,999 [40.2] 29 [27.4] Nonteaching 114,510 [59.8] 77 [72.6]
Profit 20,273 [10.8] 18 [17.1] Nonprofit 166,626 [89.2] 87 [82.9]
Patient demoma~hy c 65 years 16,914 [8.8] 6 [5.7] 65-74 years 55,985 [29.2] 36 [34.0] 75-84 years 70,772 [37.0] 34 [32.1] 85+ years 47,838 [25.0] 30 [28.3]
Male 70,471 [36.8] 34 [32.1] Female 121,038 [63.2] 72 [67.9]
White 155,215 [81.0] 88 [83.0] Black 28,005 [14.6] 14 [13.2] Other 3,104 [1.6] 1 [0.9] Unknown 5,185 [2.7] 3 [2.8]
Total 191.509 [100.01 106 [100.0]~—. -., ‘J
Chi-square
9.54, 2 df, P= O.991
2.58, 1 df, P= O.888
6.87, 1 df, P= O.991
4.10, 1 df, P= O.955
2.99, 3 df, P= O.606
0.96, 1 df, P=0.668
0.47, 3 df, P= O.076
11
Appendix D: Proportion of DRG 2% billingerrors, 1985 & 1988
Number [percent] 1988
HosRital demo~ra~hy 1-99 beds 100-299 beds 300+ beds
Metropolitan Nonmetropolitan
Teaching Nonteaching
Profit Nonprofit
Patient demo~raphv <65 years 65-74 years 75-84 years 85+ years
Male Female
White Black Other Unknown
Total
3 [12.0 t 6.6] 6 [12.5 ~ 4.8]
2 [6.1 f 4.2]
5 [6.9 f 3.0] 6 [17.6 ~ 6.6]
2 [6.9 ~ 4.8] 9 [11.7 t 3.7]
3 [9.2 ~ 3.1] 8 [16.7 t 9.0]
2 [33.3 f 21.1] 3 [8.3 ~ 4.7] 3 [8.8* 4.9]
3 [10.0 ~ 5.6]
4 [11.8 ? 5.6] 7 [9.7 * 3.5]
10 [11.4 * 3.4] o [0.0 * 0.0] o [0.0 * 0.0]
1 [33.3 t 33.3]
11 [10.4 * 3.0]
1985” t-test
21 [28.8 ~ 5.3] 3.18 9 [16.1 ~ 5.0] 0.82 7 [15.9 ~ 5.6] 2.48
14 [20.0 t 5.0] 2.82 23 [28.6 ~ 7.5] 1.39
5 [15.1 A 6.3] 2.02 32 [22.0 f
2 [15.1 f 35 [18.3 f
5 [5.0 f 13 [28.2 f 10 [18.9 ~ 9 [18.0 f
17 [24.2 ~ 20 [13.5 *
37 [18.0 f
5.2] 1.61
11.0] 1.57 3.4] 0.31
2.8] 8.85 7.6] 3.92 6.1] 1.83 5.0] 2.08
6.4] 2.31 3.4] 0.90
3.3] 1.59
*. Reweighted for comparability to 1988.
12
Appendix E DRG 2% case-mix index change, 1985 & 1988
Relative weight ~ 1988 1985 Difference standard error
Hospital demoma~hv 1-99 beds -0.0123 ~ 0.0121 -0.0429 f 0.0153 0.0306 100-299 beds 0.0654 * 0.0500 -0.0172 ~ 0.0129 0.0826 300+ beds -0.0084 ~ 0.0118 -0.0237 f 0.0135 0.0153
Metropolitan 0.0412 & 0.0331 -0.0207 ~ 0.0142 0.0619 Nonmetropolitan -0.0123 ~ 0.0171 -0.0557 ~ 0.0214 0.0434
Teaching -0.0096 t 0.0135 -0.0226 ~ 0.0134 0.0130 Nonteaching 0.0367 ~ 0.0315 -0.0267 & 0.0137 0.0634
Profit 0.0046 ~ 0.0114 0.0209 i 0.0443 -0.0163 Nonprofit 0.1190 t 0.1259 -0.0284 ~ 0.0080 0.1474
patient demomaphy <65 years 0.0445 t 0.1345 -0.0066 ~ 0.0060 0.0511 65-74 years 0.0667 * 0.0634 -0.0621 k 0.0189 0.1288 75-84 years -0.0110 t 0.0102 -0.0349 f 0.0178 0.0239 85+ years 0.0084 t 0.0143 -0.0065 * 0.0144 0.0149
Male 0.0597 t 0.0684 -0.0295 k 0.0152 0.0892 Female 0.0072 ~ 0.0117 -0.0204 f 0.0093 0.0276
White 0.0313 ~ 0.0279 Black O.0000 * O.0000 Other O.0000 * O.0000 Unknown -0.0678 f 0.0678
Total 0.0240 ~ 0.0232 -0.0243 k 0.0083 0.0483
t-test
2.12 2.73 1.53
2.35 1.94
1.36 2.46
1.16 6.23
2.72 3.84 1.52 1.41
2.80 2.25
2.30
13