Embed Size (px)
Citation preview

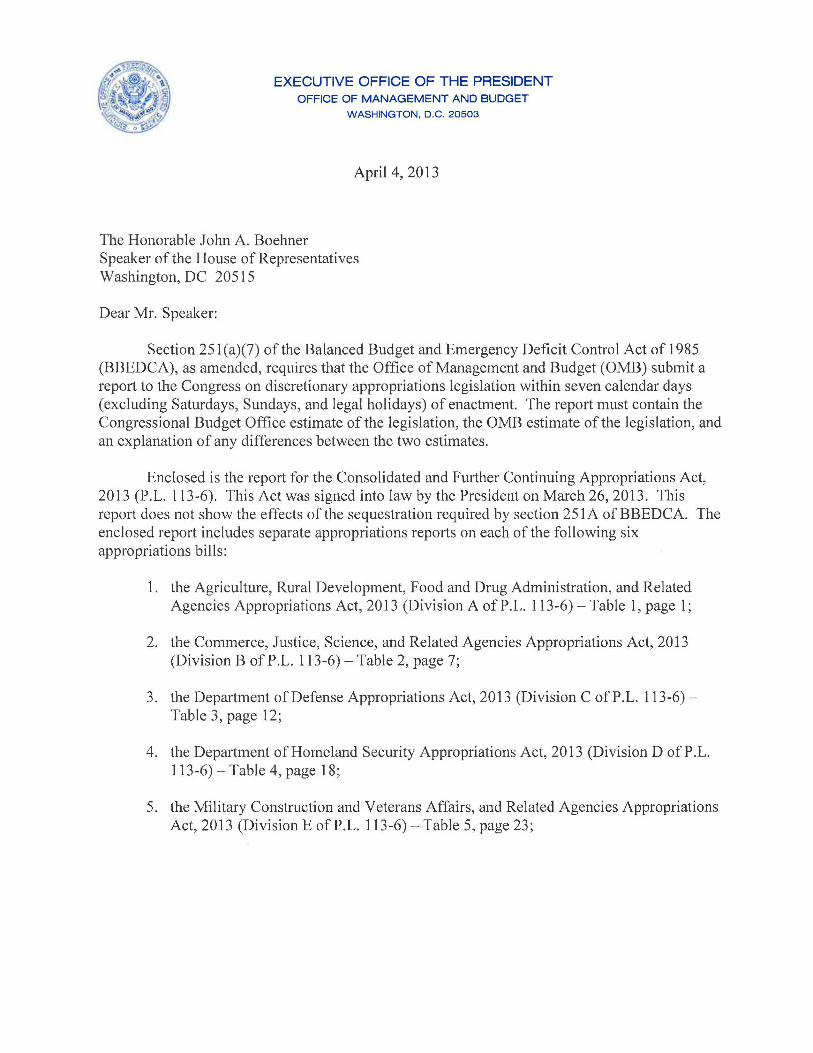
EXECUTIVE OFFICE OF THE PRESIDENT OFFICE OF MANAGEMENT AND BUDGET
WASHINGTON, D.C. 20503
April4, 2013
The Honorable John A. Boehner Speaker of the House of Representatives Washington, DC 20515
Dear Mr. Speaker:
Section 251 (a)(7) of the Balanced Budget and Emergency Deficit Control Act of 1985 (BBEDCA), as amended, requires that the Office of Management and Budget (OMB) submit a report to the Congress on discretionary appropriations legislation within seven calendar days (excluding Saturdays, Sundays, and legal holidays) of enactment. The report must contain the Congressional Budget Office estimate of the legislation, the OMB estimate ofthe legislation, and an explanation of any differences between the two estimates.
Enclosed is the report for the Consolidated and Fmiher Continuing Appropriations Act, 2013 (P.L. 113-6). This Act was signed into law by the President on March 26, 2013. This report does not show the effects of the sequestration required by section 251 A of BBEDCA. The enclosed report includes separate appropriations reports on each of the following six appropriations bills:
1. the Agriculture, Rural Development, Food and Drug Administration, and Related Agencies Appropriations Act, 2013 (Division A ofP.L. 113-6)- Table 1, page 1;
2. the Commerce, Justice, Science, and Related Agencies Appropriations Act, 2013 (Division B ofP.L. 113-6)- Table 2, page 7;
3. the Department of Defense Appropriations Act, 2013 (Division C ofP.L. 113-6)Table 3, page 12;
4. the Department ofHomeland Security Appropriations Act, 2013 (Division D ofP.L. 113-6) - Table 4, page 18;
5. the Military Construction and Veterans Afiairs, and Related Agencies Appropriations Act, 2013 (Division E ofP.L. 113-6)- Table 5, page 23;

6. the Further Continuing Appropriations Act, 2013 (Division F of P.L. 113-6):
Enclosure
a. Energy and Water Development (Title II of Division r of P.L. 113-6) - Table 6, page 27;
b. Financial Services and General Government (Title TIT of Division F ofP.L. 113-6) - Table 7, page 30;
c. Interior, Environment, and Related Agencies (Title IV of Division F of P.L. I 13-6)- Table 8. page 32;
d. Labor, Health and Human Services, and Education, and Related Agencies (Title V of Division f ofP.L. 113-6) - Table 9, page 36;
e. Legislative Branch (Title VI of Division F of P.L. 113-6) - Table 10, page 42;
f. Department of State, Foreign Operations, and Related Programs (Tille VII of Division F ofP.L. 113-6) - Table II , page 44; and
g. Transportation and Housing and Urban Development, and Related Agencies (Title Vlll ofDivision f ofP.L. I 13-6) - Table 12, page 50.
--~· fr~~ Acting Director
Identical Letter Sent to The Honorable Joseph R. Biden

Table 1.
CBO Estimates Compared to OMB Estimates for Division A of P.L. 113‐6
Agriculture, Rural Development, Food and Drug Administration, and Related Agencies Appropriations Act,
2013(in millions of dollars)
FY 2013 Enacted
Excludes OMB estimate of section 3004 across‐the‐board rescission in Division G. BA Outlays
SECURITY CATEGORY DISCRETIONARY APPROPRIATIONS
Security Category‐ Base Discretionary Appropriations
CBO ESTIMATE, SECURITY CATEGORY ‐ BASE DISCRETIONARY APPROPRIATIONS1............................ 1,617 1,692
Technical Outlay Estimating Differences:
Department of Agriculture:
Foreign Agricultural Service:
Food for Peace Title II Grants......................................................................................................... ‐‐‐ ‐43
OMB has a higher estimate of outlays from new authority (+$305 million) but a lower
estimate of outlays from prior‐year authority (‐$348 million) than CBO.
McGovern‐Dole International Food for Education and Child Nutrition......................................... ‐‐‐ +8
OMB has a higher estimate of outlays from new authority (+$28 million) but a lower
estimate of outlays from prior‐year authority (‐$20 million) than CBO.‐‐‐‐‐‐‐‐‐‐‐‐ ‐‐‐‐‐‐‐‐‐‐‐‐
TOTAL DIFFERENCES................................................................................................................ ‐‐‐ ‐35‐‐‐‐‐‐‐‐‐‐‐‐ ‐‐‐‐‐‐‐‐‐‐‐‐
OMB ESTIMATE, SECURITY CATEGORY ‐ BASE DISCRETIONARY APPROPRIATIONS............................ 1,617 1,657
NONSECURITY CATEGORY DISCRETIONARY APPROPRIATIONS
Nonsecurity Category‐Changes in Mandatory Programs (CHIMPs)
CBO ESTIMATE, NONSECURITY AGRICULTURE CHIMPs1.................................................................... ‐892 ‐105
Scorekeeping Differences:
Department of Agriculture:
Food and Nutrition Service:
Child Nutrition Programs, School Breakfast and Equipment Grants.............................................. ‐1 ‐1
CBO scores a $1 million CHIMP cost in both budget authority and outlays in 2013 ($50
million over 10 years) as the mandatory effects for increasing enrollment due to the
discretionary school breakfast and equipment grants. OMB does not assume the
discretionary spending will impact the enrollment.
1

Table 1.
CBO Estimates Compared to OMB Estimates for Division A of P.L. 113‐6
Agriculture, Rural Development, Food and Drug Administration, and Related Agencies Appropriations Act,
2013(in millions of dollars)
FY 2013 Enacted
Excludes OMB estimate of section 3004 across‐the‐board rescission in Division G. BA Outlays
Child Nutrition Programs, Fresh Fruit and Vegetable Program...................................................... +2 ‐96
Section 722 of the House bill limits the transfer of funding for the Fresh Fruit and
Vegetable program pursuant to section 19(i)(1)(E) of the National School Lunch Act to $41
million in 2013. OMB's baseline estimate for the transfer amount in 2013 is $156 million,
and; therefore, OMB is scoring this provision as delaying ‐$115 million of the transfer until
2014. CBO's baseline estimate for the transfer in 2013 is $158 million, and; therefore, CBO
is scoring this provision as delaying ‐$117 million of the transfer until 2014. This accounts
for the +$2 million difference in budget authority in 2013. In addition, OMB estimates ‐$96
million in first‐year outlay savings as a result of this delay. CBO estimates that the delay
will have no impact on outlays.
Agricultural Marketing Service:
Funds for Strengthening Markets, Income, and Supply (Section 32)…………………………………………… ‐2 ‐112
See explanation for Child Nutrition Programs above. Because OMB estimates that the limit
of $41 million in section 722 for the Fresh Fruit and Vegetable program will only delay
$115 million of funding in 2013, OMB is scoring an additional $2 million reduction from
the overall cap of $981 million on Section 14222 funding to the Section 32 account, for a
total reduction of ‐$112 million to Section 32. CBO scores a delay of $117 million to the
Fresh Fruit and Vegetable program and therefore only scores a reduction of ‐$110 million
to Section 32. In addition, OMB estimates the reduction in Section 32 will result in ‐$112
million in outlay savings, whereas CBO estimates the reduction will have no impact on
outlays.
Technical Outlay Estimating Differences:
Department of Agriculture:
Natural Resources and Conservation Service:
Farm Security and Rural Investment Programs.............................................................................. ‐‐‐ ‐34
OMB scores has a higher estimate of outlay savings from new authority (‐$34 million) than
CBO from the section 721(2) reduction to the Environmental Quality Incentives Program.
Other technical estimating differences………………………………………………………………………………………. ‐‐‐ ‐15‐‐‐‐‐‐‐‐‐‐‐‐ ‐‐‐‐‐‐‐‐‐‐‐‐
TOTAL DIFFERENCES .................................................................................................................... ‐1 ‐258‐‐‐‐‐‐‐‐‐‐‐‐ ‐‐‐‐‐‐‐‐‐‐‐‐
OMB ESTIMATE, NONSECURITY AGRICULTURE CHIMPS……………………………………………………………….... ‐893 ‐363
2

Table 1.
CBO Estimates Compared to OMB Estimates for Division A of P.L. 113‐6
Agriculture, Rural Development, Food and Drug Administration, and Related Agencies Appropriations Act,
2013(in millions of dollars)
FY 2013 Enacted
Excludes OMB estimate of section 3004 across‐the‐board rescission in Division G. BA Outlays
Nonsecurity Category‐Base Discretionary Appropriations
CBO ESTIMATE, NONSECURITY CATEGORY ‐ BASE DISCRETIONARY APPROPRIATIONS1..................... 19,806 21,323
Scorekeeping Differences:
Department of Agriculture:
Negative Subsidy Receipts:
Rural Electrification and Telephone Loans………………………………………………………………………………… ‐123 ‐123
OMB has a higher estimate of negative subsidy receipts (‐$183 million) than CBO (‐$60
million). The difference is largely due to OMB's expectation of disbursements from
previously issued loans that CBO does not include in their estimates. This accounts for the
difference in both budget authority and outlays from new authority.
Rural Community Facilities............................................................................................................. ‐4 ‐4
OMB has a higher estimate of negative subsidy receipts (‐$18 million) than CBO (‐$14
million). This accounts for the difference in both budget authority and outlays from new
authority.
Rural Utilities Service:
Distance Learning, Telemedicine, and Broadband Program.......................................................... +7 +135
The +$7 million difference in budget authority is due to the scoring of the ‐$25 million
rescission in section 737 of the Act. Only $24 million in balances remained at the end of FY
2012 for the broadband loan program, and $6 million were obligated during the first half
of FY 2013. Therefore, only $18 million in balances from prior years are left to rescind, as
reflected in OMB's scoring. CBO scores the full ‐$25 million in savings. In addition, OMB
has higher estimates of outlays from both new authority (+$3 million) and from prior‐year
authority (+$132 million) than CBO.
Departmental Management:
Agriculture Buildings and Facilities and Rental Payments.............................................................. +30 +34
Section 743 reduced the amount for buildings operations and maintenance expenses in
this account by $30 million. OMB does not score this as a reduction of $30 million in
budget authority because the section does not reduce the overall amount appropriated to
this account. CBO erroneously scored this as a reduction of $30 million. In addition, OMB
has a higher estimate of outlays from new authority (+$59 million) and a lower estimate of
outlays from prior‐year authority (‐$25 million) than CBO.
3

Table 1.
CBO Estimates Compared to OMB Estimates for Division A of P.L. 113‐6
Agriculture, Rural Development, Food and Drug Administration, and Related Agencies Appropriations Act,
2013(in millions of dollars)
FY 2013 Enacted
Excludes OMB estimate of section 3004 across‐the‐board rescission in Division G. BA Outlays
Departmental Administration........................................................................................................ +1 +46
The +$1 million difference in budget authority is due to rounding. This account receives
several separate appropriations in the Act. OMB adds these pieces together in thousands
and then rounds the total to millions, whereas CBO rounds each piece and then adds
them. In addition, OMB has higher estimates of outlays from new authority (+$51 million)
and lower estimates of outlays from prior‐year authority (‐$5 million) than CBO.
Food and Nutrition Service:
Supplemental Nutrition Assistance Program................................................................................. +1 +1
Although this account is mandatory under the BEA, some activities in it are controlled by
the appropriations process, and OMB scores them as discretionary. These activities are
not assumed in OMB's mandatory baseline. Despite their underlying discretionary
authority and specification in appropriations language, CBO includes these activities in
their mandatory baseline, leading to a difference of +$1 million in budget authority. In
addition, OMB has higher estimates of outlays from prior‐year authority (+$1 million) than
CBO.
Child Nutrition Programs …………………………………………………………………………………………………………… +17 +25
Although this account is mandatory under the BEA, several activities in it are controlled by
the appropriations process, and OMB scores them as discretionary. These activities are
not assumed in OMB's mandatory baseline. Despite their underlying discretionary
authority and specification in appropriations language, CBO includes these activities in
their mandatory baseline, leading to a difference of +$17 million in budget authority and
outlays from new authority (+$6 million). In addition, OMB has higher estimates of
outlays from new authority (+$3 million) and from prior‐year authority (+$22 million) than
CBO.
Office of the Secretary......................................................................................................................... ‐1 +6
The ‐$1 million difference in budget authority is due to rounding. This account receives
several separate appropriations in the Act. OMB adds these pieces together in thousands
and then rounds the total to millions, whereas CBO rounds each piece and then adds
them. In addition, OMB has higher estimates of outlays from new authority (+$1 million)
and prior‐year authority (+$5 million) than CBO.
Farm Service Agency:
Agricultural Credit Insurance Fund Program Account.................................................................... +1 ‐21
The +$1 million difference in budget authority is due to rounding. This account receives
several separate appropriations in the Act. OMB adds these pieces together in thousands
and then rounds the total to millions, whereas CBO rounds each piece and then adds
them. In addition, OMB has lower estimates of outlays from both new authority (‐$1
million) and from prior‐year authority (‐$20 million) than CBO.
4
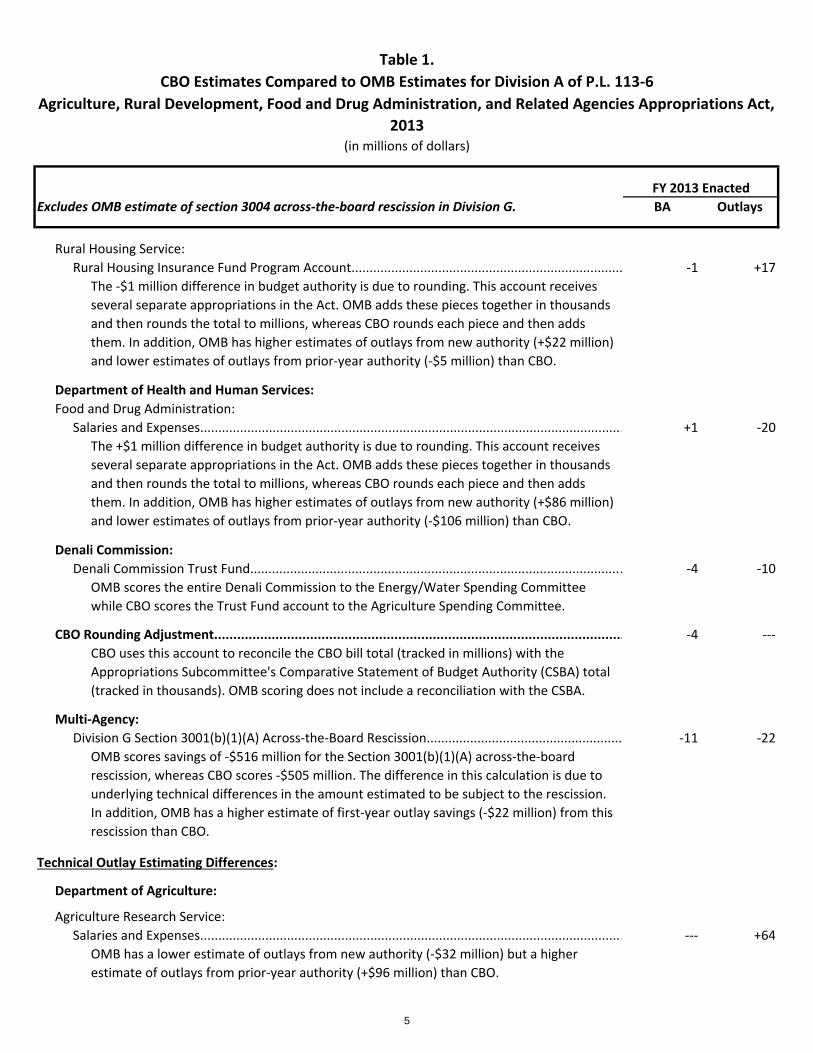
Table 1.
CBO Estimates Compared to OMB Estimates for Division A of P.L. 113‐6
Agriculture, Rural Development, Food and Drug Administration, and Related Agencies Appropriations Act,
2013(in millions of dollars)
FY 2013 Enacted
Excludes OMB estimate of section 3004 across‐the‐board rescission in Division G. BA Outlays
Rural Housing Service:
Rural Housing Insurance Fund Program Account........................................................................... ‐1 +17
The ‐$1 million difference in budget authority is due to rounding. This account receives
several separate appropriations in the Act. OMB adds these pieces together in thousands
and then rounds the total to millions, whereas CBO rounds each piece and then adds
them. In addition, OMB has higher estimates of outlays from new authority (+$22 million)
and lower estimates of outlays from prior‐year authority (‐$5 million) than CBO.
Department of Health and Human Services:
Food and Drug Administration:
Salaries and Expenses..................................................................................................................... +1 ‐20
The +$1 million difference in budget authority is due to rounding. This account receives
several separate appropriations in the Act. OMB adds these pieces together in thousands
and then rounds the total to millions, whereas CBO rounds each piece and then adds
them. In addition, OMB has higher estimates of outlays from new authority (+$86 million)
and lower estimates of outlays from prior‐year authority (‐$106 million) than CBO.
Denali Commission:
Denali Commission Trust Fund....................................................................................................... ‐4 ‐10
OMB scores the entire Denali Commission to the Energy/Water Spending Committee
while CBO scores the Trust Fund account to the Agriculture Spending Committee.
CBO Rounding Adjustment........................................................................................................... ‐4 ‐‐‐
CBO uses this account to reconcile the CBO bill total (tracked in millions) with the
Appropriations Subcommittee's Comparative Statement of Budget Authority (CSBA) total
(tracked in thousands). OMB scoring does not include a reconciliation with the CSBA.
Multi‐Agency:
Division G Section 3001(b)(1)(A) Across‐the‐Board Rescission...................................................... ‐11 ‐22
OMB scores savings of ‐$516 million for the Section 3001(b)(1)(A) across‐the‐board
rescission, whereas CBO scores ‐$505 million. The difference in this calculation is due to
underlying technical differences in the amount estimated to be subject to the rescission.
In addition, OMB has a higher estimate of first‐year outlay savings (‐$22 million) from this
rescission than CBO.
Technical Outlay Estimating Differences:
Department of Agriculture:
Agriculture Research Service:
Salaries and Expenses..................................................................................................................... ‐‐‐ +64
OMB has a lower estimate of outlays from new authority (‐$32 million) but a higher
estimate of outlays from prior‐year authority (+$96 million) than CBO.
5
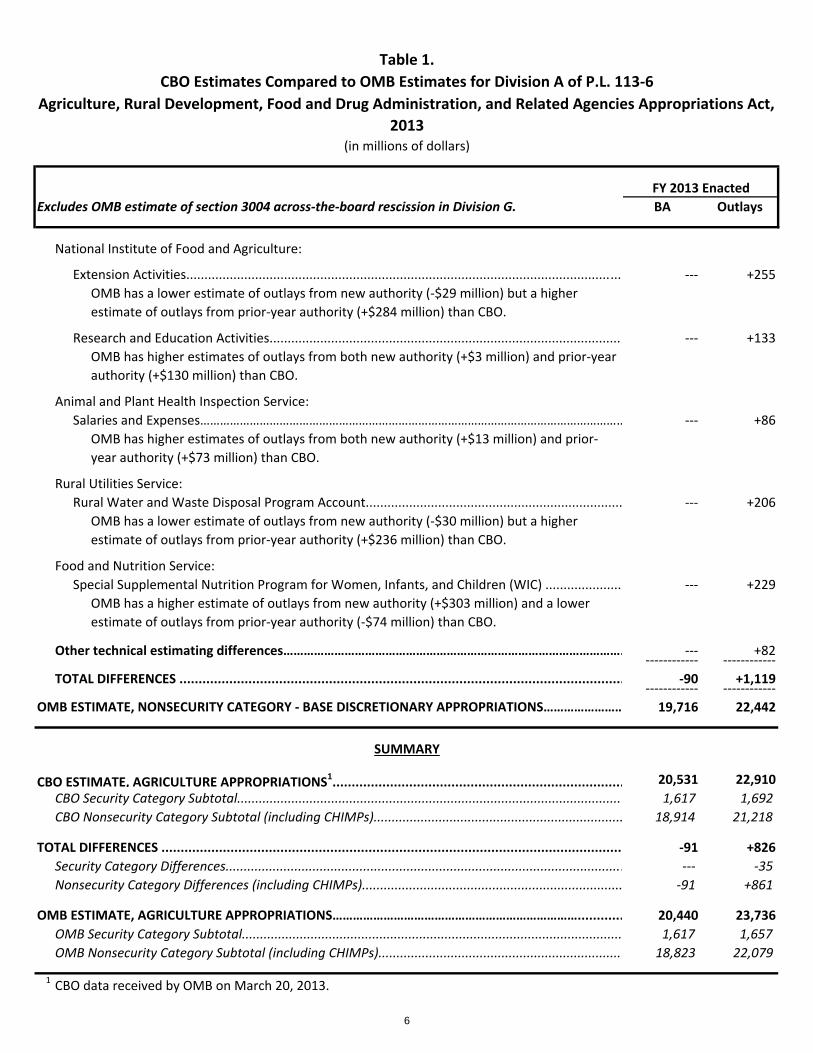
Table 1.
CBO Estimates Compared to OMB Estimates for Division A of P.L. 113‐6
Agriculture, Rural Development, Food and Drug Administration, and Related Agencies Appropriations Act,
2013(in millions of dollars)
FY 2013 Enacted
Excludes OMB estimate of section 3004 across‐the‐board rescission in Division G. BA Outlays
National Institute of Food and Agriculture:
Extension Activities......................................................................................................................... ‐‐‐ +255
OMB has a lower estimate of outlays from new authority (‐$29 million) but a higher
estimate of outlays from prior‐year authority (+$284 million) than CBO.
Research and Education Activities.................................................................................................. ‐‐‐ +133
OMB has higher estimates of outlays from both new authority (+$3 million) and prior‐year
authority (+$130 million) than CBO.
Animal and Plant Health Inspection Service:
Salaries and Expenses………………………………………………………………………………………………………………… ‐‐‐ +86
OMB has higher estimates of outlays from both new authority (+$13 million) and prior‐
year authority (+$73 million) than CBO.
Rural Utilities Service:
Rural Water and Waste Disposal Program Account....................................................................... ‐‐‐ +206
OMB has a lower estimate of outlays from new authority (‐$30 million) but a higher
estimate of outlays from prior‐year authority (+$236 million) than CBO.
Food and Nutrition Service:
Special Supplemental Nutrition Program for Women, Infants, and Children (WIC) ...................... ‐‐‐ +229
OMB has a higher estimate of outlays from new authority (+$303 million) and a lower
estimate of outlays from prior‐year authority (‐$74 million) than CBO.
Other technical estimating differences………………………………………………………………………………………. ‐‐‐ +82‐‐‐‐‐‐‐‐‐‐‐‐ ‐‐‐‐‐‐‐‐‐‐‐‐
TOTAL DIFFERENCES .................................................................................................................... ‐90 +1,119‐‐‐‐‐‐‐‐‐‐‐‐ ‐‐‐‐‐‐‐‐‐‐‐‐
OMB ESTIMATE, NONSECURITY CATEGORY ‐ BASE DISCRETIONARY APPROPRIATIONS…………………… 19,716 22,442
CBO ESTIMATE, AGRICULTURE APPROPRIATIONS1............................................................................ 20,531 22,910
CBO Security Category Subtotal........................................................................................................... 1,617 1,692
CBO Nonsecurity Category Subtotal (including CHIMPs)..................................................................... 18,914 21,218
TOTAL DIFFERENCES ........................................................................................................................ ‐91 +826
Security Category Differences.............................................................................................................. ‐‐‐ ‐35
Nonsecurity Category Differences (including CHIMPs)........................................................................ ‐91 +861
OMB ESTIMATE, AGRICULTURE APPROPRIATIONS………………………………………………………………............ 20,440 23,736
OMB Security Category Subtotal......................................................................................................... 1,617 1,657
OMB Nonsecurity Category Subtotal (including CHIMPs).................................................................... 18,823 22,079
1 CBO data received by OMB on March 20, 2013.
SUMMARY
6

Table 2.
CBO Estimates Compared to OMB Estimates for Division B of P.L. 113‐6
Commerce, Justice, Science, and Related Agencies Appropriations Act, 2013(in millions of dollars)
FY 2013 Enacted
Excludes OMB estimate of section 3004 across‐the‐board rescission in Division G. BA Outlays
SECURITY CATEGORY DISCRETIONARY APPROPRIATIONS
Security Category‐Changes in Mandatory Programs (CHIMPs)
CBO ESTIMATE, SECURITY CATEGORY CHIMPS1………………………………………………………………………………… ‐4 ‐3
Technical Outlay Estimating Differences:
Total, Security CHIMP Technical Outlay Estimating Differences......................................................... ‐‐‐ ‐1‐‐‐‐‐‐‐‐‐‐‐‐ ‐‐‐‐‐‐‐‐‐‐‐‐
OMB ESTIMATE, SECURITY CATEGORY CHIMPS………………………………………………………………………………… ‐4 ‐4
Security Category‐ Base Discretionary Appropriations
CBO ESTIMATE, SECURITY CATEGORY‐BASE APPROPRIATIONS1……………………………………………………… 85 87
Technical Outlay Estimating Differences:
Total, Security Base Technical Outlay Estimating Differences............................................................. ‐‐‐ ‐2‐‐‐‐‐‐‐‐‐‐‐‐ ‐‐‐‐‐‐‐‐‐‐‐‐
OMB ESTIMATE, SECURITY CATEGORY‐BASE APPROPRIATIONS……………………………………………………… 85 85
NONSECURITY CATEGORY DISCRETIONARY APPROPRIATIONS
Nonsecurity Category‐Changes in Mandatory Programs (CHIMPs)
CBO Estimate, Nonsecurity Category‐Changes in Mandatory Programs (CHIMPs)1…………………………… ‐10,130 ‐781
Scorekeeping Differences:
Department of Justice:
Office of Justice Programs:
Crime Victims Fund…………………………………………………………………………………………………………………… ‐1 ‐4,889
The ‐$1 million difference in budget authority is due to rounding. OMB assumes a much
higher level of outlay savings in FY 2013 (‐$5,085 million) than CBO (‐$593 million); this is
largely because OMB assumes a three‐year outlay rate (with the first year at 60 percent)
and CBO assumes a six‐year outlay rate (with the first year at 7 percent).
Office of Personnel Management:
Employees and Retired Employees Health Benefits Funds............................................................ +58 +58
The U.S. Patent and Trademark Office (USPTO) Salaries and Expenses account includes a
provision that would transfer to OPM the accruing indirect personnel costs associated
with post retirement health insurance, life insurance, and retirement benefits to USPTO
employees. OMB included these amounts in the mandatory baseline estimates of the
pertinent OPM accounts, rather than as a discretionary change (CHIMP), as CBO has
shown, in this account and in the Treasury account below.
7
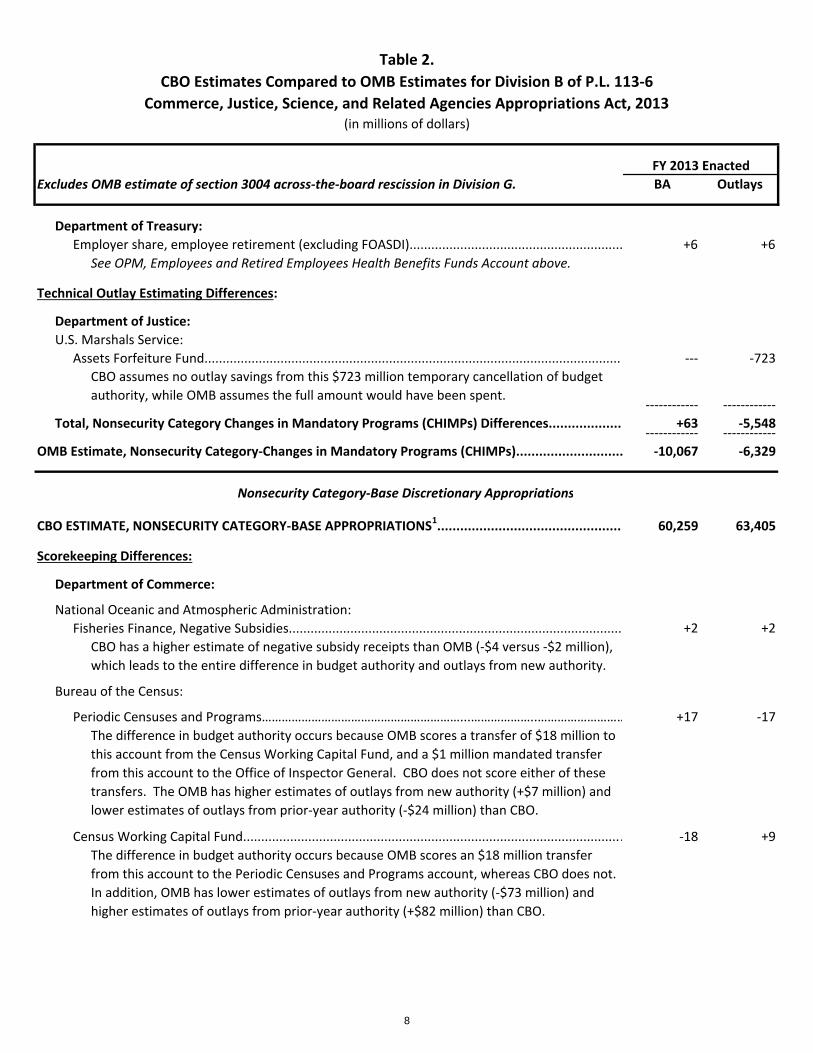
Table 2.
CBO Estimates Compared to OMB Estimates for Division B of P.L. 113‐6
Commerce, Justice, Science, and Related Agencies Appropriations Act, 2013(in millions of dollars)
FY 2013 Enacted
Excludes OMB estimate of section 3004 across‐the‐board rescission in Division G. BA Outlays
Department of Treasury:
Employer share, employee retirement (excluding FOASDI)........................................................... +6 +6
See OPM, Employees and Retired Employees Health Benefits Funds Account above.
Technical Outlay Estimating Differences:
Department of Justice:
U.S. Marshals Service:
Assets Forfeiture Fund.................................................................................................................... ‐‐‐ ‐723
CBO assumes no outlay savings from this $723 million temporary cancellation of budget
authority, while OMB assumes the full amount would have been spent. ‐‐‐‐‐‐‐‐‐‐‐‐ ‐‐‐‐‐‐‐‐‐‐‐‐
Total, Nonsecurity Category Changes in Mandatory Programs (CHIMPs) Differences.................... +63 ‐5,548‐‐‐‐‐‐‐‐‐‐‐‐ ‐‐‐‐‐‐‐‐‐‐‐‐
OMB Estimate, Nonsecurity Category‐Changes in Mandatory Programs (CHIMPs)............................ ‐10,067 ‐6,329
Nonsecurity Category‐Base Discretionary Appropriations
CBO ESTIMATE, NONSECURITY CATEGORY‐BASE APPROPRIATIONS1................................................. 60,259 63,405
Scorekeeping Differences:
Department of Commerce:
National Oceanic and Atmospheric Administration:
Fisheries Finance, Negative Subsidies............................................................................................ +2 +2
CBO has a higher estimate of negative subsidy receipts than OMB (‐$4 versus ‐$2 million),
which leads to the entire difference in budget authority and outlays from new authority.
Bureau of the Census:
Periodic Censuses and Programs……………………………………………………...………………..……………………… +17 ‐17
The difference in budget authority occurs because OMB scores a transfer of $18 million to
this account from the Census Working Capital Fund, and a $1 million mandated transfer
from this account to the Office of Inspector General. CBO does not score either of these
transfers. The OMB has higher estimates of outlays from new authority (+$7 million) and
lower estimates of outlays from prior‐year authority (‐$24 million) than CBO.
Census Working Capital Fund......................................................................................................... ‐18 +9
The difference in budget authority occurs because OMB scores an $18 million transfer
from this account to the Periodic Censuses and Programs account, whereas CBO does not.
In addition, OMB has lower estimates of outlays from new authority (‐$73 million) and
higher estimates of outlays from prior‐year authority (+$82 million) than CBO.
8

Table 2.
CBO Estimates Compared to OMB Estimates for Division B of P.L. 113‐6
Commerce, Justice, Science, and Related Agencies Appropriations Act, 2013(in millions of dollars)
FY 2013 Enacted
Excludes OMB estimate of section 3004 across‐the‐board rescission in Division G. BA Outlays
National Institute of Standards and Technology (NIST):
Scientific and Technical Research Services..................................................................................... +14 +83
The legislative language allows a permissive transfer of up to $9 million from this account
to the Working Capital Fund. OMB assumes only $2 million of this amount will be
transferred. CBO assumes the full transfer of $9 million will occur and this generates a
+$7 million difference in budget authority. Additionally, OMB scores mandated transfers
of $5 million from the Research, Evaluation and Standards and $2 million from State and
Local Law Enforcement accounts in the Department of Justice. CBO does not score either
of these transfers. In addition, OMB has higher estimates of outlays from both new
authority (+$12 million) and from prior‐year authority (+$71 million) than CBO.
NIST Working Capital Fund............................................................................................................. ‐7 +9
The budget authority difference (‐$9 million) is due to alternative assumptions OMB and
CBO have about the amount of a permissive transfer from the Scientific and Technical
Research and Services account (see the explanation above). In addition, OMB has lower
estimates of outlays from new authority (‐$45 million) and higher estimates of outlays
from prior‐year authority (+$54 million) than CBO.
Industrial Technology Services....................................................................................................... ‐1 +14
The budget authority difference is due to rounding. In addition, OMB has higher
estimates of outlays from new authority (+$38 million) and lower estimates of outlays
from prior‐year authority (‐$22 million) than CBO.
Departmental Management:
Office of the Inspector General...................................................................................................... +1 ‐6
The budget authority difference (+$1 million) is due to rounding. In addition, OMB has
higher estimates of outlays from new authority (+$1 million) and lower estimates of
outlays from prior‐year authority (‐$7 million) than CBO.
Department of Justice:
Legal Activities and U.S. Marshals:
United States Trustee System Fund............................................................................................... +3 +4
OMB has higher estimates of bankruptcy fee collections than CBO (‐$267 million
compared to ‐$270 million), leading to a difference of +$3 million in budget authority and
outlays from new authority. OMB also has higher estimates of outlays from prior‐year
authority (+$1 million) than CBO.
Salaries and Expenses, Antitrust Division…………………………………………………………………………………… ‐3 ‐3
OMB has higher estimates of Hart‐Scott‐Rodino fee collections than CBO (‐$118 million
compared to ‐$115 million), leading to a difference of ‐$3 million in budget authority and
outlays from new authority.
9

Table 2.
CBO Estimates Compared to OMB Estimates for Division B of P.L. 113‐6
Commerce, Justice, Science, and Related Agencies Appropriations Act, 2013(in millions of dollars)
FY 2013 Enacted
Excludes OMB estimate of section 3004 across‐the‐board rescission in Division G. BA Outlays
Office of Justice Programs:
Community Oriented Policing Services.......................................................................................... ‐13 +63
The difference in budget authority occurs because OMB scores a mandated transfer from
this account to the Drug Enforcement Administration, Salaries and Expenses account,
whereas CBO does not. OMB has lower estimates of outlays from new authority (‐$19
million) and higher estimates of outlays from prior‐year authority (+$82 million) than CBO.
Research, Evaluation, and Statistics............................................................................................... ‐5 ‐49
The difference in budget authority occurs because OMB scores a mandated transfer of $5
million from this account to the NIST Scientific and Technical Research Services account,
whereas CBO does not. OMB has lower estimates for both outlays from new (‐$4 million)
and prior‐year authority (‐$45 million) than CBO.
State and Local Law Enforcement Assistance................................................................................. ‐2 +13
The budget authority difference occurs because OMB scores a mandated transfer of $2
million from this account to the NIST Scientific and Technical Research Services account,
whereas CBO does not. In addition, OMB has lower estimates of outlays from new
authority (‐$25 million) and higher estimates of outlays from prior‐year authority (+$38
million) than CBO.
Salaries and Expenses, Drug Enforcement Administration............................................................ +13 ‐92
The difference in budget authority occurs because OMB scores a mandated transfer of $13
million to this account from the Community Oriented Policing Services account, whereas
CBO does not. OMB has higher estimates of outlays from new authority (‐$92 million)
than CBO.
CBO DOJ Rounding Plug.................................................................................................................. ‐1 ‐‐‐
The budget authority difference is due to rounding in Office of Justice Programs within the
Department of Justice.
Multi‐Agency:
Division G Section 3001(b)(1)(B) Across‐the‐Board Rescission...................................................... +4 ‐16
OMB scores savings of ‐$1,153 million for the Section 3001(b)(1)(B) across‐the‐board
rescission, whereas CBO scores ‐$1,157 million. The difference in this calculation is due to
underlying technical differences in the amount estimated to be subject to the rescission.
In addition, OMB has a higher estimate of first‐year outlay savings (‐$16 million) from this
rescission than CBO.
Technical Outlay Estimating Differences:
Department of Justice:
United States Marshals Service:
Salaries and Expenses..................................................................................................................... ‐‐‐ +251
OMB has lower estimates of outlays from new authority (‐$159 million) and higher
estimates of outlays from prior‐year authority (+$410 million) than CBO.
10
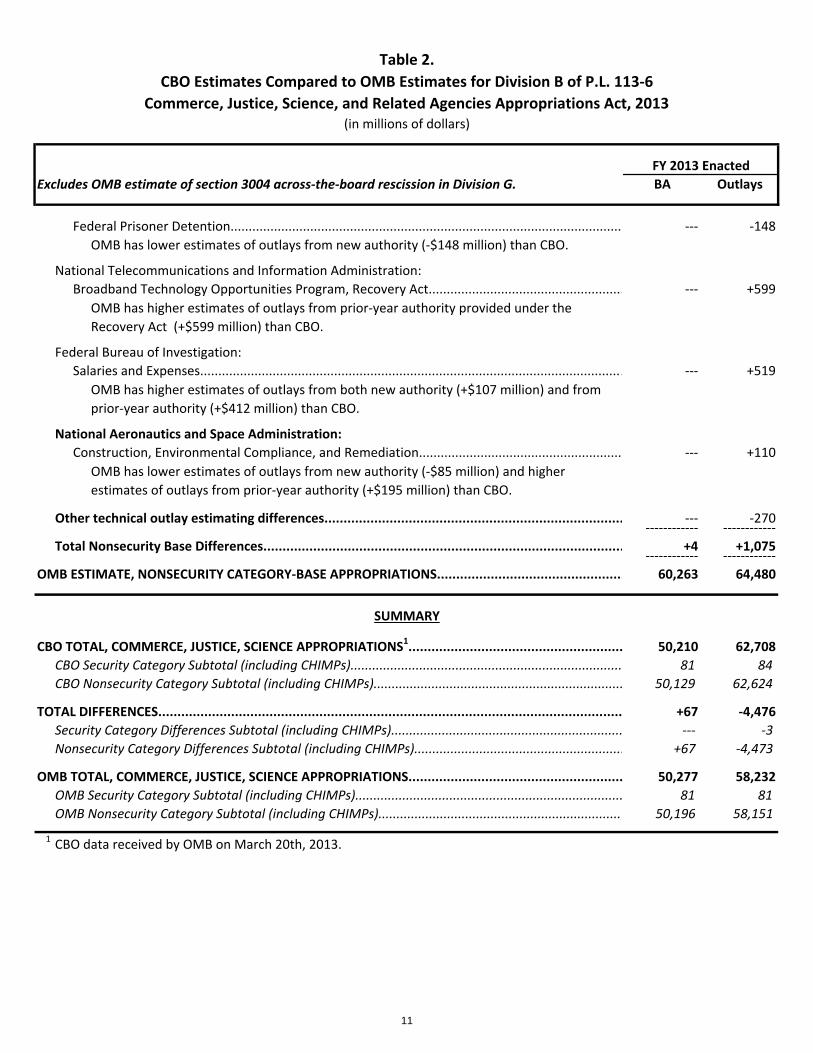
Table 2.
CBO Estimates Compared to OMB Estimates for Division B of P.L. 113‐6
Commerce, Justice, Science, and Related Agencies Appropriations Act, 2013(in millions of dollars)
FY 2013 Enacted
Excludes OMB estimate of section 3004 across‐the‐board rescission in Division G. BA Outlays
Federal Prisoner Detention............................................................................................................ ‐‐‐ ‐148
OMB has lower estimates of outlays from new authority (‐$148 million) than CBO.
National Telecommunications and Information Administration:
Broadband Technology Opportunities Program, Recovery Act...................................................... ‐‐‐ +599
OMB has higher estimates of outlays from prior‐year authority provided under the
Recovery Act (+$599 million) than CBO.
Federal Bureau of Investigation:
Salaries and Expenses..................................................................................................................... ‐‐‐ +519
OMB has higher estimates of outlays from both new authority (+$107 million) and from
prior‐year authority (+$412 million) than CBO.
National Aeronautics and Space Administration:
Construction, Environmental Compliance, and Remediation........................................................ ‐‐‐ +110
OMB has lower estimates of outlays from new authority (‐$85 million) and higher
estimates of outlays from prior‐year authority (+$195 million) than CBO.
Other technical outlay estimating differences.............................................................................. ‐‐‐ ‐270‐‐‐‐‐‐‐‐‐‐‐‐ ‐‐‐‐‐‐‐‐‐‐‐‐
Total Nonsecurity Base Differences.............................................................................................. +4 +1,075‐‐‐‐‐‐‐‐‐‐‐‐ ‐‐‐‐‐‐‐‐‐‐‐‐
OMB ESTIMATE, NONSECURITY CATEGORY‐BASE APPROPRIATIONS................................................. 60,263 64,480
SUMMARY
CBO TOTAL, COMMERCE, JUSTICE, SCIENCE APPROPRIATIONS1........................................................ 50,210 62,708
CBO Security Category Subtotal (including CHIMPs)........................................................................... 81 84
CBO Nonsecurity Category Subtotal (including CHIMPs)..................................................................... 50,129 62,624
TOTAL DIFFERENCES......................................................................................................................... +67 ‐4,476
Security Category Differences Subtotal (including CHIMPs)................................................................ ‐‐‐ ‐3
Nonsecurity Category Differences Subtotal (including CHIMPs).......................................................... +67 ‐4,473
OMB TOTAL, COMMERCE, JUSTICE, SCIENCE APPROPRIATIONS........................................................ 50,277 58,232
OMB Security Category Subtotal (including CHIMPs).......................................................................... 81 81
OMB Nonsecurity Category Subtotal (including CHIMPs).................................................................... 50,196 58,151
1 CBO data received by OMB on March 20th, 2013.
11
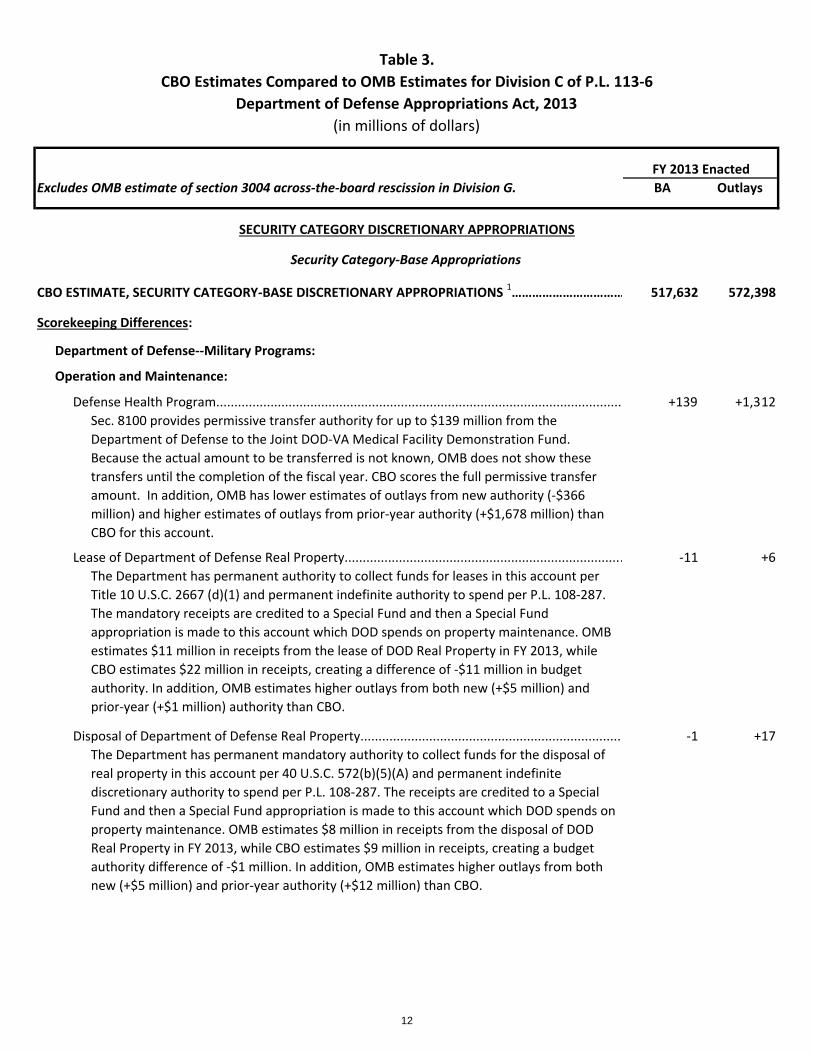
Table 3.
FY 2013 Enacted
Excludes OMB estimate of section 3004 across‐the‐board rescission in Division G. BA Outlays
CBO ESTIMATE, SECURITY CATEGORY‐BASE DISCRETIONARY APPROPRIATIONS 1…………………………… 517,632 572,398
Scorekeeping Differences:
Department of Defense‐‐Military Programs:
Operation and Maintenance:
Defense Health Program................................................................................................................ +139 +1,312
Sec. 8100 provides permissive transfer authority for up to $139 million from the
Department of Defense to the Joint DOD‐VA Medical Facility Demonstration Fund.
Because the actual amount to be transferred is not known, OMB does not show these
transfers until the completion of the fiscal year. CBO scores the full permissive transfer
amount. In addition, OMB has lower estimates of outlays from new authority (‐$366
million) and higher estimates of outlays from prior‐year authority (+$1,678 million) than
CBO for this account.
Lease of Department of Defense Real Property............................................................................. ‐11 +6
The Department has permanent authority to collect funds for leases in this account per
Title 10 U.S.C. 2667 (d)(1) and permanent indefinite authority to spend per P.L. 108‐287.
The mandatory receipts are credited to a Special Fund and then a Special Fund
appropriation is made to this account which DOD spends on property maintenance. OMB
estimates $11 million in receipts from the lease of DOD Real Property in FY 2013, while
CBO estimates $22 million in receipts, creating a difference of ‐$11 million in budget
authority. In addition, OMB estimates higher outlays from both new (+$5 million) and
prior‐year (+$1 million) authority than CBO.
Disposal of Department of Defense Real Property......................................................................... ‐1 +17
The Department has permanent mandatory authority to collect funds for the disposal of
real property in this account per 40 U.S.C. 572(b)(5)(A) and permanent indefinite
discretionary authority to spend per P.L. 108‐287. The receipts are credited to a Special
Fund and then a Special Fund appropriation is made to this account which DOD spends on
property maintenance. OMB estimates $8 million in receipts from the disposal of DOD
Real Property in FY 2013, while CBO estimates $9 million in receipts, creating a budget
authority difference of ‐$1 million. In addition, OMB estimates higher outlays from both
new (+$5 million) and prior‐year authority (+$12 million) than CBO.
CBO Estimates Compared to OMB Estimates for Division C of P.L. 113‐6
Department of Defense Appropriations Act, 2013
(in millions of dollars)
SECURITY CATEGORY DISCRETIONARY APPROPRIATIONS
Security Category‐Base Appropriations
12

Table 3.
FY 2013 Enacted
Excludes OMB estimate of section 3004 across‐the‐board rescission in Division G. BA Outlays
CBO Estimates Compared to OMB Estimates for Division C of P.L. 113‐6
Department of Defense Appropriations Act, 2013
(in millions of dollars)
Operation and Maintenance, Defense‐wide.................................................................................. +100 +826
CBO scores a $100 million permissive transfer to the Department of State, International
Assistance Program ‐ Global Security Contingency Fund pursuant to section 8069, which
provides authority to transfer up to $200 million. OMB does not score this permissive
transfer because a transfer will only occur if the Department of State and the Department
of Defense need to react to a significant international security event. In any given year, the
likelihood of a significant international security event occurring is unclear and there is no
historical reference for estimating the transfer total, since 2012 was the first year that
such an authority has been available. In addition, OMB has lower estimates of outlays
from new authority (‐$294 million) and higher estimates of outlays from prior‐year
authority (+$1,120 million) than CBO for this account.
Procurement:
Shipbuilding and Conversion, Navy................................................................................................ ‐7 +788
CBO scores +$8 million as a reappropriation to the Judgment Fund per the United States
Code, section 612 of title 41 on Payment of Claims. OMB agrees that this should be scored
as a reappropriation but assumes that there will be no balances remaining to transfer
under this authority. Also, there is a +$1 million budget authority difference due to
rounding the rescissions in section 8041. OMB rounds separate rescissions within the
same provision individually while CBO adds the rescissions together first and then rounds
to a total. In addition, OMB estimates lower outlays from new authority (‐$626 million)
and higher outlays from prior‐year authority (+$1,414 million) than CBO.
Aircraft Procurement, Air Force..................................................................................................... +1 +2,059
This +$1 million budget authority difference is due to rounding the rescissions in section
8041. OMB rounds separate rescissions within the same provision individually while CBO
adds the rescissions together first and then rounds to a total. In addition, OMB estimates
higher outlays from both new (+$328 million) and prior‐year authority (+$1,731 million)
than CBO.
Other Procurement, Air Force........................................................................................................ ‐1 ‐673
This ‐$1 million budget authority difference is due to rounding the rescissions in section
8041. OMB rounds separate rescissions within the same provision individually while CBO
adds the rescissions together first and then rounds to a total. In addition, OMB estimates
lower outlays from both new (‐$361 million) and prior‐year authority (‐$312 million) than
CBO.
Department of State:
International Assistance Program, Global Security Contingency Fund.......................................... ‐100 ‐75
The budget authority difference is due to CBO scoring a $100 million permissive transfer
that OMB does not score ‐‐ see full explanation under Operation and Maintenance,
Defense‐wide. In addition, OMB estimates lower outlays from both new (‐$35 million) and
prior‐year authority (‐$40 million) than CBO for this account.
13

Table 3.
FY 2013 Enacted
Excludes OMB estimate of section 3004 across‐the‐board rescission in Division G. BA Outlays
CBO Estimates Compared to OMB Estimates for Division C of P.L. 113‐6
Department of Defense Appropriations Act, 2013
(in millions of dollars)
Department of Veterans Affairs:
Veterans Health Administration, Joint DOD‐VA Medical Facility Demonstration Fund................. ‐139 ‐137
The budget authority difference is due to CBO scoring a $139 million permissive transfer
that OMB does not score ‐‐ see full explanation under the Defense Health Program. In
addition, OMB estimates lower outlays from both new (‐$125 million) and prior‐year
authority (‐$12 million) than CBO for this account.
Department of the Treasury:
CBO Rounding Plug......................................................................................................................... ‐2 ‐‐‐
CBO uses this account to reconcile the CBO bill total (tracked in millions) with the
Appropriations Subcommittee's Comparative Statement of Budget Authority (CSBA) total
(tracked in thousands). OMB scoring does not include reconciliation with the CSBA.
Multi‐Agency:
Division G Section 3001(b)(2) Across‐the‐Board Rescission........................................................... +2 +3
This +$2 million budget authority difference is due to rounding. In addition, OMB has
lower estimates of outlay savings from new authority (+$3 million) than CBO.
Technical Outlay Estimating Differences:
Department of Defense‐‐Military Programs:
Operation and Maintenance:
Operation and Maintenance, Navy................................................................................................ ‐‐‐ ‐1,116
OMB estimates lower outlays from both new (‐$1,002 million) and prior‐year authority
(‐$114 million) than CBO.
Operation and Maintenance, Army................................................................................................ ‐‐‐ +2,831
OMB estimates lower outlays from new authority (‐$3,791 million) and higher outlays
from prior‐year authority (+$6,622 million) than CBO.
Operation and Maintenance, Air Force.......................................................................................... ‐‐‐ +4,309
OMB estimates higher outlays from both new (+$345 million) and prior‐year authority
(+$3,964 million) than CBO.
Afghanistan Security Forces Fund.................................................................................................. ‐‐‐ ‐2,108
OMB estimates lower outlays from prior‐year authority (‐$2,108 million) than CBO.
Procurement:
Aircraft Procurement, Navy............................................................................................................ ‐‐‐ +1,509
OMB estimates higher outlays from both new (+$343 million) and prior‐year authority
(+$1,166 million) than CBO.
Missile Procurement, Air Force...................................................................................................... ‐‐‐ +588
OMB estimates higher outlays from both new (+$535 million) and prior‐year authority
(+$53 million) than CBO.
14

Table 3.
FY 2013 Enacted
Excludes OMB estimate of section 3004 across‐the‐board rescission in Division G. BA Outlays
CBO Estimates Compared to OMB Estimates for Division C of P.L. 113‐6
Department of Defense Appropriations Act, 2013
(in millions of dollars)
Other Procurement, Army.............................................................................................................. ‐‐‐ ‐870
OMB estimates lower outlays from both new (‐$364 million) and prior‐year authority
(‐$506 million) than CBO.
Procurement of Ammunition, Army............................................................................................... ‐‐‐ +670
OMB estimates lower outlays from new authority (‐$107 million) and higher outlays from
prior‐year authority (+$777 million) than CBO.
Aircraft Procurement, Army........................................................................................................... ‐‐‐ +427
OMB estimates higher outlays from both new (+$178 million) and prior‐year authority
(+$249 million) than CBO.
Procurement Of Weapons and Tracked Combat Vehicles, Army................................................... ‐‐‐ +442
OMB estimates lower outlays from new authority (‐$19 million) but higher outlays from
prior‐year authority (+$461 million) than CBO.
Other Procurement, Navy.............................................................................................................. ‐‐‐ ‐427
OMB estimates lower outlays from both new (‐$60 million) and prior‐year authority (‐$367
million) than CBO.
Research, Development, Test, and Evaluation:
Research, Development, Test and Evaluation, Defense‐wide........................................................ ‐‐‐ +421
OMB estimates higher outlays from both new (+$224 million) and prior‐year authority
(+$197 million) than CBO.
Research, Development, Test and Evaluation, Army..................................................................... ‐‐‐ +860
OMB estimates lower outlays from new authority (‐$258 million) and higher outlays from
prior‐year authority (+$1,118 million) than CBO.
Research, Development, Test and Evaluation, Air Force................................................................ ‐‐‐ +1,131
OMB estimates lower outlays from new authority (‐$41 million) and higher outlays from
prior‐year authority (+$1,172 million) than CBO.
Revolving and Management Funds:
Working Capital Funds, (multiple accounts)................................................................................... ‐‐‐ +2,486
OMB estimates lower outlays from new authority (‐$33,546 million) and higher outlays
from prior‐year authority (+$36,032 million) than CBO.
National Defense Sealift Fund........................................................................................................ ‐‐‐ +671
OMB estimates lower outlays from new authority (‐$184 million) and higher outlays from
prior‐year authority (+$855 million) than CBO.
Other technical outlay estimating differences……………………………………………………………………………. ‐‐‐ +634‐‐‐‐‐‐‐‐‐‐‐ ‐‐‐‐‐‐‐‐‐‐‐
TOTAL DIFFERENCES..................................................................................................................... ‐19 +16,584‐‐‐‐‐‐‐‐‐‐‐ ‐‐‐‐‐‐‐‐‐‐‐
OMB ESTIMATE, SECURITY CATEGORY‐BASE APPROPRIATIONS ……………………………………………………… 517,613 588,982
15

Table 3.
FY 2013 Enacted
Excludes OMB estimate of section 3004 across‐the‐board rescission in Division G. BA Outlays
CBO Estimates Compared to OMB Estimates for Division C of P.L. 113‐6
Department of Defense Appropriations Act, 2013
(in millions of dollars)
CBO ESTIMATE, SECURITY CATEGORY‐OCO/GWOT DISCRETIONARY APPROPRIATIONS1 87,226 48,044
Scorekeeping Differences:
Department of Defense‐‐Military Programs:
Operation and Maintenance:
Air National Guard.......................................................................................................................... ‐1 +3
The ‐$1 million budget authority difference is due to rounding the appropriation under
this heading. In addition, OMB has higher estimates of outlays from new authority (+$3
million) than CBO.
Procurement:
Weapons Procurement, Navy......................................................................................................... ‐1 ‐1
The ‐$1 million budget authority difference is due to rounding the appropriation under
this heading. In addition, OMB has lower estimates of outlays from new authority (‐$1
million) than CBO.
Technical Outlay Estimating Differences:
Department of Defense‐‐Military Programs:
Operation and Maintenance:
Operation and Maintenance, Defense‐wide.................................................................................. ‐‐‐ +1,350
OMB has higher estimates of outlays from new authority (+$1,350 million) than CBO.
Operation and Maintenance, Navy................................................................................................ ‐‐‐ +1,431
OMB has higher estimates of outlays from new authority (+$1,431 million) than CBO.
Operation and Maintenance, Army................................................................................................ ‐‐‐ +2,077
OMB has higher estimates of outlays from new authority (+$2,077 million) than CBO.
Operation and Maintenance, Air Force.......................................................................................... ‐‐‐ +1,619
OMB has higher estimates of outlays from new authority (+$1,619 million) than CBO.
Operation and Maintenance, Marine Corps................................................................................... ‐‐‐ +326
OMB has higher estimates of outlays from new authority (+$326 million) than CBO.
Overseas Contingency Operations Transfer Fund.......................................................................... ‐‐‐ +344
OMB has higher estimates of outlays from new authority (+$344 million) than CBO.
Security Category‐Overseas Contingency Operations/Global War on Terrorism (OCO/GWOT) Discretionary Appropriations
16
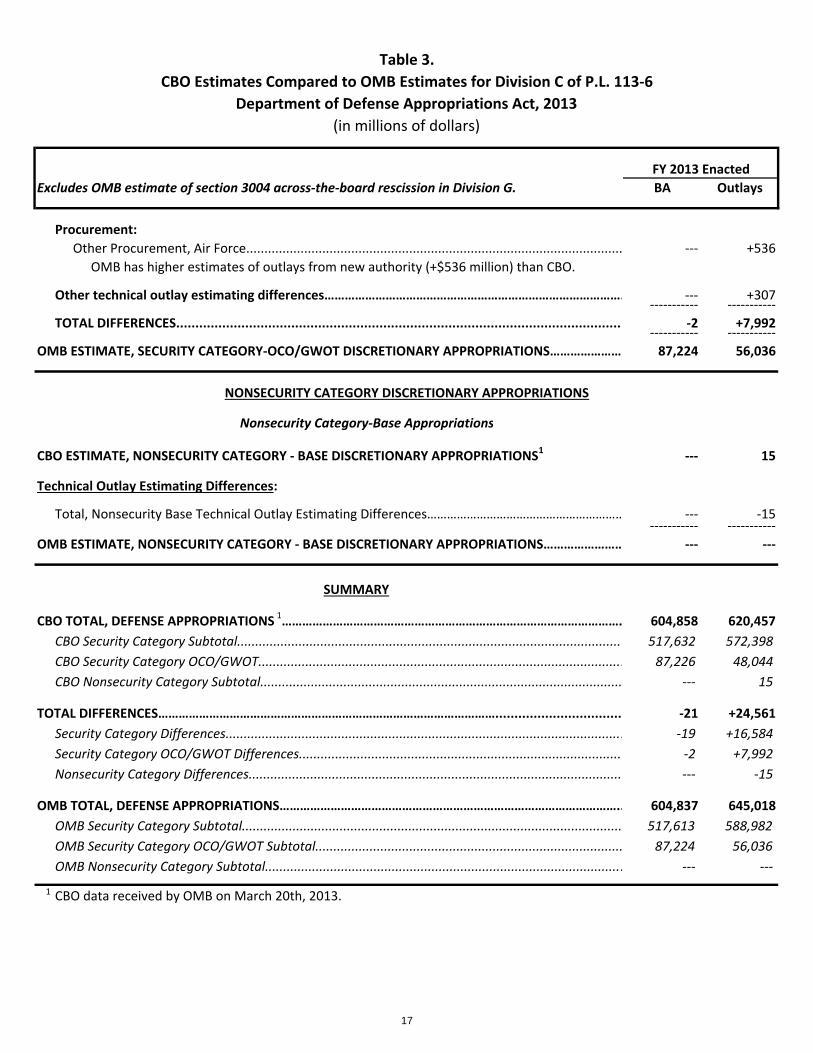
Table 3.
FY 2013 Enacted
Excludes OMB estimate of section 3004 across‐the‐board rescission in Division G. BA Outlays
CBO Estimates Compared to OMB Estimates for Division C of P.L. 113‐6
Department of Defense Appropriations Act, 2013
(in millions of dollars)
Procurement:
Other Procurement, Air Force........................................................................................................ ‐‐‐ +536
OMB has higher estimates of outlays from new authority (+$536 million) than CBO.
Other technical outlay estimating differences……………………………………………………………………………. ‐‐‐ +307‐‐‐‐‐‐‐‐‐‐‐ ‐‐‐‐‐‐‐‐‐‐‐
TOTAL DIFFERENCES..................................................................................................................... ‐2 +7,992‐‐‐‐‐‐‐‐‐‐‐ ‐‐‐‐‐‐‐‐‐‐‐
OMB ESTIMATE, SECURITY CATEGORY‐OCO/GWOT DISCRETIONARY APPROPRIATIONS…………………… 87,224 56,036
Nonsecurity Category‐Base Appropriations
CBO ESTIMATE, NONSECURITY CATEGORY ‐ BASE DISCRETIONARY APPROPRIATIONS1 ‐‐‐ 15
Technical Outlay Estimating Differences:
Total, Nonsecurity Base Technical Outlay Estimating Differences…………………………………………………… ‐‐‐ ‐15‐‐‐‐‐‐‐‐‐‐‐ ‐‐‐‐‐‐‐‐‐‐‐
OMB ESTIMATE, NONSECURITY CATEGORY ‐ BASE DISCRETIONARY APPROPRIATIONS…………………… ‐‐‐ ‐‐‐
SUMMARY
CBO TOTAL, DEFENSE APPROPRIATIONS 1………………………………………………………………………………………. 604,858 620,457
CBO Security Category Subtotal........................................................................................................... 517,632 572,398
CBO Security Category OCO/GWOT..................................................................................................... 87,226 48,044
CBO Nonsecurity Category Subtotal.................................................................................................... ‐‐‐ 15
TOTAL DIFFERENCES………………………………………………………………………………………................................. ‐21 +24,561
Security Category Differences.............................................................................................................. ‐19 +16,584
Security Category OCO/GWOT Differences.......................................................................................... ‐2 +7,992
Nonsecurity Category Differences....................................................................................................... ‐‐‐ ‐15
OMB TOTAL, DEFENSE APPROPRIATIONS……………………………………………………………………………………….. 604,837 645,018
OMB Security Category Subtotal......................................................................................................... 517,613 588,982
OMB Security Category OCO/GWOT Subtotal..................................................................................... 87,224 56,036
OMB Nonsecurity Category Subtotal................................................................................................... ‐‐‐ ‐‐‐
1 CBO data received by OMB on March 20th, 2013.
NONSECURITY CATEGORY DISCRETIONARY APPROPRIATIONS
17
Table 4.
CBO Estimates Compared to OMB Estimates for Division D of P.L. 113‐6
Department of Homeland Security Appropriations Act, 2013(in millions of dollars)
Excludes OMB estimate of section 3004 across‐the‐board rescission in Division G. BA Outlays
SECURITY CATEGORY DISCRETIONARY APPROPRIATIONS
Security Category‐Base Discretionary Appropriations
CBO ESTIMATE, SECURITY CATEGORY‐BASE DISCRETIONARY APPROPRIATIONS1.............................. 39,606 45,332
Scorekeeping Differences:
Department of Homeland Security (DHS):
Departmental Management:
Departmental Operations............................................................................................................... ‐1 +36
The difference in budget authority of ‐$1 million is due to rounding. In addition, OMB has
lower estimates of outlays from new authority (‐$39 million) and higher estimates of
outlays from prior‐year authority (+$75 million) than CBO.
Office of the Chief Information Officer........................................................................................... ‐1 ‐13
The difference in budget authority of ‐$1 million is due to rounding. In addition, OMB has
lower estimates of outlays from new authority (‐$20 million) and higher estimates of
outlays from prior‐year authority (+$7 million) than CBO.
Transportation Security Administration:
Aviation Security ............................................................................................................................ ‐23 +183
CBO assumes receipts of ‐$2,070 million under current law, while OMB assumes receipts
of ‐$2,093 million, which leads to the budget authority and part of the outlays from new
authority difference. In addition, OMB has higher estimates of outlays from new authority
(+$774 million) and lower estimates of outlays from prior‐year authority (‐$568 million)
than CBO.
Customs and Border Protection:
+7 +849
CBO's scoring does not include the +$7 million permanent, indefinite appropriation for
Small Airports, whereas OMB's scoring does. In addition, OMB has higher estimates of
outlays from new authority (+$937 million) and lower estimates of outlays from prior‐year
authority (‐$88 million) than CBO.
United States Coast Guard:
Trust Fund Share of Expenses......................................................................................................... ‐1 +2
This budget authority difference of ‐$1 million is due to rounding. In addition, OMB has
higher estimates of outlays from new authority (+$23 million) and lower estimates of
outlays from prior‐year authority (‐$21 million) than CBO.
FY 2013 Enacted
Salaries and Expenses ....................................................................................................................
18

Table 4.
CBO Estimates Compared to OMB Estimates for Division D of P.L. 113‐6
Department of Homeland Security Appropriations Act, 2013(in millions of dollars)
Excludes OMB estimate of section 3004 across‐the‐board rescission in Division G. BA Outlays
FY 2013 Enacted
Federal Emergency Management Agency:
Disaster Assistance Direct Loan Program Account......................................................................... +258 +48
Section 564 of the Act loosens forgiveness requirements for "Special Community Disaster
Loans" disbursed to communities affected by Hurricane Katrina and also refunds any
payments borrowers have already made on these loans. CBO based their $13 million
score for forgiving the disaster loans on the 2013 President's Budget reestimated subsidy
cost and added administrative costs associated with forgiving the loans. However, in the
2013 President's Budget, FEMA erroneously omitted future principal and interest
payments that borrowers were contractually obligated to pay, incorrectly suggesting that
all remaining loans would be forgiven. Since FEMA’s baseline for the 2013 President’s
Budget failed to provide estimates of future cash flows as required by the Federal Credit
Reform Act, OMB scoring of this provision is instead based on a revised estimate of future
collections. After correcting the 2013 President's Budget baseline cost estimate to include
expected repayments under these contracts, OMB scores the provision at $271 million to
reflect the cost associated with forgiving the disaster loans. Neither CBO nor OMB score a
budget authority cost for the refunds of payments borrowers have already made on these
loans because the language specifies that those repayments should come from
unobligated balances of funds provided under the Community Disaster Loan Act of 2005
(P.L. 109‐88). In addition, OMB has lower estimates of outlays from new authority (‐$15
million) and higher estimates of outlays from prior‐year authority (+$63 million) than CBO.
CBO Rounding Plug.............................................................................................................................. +2 ‐‐‐
CBO uses this account to reconcile the CBO bill total (tracked in millions) with the
Appropriations Subcommittee's Comparative Statement of Budget Authority (CSBA) total
(tracked in thousands). OMB scoring does not include a reconciliation with the CSBA.
Technical Outlay Estimating Differences:
Department of Homeland Security (DHS):
Immigration and Customs Enforcement:
Salaries and Expenses..................................................................................................................... ‐‐‐ +30
OMB has lower estimates of outlays from new authority (‐$1,062 million) and higher
estimates of outlays from prior‐year authority (+$1,092 million) than CBO.
Transportation Security Administration:
Transportation Security Support.................................................................................................... ‐‐‐ +44
OMB has higher estimates of outlays from new authority (+$286 million) and lower
estimates of outlays from prior‐year authority (‐$242 million) than CBO.
United States Secret Service:
Acquisition, Construction, and Improvements............................................................................... ‐‐‐ +32
OMB has higher estimates of outlays from new authority (+$34 million) and lower
estimates of outlays from prior‐year authority (‐$2 million) than CBO.
19

Table 4.
CBO Estimates Compared to OMB Estimates for Division D of P.L. 113‐6
Department of Homeland Security Appropriations Act, 2013(in millions of dollars)
Excludes OMB estimate of section 3004 across‐the‐board rescission in Division G. BA Outlays
FY 2013 Enacted
Customs and Border Protection:
Automation Modernization............................................................................................................ ‐‐‐ ‐94
OMB has lower estimates of outlays from new authority (‐$135 million) and higher
estimates of outlays from prior‐year authority (+$41 million) than CBO.
Air and Marine Interdiction, Operations, Maintenance, and Procurement................................... ‐‐‐ +42
OMB has lower estimates of outlays from new authority (‐$240 million) and higher
estimates of outlays from prior‐year authority (+$282 million) than CBO.
Border Security Fencing, Infrastructure, and Technology.............................................................. ‐‐‐ ‐106
OMB has lower estimates of outlays from prior‐year authority (‐$106 million) than CBO.
United States Coast Guard:
Acquisition, Construction, and Improvements .............................................................................. ‐‐‐ +636
OMB has higher estimates for outlays from both new (+$180 million) and prior‐year
authority (+$456 million) than CBO.
National Protections and Program Directorate:
United States Visitor and Immigrant Status Indicator Technology................................................ ‐‐‐ +146
OMB has higher estimates for outlays from both new (+$67 million) and prior‐year
authority (+$79 million) than CBO.
Infrastructure Protection and Information Security....................................................................... ‐‐‐ +283
OMB has higher estimates of outlays from new authority (+$371 million) and lower
estimates of outlays from prior‐year authority (‐$88 million) than CBO.
Biodefense Countermeasures........................................................................................................ ‐‐‐ +169
OMB has higher estimates of outlays from prior‐year authority (+$169 million) than CBO.
Federal Emergency Management Agency:
State and Local Programs............................................................................................................... ‐‐‐ +1,992
OMB has higher estimates for outlays from both new (+$1,154 million) and prior‐year
authority (+$838 million) than CBO.
Disaster Relief Fund........................................................................................................................ ‐‐‐ +450
OMB has higher estimates for outlays from both new (+$438 million) and prior‐year
authority (+$12 million) than CBO.
Radiological Emergency Preparedness Program............................................................................ ‐‐‐ +51
OMB has lower estimates of outlays from new authority (‐$42 million) and higher
estimates of outlays from prior‐year authority (+$93 million) than CBO.
National Pre‐disaster Mitigation Fund........................................................................................... ‐‐‐ +87
OMB has lower estimates of outlays from new authority (‐$2 million) and higher estimates
of outlays from prior‐year authority (+$89 million) than CBO.
20

Table 4.
CBO Estimates Compared to OMB Estimates for Division D of P.L. 113‐6
Department of Homeland Security Appropriations Act, 2013(in millions of dollars)
Excludes OMB estimate of section 3004 across‐the‐board rescission in Division G. BA Outlays
FY 2013 Enacted
Domestic Nuclear Detection Office:
Research, Development, and Operations …………………………………………………………………………………… ‐‐‐ +43
OMB has higher estimates of outlays from new authority (+$136 million) and lower
estimates of outlays from prior‐year authority (‐$93 million) than CBO.
Other technical outlay estimating differences ............................................................................. ‐‐‐ ‐15‐‐‐‐‐‐‐‐‐‐‐ ‐‐‐‐‐‐‐‐‐‐‐
Total, Security Base Discretionary Differences ............................................................................. +241 +4,895‐‐‐‐‐‐‐‐‐‐‐ ‐‐‐‐‐‐‐‐‐‐‐
OMB Estimate, Security Category‐Base Discretionary Appropriations............................................... 39,847 50,227
Security Category‐Overseas Contingency Operations Discretionary Appropriations
CBO Estimate, Security Category‐Overseas Contingency Operations Discretionary Appropriations1.. 254 203
NO DIFFERENCES
OMB Estimate, Security Category‐Overseas Contingency Operations Discretionary Appropriations.. 254 203
Security Category‐Disaster Relief Cap Adjustment
CBO Estimate, Security Category‐Disaster Relief Cap Adjustment1.................................................... 6,400 320
Technical Outlay Estimating Differences:
Department of Homeland Security (DHS):
Federal Emergency Management Agency:
Disaster Relief Fund........................................................................................................................ ‐‐‐ +4,800
OMB has higher estimates of outlays from new authority (+$4,800 million) than CBO.
OMB Estimate, Security Category‐Disaster Relief Cap Adjustment.................................................... 6,400 5,120
21

Table 4.
CBO Estimates Compared to OMB Estimates for Division D of P.L. 113‐6
Department of Homeland Security Appropriations Act, 2013(in millions of dollars)
Excludes OMB estimate of section 3004 across‐the‐board rescission in Division G. BA Outlays
FY 2013 Enacted
SUMMARY
CBO TOTAL, HOMELAND SECURITY APPROPRIATIONS 1.................................................................... 46,260 45,855
CBO Security Category Subtotal......................................................................................................................... 39,606 45,332CBO OCO/GWOT Security Subtotal.................................................................................................................... 254 203CBO Disaster Relief Cap Adjustment Subtotal.................................................................................................... 6,400 320CBO Nonsecurity Category Subtotal.................................................................................................................. ‐‐‐ ‐‐‐
TOTAL DIFFERENCES ………….............................................................................................................. +241 +9,695Security Category Subtotal................................................................................................................................. 241 4,895OCO/GWOT Security Subtotal............................................................................................................................ ‐‐‐ ‐‐‐Disaster Relief Cap Adjustment Subtotal........................................................................................................... ‐‐‐ +4,800Nonsecurity Category Subtotal.......................................................................................................................... ‐‐‐ ‐‐‐
OMB TOTAL, HOMELAND SECURITY APPROPRIATIONS..................................................................... 46,501 55,550OMB Security Category Subtotal........................................................................................................................ 39,847 50,227OMB OCO/GWOT Security Subtotal................................................................................................................... 254 203OMB Disaster Relief Cap Adjustment Subtotal.................................................................................................. 6,400 5,120OMB Nonsecurity Category Subtotal................................................................................................................. ‐‐‐ ‐‐‐
1 CBO data received by OMB on March 20th, 2013.
22
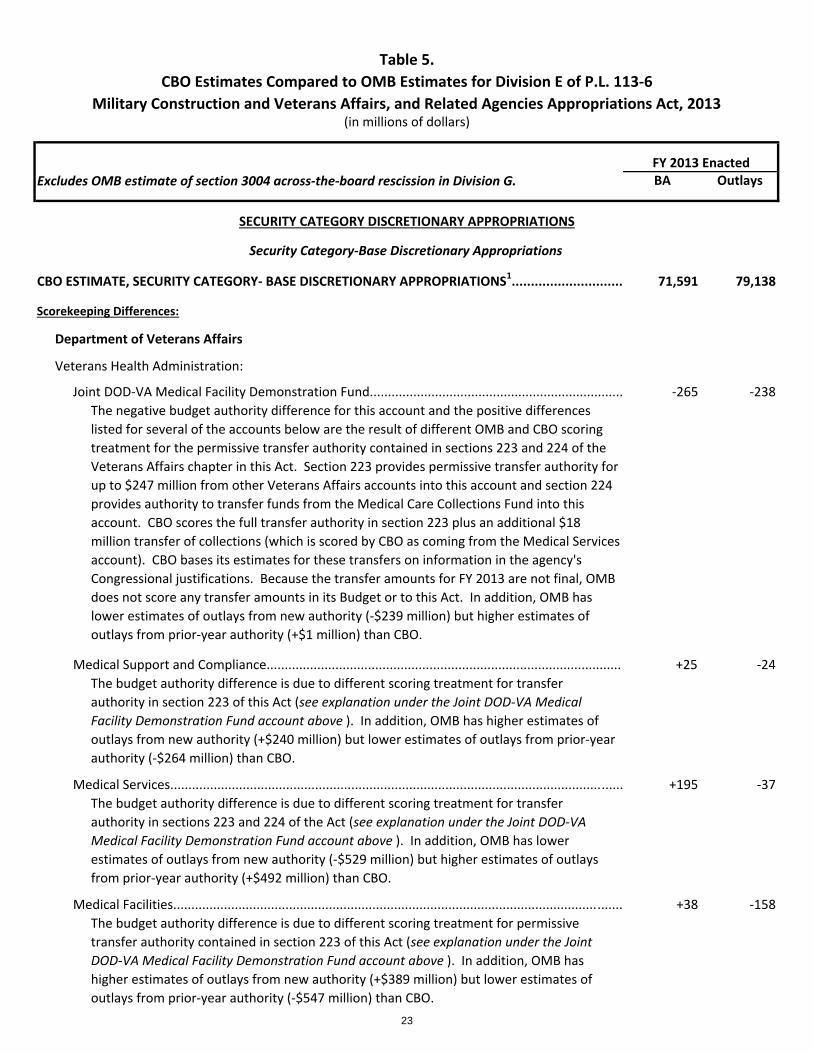
Table 5.
CBO Estimates Compared to OMB Estimates for Division E of P.L. 113‐6
Military Construction and Veterans Affairs, and Related Agencies Appropriations Act, 2013(in millions of dollars)
Excludes OMB estimate of section 3004 across‐the‐board rescission in Division G. BA Outlays
CBO ESTIMATE, SECURITY CATEGORY‐ BASE DISCRETIONARY APPROPRIATIONS1............................. 71,591 79,138
Scorekeeping Differences:
Department of Veterans Affairs
Veterans Health Administration:
Joint DOD‐VA Medical Facility Demonstration Fund...................................................................... ‐265 ‐238
The negative budget authority difference for this account and the positive differences
listed for several of the accounts below are the result of different OMB and CBO scoring
treatment for the permissive transfer authority contained in sections 223 and 224 of the
Veterans Affairs chapter in this Act. Section 223 provides permissive transfer authority for
up to $247 million from other Veterans Affairs accounts into this account and section 224
provides authority to transfer funds from the Medical Care Collections Fund into this
account. CBO scores the full transfer authority in section 223 plus an additional $18
million transfer of collections (which is scored by CBO as coming from the Medical Services
account). CBO bases its estimates for these transfers on information in the agency's
Congressional justifications. Because the transfer amounts for FY 2013 are not final, OMB
does not score any transfer amounts in its Budget or to this Act. In addition, OMB has
lower estimates of outlays from new authority (‐$239 million) but higher estimates of
outlays from prior‐year authority (+$1 million) than CBO.
Medical Support and Compliance.................................................................................................. +25 ‐24
The budget authority difference is due to different scoring treatment for transfer
authority in section 223 of this Act (see explanation under the Joint DOD‐VA Medical
Facility Demonstration Fund account above ). In addition, OMB has higher estimates of
outlays from new authority (+$240 million) but lower estimates of outlays from prior‐year
authority (‐$264 million) than CBO.
Medical Services............................................................................................................................. +195 ‐37
The budget authority difference is due to different scoring treatment for transfer
authority in sections 223 and 224 of the Act (see explanation under the Joint DOD‐VA
Medical Facility Demonstration Fund account above ). In addition, OMB has lower
estimates of outlays from new authority (‐$529 million) but higher estimates of outlays
from prior‐year authority (+$492 million) than CBO.
Medical Facilities............................................................................................................................ +38 ‐158
The budget authority difference is due to different scoring treatment for permissive
transfer authority contained in section 223 of this Act (see explanation under the Joint
DOD‐VA Medical Facility Demonstration Fund account above ). In addition, OMB has
higher estimates of outlays from new authority (+$389 million) but lower estimates of
outlays from prior‐year authority (‐$547 million) than CBO.
FY 2013 Enacted
SECURITY CATEGORY DISCRETIONARY APPROPRIATIONS
Security Category‐Base Discretionary Appropriations
23

Table 5.
CBO Estimates Compared to OMB Estimates for Division E of P.L. 113‐6
Military Construction and Veterans Affairs, and Related Agencies Appropriations Act, 2013(in millions of dollars)
Excludes OMB estimate of section 3004 across‐the‐board rescission in Division G. BA OutlaysFY 2013 Enacted
Information Technology System .................................................................................................... +7 +75
The budget authority difference is due to different scoring treatment for permissive
transfer authority contained in section 223 of this Act (see explanation under the Joint
DOD‐VA Medical Facility Demonstration Fund account above ). In addition, OMB estimates
higher outlays from new authority (+$75 million) than CBO.
Multi‐Agency:
Division G Section 3001(b)(2) Across‐the‐Board Rescission........................................................... ‐2 ‐4
The ‐$2 million budget authority difference in this calculation is due to underlying
technical differences in the amount estimated to be subject to the rescission. CBO
estimates a smaller ATB reduction (‐$27 million) than OMB (‐$29 million). In addition,
OMB has higher estimates of outlay savings from new authority (‐$4 million) than CBO.
CBO Rounding Plug......................................................................................................................... ‐1 ‐‐‐
CBO uses this account to reconcile the CBO bill total (tracked in millions) with the
Appropriations Subcommittee's Comparative Statement of Budget Authority (CSBA) total
(tracked in thousands). OMB scoring does not include a reconciliation with the CSBA.
Technical Outlay Estimating Differences:
Department of Defense:
Military Construction and Family Housing:
Military Construction, Defense‐wide ............................................................................................. ‐‐‐ +105
OMB estimates higher outlays from prior‐year authority (+$105 million) than CBO.
Military Construction, Navy and Marine Corps ............................................................................. ‐‐‐ +193
OMB estimates higher outlays from both new (+$94 million) and prior‐year authority
(+$99 million) than CBO.
Military Construction, Army........................................................................................................... ‐‐‐ +3,318
OMB estimates higher outlays from both new (+$383 million) and prior‐year authority
(+$2,935 million) than CBO.
Department of Defense Base Closure Account 2005 .................................................................... ‐‐‐ +116
OMB estimates lower outlays from new authority (‐$46 million) and higher outlays from
prior‐year authority (+$162 million) than CBO.
North Atlantic Treaty Organization Security Investment Program ................................................ ‐‐‐ +180
OMB estimates higher outlays from both new (+$99 million) and prior‐year authority
(+$81 million) than CBO.
Department of Defense Family Housing Improvement Fund ........................................................ ‐‐‐ ‐76
OMB estimates lower outlays from prior‐year authority (‐$76 million) than CBO.
24

Table 5.
CBO Estimates Compared to OMB Estimates for Division E of P.L. 113‐6
Military Construction and Veterans Affairs, and Related Agencies Appropriations Act, 2013(in millions of dollars)
Excludes OMB estimate of section 3004 across‐the‐board rescission in Division G. BA OutlaysFY 2013 Enacted
Department of Veterans Affairs:
Departmental Administration:
Construction, Major Projects ......................................................................................................... ‐‐‐ ‐212
OMB estimates lower outlays from both new (‐$19 million) and prior‐year authority (‐$193
million) than CBO.
Construction, Minor Projects ......................................................................................................... ‐‐‐ ‐221
OMB estimates lower outlays from both new authority (‐$48 million) and prior‐year
authority (‐$173 million) than CBO.
General Operating Expenses ......................................................................................................... ‐‐‐ ‐62
OMB estimates lower outlays from new authority (‐$201 million) but higher outlays from
prior‐year authority (+$139 million) than CBO.
Other technical outlay estimating differences.............................................................................. ‐‐‐ +15‐‐‐‐‐‐‐‐‐‐‐‐ ‐‐‐‐‐‐‐‐‐‐‐‐
Total Security Base Differences.................................................................................................... ‐3 +2,970‐‐‐‐‐‐‐‐‐‐‐‐ ‐‐‐‐‐‐‐‐‐‐‐‐
OMB ESTIMATE, SECURITY CATEGORY‐ BASE DISCRETIONARY APPROPRIATIONS............................. 71,588 81,782
CBO ESTIMATE, SECURITY CATEGORY‐ OCO/GWOT DISCRETIONARY APPROPRIATIONS1.................. ‐‐‐ 2
Technical Outlay Estimating Differences:
Total, Security OCO/GWOT Technical Outlay Estimating Differences................................................. ‐‐‐ ‐2‐‐‐‐‐‐‐‐‐‐‐‐ ‐‐‐‐‐‐‐‐‐‐‐‐
OMB ESTIMATE, SECURITY CATEGORY‐ OCO/GWOT DISCRETIONARY APPROPRIATIONS.................. ‐‐‐ ‐‐‐
CBO ESTIMATE, NONSECURITY CATEGORY‐ BASE APPROPRIATIONS1................................................ 339 262
Technical Outlay Estimating Differences:
Other Defense‐Civil Programs:
Salaries and Expenses [Cemeterial Expenses]................................................................................ ‐‐‐ +33
OMB has higher estimates of outlays from new authority (+$39 million) but lower
estimates of outlays from prior‐year authority (‐$6 million) than CBO.
Armed Forces Retirement Home.................................................................................................... ‐‐‐ ‐8
OMB has lower estimates of outlays from new authority (‐$9 million) but higher estimates
of outlays from prior‐year authority (+$1 million) than CBO.
NONSECURITY CATEGORY DISCRETIONARY APPROPRIATIONS
Nonsecurity Category‐Base Discretionary Appropriations
Security Category‐Overseas Contingency Operations/Global War on Terrorism (OCO/GWOT) Appropriations
25

Table 5.
CBO Estimates Compared to OMB Estimates for Division E of P.L. 113‐6
Military Construction and Veterans Affairs, and Related Agencies Appropriations Act, 2013(in millions of dollars)
Excludes OMB estimate of section 3004 across‐the‐board rescission in Division G. BA OutlaysFY 2013 Enacted
Total, Nonsecurity Base Technical Outlay Estimating Differences...................................................... ‐‐‐ +2‐‐‐‐‐‐‐‐‐‐‐‐ ‐‐‐‐‐‐‐‐‐‐‐‐
Total Nonsecurity Base Differences.............................................................................................. ‐‐‐ +27‐‐‐‐‐‐‐‐‐‐‐‐ ‐‐‐‐‐‐‐‐‐‐‐‐
OMB ESTIMATE, NONSECURITY CATEGORY‐ BASE APPROPRIATIONS................................................ 339 289
CBO TOTAL, MILITARY CONSTRUCTION AND VETERANS AFFAIRS APPROPRIATIONS1……………………….…………… 71,930 79,402
CBO Security Category Subtotal......................................................................................................................... 71,591 79,138
CBO OCO/GWOT Security Subtotal.................................................................................................................... ‐‐‐ 2
CBO Nonsecurity Category Subtotal.................................................................................................................. 339 262
TOTAL DIFFERENCES....................................................................................................................................... ‐3 +2,669
Security Category Differences............................................................................................................................ ‐3 +2,644
OCO/GWOT Security Subtotal............................................................................................................................ ‐‐‐ ‐2
Nonsecurity Category Differences...................................................................................................................... ‐‐‐ +27
OMB TOTAL, MILITARY CONSTRUCTION AND VETERANS AFFAIRS APPROPRIATIONS…………...……………………… 71,927 82,071
OMB Security Category Subtotal........................................................................................................................ 71,588 81,782
OMB OCO/GWOT Security Subtotal................................................................................................................... ‐‐‐ ‐‐‐
OMB Nonsecurity Category Subtotal................................................................................................................. 339 2891 CBO data received by OMB on March 20th, 2013.
SUMMARY
26

Table 6.
CBO Estimates Compared to OMB Estimates for Division F of P.L. 113‐6
Further Continuing Appropriations Act, 2013
Title II ‐‐ Energy and Water Development
Excludes OMB estimate of section 3004 across‐the‐board rescission in Division G. BA Outlays
SECURITY CATEGORY DISCRETIONARY APPROPRIATIONS
Security Category‐Base Discretionary Appropriations
CBO ESTIMATE, SECURITY CATEGORY ‐ BASE DISCRETIONARY APPROPRIATIONS1…………………………… 11,501 11,518
Technical Outlay Estimating Differences:
Department of Energy‐National Nuclear Security Administration:
Weapons Activities………………………………………………………………………………………………….................... ‐‐‐ +245
OMB has lower estimates of outlays from new authority (‐$813 million) but higher
estimates of outlays from prior‐year authority (+$1,058 million) than CBO.
Defense Nuclear Nonproliferation................................................................................................. ‐‐‐ +173
OMB has higher estimates of outlays from prior‐year authority (+$173 million) than CBO.
Other technical outlay estimating differences.............................................................................. ‐‐‐ ‐44‐‐‐‐‐‐‐‐‐‐‐ ‐‐‐‐‐‐‐‐‐‐‐
TOTAL DIFFERENCES..................................................................................................................... ‐‐‐ +374‐‐‐‐‐‐‐‐‐‐‐ ‐‐‐‐‐‐‐‐‐‐‐
OMB ESTIMATE, SECURITY CATEGORY ‐ BASE DISCRETIONARY APPROPRIATIONS............................ 11,501 11,892
Nonsecurity Category‐Base Discretionary Appropriations
CBO ESTIMATE, NONSECURITY CATEGORY ‐ BASE DISCRETIONARY APPROPRIATIONS1…………………… 21,782 29,486
Scorekeeping Differences:
Department of Energy:
Fees and Recoveries, Federal Energy Regulatory Commission………………………………………………. ‐26 ‐26
OMB scores collections in excess of spending for the account as discretionary, while CBO
scores collections in excess of spending as mandatory. This accounts for the ‐$26 million
difference in budget authority and outlays from new authority.
Electricity Delivery and Energy Reliability...................................................................................... +1 ‐163
The appropriation is $139.5 million and CBO rounded down while OMB rounded up
resulting in the budget authority difference. In addition, OMB has higher estimates of
outlays from new authority (+$34 million) but lower estimates of outlays from prior‐year
authority (‐$197 million) than CBO.
Power Marketing Administration:
Construction, Rehabilitation, Operation & Maintenance, Western Area Power Administration… +4 +218
A $4 million difference exists for budget authority and associated outlays from new
authority because CBO has a higher estimate of annual expense receipts than OMB ($194
million as compared to $190 million) because OMB interprets the legislative language as
limiting the collections to that level. In addition, OMB has higher estimates of outlays
from both new (+$76 million) and prior‐year authority (+$138 million) than CBO.
(in millions of dollars)
FY 2013 Enacted
27

Table 6.
CBO Estimates Compared to OMB Estimates for Division F of P.L. 113‐6
Further Continuing Appropriations Act, 2013
Title II ‐‐ Energy and Water Development
Excludes OMB estimate of section 3004 across‐the‐board rescission in Division G. BA Outlays
(in millions of dollars)
FY 2013 Enacted
Corps of Engineers ‐‐ Civil Works:
Operations and Maintenance………………………………………………………………………………….................... +10 ‐61
This account receives funding derived from the Harbor Maintenance Trust Fund. CBO has
a lower estimate of funds derived from this fund than OMB resulting in a +$8 million
difference in both budget authority and outlays from new authority, plus a +$2 million
rounding difference in both budget authority and outlays from new authority. In addition,
OMB has lower estimates of outlays from new authority (‐$220 million) but higher
estimates of prior‐year authority (+$149 million) than CBO.
Harbor Maintenance Trust Fund………………………………………………………………………………………………… ‐8 ‐8
CBO has a lower estimate of funds that are transferred (resulting in higher net budget
authority and outlays) to the Operations and Maintenance account than OMB resulting in
a ‐$8 million difference in both budget authority and outlays from new authority.
Denali Commission:
Denali Commission Trust Fund………………………………………………………………………………………............. +4 +4
OMB scores the entire Denali Commission to the Energy and Water Development
Spending Committee, while CBO scores the Trust Fund Account to the Agriculture and
Rural Development Spending Committee.
Technical Outlay Estimating Differences:
Department of Energy:
Environmental and Other Defense Activities:
Other Defense Activities................................................................................................................. ‐‐‐ +208
OMB has lower estimates of outlays from new authority (‐$749 million) but higher
estimates of outlays from prior‐year authority (+$957 million) than CBO.
Defense Environmental Cleanup.................................................................................................... ‐‐‐ +641
OMB has higher estimates of outlays from both new authority (+$268 million) and prior‐
year authority (+$373 million) than CBO.
Energy Programs:
Title 17 Innovative Technology Loan Guarantee Program............................................................. ‐‐‐ +55
OMB has higher estimates of outlays from both new (+$6 million) and prior‐year authority
(+$49 million) than CBO.
Fossil Energy Research and Development...................................................................................... ‐‐‐ +353
OMB has higher estimates of outlays from both new (+$102 million) and prior‐year
authority (+$251 million) than CBO.
Science............................................................................................................................................ ‐‐‐ +1,195
OMB has higher estimates of outlays from both new (+$168 million) and prior‐year
authority (+$1,027 million) than CBO.
28
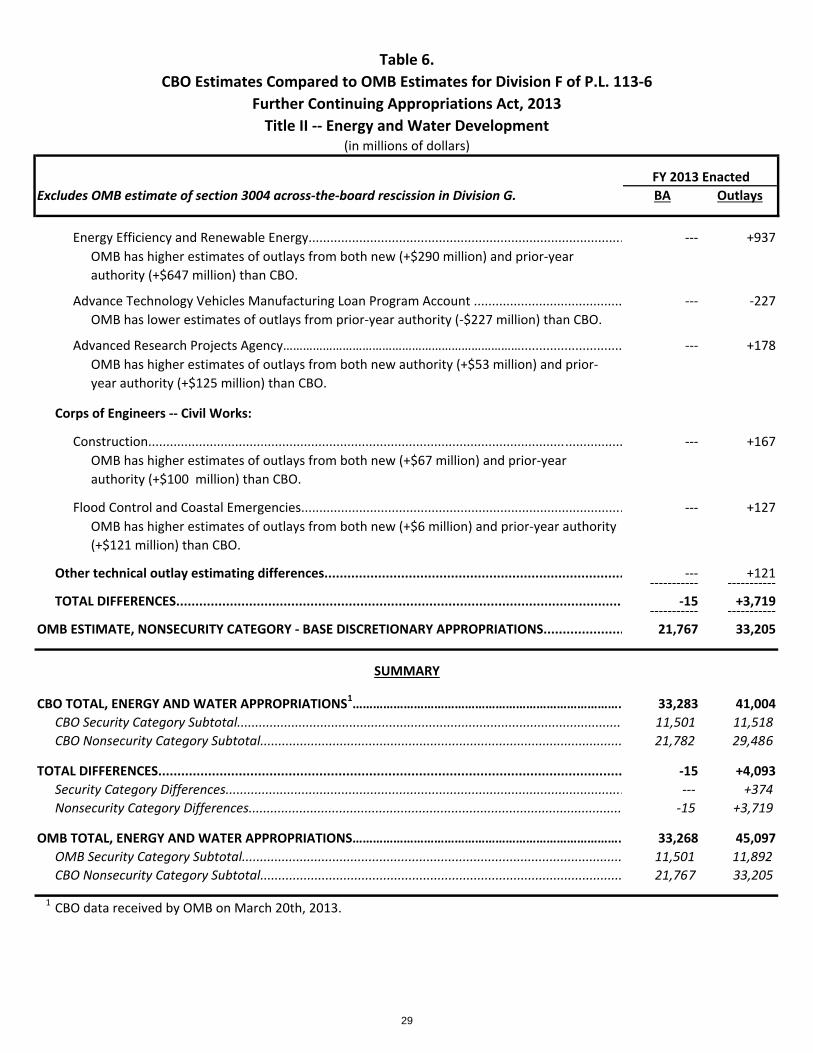
Table 6.
CBO Estimates Compared to OMB Estimates for Division F of P.L. 113‐6
Further Continuing Appropriations Act, 2013
Title II ‐‐ Energy and Water Development
Excludes OMB estimate of section 3004 across‐the‐board rescission in Division G. BA Outlays
(in millions of dollars)
FY 2013 Enacted
Energy Efficiency and Renewable Energy....................................................................................... ‐‐‐ +937
OMB has higher estimates of outlays from both new (+$290 million) and prior‐year
authority (+$647 million) than CBO.
Advance Technology Vehicles Manufacturing Loan Program Account ......................................... ‐‐‐ ‐227
OMB has lower estimates of outlays from prior‐year authority (‐$227 million) than CBO.
Advanced Research Projects Agency………………………………………………………………............................ ‐‐‐ +178
OMB has higher estimates of outlays from both new authority (+$53 million) and prior‐
year authority (+$125 million) than CBO.
Corps of Engineers ‐‐ Civil Works:
Construction................................................................................................................................... ‐‐‐ +167
OMB has higher estimates of outlays from both new (+$67 million) and prior‐year
authority (+$100 million) than CBO.
Flood Control and Coastal Emergencies......................................................................................... ‐‐‐ +127
OMB has higher estimates of outlays from both new (+$6 million) and prior‐year authority
(+$121 million) than CBO.
Other technical outlay estimating differences.............................................................................. ‐‐‐ +121‐‐‐‐‐‐‐‐‐‐‐ ‐‐‐‐‐‐‐‐‐‐‐
TOTAL DIFFERENCES..................................................................................................................... ‐15 +3,719‐‐‐‐‐‐‐‐‐‐‐ ‐‐‐‐‐‐‐‐‐‐‐
OMB ESTIMATE, NONSECURITY CATEGORY ‐ BASE DISCRETIONARY APPROPRIATIONS..................... 21,767 33,205
SUMMARY
CBO TOTAL, ENERGY AND WATER APPROPRIATIONS1……………………………………………………………………… 33,283 41,004
CBO Security Category Subtotal........................................................................................................... 11,501 11,518
CBO Nonsecurity Category Subtotal.................................................................................................... 21,782 29,486
TOTAL DIFFERENCES......................................................................................................................... ‐15 +4,093
Security Category Differences.............................................................................................................. ‐‐‐ +374
Nonsecurity Category Differences....................................................................................................... ‐15 +3,719
OMB TOTAL, ENERGY AND WATER APPROPRIATIONS……………………………………………………………………… 33,268 45,097
OMB Security Category Subtotal......................................................................................................... 11,501 11,892
CBO Nonsecurity Category Subtotal.................................................................................................... 21,767 33,205
1 CBO data received by OMB on March 20th, 2013.
29

Table 7.
CBO Estimates Compared to OMB Estimates for Division F of P.L. 113‐6
Further Continuing Appropriations Act, 2013
Title III ‐‐ Financial Services and General Government(in millions of dollars)
FY 2013 Enacted
Excludes OMB estimate of section 3004 across‐the‐board rescission in Division G. BA Outlays
Nonsecurity Category‐Changes in Mandatory Programs (CHIMPs)
CBO ESTIMATE, NONSECURITY CATEGORY CHIMPS1......................................................................... ‐985 ‐35
NO DIFFERENCES
OMB ESTIMATE, NONSECURITY CATEGORY CHIMPS......................................................................... ‐985 ‐35
Nonsecurity Category‐Base Discretionary Appropriation
22,438 24,405
Scorekeeping Differences:
Judicial Branch:
Courts of Appeals, District Courts, and Other Judicial Services:
Salaries and Expenses..................................................................................................................... +10 +10OMB has a higher estimate of budget authority and outlays from new authority (+$10
million) than CBO does. OMB assumes that Section 1101 of the Act maintains the level of
the discretionary appropriations in the account, while section 1109 provides such sums as
a term and condition of the Continuing Resolution for the permanent indefinite authority
authorized for the account. CBO maintains the topline provided in the underlying 2012
appropriations Act.
Executive Office of the President:
Special Assistance to the President and the Official Residence of the Vice President................... +1 +1
OMB adds the budget authority for these two accounts, while CBO scores them
separately. This results in a +$1 million difference in budget authority and outlays from
new authority due to rounding.
Federal Trade Commission
Salaries and Expenses..................................................................................................................... +3 ‐15OMB has a lower estimate of collections of Hart‐Scott‐Rodino and Do Not Call fees than
CBO which leads to a difference of +$3 million in budget authority and outlays from new
authority. Overall outlay differences result because OMB has lower estimates of outlays
from new authority (‐$76 million, including collections) and higher estimates of outlays
from prior‐year authority (+$61 million) than CBO.
Office of Personnel Management:
Employees and Retired Employees Health Benefits Funds............................................................ ‐1 ‐1
OMB has a lower estimate of budget authority and outlays from new authority (‐$1
million) than CBO due to rounding.
NONSECURITY CATEGORY DISCRETIONARY APPROPRIATIONS
CBO ESTIMATE, NONSECURITY CATEGORY ‐ BASE DISCRETIONARY APPROPRIATIONS1....................
30

Table 7.
CBO Estimates Compared to OMB Estimates for Division F of P.L. 113‐6
Further Continuing Appropriations Act, 2013
Title III ‐‐ Financial Services and General Government(in millions of dollars)
FY 2013 Enacted
Excludes OMB estimate of section 3004 across‐the‐board rescission in Division G. BA Outlays
Public Company Accounting Oversight Board:
Public Company Accounting Oversight Board................................................................................ ‐1 ‐1
OMB estimates lower fine collections, and thus, lower funding available for the
discretionary Sarbanes‐Oxley scholarship program funded out of this account. OMB
estimates available funding for this program at $1 million while CBO estimates available
budget authority would round to $2 million.
Other technical outlay estimating differences.............................................................................. ‐‐‐ +19‐‐‐‐‐‐‐‐‐‐‐ ‐‐‐‐‐‐‐‐‐‐‐
TOTAL DIFFERENCES..................................................................................................................... +12 +13‐‐‐‐‐‐‐‐‐‐‐ ‐‐‐‐‐‐‐‐‐‐‐
22,450 24,418
SUMMARY
CBO TOTAL, FINANCIAL SERVICES AND GENERAL GOVERNMENT APPROPRIATIONS1........................ 21,453 24,370
CBO Security Category Subtotal........................................................................................................... ‐‐‐ ‐‐‐
CBO Nonsecurity Category Subtotal (includes CHIMPs)....................................................................... 21,453 24,370
TOTAL DIFFERENCES......................................................................................................................... +12 +15
Security Category Differences.............................................................................................................. ‐‐‐ ‐‐‐
Nonsecurity Category Differences....................................................................................................... +12 +15
OMB TOTAL, FINANCIAL SERVICES AND GENERAL GOVERNMENT APPROPRIATIONS........................ 21,465 24,385
OMB Security Category Subtotal......................................................................................................... ‐‐‐ ‐‐‐
OMB Nonsecurity Category Subtotal (includes CHIMPs)..................................................................... 21,465 24,385
1 CBO data received by OMB on March 20th, 2013.
OMB ESTIMATE, NONSECURITY CATEGORY ‐ BASE DISCRETIONARY APPROPRIATIONS.....................
31

Table 8.
CBO Estimates Compared to OMB Estimates for Division F of P.L. 113‐6
Further Continuing Appropriations Act, 2013
Title IV ‐‐ Interior, Environment, and Related Agencies
Excludes OMB estimate of section 3004 across‐the‐board rescission in Division G. BA Outlays
CBO ESTIMATE, INTERIOR, ENVIRONMENT NONSECURITY CATEGORY‐CHIMPS1.............................. ‐67 ‐38
Technical Outlay Estimating Differences:
Total, Nonsecurity technical outlay estimating differences................................................................ ‐‐‐ +1‐‐‐‐‐‐‐‐‐ ‐‐‐‐‐‐‐‐‐
OMB ESTIMATE, INTERIOR, ENVIRONMENT NONSECURITY CATEGORY‐CHIMPS............................... ‐67 ‐37
CBO ESTIMATE, INTERIOR, ENVIRONMENT NONSECURITY CATEGORY‐BASE APPROPRIATIONS1....... 29,894 31,621
Scorekeeping Differences:
Department of the Interior:
Bureau of Land Management:
Management of Lands and Resources........................................................................................... +3 +20
OMB’s estimate of net collections and spending of fees including Mining Law fees, fees for
processing applications for permit to drill, and for conducting oil and gas inspection
activities is lower (‐$16 million) than CBO's estimate of net collections and spending (‐$19
million), which results in a +$3 million difference in net budget authority and outlays from
new authority. Also, OMB has higher estimates of outlays from new authority (+$6
million) and higher estimates of outlays from prior‐year authority (+$11 million) than CBO.
United States Fish and Wildlife Service:
Multinational Species Conservation Fund...................................................................................... +1 +1
The budget authority difference is due to rounding. OMB has lower estimates of outlays
from new authority (‐$2 million) and higher estimates of outlays from prior‐year authority
(+$3 million) than CBO.
North American Wetlands Conservation Fund............................................................................... ‐1 +3
The budget authority difference is due to rounding. OMB has lower estimates of outlays
from new authority (‐$2 million) and higher estimates of outlays from prior‐year authority
(+$5 million) than CBO.
Smithsonian Institution:
Repair, Restoration, and Renovation of Buildings, National Gallery of Art.................................... ‐1 +9
The budget authority difference is due to rounding. OMB has higher estimates of outlays
from both new (+$8 million) and prior‐year authority (+$1 million) than CBO.
Nonsecurity Category ‐ Changes in Mandatory Programs (CHIMPs)
Nonsecurity Category ‐ Base Discretionary Appropriations
(in millions of dollars)
FY 2013 Enacted
NONSECURITY CATEGORY DISCRETIONARY APPROPRIATIONS
32
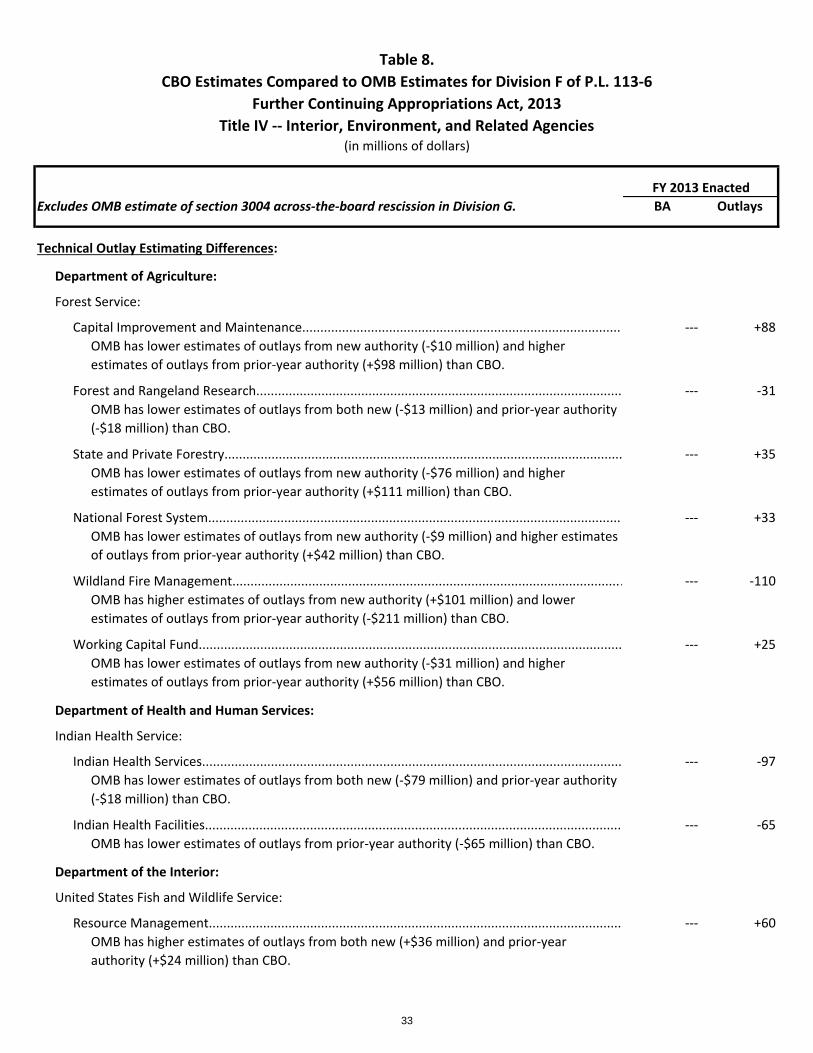
Table 8.
CBO Estimates Compared to OMB Estimates for Division F of P.L. 113‐6
Further Continuing Appropriations Act, 2013
Title IV ‐‐ Interior, Environment, and Related Agencies
Excludes OMB estimate of section 3004 across‐the‐board rescission in Division G. BA Outlays
(in millions of dollars)
FY 2013 Enacted
Technical Outlay Estimating Differences:
Department of Agriculture:
Forest Service:
Capital Improvement and Maintenance......................................................................................... ‐‐‐ +88
OMB has lower estimates of outlays from new authority (‐$10 million) and higher
estimates of outlays from prior‐year authority (+$98 million) than CBO.
Forest and Rangeland Research..................................................................................................... ‐‐‐ ‐31
OMB has lower estimates of outlays from both new (‐$13 million) and prior‐year authority
(‐$18 million) than CBO.
State and Private Forestry.............................................................................................................. ‐‐‐ +35
OMB has lower estimates of outlays from new authority (‐$76 million) and higher
estimates of outlays from prior‐year authority (+$111 million) than CBO.
National Forest System................................................................................................................... ‐‐‐ +33
OMB has lower estimates of outlays from new authority (‐$9 million) and higher estimates
of outlays from prior‐year authority (+$42 million) than CBO.
Wildland Fire Management............................................................................................................ ‐‐‐ ‐110
OMB has higher estimates of outlays from new authority (+$101 million) and lower
estimates of outlays from prior‐year authority (‐$211 million) than CBO.
Working Capital Fund..................................................................................................................... ‐‐‐ +25
OMB has lower estimates of outlays from new authority (‐$31 million) and higher
estimates of outlays from prior‐year authority (+$56 million) than CBO.
Department of Health and Human Services:
Indian Health Service:
Indian Health Services.................................................................................................................... ‐‐‐ ‐97
OMB has lower estimates of outlays from both new (‐$79 million) and prior‐year authority
(‐$18 million) than CBO.
Indian Health Facilities................................................................................................................... ‐‐‐ ‐65
OMB has lower estimates of outlays from prior‐year authority (‐$65 million) than CBO.
Department of the Interior:
United States Fish and Wildlife Service:
Resource Management.................................................................................................................. ‐‐‐ +60
OMB has higher estimates of outlays from both new (+$36 million) and prior‐year
authority (+$24 million) than CBO.
33

Table 8.
CBO Estimates Compared to OMB Estimates for Division F of P.L. 113‐6
Further Continuing Appropriations Act, 2013
Title IV ‐‐ Interior, Environment, and Related Agencies
Excludes OMB estimate of section 3004 across‐the‐board rescission in Division G. BA Outlays
(in millions of dollars)
FY 2013 Enacted
Cooperative Endangered Species Conservation Fund.................................................................... ‐‐‐ +20
OMB has higher estimates of outlays from prior‐year authority (+$20 million) than CBO.
National Park Service:
Operation of the National Park System.......................................................................................... ‐‐‐ +42
OMB has lower estimates of outlays from new authority (‐$117 million) and higher
estimates of outlays from prior‐year authority (+$159 million) than CBO.
Construction (and Major Maintenance)......................................................................................... ‐‐‐ +68
OMB has lower estimates of outlays from new authority (‐$34 million) and higher
estimates of outlays from prior‐year authority (+$102 million) than CBO.
Bureau of Indian Affairs and Bureau of Indian Education:
Operation of Indian Programs ....................................................................................................... ‐‐‐ ‐122
OMB has lower estimates of outlays from new authority (‐$262 million) and higher
estimates of outlays from prior‐year authority (+$140 million) than CBO.
Construction .................................................................................................................................. ‐‐‐ +25
OMB has lower estimates of outlays from new authority (‐$5 million) and higher estimates
of outlays from prior‐year authority (+$30 million) than CBO.
Department‐wide Programs:
Wildland Fire Management............................................................................................................ ‐‐‐ ‐53
OMB has lower estimates of outlays from new authority (‐$213 million) and higher
estimates of outlays from prior‐year authority (+$160 million) than CBO.
Working Capital Fund..................................................................................................................... ‐‐‐ +30
OMB has lower estimates of outlays from new authority (‐$150 million) and higher
estimates of outlays from prior‐year authority (+$180 million) than CBO.
Environmental Protection Agency:
State and Tribal Assistance Grants................................................................................................. ‐‐‐ ‐39
OMB has lower estimates of outlays from new authority (‐$88 million) and higher
estimates of outlays from prior‐year authority (+$49 million) than CBO.
Science and Technology................................................................................................................. ‐‐‐ ‐48
OMB has higher estimates of outlays from new authority (+$142 million) and lower
estimates of outlays from prior‐year authority (‐$190 million) than CBO.
Environmental Programs and Management.................................................................................. ‐‐‐ ‐46
OMB has higher estimates of outlays from new authority (+$67 million) and lower
estimates of outlays from prior‐year authority (‐$113 million) than CBO.
34

Table 8.
CBO Estimates Compared to OMB Estimates for Division F of P.L. 113‐6
Further Continuing Appropriations Act, 2013
Title IV ‐‐ Interior, Environment, and Related Agencies
Excludes OMB estimate of section 3004 across‐the‐board rescission in Division G. BA Outlays
(in millions of dollars)
FY 2013 Enacted
Working Capital Fund..................................................................................................................... ‐‐‐ +61
OMB has lower estimates of outlays from new authority (‐$16 million) and higher
estimates of outlays from prior‐year authority (+$77 million) than CBO.
Hazardous Substance Superfund.................................................................................................... ‐‐‐ +213
OMB has higher estimates of outlays from both new (+$120 million) and prior‐year
authority (+$93 million) than CBO.
Leaking Underground Storage Tank Trust Fund............................................................................. ‐‐‐ +22
OMB has lower estimates of outlays from new authority (‐$9 million) and higher estimates
of outlays from prior‐year authority (+$31 million) than CBO.
Other technical estimating differences......................................................................................... ‐‐‐ +114‐‐‐‐‐‐‐‐‐ ‐‐‐‐‐‐‐‐‐
TOTAL DIFFERENCES...................................................................................................................... +2 +258‐‐‐‐‐‐‐‐‐ ‐‐‐‐‐‐‐‐‐
OMB ESTIMATE, INTERIOR, ENVIRONMENT NONSECURITY CATEGORY‐BASE APPROPRIATIONS....... 29,896 31,879
SUMMARY
CBO TOTAL, INTERIOR, ENVIRONMENT APPROPRIATIONS1............................................................... 29,827 31,583
CBO Security Category Subtotal........................................................................................................... ‐‐‐ ‐‐‐
CBO Nonsecurity Category Subtotal (including CHIMPs)..................................................................... 29,827 31,583
TOTAL DIFFERENCES......................................................................................................................... +2 +259
Security Category Differences.............................................................................................................. ‐‐‐ ‐‐‐
Nonsecurity Category Differences (including CHIMPs)....................................................................... +2 +259
OMB TOTAL, INTERIOR, ENVIRONMENT APPROPRIATIONS............................................................... 29,829 31,842
OMB Security Category Subtotal......................................................................................................... ‐‐‐ ‐‐‐
OMB Nonsecurity Category Subtotal (including CHIMPs)................................................................... 29,829 31,842
1 CBO data received by OMB on March 20th, 2013.
35

Table 9.
CBO Estimates Compared to OMB Estimates for Division F of P.L. 113‐6
Further Continuing Appropriations Act, 2013
Title V ‐‐ Labor, Health and Human Services, and Education and Related Agencies
Excludes OMB estimate of section 3004 across‐the‐board rescission in Division G. BA Outlays
Nonsecurity Category ‐ Changes in Mandatory Programs (CHIMPs)
CBO ESTIMATE, NONSECURITY LABOR, HHS, EDUCATION CHIMPS 1.................................................. ‐6,533 178
Scorekeeping Differences:
Department of Labor:
Mine Safety and Health Administration:
Salaries and Expenses...................................................................................................................... +1 +1
OMB and CBO have a +$1 million budget authority difference due to varying assumptions
about the classification of the Mine Safety and Health Administration’s (MSHA’s) approval
and certification fees. CBO inadvertently assumed that only $1.499 million of the fee,
rather than the whole $2.499 million in collections, is classified as a mandatory receipt
under current law. CBO implicitly classified the remaining $1 million as a discretionary
collection that is available to offset the spending authority from that collection. OMB
instead assumes that the entire $2.499 million amount is mandatory since the receipts,
even absent 2013 appropriations language, can be collected and deposited in the General
Fund of the Treasury, pursuant to 31 U.S.C. 3302. Therefore, although both CBO and OMB
attribute a CHIMP cost to MSHA’s approval and certification fee language allowing the
salaries and expenses account to retain the fee, CBO assumes an additional $1 million
(rounded) cost to represent the conversion of the remaining current law mandatory
receipt into a discretionary offsetting collection, whereas OMB assumes an additional $2
million (rounded) cost for the conversion of the entire mandatory amount collected. This
leads to the entire difference in budget authority and outlays from new authority.
Technical Outlay Estimating Differences:
Department of Health and Human Services:
Centers for Medicare and Medicaid Services (multiple accounts)...................................................... ‐‐‐ ‐144
OMB has lower estimates of outlays from new authority (‐$144 million) than CBO.
Other technical estimating differences......................................................................................... ‐‐‐ +15‐‐‐‐‐‐‐‐‐‐‐ ‐‐‐‐‐‐‐‐‐‐‐
Total Differences.......................................................................................................................... +1 ‐128‐‐‐‐‐‐‐‐‐‐‐ ‐‐‐‐‐‐‐‐‐‐‐
OMB ESTIMATE, NONSECURITY LABOR, HHS, EDUCATION CHIMPS .................................................. ‐6,532 50
(in millions of dollars)
FY 2013 Enacted
NONSECURITY CATEGORY DISCRETIONARY APPROPRIATIONS
36

Table 9.
CBO Estimates Compared to OMB Estimates for Division F of P.L. 113‐6
Further Continuing Appropriations Act, 2013
Title V ‐‐ Labor, Health and Human Services, and Education and Related Agencies
Excludes OMB estimate of section 3004 across‐the‐board rescission in Division G. BA Outlays
(in millions of dollars)
FY 2013 Enacted
Nonsecurity Category ‐ Base Discretionary Appropriations
CBO ESTIMATE, NON‐SECURITY CATEGORY ‐ BASE DISCRETIONARY APPROPRIATIONS 1.................... 163,407 166,938
Scorekeeping Differences:
Department of Health and Human Services:
Health Resources and Services Administration:
Health Resources and Services........................................................................................................ ‐11 ‐23
The budget authority difference is due to scoring of permissive transfers ‐‐ see explanation
above. CBO scores permissive transfers to this account as follows: +1 million from the
Centers for Disease Control and Prevention; +9 million from the National Institutes of
Health; and +1 million from Substance Abuse and Mental Health Services accounts while
OMB does not. OMB has higher estimates of outlays from new authority (+$3 million) and
lower estimates of outlays from prior‐year authority (‐$26 million) than CBO.
Centers for Disease Control and Prevention:
Disease Control, Research, and Training ........................................................................................ +1 +108
The budget authority difference is due to scoring of permissive transfers ‐‐ see explanation
above. CBO scores a ‐$1 million permissive transfer from this account to the Health
Resources and Services account while OMB does not. OMB has lower estimates of outlays
from new authority (‐$175 million) and higher estimates of outlays from prior‐year
authority (+$283 million) than CBO.
National Institutes of Health ............................................................................................................... +9 +44
The budget authority difference is due to scoring of permissive transfers ‐‐ see explanation
above. CBO scores a ‐$9 million permissive transfer from this account to the Health
Resources and Services account while OMB does not. OMB has lower estimates of outlays
from new authority (‐$195 million) and higher estimates of outlays from prior‐year
authority (+$239 million) than CBO.
Permissive Transfers. Please note that several of the budget authority differences listed below
are due to the different scoring treatment of permissive transfers by OMB and CBO in the
continuing resolution (CR). OMB typically does not score permissive transfers that would be
permitted under section 1101 as a term and condition of the CR, whereas CBO does score such
transfers. Although permissive transfers can still be executed pursuant to the CR, it has been
OMB's standard practice, consistent with GAO opinion, that permissive transfers are not
deducted in determining the CR rate for operations in a short‐term CR. OMB has historically
extended that practice for full‐year CRs. The budget authority differences that are impacted by
this scoring treatment are noted in the explanation as appropriate.
37

Table 9.
CBO Estimates Compared to OMB Estimates for Division F of P.L. 113‐6
Further Continuing Appropriations Act, 2013
Title V ‐‐ Labor, Health and Human Services, and Education and Related Agencies
Excludes OMB estimate of section 3004 across‐the‐board rescission in Division G. BA Outlays
(in millions of dollars)
FY 2013 Enacted
Substance Abuse and Mental Health Services..................................................................................... +1 +1
The budget authority difference is due to scoring of permissive transfers ‐‐ see explanation
above. CBO scores a ‐$1 million permissive transfer from this account to the Health
Resources and Services account while OMB does not. OMB has higher estimates of
outlays from prior‐year authority (+$1 million) than CBO.
Centers for Medicare & Medicaid Services:
Federal Supplemental Medical Insurance Trust Fund..................................................................... +1 ‐89
OMB and CBO have a +$1 million budget authority difference due to rounding. OMB has
lower estimates of outlays from new authority (‐$874 million) and higher estimates of
outlays from prior‐year authority (+$785 million) than CBO.
Federal Hospital Insurance Trust Fund............................................................................................ +1 ‐85
OMB and CBO have a +$1 million budget authority difference due to rounding. OMB has
lower estimates of outlays from new authority (‐$183 million) and higher estimates of
outlays from prior‐year authority (+$98 million) than CBO.
Administration on Aging:
Aging and Disability Services Programs .......................................................................................... +2 ‐25
The budget authority difference is due to scoring of permissive transfers ‐‐ see explanation
above. CBO scores a‐$2 million permissive transfer from this account to the Commodity
Assistance Program account while OMB does not. OMB has lower estimates of outlays
from new authority (‐$43 million) and higher estimates of outlays from prior‐year
authority (+$18 million) than CBO.
Department of Labor:
Employment and Training Administration:
Unemployment Trust Fund Administration.................................................................................... ‐4 +5
CBO scores +$5 million for the Average Weekly Insured Unemployment contingent
appropriation in 2013, while OMB estimates that no contingent appropriation will be
necessary. CBO’s workload estimates, which trigger the contingency appropriation, are
higher than OMB’s estimates. In addition, there is a +1 million budget authority difference
due to rounding. OMB has higher estimates of outlays from new authority (+$44 million)
and lower estimates of outlays from prior‐year authority (‐$39 million) than CBO.
Mine Safety and Health Administration:
Salaries and Expenses...................................................................................................................... +1 +7
The budget authority difference is due to scoring of permissive transfers ‐‐ see explanation
above. CBO scores a ‐$1 million permissive transfer from this account to the
Departmental Management's Salaries and Expenses account while OMB does not. OMB
has higher estimates of outlays from both new authority (+$5 million) and prior‐year
authority (+$2 million) than CBO.
38

Table 9.
CBO Estimates Compared to OMB Estimates for Division F of P.L. 113‐6
Further Continuing Appropriations Act, 2013
Title V ‐‐ Labor, Health and Human Services, and Education and Related Agencies
Excludes OMB estimate of section 3004 across‐the‐board rescission in Division G. BA Outlays
(in millions of dollars)
FY 2013 Enacted
Departmental Management:
Salaries and Expenses...................................................................................................................... ‐1 +12
The budget authority difference is due to scoring of permissive transfers ‐‐ see explanation
above. CBO scores a +$1 million permissive transfer to this account from the Mine Safety
and Health Administration's Salaries and Expenses account while OMB does not. OMB has
higher estimates of outlays from both new authority (+$2 million) and prior‐year authority
(+$10 million) than CBO.
Department of Education:
Office of Federal Student Aid:
Student Financial Assistance........................................................................................................... ‐1 +1,514
OMB and CBO have a ‐$1 million budget authority difference due to rounding. OMB has
higher estimates of outlays from both new authority (+$274 million) and prior‐year
authority (+$1,240 million) than CBO.
Social Security Administration (SSA):
Supplemental Security Income (SSI) Program................................................................................. +10 ‐‐‐
OMB scores the first $7 million of the "Research and Demonstration" portion of the SSI
account as mandatory and the rest as discretionary because spending for certain activities
in this account is controlled through the appropriations process, while CBO scores the
entire "Research and Demonstration" portion as mandatory. This results in the total
budget authority difference of +$10 million.
State Supplemental Fees ................................................................................................................ ‐9 ‐18
OMB and CBO use different assumptions regarding the number of SSI beneficiaries that
will receive a state supplement, and therefore, the amount of fees for administering the
supplement that SSA will collect. CBO's assumption of the number of people anticipated to
get state supplement payments each month is extrapolated from SSA's research office
database, while OMB's assumption are based on SSA's actuarial data. OMB scores $161
million in spending pursuant to the enacted 2012 appropriations language and estimates
that ‐$170 million in fees are collected, for a net score of ‐$9 million. CBO estimates ‐$166
million in fees are collected, but inadvertently also scored $166 million in spending, for a
net score of zero. This results in a ‐$9 million difference in budget authority. In addition,
OMB has lower estimates of outlays from both new authority (‐$3 million) and from prior‐
year authority (‐$15 million) than CBO.
39
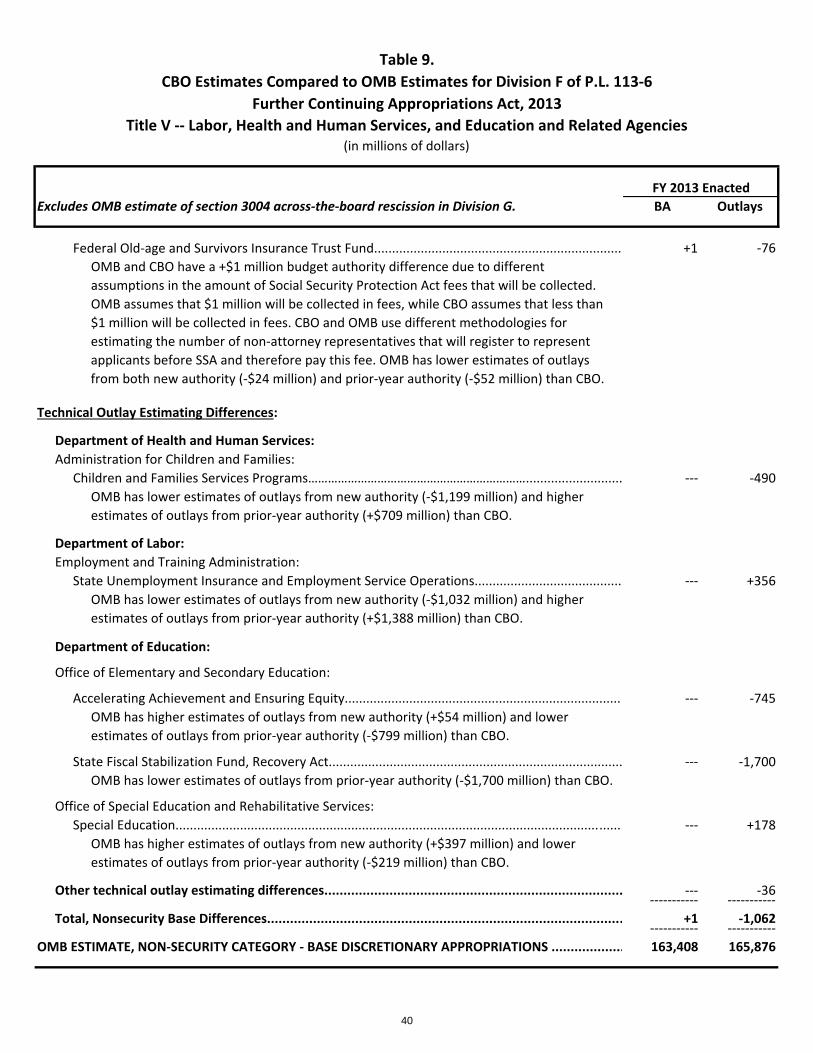
Table 9.
CBO Estimates Compared to OMB Estimates for Division F of P.L. 113‐6
Further Continuing Appropriations Act, 2013
Title V ‐‐ Labor, Health and Human Services, and Education and Related Agencies
Excludes OMB estimate of section 3004 across‐the‐board rescission in Division G. BA Outlays
(in millions of dollars)
FY 2013 Enacted
Federal Old‐age and Survivors Insurance Trust Fund..................................................................... +1 ‐76
OMB and CBO have a +$1 million budget authority difference due to different
assumptions in the amount of Social Security Protection Act fees that will be collected.
OMB assumes that $1 million will be collected in fees, while CBO assumes that less than
$1 million will be collected in fees. CBO and OMB use different methodologies for
estimating the number of non‐attorney representatives that will register to represent
applicants before SSA and therefore pay this fee. OMB has lower estimates of outlays
from both new authority (‐$24 million) and prior‐year authority (‐$52 million) than CBO.
Technical Outlay Estimating Differences:
Department of Health and Human Services:
Administration for Children and Families:
Children and Families Services Programs…………………………………………………………........................... ‐‐‐ ‐490
OMB has lower estimates of outlays from new authority (‐$1,199 million) and higher
estimates of outlays from prior‐year authority (+$709 million) than CBO.
Department of Labor:
Employment and Training Administration:
State Unemployment Insurance and Employment Service Operations......................................... ‐‐‐ +356
OMB has lower estimates of outlays from new authority (‐$1,032 million) and higher
estimates of outlays from prior‐year authority (+$1,388 million) than CBO.
Department of Education:
Office of Elementary and Secondary Education:
Accelerating Achievement and Ensuring Equity.............................................................................. ‐‐‐ ‐745
OMB has higher estimates of outlays from new authority (+$54 million) and lower
estimates of outlays from prior‐year authority (‐$799 million) than CBO.
State Fiscal Stabilization Fund, Recovery Act.................................................................................. ‐‐‐ ‐1,700
OMB has lower estimates of outlays from prior‐year authority (‐$1,700 million) than CBO.
Office of Special Education and Rehabilitative Services:
Special Education............................................................................................................................. ‐‐‐ +178
OMB has higher estimates of outlays from new authority (+$397 million) and lower
estimates of outlays from prior‐year authority (‐$219 million) than CBO.
Other technical outlay estimating differences.............................................................................. ‐‐‐ ‐36‐‐‐‐‐‐‐‐‐‐‐ ‐‐‐‐‐‐‐‐‐‐‐
Total, Nonsecurity Base Differences............................................................................................. +1 ‐1,062‐‐‐‐‐‐‐‐‐‐‐ ‐‐‐‐‐‐‐‐‐‐‐
OMB ESTIMATE, NON‐SECURITY CATEGORY ‐ BASE DISCRETIONARY APPROPRIATIONS ................... 163,408 165,876
40

Table 9.
CBO Estimates Compared to OMB Estimates for Division F of P.L. 113‐6
Further Continuing Appropriations Act, 2013
Title V ‐‐ Labor, Health and Human Services, and Education and Related Agencies
Excludes OMB estimate of section 3004 across‐the‐board rescission in Division G. BA Outlays
(in millions of dollars)
FY 2013 Enacted
Nonsecurity Category ‐ Program Integrity Discretionary Appropriations
CBO ESTIMATE, NON‐SECURITY CATEGORY ‐ PROGRAM INTEGRITY APPROPRIATIONS1..................... 483 430
Technical Outlay Estimating Differences:
Social Security Administration:
Supplemental Security Income Program…………………………………………………….................................. ‐‐‐ +27
OMB has higher estimates of outlays from new authority (+$27 million) than CBO.
Other technical outlay estimating differences.............................................................................. ‐‐‐ +26‐‐‐‐‐‐‐‐‐‐‐ ‐‐‐‐‐‐‐‐‐‐‐
Total, Nonsecurity Program Integrity Differences......................................................................... ‐‐‐ +53‐‐‐‐‐‐‐‐‐‐‐ ‐‐‐‐‐‐‐‐‐‐‐
OMB ESTIMATE, NON‐SECURITY CATEGORY ‐ PROGRAM INTEGRITY APPROPRIATIONS..................... 483 483
SUMMARY
CBO TOTAL, LABOR, HHS, EDUCATION AND RELATED AGENCIES APPROPRIATIONS1........................... 157,357 167,546
‐‐‐ ‐‐‐
156,874 167,116
483 430
TOTAL DIFFERENCES.......................................................................................................................... +2 ‐1,137
‐‐‐ ‐‐‐
+2 ‐1,190
‐‐‐ +53
OMB TOTAL, LABOR, HHS, EDUCATION AND RELATED AGENCIES APPROPRIATIONS ........................ 157,359 166,409
‐‐‐ ‐‐‐
156,876 165,926
483 483
1 CBO data received by OMB on March 20th, 2013.
OMB Security Category Subtotal..........................................................................................................
CBO Security Category Subtotal............................................................................................................
Security Category Differences...............................................................................................................
OMB Nonsecurity Category Program Integrity Subtotal .....................................................................
CBO Nonsecurity Category Subtotal (including CHIMPs)......................................................................
CBO Nonsecurity Category Program Integrity Subtotal........................................................................
Nonsecurity Category Differences (including CHIMPs).........................................................................
Nonsecurity Category Program Integrity Differences...........................................................................
OMB Nonsecurity Category Subtotal (including CHIMPs)....................................................................
41
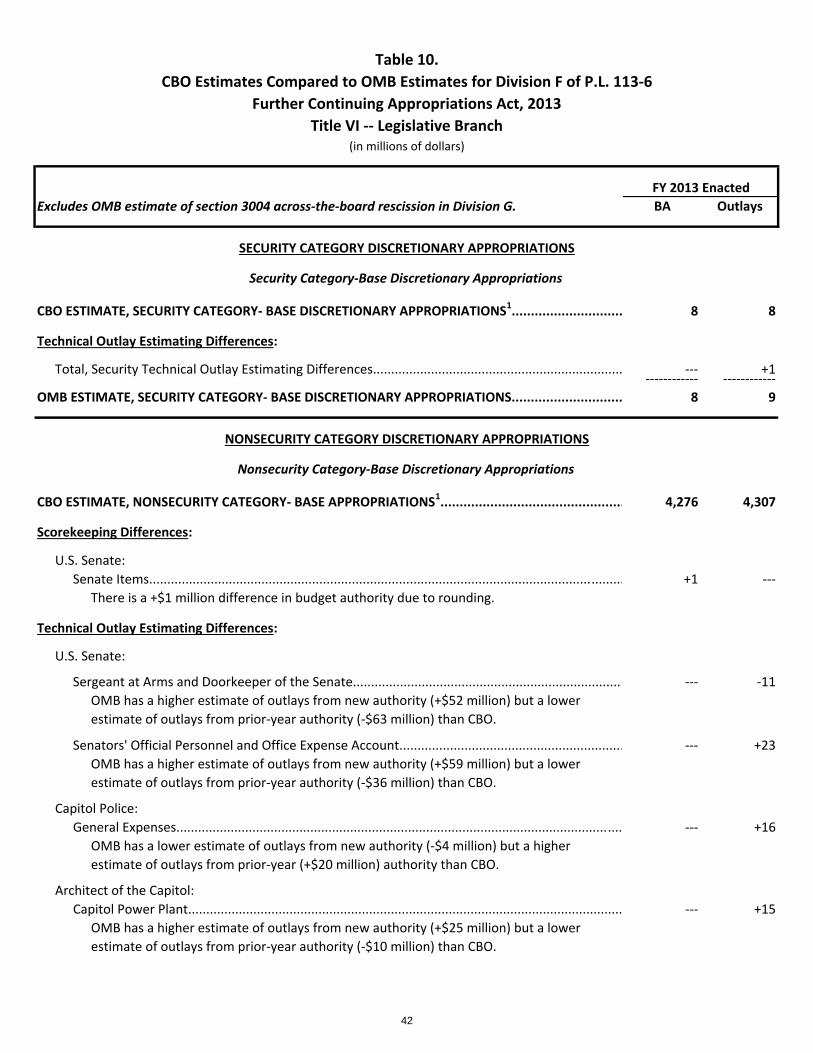
Table 10.
CBO Estimates Compared to OMB Estimates for Division F of P.L. 113‐6
Further Continuing Appropriations Act, 2013
Title VI ‐‐ Legislative Branch(in millions of dollars)
Excludes OMB estimate of section 3004 across‐the‐board rescission in Division G. BA Outlays
CBO ESTIMATE, SECURITY CATEGORY‐ BASE DISCRETIONARY APPROPRIATIONS1............................. 8 8
Technical Outlay Estimating Differences:
Total, Security Technical Outlay Estimating Differences..................................................................... ‐‐‐ +1‐‐‐‐‐‐‐‐‐‐‐‐ ‐‐‐‐‐‐‐‐‐‐‐‐
OMB ESTIMATE, SECURITY CATEGORY‐ BASE DISCRETIONARY APPROPRIATIONS............................. 8 9
CBO ESTIMATE, NONSECURITY CATEGORY‐ BASE APPROPRIATIONS1................................................ 4,276 4,307
Scorekeeping Differences:
U.S. Senate:
Senate Items................................................................................................................................... +1 ‐‐‐
There is a +$1 million difference in budget authority due to rounding.
Technical Outlay Estimating Differences:
U.S. Senate:
Sergeant at Arms and Doorkeeper of the Senate........................................................................... ‐‐‐ ‐11
OMB has a higher estimate of outlays from new authority (+$52 million) but a lower
estimate of outlays from prior‐year authority (‐$63 million) than CBO.
Senators' Official Personnel and Office Expense Account.............................................................. ‐‐‐ +23
OMB has a higher estimate of outlays from new authority (+$59 million) but a lower
estimate of outlays from prior‐year authority (‐$36 million) than CBO.
Capitol Police:
General Expenses........................................................................................................................... ‐‐‐ +16
OMB has a lower estimate of outlays from new authority (‐$4 million) but a higher
estimate of outlays from prior‐year (+$20 million) authority than CBO.
Architect of the Capitol:
Capitol Power Plant........................................................................................................................ ‐‐‐ +15
OMB has a higher estimate of outlays from new authority (+$25 million) but a lower
estimate of outlays from prior‐year authority (‐$10 million) than CBO.
NONSECURITY CATEGORY DISCRETIONARY APPROPRIATIONS
Nonsecurity Category‐Base Discretionary Appropriations
FY 2013 Enacted
SECURITY CATEGORY DISCRETIONARY APPROPRIATIONS
Security Category‐Base Discretionary Appropriations
42

Table 10.
CBO Estimates Compared to OMB Estimates for Division F of P.L. 113‐6
Further Continuing Appropriations Act, 2013
Title VI ‐‐ Legislative Branch(in millions of dollars)
Excludes OMB estimate of section 3004 across‐the‐board rescission in Division G. BA Outlays
FY 2013 Enacted
House Historic Buildings Revitalization Trust Fund........................................................................ ‐‐‐ +16
OMB has a lower estimate of outlays from new authority (‐$1 million) but a higher
estimate of outlays from prior‐year authority (+$17 million) than CBO.
Library of Congress:
Salaries and Expenses..................................................................................................................... ‐‐‐ ‐17
OMB has a lower estimate of outlays from new authority (‐$19 million) but a higher
estimate of outlays from prior‐year authority (+$2 million) than CBO.
Other technical estimating differences ........................................................................................ ‐‐‐ ‐14‐‐‐‐‐‐‐‐‐‐‐ ‐‐‐‐‐‐‐‐‐‐‐
TOTAL BASE DIFFERENCES............................................................................................................ +1 +28‐‐‐‐‐‐‐‐‐‐‐ ‐‐‐‐‐‐‐‐‐‐‐
OMB ESTIMATE, NONSECURITY CATEGORY‐ BASE APPROPRIATIONS................................................ 4,277 4,335
CBO TOTAL, LEGISLATIVE BRANCH APPROPRIATIONS1……………………….……………..…………………………… 4,284 4,315
CBO Security Category Subtotal........................................................................................................... 8 8
CBO Nonsecurity Category Subtotal ................................................................................................... 4,276 4,307
TOTAL DIFFERENCES......................................................................................................................... +1 +29
Security Category Differences.............................................................................................................. ‐‐‐ +1
Nonsecurity Category Differences....................................................................................................... +1 +28
OMB TOTAL, LEGISLATIVE BRANCH APPROPRIATIONS…………...……………………………………………………… 4,285 4,344
OMB Security Category Subtotal......................................................................................................... 8 9
OMB Nonsecurity Category Subtotal .................................................................................................. 4,277 4,3351 CBO data received by OMB on March 20th, 2013.
SUMMARY
43

Table 11.
CBO Estimates Compared to OMB Estimates for Division F of P.L. 113‐6
Further Continuing Appropriations Act, 2013
Title VII ‐‐ Department of State, Foreign Operations, and Related Programs(in millions of dollars)
FY 2013 Enacted
Excludes OMB estimate of section 3004 across‐the‐board rescission in Division G. BA Outlays
SECURITY CATEGORY DISCRETIONARY APPROPRIATIONS
Security Category ‐ Base Discretionary Appropriations
CBO ESTIMATE, SECURITY CATEGORY ‐ BASE APPROPRIATIONS1...................................................... 41,964 49,520
Scorekeeping Differences:
Department of State:
International Security Assistance:
Economic Support Fund................................................................................................................. +26 ‐300
The budget authority difference is due to scoring of permissive transfers ‐‐ see explanation
above. CBO scores a permissive transfer from this account to the Development Credit
Authority Program account while OMB does not. In addition, OMB has higher estimates of
outlays from new authority (+$154 million) and lower estimates of outlays from prior‐year
authority (‐$454 million) than CBO.
Administration of Foreign Affairs:
Diplomatic and Consular Programs................................................................................................ +22 +284
The budget authority difference is due to scoring of permissive transfers ‐‐ see explanation
above. CBO scores a permissive transfer from this account to the Conflict Stabilization
Operations account while OMB does not. In addition, OMB has higher estimates of outlays
from new authority (+$626 million) and lower estimates of outlays from prior‐year
authority (‐$342 million) than CBO.
Conflict Stabilization Operations.................................................................................................... ‐22 ‐15
The budget authority difference is due to scoring of permissive transfers ‐‐ see explanation
above. CBO scores a permissive transfer to this account from the Diplomatic and Consular
Programs account while OMB does not. In addition, OMB has lower estimates of outlays
from both new (‐$9 million) and prior‐year authority (‐$6 million) than CBO.
Permissive Transfers. Please note that several of the budget authority differences listed below
are due to the different scoring treatment of permissive transfers by OMB and CBO in the
continuing resolution (CR). OMB typically does not score permissive transfers that would be
permitted under section 1101 as a term and condition of the CR, whereas CBO does score such
transfers. Although permissive transfers can still be executed pursuant to the CR, it has been
OMB's standard practice, consistent with GAO opinion, that permissive transfers are not
deducted in determining the CR rate for operations in a short‐term CR. OMB has historically
extended that practice for full‐year CRs. The budget authority differences that are impacted by
this scoring treatment are noted in the explanation as appropriate.
44
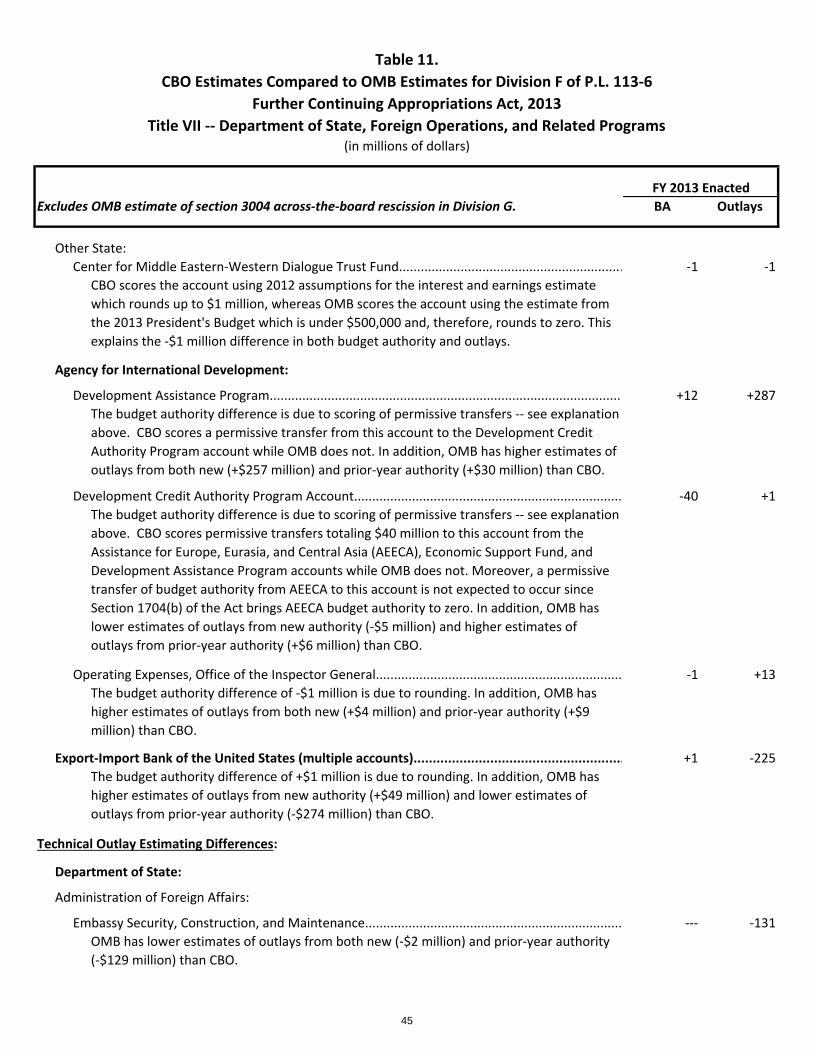
Table 11.
CBO Estimates Compared to OMB Estimates for Division F of P.L. 113‐6
Further Continuing Appropriations Act, 2013
Title VII ‐‐ Department of State, Foreign Operations, and Related Programs(in millions of dollars)
FY 2013 Enacted
Excludes OMB estimate of section 3004 across‐the‐board rescission in Division G. BA Outlays
Other State:
Center for Middle Eastern‐Western Dialogue Trust Fund.............................................................. ‐1 ‐1
CBO scores the account using 2012 assumptions for the interest and earnings estimate
which rounds up to $1 million, whereas OMB scores the account using the estimate from
the 2013 President's Budget which is under $500,000 and, therefore, rounds to zero. This
explains the ‐$1 million difference in both budget authority and outlays.
Agency for International Development:
Development Assistance Program.................................................................................................. +12 +287
The budget authority difference is due to scoring of permissive transfers ‐‐ see explanation
above. CBO scores a permissive transfer from this account to the Development Credit
Authority Program account while OMB does not. In addition, OMB has higher estimates of
outlays from both new (+$257 million) and prior‐year authority (+$30 million) than CBO.
Development Credit Authority Program Account.......................................................................... ‐40 +1
The budget authority difference is due to scoring of permissive transfers ‐‐ see explanation
above. CBO scores permissive transfers totaling $40 million to this account from the
Assistance for Europe, Eurasia, and Central Asia (AEECA), Economic Support Fund, and
Development Assistance Program accounts while OMB does not. Moreover, a permissive
transfer of budget authority from AEECA to this account is not expected to occur since
Section 1704(b) of the Act brings AEECA budget authority to zero. In addition, OMB has
lower estimates of outlays from new authority (‐$5 million) and higher estimates of
outlays from prior‐year authority (+$6 million) than CBO.
Operating Expenses, Office of the Inspector General.................................................................... ‐1 +13
The budget authority difference of ‐$1 million is due to rounding. In addition, OMB has
higher estimates of outlays from both new (+$4 million) and prior‐year authority (+$9
million) than CBO.
Export‐Import Bank of the United States (multiple accounts)....................................................... +1 ‐225
The budget authority difference of +$1 million is due to rounding. In addition, OMB has
higher estimates of outlays from new authority (+$49 million) and lower estimates of
outlays from prior‐year authority (‐$274 million) than CBO.
Technical Outlay Estimating Differences:
Department of State:
Administration of Foreign Affairs:
Embassy Security, Construction, and Maintenance....................................................................... ‐‐‐ ‐131
OMB has lower estimates of outlays from both new (‐$2 million) and prior‐year authority
(‐$129 million) than CBO.
45
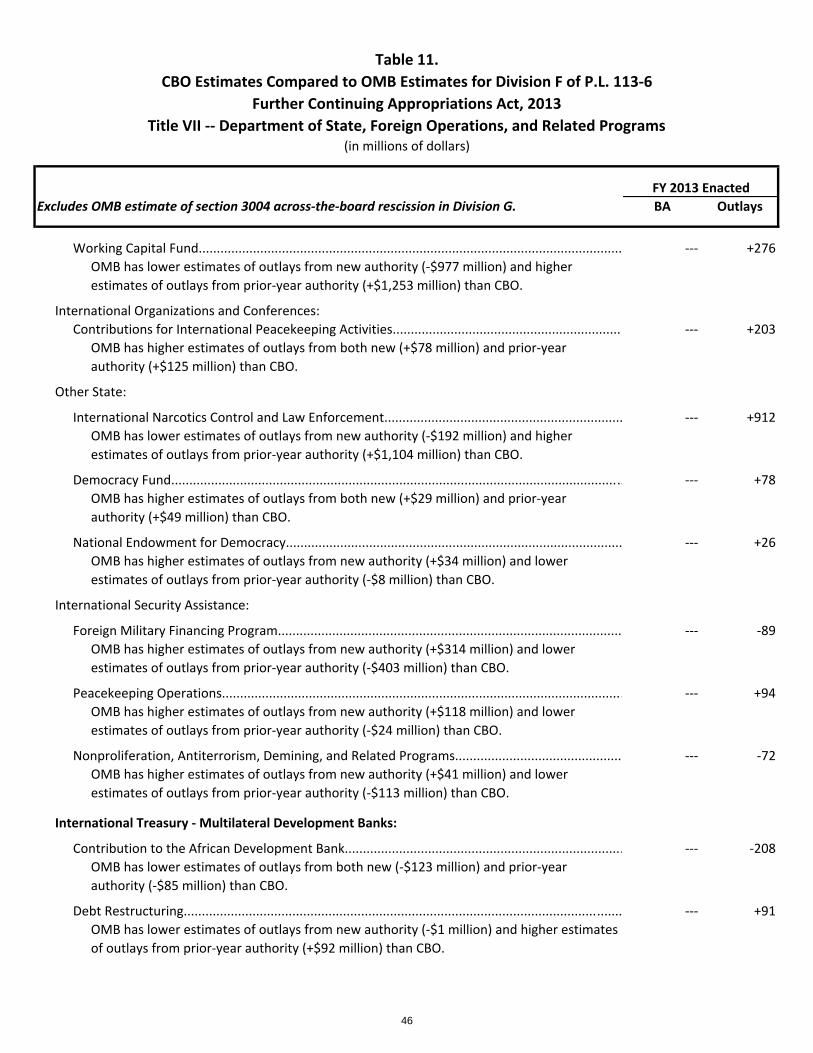
Table 11.
CBO Estimates Compared to OMB Estimates for Division F of P.L. 113‐6
Further Continuing Appropriations Act, 2013
Title VII ‐‐ Department of State, Foreign Operations, and Related Programs(in millions of dollars)
FY 2013 Enacted
Excludes OMB estimate of section 3004 across‐the‐board rescission in Division G. BA Outlays
Working Capital Fund..................................................................................................................... ‐‐‐ +276
OMB has lower estimates of outlays from new authority (‐$977 million) and higher
estimates of outlays from prior‐year authority (+$1,253 million) than CBO.
International Organizations and Conferences:
Contributions for International Peacekeeping Activities................................................................ ‐‐‐ +203
OMB has higher estimates of outlays from both new (+$78 million) and prior‐year
authority (+$125 million) than CBO.
Other State:
International Narcotics Control and Law Enforcement.................................................................. ‐‐‐ +912
OMB has lower estimates of outlays from new authority (‐$192 million) and higher
estimates of outlays from prior‐year authority (+$1,104 million) than CBO.
Democracy Fund............................................................................................................................. ‐‐‐ +78
OMB has higher estimates of outlays from both new (+$29 million) and prior‐year
authority (+$49 million) than CBO.
National Endowment for Democracy............................................................................................. ‐‐‐ +26
OMB has higher estimates of outlays from new authority (+$34 million) and lower
estimates of outlays from prior‐year authority (‐$8 million) than CBO.
International Security Assistance:
Foreign Military Financing Program............................................................................................... ‐‐‐ ‐89
OMB has higher estimates of outlays from new authority (+$314 million) and lower
estimates of outlays from prior‐year authority (‐$403 million) than CBO.
Peacekeeping Operations............................................................................................................... ‐‐‐ +94
OMB has higher estimates of outlays from new authority (+$118 million) and lower
estimates of outlays from prior‐year authority (‐$24 million) than CBO.
Nonproliferation, Antiterrorism, Demining, and Related Programs.............................................. ‐‐‐ ‐72
OMB has higher estimates of outlays from new authority (+$41 million) and lower
estimates of outlays from prior‐year authority (‐$113 million) than CBO.
International Treasury ‐ Multilateral Development Banks:
Contribution to the African Development Bank............................................................................. ‐‐‐ ‐208
OMB has lower estimates of outlays from both new (‐$123 million) and prior‐year
authority (‐$85 million) than CBO.
Debt Restructuring......................................................................................................................... ‐‐‐ +91
OMB has lower estimates of outlays from new authority (‐$1 million) and higher estimates
of outlays from prior‐year authority (+$92 million) than CBO.
46
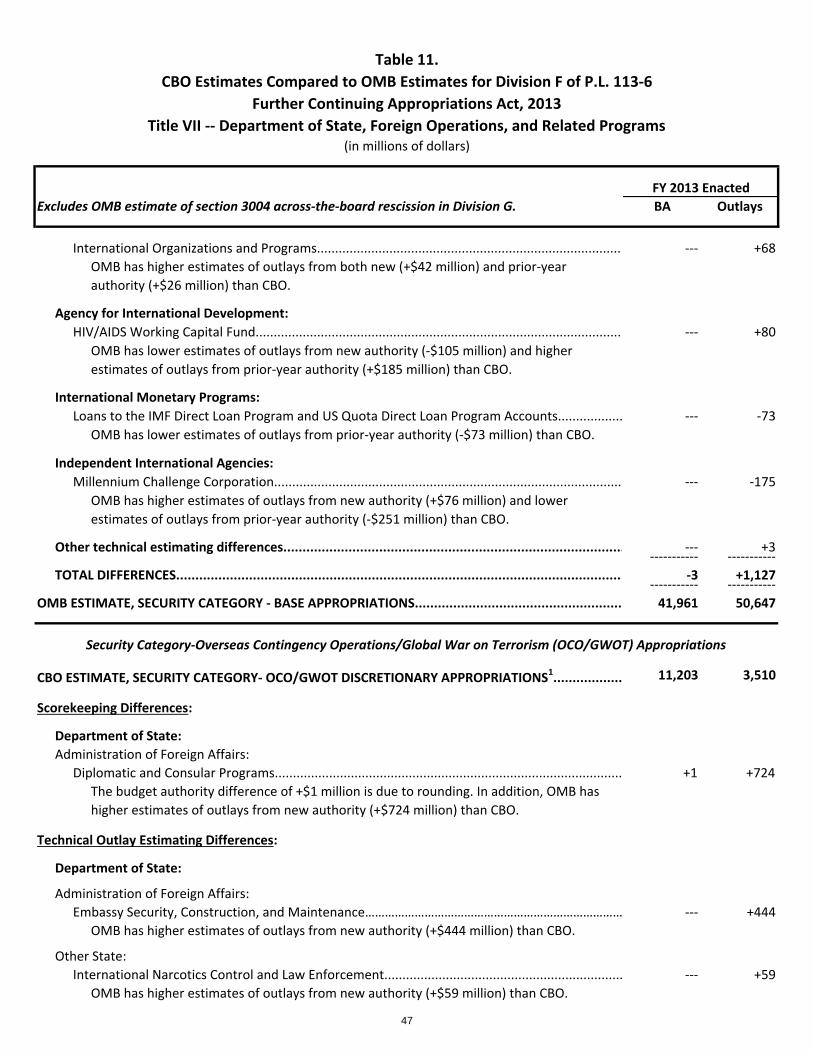
Table 11.
CBO Estimates Compared to OMB Estimates for Division F of P.L. 113‐6
Further Continuing Appropriations Act, 2013
Title VII ‐‐ Department of State, Foreign Operations, and Related Programs(in millions of dollars)
FY 2013 Enacted
Excludes OMB estimate of section 3004 across‐the‐board rescission in Division G. BA Outlays
International Organizations and Programs..................................................................................... ‐‐‐ +68
OMB has higher estimates of outlays from both new (+$42 million) and prior‐year
authority (+$26 million) than CBO.
Agency for International Development:
HIV/AIDS Working Capital Fund..................................................................................................... ‐‐‐ +80
OMB has lower estimates of outlays from new authority (‐$105 million) and higher
estimates of outlays from prior‐year authority (+$185 million) than CBO.
International Monetary Programs:
Loans to the IMF Direct Loan Program and US Quota Direct Loan Program Accounts.................. ‐‐‐ ‐73
OMB has lower estimates of outlays from prior‐year authority (‐$73 million) than CBO.
Independent International Agencies:
Millennium Challenge Corporation................................................................................................ ‐‐‐ ‐175
OMB has higher estimates of outlays from new authority (+$76 million) and lower
estimates of outlays from prior‐year authority (‐$251 million) than CBO.
Other technical estimating differences......................................................................................... ‐‐‐ +3‐‐‐‐‐‐‐‐‐‐‐ ‐‐‐‐‐‐‐‐‐‐‐
TOTAL DIFFERENCES..................................................................................................................... ‐3 +1,127‐‐‐‐‐‐‐‐‐‐‐ ‐‐‐‐‐‐‐‐‐‐‐
OMB ESTIMATE, SECURITY CATEGORY ‐ BASE APPROPRIATIONS...................................................... 41,961 50,647
CBO ESTIMATE, SECURITY CATEGORY‐ OCO/GWOT DISCRETIONARY APPROPRIATIONS1.................. 11,203 3,510
Scorekeeping Differences:
Department of State:
Administration of Foreign Affairs:
Diplomatic and Consular Programs................................................................................................ +1 +724
The budget authority difference of +$1 million is due to rounding. In addition, OMB has
higher estimates of outlays from new authority (+$724 million) than CBO.
Technical Outlay Estimating Differences:
Department of State:
Administration of Foreign Affairs:
Embassy Security, Construction, and Maintenance…………………………………………………………………… ‐‐‐ +444
OMB has higher estimates of outlays from new authority (+$444 million) than CBO.
Other State:
International Narcotics Control and Law Enforcement.................................................................. ‐‐‐ +59
OMB has higher estimates of outlays from new authority (+$59 million) than CBO.
Security Category‐Overseas Contingency Operations/Global War on Terrorism (OCO/GWOT) Appropriations
47
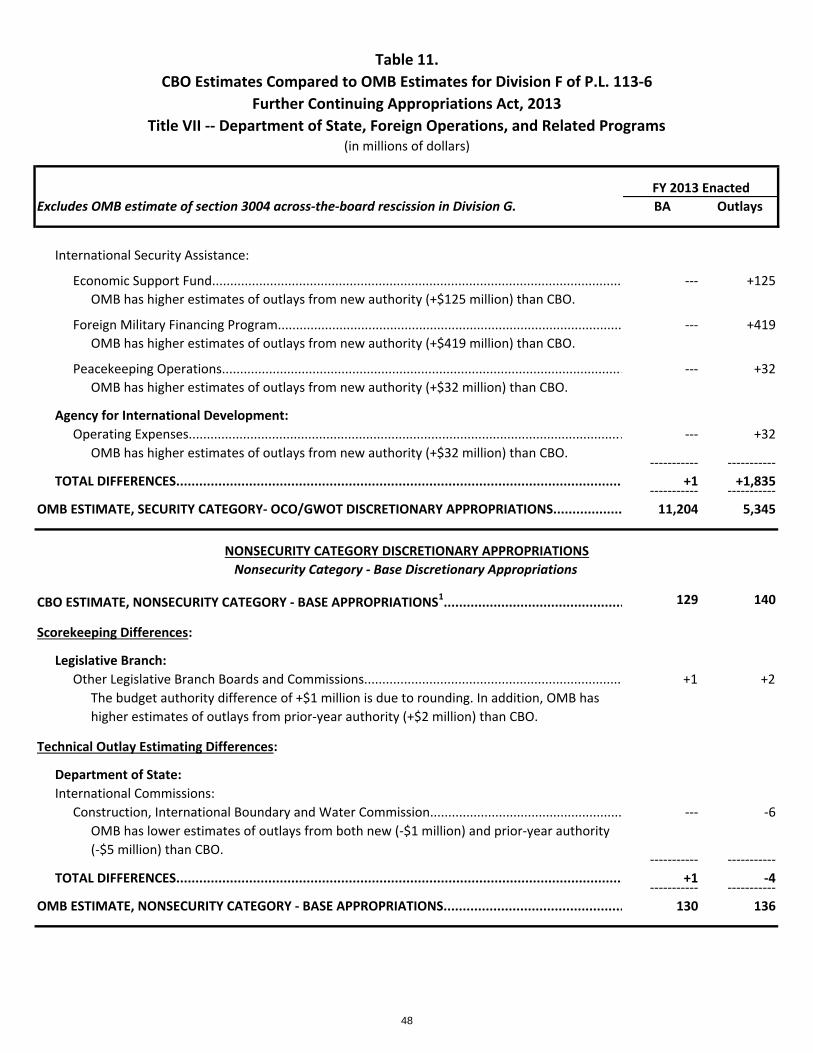
Table 11.
CBO Estimates Compared to OMB Estimates for Division F of P.L. 113‐6
Further Continuing Appropriations Act, 2013
Title VII ‐‐ Department of State, Foreign Operations, and Related Programs(in millions of dollars)
FY 2013 Enacted
Excludes OMB estimate of section 3004 across‐the‐board rescission in Division G. BA Outlays
International Security Assistance:
Economic Support Fund................................................................................................................. ‐‐‐ +125
OMB has higher estimates of outlays from new authority (+$125 million) than CBO.
Foreign Military Financing Program............................................................................................... ‐‐‐ +419
OMB has higher estimates of outlays from new authority (+$419 million) than CBO.
Peacekeeping Operations............................................................................................................... ‐‐‐ +32
OMB has higher estimates of outlays from new authority (+$32 million) than CBO.
Agency for International Development:
Operating Expenses........................................................................................................................ ‐‐‐ +32
OMB has higher estimates of outlays from new authority (+$32 million) than CBO.‐‐‐‐‐‐‐‐‐‐‐ ‐‐‐‐‐‐‐‐‐‐‐
TOTAL DIFFERENCES..................................................................................................................... +1 +1,835‐‐‐‐‐‐‐‐‐‐‐ ‐‐‐‐‐‐‐‐‐‐‐
OMB ESTIMATE, SECURITY CATEGORY‐ OCO/GWOT DISCRETIONARY APPROPRIATIONS.................. 11,204 5,345
NONSECURITY CATEGORY DISCRETIONARY APPROPRIATIONS
Nonsecurity Category ‐ Base Discretionary Appropriations
CBO ESTIMATE, NONSECURITY CATEGORY ‐ BASE APPROPRIATIONS1............................................... 129 140
Scorekeeping Differences:
Legislative Branch:
Other Legislative Branch Boards and Commissions....................................................................... +1 +2
The budget authority difference of +$1 million is due to rounding. In addition, OMB has
higher estimates of outlays from prior‐year authority (+$2 million) than CBO.
Technical Outlay Estimating Differences:
Department of State:
International Commissions:
Construction, International Boundary and Water Commission..................................................... ‐‐‐ ‐6
OMB has lower estimates of outlays from both new (‐$1 million) and prior‐year authority
(‐$5 million) than CBO.‐‐‐‐‐‐‐‐‐‐‐ ‐‐‐‐‐‐‐‐‐‐‐
TOTAL DIFFERENCES..................................................................................................................... +1 ‐4‐‐‐‐‐‐‐‐‐‐‐ ‐‐‐‐‐‐‐‐‐‐‐
OMB ESTIMATE, NONSECURITY CATEGORY ‐ BASE APPROPRIATIONS............................................... 130 136
48
Table 11.
CBO Estimates Compared to OMB Estimates for Division F of P.L. 113‐6
Further Continuing Appropriations Act, 2013
Title VII ‐‐ Department of State, Foreign Operations, and Related Programs(in millions of dollars)
FY 2013 Enacted
Excludes OMB estimate of section 3004 across‐the‐board rescission in Division G. BA Outlays
CBO TOTAL, STATE AND FOREIGN OPERATIONS APPROPRIATIONS1……………………….……………..………… 53,296 53,170
CBO Security Category Subtotal......................................................................................................................... 41,964 49,520CBO OCO/GWOT Security Subtotal.................................................................................................................... 11,203 3,510CBO Nonsecurity Category Subtotal.................................................................................................................. 129 140
TOTAL DIFFERENCES......................................................................................................................... ‐1 +2,958Security Category Differences............................................................................................................................ ‐3 +1,127OCO/GWOT Security Subtotal............................................................................................................................ +1 +1,835Nonsecurity Category Differences...................................................................................................................... +1 ‐4
OMB TOTAL, STATE AND FOREIGN OPERATIONS APPROPRIATIONS…………...…………………………………… 53,295 56,128OMB Security Category Subtotal........................................................................................................................ 41,961 50,647OMB OCO/GWOT Security Subtotal................................................................................................................... 11,204 5,345OMB Nonsecurity Category Subtotal................................................................................................................. 130 136
1 CBO data received by OMB on March 20th, 2013.
SUMMARY
49

Table 12.
CBO Estimates Compared to OMB Estimates for Division F of P.L. 113‐6
Further Continuing Appropriations Act, 2013
Title VIII ‐‐ Transportation, Housing and Urban Development, and Related Agencies(in millions of dollars)
FY 2013 Enacted
Excludes OMB estimate of section 3004 across‐the‐board rescission in Division G. BA/Oblim. Outlays
Nonsecurity Category‐Base Discretionary Appropriations
CBO ESTIMATE, TRANSPORTATION AND HUD BASE APPROPRIATIONS1............................................ 104,576 114,914
Scorekeeping Differences:
Department of Transportation:
Federal Highway Administration:
Federal‐Aid Highways (Obligation Limitation)................................................................................ +1,000 +180
CBO scores $1,000 million of obligation limitations as "flexed" from this account to the
Transit Formula Grants account based on Transportation's transfer authority. OMB does
not score this "flexing" of obligation limitation to the appropriations bills. In addition, OMB
has higher estimates of outlays from new authority (+$1,014 million) and lower estimates
of outlays from prior‐year authority (‐$834 million) than CBO.
Federal Transit Administration:
Transit Formula Grants (Obligation Limitation).............................................................................. ‐1,000 +416
See "Federal‐Aid Highway" explanation above for obligation limitation difference. In
addition, OMB has lower estimates of outlays from new authority (‐$474 million) and
higher estimates of outlays from prior‐year authority (+$890 million) than CBO.
Department of Housing and Urban Development:
Government National Mortgage Association...................................................................................... +134 +132
CBO estimates negative subsidy receipts of ‐$647 million, net offsetting collections from
fees not included in the subsidy rate of ‐$80 million, as well as ‐$23 million in savings for
removing the cap on Home Equity Conversion Mortgage (HECM) loans, resulting in a total
estimate of ‐$750 million. In contrast, OMB estimates negative subsidy receipts of ‐$550
million, including savings from removing the HECM cap, and net offsetting collections from
fees not included in the subsidy rate of ‐$66 million, resulting in a total of ‐$616 million in
receipts. The result is OMB having estimates that are +$134 million higher than CBO,
which affects both budget authority and outlays from new authority. In addition, OMB
has lower estimates of outlays from new authority for the spending of the offsetting
collections (‐$2 million) than CBO.
50

Table 12.
CBO Estimates Compared to OMB Estimates for Division F of P.L. 113‐6
Further Continuing Appropriations Act, 2013
Title VIII ‐‐ Transportation, Housing and Urban Development, and Related Agencies(in millions of dollars)
FY 2013 Enacted
Excludes OMB estimate of section 3004 across‐the‐board rescission in Division G. BA/Oblim. Outlays
Housing Programs:
Mutual Mortgage Insurance Capital Reserve................................................................................. +764 +764
CBO scores ‐$9,846 million in current law negative subsidy receipts, whereas OMB scores
receipts of ‐$9,082 million. OMB's estimate includes a net increase of ‐$894 million in
HUD receipts that are due to mortgage insurance premium changes implemented in April
and June of 2012. This change is not due to a technical reestimate but rather
administrative policy changes implemented after the FY 2013 Budget was transmitted.
OMB used the FY 2013 Mid‐Session Review process to validate the effect of these
changes. CBO had already included its estimate for these changes in its ‐$9,846 million
level of negative subsidy receipts based on the Administration’s announcement it would
implement these premium changes in February of 2012. In addition, CBO's estimate of
volume is much higher ($227 billion compared to OMB's estimate of $149 billion), which
more than offsets CBO's less favorable subsidy rate (‐4.25% compared to ‐5.98% for OMB's
rate). CBO economic assumptions and their assumption about FHA market share drive the
difference in volume from OMB. These different estimates combined lead to the entire
difference affecting both budget authority and outlays from new authority (+$764
million).
Fair Housing Activities.................................................................................................................... ‐1 +1
The budget authority difference of ‐$1 million is due to rounding. In addition, OMB has
higher estimates of outlays from new authority (+$7 million) and lower estimates of
outlays from prior‐year authority (‐$6 million) than CBO.
Technical Outlay Estimating Differences:
Department of Transportation:
Federal Aviation Administration:
Trust Fund Share of FAA Activities................................................................................................. ‐‐‐ +152
OMB has higher estimates of outlays from new authority (+$557 million) and lower
estimates of outlays from prior‐year authority (‐$405 million) than CBO.
Facilities and Equipment................................................................................................................ ‐‐‐ +240
OMB has lower estimates of outlays from new authority (‐$89 million) and higher
estimates of outlays from prior‐year authority (+$329 million) than CBO.
Grants‐in‐Aid for Airports............................................................................................................... ‐‐‐ +379
OMB has lower estimates of outlays from new authority (‐$40 million) and higher
estimates of outlays from prior‐year authority (+$419 million) than CBO.
National Highway Traffic Safety Administration
Highway Traffic Safety Grants........................................................................................................ ‐‐‐ +93
OMB has higher estimates of outlays from prior‐year authority (+$93 million) than CBO.
51

Table 12.
CBO Estimates Compared to OMB Estimates for Division F of P.L. 113‐6
Further Continuing Appropriations Act, 2013
Title VIII ‐‐ Transportation, Housing and Urban Development, and Related Agencies(in millions of dollars)
FY 2013 Enacted
Excludes OMB estimate of section 3004 across‐the‐board rescission in Division G. BA/Oblim. Outlays
Federal Highway Administration:
Emergency Relief Program............................................................................................................. ‐‐‐ +139
OMB has higher estimates of outlays from prior‐year authority (+$139 million) than CBO.
Federal Railroad Administration:
Capital Assistance for High Speed Rail Corridors............................................................................ ‐‐‐ +970
OMB has higher estimates from prior‐year authority (+$970 million) than CBO.
Transit Capital Assistance, Recovery Act....................................................................................... ‐‐‐ +204
OMB has higher estimates from prior‐year authority (+$204 million) than CBO.
Department of Housing and Urban Development:
Public and Indian Housing Programs:
Project‐Based Rental Assistance..................................................................................................... ‐‐‐ +225
OMB has lower estimates of outlays from new authority (‐$202 million) and higher
estimates of outlays from prior‐year authority (+$427 million) than CBO.
Public Housing Capital Fund........................................................................................................... ‐‐‐ +169
OMB has higher estimates of outlays from prior‐year authority (+$169 million) than CBO.
Housing for the Elderly................................................................................................................... ‐‐‐ +196
OMB has higher estimates of outlays from both new (+$76 million) and prior‐year
authority (+$120 million) than CBO.
Community Planning and Development:
Community Development Fund..................................................................................................... ‐‐‐ ‐409
OMB has higher estimates of outlays from new authority (+$6 million) and lower
estimates of outlays from prior‐year authority (‐$415 million) than CBO.
Homeless Assistance Grants........................................................................................................... ‐‐‐ +179
OMB has lower estimates of outlays from new authority (‐$9 million) and higher estimates
of outlays from prior‐year authority (+$188 million) than CBO.
Other technical estimating differences......................................................................................... ‐‐‐ +798‐‐‐‐‐‐‐‐‐‐‐ ‐‐‐‐‐‐‐‐‐‐‐
TOTAL DIFFERENCES..................................................................................................................... +897 +4,828‐‐‐‐‐‐‐‐‐‐‐ ‐‐‐‐‐‐‐‐‐‐‐
OMB ESTIMATE, TRANSPORTATION AND HUD BASE APPROPRIATIONS............................................ 105,473 119,742
52

Table 12.
CBO Estimates Compared to OMB Estimates for Division F of P.L. 113‐6
Further Continuing Appropriations Act, 2013
Title VIII ‐‐ Transportation, Housing and Urban Development, and Related Agencies(in millions of dollars)
FY 2013 Enacted
Excludes OMB estimate of section 3004 across‐the‐board rescission in Division G. BA/Oblim. Outlays
SUMMARY
CBO TOTAL, TRANSPORTATION AND HOUSING AND URBAN DEVELOPMENT APPROPRIATIONS1...... 104,576 114,914
CBO Security Category Subtotal........................................................................................................... ‐‐‐ ‐‐‐
CBO Nonsecurity Category Subtotal (Budget Authority)..................................................................... 51,817 114,914
CBO Nonsecurity Category Subtotal (Obligation Limitations)............................................................. 52,759
TOTAL DIFFERENCES......................................................................................................................... +897 +4,828
Security Category Differences.............................................................................................................. ‐‐‐ ‐‐‐
Nonsecurity Category Differences (Budget Authority)......................................................................... +897 +4,828
Nonsecurity Category Differences (Obligation Limitations)................................................................. ‐‐‐
OMB TOTAL, TRANSPORTATION AND HOUSING AND URBAN DEVELOPMENT APPROPRIATIONS...... 105,473 119,742
OMB Security Category Subtotal......................................................................................................... ‐‐‐ ‐‐‐
OMB Nonsecurity Category Subtotal (Budget Authority).................................................................... 52,714 119,742
OMB Nonsecurity Category Subtotal (Obligation Limitations)............................................................ 52,759
1 CBO data received by OMB on March 20th, 2013.
53

Table 13.
OMB Estimates for Section 3004 of Division G of P.L. 113‐6
Consolidated and Further Continuing Appropriations Act, 2013(in millions of dollars)
BA Outlays
OMB ESTIMATE, SECURITY RESCISSIONS PURSUANT TO SECTION 3004 OF DIVISION G..................... ‐219 ‐139
By Appropriations Subcommittee:Agriculture and Rural Development Appropriations................................................................. ‐1 ‐1
Defense Appropriations............................................................................................................ ‐164 ‐103Energy and Water Appropriations............................................................................................ ‐4 ‐3
Homeland Security Appropriations........................................................................................... ‐13 ‐9
Military Construction and Veterans Affairs Appropriations....................................................... ‐23 ‐16
State and Foreign Operations Appropriations.......................................................................... ‐14 ‐7
OMB ESTIMATE, NONSECURITY RESCISSIONS PURSUANT TO SECTION 3004 OF DIVISION G.............. ‐876 ‐500
By Appropriations Subcommittee:Agriculture and Rural Development Appropriations................................................................. ‐40 ‐30Commerce, Justice, and Science Appropriations..................................................................... ‐120 ‐79Energy and Water Appropriations............................................................................................ ‐43 ‐28Financial Services and General Government Appropriations................................................... ‐47 ‐42Interior and Environment Appropriations.................................................................................. ‐59 ‐39Labor, Health and Human Services, and Education Appropriations........................................ ‐325 ‐143Legislative Branch Appropriations............................................................................................ ‐9 ‐8
Military Construction and Veterans Affairs Appropriations....................................................... ‐1 ‐1Transportation and Housing and Urban Development Appropriations..................................... ‐232 ‐130
NONSECURITY CATEGORY DISCRETIONARY APPROPRIATIONS
Nonsecurity Category‐Base Discretionary Appropriations
Section 3004 Division G Across‐the‐Board Rescissions. Section 3004 in Division G of P.L. 113‐6 requires
OMB to calculate across‐the‐board rescissions to eliminate the amount by which the new budget authority
provided in appropriations Acts for fiscal year 2013 exceeds the security and nonsecurity discretionary
spending limits due to estimating differences between CBO and OMB. This directive ensures that no
budget‐year breach within either category will occur and that a sequestration of discretionary budget
authority will not be required. OMB calculated that an across‐the‐board rescission 0.032 percent was
necessary to all security programs and that an across‐the‐board rescission of 0.200 percent was necessary
to all nonsecurity programs. Since the section 3004 rescissions affect only OMB scoring, the combined
OMB estimates are compiled on this table instead of in the separate bridge tables of this report.
FY 2013 Enacted
SECURITY CATEGORY DISCRETIONARY APPROPRIATIONS
Security Category‐Base Discretionary Appropriations
54

Table 14.
Enacted Appropriations as of April 4, 2013 (in millions of dollars)
FY 2013
BA Outlays
SECURITY CATEGORY
Discretionary Spending Limit1......................................................................................................... 684,000 N/A
Appropriations previously enacted................................................................................................ ‐‐‐ ‐‐‐
Newly Enacted Base Security Appropriations:2
Amount provided in Division A of P.L. 113‐6, Agriculture, Rural Development, Food and Drug Administration, and Related Agencies Appropriations Act, 2013............................ 1,616 1,656
Amount provided in Division B of P.L. 113‐6, Commerce, Justice, Science and Related Agencies Appropriations Act, 2013............................................................................ 81 81
Amount provided in Division C of P.L. 113‐6, Department of Defense Appropriations Act, 2013......................................................................................................... 517,449 588,879
Amount provided in Division D of P.L. 113‐6, Homeland Security Appropriations Act, 2013.................................................................................................................................. 39,834 50,218
Amount provided in Division E of P.L. 113‐6, Military Construction and Veterans Affairs and Related Agencies Appropriations Act, 2013.......................................................... 71,565 81,766
Amounts provided in Division F of P.L. 113‐6, Further Continuing Appropriations Act, 2013:
Title II of Division F, Energy and Water Development............................................................. 11,497 11,889
Title VI of Division F, Legislative Branch.................................................................................. 8 9
Title VII of Division F, Department of State, Foreign Operations and Related Programs................................................................................................................. 41,947 50,640
‐‐‐‐‐‐‐‐‐ ‐‐‐‐‐‐‐‐‐Total, All Enacted Security Appropriations..................................................................................... 683,997 785,138
Security Appropriations Over (+)/Under (‐) spending limit............................................................ ‐3 N/A
NONSECURITY CATEGORY
Discretionary Spending Limit1......................................................................................................... 359,000 N/A
Appropriations previously enacted3............................................................................................... 3,459 171
Newly Enacted Base Nonsecurity Appropriations:2
Amount provided in Division A of P.L. 113‐6, Agriculture, Rural Development, Food and Drug Administration, and Related Agencies Appropriations Act, 2013............................ 18,783 22,049
Amount provided in Division B of P.L. 113‐6, Commerce, Justice, Science and Related Agencies Appropriations Act, 2013............................................................................ 50,076 58,072
Amount provided in Division E of P.L. 113‐6, Military Construction and Veterans Affairs and Related Agencies Appropriations Act, 2013.......................................................... 338 288
55

Table 14.
Enacted Appropriations as of April 4, 2013 (in millions of dollars)
FY 2013
BA Outlays
Amounts provided in Division F of P.L. 113‐6, Further Continuing Appropriations Act, 2013:
Title II of Division F, Energy and Water Development............................................................. 21,724 33,177
Title III of Division F, Financial Services and General Government ......................................... 21,418 24,343
Title IV of Division F, Interior, Environment, and Related Agencies........................................ 29,770 31,803
Title V of Division F, Labor, Health and Human Services, Education, and Related Agencies........................................................................................................... 156,551 165,783
Title VI of Division F, Legislative Branch.................................................................................. 4,268 4,327
Title VII of Division F, Department of State, Foreign Operations and Related Programs................................................................................................................. 130 136
Title VIII of Division F, Transportation and Housing and Urban Development, and Related Agencies.................................................................................................................. 52,482 119,612
‐‐‐‐‐‐‐‐‐ ‐‐‐‐‐‐‐‐‐Total, All Enacted Nonsecurity Appropriations............................................................................... 358,999 459,761
Nonsecurity Appropriations Over (+)/Under (‐) spending limit...................................................... ‐1 N/A
TOTAL DISCRETIONARY APPROPRIATIONS
Discretionary Spending Limits........................................................................................................ 1,043,000 N/A
Appropriations previously enacted3............................................................................................... 3,459 171
Newly Enacted Base Appropriations:2
Amount provided in Division A of P.L. 113‐6, Agriculture, Rural Development, Food and Drug Administration, and Related Agencies Appropriations Act, 2013............................ 20,399 23,705
Amount provided in Division B of P.L. 113‐6, Commerce, Justice, Science and Related Agencies Appropriations Act, 2013............................................................................ 50,157 58,153
Amount provided in Division C of P.L. 113‐6, Department of Defense Appropriations Act, 2013......................................................................................................... 517,449 588,879
Amount provided in Division D of P.L. 113‐6, Homeland Security Appropriations Act, 2013.................................................................................................................................. 39,834 50,218
Amount provided in Division E of P.L. 113‐6, Military Construction and Veterans Affairs and Related Agencies Appropriations Act, 2013.......................................................... 71,903 82,054
Amounts provided in Division F of P.L. 113‐6, Further Continuing Appropriations Act, 2013:
Title II of Division F, Energy and Water Development............................................................. 33,221 45,066
56
Table 14.
Enacted Appropriations as of April 4, 2013 (in millions of dollars)
FY 2013
BA Outlays
Title III of Division F, Financial Services and General Government ......................................... 21,418 24,343
Title IV of Division F, Interior, Environment, and Related Agencies........................................ 29,770 31,803
Title V of Division F, Labor, Health and Human Services, Education, and Related Agencies........................................................................................................... 156,551 165,783
Title VI of Division F, Legislative Branch.................................................................................. 4,276 4,336
Title VII of Division F, Department of State, Foreign Operations and Related Programs................................................................................................................. 42,077 50,776
Title VIII of Division F, Transportation and Housing and Urban Development, and Related Agencies.................................................................................................................. 52,482 119,612
‐‐‐‐‐‐‐‐‐ ‐‐‐‐‐‐‐‐‐Total, All Enacted Discretionary Appropriations............................................................................. 1,042,996 1,244,899
Discretionary Appropriations Over (+)/Under (‐) spending limits.................................................. ‐4 N/A
Amount provided in Division C of P.L. 113‐6, Department of Defense Appropriations Act, 2013............................................................................................................. 87,224 56,036
Amount provided in Division D of P.L. 113‐6, Homeland Security Appropriations Act, 2013..................................................................................................................................... 254 203
Amount provided in Division E of P.L. 113‐6, Military Construction and Veterans Affairs and Related Agencies Appropriations Act, 2013 (net zero due to rescissions)................. ‐‐‐ ‐‐‐
Amount provided in Division F of P.L. 113‐6, Further Continuing Appropriations Act, 2013 Title VII, Department of State, Foreign Operations, and Related Programs............................... 11,204 5,345
‐‐‐‐‐‐‐‐‐ ‐‐‐‐‐‐‐‐‐Total, Security Appropriations for Overseas Contingency Operations/Global War on Terrorism... 98,682 61,584
Nonsecurity Appropriations designated by the Congress for Program Integrity5
Amount provided in Division F of P.L. 113‐6, Further Continuing Appropriations Act, 2013 Title V, Labor, Health and Human Services, Education, and Related Agencies........................... 483 483
Security Appropriations designated by the Congress for Disaster Relief6
Amount provided in Division D of P.L. 113‐6, Homeland Security Appropriations Act, 2013..................................................................................................................................... 6,400 5,120
Security Appropriations designated by the Congress and the President for Overseas Contingency Operations/Global War
on Terrorism4
57
Table 14.
Enacted Appropriations as of April 4, 2013 (in millions of dollars)
FY 2013
BA Outlays
Notes:
6 Section 251(b)(2)(D) of the Balanced Budget and Emergency Deficit Control Act of 1985, as amended, authorizes an adjustment to the caps for
appropriations that are designated by the Congress as being for disaster relief. The Consolidated and Further Continuing Appropriations Act, 2013
(P.L. 113‐6) included funding for these activities with the appropriate designation. These amounts are summarized here and are not included in the
totals displayed above that are counted against the caps. The adjustments to the discretionary limits to reflect this spending are not included in this
report but will be included in the Final Sequestration Report for 2013.
2 All of the amounts below are adjusted where appropriate to include the across‐the‐board rescissions in sections 3001 and 3004 in Division G of P.L.
113‐6.
1 The FY 2013 spending limits for the base security and nonsecurity categories are equal to the limits enacted in Title IX of P.L. 112‐240, the American
Taxpayer Relief Act of 2012 (ATRA).
3 See OMB's report on the previously enacted Disaster Relief Appropriations Act, 2013 (P.L. 113‐2) which was released on February 7, 2013 (see
http://www.whitehouse.gov/omb/legislative_reports/BEA_reports).
4 Section 251(b)(2)(A) of the Balanced Budget and Emergency Deficit Control Act of 1985, as amended, authorizes an adjustment to the caps for
appropriations that are designated by the Congress, and subsequently designated by the President, as emergency requirements or for Overseas
Contingency Operations/Global War on Terrorism. The Consolidated and Further Continuing Appropriations Act, 2013 (P.L. 113‐6) included funding
for these activities with the appropriate designation and the President transmitted to the Congress on March 26, 2013 his subsequent designation of
all of these amounts. These amounts are summarized here and are not included in the totals displayed above that are counted against the caps. The
adjustments to the discretionary limits to reflect this spending are not included in this report but will be included in the Final Sequestration Report for
2013.
5 Section 251(b)(2)(B) of the Balanced Budget and Emergency Deficit Control Act of 1985, as amended, authorizes an adjustment to the caps for
appropriations that are designated by the Congress as being for Social Security Administration Continuing Disability Reviews and Redeterminations.
The Consolidated and Further Continuing Appropriations Act, 2013 (P.L. 113‐6) included funding for these activities with the appropriate designation.
These amounts are summarized here and are not included in the totals displayed above that are counted against the caps. The adjustments to the
discretionary limits to reflect this spending are not included in this report but will be included in the Final Sequestration Report for 2013.
58


![CIVL446 - Report - April4 [Ready for Printing].pdf](https://img.pdfslide.net/doc/110x75/577cd7081a28ab9e789de13b/civl446-report-april4-ready-for-printingpdf.jpg)