Embed Size (px)
Citation preview
Department of Health and Human Services
OFFICE OFNSPECTOR GENERAL
AMBUIANCE SERVICES FORMEDICARE END-STAGE RENAL
DISEASE BENEFICIARIES:
PAYMENT PRACTICES
MARCH 1994
OFFICE OF INSPECTOR GENERAL
The mission of the Office of Inspector General (OIG), as mandated by Public Law 95-452, as amended, is to protect the integrity of the Department of Health and Human Services’ (HHS) programs as well as the health and welfare of beneficiaries served by those programs. This statutory mission is carried out through a nationwide network of audits, investigations, and inspections conducted by three OIG operating components: the Office of Audit Services, the Office of Investigations, and the Office of Evaluation and Inspections. The OIG also informs the Secretary of HHS of program and management problems and recommends courses to correct them.
OFFICE OF AUDIT SERVICES
The OIG’S Office of Audit Semites (OAS) provides all auditing services for HHS, either by conducting audits with its own audit resources or by overseeing audit work done by others. Audits examine the performance of HHS programs and/or its grantees and contractors in carrying out their respective responsibilities and are intended to provide independent assessments of HHS programs and operations in order to reduce waste, abuse, and mismanagement and to promote economy and efficiency throughout the Department.
OFFICE OF INVESTIGATIONS
The OIGS Office of Investigations (01) conducts criminal, civil, and administrative investigations of allegations of wrongdoing in HHS programs or to HHS beneficiaries and of unjust enrichment by providers. The investigative efforts of 01 lead to criminal convictions, administrative sanctions, or civil money penalties. The 01 also oversees State Medicaid fraud control units which investigate and prosecute fraud and patient abuse in the Medicaid program.
OFFICE OF EVALUATION AND INSPECI’IONS
The OIGS Office of Evaluation and Inspections (OEI) conducts short-term management andprogram evaluations (called inspections) that focus on issues of concern to the Department,the Congress, and the public. The findings and recommendations contained in these inspectionreports generate rapid, accurate, and up-to-date information on the efficiency, vulnerability,and effectiveness of departmental programs.
This report was prepared in the Philadelphia regional office under the direction of Joy Quill,Regional Inspector General and Robert A Vito, Deputy Regional Inspector General. Projectstaftl
Isabelle Buonocore, Project Leader Wm. Mark Krushat, MPH, SCDNancy J. Molyneaux, Lead Analyst Brian RitchieAhalya Nava, Intern Hugh Hetzer
For additional copies of this report, please contact the Philadelphia regional office at (215)596-0606.
Department of Health and Human Services
OFFICE OF INSPECTOR GENERAL
AMBULANCE SERVICES FORMEDICARE END-STAGE RENAL
DISESE BENEFICIARIES:
PAYMENT PRACTICES
MARCH 1994 OEI-03-90-02131!
EXECUTIVE SUMMARY
PURPOSE
This report describes growth in Medicare expenditures for Part B ambulance services for persons with end-stage renal disease (ESRD) and problems with the coding and payments systems for this semice.
BACKGROUND
Persons with ESRDare entitled to Medicare coverage under 1972 amendments to the Social Security Act. In 1991, there were 193,883 ESRD beneficiaries with Medicare Part B claims.
Medicare Part B covers ambulance semices under certain conditions. Ambulance transport must be reasonable and medically necessary. Other coverage requirements are that the vehicle and crew meet certain criteria and the ambulance trip be within distance and destination limits.
Some ESRD beneficiaries need ambulance transport to hospital-based facilities for dialysis therapy. Generally, ESRD patients require dialysis three times a week. Both the dialysis treatment and ambulance transport are scheduled in advance.
In 1991, Part B claims representing $101 million in total ambulance allowances for ESRD beneficiaries were handled by insurance carriers under contract with the Health Care Financing Administration (HCFA). Ambulance company services and charges are represented by alphanumeric codes which the Medicare program uses to analyze utilization and payments.
We reviewed 1991 and 1988 Part B claims data for ESRD beneficiaries in HCFA’S databases and interviewed carriers regarding coding and payment issues. We reviewed ambulance studies conducted within the Department between 1986 and 1993. We also performed probability tests to determine future Medicare expenses for ESRD beneficiaries needing scheduled ambulance transport, and we estimated potential savings on scheduled transports. A future report will address coverage issues.
FINDINGS
Less than 2 percent of ESRD benejiciati accounted for 75 pement ($76 millwn) of total ESRD ambulance allbwanizs.
While total ESRD arnbukmce allowances more than doubkd from 1988 to 1991, cetia~ utiuah”on patk?rns remained the same.
can be identi! prospective~.High volume users
Cam-en do not use ambulance codes unijorndy.
l%e payment system does not take into account the row predictable nature of scheduled ambuhmce transport.
� Ambulance payments are based on an outmoded payment system.
� The payment system does not take advantage of the lower costs associated with high-volume scheduled transports.
RECOMMENDATIONS
We believe coding changes will result in greater accuracy in monitoring and analysis of Medicare-covered ambulance services. Therefore, we recommend that HCFA:
. Establish a code for scheduled transports.
� Require uniform use of national ambulance codes.
We also offer optional strategies to ensure fairer payment for services rendered.While these options may require legislation and start-up costs, implementation of oneor more options could result in $11.4 to $34.1 million in savings annually ($57 to $170million over a 5-year period) as shown in Appendix E. The HCFA may considercombining two or more of the following strategies and establishing demonstrationprojects in particular geographic areas.
� Establish a payment schedule for ambulance transport to maintenance dialysis, and set the fee lower than what is paid for unscheduled, emergency transports.
� Negotiate preferred provider agreements with ambulance companies to provide scheduled transportation for ESRD beneficiaries.
� Undertake competitive bidding to establish a price for scheduled transports for ESRD beneficiaries or to select companies who agree to provide such services.
� Establish a rebate program for companies that routinely transport ESRD beneficiaries.
� Provide an add-on to the composite rate Medicare pays dialysis facilities to cover the cost of transportation for these beneficiaries, allowing the facility to negotiate agreements with ambulance companies rather than the program.
We are continuing our work to determine whether payments for 1991 Part B ambulance transportation for ESRD beneficiaries met Medicare coverage guidelines. Such information will also help HCFA in its continuing efforts to assess payment policies for this semice.
ii
COMMENTS
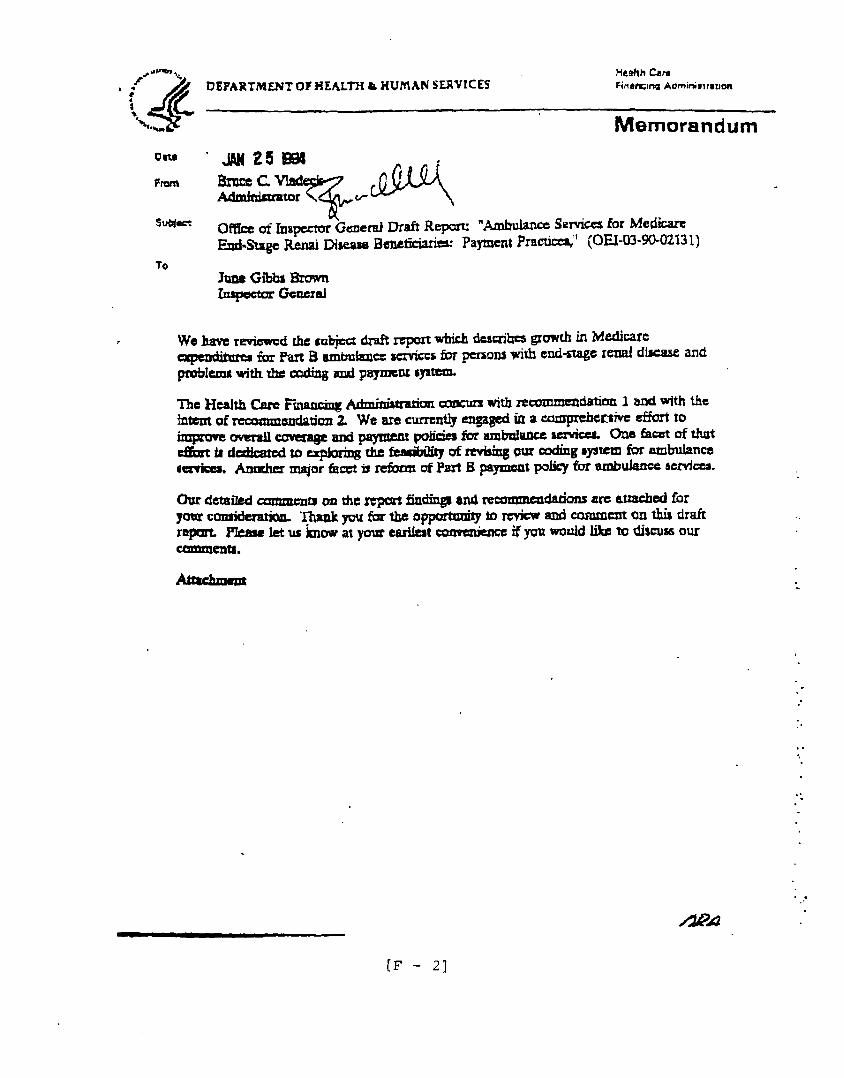
The HCFA commented on the draft of this report. They concur with our recommendation to make coding changes, and they concur with the intent of our recommendation to ensure fairer payment for services rendered. The HCFA is “exploring the feasibility of revising the coding system” and is “engaged in a comprehensive effort to improve overall coverage and payment policies... including those involving payment for non-emergency transport services.” The full text of this agency’s comments are in Appendix F.
... 111
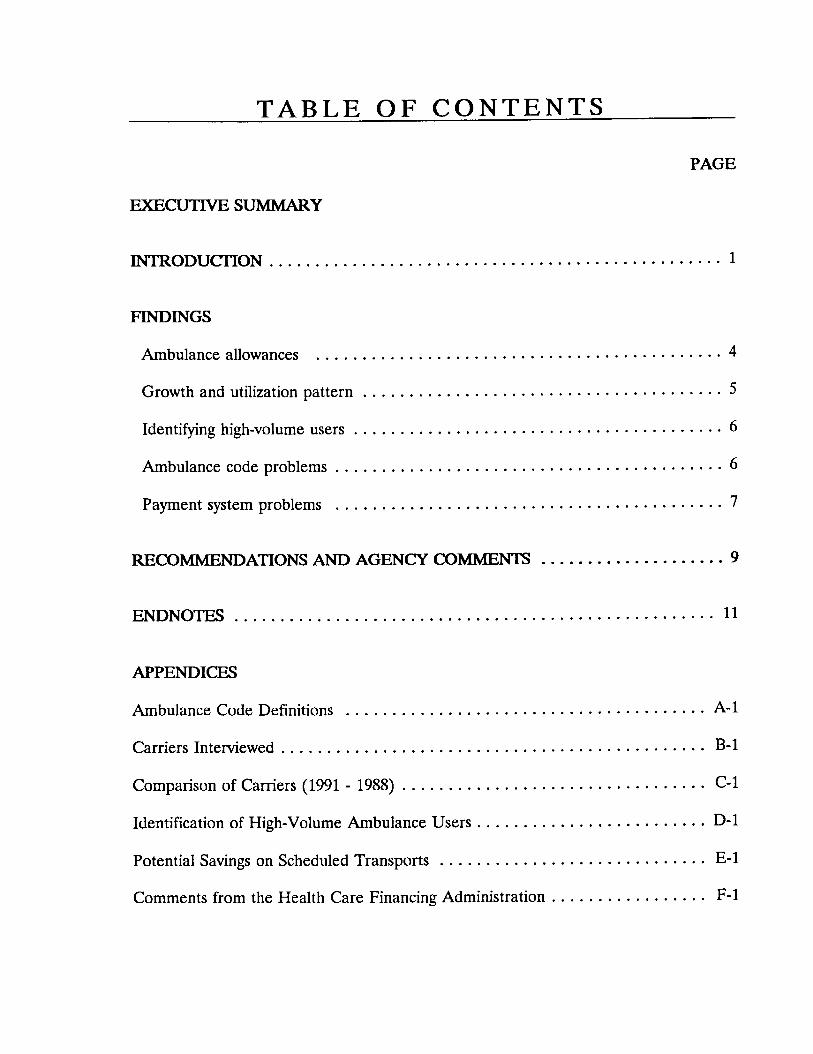
TABLE OF CONTENTS
EXECUTIVE SUMMARY
INTRODUCI’ION . . . . . . . . . . . . . . . . . . . . . . . . . . . . . . . . . . . . . . . . . . ..o. o*o1
FINDINGS
Ambulance allowances . . . . . . . . . . . . . . . . . . . . . . . . . . . . . . . . . . . . ..”o-””04
Growth and utilization pattern. . . . . . . . . . . . . . . . . . . . . . . . . . . . . . . . ..”” ”.”5
Identifying high-volume users.. . . . . . . . . . . . . . . . . . . . . . . . . . . . . . . . . . ..””.6
Ambulance code problems . . . . . . . . . . . . . . . . . . . . . . . . . . . . . . . . . . . . ..””*o6
Payment systemproblems . . . . . . . . . . . . . . . . . . . . . . . . . . . . . . . . . . . . . ..”””7
RECOMMENDATIONS AND AGENCY COMMENTS . . . . . . . . . . . . . . . . . ...9
ENDNOTES . . . . . . . . . . . . . . . . . . . . . . . . . . . . . . . . . . . . . . . . . . . . . . . . . ...11
APPENDICES
Ambulance Code Definitions . . . . . . . . . . . . . . . . . . . . . . . . . . . . . . . . . . . . . . . A-1
Carriers Interviewed . . . . . . . . . . . . . . . . . . . . . . . . . . . . . . . . . . . . . . . . . ...”” B-1
Comparison of Carriers (1991 - 1988).... . . . . . . . . . . . . . . . . . . . . . . . . . . . . . c-1
Identificationof High-Volume Ambulance Users . . . . . . . . . . . . . . . . . . . . . . . . . D-1
Potential Savings on Scheduled Transports . . . . . . . . . . . . . . . . . . . . . . . . . . . . . E-1
Comments from the Health Care Financimz Administration . . . . . . . . . . . . . . . . . F-1
INTRODUCTION
PURPOSE
This report describes growth in Medicare expenditures for for beneficiaries with end-stage renal disease (ESRD) and and payment systems for this service.
BACKGROUND
Part B ambulance sewices problems with the coding
Medicare coverage was extended to persons with ESRD under the 1972 amendments to the Social Security Act. Persons with ESRD require dialysis therapy at least three times a week, or a kidney transplant in order to sumive. There were 193,883 ESRD beneficiaries with Medicare Part B claims in 1991.
Under Medicare Part B, ambulance transports are a covered service. However, transports must be reasonable and medically necessary. Medical necessity is indicated when any means of transportation other than an ambulance would endanger the beneficiary’s health. Other coverage requirements are that the vehicle and crew meet certain criteria and the ambulance trip be within distance and destination limits.
In calendar year 1991, carriers processed Part B ambulance claims totaling $101 million in allowances for ESRD beneficiaries. Carriers are the insurance companies under contract with the Health Care Financing Administration (HCFA) to process and pay Medicare Part B claims.
While the Medicare reimbursement is 80 percent of the allowed payment for service rendered to the beneficiary, the carrier determines the payment allowance. The ambulance company providing the service receives 80 percent of the payment allowance from the carrier and the remaining 20 percent from the beneficiary.
An alphanumeric coding system is used by HCF~ carriers, and ambulance companies to represent the type of ambulance service provided. These codes explain what ambulance companies billed for and what services Medicare carriers paid for. Some codes are national and defined by HCFA under its health care procedure code system. Other codes are established and defined locally. (Currently, there is a movement away from the use of local codes.)
Codes signify several things. For example, certain ones signify mileage charges, while others signify a base charge for ambulance transport. The codes also indicate whether the level of service was basic life support (BLS) or advanced life support (AI-S), and whether the transport was an emergency or non-emergency. (See Appendix A for definitions of eight national ambulance codes.)
The HCFA is responsible for administration of the ESRD and Medicare programs. It maintains data on ESRD Program enrollees, Part B ambulance claims, and payment allowances at its headquarters. The HCFA regional offices monitor and evaluate the carrier’s handling of Part B claims.
This report is based on our on-going national study of ambulance transportation for ESRD beneficiaries. A future report will deal with whether 1991 Part B ambulance claims for ESRD beneficiaries met Medicare coverage requirements.
SCOPE AND METHODOLOGY
Our primary sources of information were HCFA’S Common Working File (CWF) and Part B Medicare Annual Data (B-MAD) file (which was replaced by the CWF after 1989), and structured interviews with carrier staff. We also reviewed ambulance studies conducted within the Department between 1986 and 1993, and met with HCFA staff and representatives of the American Ambulance Association (MA). The data was collected and analyzed between November 1992 and June 1993.
We selected a sample of 1991 ambulance claims for ESRD beneficiaries as follows:
� Using the Medicare Status Code, we identified all ESRD beneficiaries with 1991 CWF Part B claims. Then all 1991 CWF ambulance claims were selected for these beneficiaries based on eight national ambulance codes (the eight codes are in Appendix A).
� These ambulance claims were then summarized by Part B carrier, and we arrayed the 56 jurisdictions of all 36 carriers by total allowed payments. Two carriers were then excluded: Maryland Blue Shield (because of a number of active investigations) and the Railroad Retirement Board (because of the large geographical area that it covers).
From the remaining 54 carrier jurisdictions, we identified the top 16, representing 87 percent of the total ESRD ambulance allowances for 1991 ($85.3 of $97.3 millionl). From the top 16 we randomly selected a sample of 8 (see Appendix B for sample carriers).
� Finally, a simple random sample of 35 ESRD ambulance claims was selected from each of these 8 carriers. These 280 claims represented 277 beneficiaries.
We conducted structured interviews with carriers in our sample regarding coverage ofambulance codes, claims processing, identification of non-covered claims, anddetection of overpayments. The carriers sent us documents to support their interviewresponses, copies of the claims in our sample, and profiles of the ambulancecompanies that submitted the claims.
2
Using HCFA’S 1991 CWF claims data and 1988 B-MAD claims data,2 we compared: (1) total allowed ambulance payments for ESRD beneficiaries, and (2) carriers with beneficiaries who had over $10,000 in ambulance allowances (see Appendix C).
We conducted a probability analysis using the number of submitted ambulance claims per ESRD beneficiary (in 1991) in order to identify high volume ambulance users (see Appendix D). We used the percentages of beneficiaries requiring the largest amount of ambulance allowances to predict future trends in carrier payments.
We also estimated potential savings on scheduled ambulance transports for ESRD beneficiaries (see Appendix E).
We met with HCFA staff and AAA representatives to determine the availability of data and to clarify issues. We reviewed past ambulance studies to determine what work had already been done.
This study was conducted in accordance with the Quality Standards for Inspections issued by the President’s Council on Integrity and Efficiency.
3
FINDINGS
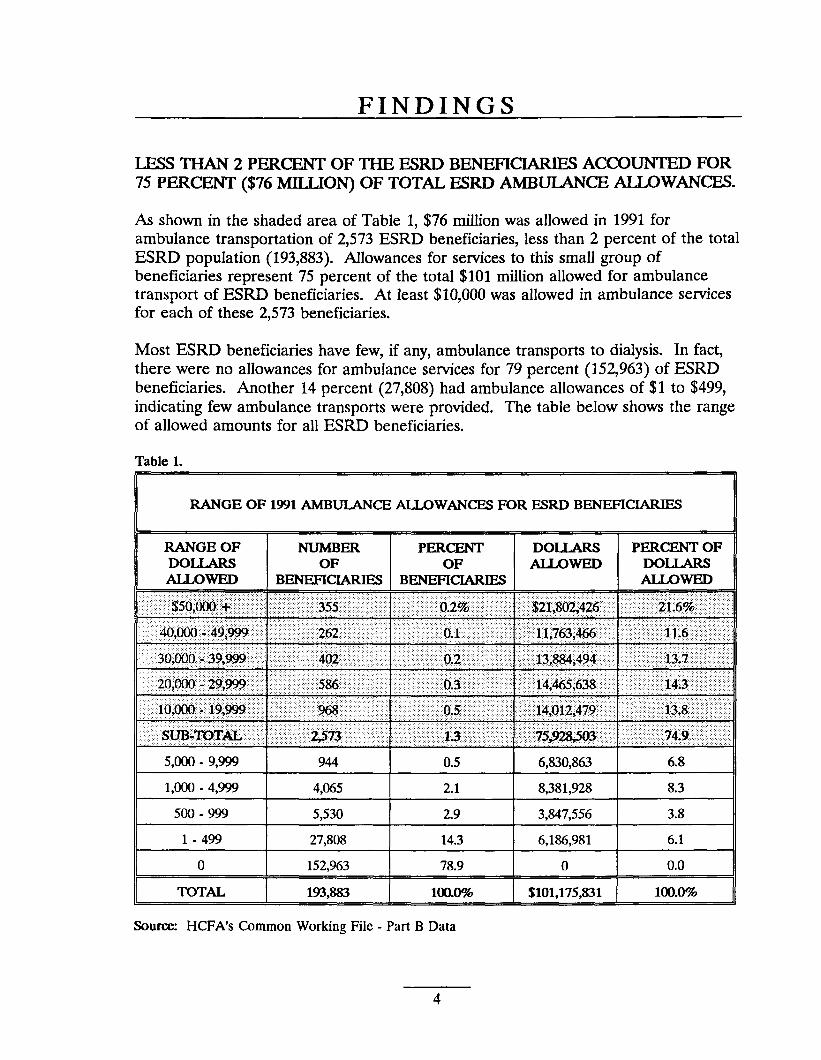
LESS THAN2PERCENT OF THE ESRDBENEFICIARIES ACCOUNTED FOR 75 PERCENT ($76 MILLION) OF TOTAL ESRD AMBULANCE ALLOWANCES.
As shown in the shaded area of Table 1, $76 million was allowed in 1991 for ambulance transportation of 2,573 ESRD beneficiaries, less than 2 percent of the total ESRD population (193,883). Allowances for services to this small group of beneficiaries represent 75 percent of the total $101 million allowed for ambulance transport of ESRD beneficiaries. At least $10,000 was allowed in ambulance services for each of these 2,573 beneficiaries.
Most ESRD beneficiaries have few, if any, ambulance transports to dialysis. In fact, there were no allowances for ambulance services for 79 percent (152,963) of ESRD beneficiaries. Another 14 percent (27,808) had ambulance allowances of $1 to $499, indicating few ambulance transports were provided. The table below shows the range of allowed amounts for all ESRD beneficiaries.
Table 1.
RANGE OF 1991 AMBULANCE ALLOWANCES FOR ESRD BENEFICIARIES
Source: HCFA’S timmon Working File - Part B Data
4
II
WHILE TOTAL ESRD AMBULANCE ALLOWANCES MORE THAN DOUBLED, CERTAIN UTILIZATION PA’ITERNS REMAINED THE SAME.
Total ambulance allowances for ESRD beneficiaries more than doubled between 1988 and 1991. In 1988, carriers allowed $40 million for ESRD ambulance transport; by 1991, the total allowed amount had grown to $101 million.
Patterns of utilization--high dollars paid to ambulance companies for services to a small number of beneficiaries--have remained the same. In 1988, 4 percent of beneficiaries with ambulance allowances (1, 181 of 27,326) accounted for 65 percent of total ESRD ambulance allowances. Each of these 1,181 beneficiaries had allowances of $10,000 or more. In 1991, 6 percent (2,573 of 40,920) of the beneficiaries with $10,OOOor more accounted for 75 percent of the total.
The distribution of beneficiaries among earners has also remained essentially the same (see Appendix C). The top 16 carrier~ in 1988 and 1991 accounted for 90 percent of ESRD beneficiaries with allowances over $10,000. (Fourteen of the top 16 carriers were the same in 1988 and 1991.)
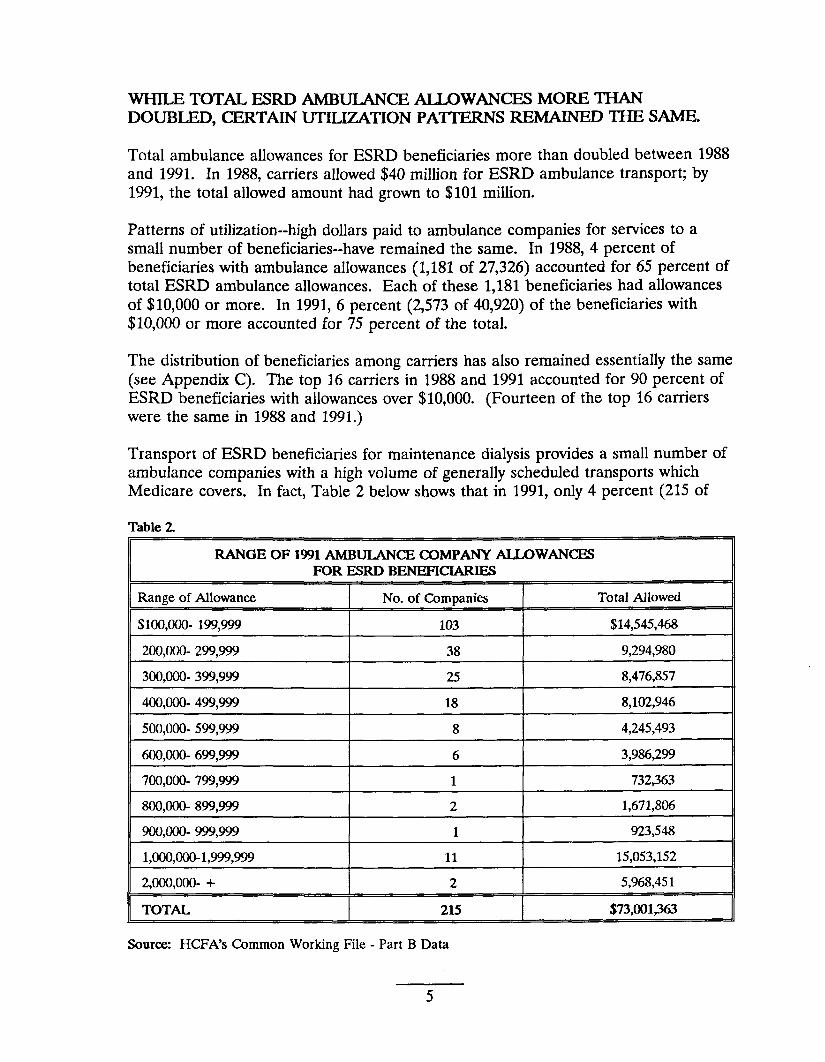
Transport of ESRD beneficiaries for maintenance dialysis provides a small number of ambulance companies with a high volume of generally scheduled transports which Medicare covers. In fact, Table 2 below shows that in 1991, only 4 percent (215 of
Table 2
RANGE OF 1991 AMBULANCE COMPANY ALLOWANCES FOR ESRD BENEFICIARIES
Range of Allowance
$100,000-199,999
200,000-299,999
300,000-399,999 I 400,000-499,999
500,000-599,999
600,000-699,999
700,000-799,999
800,000-899,999
900,000-999,999
1,000,000-1,999,999
2,000,000- +
TOTAL
Source: HCFA’S Common Working File
No. of Companies Total Allowed
103 $14,545,468
38 9,294,980
25 I 8,476,857
18 8,102,946
8 4,245,493
6 3,986,299
1 732363
2 1,671,806
1 923,548
11 15,053,152
2 5,968,451
215 $73,001*
- Part B Data
5
5,228)3 of all ambulance companies receiving Part B payments had ’72percent or $73 million of the total payment allowances for ESRD ambulance transportation. The 215 companies were allowed 83 percent of the dollars ($62.6 million) for services to the 2,573 beneficiaries with allowances over $10,000.
Similarly, in 1988, the percentage of ambulance companies receiving the largest share of allowances was very small. Of the ambulance companies which provided transports to ESRD beneficiaries in 1988, 2.1 percent (88) accounted for 57.6 percent of the total ESRD ambulance allowances.
HIGH VOLUME USERS CAN BE IDENTIFED PROSPECITVELY.
It is possible to predict which ESRD beneficiaries will be high volume users of ambulance services. With refinements, carriers can use either of two models in Appendix D as a step in predicting which beneficiaries will have a high-volume of scheduled transports.
We found the first model, which identifies beneficiaries with a second transport w“thin 3 days of the first to be highly predictive. The beneficiaries identified represented 66 percent of the total allowed amount for ESRD ambulance transports in 1991 and 71 percent of all ESRD beneficiaries with $10,OOOor more in ambulance allowances.
The second model identified the number of transports each beneficiary had within 15 days of the first. Beneficiaries with 7 transports in this time period accounted for nearly half of the total allowed amounts for ESRD ambulance transports. The average amount allowed per beneficiary was over $22,000.
Identification of high-volume users could be part of new payment strategies to save Medicare funds.
CARRIERS DO NOT USE AMBULANCE CODES UNIFORMLY.
Ambulance codes represent the types of selvice provided by an ambulance company and types of service paid for by Medicare. Without uniform use of codes by carriers, HCFA cannot accurately analyze service utilization or payments. For example, current coding practices make it impossible to know the number of ESRD beneficiaries transported in emergency situations or as scheduled trips.
In 1991, the eight carriers in our sample varied in terms of which codes they covered and how these codes were used. Only two carriers covered all eight national codes that we examined (Appendix A lists the codes). The remaining carriers covered from five to seven. They also used codes differently, so that the type of service covered under a code could vary from carrier to carrier. For example, one carrier used a code (A0221) to indicate mileage charges for ALS emergency transport, while another used the same code to indicate a base charge for basic life support transport. The
6
emergency or non-emergency nature of the transport was irrelevant to the latter carrier.
Although inconsistency among carriers has been somewhat reduced since 1991, it still exists today. Sample carriers currently lack uniformity in distinguishing between emergency and non-emergency transport. Two of the eight carriers require that scheduled transport of ESRD beneficiaries to maintenance dialysis be billed under a non-emergency code (e.g., A0150), while two other carriers do not cover non-emergency transport and require that the same type of service be billed under an emergency code (e.g., AOO1O). Three carriers instruct providers to use a non-emergency code for this service. These three carriers do not automatically deny payment if an emergency code is billed for this service. However, if billed routinely, the carriers would inform the ambulance company of the preferred code. The one remaining carrier in the sample does not categorize transports as emergency or non-emergency.
The lack of consistency in coding is further illustrated by variations in the use of return trip codes. Of the two carriers who cover only emergency codes, one uses the return trip code (A0222) to indicate an emergency transport, while the other considers the return trip a non-emergency and does not cover it. Five other carriers use the return trip code as a non-emergency code, and one includes both emergency and non-emergency transport under this code.
A study conducted by Project HOPE and included in a recent HCFA Report to Congress identified similar problems in the way codes are used. The study suggested that HCFA encourage the use of a separate code for scheduled ambulance transport.
THE PAYMENT SYSTEM DOES NOT TAKE INTO ACCOUNT THE RO= PREDICTABLE NATURE OF SCHEDULED AMBULANCE TRANSPORTS.
Ambulance payments are based on an outmoded payment system
The Medicare payment system employed by carriers is based on inflation indexed charges or the customary or prevailing charge, whichever is less. Under this system, payment to an ambulance company is determined by what it has charged in the past and what other ambulance companies in the area charge, rather than the cost of resources needed to provide the service.
Both Congress and HCFA have recognized the vulnerabilities in payment based on reasonable, usual, or customary charges. As a result, the Medicare program now pays hospitals based on diagnostic-related groups and has established fee schedules for physician semices, laboratory services, and durable medical equipment. The fee schedule for physician services is distinguished by its use of relative resource consumption as the primary basis for payment rather than historical charges.
7
Under the current system, ambulance companies in the same area providing the same service may receive different payments. In our sample of 1991 claims, we found different payments for the same service in metropolitan areas of Florida, Michigan, Pennsylvania, and Texas. For example, in Pittsburgh, Pennsylvania three ambulance companies transported ESRD beneficiaries to dialysis facilities. Each billed the carrier under the same base code for BLS emergency transport--AOOIO--and were paid base rates of $140, $157, and $175. Each company also billed under a mileage code for the distance traveled between the beneficiary’s pick up location and destination. (The sample carriers pay only for the miles traveled while a beneficiary is aboard.) As with base codes, payment for mileage codes varied among the three companies.
These variations still occur today. In 1993, seven Philadelphia, Pennsylvania ambulance companies that were in our 1991 sample had different allowances ranging from $130 to $183 for the same base code (BLS emergency transport--AOOIO).
Another problem associated with this system is that carriers must maintain separate charge profiles for each ambulance company. This is complex, time-consuming, and costly to administer.5
l%e payment system dbes not take advantage of the lower cmts associated with high-volume schedukd transpmm.
The Project HOPE study found ambulance company costs for scheduled transport to be substantially lower than costs for emergency transports. According to the study, “scheduled runs are provided at ... approximately 20 to 60 percent below the costs of providing an emergency BLS run and substantially below the cost of providing an emergency ALS run in the surveyed States.”b The study also stated that some private ambulance companies specialize in scheduled transports because of the combination of lower costs and the fact that carrier payments do not differ for scheduled and unscheduled services.’ In 1987, the Office of Inspector General found that Veteran’s Hospitals contract with ambulance companies for scheduled transports at rates approximately 25 percent less than Medicare rates (OAI-03-86-00012).
We estimate that Medicare could save between $11.4 to $34.1 million annually ($57 to $170.5 million over 5 years) by changing its payment method for ambulance transports. Since current coding and payment practices make it impossible to precisely identiq the ambulance allowances for ESRD beneficiaries going to dialysis, the savings are based on approximate calculations. The calculations for these savings are shown in Appendix E.
8
RECOMMENDATIONS
CODING SYSTEM
In light of our findings, we recommend that HCFA take the following steps to ensure greater accuracy in monitoring and analysis of Medicare-covered ambulance sexvices.
� Establish a code for scheduled transports.
� Require uniform use of national ambulance codes.
The HCFA may need to revise or elaborate on the current definitions of national ambulance codes so that the distinctions among codes are clear to billers and payers alike. A specific type of ambulance service should be represented by one code only. Carriers should be notified that sexvices should be billed under the appropriate code, as newly defined, in order to be reimbursed.
PAYMENT SYSTEM
In light of the predictable nature of scheduled transport for dialysis, we offer several optional strategies which would better ensure fair payment for services rendered and would save Medicare funds. While these options will require start-up costs and, in some cases, legislation, we believe Medicare could save between $11.4 to $34.1 million annually ($57 to $170.5 million over 5 years). Since current coding and payment practices make it impossible to precisely identify the ambulance allowances for ESRD beneficiaries going to dialysis, the savings are based on approximate calculations. The calculations for these savings are shown in Appendix E.
The HCFA may consider combining two or more of the following strategies and establishing demonstration projects in particular geographic areas. The probability models described in appendix D could be used in implementing some of these strategies.
. Establish a payment schedule for ambulance transport to maintenance dialysis, and set the fee lower than what is paid for unscheduled, emergenq transports. To establish the payment amount, HCFA might consider using Project HOPE’s data on the lower costs of scheduled transports or assess the practices of other payers (e.g., Veterans Administration).
. Negotiate preferred provider agreements with ambulance companies to provide scheduled transportation for ESRD beneficiaries. The ambulance company would be given a set payment and would have a predictable volume of scheduled transports.
9
�
�
�
Undertake competitive bidding to establish a price for scheduled transports for ESRD beneficiaries or to select companies who agree to provide such services. Thecompetitive bidding might remodeled after the 1993 HCFAlegislative proposal for oxygen and other durable medical equipment.
Establish a rebate program for companies that routinely transport ESRD beneficiaries. Such a program might be modeled on the Medicaid rebate program for prescription drugs. Theadvantage ofarebate program is that it does notrequire front-end administration. Forexample, HCFAwould establish a base rebate amount and if the ambulance company provided the service it would pay Medicare the rebate. If the company did not provide the service, it would not have to pay the rebate.
Provide an add-on to the composite rate Medicare pays dialysis facilities to cover the cost of transporting beneficiaries and allow the facility to negotiate agreements with ambulance companies. The model for this is the Medicare hospital payment mechanism. By bundling an add-on for transportation, Medicare would be encouraging the use of the most cost-effective mode of transportation. The dialysis facility, which is in an excellent position to determine whether a patient requires an ambulance, would have a financial interest in arranging for the most economical means of transport. However, given the small number of ESRD beneficiaries using ambulances, it maybe difficult to set add-on rates for all facilities.
We are continuing our work to determine whether payments for 1991 Part B ambulance transportation for ESRD beneficiaries met Medicare coverage guidelines. We believe such information will also help HCFA in its continuing efforts to assess its payment policies for this semice.
COMMENTS FROM HCFA
The HCFA commented on the draft of this report. They concur with our recommendation to make coding changes, and they concur with the intent of our recommendation to ensure fairer payment for services rendered. The HCFA is “exploring the feasibility of revising the coding system” and is “engaged in a comprehensive effort to improve overall coverage and payment policies...including those involving payment for non-emergency transport services.” The full text of this agency’s comments are in Appendix F.
10
ENDNOTES
1. The earners that were excluded had a combined allowed amount of $3,792,639 (Maryland - $1,897,209; Railroad Retirement Board - $1,895,430). Therefore, the total allowed amount for all carriers was $101,175,828.
2. Al11988B-MAD data is basedon 10national ambulance codes. These include the 8 codes listed in Appendix A.
3. This percentage could be lower if, as is often the case, ambulance companies have more than one provider identification number.
4. Project HOPE, A Studv of Pavm ents For Ambulance Services Under Medicare, p. 7-3 and p. 7-11, as appended to a report to Congress, Studv of Pavrnent of Ambulance Services by Donna E. Shalala, Secretary, Department of Health and Human Semites (Washington, DC. U.S. Department of Health and Human Services, 1993).
5. Physician Payment Review Commission, Annual Report to Corwress, p. 2 (Washington, DC: Physician Payment Review Commission, 1992).
6. Project HOPE, p. 7-10.
7. Ibid, pp. 7-7 and 7-8.
11
APPENDIX A
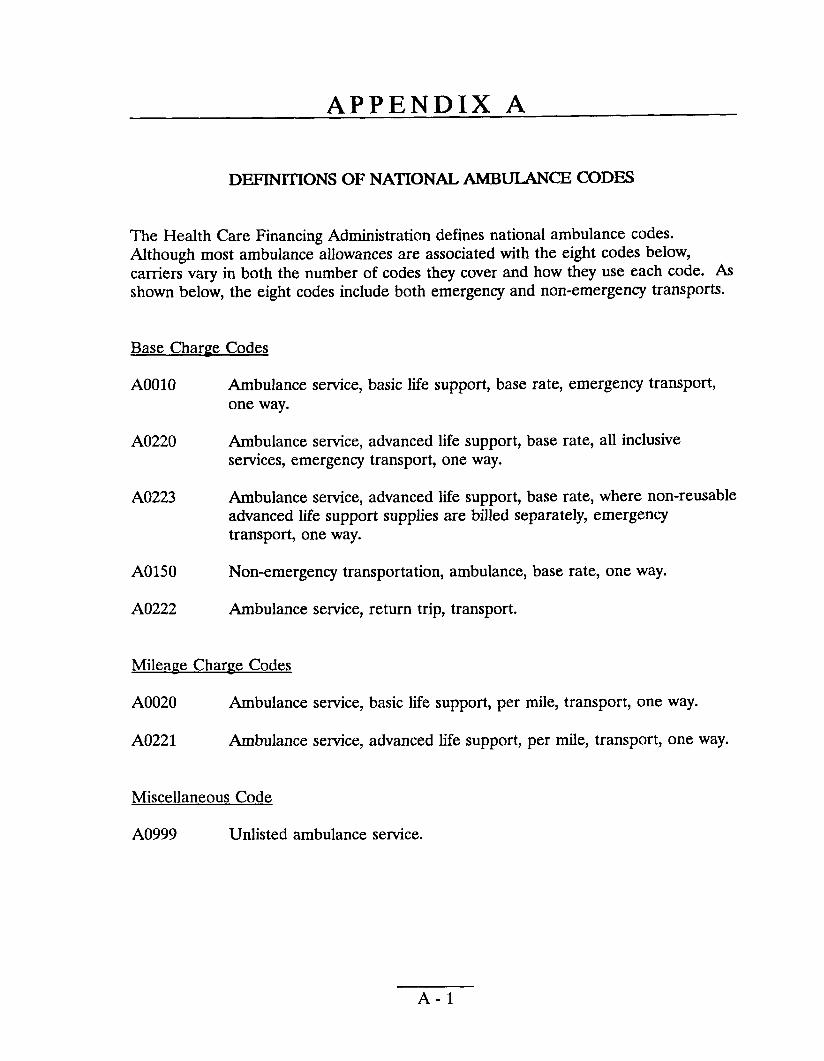
DEFINITIONS OF NATIONAL AMBULANCE CODES
The Health Care Financing Administration defines national ambulance codes. Although most ambulance allowances are associated with the eight codes below, carriers va~ in both the number of codes they cover and how they use each code. f% shown below, the eight codes include both emergency and non-emergency transports.
Base Charge Codes
AOO1O Ambulance service, basic life support, base rate, emergency transport, one way.
A0220 Ambulance service, advanced life support, base rate, all inclusive services, emergen~ transport, one way.
A0223 Ambulance service, advanced life support, base rate, where non-reusable advanced life support supplies are billed separately, emergency transport, one way.
A0150 Non-emergency transportation, ambulance, base rate, one way.
A0222 Ambulance setice, return trip, transport.
Mileage Chanze Codes
AO020 Ambulance sewice, basic life support, per mile, transport, one way.
A0221 Ambulance service, advanced life support, per mile, transport, one way.
Miscellaneous Code
A0999 Unlisted ambulance service.
A-1
APPENDIX B
CARRIERS INTERVIEWED
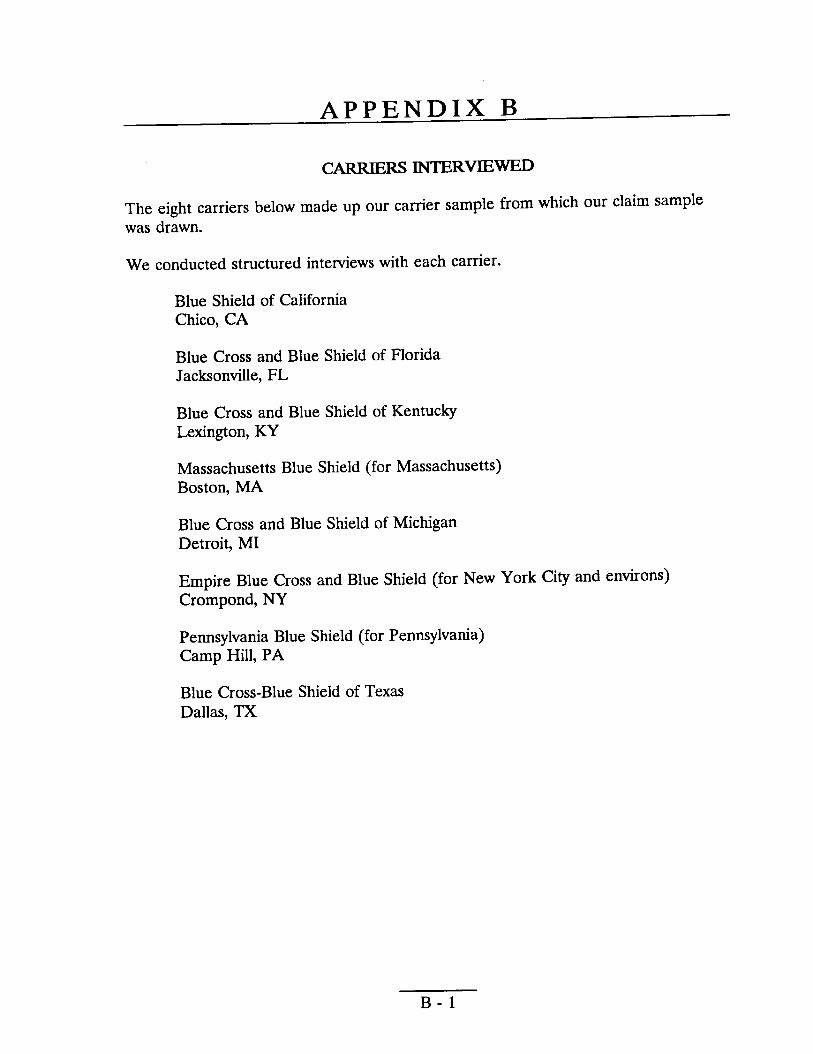
The eight carriers below made up our carrier sample from which our claim sample was drawn.
We conducted structured interviews with each carrier.
Blue Shield of California Chico, CA
Blue Cross and Blue Shield of Florida Jacksonville, FL
Blue Cross and Blue Shield of Kentucky Lexington, KY
Massachusetts Blue Shield (for Massachusetts) Boston, MA
Blue Cross and Blue Shield of Michigan Detroit, MI
Empire Blue Cross and Blue Shield (for New York Crompond, NY
Pennsylvania Blue Shield (for Pennsylvania) Camp Hill, PA
Blue Cross-Blue Shield of Texas Dallas, TX
B-1
City and environs)
APPENDIX C
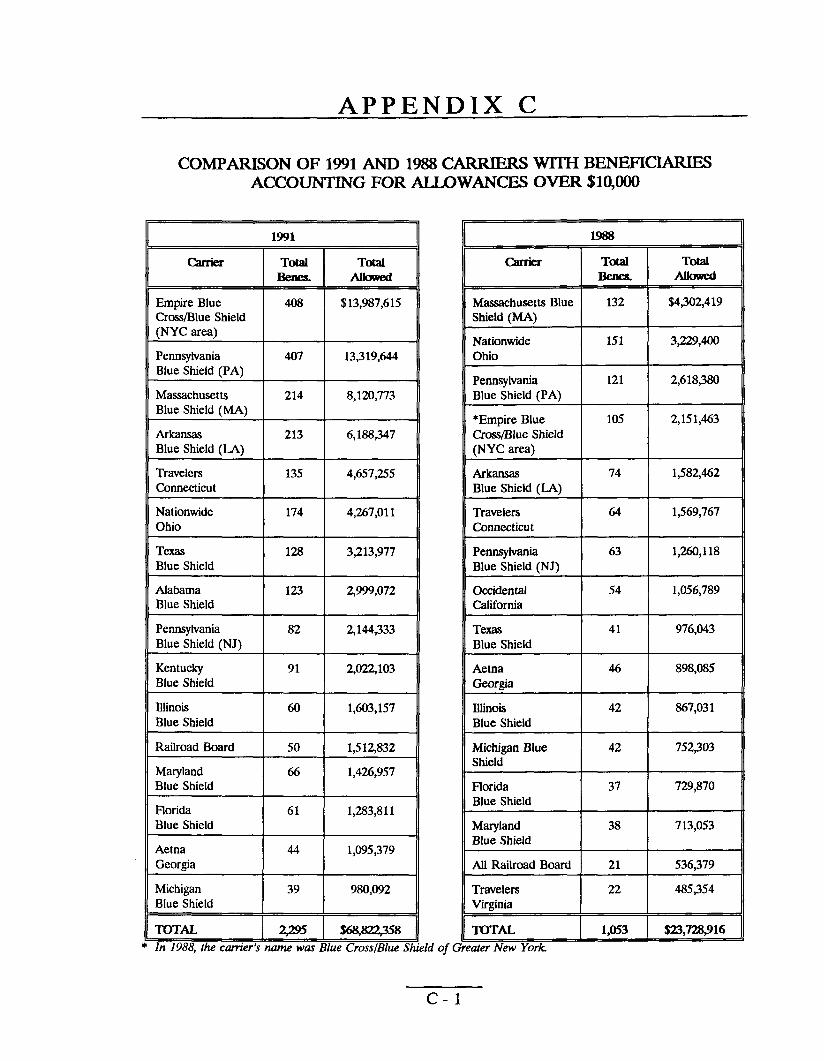
COMPARISON OF 1991 AND 1988 CARRIERS WITH ACCOUNTING FOR ALLOWANCES OVER
1991
carrier Total Total
Empire Blue 408 $13,987,615Cross/Blue Shield(NYC area)
PennsylvaniaBlue Shield (PA)
Massachusetts 214 8,120,773Blue Shield (MA)
Arkansas 213 I 6,188,347Blue Shield (LA)
TravelersConnecticut %==
I INationwide 174 4,267,011 Ohio
Texas 128 3,213,977 Blue Shield
Alabama Blue Shield vPennsylvania Blue Shield (NJ)
Kentucky 91 I 2,0~103 Blue Shield I
~
‘JDTAL $68&2#58In 1988, thecarrier’s nome was Blue Cross/Blue St
Carrk$
Massachusetts BlueShield (MA)
NationwideOhio
PennsylvaniaBlue Shield [PA)
*Empire BlueCross/Blue Shield(NYC area)
ArkansasBlue Shield (IA)
TravelersConnecticut
PennsylvaniaBlue Shield (NJ)
OccidentalCalifornia
TexasBlue Shield
Aetna
IllinoisBlue Shield
Michigan BlueShield
FloridaBlue Shield
MarylandBlue Shield
All Railroad Board
TravelersVirginia
‘17)TALtier New York
c-1
BENEFICIARIES $10,000
Total Total
132 $4,302,419
151 3,229,400
121 2,618,380
105 2,151,463
74 1,582,462
64 1,569,767
63 1,260,118
54 1,056,789
41 976,043
46 898,085
42 867,031
42 75~03
37 729,870
38 713,053
21 536,379
22 485,354
1.053 S23.728916
APPENDIX D
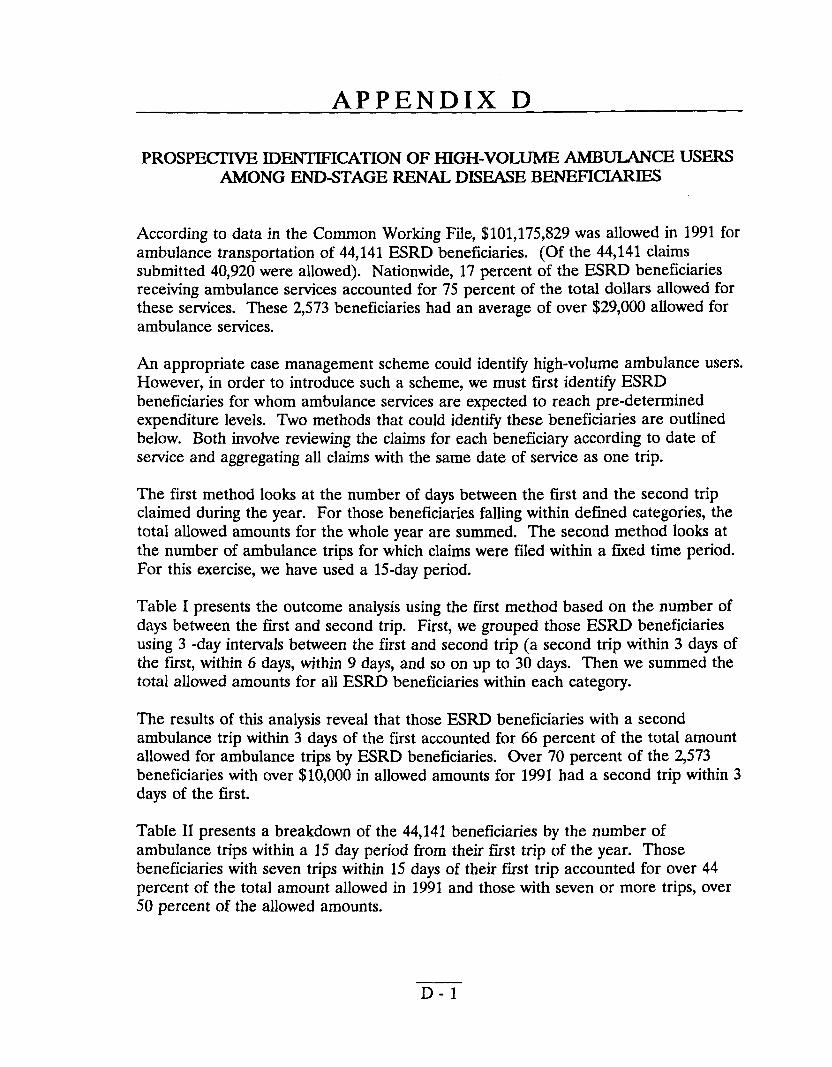
PROSPE~ IDENTIFICATION OF HIGH-VOLUME AMBULANCE USERS AMONG END-STAGE RENAL DISEASE BENEFICIARIES
According to data in the Common Working File, $101,175,829 was allowed in 1991 for ambulance transportation of 44,141 ESRD beneficiaries. (Of the 44,141 claims submitted 40,920 were allowed). Nationwide, 17 percent of the ESRD beneficiaries receiving ambulance services accounted for 75 percent of the total dollars allowed for these services. These 2,573 beneficiaries had an average of over $29,000 allowed for ambulance semices.
An appropriate case management scheme could identify high-volume ambulance users. However, in order to introduce such a scheme, we must first identify ESRD beneficiaries for whom ambulance services are expected to reach pre-determined expenditure levels. Two methods that could identify these beneficiaries are outlined below. Both involve reviewing the claims for each beneficiary according to date of service and aggregating all claims with the same date of service as one trip.
The first method looks at the number of days between the first and the second trip claimed during the year. For those beneficiaries falling within defined categories, the total allowed amounts for the whole year are summed. The second method looks at the number of ambulance trips for which claims were filed w’thin a fixed time period. For this exercise, we have used a 15-day period.
Table I presents the outcome analysis using the first method based on the number of days between the first and second trip. First, we grouped those ESRD beneficiaries using 3 -day intervals between the first and second trip (a second trip within 3 days of the first, within 6 days, within 9 days, and so on Up to 30 days. Then we summed the total allowed amounts for all ESRD beneficiaries within each category.
The results of this analysis reveal that those ESRD beneficiaries with a second ambulance trip within 3 days of the first accounted for 66 percent of the total amount allowed for ambulance trips by ESRD beneficiaries. Over 70 percent of the 2,573 beneficiaries with over $10,000 in allowed amounts for 1991 had a second trip within 3 days of the first.
Table II presents a breakdown of the 44,141 beneficiaries by the number of ambulance trips within a 15 day period from their first trip of the year. Those beneficiaries with seven trips within 15 days of their first trip accounted for over 44 percent of the total amount allowed in 1991 and those with seven or more trips, over 50 percent of the allowed amounts.
D-1
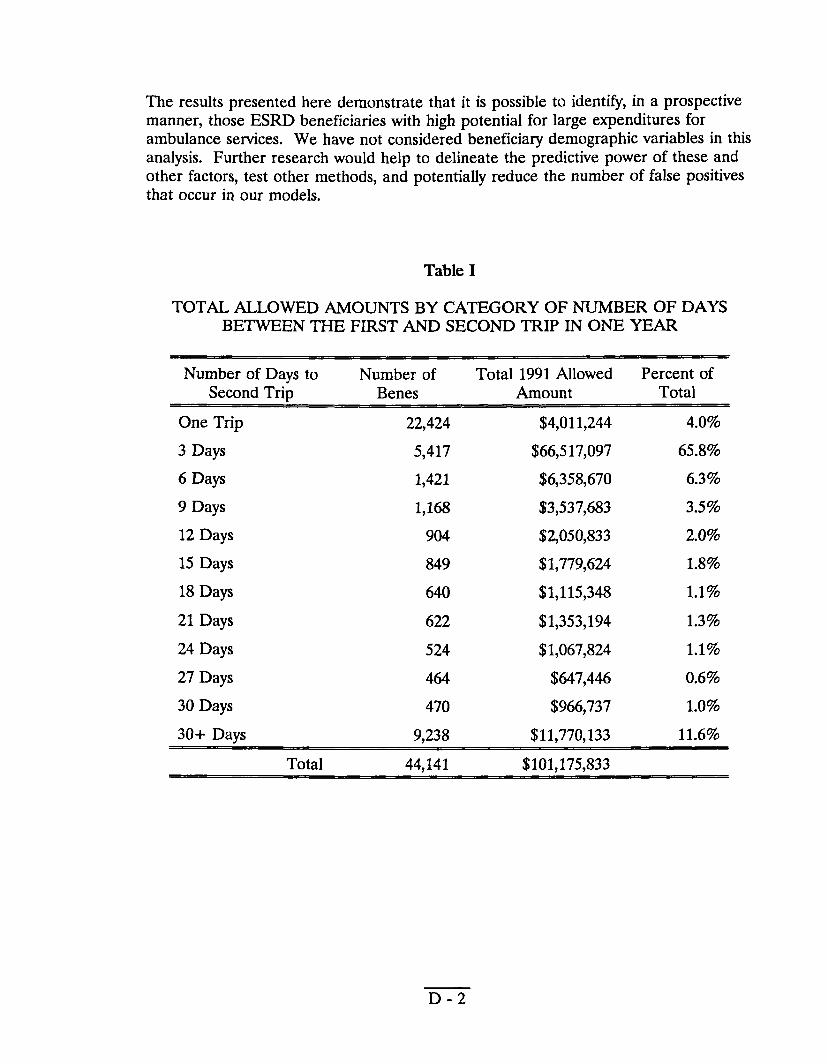
The results presented here demonstrate that it is possible to identi~, in a prospective manner, those ESRD beneficiaries with high potential for large expenditures for ambulance services. We have not considered beneficiary demographic variables in this analysis. Further research would help to delineate the predictive power of these and other factors, test other methods, and potentially reduce the number of false positives that occur in our models.
Table I
TOTAL ALLOWED AMOUNTS BY CATEGORY OF NUMBER OF DAYS BETWEEN THE FIRST AND SECOND TRIP IN ONE YEAR
Number of Days to Number of Second TriD Benes
One Trip 22,424
3 Days 5,417
6 Days 1,421
9 Days 1,168
12 Days 904
15 Days 849
18 Days 640
21 Days 622
24 Days 524
27 Days 464
30 Days 470
30+ Days 9,238
Total 44,141
D-2
Total 1991 Allowed Amount
$4,011,244
$66,517,097
$6,358,670
$3,537,683
$2,050,833
$1,779,624
$1,115,348
$1,353,194
$1,067,824
$647,446
$966,737
$11,770,133
$101,175,833
Percent of Total
4.0%
65.8%
6.39Z0
3.5%
2.0%
1.8%
1.1%
1.3%
1.1%
0.6%
Lo%
11.6%
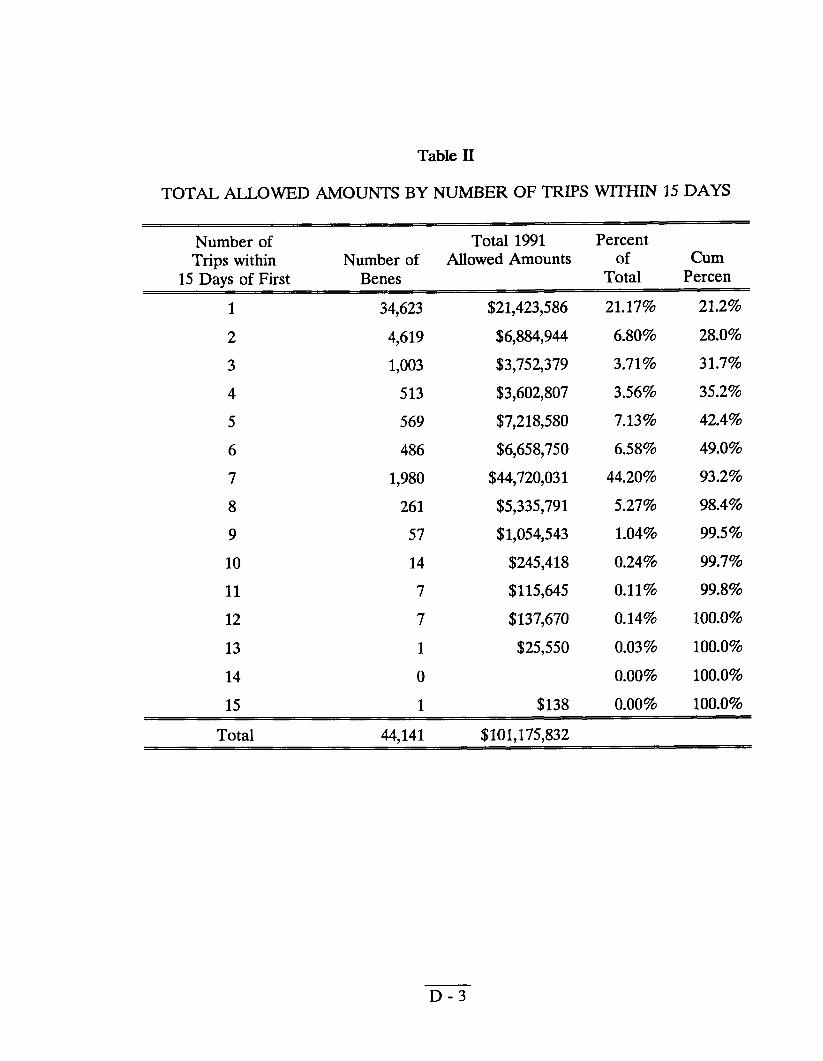
Table II
TOTAL ALLOWED AMOUNTS BY NUMBER OF TRIPS WITHIN 15 DAYS
Number of Trips within
15 Days of First
1
2
3
4
5
6
7
8
9
10
11
12
13
14
15
Total
Total 1991 Number of Allowed Amounts
Percent of Cum
Total Percen
21.17% 21.2%
6.80% 28.0%
3.71% 31.7%
3.56% 35.2%
7.13% 42.4%
6.58% 49.0%
44.20% 93.2%
5.27% 98.4%
1.04% 99.5%
0.24% 99.7%
0.11% 99.8%
0.14% 100.0%
0.03% 100.0%
0.00% 100.0%
0.00% 100.0%
Benes
34,623
4,619
1,003
513
569
486
1,980
261
57
14
7
7
1
0
1
44.141
$21,423,586
$6,884,944
$3,752,379
$3,602,807
$7,218,580
$6,658,750
$44,720,031
$5,335,791
$1,054,543
$245,418
$115,645
$137,670
$25,550
$138
$101.175.832
D-3
APPENDIX E
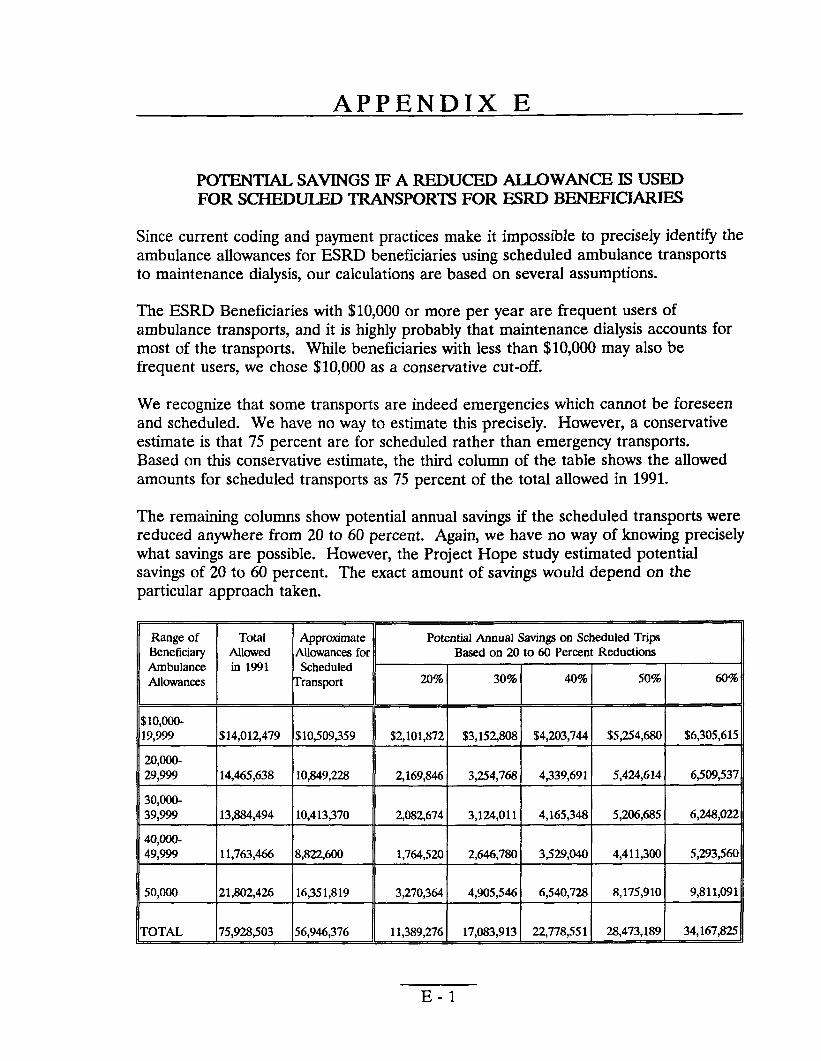
POTENTIAL SAVINGS IF A REDUCED ALLOWANCE IS USED FOR SCHEDULED TRANSPORTS FOR ESRD BENEFICIARIES
Since current coding and payment practices make it impossible to precisely identify the ambulance allowances for ESRD beneficiaries using scheduled ambulance transports to maintenance dialysis, our calculations are based on several assumptions.
The ESRD Beneficiaries with $10,000 or more per year are frequent users of ambulance transports, and it is highly probably that maintenance dialysis accounts for most of the transports. While beneficiaries with less than $10,000 may also be frequent users, we chose $10,000 as a conservative cut-off.
We recognize that some transports are indeed emergencies which cannot be foreseen and scheduled. We have no way to estimate this precisely. However, a conservative estimate is that 75 percent are for scheduled rather than emergency transports. Based on this conservative estimate, the third column of the table shows the allowed amounts for scheduled transports as 75 percent of the total allowed in 1991.
The remaining columns show potential annual savings if the scheduled transports were reduced anywhere from 20 to 60 percent. Again, we have no way of knowing precisely what savings are possible. However, the Project Hope study estimated potential savings of 20 to 60 percent. The exact amount of savings would depend on the particular approach taken.
Range of Total Approximate Potential Annual Savings on Scheduled Trips Beneficiary Allowed Allowancesfor Baaed on 20 to 60 Pereent Reductions Ambulance in 1991 Scheduled Allowances Transport 20% 30% 40% 50% 60%
$1o,ooo-19,999 $14,012479 $10309,359 $2,101,872 $3,152W8 $4,203,744 $5,254,680 $6,305,615
20,000-29,999 14,465,638 10,849,228 2,169,846 3,254,768 4,339,691 5,424,614 6,509,537
30,000-39,999 13,884,494 10,413,370 2,082,674 3,124,011 4,165,348 5,206,685 6,248,022
40,000-49,999 11,763,466 8,822,600 1,764,520 2,646,780 3,529,040 4,411,300 5,293,560
50,000 21,802,426 16,351,819 3,270,364 4,905346 6,540,728 8,175,910 9,811,091
TOTAL 75,928,503 56,946,376 11,389,276 17,083,913 22,778,551 28,473,189 34,167,825
E-1
APPENDIX F
COMMENTS FROM THE HEALTH CARE FINANCING ADMINISTRA~ON
F-1
U8PARTMENT OF HliALm & HUMAN SERVICES kieehh Cam Finaciw Admmimrmmn
Memorandum
wSu
Frum
mbloet
“!i=iii’~?’qY@’4Offkt ofIiIaputor Gtmerd DM R- “~buiancc Services for A4e#icarc EurMtage Rend Disease %w~ PaymentPra~” (OE1-03-W-~13 1)
To June Gibbt Brown IqnXmr Gcrleral
Wa
.
.
.
,’
,,
.
,,
..,. .
A&2
�
. . . cnts uf theHealth Care Financj@@nmtraQQu IHCFA)
~of hg@ar Genera 1KXGl H Rcx
a Establish a de for dldlkd tmtqmrta
o Require uniform use of national embulan- oack
‘lM HCFA may need tQ revise or elabcmte on the current definihm af national ~ce codca ao that the disbdme emcmgcodes are clear to bilk and payeradik A-~~~buh~hdtibs~ti&[email protected] ehouhi be aotifkd that smviccs dmuld be bind under the appropriate + asnwiyd&nti rnatdertobelekbumd
HCFA comum We are currcmw explaring the ftasibfity ofrevising our coding qstumb ambdance services.In thatq~ we lmw b= working with the American
~cm to eneure tha~ to tho extentposaibk any coding chsnga we ~ - -W ~ the ambulaucs iwhstry.
CkUSi&CaIrtbh.htg WU ax mwe of the fohwbtg s@8te ‘u and eeteblishing niorlprujec’t$ill pdlxllar gcographk areaa- % e probabi~ rnodeb dtibcd
.in appendix D oouid be ueed in implementing come of tbe stmstegica.
o Establieh a payment sAdoIe h ambulancetranspt to rnaimtmamx di8iy&andaottho feelcJverthanwM iepaid-foP un9Chedule4 emeqpmq traneportL To eetablieh the payment amoux HCFA might ~ usiog Rujeot HOPE%data an the lower costs of scheduled ~ - ~ he PI--C d ok P8yors (sg., US. Depmnent of v~’a Jl&@
0 Neguth pmkrred providerqpemcnrs wfthambulance compios to prcwide*ednkd tmuptmion h ESRI) beueficiark Under this typa
. .
-.
‘.
“.
,
..
. .r“.
. .
[F - 3]
Page 2
of syman, the mbdanm cxunpanycould be given a set pawent for each ~ in rctnrn for Medicaze’s buaincas
a UBdartakc competitive biddiug to est=blhh � ~ h **kd frJUWXXTX for E3RD beuefkiaries or tn Mm cnmpanies who agree m prtide such ~ l’%c amtpeuti bidding rnigltfbe rnockkd afbr the 1993 HCFA kgishfve prqxxal fur oxygenand other hrabk medical equipment
o Establish a rebate programfor earnpaaks that rmtinely transportESRD kelkiaries. Under MS type of qete~ ccxrqnmicawhkh reaiw over a certain dcilez Ievd in paymcats might be required to ~ovide a rebata based on a percentage of tho payments made. For exampiq companies wbieh rcsived $SO,?MX)in Med~e pqmeam cotdd be required to rebate S percent ($Z500) at the cad of the year.
0 Provide en add-on to the cumucufte rate hdedicarc Payadialwis f=dhiea co bedimmeeand alkiv ihe fa&ty toCmer t.h mst of transporung
negodaliia egreetumte with ambuhtm -nies. TIM ntodeI for this is the hiediam hoepital pllyYlleBtm=hanmm By bundlfng an add-an for tmmpmad~ Medkare would be enoouzegimgdie use uf the nrcmccxn. .eKcethmmodoof~ -rbcdMyeie f*, w&btirnm excdkrn poeidon to detenttine whether a patient xqrirea an ambulance, mhmafkektmst timangingfortiem~ --~~m-s od trempmL Hawever, giventb smail number of ESRD beneficiaries ubg ambu~~ it maybe dif&ult to aet add-en mtea for 8JItilith.
H(?FA ~m witk the intern of tha reeommendaCkr&We mmgnizs that tbete are a number ofvtdneeaMEda in the *payment syuem for exnimlanca~ under Pert B. As � -i% we am am’unt!yengaged in 8 Cmllpnehllsnm efh)rt to improve overeRRYv6mp esdpaynMntpoiideaf orxlwaneeserwieek
.’
.“ .
,,
. .
‘. ,..
., ,. J.
. .
[1? - 4]