Embed Size (px)
Citation preview
55

Annual Report to the General Assembly, the Governor,
and the Illinois Commerce Commission
Submitted pursuant to Section 20-110 of the
Illinois Public Utilities Act
Office of Retail Market Development
Illinois Commerce Commission
June 2015
Office of Retail Market Development 2015 Annual Report
Section 20-110 of the Public Utilities Act
2
I. Introduction
Section 20-102 of the Retail Electric Competition Act of 2006 (“Retail Competition Act”) states that
“a competitive wholesale electricity market alone will not deliver the full benefits of competition to Illinois consumers. For Illinois consumers to receive products, prices and terms tailored to meet their needs, a competitive wholesale electricity market must be closely linked to a competitive retail electric market. To date, as a result of the Electric Service Customer Choice and Rate Relief Law of 1997, thousands of large Illinois commercial and industrial consumers have experienced the benefits of a competitive retail electricity market. Alternative electric retail suppliers actively compete to supply electricity to large Illinois commercial and industrial consumers with attractive prices, terms, and conditions. A competitive retail electric market does not yet exist for residential and small commercial consumers. As a result, millions of residential and small commercial consumers in Illinois are faced with escalating heating and power bills and are unable to shop for alternatives to the rates demanded by the State's incumbent electric utilities. The General Assembly reiterates its findings from the Electric Service Customer Choice and Rate Relief Law of 1997 that the Illinois Commerce Commission should promote the development of an effectively competitive retail electricity market that operates efficiently and benefits all Illinois consumers.” To further the goal of developing an effectively competitive retail electricity market,
the Retail Competition Act created the Office of Retail Market Development (“ORMD”) within the Illinois Commerce Commission (“ICC”). Section 20-110 of the Retail Competition Act provides that on or before June 30 of each year, the Director of the ORMD submit a report to the Commission, the General Assembly, and the Governor, that details specific accomplishments achieved by the Office in the prior 12 months in promoting retail electric competition and that suggests administrative and legislative action necessary to promote further improvements in retail electric competition.

Office of Retail Market Development 2015 Annual Report
Section 20-110 of the Public Utilities Act
3
II. Executive Summary
• Statewide, 85 alternative retail electric suppliers (“ARES”) have ICC certification to serve retail customers in Illinois, down slightly from last year (see page 5 of the report).
• Currently, Illinois has 347 licensed Agents, Brokers and Consultants (“ABCs”), up from 309 a year ago (see page 12).
• As of May 31, 2015, the percentage of total electric usage provided by ARES has dropped in the ComEd and three Ameren Illinois service territories. (see pages 6-10).
♦ In ComEd’s region, ARES provided approximately 79.5% of the total electric usage of customers, down from 81% last year.
♦ ARES provided 71% of the total electric usage in the Ameren Illinois Rate Zone I (formerly AmerenCIPS), down from 73% last year.
♦ In Ameren Illinois Rate Zone II (formerly Ameren CILCO), ARES provided 80% of the total electric usage of customers, down slightly from 81% last year.
♦ 79% of the total electric usage of Ameren Illinois Rate Zone III (formerly Ameren IP) customers was provided by ARES, down from 81% last year.
• Switching levels for the residential class decreased slightly in the last year (see pages
21-28). ♦ As of May 31, 2015, more than 2.7 million residential customers across the
state receive their power from an ARES, a decrease of approximately 291,000 from a year earlier. However, the number of residential customers receiving ARES service outside of an aggregation program has actually increased in the last year.
♦ More than 61% of ComEd’s residential customers receive service from a retail electric supplier.
♦ As of May 2015, 48 ARES actively serve residential customers in the ComEd service territory, compared to 51 in May 2014. Twenty-two ARES serve residential customers in the Ameren Illinois service territory, down from 23 in May 2014.
♦ As of April 2015, the ComEd service territory had 75 different residential offers on PluginIllinois.org.
Office of Retail Market Development 2015 Annual Report
Section 20-110 of the Public Utilities Act
4
♦ Of the residential offers posted on PluginIllinois.org for ComEd customers, 76% were fixed offers and 21% were variable.
• The residential switching numbers and market concentration levels changed only
slightly from last year (see pages 23, 25 and 36). ♦ In May 2015, just under 70% of residential ARES customers were part of a
government aggregation program, a decline of about 4 percentage points compared to last year.
♦ A total of 743 communities have passed an opt-out aggregation referendum to date, adding another 12 communities after the November 2014 referendum date and two more in February 2015. However, as of June 2015, 121 aggregation communities have decided to not continue their aggregation program.
♦ The ComEd residential market, based on HHI values, remains “moderately concentrated”, with 61% of the market going to the three largest suppliers in May 2015, compared to 66% in May 2014.
• For the first time since preparing this annual report, the percentage of ARES-
provided load in the small commercial customer class (0-100kW) declined year-over-year, especially in the Ameren Illinois service territories (see pages 6-10).
♦ As of May 31, 2015, ARES provided about 62% of the electric usage of ComEd’s smallest commercial customers (0-100kW), down from 63%a year ago.
♦ 59% of the electric usage of Ameren Illinois Rate Zone I smallest commercial customers (0-100kW) was provided by ARES, down from 65% a year ago.
♦ 59% of the electric usage of Ameren Illinois Rate Zone II smallest commercial customers (0-100kW) was provided by ARES, down from 65% a year ago.
♦ As of May 31, 2015, 61% of the electric usage of Ameren Illinois Rate Zone III smallest commercial customers (0-100kW) was provided by ARES, down from 66.6% a year ago.

Office of Retail Market Development 2015 Annual Report
Section 20-110 of the Public Utilities Act
5
III. Recent competitive activity
A. Number of certified and registered suppliers
Statewide, there are currently 85 alternative retail electricity suppliers (“ARES”) that have obtained ICC certification pursuant to Section 16-1151. This is down from 88 suppliers at the same time last year. Sixty ARES have obtained certification to serve residential and small commercial customers, which is up from 59 as of last year. Aside from receiving a certificate from the Commission, suppliers must also register with the electric utility and complete certain technical testing before they can start offering retail electric service in Illinois. Thirty-eight suppliers have completed the registration process with Ameren Illinois, compared to 39 at the same time last year. Thirty-six of those suppliers were actively selling electricity in the territory as of December 2014, which remains unchanged from December 2013. In Commonwealth Edison’s (“ComEd’s”) territory, 62 suppliers have completed the registration process, down from 68 suppliers last year. Sixty-one of those suppliers were actively selling electricity as of December 2014, compared to 62 as of December 2013. Four of the active suppliers are either electric utilities or affiliates of electric or natural gas utilities.
The following shows the number of active ARES from 2009 to the end of 2014 by utility service territory:2
1 Eleven of the 85 suppliers are certified to serve only themselves or their affiliates.
2 In order to maintain consistency with the reporting of previous years, the graph includes ARES providing power to themselves or their subsidiaries. Also, several suppliers operate in more than one utility service territory.

Office of Retail Market Development 2015 Annual Report
Section 20-110 of the Public Utilities Act
6
B. Non-residential customer switching
For the past few years, more than half of the total electric consumption of ComEd’s and Ameren Illinois’s customers had been provided by alternative retail electric suppliers. Two years ago marked the first time that approximately 80% of the total electric usage of ComEd customers as well as the customers of all three Ameren Illinois rate zones had been provided by retail electric suppliers. A year later, this percentage remained relatively unchanged. This year, it has decreased somewhat in all four utility areas. As a whole, the dip in percentage points is relatively small but the small commercial customer class saw some significant reductions in the amount of ARES-provided supply compared to a year ago. The amount of ARES-provided electric usage to the 0-100 kW customer class had crossed the 60% mark in both ComEd and Ameren Illinois’ territories for the first time two years ago and reached approximately 64% in May 2014. A year later, all four utility areas saw declines in that customer class, with the biggest drops in the three Ameren Rate Zones. The ARES-provided share of the small commercial customer usage in those areas dropped by about six percentage points. Given that some of the small commercial customers are included in governmental aggregation programs, this result is not surprising because several communities ended their programs during the last year.

Office of Retail Market Development 2015 Annual Report
Section 20-110 of the Public Utilities Act
7
The following provides detailed non-residential usage information for the four utility service areas.
1. ComEd
As of May 31, 2015, 79.5% of the total electric usage of ComEd’s customers was provided by alternative retail electric suppliers (down from 81% last year). Breaking it down further, about 62% of the electric usage of ComEd’s small commercial customers3 (down from 63% last year) and 78% of its medium commercial and industrial customers4 (up from 77% last year) was provided by ARES. For large customers5 it was 91% (up from 90% last year), and 96% of customers with a demand of over 1MW received service from an ARES (the same as last year). Together, about 86% (up slightly from last year) of all non-residential load was provided by alternative retail electric suppliers as of May 31, 2015. The following shows the electric usage provided by ARES for the various commercial and industrial customer classes for the past six years6.
3 Non-residential customers with demand up to 100kW.
4 Non-residential customers with demand between 100kW and 400kW.
5 Non-residential customers with demand between 400kW and 1MW.
6 Data as of May 31 of each year.
Office of Retail Market Development 2015 Annual Report
Section 20-110 of the Public Utilities Act
8
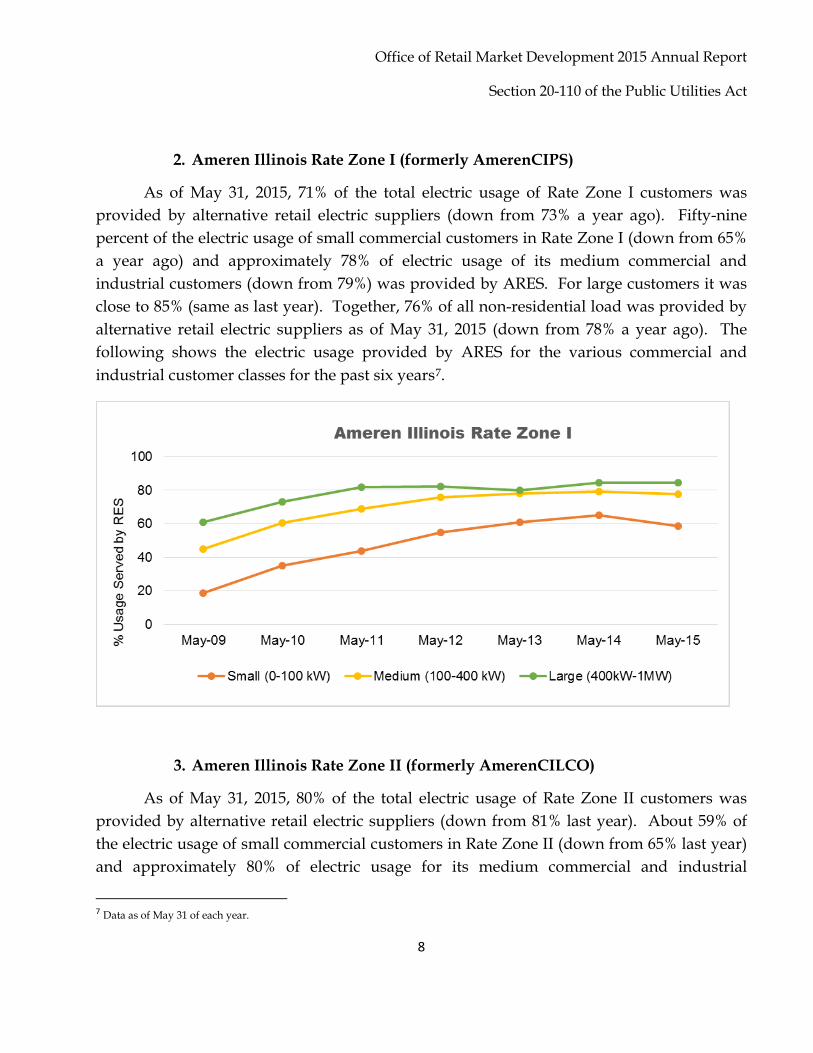
2. Ameren Illinois Rate Zone I (formerly AmerenCIPS)
As of May 31, 2015, 71% of the total electric usage of Rate Zone I customers was provided by alternative retail electric suppliers (down from 73% a year ago). Fifty-nine percent of the electric usage of small commercial customers in Rate Zone I (down from 65% a year ago) and approximately 78% of electric usage of its medium commercial and industrial customers (down from 79%) was provided by ARES. For large customers it was close to 85% (same as last year). Together, 76% of all non-residential load was provided by alternative retail electric suppliers as of May 31, 2015 (down from 78% a year ago). The following shows the electric usage provided by ARES for the various commercial and industrial customer classes for the past six years7.
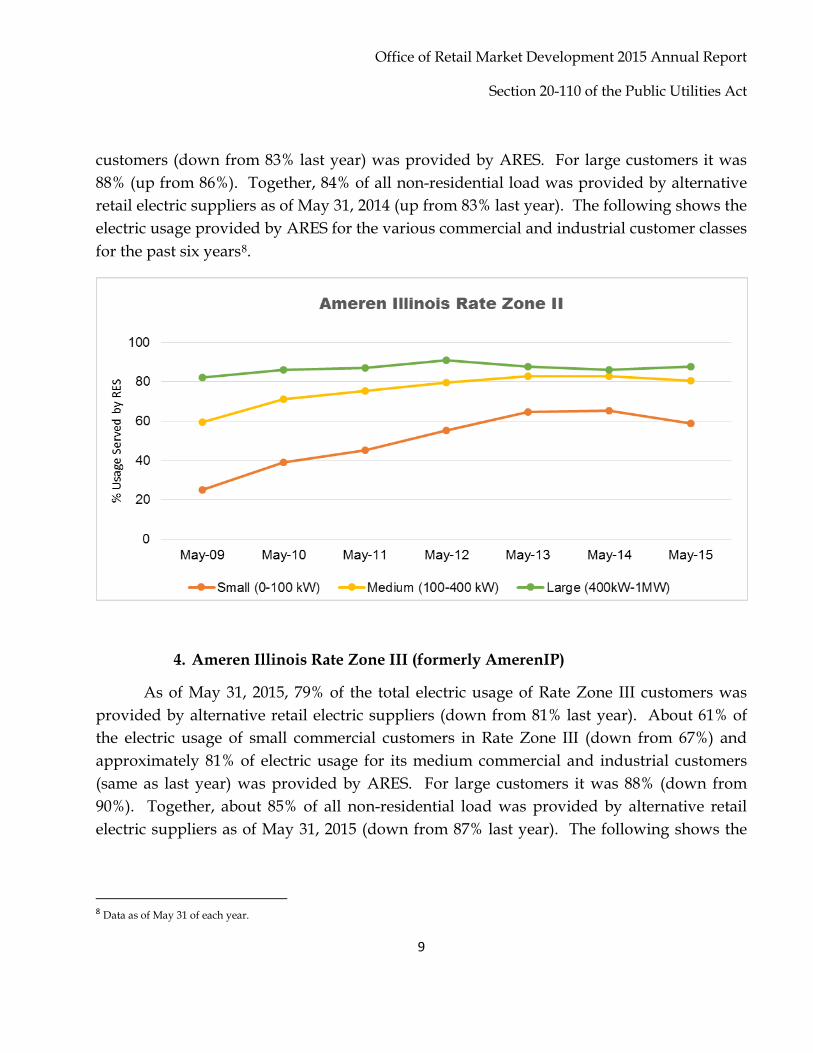
3. Ameren Illinois Rate Zone II (formerly AmerenCILCO)
As of May 31, 2015, 80% of the total electric usage of Rate Zone II customers was provided by alternative retail electric suppliers (down from 81% last year). About 59% of the electric usage of small commercial customers in Rate Zone II (down from 65% last year) and approximately 80% of electric usage for its medium commercial and industrial
7 Data as of May 31 of each year.
Office of Retail Market Development 2015 Annual Report
Section 20-110 of the Public Utilities Act
9
customers (down from 83% last year) was provided by ARES. For large customers it was 88% (up from 86%). Together, 84% of all non-residential load was provided by alternative retail electric suppliers as of May 31, 2014 (up from 83% last year). The following shows the electric usage provided by ARES for the various commercial and industrial customer classes for the past six years8.
4. Ameren Illinois Rate Zone III (formerly AmerenIP)
As of May 31, 2015, 79% of the total electric usage of Rate Zone III customers was provided by alternative retail electric suppliers (down from 81% last year). About 61% of the electric usage of small commercial customers in Rate Zone III (down from 67%) and approximately 81% of electric usage for its medium commercial and industrial customers (same as last year) was provided by ARES. For large customers it was 88% (down from 90%). Together, about 85% of all non-residential load was provided by alternative retail electric suppliers as of May 31, 2015 (down from 87% last year). The following shows the
8 Data as of May 31 of each year.

Office of Retail Market Development 2015 Annual Report
Section 20-110 of the Public Utilities Act
10
electric usage provided by ARES for the various commercial and industrial customer classes for the past six years9.
5. Comparing ARES-provided load
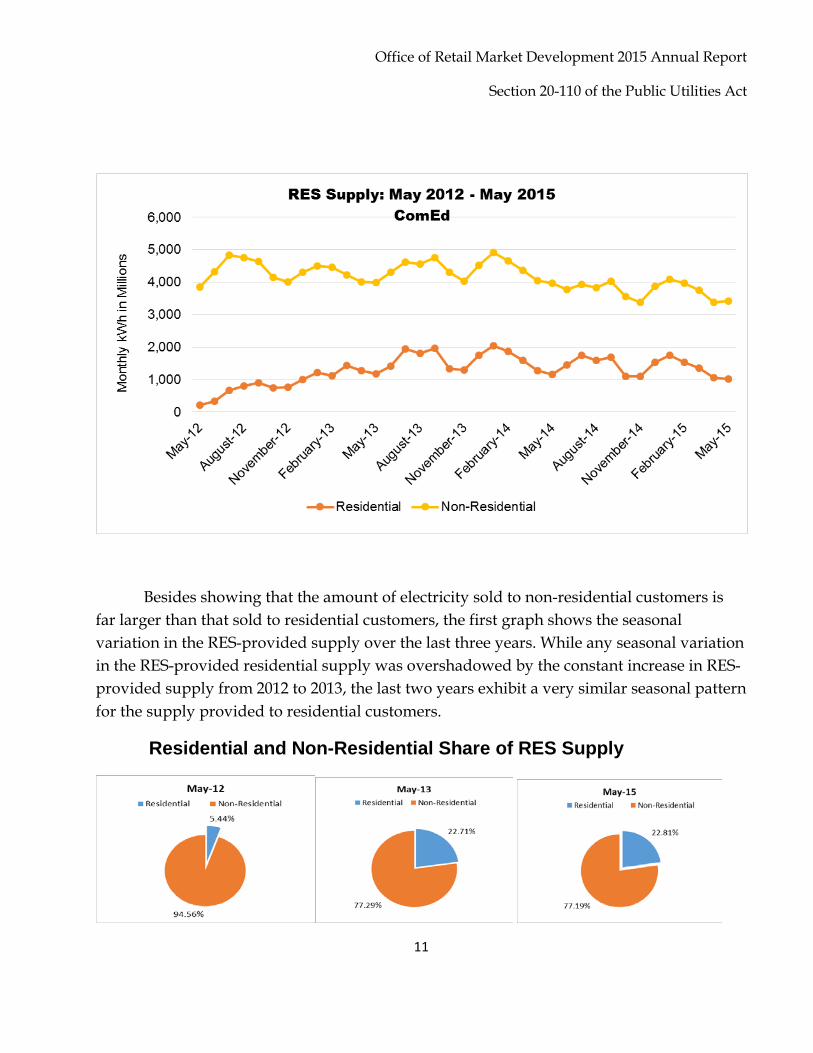
While the number of non-residential customers on competitive supply has been steadily, but slowly, increasing over the last few years, the number of residential ARES customers has gone from virtually zero in 2011 to more than 3 million in 2013. As a whole, competitive suppliers now have about ten times as many residential customers as they have non-residential ARES customers.
Of course, looking at the number of customers gives us only a portion of the overall picture. The following charts show that even the substantial increase in residential customers has not changed the fact that, as a whole, suppliers provide substantially more electricity to non-residential than to residential customers.
9 Data as of May 31 of each year.
Office of Retail Market Development 2015 Annual Report
Section 20-110 of the Public Utilities Act
11
Besides showing that the amount of electricity sold to non-residential customers is far larger than that sold to residential customers, the first graph shows the seasonal variation in the RES-provided supply over the last three years. While any seasonal variation in the RES-provided residential supply was overshadowed by the constant increase in RES-provided supply from 2012 to 2013, the last two years exhibit a very similar seasonal pattern for the supply provided to residential customers.
Residential and Non-Residential Share of RES Supply

Office of Retail Market Development 2015 Annual Report
Section 20-110 of the Public Utilities Act
12
In terms of monthly kilowatt hours, the active suppliers in ComEd’s service territory have been providing upwards of 4 billion kWh per month to their non-residential customers during the last few years. While the non-residential usage provided by the suppliers continues to be the lion share of RES-provided usage, the electricity provided to residential customers jumped from just over five percent to almost a quarter of the entire usage within one year (from 2012 to 2013). For the last two years, however, the share of the residential usage provided by retail electric suppliers has not changed very much.
C. Agents, Brokers and Consultants
One additional indicator of competitive activity is the steadily rising number of Agents, Brokers, and Consultants (“ABCs”) seeking a license pursuant to Section 16-115C of the Public Utilities Act (“PUA”). Over the last twelve months, an additional 38 ABCs received a license from the Commission, bringing the total to 347 licensed ABCs.
D. Supplier use of UCB/POR for non-residential customers
Sections 16-118 (c) and (d) require ComEd and Ameren Illinois to offer utility consolidated billing (“UCB”) and the purchase of receivables (“POR”). Under UCB, an ARES electronically submits its monthly customer charges for power and energy to the utility which then places those charges, along with its delivery charges, on one single bill to the customer. Under POR, an ARES is able to sell its receivables (the amount that customers owe to that ARES) to the utility at a discount. The POR requirement encourages alternative suppliers to offer their services to every utility customer rather than serve only those above certain credit thresholds, thereby furthering the statutory goal of an “effectively competitive retail electricity market that operates efficiently and benefits all Illinois consumers.”
While Sections 16-118(c) (POR) and 16-118(d) (UCB) appear to be separate and distinct requirements, the utilities have so far focused on an offering that would combine the purchase of receivables with the provision of utility consolidated billing. That is, if a supplier enrolls a customer with utility consolidated billing, the supplier then also has to sell the corresponding receivables to the utility at a discount. Because the POR provision in Section 16-118(c) is limited to customers with a demand of less than 400 kilowatts, this
Office of Retail Market Development 2015 Annual Report
Section 20-110 of the Public Utilities Act
13
combination of utility consolidated billing with the purchase of receivables is therefore also limited to customers with a demand of less than 400 kilowatts.
As of May 31, 2015, 22 suppliers were using Ameren’s UCB/POR service for residential customers (up from 21 a year earlier) and 21 suppliers were using UCB/POR for non-residential customers (up from 18 a year ago). As for ComEd, as of May 31, 2015, 48 suppliers were using ComEd’s UCB/POR service for residential customers (down from 49 at the time of this report last year) and the same number of suppliers were using UCB/POR service for non-residential customers (down from 49 last year).
While all suppliers are currently using UCB/POR for their residential customers, it is worth noting the widespread use of UCB/POR in the non-residential classes as well. By reviewing ComEd’s monthly data, we are able to compare the number of new UCB/POR customers in a particular customer class to the number of total new ARES customers for that customer class. Analyzing the June 2012 to May 2015 time period, it shows that suppliers are using UCB/POR for all non-residential customers for which it is available, meaning the Watt-Hour10, the 0-100kW, and the 100-400kW customer class. For the Watt-Hour class, the ratio of new UCB/POR customers to total new ARES customers has generally been around 100%, with the ratio being over 100% in some months. A monthly ratio exceeding 100% means that existing ARES customers have been converted to utility-consolidated billing during that month. For the 0-100kW class, the ratio of new UCB/POR customers to total new ARES customers has varied between 50% and 100%. Even for the 100-400kW class, usually considered medium-sized customers, a substantial percentage of ARES customers were UCB/POR customers. In May 2015, ARES have used UCB/POR for 56% of their Watt-Hour customers, for 68% of their 0-100kW customers, and for 19% of their 100-400kW customers.
E. Competitive Declarations
As of August 2007, Section 16-113(f) of the Act declared the provision of electric power and energy to retail customers of ComEd and Ameren Illinois with peak demands of at least 400 kilowatts to be a competitive service. The legislation resulted in ComEd’s 10 The Watt-Hour class consists of small commercial customers for which no metering equipment or only watt-hour metering equipment is installed at the customer's premises. Generally, a customer in this supply group uses less than 2,000 kWh during a monthly billing period.

Office of Retail Market Development 2015 Annual Report
Section 20-110 of the Public Utilities Act
14
discontinuation of providing fixed-price bundled service to those customers after the end of the May 2008 billing period. The law similarly provided that Ameren Illinois does not need to provide fixed-price bundled service to that class of customers after the end of the May 2010 billing period.
In addition, Section 16-113(g) gives both ComEd and Ameren Illinois the ability to declare the provision of power and energy to customers with peak demands of at least 100 kilowatts but less than 400 kilowatts to be competitive if certain conditions are met. In 2007, ComEd filed a petition for competitive declaration and the Commission found that ComEd had satisfied the statutory requirements and therefore the provision of power and energy to those customers has been declared competitive as of November 200711. As a result of the competitive declaration, after the end of the May 2010 billing period, all customers in the 100-400kW class, with the exception of some statutorily exempted condominium associations, are taking supply service from the utility on an hourly-pricing basis or they are receiving service from an alternative retail electric supplier.
In March 2011, Ameren Illinois filed a petition for competitive declaration of its customers with peak demands above 150 kilowatts but less than 400 kilowatts12. Ameren’s petition stated that 67% of its customers with peak demands between 150 and 400 kilowatts were currently being served by an ARES. The Commission approved Ameren’s petition, with the competitive declaration to be effective on May 1, 2011. Customers in this class continued to receive fixed-price bundled utility service until May 2014 unless they had elected to receive service from a retail electric supplier before that date. At this point in time, the only non-residential customers still receiving a fixed-price supply service from the utility are ComEd customers with demand below 100kW and AIU customers with demand below 150kW. All other non-residential customers receive their power from a competitive supplier or they are on the utility’s hourly-pricing option.
11 ICC Docket No. 07-0478.
12ICC Docket No. 11-0192.
Office of Retail Market Development 2015 Annual Report
Section 20-110 of the Public Utilities Act
15
F. Non-residential market concentration
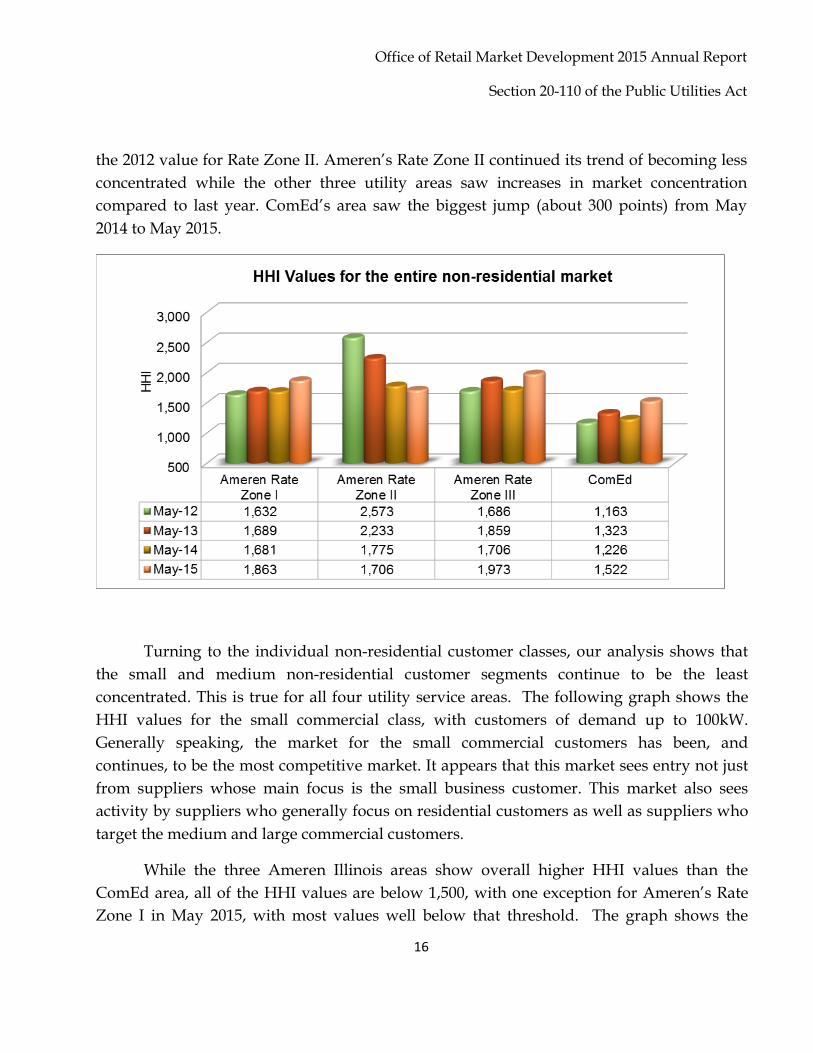
Similar to the last five annual reports, this year’s report again analyzes the non-residential market shares of the individual ARES by looking at the share of electric usage provided by an ARES instead of the share of customers served by individual ARES. We believe either approach would be informative but we assume the amount of kWh served might be more closely related to an ARES’ financial success than the number of customers it serves. In addition, when calculating market shares based on customer counts, we did not find significant differences from the values derived from using ARES-provided usage. We again used the Herfindahl-Hirschmann index, or HHI, which is a common indicator to measure competition among firms in a defined market. In order to put the resulting numbers into perspective, we looked at the revised 2010 Horizontal Merger Guidelines by the Department of Justice (“DOJ”) and the Federal Trade Commission (“FTC”), which divide the spectrum of market concentration into three regions. Generally speaking, the revised guidelines state that the DOJ and the FTC view a market with an HHI below 1,500 as unconcentrated (meaning many similarly sized firms compete for the same customers), a market with an HHI between 1,500 and 2,500 as moderately concentrated, and a market with an HHI above 2,500 as highly concentrated (very few firms dominating the market).
For this exercise, we again excluded retail electric suppliers that provide electric supply only to themselves or their subsidiaries or affiliates. We also need to emphasize that the numbers below reflect only the segment of the non-residential market that has already switched to a competitive supplier. In other words, the market concentration analysis shown here does not include the customers on utility fixed-price service (where available) or utility-provided hourly service.
The first graph shows the HHI values for the total non-residential market among the four utility service areas. While it is unreasonable to assume that all non-residential customer classes are considered to be part of the same market, the overall HHI values shown here display the trend in market concentration from May 2012 to May 2015. The values also allow a relative comparison among the utility service territories. As the graph shows, the ComEd non-residential market is generally less concentrated (meaning more suppliers with customers) than the three Ameren Illinois markets. It also shows that ComEd’s total non-residential market has been unconcentrated for three of the four years shown here and was moderately concentrated in May 2015. Ameren Illinois’s Rate Zones are generally in the moderately concentrated range of 1,500 to 2,500, with the exception of
Office of Retail Market Development 2015 Annual Report
Section 20-110 of the Public Utilities Act
16
the 2012 value for Rate Zone II. Ameren’s Rate Zone II continued its trend of becoming less concentrated while the other three utility areas saw increases in market concentration compared to last year. ComEd’s area saw the biggest jump (about 300 points) from May 2014 to May 2015.
Turning to the individual non-residential customer classes, our analysis shows that the small and medium non-residential customer segments continue to be the least concentrated. This is true for all four utility service areas. The following graph shows the HHI values for the small commercial class, with customers of demand up to 100kW. Generally speaking, the market for the small commercial customers has been, and continues, to be the most competitive market. It appears that this market sees entry not just from suppliers whose main focus is the small business customer. This market also sees activity by suppliers who generally focus on residential customers as well as suppliers who target the medium and large commercial customers.
While the three Ameren Illinois areas show overall higher HHI values than the ComEd area, all of the HHI values are below 1,500, with one exception for Ameren’s Rate Zone I in May 2015, with most values well below that threshold. The graph shows the

Office of Retail Market Development 2015 Annual Report
Section 20-110 of the Public Utilities Act
17
values for the month of May for the past seven years and it shows that the concentration has increased since last year for all four utility areas. ComEd’s market saw the biggest increase, which is partially explained by the recent Constellation/Integrys merger.
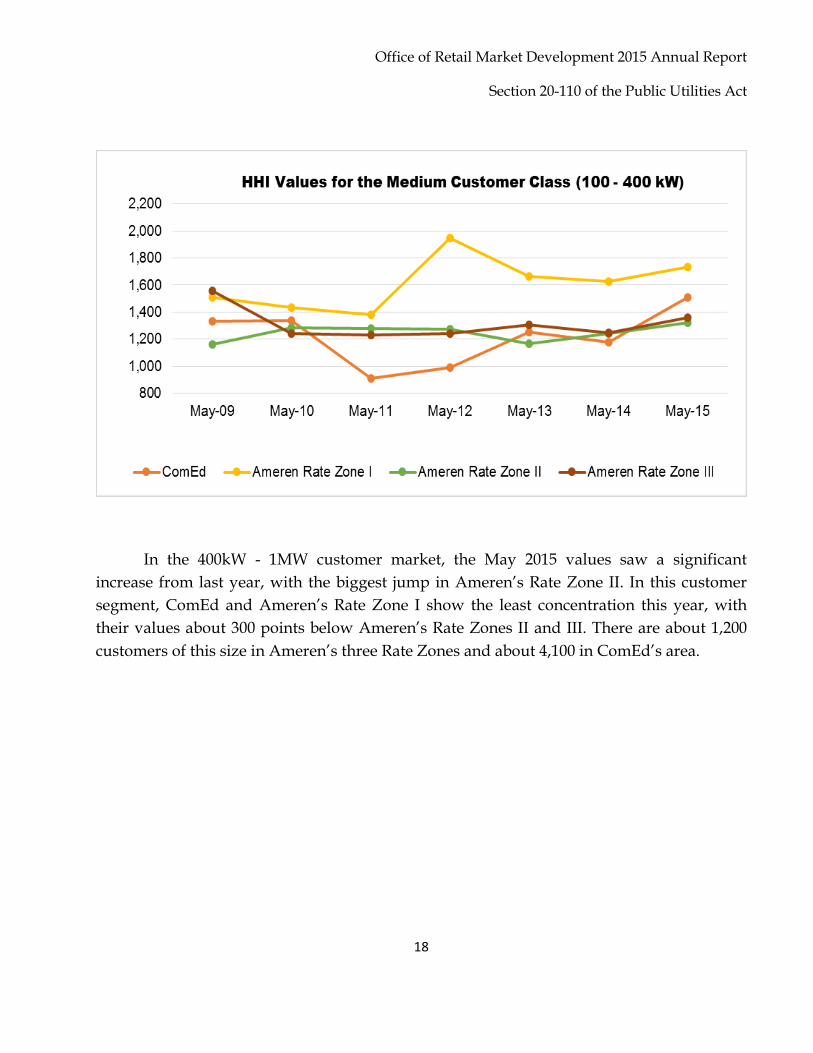
The next larger commercial customer segment (customers with demand between 100 and 400kW) generally shows HHI values in the 1,100 to 1,700 range for the last three years. While the ComEd market has usually been less concentrated than the Ameren markets, the May 2015 HHI values are higher for ComEd than for Ameren Rate Zones II and III. The graph below also shows that all four markets saw an increase in concentration compared to last year, with the biggest increase in ComEd’s market. However, Ameren’s Rate Zone I continues to exhibit the largest market concentration in this particular non-residential customer segment.
Office of Retail Market Development 2015 Annual Report
Section 20-110 of the Public Utilities Act
18
In the 400kW - 1MW customer market, the May 2015 values saw a significant increase from last year, with the biggest jump in Ameren’s Rate Zone II. In this customer segment, ComEd and Ameren’s Rate Zone I show the least concentration this year, with their values about 300 points below Ameren’s Rate Zones II and III. There are about 1,200 customers of this size in Ameren’s three Rate Zones and about 4,100 in ComEd’s area.

Office of Retail Market Development 2015 Annual Report
Section 20-110 of the Public Utilities Act
19
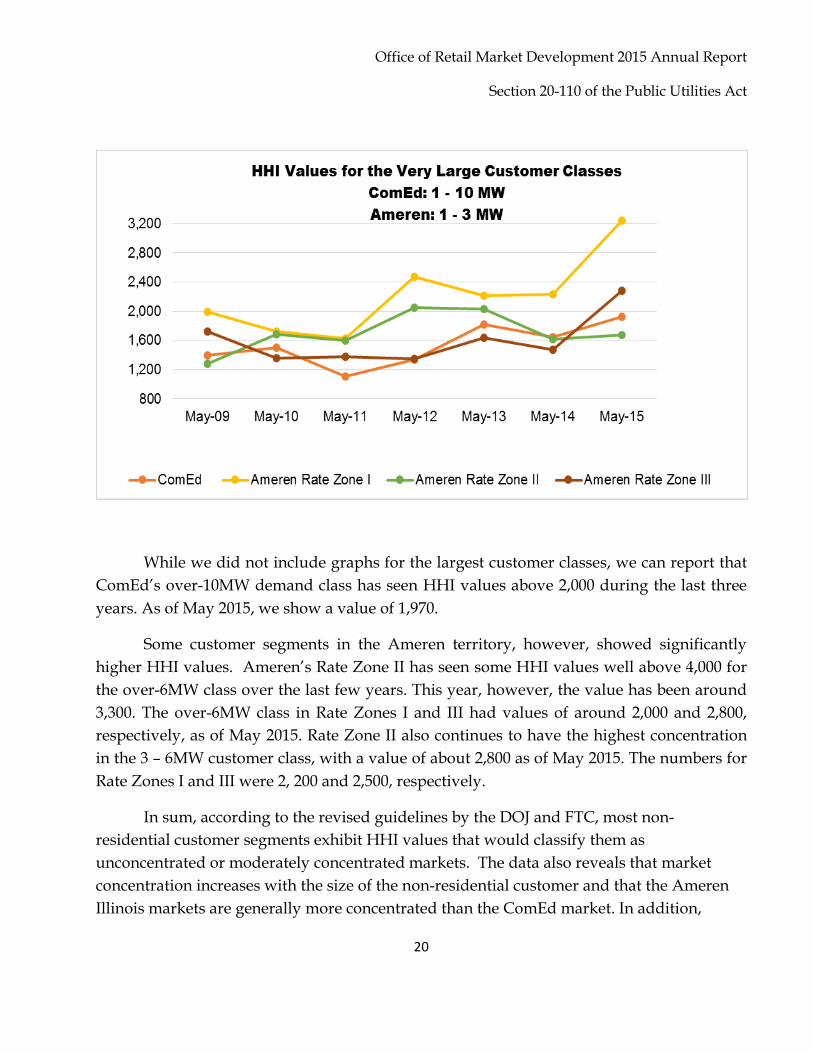
The market for the very large commercial and industrial customers is generally exhibiting the highest non-residential HHI values. The following graph is different from the three previous graphs because the customer sizes are not uniform among the utility areas. ComEd reports switching activity for the 1 – 10MW class, while Ameren reports for the 1 – 3MW, the 3 – 6MW, and the over-6MW classes. As a result, the HHI values are not necessarily comparable among the four utility areas but they show some trends nonetheless. The graph shows that even in ComEd’s area, the HHI value is close to 2,000, which is significantly higher than it is for markets with smaller-sized customers. The graph also shows that Rate Zone III shows by far the highest market concentration in Ameren’s areas. In addition, Ameren’s Rate Zones I and III have seen the sharpest increase in HHI values over the last year.
Office of Retail Market Development 2015 Annual Report
Section 20-110 of the Public Utilities Act
20
While we did not include graphs for the largest customer classes, we can report that ComEd’s over-10MW demand class has seen HHI values above 2,000 during the last three years. As of May 2015, we show a value of 1,970.
Some customer segments in the Ameren territory, however, showed significantly higher HHI values. Ameren’s Rate Zone II has seen some HHI values well above 4,000 for the over-6MW class over the last few years. This year, however, the value has been around 3,300. The over-6MW class in Rate Zones I and III had values of around 2,000 and 2,800, respectively, as of May 2015. Rate Zone II also continues to have the highest concentration in the 3 – 6MW customer class, with a value of about 2,800 as of May 2015. The numbers for Rate Zones I and III were 2, 200 and 2,500, respectively.
In sum, according to the revised guidelines by the DOJ and FTC, most non-residential customer segments exhibit HHI values that would classify them as unconcentrated or moderately concentrated markets. The data also reveals that market concentration increases with the size of the non-residential customer and that the Ameren Illinois markets are generally more concentrated than the ComEd market. In addition,
Office of Retail Market Development 2015 Annual Report
Section 20-110 of the Public Utilities Act
21
almost all markets saw an increase in concentration compared to last year, with some increases relatively large.
G. Residential activity
With several communities deciding to end their aggregation programs, overall residential switching levels have declined compared to last year. However, the number of residential customers receiving ARES service outside of an aggregation program has actually increased in the last year.
As we did in last year’s report, we will attempt to capture the residential activity by looking at four different indicators. We start by looking at the number of residential customers switching away from the utility supply service over the previous twelve months and for each of the four utility areas. We will then look at the increase in the number of certified and active suppliers and the number and types of residential offers that those suppliers have posted on our website, PlugInIllinois.org. Third, we will provide a market-share analysis of the residential ComEd market over the last twelve months. Lastly, we provide an estimate of savings (in dollars) realized by the residential customers that have been on ARES service during the last year.
1. Customer switching
For the first time since residential switching began in 2011, the number of residential customers receiving supply from an ARES decreased year-over-year. As of the end of May 2015, about 2.7 million residential customers have been on ARES service, compared to over 3 million customers a year earlier. In fact, even compared to May 2013, the number of residential ARES customers has gone down. The following table shows the number, as well as the percentage, of residential customers who are receiving supply from a competitive supplier.

Office of Retail Market Development 2015 Annual Report
Section 20-110 of the Public Utilities Act
22
Residential Customers on Competitive Supply
31-Mar-11 May 2011 May 2012 May 2013 May 2014 May 2015
Ameren Illinois Rate Zone I:
78 28,459 147,513 185,251 172,449
Ameren Illinois Rate Zone II:
23 12,752 138,163 140,439 129,211
Ameren Illinois Rate Zone III:
72 47,124 277,229 345,911 308,554
ComEd: 21,276 406,144 2,312,654 2,356,669 2,126,674
Total: 21,449 494,479 2,875,559 3,028,270 2,736,888
Ameren Illinois Rate Zone I:
0.02% 8.7% 45.2% 63.9% 53.0%
Ameren Illinois Rate Zone II:
0.01% 6.8% 73.2% 74.5% 68.5%
Ameren Illinois Rate Zone III:
0.01% 8.7% 51.2% 63.9% 56.9%
ComEd: 0.63% 11.9% 67.7% 68.5% 61.5%
The table shows that the biggest percentage drop occurred in Ameren Illinois Rate Zone I while the biggest drop in absolute customer numbers occurred in ComEd’s area. While all four utility areas saw a decline compared to 2014, two of the areas (Ameren Illinois Rate Zone II and ComEd) also saw a decline compared to 2013. The total number of Ameren Illinois’ residential customers on competitive supply decreased from 671,601 in May 2014 to 610,214 as of May 2015, a drop of about 61,000 customers. The number of residential ARES customers in ComEd’s service area (which has more than three times as many residential customers as Ameren Illinois’ areas) decreased by about 230,000 in the same time period.
Office of Retail Market Development 2015 Annual Report
Section 20-110 of the Public Utilities Act
23
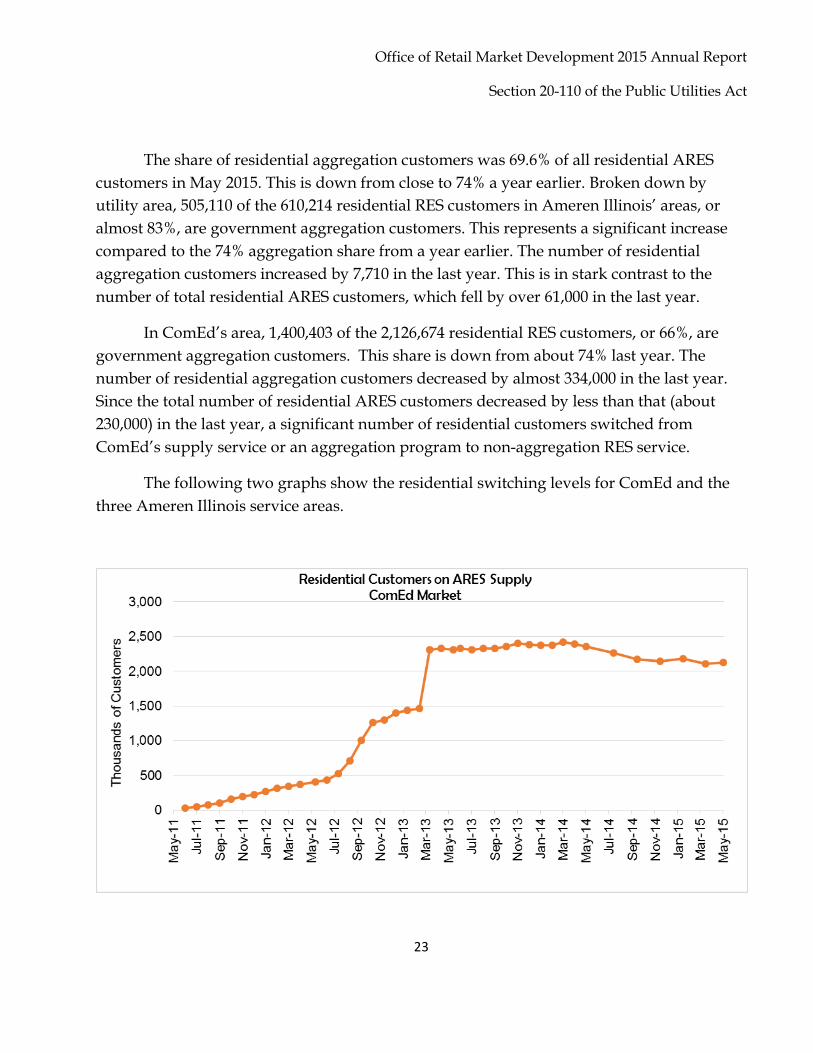
The share of residential aggregation customers was 69.6% of all residential ARES customers in May 2015. This is down from close to 74% a year earlier. Broken down by utility area, 505,110 of the 610,214 residential RES customers in Ameren Illinois’ areas, or almost 83%, are government aggregation customers. This represents a significant increase compared to the 74% aggregation share from a year earlier. The number of residential aggregation customers increased by 7,710 in the last year. This is in stark contrast to the number of total residential ARES customers, which fell by over 61,000 in the last year.
In ComEd’s area, 1,400,403 of the 2,126,674 residential RES customers, or 66%, are government aggregation customers. This share is down from about 74% last year. The number of residential aggregation customers decreased by almost 334,000 in the last year. Since the total number of residential ARES customers decreased by less than that (about 230,000) in the last year, a significant number of residential customers switched from ComEd’s supply service or an aggregation program to non-aggregation RES service.
The following two graphs show the residential switching levels for ComEd and the three Ameren Illinois service areas.
Office of Retail Market Development 2015 Annual Report
Section 20-110 of the Public Utilities Act
24
The graph show the spikes in switching following government aggregation initiatives, most notably the mass switching of the City of Chicago aggregation customers in early 2013. The City of Chicago announced that it is not continuing its aggregation program beyond August 2015. Unless a large portion of the aggregation customers switches to an ARES before then, next year’s report will show a sudden decline in the number of residential ASES customers. The graph also shows that the peak (so far) of residential ARES customers occurred in March 2014. At that time, more than 2.4 million residential customers, or 70% of ComEd’s total residential customers, received electric service from an ARES.
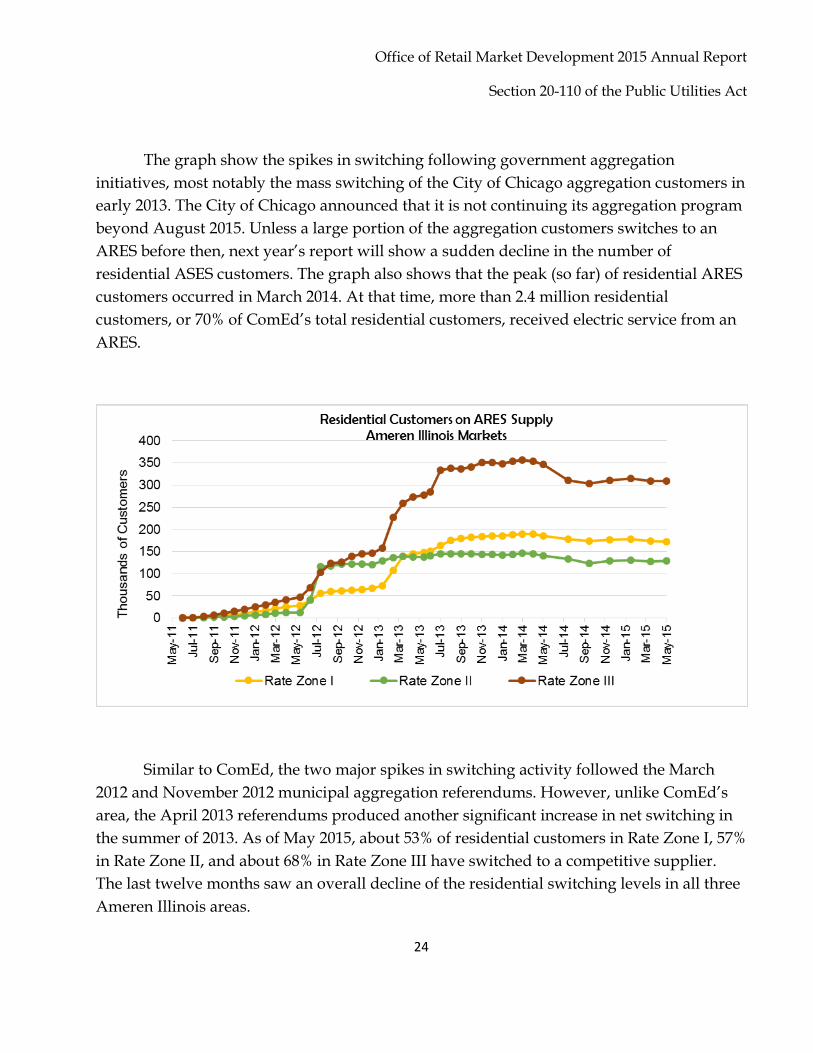
Similar to ComEd, the two major spikes in switching activity followed the March 2012 and November 2012 municipal aggregation referendums. However, unlike ComEd’s area, the April 2013 referendums produced another significant increase in net switching in the summer of 2013. As of May 2015, about 53% of residential customers in Rate Zone I, 57% in Rate Zone II, and about 68% in Rate Zone III have switched to a competitive supplier. The last twelve months saw an overall decline of the residential switching levels in all three Ameren Illinois areas.

Office of Retail Market Development 2015 Annual Report
Section 20-110 of the Public Utilities Act
25
2. Municipal/Government Aggregation
Effective January 1, 2010, Public Act 96-0176 amended the Illinois Power Agency Act (“IPA Act”) by allowing municipalities and counties to adopt an ordinance under which it may aggregate electrical load. Specifically, it allows municipal corporate authorities or county boards to adopt an ordinance under which it may aggregate residential and small commercial retail electrical loads located within their jurisdiction and solicit bids to enter service agreements for the sale and purchase of electricity and related services and equipment.
The law requires the corporate authorities of a municipality, township, or county board to submit a referendum to its residents to determine whether or not the aggregation program shall operate as an opt-out program for residential and small commercial customers prior to the adoption of an ordinance for the aggregation of these loads.
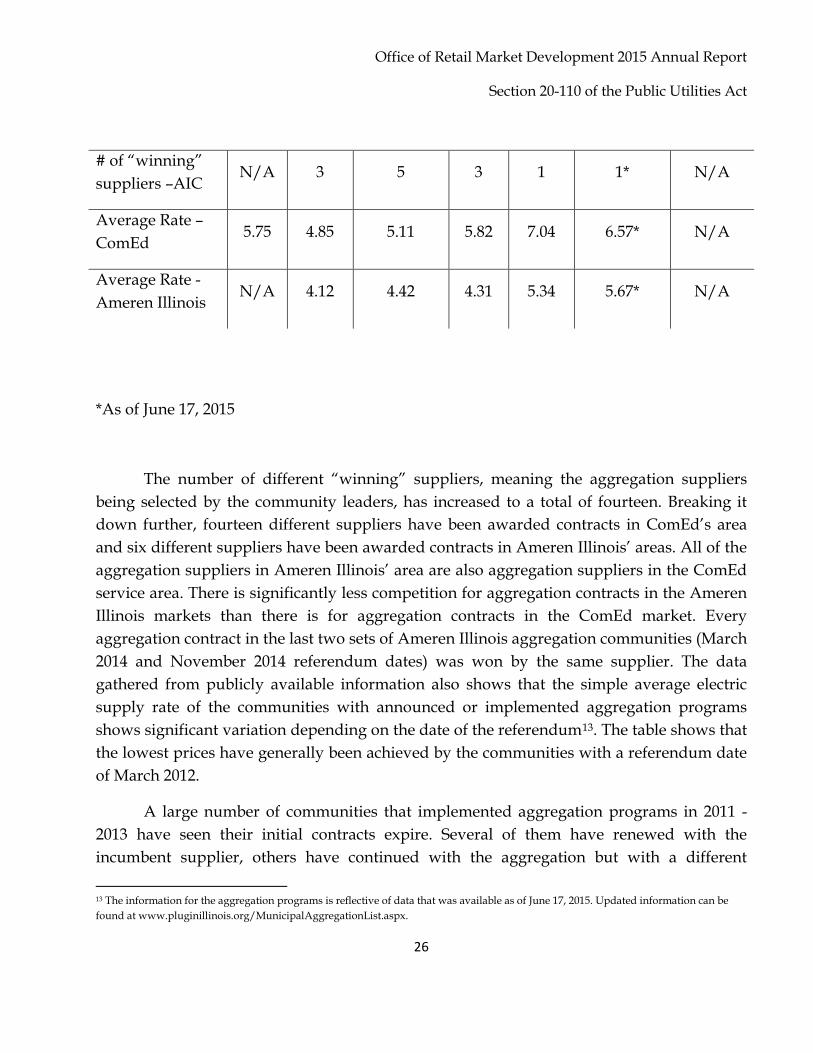
The November 2014 general election date saw another 12 (albeit generally small) communities pass an opt-out aggregation referendum with 2 more passing in the February 2015 consolidated election, bringing the statewide total to 743. As of the end of June 2015, 121 communities have let their aggregation programs expire. The following table compares the municipal aggregation activity over the various election dates:
April 2011
March 2012
November 2012
April 2013
March 2014
November 2014
February 2015
Referendums Passed
20 246 207 204 52 12 2
Aggregation Programs Announced or Implemented
19 244 192 187 48 6* 0*
# of “winning” suppliers –ComEd
4 8 8 7 7 4* N/A
Office of Retail Market Development 2015 Annual Report
Section 20-110 of the Public Utilities Act
26
*As of June 17, 2015
The number of different “winning” suppliers, meaning the aggregation suppliers
being selected by the community leaders, has increased to a total of fourteen. Breaking it down further, fourteen different suppliers have been awarded contracts in ComEd’s area and six different suppliers have been awarded contracts in Ameren Illinois’ areas. All of the aggregation suppliers in Ameren Illinois’ area are also aggregation suppliers in the ComEd service area. There is significantly less competition for aggregation contracts in the Ameren Illinois markets than there is for aggregation contracts in the ComEd market. Every aggregation contract in the last two sets of Ameren Illinois aggregation communities (March 2014 and November 2014 referendum dates) was won by the same supplier. The data gathered from publicly available information also shows that the simple average electric supply rate of the communities with announced or implemented aggregation programs shows significant variation depending on the date of the referendum13. The table shows that the lowest prices have generally been achieved by the communities with a referendum date of March 2012.
A large number of communities that implemented aggregation programs in 2011 -2013 have seen their initial contracts expire. Several of them have renewed with the incumbent supplier, others have continued with the aggregation but with a different
13 The information for the aggregation programs is reflective of data that was available as of June 17, 2015. Updated information can be found at www.pluginillinois.org/MunicipalAggregationList.aspx.
# of “winning” suppliers –AIC
N/A 3 5 3 1 1* N/A
Average Rate – ComEd
5.75 4.85 5.11 5.82 7.04 6.57* N/A
Average Rate - Ameren Illinois
N/A 4.12 4.42 4.31 5.34 5.67* N/A

Office of Retail Market Development 2015 Annual Report
Section 20-110 of the Public Utilities Act
27
supplier and 121 of them (as of June 17, 2015) have allowed the aggregation program to expire.
3. Residential Savings Estimate
The last three annual reports included an estimate of the total annual savings realized by residential RES customers in ComEd’s service area. We looked at the preceding 12-month period and we compared the amount residential customers as a whole spent on RES service to the amount those customers would have spent had they stayed on ComEd’s fixed-price bundled service. For the first two we performed this analysis, we took into account the fact that some customers switched away from the discounted utility space-heat rate. As of June 2013, there are no separate utility supply rates for residential customers with electric space heat. In every year, we calculated the savings with and without the effects of the Purchased Electricity Adjustment (“PEA”)14.
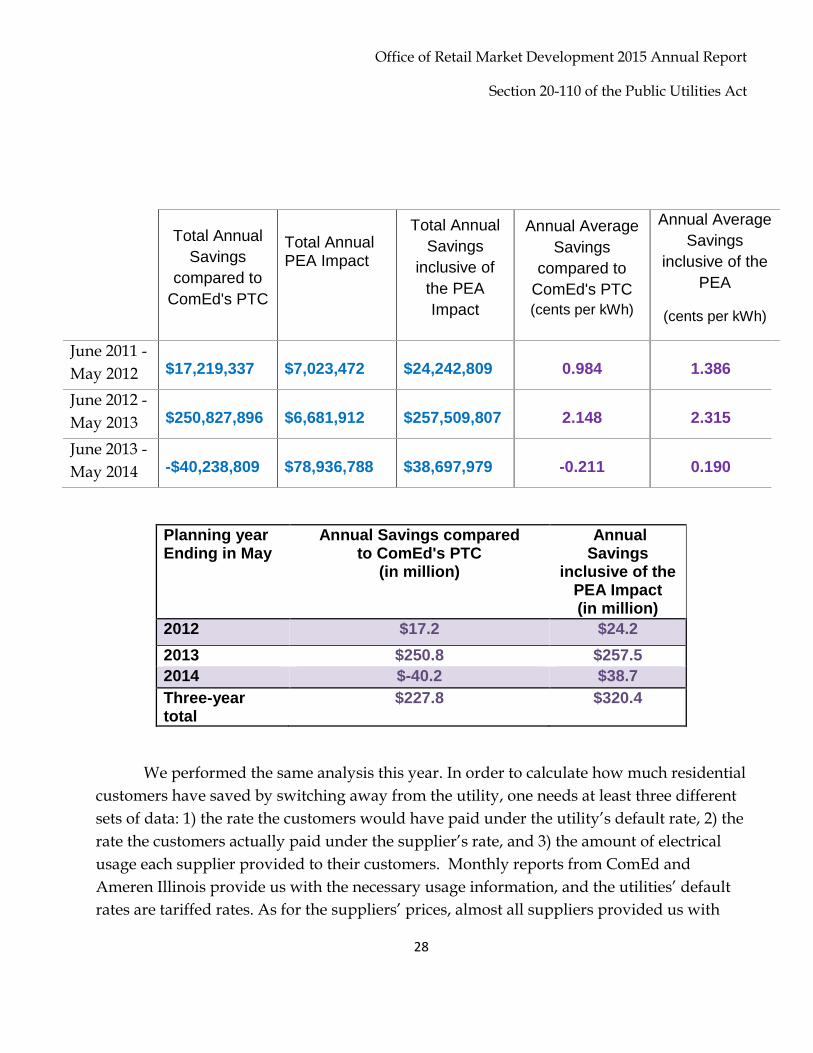
The following tables show the results from the first three years we performed this analysis (June 2011 through May 2014). It shows aggregate residential savings of around $320 million, with about $228 million resulting from comparing the suppliers’ average rate to ComEd’s Price-to-Compare (“PTC”). The ComEd PTC is comprised of the Electric Supply Charge and the PJM Transmission Services Charge. The remaining $92 million in savings result from the application of the PEA for ComEd supply customers.
14 The PEA is a monthly fluctuating true-up mechanism for the utility, matching incurred supply costs to actual received supply revenues. The PEA is therefore a credit in some months and a charge in others.
Office of Retail Market Development 2015 Annual Report
Section 20-110 of the Public Utilities Act
28
Planning year Ending in May
Annual Savings compared to ComEd's PTC
(in million)
Annual Savings
inclusive of the PEA Impact (in million)
2012 $17.2 $24.2 2013 $250.8 $257.5 2014 $-40.2 $38.7 Three-year total
$227.8 $320.4
We performed the same analysis this year. In order to calculate how much residential customers have saved by switching away from the utility, one needs at least three different sets of data: 1) the rate the customers would have paid under the utility’s default rate, 2) the rate the customers actually paid under the supplier’s rate, and 3) the amount of electrical usage each supplier provided to their customers. Monthly reports from ComEd and Ameren Illinois provide us with the necessary usage information, and the utilities’ default rates are tariffed rates. As for the suppliers’ prices, almost all suppliers provided us with
Total Annual
Savings compared to
ComEd's PTC
Total Annual PEA Impact
Total Annual Savings
inclusive of the PEA Impact
Annual Average Savings
compared to ComEd's PTC (cents per kWh)
Annual Average Savings
inclusive of the PEA
(cents per kWh)
June 2011 - May 2012
$17,219,337
$7,023,472
$24,242,809
0.984
1.386
June 2012 - May 2013
$250,827,896
$6,681,912
$257,509,807
2.148
2.315
June 2013 - May 2014
-$40,238,809
$78,936,788
$38,697,979
-0.211
0.190
Office of Retail Market Development 2015 Annual Report
Section 20-110 of the Public Utilities Act
29
monthly average residential rates for the past twelve months in response to a Staff Data Request. Also, we decided again to limit this savings estimate to residential customers in the ComEd area. Now that Ameren Illinois’s residential rate structure is more streamlined and does not require us to make average usage assumptions, we intend to perform a similar analysis for Ameren Illinois’ residential customers for next year’s report.
It is important to keep in mind that these are total, or aggregate, savings and that the savings for individual customers differ from these averages. In addition, these calculations are ex-post calculations and do not take into account how ComEd’s default rates would have been different had more customers stayed on the utility’s default supply service. Also, not captured in these numbers are rewards and incentives that are not part of the suppliers’ electric supply rates. For example, several suppliers offer one-time gift cards as an incentive to sign up for a particular offer and other offers contain rewards such as airline miles and other non-rate benefits. In addition, not every customer saved money during the relevant time periods. However, as there are probably a variety of reasons residential customers switch from a utility’s default supply service to a supplier’s offering, it is likely that the opportunity to save money is a primary reason for many residential customers.
The following table shows the monthly comparisons for the most recent 12-month period:

Office of Retail Market Development 2015 Annual Report
Section 20-110 of the Public Utilities Act
30
June 2014 to May 2015
Monthly Savings
compared to ComEd's PTC
Monthly PEA Impact
Monthly Savings
inclusive of the PEA Impact
Monthly Average Savings
compared to ComEd's
PTC (in cents per kWh)
Monthly Average Savings inclusive
of the PEA (in cents per kWh)
Jun-14 $11,213,839 -$7,124,687 $4,089,153 0.787 0.287 Jul-14 $12,176,573 -$8,642,635 $3,533,938 0.704 0.204 Aug-14 $6,159,135 -$7,888,595 -$1,729,460 0.390 -0.110 Sep-14 $3,424,591 -$6,042,507 -$2,617,916 0.205 -0.156 Oct-14 -$5,054,265 -$5,505,145 -$10,559,410 -0.459 -0.959 Nov-14 -$6,228,769 -$5,455,623 -$11,684,392 -0.571 -1.071 Dec-14 -$6,050,066 -$7,648,941 -$13,699,006 -0.395 -0.895 Jan-15 -$4,137,482 -$8,685,276 -$12,822,759 -0.238 -0.738 Feb-15 -$4,998,851 -$7,637,487 -$12,636,338 -0.327 -0.827 Mar-15 -$5,946,196 -$6,591,105 -$12,537,301 -0.451 -0.951 Apr-15 -$6,777,916 $5,182,729 -$1,595,187 -0.654 -0.154 May-15 -$6,118,772 $4,937,478 -$1,181,294 -0.620 -0.120 Totals -$12,338,179 -$61,101,792 -$73,439,971
Average -$1,028,181 -$5,091,816 -$6,119,997 -0.081 -0.446
It shows that, on average, residential RES customers saved during the utility’s four-month summer period when compared to ComEd’s PTC. Taking into account the PEA credit, the average residential RES customer saved only during the months of June and July. The “monthly PEA impact” column highlights the huge effect of the variable PEA for residential customers. During the period that ended in May 2014, the mostly positive PEA (meaning a charge on the utility’s supply customer’s bill) turned a negative comparison against ComEd’s PTC into an effective average savings estimate for RES customers. For the period that ended in May 2015, however, the mostly negative PEA (meaning a credit on the utility’s supply customer’s bill) turned a slightly negative comparison against ComEd’s PTC into a much larger negative comparison against the utility’s default charges.
Taking the most recent 12-month period into account, the four-year tables look as follows:

Office of Retail Market Development 2015 Annual Report
Section 20-110 of the Public Utilities Act
31
Looking at this from a cents/kWh perspective, the average savings per kWh was close to 1 cent when compared to ComEd’s Price-to-Compare and close to 1.4 cent when taking into account the Purchased Electricity Adjustment for the June 2011 through May 2012 period. For the June 2012 through May 2013 period, the average savings per kWh was about 2.1 cent when compared to ComEd’s PTC and about 2.3 cent when taking into account the PEA. For the June 2013 through May 2014 period, the average RES rate was
Total Annual
Savings compared to
ComEd's PTC
Total Annual PEA Impact
Total Annual Savings
inclusive of the PEA Impact
Annual Average Savings
compared to ComEd's PTC (cents per kWh)
Annual Average Savings
inclusive of the PEA
(cents per kWh)
June 2011 - May 2012
$17,219,337
$7,023,472
$24,242,809
0.984
1.386
June 2012 - May 2013
$250,827,896
$6,681,912
$257,509,807
2.148
2.315
June 2013 - May 2014
-$40,238,809
$78,936,788
$38,697,979
-0.211
0.190
June 2014 - May 2015
-$12,338,179
-$61,101,792
-$73,439,971
-0.081
-0.446
Planning year Ending in May
Annual Savings compared to ComEd's PTC
(in million)
Annual Savings inclusive of the
PEA Impact (in million)
2012 $17.2 $24.2 2013 $250.8 $257.5 2014 -$40.2 $38.7 2015 -$12.3 -$73.4 Four-year total $215.5 $247

Office of Retail Market Development 2015 Annual Report
Section 20-110 of the Public Utilities Act
32
about 0.2 cent above ComEd’s PTC and 0.19 cent below ComEd’s supply rate when taking into account the PEA. Finally, for the June 2014 through May 2015 period, the average RES rate was about 0.08 cent above ComEd’s PTC and 0.45 cent above ComEd’s supply rate when taking into account the PEA.
Reviewing the tables above shows that, on average, a RES customer consuming 500 kWh/month saved approximately $139 for the year during the planning year that ended in May 2013. The same average RES customer saved just over $11 during the planning year that ended in May 2014 and paid $27 more during the planning year that ended in May 2015. An average RES customer using 1,200 kWh/month during the planning year that ended in May 2013 saved around $333 while saving just over $27 during the planning year that ended in May 2014 and paying $64 more during the planning year that ended in May 2015. Again, these are averages and almost all customers are either below or above the average.
4. Active suppliers
Having looked at the customer switching numbers, the following table shows the increase in residential supplier activity over the last four years.
Residential Suppliers
May 2011 May 2012 May 2013 May 2014 May 2015 ComEd – ICC certified 22 40 57 61 60
ComEd -- active 8 27 42 51 48 Ameren IL – ICC certified 16 26 33 36 34
Ameren IL -- active 3 10 17 23 22

Office of Retail Market Development 2015 Annual Report
Section 20-110 of the Public Utilities Act
33
The table above shows that the number of certified and active suppliers has gone down for the first time year-over-year. For the last two years, the number of active residential suppliers in the ComEd market has been about twice the number of active suppliers in the Ameren Illinois market. It also continues to be true that all suppliers that have residential customers in the Ameren Illinois areas also have residential customers in the ComEd area.
An additional indicator of supplier activity is the number of residential offers posted on PlugInIllinois.org. The “Compare Offers Now” portion of the website went live in 2011 and has seen a steady stream of additional suppliers and residential offers since that date. The tables below show that the number of suppliers as well as the number of offers by these suppliers continues to increase. Most of the activity has been in the ComEd area but customers of Ameren Illinois are able to choose from a host of residential offers as well.
Residential Suppliers Posting on PlugInIllinois.org
Utility Area # of Suppliers posting in July 2011
# of Suppliers posting in May 2012
# of Suppliers posting in April 2013
# of Suppliers posting in April 2014
# of Suppliers posting in April 2015
ComEd -- Total 9 20 28 29 30 Ameren IL – Total 3 6 10 11 10
Residential Offers Posted on PlugInIllinois.org
Utility Area # Offers in July 2011
# Offers in May 2012
# Offers April 2013
# Offers April 2014
# Offers April 2015
ComEd - Total 31 61 63 59 75
Ameren IL - Total 3 11 20 22 24
Office of Retail Market Development 2015 Annual Report
Section 20-110 of the Public Utilities Act
34
Given the large number of residential offers for ComEd customers, we will take a closer look at the type of offers posted so far. The following table compares the type of offers posted in July 2011, May 2012, April 2013, April 2014, and April 2015.
Type of Residential Offer
# of Offers in July 2011
# of Offers in May 2012
# of Offers in
April 2013
# of Offers in
April 2014
# of Offers in
April 2015
Total 31 61 63 59 75
Fixed 28 (90%) 51 (84%) 46 (73%) 41 (69%) 57 (76%)
Variable 3 (10%) 10 (16%) 17 (27%) 17 (31%) 16 (21%)
Fixed with Early Termination Fee
20 (71%) 34 (67%) 29 (63%) 28 (68%) 37 (65%)
Fixed without Early Termination Fee
8 (29%) 17 (33%) 17 (37%) 13 (32%) 20 (35%)
< than 12-month Term 1 (4%) 6 (12%) 23 (37%) 22 (37%) 24 (32%)
12-month Term 16 (57%) 26 (51%) 28 (44%) 26 (44%) 29 (39%)

Office of Retail Market Development 2015 Annual Report
Section 20-110 of the Public Utilities Act
35
The table allows us to make several observations. First, while their share had declined over the last few years, the percentage of fixed price offers has gone up since last year. Second, more than half of the posted offers have either a one- or two-year contract term. Furthermore, only five of the 75 offers posted in April 2015 have a term longer than two years. On the other hand, offers with a term of less than one year make up almost a third of all offers. Third, about two thirds of the fixed offers have an early termination fee. And finally, 21 of the 75 offers have a “green”/renewable content higher than what is required by the state’s renewable portfolio standard.
Besides analyzing the type of offers, we took a look at the prices for the various posted offers and how those prices might have changed during that same time period. The following table shows the average prices for the different types of offers posted on PlugInIllinois.org. The bottom of the table shows ComEd’s fixed-price supply service rate for the five months in question. The ComEd rates shown include the Purchased Electricity Adjustment (“PEA”).
13-23 month Term 2 (7%) 3 (6%) 2 (3%) 5 (8%) 6 (8%)
24-month Term 8 (29%) 16 (31%) 10 (16%) 4 (7%) 11 (15%)
> than 24-month Term 1 (4%) 1 (2%) 0 (0%) 2 (3%) 5(6%)
Green/Renewable 9 (29%) 21 (34%) 18 (29%) 23 (39%) 21 (28%)

Office of Retail Market Development 2015 Annual Report
Section 20-110 of the Public Utilities Act
36
Type of Residential
Offer
July 2011 Average Price (in cents/kWh)
May 2012 Average Price (in cents/kWh)
April 2013 Average Price
(in cents /kWh)
April 2014 Average Price
(in cents / kWh)
April 2015 Average Price
(in cents / kWh)
Fixed 6.81 6.37 (-6%) 6.21 (-3%) 7.76 (+25%) 7.78 (+0.26%)
Variable 7.67 7.00 (-9%) 7.07 (+1%) 8.49 (+20%) 8.48 (-0.12%)
Fixed with Early Termination Fee
6.64 6.35 (-4%) 6.00 (-6%) 7.80 (+30%) 7.60 (-3%)
Fixed without Early Termination Fee
6.64 6.32 (-5%) 5.64 (-12%) 6.97 (+24%) 7.89 (+13%)
< than 12-month Term 6.98 6.14 (-12%)
6.78 (+9%) 7.79 (+15%) 7.89 (+1%)
12-month Term 6.65 6.52 (-2%) 5.92 (-10%) 7.64 (+29%) 8.07 (+6%)
13-23 month Term 6.80 6.33 (-7%) 6.22 (-2%) 7.59 (+22%) 7.28 (-4%)
24-month Term 6.57 6.15 (-6%) 5.60 (-10%) 5.92 (+6%) 7.65 (+29%)
> than 24-month Term 6.30 6.30 (no
change)
N/A 7.58 8.27 (+9%)
Green/Renewable 7.47 6.98 (-7%) 6.83 (-2%) 8.57 (+25%) 8.60 (+0.35%)
ComEd Price-to-Compare, incl. PEA
8.42 8.23 8.80 5.97 8.07

Office of Retail Market Development 2015 Annual Report
Section 20-110 of the Public Utilities Act
37
The comparison shows that the average price of the various types of offers was well below ComEd’s then-effective fixed price bundled service rates for the first three of the selected months. However, in April 2014 (two months before ComEd’s Price-to-Compare increased significantly), the posted offers were substantially higher than ComEd’s then-effective bundled service rate. Moreover, almost all of the average prices of the posted ARES offers increased between April 2014 and April 2015. Interestingly, the average price of the two-year term offers increased substantially more than any other offer type or length. In addition, the table shows that in April 2015 the average posted price for an offer without an early termination fee was, for the first time, actually higher than the average posted price for an offer with an early termination fee. Finally, looking at the average prices for the different term lengths, it shows that the average price for a twelve-month fixed offer was higher than the average price for a 24-month fixed offer. This was the case in all five of the selected months.
5. Residential market concentration
As the previous section on supplier activity suggests, currently there is significantly less market concentration in the ComEd residential market than in the Ameren Illinois residential market. This difference has even increased compared to a year ago, with the HHI values in the three Ameren Rate Zones about 3-4 times higher than in the ComEd market. The following graph shows the monthly HHI values for the residential class in both ComEd and Ameren Illinois’ areas from 2011 to 2015.15
The graph illustrates several trends. First, ComEd’s residential market continues to exhibit little or moderate market concentration, especially when compared to the three Ameren Illinois Rate Zones. Second, even after the Constellation/Integrys merger, the market concentration in ComEd’s market decreased slightly over the past 12 months. With HHI values in the 1,700 range, ComEd’s residential market continues to be moderately concentrated. Third, Ameren’s Rate Zone II is still by far the most concentrated residential market. Fourth, Ameren’s Rate Zone I has seen the biggest increase in market concentration
15 The HHI values are based on residential usage, rather than number of customers. However, there is not a substantial difference between using number of customers and amount of usage for the market share calculation.
Office of Retail Market Development 2015 Annual Report
Section 20-110 of the Public Utilities Act
38
in the last year and, like Ameren’s two other Rate Zones, is now considered a highly concentrated market.
Having looked at the HHI values for the different utility service areas, we will now take a closer look at the ComEd residential market. The HHI values shown above already tell us that the current market would be considered on the low end of a “moderately concentrated” market per the DOJ and FTC’s Merger guidelines. The next table highlights the changing market dynamics over the last few years:
ComEd Residential Market Shares by Customers
June 2011
May 2012
May 2013
May 2014
May 2015
Share of largest 3 suppliers 86% 44% 69% 66% 61%
# of suppliers with customers 8 27 41 50 48

Office of Retail Market Development 2015 Annual Report
Section 20-110 of the Public Utilities Act
39
It shows that the market share of the three suppliers with the highest market share (in terms of residential customers) has gone down slightly over the last two years. Worth noting is that 45 of the 48 suppliers with residential customers had a market share of less than 5% and 29 of suppliers with residential customers had a market share of less than 1%. However, compared to last year, when only twelve suppliers had a market share above 1%, this year shows nineteen suppliers having surpassed that mark. Given that the universe of residential ARES customers in ComEd’s area was about 2.1 million as of May 2015, nineteen different suppliers had at least 21,000 residential customers as of that date. Only one supplier had a market share above 15% and only two suppliers had a market share between 5% and 15%. Finally, the table reveals how the total number of suppliers with residential customers seems to be leveling off.
The following three pie charts are the most striking visual representation of the changes in supplier diversity. The first chart shows the make-up of ComEd’s residential market in May 2013, the second chart shows the composition as of May 2014, and the third chart represents the most recent data.
# of suppliers with >15% share 2 1 2 2 1
# of suppliers with >5% and <15% share
2 5 2 2 2
# of suppliers with <5% share 4 21 37 46 45
# of suppliers with < 1% share 2 11 30 38 29
Office of Retail Market Development 2015 Annual Report
Section 20-110 of the Public Utilities Act
40

Office of Retail Market Development 2015 Annual Report
Section 20-110 of the Public Utilities Act
41
IV. Additional Consumer Protections and Education
A. PlugInIllinois.org
PluginIllinois.org is the Commission’s electric choice education website aimed at providing residential and small commercial customers with a better understanding of their electric supply options. Public Act 97-0222 required Ameren Illinois and ComEd to include the PlugInIllinois.org internet address on its monthly bill. Since May 2012, both ComEd and Ameren Illinois have been sending out monthly bills with this new information. The law also requires all suppliers to provide the PlugInIllinois.org website address to residential and small commercial customers.
With the constant change in the status of communities with opt-out aggregation programs, the ORMD continues to maintain the informative Municipal Aggregation List of

Office of Retail Market Development 2015 Annual Report
Section 20-110 of the Public Utilities Act
42
Communities on PlugInIllinois.org. The Municipal Aggregation List contains eight columns including the name of the community, the status of each community’s aggregation program, the chosen supplier, the rate, the contract end date, possible termination fees, utility service area and referendum date. Additionally, a sort function was added to the list, allowing visitors to the website to sort by community name, status, supplier name, aggregation rate, contract end date, service area or referendum date.
In addition to the Complaint Scorecard, which ranks suppliers by their rate of complaints compared to the average rate of complaints for the entire residential market, the “Customer Complaint Statistics” also includes a Complaint Summary. The Complaint Summary shows the total number and type of complaints received for each retail electric supplier over the last two years. The Complaint Summary provides a more detailed view of the number and types of informal complaints the Illinois Commerce Commission receives about each retail electric supplier.
When it comes to informal complaints received by the Commission, the ORMD and the Consumer Services Division work together to address any patterns in informal complaints or concerns with the marketing materials used by individual suppliers. In the past year, two of those Staff investigations led to settlements approved by the Commission. On May 6, 2015, the Commission approved a settlement between Staff, the Citizen’s Utility Board (“CUB”), and Major Energy Electric Services, LLC (Docket No. 14-0512). On June 16, 2015, the Commission approved a settlement between Staff, CUB, the Office of the Attorney General, and Nordic Energy Services, LLC (Docket No. 15-0139). The ORMD and the Consumer Services Division are constantly reviewing sales scripts and other materials used by retail electric suppliers in the marketing to residential and small commercial customers.
In addition to the recent updates to PluginIllinois.org, the ORMD maintains the residential Price-to-Compare information for customers of Ameren Illinois and ComEd. The Price-to-Compare for ComEd combines ComEd’s Electric Supply Charge with the Transmission Services Charge to provide customers a price (in cents per kWh) to compare with ARES offers. Similar to ComEd, Ameren Illinois’ Price-to-Compare combines Ameren Illinois’s Electricity Supply Charges, including the Supply Cost Adjustment, with the Transmission Service Charge to come up with a price Ameren Illinois customers can compare to supplier offers. In addition, the ORMD maintains a table with historical Prices-to-Compare for ComEd and Ameren Illinois customers. The historical Prices-to-Compare
Office of Retail Market Development 2015 Annual Report
Section 20-110 of the Public Utilities Act
43
also include the Purchased Electricity Adjustment (“PEA”). This is done because, unlike future PEA values, historical PEA values are known values. Recently, the MidAmerican territory saw market entry by a RES and the ORMD will work with MidAmerican to develop relevant Price-to-Compare information for MidAmerican’s residential customers to be used on the PlugInIllinois.org site.
The residential RES offer comparison matrix, available through the “Compare Offers Now” link, prompts customers to select their utility service area to see the suppliers’ offers available in their area, and it allows them to compare the offers to their utility rate as well as to each other. For each offer posted, the offer comparison matrix displays the supplier’s logo, which is also a link to the supplier’s website, as well as the particular offer name, which links to further offer-specific information on the supplier’s website. The offer comparison matrix lists the price in cents per kWh, any potential additional monthly fees, the term in months, any possible early termination fees, and a brief description of the offer. It also lists the offer’s cost for monthly usage levels of 500, 1,000 and 1,500 kWh. Customers are also able to sort the offers by supplier, by price, or by the length of the term.
In September 2014, the Commission, based upon a Staff Report by the ORMD, issued a Notice of Inquiry into items concerning the marketing of retail electric service to residential and small commercial customers. Partially based on informal complaints received by the Commission, the following are among the items the NOI addressed:
a) Additional consumer education: Changes and supplements to PlugInIllinois.org,
more frequent press releases, and new ways to increase traffic to PlugInIllinois.org b) Should the Commission define residential marketing terms such as “green” and
“renewable” offers? Should a “% renewable” column be added to the existing RES offer matrix?
c) Should the Commission define “fixed” and “variable” rates? Should there be extra disclosure requirements for fixed offers that contain change-of-law/change-of-supplier-cost type contract clauses?
d) Should there be a requirement that a residential variable rate has to be tied to a publicly available index/benchmark? Should there be additional notice requirements for variable rate changes? Should suppliers be required to set and disclose a maximum rate for each variable rate offer?
Office of Retail Market Development 2015 Annual Report
Section 20-110 of the Public Utilities Act
44
The ORMD received several rounds of written comments on these and other topics. The comments form the basis for a forthcoming Staff Report to the Commission that contains several recommendations, including the recommendation to amend the Commission’s rules regarding the marketing to residential and small commercial retail electric customers.
B. Other regulatory activities
In July 2012, the Commission entered an order initiating the proceeding to develop
additional rules regarding municipal aggregation and opened Docket No. 12-0456. On June 11, 2014, the Commission entered a Second Notice Order and authorized submission to JCAR to begin the second notice period. At JCAR’s October 14, 2014 meeting, the Joint Committee objected to, and prohibited the filing of, the Commission’s proposed rules. Parties to the rulemaking subsequently submitted agreed-upon changes to the proposed rules, which the Commission adopted in a January 28, 2015 Order. The modified proposed rules were considered by JCAR at its meeting on February 18, 2015 and JCAR voted to withdraw the filing prohibition that it had previously entered in the rulemaking. The final rules became effective on April 1, 2015. The rules address a variety of topics, including certain requirements for the notices to be sent to eligible aggregation customers and protections for customers who have previously actively selected a RES offer on their own.
On September 4, 2013, the Commission initiated Docket No. 13-0506 to investigate the applicability of Sections 16-122 and 16-108.6 of the Public Utilities Act. These sections pertain to the release of customer-specific information by electric utilities. The Commission stated that that the deployment of the Advanced Metering Infrastructure, Net Metering, Peak-Time Rebate Programs and certain Rate Design filings required by the electric utilities pursuant to statute has led to the immediate need for utilities to provide customer-specific information to third parties which may or may not conflict with other sections of the PUA. The ORMD participated in the Docket and hosted workshops that were ordered as part of the Commission’s January 28, 2014 Final Order. The workshop discussions led to a follow-up proceeding, Docket No. 14-0701, which determined the language and format of customer authorizations a supplier is required to obtain prior to receiving a customer’s interval usage data for non-billing purposes.
Office of Retail Market Development 2015 Annual Report
Section 20-110 of the Public Utilities Act
45
Similar to Docket No. 14-0701, the ORMD is currently participating in Docket No. 15-0073, which seeks to determine the language and format of customer authorizations for third-parties other than retail electric suppliers. This Docket is expected to result in a Commission Order later this summer.
V. Suggested Administrative and Legislative Action
As stated above, the ORMD anticipates a new Commission rulemaking proceeding that addresses additional requirements for suppliers marketing to residential and small commercial customers. Such a rulemaking is the appropriate venue to provide all interested parties with an opportunity to discuss policy and legal issues surrounding the marketing to residential and small commercial customers and to propose solutions to those issues. If however, for whatever reason, the rulemaking is not able to fully address all items that, in the ORMD’s judgement, deserve resolution, the ORMD will work with interested parties and the General Assembly to resolve any remaining issues legislatively.


![Illinois Basin - Market Cycles and Outlook.ppt [Read-Only]thecoalinstitute.org/ckfinder/userfiles/files/Illinois Basin - Market Cycles and...Illinois Basin – Market Cycles and Outlook](https://img.pdfslide.net/doc/110x75/5ecb5a97de228e61af6aea59/illinois-basin-market-cycles-and-read-onlythecoalinstituteorgckfinderuserfilesfilesillinois.jpg)