Embed Size (px)
Citation preview

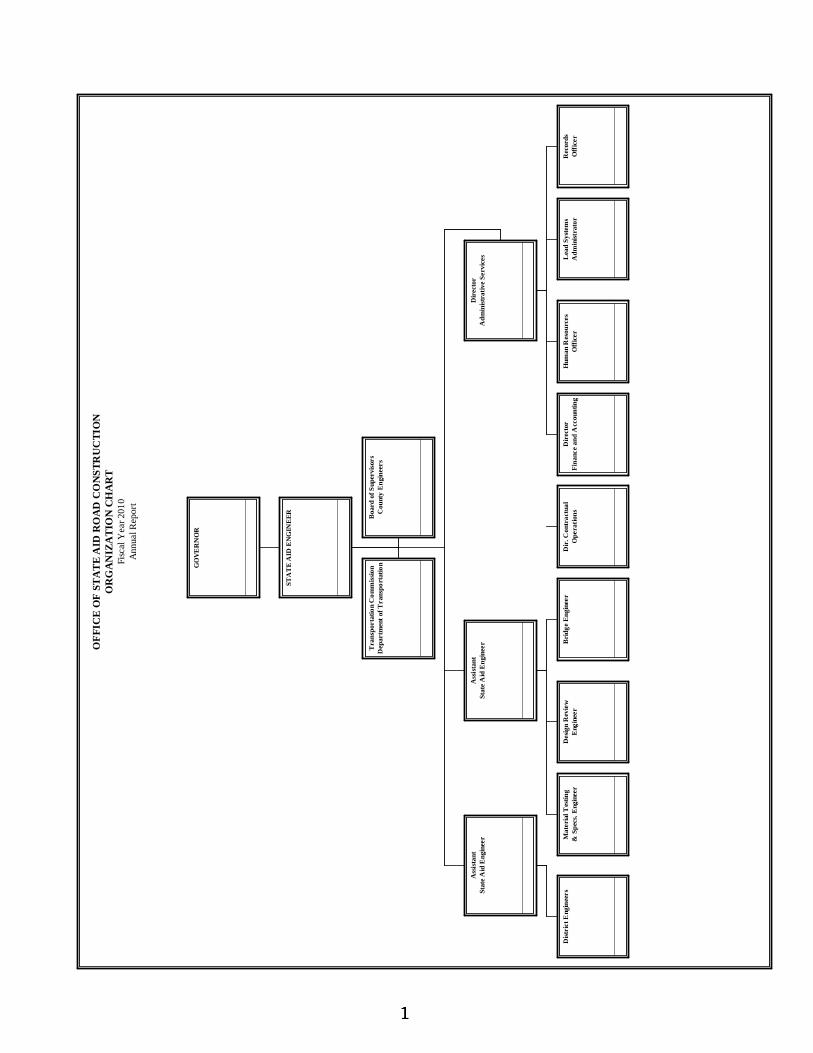
OFFICE OF STATE AID ROAD CONSTRUCTION
Annual ReportFiscal Year 2010
OFFICE OF STATE AID ROAD CONSTRUCTION FY 2010 ANNUAL REPORT
OFFICE OF STATE AID ROAD CONSTRUCTION
SUMMARY ANNUAL REPORT
FOR
THE FISCAL YEAR JULY 1, 2009 TO JUNE 30, 2010
TOGETHER WITH
A PROGRESS REPORT FROM THE BEGINNING OF THE
PROGRAM (MAY, 1950) TO JUNE 30, 2010
OFFICE OF STATE AID ROAD CONSTRUCTION FY 2010 ANNUAL REPORT
TABLE OF CONTENTSPage
Organizational Chart 1
State Aid Road Program:
Background of Program 2
Organization of Program 3
Operation of Program 4
Type or Character of Construction and Reseal Programs 5
Progress of Program 6
Revenue Sources and Amounts 11
Receipts and Disbursements 13
Funding Summary 14
Summary of Administrative Expenses 15
Out-of-State Travel to Conventions and Meetings 17
Automobile Expenditures for State-Owned Vehicles 18
Improvements Let to Contract from July 1, 2009 thru June 30, 2010 19
Improvements Made on State Aid System from June, 1950, thru June 30, 2010 21
State Aid Program Construction and Engineering Disbursements from July 1, 2009 thru June 30, 2010 24
Local System Bridge Program Construction and Engineering Disbursements from July 1, 2009, thru June 30, 2010 26
OF
FIC
E O
F S
TA
TE
AID
RO
AD
CO
NS
TR
UC
TIO
NO
RG
AN
IZA
TIO
N C
HA
RT
Fisc
al Y
ear 2
010
Ann
ual R
epor
t
Tra
nspo
rtat
ion
Com
mis
sion
Dep
artm
ent
of T
rans
port
atio
nB
oard
of S
uper
viso
rsC
ount
y E
ngin
eers
Dis
tric
t Eng
inee
rs
Ass
ista
ntSt
ate
Aid
Eng
inee
r Mat
eria
l Tes
ting
& S
pecs
. Eng
inee
rD
esig
n R
evie
wE
ngin
eer
Bri
dge
Eng
inee
rD
ir. C
ontr
actu
alO
pera
tion
s
Ass
ista
ntSt
ate
Aid
Eng
inee
r
Dir
ecto
rF
inan
ce a
nd A
ccou
ntin
gH
uman
Res
ourc
esO
ffic
erL
ead
Syst
ems
Adm
inis
trat
orR
ecor
dsO
ffic
er
Dir
ecto
rA
dmin
istr
ativ
e Se
rvic
es
STA
TE
AID
EN
GIN
EE
R
GO
VE
RN
OR
OFFICE OF STATE AID ROAD CONSTRUCTION FY 2010 ANNUAL REPORT
THE STATE AID ROAD PROGRAM
This report primarily summarizes the operations and progress of the State Aid Program for the fiscal year July 1, 2009 to June 30, 2010.
It is considered appropriate, however, to include an overall background of the program covering the enabling legislation, organization and functions at the State Aid Office and county levels, total funds expended, and total construction improvements accomplished.
An estimate of the program volume anticipated for the fiscal year July 1, 2010 to June 30, 2011 is also included in the report.
BACKGROUND OF PROGRAM
The State Aid Program had its beginning with the passage of Chapter 6, Laws of the Extraordinary Session of 1949 (Section 65-9-[1-33] of the Mississippi Code of 1972). This legislation provided for the creation of a division within the State Highway Department, to be known as the Division of State Aid Road Construction, and to be charged with the responsibility of administering the program at the state level. The 1992 Legislature passed Senate Bill 2763 which created the Mississippi Department of Transportation. Under this bill the State Highway Department became known as the Department of Transportation and the Division of State Aid Road Construction became known as the Office of State Aid Road Construction.
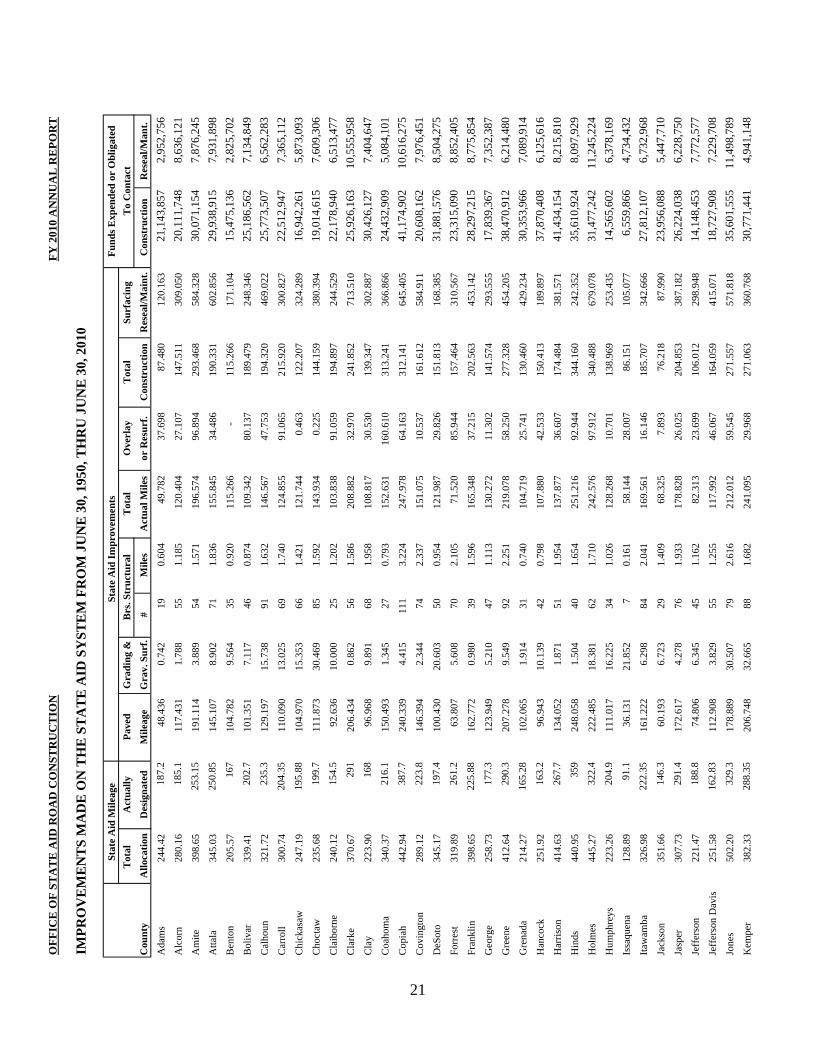
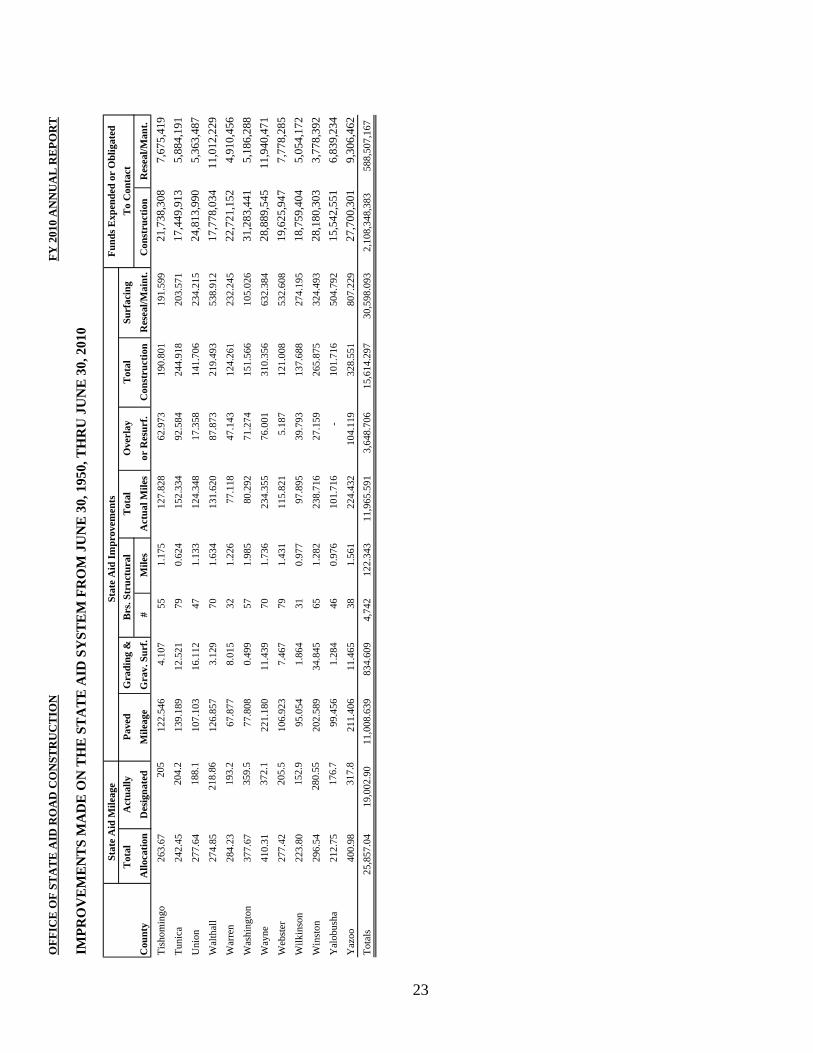
The Enabling Act also provided for a State Aid System, to be composed of the principal collector and distributor routes in the 82 counties, connecting with the State Highway System and other principal county roads to form a network of secondary roads for the state. This system was originally limited to 11,656.4 miles, with each county allocated a percentage of this eligible mileage. The State Legislature at its 1962 Regular Session increased the eligible system mileage to 23,312.8 miles. No change was made in the allocation percentages. In 1994, under House Bill 1302, the allocation percentages were revised and the eligible mileage was increased to 25,857.04 miles. There are 19,002.90 miles actually designated by the Boards and approved by the State Aid Engineer as of June 30, 2010.
The 1994 Regular Session of the Legislature passed House Bill 1302 which included the establishment of a Local System Bridge Replacement and Rehabilitation Program (LSBP), (Section 65-37[1-15] of the Mississippi Code of 1972). The program provides funding for replacement and rehabilitation of deficient bridges maintained by counties or municipalities excluding bridges on the State Aid System, the municipal urban system or the rural major collector system. The Office of State Aid Road Construction is charged with the responsibility of administering the LSBP program under rules and regulations promulgated by the State Aid Engineer.
The 2001 Regular Session of the Legislature passed Senate Bill No. 2318 which established the Local System Road Program (LSRP), (Section 65-18[1-17] of the Mississippi Code of 1972. The program gives the counties the ability to use LSBP and State Aid funds(subject to certain criteria) for the construction, reconstruction and paving of county roads not on the State Aid Road System.
2
OFFICE OF STATE AID ROAD CONSTRUCTION FY 2010 ANNUAL REPORT
ORGANIZATION OF PROGRAM
Organization of the State Aid Office
The State Aid Enabling Act provides that the Office of State Aid Road Construction be directed by a State Aid Engineer, who is appointed by the Governor for terms of four years each (as amended by the Legislature in 1985). It further provides that the State Aid Engineer hire assistant engineers and other employees necessary to carry out the duties and responsibilities set out in the enabling legislation.
The actual organization of the office began with the appointment of the first State Aid Engineer on May 11, 1950. The office was authorized in 2010 to have an organization for a staff of fifty-three (53) full-time employees, including fifteen (15) Registered Professional Engineers. All positions are approved by the Department of Finance and Administration and the State Personnel Board.
Organization at the County Level
Each Board of Supervisors, as the governing agency of the county, is required by statute to appoint a County Engineer, who is a Registered Professional Engineer, to act for and on behalf of the Board and to administer the engineering functions at the county level, subject to the rules and regulations promulgated by the State Aid Engineer.
The Board is also required to appoint a Local System Bridge Engineer to administer the LSBP program at the county level. The duties of the LSBP Engineer parallel those of the County Engineer and the Board may elect to appoint the County Engineer as the LSBP Engineer.
3
OFFICE OF STATE AID ROAD CONSTRUCTION FY 2010 ANNUAL REPORT
OPERATION OF THE PROGRAM
Operation of the Program at the County Level
It is the responsibility of the Board of Supervisors to designate the roads to be included in the county's State Aid System; adopt annual construction programs; acquire rights-of-way for State Aid projects; advertise for bids; award contracts; and maintain completed projects after construction.
The County Engineers' responsibilities and duties include, but are not limited to, the following: Assist the Boards of Supervisors in the designation and modification of their State Aid Systems; prepare annual construction programs; make surveys and prepare detailed plans and designs; make field inspections with the State Aid Engineer's representatives; prepare proposals for advertisement for bids; attend lettings at the county level; provide engineering controls (staking, etc.); supervise and inspect construction; prepare estimates for payment to the contractors; and make annual maintenance inspections of completed projects.
Operation of the Program at the State Level
It is the responsibility of the State Aid Engineer and his staff to prepare and adopt uniform design standards and specifications for the construction and maintenance of State Aid projects; approve all additions to the State Aid System; approve all construction programs, plans and specifications; authorize advertisement for bids; concur in the award of the contracts; approve and disburse all payments made from the project fund; approve the final acceptance of completed projects; and make annual and other periodic inspections of completed projects to see that they are properly maintained by the respective Boards of Supervisors.
4
O FFICE OF STATE AID ROAD CONSTRUCTION FY 2010 ANNUAL REPORT
TYPE OR CHARACTER OF CONSTRUCTION AND RESEAL PROGRAMS
Construction
During the early years of the program (the 1950's), many counties had a great need for bridges and graded roadways with a gravel surface, although many other counties began their State Aid Programs with the construction of hard-surfaced (blacktop) improvements.
It has been the objective throughout the program to construct roads that would connect with the State Highway System and other State Aid routes to form a network of secondary roads. At the present time, all programs now being approved provide for the future completion of a hard-surfaced facility.
The first hard-surfaced State Aid roads, which were completed in the beginning of the program, now need asphalt overlays. It will be noted from the summaries to follow in this report that a total of 3,648.7 miles of hot mix asphalt overlay construction (some surfaces were widened) has been accomplished. This points to the fact that the principal or arterial State Aid roads must now be upgraded to meet increasing traffic volumes and heavier loads. It is anticipated that the need for these betterments on the principal routes will continue to increase.
Maintenance and Reseal Work
The original State Aid Act did not permit the use of State Aid funds for the reseal of existing bituminous surfaces, which work consists of a light application of liquid asphalt and a light application of a fine or seal aggregate to cover the asphalt. Reseal work is regarded as maintenance. The Legislature, during its 1962 Session, amended the law to permit the use of State Aid funds (not to exceed 10%) to reseal hard-surfaced roads which had been constructed through the use of State Aid Funds. This 10% limitation was eliminated during the 1982 Legislative Session.
Bituminous surface treatments need to be resealed on an average of every five or six years to protect the surfaces and the investments made therein. A total of 30,598.09 miles have been resealed, with 1,705.07 miles of this total being contracted during the 2010 fiscal year.
The Legislature, during the 1982 Regular Session, amended Section 65-9-25 of the Mississippi Code of 1972 to permit additional State Aid funds to be used for maintenance, repair and reconstruction of State Aid roads which have been constructed in accordance with State Aid standards and specifications.
5

OFFICE OF STATE AID ROAD CONSTRUCTION FY 2010 ANNUAL REPORT
PROGRESS OF PROGRAM
Projects Placed Under Contract from July 1, 2009 thru June 30, 2010# Miles Cost
LSBP Projects (106 Bridges Replaced) 86 9.631 24,951,844
LSRP (LSBP Funds) 2 0.494 694,4000
LSRP (SA Funds) 1 1.982 831,800
Total LSBP and LSRP Projects (LSBP & SA Funds) 89 26,478,044
State Aid & Federal Aid Projects (including Bridge Inspections) Construction Grading, Drainage Structures & Paving 75.039 Grading, Drainage Structures & Gravel Surface 4.049 Bridges 14.020 Asphalt Overlay Construction 559.524 Total Construction Improvements 49 652.632 39,407,761
Reseal & Maintenance Projects(Previously Paved State Aid Routes) 41 1,705.077 19,990,800
Total State Aid & Federal Aid Project (including Bridge Inspections) 90 59,398,561
NOTE: The above totals, by Counties, are included elsewhere in this report.
Amounts and Types of Funds Contracted: State Aid 53,981,746 County 1,540,315Federal Funds: MDOT Funds 0 Surface Transportation 6,261,565 Appalachian Access 275,000 Bridge Replacement 4,497,692 Bridge Inspection 0 Bridge Posting 0 Congestion Relief 0 Defense Access 0 Development Infrastructure 0 Eastern Federal Land Highway (EFLH) 366,050 Emergency Relief 2,547,953 Federal Land Highways 0 High Priority 819,968 High Risk Rural Road (HRRRP) 1,206,630 National Corridor Planning & Development (NCPD) 0 Public Lands Highway (PLH) 3,490,298 Rural Infrastructure Fund (RIF) 0 Rural Safety Innovation (RSIP) 74,560 Stimulus (ARRA) 2,738,784 Transportation-Community-System Preservation (TCSP) 222,500
Total Funds Contracted 78,023,061
Grand Total all Projects 179 85,876,605
6

Projects Completed and/or Placed Under Contract from Beginning ofProgram in June, 1950, thru June 30, 2010
# Miles CostLSBP Projects (1,606 Bridges Replaced) 929 165.620 267,602,218
LSRP (LSBP Funds) 5 13.984 3,796,700
LSRP (SA Funds) 11 10.210 4,573,495
Total LSBP and LSRP Projects (LSBP & SA Funds) 945 275,972,413
State Aid & Federal Aid Project (including Bridge Inspections) Construction Grading, Drainage Structures & Paving 11,008.639 Grading, Drainage Structures & Gravel Surface 834.609 Bridges 122.343 Asphalt Overlay Construction 3,648.706 Total Construction Improvements 8,405 15,614.297 1,991,665,433
Reseal & Maintenance Projects(Previously Paved State Aid Routes) 1,529 30,598.093 588,507,167
Total State Aid & Federal Aid Project (including Bridge Inspections) 9,934 2,580,172,600
Grand Totals all Projects 10,879 2,856,145,013
NOTE: The above totals, by Counties, are included elsewhere in this report.
7
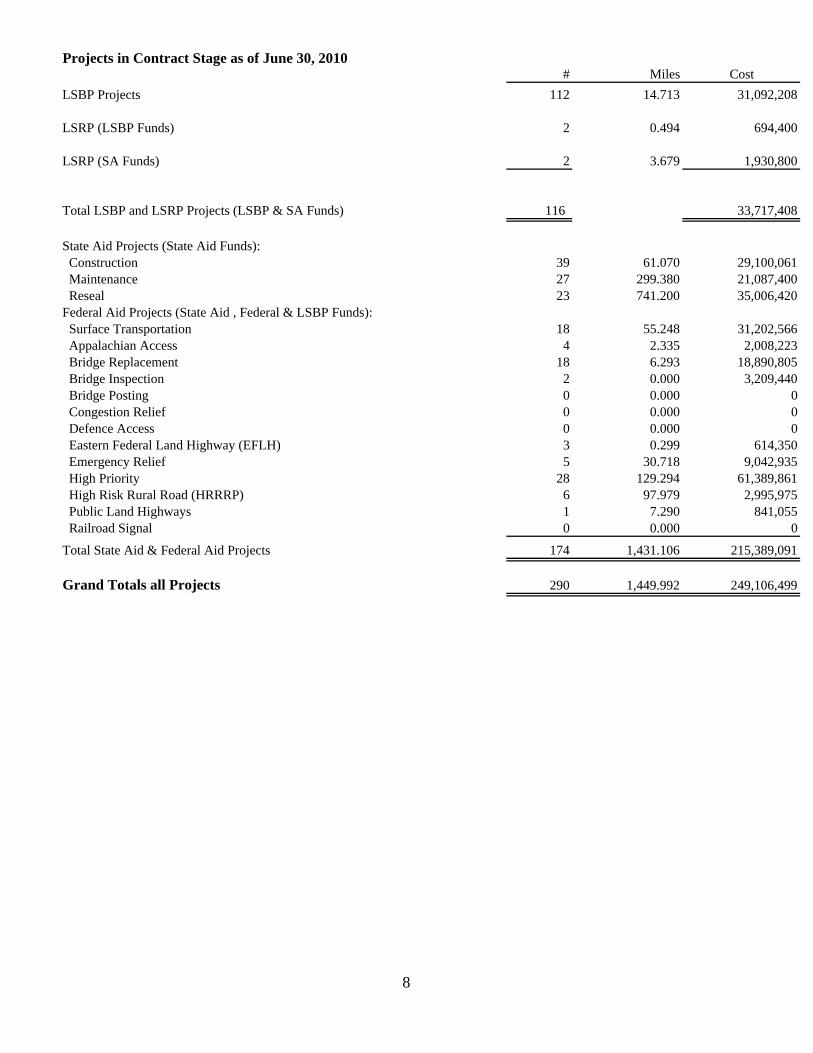
Projects in Contract Stage as of June 30, 2010# Miles Cost
LSBP Projects 112 14.713 31,092,208
LSRP (LSBP Funds) 2 0.494 694,400
LSRP (SA Funds) 2 3.679 1,930,800
Total LSBP and LSRP Projects (LSBP & SA Funds) 116 33,717,408
State Aid Projects (State Aid Funds): Construction 39 61.070 29,100,061 Maintenance 27 299.380 21,087,400 Reseal 23 741.200 35,006,420Federal Aid Projects (State Aid , Federal & LSBP Funds): Surface Transportation 18 55.248 31,202,566 Appalachian Access 4 2.335 2,008,223 Bridge Replacement 18 6.293 18,890,805 Bridge Inspection 2 0.000 3,209,440 Bridge Posting 0 0.000 0 Congestion Relief 0 0.000 0 Defence Access 0 0.000 0 Eastern Federal Land Highway (EFLH) 3 0.299 614,350 Emergency Relief 5 30.718 9,042,935 High Priority 28 129.294 61,389,861 High Risk Rural Road (HRRRP) 6 97.979 2,995,975 Public Land Highways 1 7.290 841,055 Railroad Signal 0 0.000 0
Total State Aid & Federal Aid Projects 174 1,431.106 215,389,091
Grand Totals all Projects 290 1,449.992 249,106,499
8

OFFICE OF STATE AID ROAD CONSTRUCTION FY 2010 ANNUAL REPORT
Estimated Program Volume for July 1, 2009, thru June 30, 2010
It is difficult to estimate the miles of construction and reseal improvements that will be let to contract during the coming fiscal year. However, the State Aid Road Construction Program has the potential for a $100 to $215 million total program for the fiscal year 2010. In addition, we expect to place under contract $20 million in LSBP Funds.
As of June 30, 2010, programs (proposed improvements) have been adopted by the Boards of Supervisors and approved by the State Aid Engineer for the following work:
Type of Projects Number of Projects Estimated Cost
Total LSBP (System 81) 190 54,519,932
Total LSRP (LSBP Funds)(System 80) 3 2,405,712
Total LSRP (SA Funds)(System 80) 2 903,100
State Aid: (State Aid Funds Only)
Construction (System 81) 44 22,011,536
Maintenance (System 81) 34 22,042,887
Reseal (System 81) 10 8,068,000
State Aid & Federal Aid Funds
STP (System 82) 45 26,690,529
STPG (System 32) 4 1,636,317
APL (System 36) 5 1,860,765
BR (System 85) 92 72,142,947
EFLH (System 63) 16 6,670,174
ER (System 66) 10 653,007
HRRRP (System 25) 16 3,836,945
MS, FBD (System 19) 61 143,927,401
PLH (System 62) 2 296,349
GRAND TOTAL 534 $365,665,601
Total State Aid 339 $307,836,857
9
OFFICE OF STATE AID ROAD CONSTRUCTION FY 2010 ANNUAL REPORT
The Boards of Supervisors began the new four-year term on January 1, 2008, and have available for planning and expenditure purposes 90% of the State Aid revenue that will accrue during the 2008-2011 period.
Bridge Replacement and Rehabilitation is a major Federal program that has helped the counties to improve the seriously deficient condition of many State Aid and Federal Aid System bridges. Historically, the Mississippi Department of Transportation transferred approximately 30% of the Bridge Replacement funds that are apportioned to the State Aid program for replacement of deficient bridges on county roads. In fiscal year 2010, $15,534,022 was transferred. State Aid is projected to receive for fiscal year 2011, $15,000,000 to be transferred by Mississippi Department of Transportation.
The cost per mile for the construction of projects, embracing grading, drainage structures, small bridges, base and bituminous surfacing, ranges from $311,521.08 per mile to $1,247,698.80 per mile, depending on the soil conditions, availability of construction materials and terrain. The average cost of construction projects in fiscal year 2010 was $398,500.89 per mile.
Projects involving large bridges with long spans and/or projects requiring higher design standards because of heavy traffic demands or other special conditions should not be considered in these cost ranges.
Liquid seal (resealing) projects range from $30463.18 to $78,083.35 per mile, depending on the location and on the leveling and base course corrections needed. The average cost of reseal projects in fiscal year 2010 was $38,636.75 per mile.
10
OFFICE OF STATE AID ROAD CONSTRUCTION FY 2010 ANNUAL REPORT
11
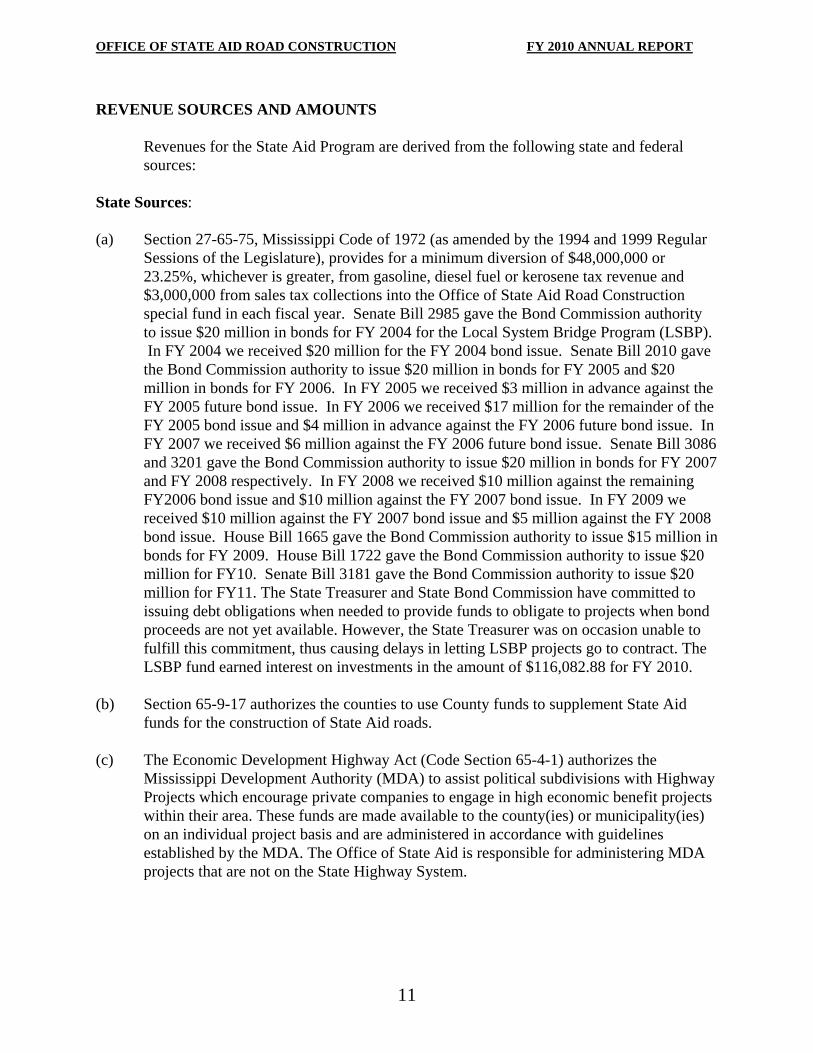
REVENUE SOURCES AND AMOUNTS
Revenues for the State Aid Program are derived from the following state and federal sources:
State Sources: (a) Section 27-65-75, Mississippi Code of 1972 (as amended by the 1994 and 1999 Regular
Sessions of the Legislature), provides for a minimum diversion of $48,000,000 or 23.25%, whichever is greater, from gasoline, diesel fuel or kerosene tax revenue and $3,000,000 from sales tax collections into the Office of State Aid Road Construction special fund in each fiscal year. Senate Bill 2985 gave the Bond Commission authority to issue $20 million in bonds for FY 2004 for the Local System Bridge Program (LSBP). In FY 2004 we received $20 million for the FY 2004 bond issue. Senate Bill 2010 gave the Bond Commission authority to issue $20 million in bonds for FY 2005 and $20 million in bonds for FY 2006. In FY 2005 we received $3 million in advance against the FY 2005 future bond issue. In FY 2006 we received $17 million for the remainder of the FY 2005 bond issue and $4 million in advance against the FY 2006 future bond issue. In FY 2007 we received $6 million against the FY 2006 future bond issue. Senate Bill 3086 and 3201 gave the Bond Commission authority to issue $20 million in bonds for FY 2007 and FY 2008 respectively. In FY 2008 we received $10 million against the remaining FY2006 bond issue and $10 million against the FY 2007 bond issue. In FY 2009 we received $10 million against the FY 2007 bond issue and $5 million against the FY 2008 bond issue. House Bill 1665 gave the Bond Commission authority to issue $15 million in bonds for FY 2009. House Bill 1722 gave the Bond Commission authority to issue $20 million for FY10. Senate Bill 3181 gave the Bond Commission authority to issue $20 million for FY11. The State Treasurer and State Bond Commission have committed to issuing debt obligations when needed to provide funds to obligate to projects when bond proceeds are not yet available. However, the State Treasurer was on occasion unable to fulfill this commitment, thus causing delays in letting LSBP projects go to contract. The LSBP fund earned interest on investments in the amount of $116,082.88 for FY 2010.
(b) Section 65-9-17 authorizes the counties to use County funds to supplement State Aid funds for the construction of State Aid roads.
(c) The Economic Development Highway Act (Code Section 65-4-1) authorizes the
Mississippi Development Authority (MDA) to assist political subdivisions with Highway Projects which encourage private companies to engage in high economic benefit projects within their area. These funds are made available to the county(ies) or municipality(ies) on an individual project basis and are administered in accordance with guidelines established by the MDA. The Office of State Aid is responsible for administering MDA projects that are not on the State Highway System.
OFFICE OF STATE AID ROAD CONSTRUCTION FY 2010 ANNUAL REPORT
12
Federal Sources (Regular):
MDOT provides a portion of the Surface Transportation Program funds and Bridge Replacement funds made available to the State of Mississippi by the Federal Government to the counties through the State Aid Office.
Federal Sources (Special): (a) Emergency Relief funds are made available by the Federal Government to the counties
through the State Aid Office on an individual project basis, to reconstruct roads and bridges on Federal Aid highways damaged or destroyed by floods, hurricanes, catastrophic failure and other disasters.
(c) Appalachian Access Highway funds are made available to the counties in the twenty-four
county Appalachian area in northeast Mississippi on an individual project basis. These projects are administered by the State Aid Office on an individual project basis through the Federal Highway Administration.
(c) Other funds earmarked by Congress for selected counties.
OFFICE OF STATE AID ROAD CONSTRUCTION FY 2010 ANNUAL REPORT
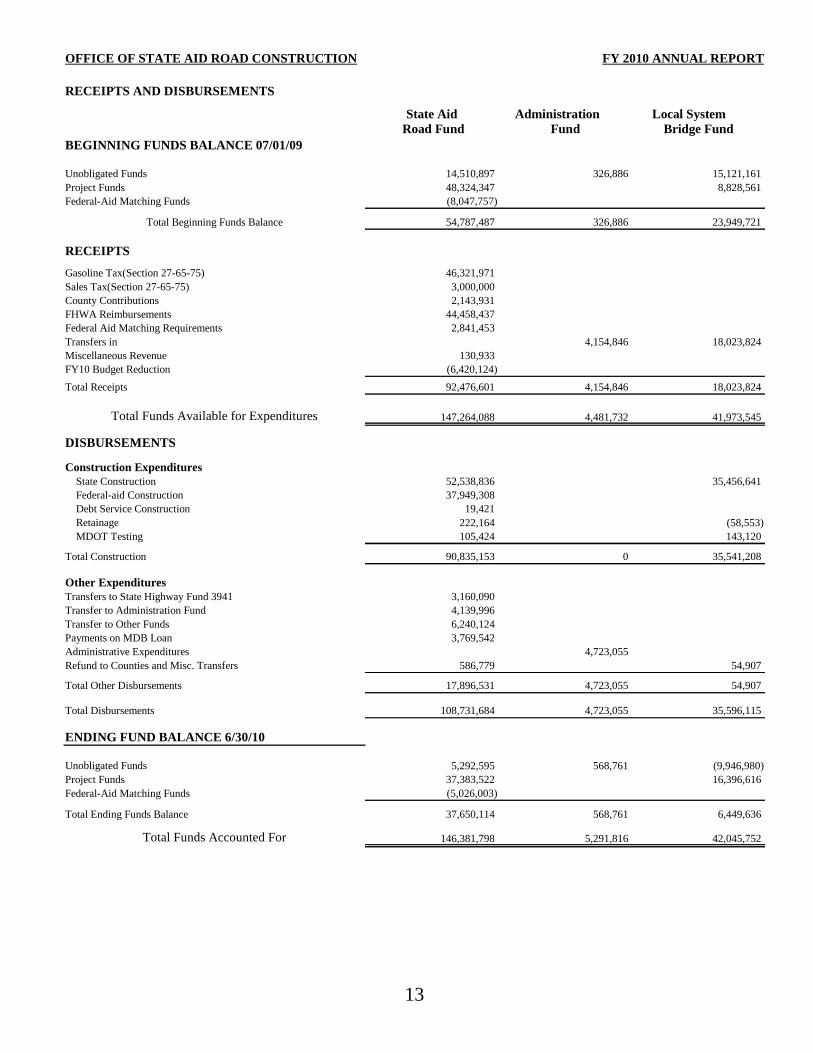
RECEIPTS AND DISBURSEMENTS
BEGINNING FUNDS BALANCE 07/01/09
14,510,897 326,886 15,121,161 Project Funds 48,324,347 8,828,561 Federal-Aid Matching Funds (8,047,757)
Total Beginning Funds Balance 54,787,487 326,886 23,949,721
RECEIPTS
Gasoline Tax(Section 27-65-75) 46,321,971 Sales Tax(Section 27-65-75) 3,000,000 County Contributions 2,143,931 FHWA Reimbursements 44,458,437 Federal Aid Matching Requirements 2,841,453 Transfers in 4,154,846 18,023,824 Miscellaneous Revenue 130,933 FY10 Budget Reduction (6,420,124)
Total Receipts 92,476,601 4,154,846 18,023,824
Total Funds Available for Expenditures 147,264,088 4,481,732 41,973,545
DISBURSEMENTS
Construction Expenditures State Construction 52,538,836 35,456,641 Federal-aid Construction 37,949,308 Debt Service Construction 19,421
222,164 (58,553) MDOT Testing 105,424 143,120
Total Construction 90,835,153 0 35,541,208
Other ExpendituresTransfers to State Highway Fund 3941 3,160,090 Transfer to Administration Fund 4,139,996 Transfer to Other Funds 6,240,124 Payments on MDB Loan 3,769,542 Administrative Expenditures 4,723,055 Refund to Counties and Misc. Transfers 586,779 54,907
Total Other Disbursements 17,896,531 4,723,055 54,907
Total Disbursements 108,731,684 4,723,055 35,596,115
ENDING FUND BALANCE 6/30/10
5,292,595 568,761 (9,946,980)Project Funds 37,383,522 16,396,616 Federal-Aid Matching Funds (5,026,003)
Total Ending Funds Balance 37,650,114 568,761 6,449,636
Total Funds Accounted For 146,381,798 5,291,816 42,045,752
13
State Aid Road Fund
Administration Fund
Local System Bridge Fund
Unobligated Funds
Retainage
Unobligated Funds

14
OFFICE OF STATE AID ROAD CONSTRUCTION FY 2010 ANNUAL REPORT
FUNDING SUMMARY
FUNDS MADE AVAILABLE DURING FY 2010
Sources: Gasoline Tax (Section 27-65-75) 46,321,971 Sales Tax (Section 27-65-75) 3,000,000 County Contributions 2,143,931 Federal Aid Matching Requirements 2,841,453 Miscellaneous State Aid Revenue 130,933 Local System Bridge Funds 18,023,824 Administrative Transfer from Counties 4,154,846 FY10 Budget Reduction (6,420,124) Federal Funds-- FHWA Reimbursements 44,458,437 Total Federal Funds 44,458,437 Total Fiscal Year Revenue 114,655,271 Less: Requirements for Administrative Expenses (4,154,846)
Total Funds Made Available for Construction During FY 2010 110,500,425
PROJECTION OF REVENUE FOR FY 2011 AND FY 2012
Sources: FY 2011 FY 2012 Gasoline Tax (Section 27-65-75) 57,000,000 57,000,000 Sales Tax (Section 27-65-75) 3,000,000 3,000,000 County Contributions 22,400,000 22,400,000 Federal Aid Matching Requirements 22,500,000 22,500,000 Miscellaneous State Aid Revenue 4,540,769 4,540,769 Local System Bridge Funds 35,000,000 35,000,000 Administrative Transfer from Counties 5,000,000 5,048,576 Budget Reduction 0 0 Federal Funds - FHWA Reimbursements 90,000,000 90,000,000 Total Fiscal Year Revenue 239,440,769 239,489,345 Less: Requirements for Administrative Expenses (5,000,000) (5,048,576)
Total Revenue Available for Construction 234,440,769 234,440,769
OFFICE OF STATE AID ROAD CONSTRUCTION FY 2010 ANNUAL REPORT
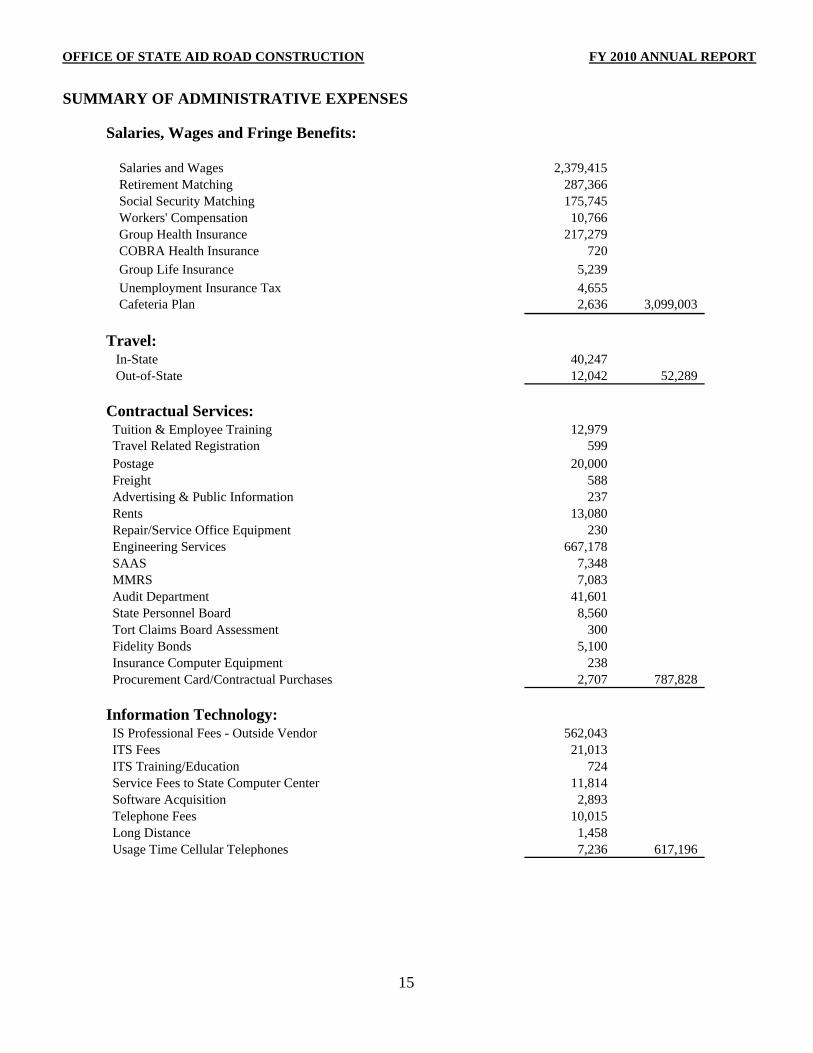
SUMMARY OF ADMINISTRATIVE EXPENSES
Salaries, Wages and Fringe Benefits:
Salaries and Wages 2,379,415 Retirement Matching 287,366 Social Security Matching 175,745 Workers' Compensation 10,766 Group Health Insurance 217,279 COBRA Health Insurance 720 Group Life Insurance 5,239 Unemployment Insurance Tax 4,655 Cafeteria Plan 2,636 3,099,003
Travel: In-State 40,247 Out-of-State 12,042 52,289
Contractual Services: Tuition & Employee Training 12,979 Travel Related Registration 599 Postage 20,000 Freight 588 Advertising & Public Information 237 Rents 13,080 Repair/Service Office Equipment 230 Engineering Services 667,178 SAAS 7,348 MMRS 7,083 Audit Department 41,601 State Personnel Board 8,560 Tort Claims Board Assessment 300 Fidelity Bonds 5,100 Insurance Computer Equipment 238 Procurement Card/Contractual Purchases 2,707 787,828
Information Technology: IS Professional Fees - Outside Vendor 562,043 ITS Fees 21,013 ITS Training/Education 724 Service Fees to State Computer Center 11,814 Software Acquisition 2,893 Telephone Fees 10,015 Long Distance 1,458 Usage Time Cellular Telephones 7,236 617,196
15

OFFICE OF STATE AID ROAD CONSTRUCTION FY 2010 ANNUAL REPORT
SUMMARY OF ADMINISTRATIVE EXPENSES
Commodities: Printing and Binding 6,028 Duplication Supplies 2,941 Office Supplies and Materials 8,083 Paper Supplies 2,028 Maps and Manuals 287 Office Equipment 2,167 Fuel Card - Gas, Oils, Greases, Etc. 28,422 Tires and Tubes - Auto 2,060 Vehicle Repairs 1,011 Batteries & Accessories for Vehicles 2,600 Engineering Supplies 1,990 Equipment Repair & Parts 1,908 Other Supplies and Materials 3,273 Procurement Card Purchases 2,477 65,276
Capital Outlay: Automobiles 51,873 Mainframe Systems Equipment 49,590 101,463
Total 4,723,055
16

17
OFFICE OF STATE AID ROAD CONSTRUCTION FY 2010 ANNUAL REPORT
OUT-OF-STATE TRAVEL TO CONVENTIONS AND MEETINGS
Charles David Barrett Nashville, TN Meeting with Tennessee Department of Transportation $194.00
John Ferris Bond Birmingham, AL Southern Transportation Civil Rights Conference $635.00
Kimberly Cooper Birmingham, AL Southern Transportation Civil Rights Conference $967.00
Trent Curtis Palm Springs, CA AASHTO 2009 Annual Meeting $2,506.00
Palm Springs, CA AASHTO 2009 Annual Meeting $2,185.00
John Harper Fort Worth, TX $580.00
Travis Henley Powder Springs, GA Signs and Markings LEVEL II $450.00
Daniel Jordan Birmingham, AL Southern Transportation Civil Rights Conference $835.00
James Maher Nashville, TN Meeting with Tennessee Department of Transportation $716.00
Brooks Miller Palm Springs, CA AASHTO 2009 Annual Meeting $1,617.00
Birmingham, AL Southern Transportation Civil Rights Conference $937.00
Palm Springs, CA AASHTO 2009 Annual Meeting $420.00
GRAND TOTAL $12,042.00
Employee's Name
Travel Destination
Travel Meeting Title
Total Amount
Jerry Gilliland
NACE 2010
Sandra Lynn Mohr
Dan Tolar
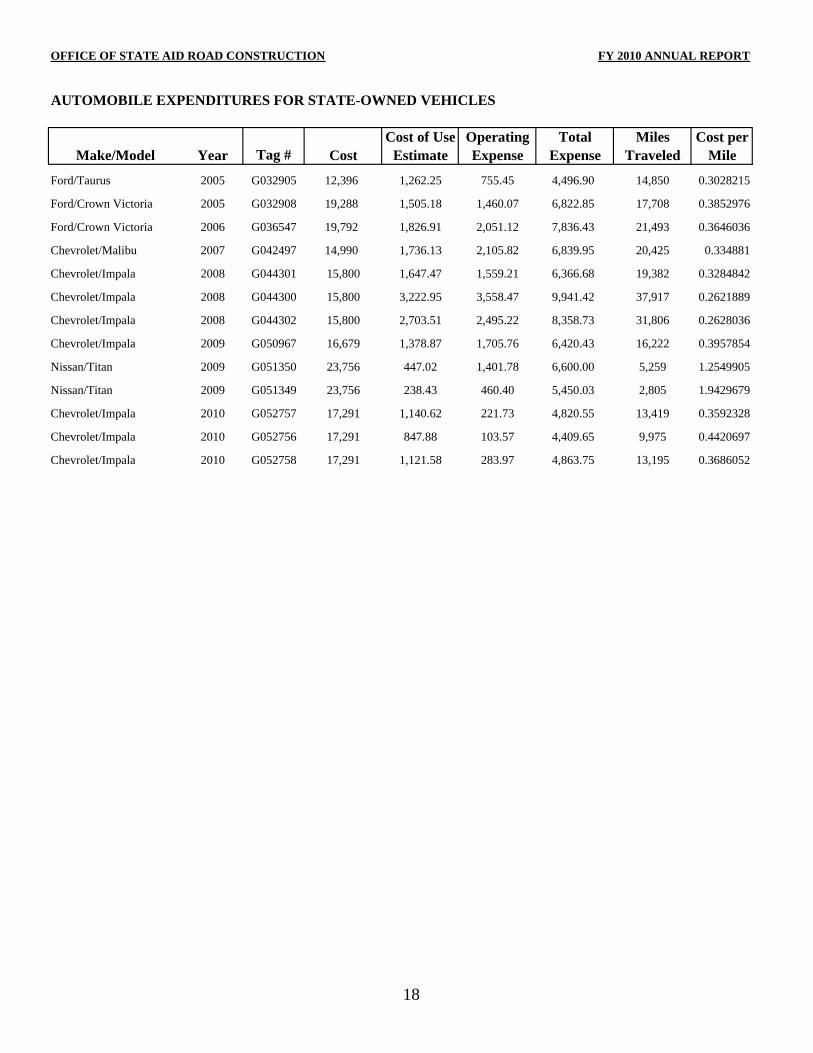
OFFICE OF STATE AID ROAD CONSTRUCTION
Cost of Use Operating Total Miles Cost perYear Tag # Cost Estimate Expense Expense Traveled Mile
Ford/Taurus 2005 G032905 12,396 1,262.25 755.45 4,496.90 14,850 0.3028215
Ford/Crown Victoria 2005 G032908 19,288 1,505.18 1,460.07 6,822.85 17,708 0.3852976
Ford/Crown Victoria 2006 G036547 19,792 1,826.91 2,051.12 7,836.43 21,493 0.3646036
Chevrolet/Malibu 2007 G042497 14,990 1,736.13 2,105.82 6,839.95 20,425 0.334881
Chevrolet/Impala 2008 G044301 15,800 1,647.47 1,559.21 6,366.68 19,382 0.3284842
Chevrolet/Impala 2008 G044300 15,800 3,222.95 3,558.47 9,941.42 37,917 0.2621889
Chevrolet/Impala 2008 G044302 15,800 2,703.51 2,495.22 8,358.73 31,806 0.2628036
Chevrolet/Impala 2009 G050967 16,679 1,378.87 1,705.76 6,420.43 16,222 0.3957854
Nissan/Titan 2009 G051350 23,756 447.02 1,401.78 6,600.00 5,259 1.2549905
Nissan/Titan 2009 G051349 23,756 238.43 460.40 5,450.03 2,805 1.9429679
Chevrolet/Impala 2010 G052757 17,291 1,140.62 221.73 4,820.55 13,419 0.3592328
Chevrolet/Impala 2010 G052756 17,291 847.88 103.57 4,409.65 9,975 0.4420697
Chevrolet/Impala 2010 G052758 17,291 1,121.58 283.97 4,863.75 13,195 0.3686052
AUTOMOBILE EXPENDITURES FOR STATE-OWNED VEHICLES
FY 2010 ANNUAL REPORT
Make/Model
18
OFFICE OF STATE AID ROAD CONSTRUCTION FY 2010 ANNUAL REPORT
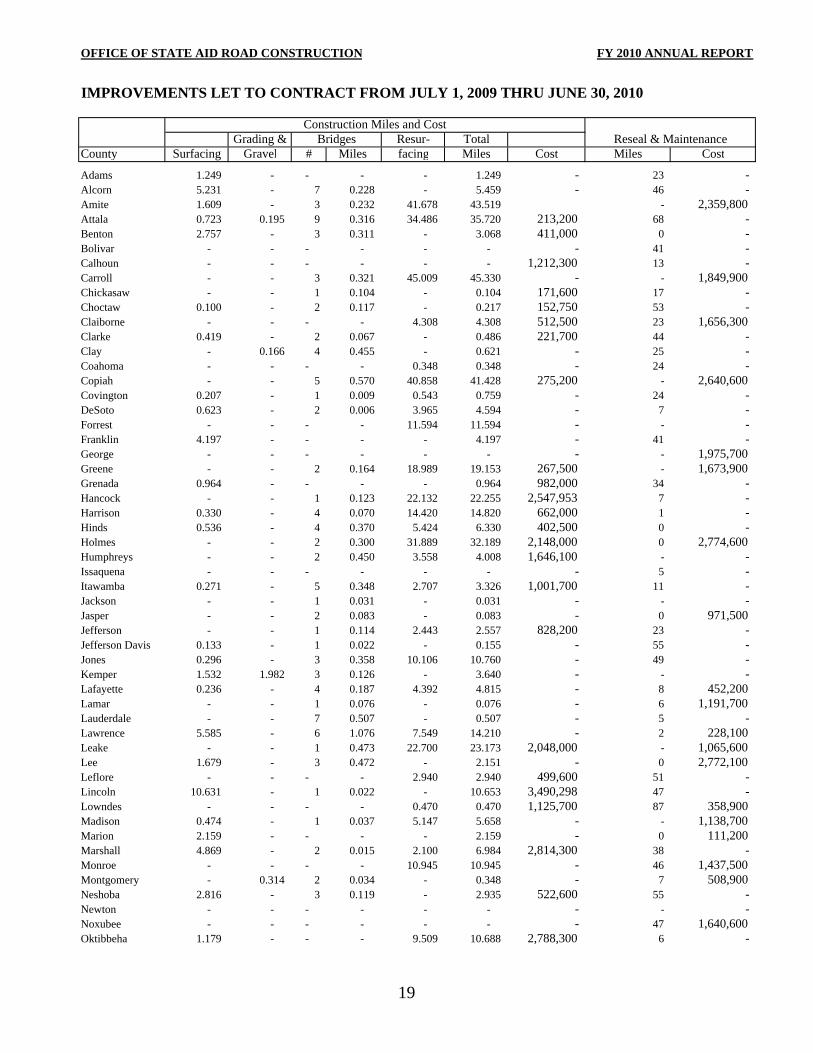
IMPROVEMENTS LET TO CONTRACT FROM JULY 1, 2009 THRU JUNE 30, 2010
Grading & Resur- TotalCounty Surfacing Gravel # Miles facing Miles Cost Miles Cost
Adams 1.249 - - - - 1.249 - 23 - Alcorn 5.231 - 7 0.228 - 5.459 - 46 - Amite 1.609 - 3 0.232 41.678 43.519 - 2,359,800 Attala 0.723 0.195 9 0.316 34.486 35.720 213,200 68 - Benton 2.757 - 3 0.311 - 3.068 411,000 0 - Bolivar - - - - - - - 41 - Calhoun - - - - - - 1,212,300 13 - Carroll - - 3 0.321 45.009 45.330 - - 1,849,900 Chickasaw - - 1 0.104 - 0.104 171,600 17 - Choctaw 0.100 - 2 0.117 - 0.217 152,750 53 - Claiborne - - - - 4.308 4.308 512,500 23 1,656,300 Clarke 0.419 - 2 0.067 - 0.486 221,700 44 - Clay - 0.166 4 0.455 - 0.621 - 25 - Coahoma - - - - 0.348 0.348 - 24 - Copiah - - 5 0.570 40.858 41.428 275,200 - 2,640,600 Covington 0.207 - 1 0.009 0.543 0.759 - 24 - DeSoto 0.623 - 2 0.006 3.965 4.594 - 7 - Forrest - - - - 11.594 11.594 - - - Franklin 4.197 - - - - 4.197 - 41 - George - - - - - - - - 1,975,700 Greene - - 2 0.164 18.989 19.153 267,500 - 1,673,900 Grenada 0.964 - - - - 0.964 982,000 34 - Hancock - - 1 0.123 22.132 22.255 2,547,953 7 - Harrison 0.330 - 4 0.070 14.420 14.820 662,000 1 - Hinds 0.536 - 4 0.370 5.424 6.330 402,500 0 - Holmes - - 2 0.300 31.889 32.189 2,148,000 0 2,774,600 Humphreys - - 2 0.450 3.558 4.008 1,646,100 - - Issaquena - - - - - - - 5 - Itawamba 0.271 - 5 0.348 2.707 3.326 1,001,700 11 - Jackson - - 1 0.031 - 0.031 - - - Jasper - - 2 0.083 - 0.083 - 0 971,500 Jefferson - - 1 0.114 2.443 2.557 828,200 23 - Jefferson Davis 0.133 - 1 0.022 - 0.155 - 55 - Jones 0.296 - 3 0.358 10.106 10.760 - 49 - Kemper 1.532 1.982 3 0.126 - 3.640 - - - Lafayette 0.236 - 4 0.187 4.392 4.815 - 8 452,200 Lamar - - 1 0.076 - 0.076 - 6 1,191,700 Lauderdale - - 7 0.507 - 0.507 - 5 - Lawrence 5.585 - 6 1.076 7.549 14.210 - 2 228,100 Leake - - 1 0.473 22.700 23.173 2,048,000 - 1,065,600 Lee 1.679 - 3 0.472 - 2.151 - 0 2,772,100 Leflore - - - - 2.940 2.940 499,600 51 - Lincoln 10.631 - 1 0.022 - 10.653 3,490,298 47 - Lowndes - - - - 0.470 0.470 1,125,700 87 358,900 Madison 0.474 - 1 0.037 5.147 5.658 - - 1,138,700 Marion 2.159 - - - - 2.159 - 0 111,200 Marshall 4.869 - 2 0.015 2.100 6.984 2,814,300 38 - Monroe - - - - 10.945 10.945 - 46 1,437,500 Montgomery - 0.314 2 0.034 - 0.348 - 7 508,900 Neshoba 2.816 - 3 0.119 - 2.935 522,600 55 - Newton - - - - - - - - - Noxubee - - - - - - - 47 1,640,600 Oktibbeha 1.179 - - - 9.509 10.688 2,788,300 6 -
Construction Miles and CostBridges Reseal & Maintenance
19

OFFICE OF STATE AID ROAD CONSTRUCTION FY 2010 ANNUAL REPORT
IMPROVEMENTS LET TO CONTRACT FROM JULY 1, 2009 THRU JUNE 30, 2010
Grading & Resur- TotalCounty Surfacing Gravel # Miles facing Miles Cost Miles Cost
Construction Miles and CostBridges Reseal & Maintenance
Panola 0.158 0.103 6 0.626 2.524 3.411 - 60 369,900 Pearl River 0.874 - 7 0.296 5.109 6.279 857,800 93 327,700 Perry 2.439 - - - - 2.439 - 0 101,200 Pike 1.484 - 4 0.450 - 1.934 951,500 75 - Pontotoc 0.656 - 1 0.053 - 0.709 - 12 940,500 Prentiss 0.902 - 3 0.146 7.096 8.144 - - 1,432,100 Quitman - - - - 2.740 2.740 - - - Rankin - - - - 36.178 36.178 6,240,000 - - Scott 0.196 0.612 4 0.753 - 1.561 - 39 - Sharkey - - - - 3.854 3.854 - 2 - Simpson - 0.245 3 0.292 1.865 2.402 - 28 228,300 Smith 1.359 - 1 0.006 - 1.365 840,300 0 921,400 Stone 1.711 - 2 0.034 5.424 7.169 187,800 21 219,500 Sunflower 3.587 - 2 0.198 - 3.785 - 23 1,675,600 Tallahatchie 5.946 - 2 0.228 3.045 9.219 - 3 - Tate - - 3 0.222 - 0.222 - 3 33,900 Tippah 0.403 - 3 0.384 - 0.787 228,700 33 1,002,100 Tishomingo - - - - - - 65,000 42 1,588,600 Tunica - - 1 0.042 - 0.042 - 9 - Union - - 1 0.126 - 0.126 - 64 - Walthall - - 2 0.309 59.710 60.019 - 59 184,800 Warren 0.114 - 3 0.464 - 0.578 802,800 4 - Washington - - 3 0.297 - 0.297 - - - Wayne - - - - 67.704 67.704 1,507,960 - 2,167,600 Webster - 0.204 4 0.214 - 0.418 - - - Wilkinson - 0.228 2 0.158 - 0.386 - - - Winston 4.405 - 3 0.158 4.066 8.629 374,900 60 - Yalobusha - - 1 0.158 - 0.158 406,000 36 614,300 Yazoo - - 1 0.093 - 0.093 - - - Statewide - - - - - - - - -
Totals 75.039 4.049 166 14.020 559.524 652.632 39,407,761 1,705.077 38,615,300
20
OFF
ICE
OF
STA
TE
AID
RO
AD
CO
NST
RU
CT
ION
FY 2
010
AN
NU
AL
RE
POR
T
IMPR
OV
EM
EN
TS
MA
DE
ON
TH
E S
TA
TE
AID
SY
STE
M F
RO
M J
UN
E 3
0, 1
950,
TH
RU
JU
NE
30,
201
0
Tot
al
Act
ually
Pave
dG
radi
ng &
Tot
alO
verl
ayT
otal
Surf
acin
g
Cou
nty
Allo
catio
nD
esig
nate
dM
ileag
eG
rav.
Sur
f.#
Mile
sA
ctua
l Mile
sor
Res
urf.
Con
stru
ctio
nR
esea
l/Mai
nt.
Con
stru
ctio
nR
esea
l/Man
t.
Ada
ms
244.
4218
7.2
48.4
36
0.
742
19
0.
604
49
.782
37.6
98
87
.480
12
0.16
3
21
,143
,857
2,95
2,75
6A
lcor
n28
0.16
185.
111
7.43
1
1.
788
55
1.
185
12
0.40
4
27
.107
147.
511
309.
050
20,1
11,7
488,
636,
121
Am
ite39
8.65
253.
1519
1.11
4
3.
889
54
1.
571
19
6.57
4
96
.894
293.
468
584.
328
30,0
71,1
547,
876,
245
Atta
la34
5.03
250.
8514
5.10
7
8.
902
71
1.
836
15
5.84
5
34
.486
190.
331
602.
856
29,9
38,9
157,
931,
898
Ben
ton
205.
5716
710
4.78
2
9.
564
35
0.
920
11
5.26
6
-
115.
266
171.
104
15,4
75,1
362,
825,
702
Bol
ivar
339.
4120
2.7
101.
351
7.11
7
46
0.87
4
109.
342
80.1
37
18
9.47
9
24
8.34
6
25
,186
,562
7,13
4,84
9C
alho
un32
1.72
235.
312
9.19
7
15
.738
91
1.63
2
146.
567
47.7
53
19
4.32
0
46
9.02
2
25
,773
,507
6,56
2,28
3C
arro
ll30
0.74
204.
3511
0.09
0
13
.025
69
1.74
0
124.
855
91.0
65
21
5.92
0
30
0.82
7
22
,512
,947
7,36
5,11
2C
hick
asaw
247.
1919
5.88
104.
970
15.3
53
66
1.
421
12
1.74
4
0.
463
122.
207
324.
289
16,9
42,2
615,
873,
093
Cho
ctaw
235.
6819
9.7
111.
873
30.4
69
85
1.
592
14
3.93
4
0.
225
144.
159
380.
394
19,0
14,6
157,
609,
306
Cla
ibor
ne24
0.12
154.
592
.636
10.0
00
25
1.
202
10
3.83
8
91
.059
194.
897
244.
529
22,1
78,9
406,
513,
477
Cla
rke
370.
6729
120
6.43
4
0.
862
56
1.
586
20
8.88
2
32
.970
241.
852
713.
510
25,9
26,1
6310
,555
,958
Cla
y22
3.90
168
96.9
68
9.
891
68
1.
958
10
8.81
7
30
.530
139.
347
302.
887
30,4
26,1
277,
404,
647
Coa
hom
a34
0.37
216.
115
0.49
3
1.
345
27
0.
793
15
2.63
1
16
0.61
0
313.
241
366.
866
24,4
32,9
095,
084,
101
Cop
iah
442.
9438
7.7
240.
339
4.41
5
11
1
3.22
4
247.
978
64.1
63
31
2.14
1
64
5.40
5
41
,174
,902
10,6
16,2
75C
ovin
gton
289.
1222
3.8
146.
394
2.34
4
74
2.33
7
151.
075
10.5
37
16
1.61
2
58
4.91
1
20
,608
,162
7,97
6,45
1D
eSot
o34
5.17
197.
410
0.43
0
20
.603
50
0.95
4
121.
987
29.8
26
15
1.81
3
16
8.38
5
31
,881
,576
8,50
4,27
5Fo
rres
t31
9.89
261.
263
.807
5.60
8
70
2.10
5
71.5
20
85
.944
157.
464
310.
567
23,3
15,0
908,
852,
405
Fran
klin
398.
6522
5.88
162.
772
0.98
0
39
1.59
6
165.
348
37.2
15
20
2.56
3
45
3.14
2
28
,297
,215
8,77
5,85
4G
eorg
e25
8.73
177.
312
3.94
9
5.
210
47
1.
113
13
0.27
2
11
.302
141.
574
293.
555
17,8
39,3
677,
352,
387
Gre
ene
412.
6429
0.3
207.
278
9.54
9
92
2.25
1
219.
078
58.2
50
27
7.32
8
45
4.20
5
38
,470
,912
6,21
4,48
0G
rena
da21
4.27
165.
2810
2.06
5
1.
914
31
0.
740
10
4.71
9
25
.741
130.
460
429.
234
30,3
53,9
667,
089,
914
Han
cock
251.
9216
3.2
96.9
43
10
.139
42
0.79
8
107.
880
42.5
33
15
0.41
3
18
9.89
7
37
,870
,408
6,12
5,61
6H
arris
on41
4.63
267.
713
4.05
2
1.
871
51
1.
954
13
7.87
7
36
.607
174.
484
381.
571
41,4
34,1
548,
215,
810
Hin
ds44
0.95
359
248.
058
1.50
4
40
1.65
4
251.
216
92.9
44
34
4.16
0
24
2.35
2
35
,610
,924
8,09
7,92
9H
olm
es44
5.27
322.
422
2.48
5
18
.381
62
1.71
0
242.
576
97.9
12
34
0.48
8
67
9.07
8
31
,477
,242
11,2
45,2
24H
umph
reys
223.
2620
4.9
111.
017
16.2
25
34
1.
026
12
8.26
8
10
.701
138.
969
253.
435
14,5
65,6
026,
378,
169
Issa
quen
a12
8.89
91.1
36.1
31
21
.852
7
0.16
1
58.1
44
28
.007
86.1
51
105.
077
6,55
9,86
64,
734,
432
Itaw
amba
326.
9822
2.35
161.
222
6.29
8
84
2.04
1
169.
561
16.1
46
18
5.70
7
34
2.66
6
27
,812
,107
6,73
2,96
8Ja
ckso
n35
1.66
146.
360
.193
6.72
3
29
1.40
9
68.3
25
7.
893
76.2
18
87.9
90
23,9
56,0
885,
447,
710
Jasp
er30
7.73
291.
417
2.61
7
4.
278
76
1.
933
17
8.82
8
26
.025
204.
853
387.
182
26,2
24,0
386,
228,
750
Jeff
erso
n22
1.47
188.
874
.806
6.34
5
45
1.16
2
82.3
13
23
.699
106.
012
298.
948
14,1
48,4
537,
772,
577
Jeff
erso
n D
avis
251.
5816
2.83
112.
908
3.82
9
55
1.25
5
117.
992
46.0
67
16
4.05
9
41
5.07
1
18
,727
,908
7,22
9,70
8Jo
nes
502.
2032
9.3
178.
889
30.5
07
79
2.
616
21
2.01
2
59
.545
271.
557
571.
818
35,6
01,5
5511
,498
,789
Kem
per
382.
3328
8.35
206.
748
32.6
65
88
1.
682
24
1.09
5
29
.968
271.
063
360.
768
30,7
71,4
414,
941,
148
21
Fund
s Exp
ende
d or
Obl
igat
edB
rs. S
truc
tura
lT
o C
onta
ctSt
ate
Aid
Mile
age
Stat
e A
id Im
prov
emen
ts

OFF
ICE
OF
STA
TE
AID
RO
AD
CO
NST
RU
CT
ION
FY 2
010
AN
NU
AL
RE
POR
T
IMPR
OV
EM
EN
TS
MA
DE
ON
TH
E S
TA
TE
AID
SY
STE
M F
RO
M J
UN
E 3
0, 1
950,
TH
RU
JU
NE
30,
201
0
Tot
al
Act
ually
Pave
dG
radi
ng &
Tot
alO
verl
ayT
otal
Surf
acin
g
Cou
nty
Allo
catio
nD
esig
nate
dM
ileag
eG
rav.
Sur
f.#
Mile
sA
ctua
l Mile
sor
Res
urf.
Con
stru
ctio
nR
esea
l/Mai
nt.
Con
stru
ctio
nR
esea
l/Man
t.
Fund
s Exp
ende
d or
Obl
igat
edB
rs. S
truc
tura
lT
o C
onta
ctSt
ate
Aid
Mile
age
Stat
e A
id Im
prov
emen
ts
Lafa
yette
341.
9518
4.7
108.
252
8.41
0
10
1
2.06
4
118.
726
35.4
38
15
4.16
4
34
3.73
3
24
,813
,530
6,15
2,85
3La
mar
318.
1020
7.78
110.
304
1.47
4
51
1.58
2
113.
360
87.4
50
20
0.81
0
48
3.83
2
20
,868
,677
10,0
11,7
40La
uder
dale
439.
3941
2.3
246.
918
1.61
9
68
1.81
4
250.
351
96.3
68
34
6.71
9
46
6.25
3
26
,913
,412
8,45
9,09
8La
wre
nce
261.
1020
7.72
125.
845
8.17
7
64
2.48
3
136.
505
73.5
48
21
0.05
3
40
1.49
3
49
,375
,746
6,41
8,67
1Le
ake
296.
5422
3.33
146.
788
11.0
73
61
1.
928
15
9.78
9
38
.697
198.
486
333.
017
27,9
61,1
545,
895,
769
Lee
343.
2419
4.4
109.
494
17.8
76
74
1.
912
12
9.28
2
19
.648
148.
930
357.
368
30,1
87,4
1011
,423
,646
Leflo
re31
1.14
275.
913
4.40
9
5.
456
59
2.
585
14
2.45
0
9.
928
152.
378
572.
890
24,8
59,6
4910
,419
,670
Linc
oln
433.
6235
8.8
208.
446
4.18
7
69
1.84
7
214.
480
31.5
96
24
6.07
6
54
8.20
8
41
,297
,776
8,23
3,75
2Lo
wnd
es33
4.88
189
112.
242
6.96
6
60
1.32
5
120.
533
119.
007
23
9.54
0
37
7.30
1
30
,287
,657
7,79
3,68
7M
adis
on36
9.85
285.
315
4.91
9
3.
352
56
1.
390
15
9.66
1
57
.271
216.
932
421.
207
29,0
03,6
225,
522,
039
Mar
ion
331.
9428
7.6
185.
490
3.83
8
62
1.22
6
190.
554
92.8
45
28
3.39
9
54
6.90
0
21
,553
,818
7,93
9,57
2M
arsh
all
315.
6121
112
0.75
7
8.
431
42
1.
497
13
0.68
5
13
.634
144.
319
218.
122
34,1
92,5
545,
613,
138
Mon
roe
328.
9520
3.7
142.
349
7.45
4
45
0.90
4
150.
707
37.7
45
18
8.45
2
40
2.50
9
22
,379
,015
8,17
1,32
3M
ontg
omer
y25
1.78
210.
8589
.916
24.5
37
82
1.
543
11
5.99
6
10
.429
126.
425
286.
341
20,1
72,6
757,
954,
554
Nes
hoba
377.
6731
2.2
185.
718
34.3
54
90
1.
633
22
1.70
5
9.
884
231.
589
399.
864
30,6
82,6
827,
200,
892
New
ton
296.
8627
317
0.39
1
6.
404
67
1.
048
17
7.84
3
12
.234
190.
077
318.
597
23,0
72,4
714,
738,
648
Nox
ubee
317.
0522
212
7.97
0
6.
497
56
1.
125
13
5.59
2
19
.013
154.
605
379.
604
23,3
42,3
415,
895,
890
Okt
ibbe
ha28
5.13
202.
413
2.55
8
10
.305
24
0.41
1
143.
274
30.7
37
17
4.01
1
41
3.94
3
20
,937
,903
4,87
9,09
7Pa
nola
380.
4025
0.4
157.
586
6.51
5
60
1.80
0
165.
901
116.
497
28
2.39
8
47
2.41
5
31
,866
,261
6,08
5,56
7Pe
arl R
iver
410.
0123
9.6
146.
860
14.2
77
66
2.
080
16
3.21
7
49
.026
212.
243
627.
117
30,7
18,1
1311
,043
,120
Perr
y28
6.75
223.
890
.159
6.04
0
62
1.46
3
97.6
62
32
.700
130.
362
408.
417
23,0
72,6
106,
268,
006
Pike
338.
5025
7.1
133.
282
15.5
12
61
1.
716
15
0.51
0
7.
637
158.
147
522.
436
22,7
35,4
0810
,744
,638
Pont
otoc
267.
1518
0.09
98.6
99
10
.225
25
0.61
6
109.
540
4.71
2
11
4.25
2
24
3.73
8
14
,888
,558
8,24
6,62
6Pr
entis
s28
1.65
198.
5212
3.95
7
20
.356
70
1.49
1
145.
804
29.5
88
17
5.39
2
23
5.92
4
23
,716
,442
6,03
2,75
4Q
uitm
an21
7.38
184.
686
.054
6.23
8
49
1.34
6
93.6
38
27
.232
120.
870
133.
779
15,9
71,0
483,
466,
694
Ran
kin
541.
4927
0.2
136.
958
10.2
42
81
1.
523
14
8.72
3
12
8.34
5
277.
068
284.
887
49,5
06,6
399,
143,
163
Scot
t31
0.55
223.
313
5.87
3
15
.732
88
1.97
2
153.
577
11.7
86
16
5.36
3
39
7.70
8
23
,035
,927
8,62
4,43
2Sh
arke
y16
4.28
111.
673
.556
14.3
92
15
0.
468
88
.416
40.8
46
12
9.26
2
16
4.44
7
11
,453
,306
4,99
8,59
6Si
mps
on34
8.73
286.
7517
1.51
9
4.
117
81
2.
319
17
7.95
5
22
.061
200.
016
513.
837
29,0
29,1
027,
393,
303
Smith
321.
7226
018
4.16
9
10
.627
67
1.82
2
196.
618
14.2
11
21
0.82
9
47
3.39
9
29
,310
,188
6,79
8,49
2St
one
223.
6018
1.9
127.
180
2.08
8
35
0.68
5
129.
953
49.0
17
17
8.97
0
31
6.93
6
19
,194
,664
4,35
5,66
0Su
nflo
wer
412.
6424
9.8
141.
429
22.1
94
53
1.
758
16
5.38
1
55
.264
220.
645
259.
245
33,4
28,0
476,
740,
558
Talla
hatc
hie
296.
0728
9.43
146.
786
21.9
00
42
1.
523
17
0.20
9
26
.386
196.
595
463.
680
25,4
71,8
957,
588,
635
Tate
244.
1616
4.8
51.2
74
17
.418
61
1.89
6
70.5
88
25
.072
95.6
60
162.
211
18,6
13,9
484,
894,
706
Tipp
ah29
0.95
217.
313
8.55
9
13
.654
53
1.17
3
153.
386
9.36
8
16
2.75
4
27
2.03
8
24
,115
,431
4,27
2,66
9
22
OFF
ICE
OF
STA
TE
AID
RO
AD
CO
NST
RU
CT
ION
FY 2
010
AN
NU
AL
RE
POR
T
IMPR
OV
EM
EN
TS
MA
DE
ON
TH
E S
TA
TE
AID
SY
STE
M F
RO
M J
UN
E 3
0, 1
950,
TH
RU
JU
NE
30,
201
0
Tot
al
Act
ually
Pave
dG
radi
ng &
Tot
alO
verl
ayT
otal
Surf
acin
g
Cou
nty
Allo
catio
nD
esig
nate
dM
ileag
eG
rav.
Sur
f.#
Mile
sA
ctua
l Mile
sor
Res
urf.
Con
stru
ctio
nR
esea
l/Mai
nt.
Con
stru
ctio
nR
esea
l/Man
t.
Fund
s Exp
ende
d or
Obl
igat
edB
rs. S
truc
tura
lT
o C
onta
ctSt
ate
Aid
Mile
age
Stat
e A
id Im
prov
emen
ts
Tish
omin
go26
3.67
205
122.
546
4.10
7
55
1.17
5
127.
828
62.9
73
19
0.80
1
19
1.59
9
21
,738
,308
7,67
5,41
9Tu
nica
242.
4520
4.2
139.
189
12.5
21
79
0.
624
15
2.33
4
92
.584
244.
918
203.
571
17,4
49,9
135,
884,
191
Uni
on27
7.64
188.
110
7.10
3
16
.112
47
1.13
3
124.
348
17.3
58
14
1.70
6
23
4.21
5
24
,813
,990
5,36
3,48
7W
alth
all
274.
8521
8.86
126.
857
3.12
9
70
1.63
4
131.
620
87.8
73
21
9.49
3
53
8.91
2
17
,778
,034
11,0
12,2
29W
arre
n28
4.23
193.
267
.877
8.01
5
32
1.22
6
77.1
18
47
.143
124.
261
232.
245
22,7
21,1
524,
910,
456
Was
hing
ton
377.
6735
9.5
77.8
08
0.
499
57
1.
985
80
.292
71.2
74
15
1.56
6
10
5.02
6
31
,283
,441
5,18
6,28
8W
ayne
410.
3137
2.1
221.
180
11.4
39
70
1.
736
23
4.35
5
76
.001
310.
356
632.
384
28,8
89,5
4511
,940
,471
Web
ster
277.
4220
5.5
106.
923
7.46
7
79
1.43
1
115.
821
5.18
7
12
1.00
8
53
2.60
8
19
,625
,947
7,77
8,28
5W
ilkin
son
223.
8015
2.9
95.0
54
1.
864
31
0.
977
97
.895
39.7
93
13
7.68
8
27
4.19
5
18
,759
,404
5,05
4,17
2W
inst
on29
6.54
280.
5520
2.58
9
34
.845
65
1.28
2
238.
716
27.1
59
26
5.87
5
32
4.49
3
28
,180
,303
3,77
8,39
2Y
alob
usha
212.
7517
6.7
99.4
56
1.
284
46
0.
976
10
1.71
6
-
101.
716
504.
792
15,5
42,5
516,
839,
234
Yaz
oo40
0.98
317.
821
1.40
6
11
.465
38
1.56
1
224.
432
104.
119
32
8.55
1
80
7.22
9
27
,700
,301
9,30
6,46
2To
tals
25,8
57.0
419
,002
.90
11,0
08.6
39
83
4.60
9
4,
742
122.
343
11,9
65.5
91
3,
648.
706
15,6
14.2
97
30
,598
.093
2,10
8,34
8,38
358
8,50
7,16
7
23
OFF
ICE
OF
STA
TE
AID
RO
AD
CO
NST
RU
CT
ION
FY 2
010
AN
NU
AL
RE
POR
T
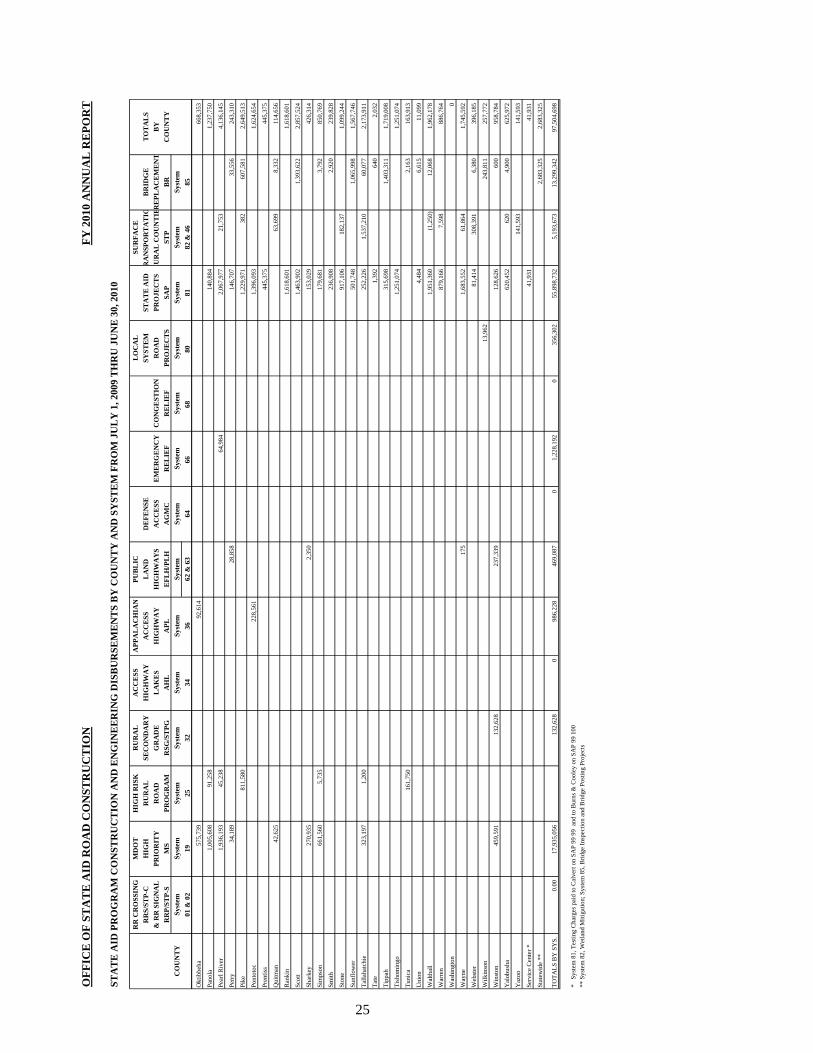
STA
TE
AID
PR
OG
RA
M C
ON
STR
UC
TIO
N A
ND
EN
GIN
EE
RIN
G D
ISB
UR
SEM
EN
TS
BY
CO
UN
TY
AN
D S
YST
EM
FR
OM
JU
LY
1, 2
009
TH
RU
JU
NE
30,
201
0
RR
CR
OSS
ING
MD
OT
HIG
H R
ISK
RU
RA
LA
CC
ESS
APP
AL
AC
HIA
NPU
BL
ICL
OC
AL
SUR
FAC
ER
RS/
STP-
CH
IGH
RU
RA
LSE
CO
ND
AR
YH
IGH
WA
YA
CC
ESS
LA
ND
DE
FEN
SESY
STE
MST
AT
E A
IDR
AN
SPO
RT
AT
IOB
RID
GE
TO
TA
LS
& R
R S
IGN
AL
PRIO
RIT
YR
OA
DG
RA
DE
LA
KE
SH
IGH
WA
YH
IGH
WA
YS
AC
CE
SSE
ME
RG
EN
CY
CO
NG
EST
ION
RO
AD
PRO
JEC
TS
RU
RA
L C
OU
NT
IER
EPL
AC
EM
EN
TB
YR
RP/
STP-
SM
SPR
OG
RA
MR
SG/S
TPG
AH
LA
PLE
FLH
/PL
HA
GM
CR
EL
IEF
RE
LIE
FPR
OJE
CT
SSA
PST
PB
RC
OU
NT
YC
OU
NT
YSy
stem
Syst
emSy
stem
Syst
emSy
stem
Syst
emSy
stem
Syst
emSy
stem
Syst
emSy
stem
Syst
emSy
stem
Syst
em01
& 0
219
2532
3436
62 &
63
6466
6880
8182
& 4
685
Ada
ms
22,5
7029
,885
16,3
9768
,852
Alc
orn
221,
990
8,17
623
0,16
5
Am
ite2,
871
565,
227
2,10
057
0,19
9
Atta
la1,
727,
242
1,99
2,02
748
8,00
94,
207,
278
Ben
ton
700
775,
843
36,3
6681
2,90
8
Bol
ivar
1,18
9,62
01,
189,
620
Cal
houn
699,
371
244,
593
943,
964
Car
roll
20,4
821,
204,
167
4,90
01,
229,
549
Chi
ckas
aw50
022
8,77
71,
385
230,
662
Cho
ctaw
9,35
130
3,92
272
,642
385,
915
Cla
ibor
ne15
,525
1,54
5,94
952
7,01
72,
088,
491
Cla
rke
9,09
363
,884
72,9
78
Cla
y11
,272
1,68
4,04
834
9,40
92,
044,
730
Coa
hom
a36
,778
661
46,2
3417
583
,848
Cop
iah
1,39
9,55
51,
802
848,
587
131,
895
2,38
1,83
9
Cov
ingt
on27
5,61
351
,368
4,08
981
,936
413,
006
DeS
oto
1,06
4,74
71,
997
1,06
6,74
4
Forr
est
23,1
421,
622,
701
1,64
5,84
3
Fran
klin
819,
982
45,2
0486
5,18
6
Geo
rge
20,6
7052
,511
73,1
81
Gre
ene
252,
247
760,
286
33,4
391,
045,
972
Gre
nada
1,17
3,76
119
,803
1,19
3,56
3
Han
cock
170,
738
35,8
6243
,125
249,
724
Har
rison
12,1
5093
3,22
759
9,24
85,
199
1,54
9,82
4
Hin
ds1,
342,
451
467,
533
113,
681
1,92
3,66
4
Hol
mes
10,9
6939
9,68
256
0,19
997
0,84
9
Hum
phre
ys79
,741
125,
414
373,
359
578,
515
Issa
quen
a18
9,08
818
9,08
8
Itaw
amba
34,0
1985
1,92
618
4,61
035
6,11
21,
426,
666
Jack
son
24,3
5217
7,47
317
520
2,00
0
Jasp
er10
3,62
51,
431
105,
056
Jeff
erso
n33
,977
37,2
0871
,186
Jeff
Dav
is26
4,98
635
1,56
561
6,55
1
Jone
s38
7,27
166
7,51
71,
054,
788
Kem
per
321,
670
501,
333
347,
385
1,17
0,38
8
Lafa
yette
768,
974
2,49
877
1,47
2
Lam
ar33
01,
407,
403
21,3
221,
429,
056
Laud
erda
le3,
346
1,43
2,76
52,
226
1,43
8,33
6
Law
renc
e5,
919,
668
359,
515
10,5
266,
289,
709
Leak
e9,
000
666,
677
851,
049
1,52
6,72
6
Lee
64,2
111,
993,
051
500
2,05
7,76
2
Leflo
re44
1,81
215
2,23
21,
605,
309
300
2,19
9,65
3
Linc
oln
206,
377
2,86
140
6,28
329
6,04
391
1,56
4
Low
ndes
334,
209
2,10
2,54
640
4,29
02,
841,
045
Mad
ison
1,43
2,39
684
,537
1,51
6,93
3
Mar
ion
338,
174
338,
174
Mar
shal
l37
2,15
221
2,07
823
2,61
41,
177,
310
675
1,99
4,82
9
Mon
roe
1,24
1,85
211
2,61
01,
354,
462
Mon
tgom
ery
1,37
8,45
071
7,89
52,
096,
345
Nes
hoba
1,04
5,89
527
4,08
011
,317
1,33
1,29
2
New
ton
4,83
62,
699
7,53
5
Nox
ubee
1,64
4,90
01,
200
1,64
6,10
0
24
OFF
ICE
OF
STA
TE
AID
RO
AD
CO
NST
RU
CT
ION
FY 2
010
AN
NU
AL
RE
POR
T
STA
TE
AID
PR
OG
RA
M C
ON
STR
UC
TIO
N A
ND
EN
GIN
EE
RIN
G D
ISB
UR
SEM
EN
TS
BY
CO
UN
TY
AN
D S
YST
EM
FR
OM
JU
LY
1, 2
009
TH
RU
JU
NE
30,
201
0
RR
CR
OSS
ING
MD
OT
HIG
H R
ISK
RU
RA
LA
CC
ESS
APP
AL
AC
HIA
NPU
BL
ICL
OC
AL
SUR
FAC
ER
RS/
STP-
CH
IGH
RU
RA
LSE
CO
ND
AR
YH
IGH
WA
YA
CC
ESS
LA
ND
DE
FEN
SESY
STE
MST
AT
E A
IDR
AN
SPO
RT
AT
IOB
RID
GE
TO
TA
LS
& R
R S
IGN
AL
PRIO
RIT
YR
OA
DG
RA
DE
LA
KE
SH
IGH
WA
YH
IGH
WA
YS
AC
CE
SSE
ME
RG
EN
CY
CO
NG
EST
ION
RO
AD
PRO
JEC
TS
RU
RA
L C
OU
NT
IER
EPL
AC
EM
EN
TB
YR
RP/
STP-
SM
SPR
OG
RA
MR
SG/S
TPG
AH
LA
PLE
FLH
/PL
HA
GM
CR
EL
IEF
RE
LIE
FPR
OJE
CT
SSA
PST
PB
RC
OU
NT
YC
OU
NT
YSy
stem
Syst
emSy
stem
Syst
emSy
stem
Syst
emSy
stem
Syst
emSy
stem
Syst
emSy
stem
Syst
emSy
stem
Syst
em01
& 0
219
2532
3436
62 &
63
6466
6880
8182
& 4
685
Okt
ibbe
ha57
5,73
992
,614
668,
353
Pano
la1,
005,
608
91,2
5814
0,88
41,
237,
750
Pear
l Riv
er1,
936,
193
45,2
3864
,984
2,06
7,97
721
,753
4,13
6,14
5
Perr
y34
,189
28,8
5814
6,70
733
,556
243,
310
Pike
811,
580
1,22
9,97
138
260
7,58
12,
649,
513
Pont
otoc
228,
561
1,39
6,09
31,
624,
654
Pren
tiss
445,
375
445,
375
Qui
tman
42,6
2563
,699
8,33
211
4,65
6
Ran
kin
1,61
8,60
11,
618,
601
Scot
t1,
463,
902
1,39
3,62
22,
857,
524
Shar
key
270,
935
2,35
015
3,02
942
6,31
4
Sim
pson
661,
560
5,73
517
9,68
13,
792
850,
769
Smith
236,
908
2,92
023
9,82
8
Ston
e91
7,10
618
2,13
71,
099,
244
Sunf
low
er50
1,74
81,
065,
998
1,56
7,74
6
Talla
hatc
hie
323,
197
1,20
025
2,22
61,
537,
210
60,0
772,
173,
911
Tate
1,39
264
02,
032
Tipp
ah31
5,69
81,
403,
311
1,71
9,00
8
Tish
omin
go1,
251,
074
1,25
1,07
4
Tuni
ca16
1,75
02,
163
163,
913
Uni
on4,
484
6,61
511
,099
Wal
thal
l1,
951,
360
(1,2
50)
12,0
681,
962,
178
War
ren
879,
166
7,59
888
6,76
4
Was
hing
ton
0
Way
ne17
51,
683,
552
61,8
641,
745,
592
Web
ster
81,4
1430
8,39
16,
380
396,
185
Wilk
inso
n13
,962
243,
811
257,
772
Win
ston
459,
591
132,
628
237,
339
128,
626
600
958,
784
Yal
obus
ha62
0,45
262
04,
900
625,
972
Yaz
oo14
1,59
314
1,59
3
Serv
ice
Cen
ter *
41,9
3141
,931
Stat
ewid
e **
2,68
3,32
52,
683,
325
TOTA
LS B
Y S
YS.
0.00
17,9
35,0
5613
2,62
80
986,
228
469,
087
01,
228,
192
035
6,30
255
,898
,732
5,19
3,67
313
,299
,342
97,5
04,6
98
* S
yste
m 8
1, T
estin
g C
harg
es p
aid
to C
alve
rt on
SA
P 99
99
and
to B
urns
& C
oole
y on
SA
P 99
100
** S
yste
m 8
2, W
etla
nd M
itiga
tion;
Sys
tem
85,
Brid
ge In
spec
tion
and
Brid
ge P
ostin
g Pr
ojec
ts
25
OFFICE OF STATE AID ROAD CONSTRUCTION FY 2010 ANNUAL REPORT
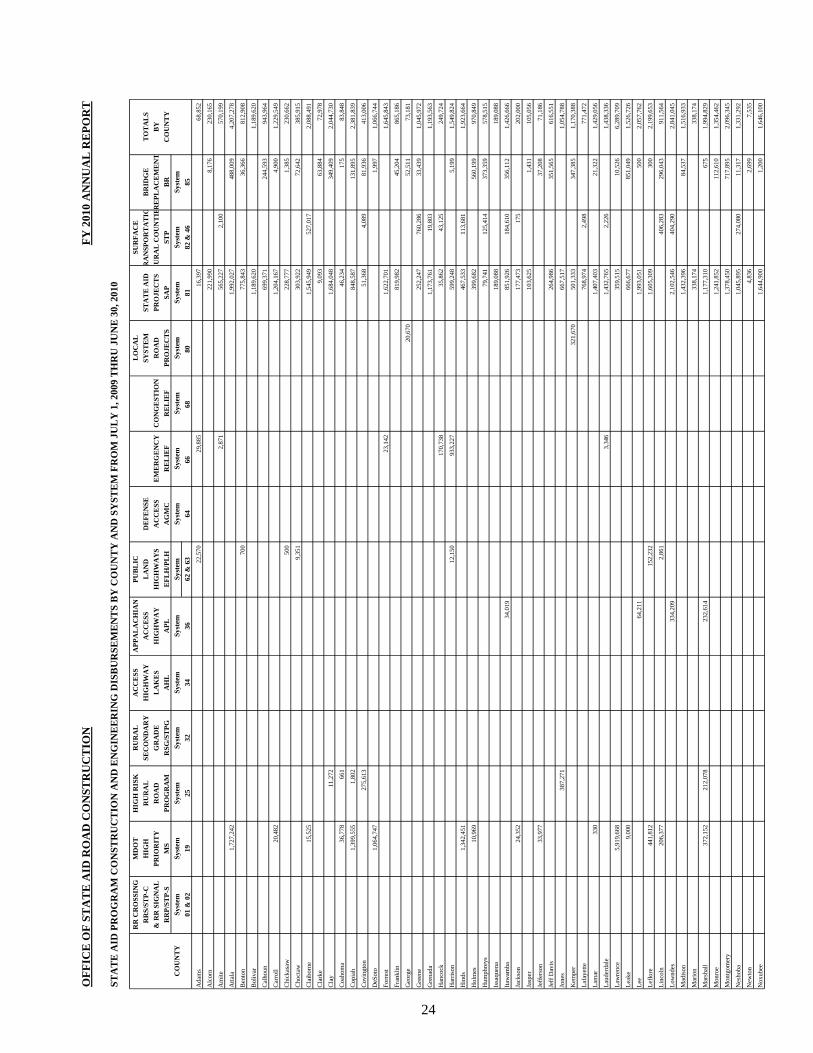
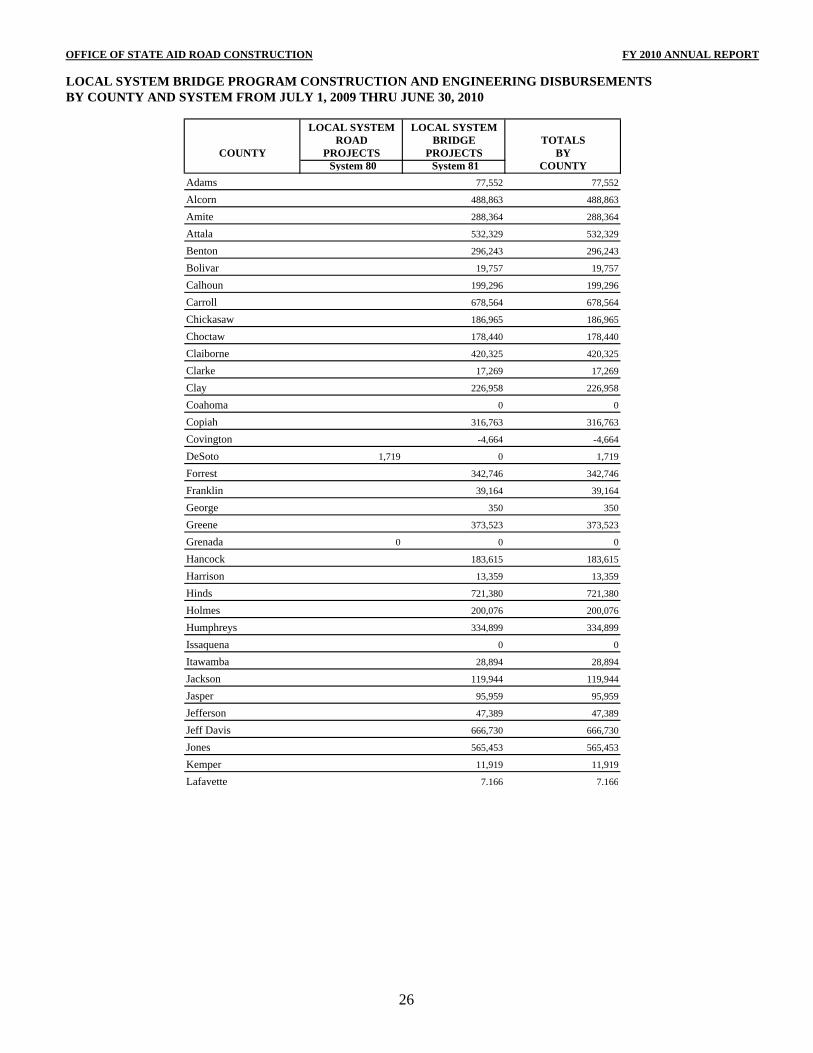
LOCAL SYSTEM BRIDGE PROGRAM CONSTRUCTION AND ENGINEERING DISBURSEMENTSBY COUNTY AND SYSTEM FROM JULY 1, 2009 THRU JUNE 30, 2010
LOCAL SYSTEM LOCAL SYSTEMROAD BRIDGE TOTALS
COUNTY PROJECTS PROJECTS BY System 80 System 81 COUNTY
Adams 77,552 77,552
Alcorn 488,863 488,863
Amite 288,364 288,364
Attala 532,329 532,329
Benton 296,243 296,243
Bolivar 19,757 19,757
Calhoun 199,296 199,296
Carroll 678,564 678,564
Chickasaw 186,965 186,965
Choctaw 178,440 178,440
Claiborne 420,325 420,325
Clarke 17,269 17,269
Clay 226,958 226,958
Coahoma 0 0
Copiah 316,763 316,763
Covington -4,664 -4,664
DeSoto 1,719 0 1,719
Forrest 342,746 342,746
Franklin 39,164 39,164
George 350 350
Greene 373,523 373,523
Grenada 0 0 0
Hancock 183,615 183,615
Harrison 13,359 13,359
Hinds 721,380 721,380
Holmes 200,076 200,076
Humphreys 334,899 334,899
Issaquena 0 0
Itawamba 28,894 28,894
Jackson 119,944 119,944
Jasper 95,959 95,959
Jefferson 47,389 47,389
Jeff Davis 666,730 666,730
Jones 565,453 565,453
Kemper 11,919 11,919
Lafayette 7,166 7,166
26
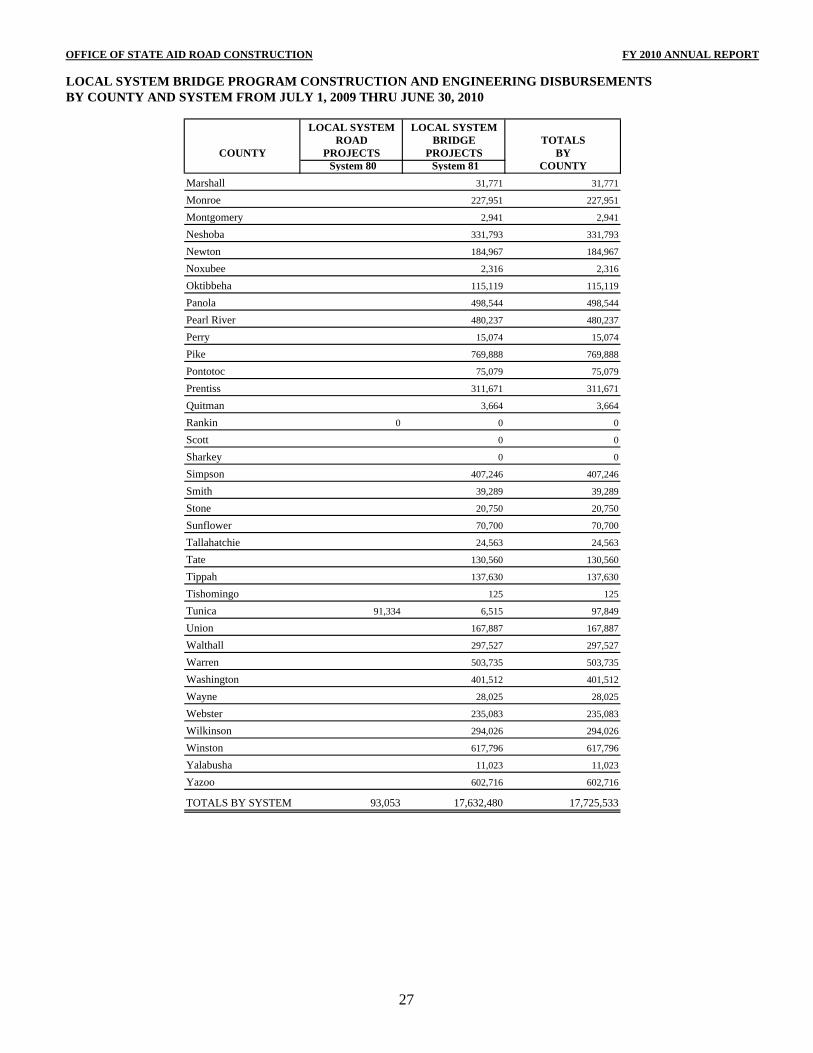
OFFICE OF STATE AID ROAD CONSTRUCTION FY 2010 ANNUAL REPORT
LOCAL SYSTEM BRIDGE PROGRAM CONSTRUCTION AND ENGINEERING DISBURSEMENTSBY COUNTY AND SYSTEM FROM JULY 1, 2009 THRU JUNE 30, 2010
LOCAL SYSTEM LOCAL SYSTEMROAD BRIDGE TOTALS
COUNTY PROJECTS PROJECTS BY System 80 System 81 COUNTY
Marshall 31,771 31,771
Monroe 227,951 227,951
Montgomery 2,941 2,941
Neshoba 331,793 331,793
Newton 184,967 184,967
Noxubee 2,316 2,316
Oktibbeha 115,119 115,119
Panola 498,544 498,544
Pearl River 480,237 480,237
Perry 15,074 15,074
Pike 769,888 769,888
Pontotoc 75,079 75,079
Prentiss 311,671 311,671
Quitman 3,664 3,664
Rankin 0 0 0
Scott 0 0
Sharkey 0 0
Simpson 407,246 407,246
Smith 39,289 39,289
Stone 20,750 20,750
Sunflower 70,700 70,700
Tallahatchie 24,563 24,563
Tate 130,560 130,560
Tippah 137,630 137,630
Tishomingo 125 125
Tunica 91,334 6,515 97,849
Union 167,887 167,887
Walthall 297,527 297,527
Warren 503,735 503,735
Washington 401,512 401,512
Wayne 28,025 28,025
Webster 235,083 235,083
Wilkinson 294,026 294,026
Winston 617,796 617,796
Yalabusha 11,023 11,023
Yazoo 602,716 602,716
TOTALS BY SYSTEM 93,053 17,632,480 17,725,533
27

This page intentionally left blank.