Embed Size (px)
Citation preview
OFFICE OF THE ACTUARY
The Financial Status of MedicarePresentation for the American Enterprise Institute
April 24, 2012
Richard S. Foster, FSAChief Actuary
Chart 1—Medicare enrollment, benefits, and
financing
Hospital Insurance (HI)
Supplementary Medical
Insurance (SMI)
Enrollment in CY 2011: Total .......................................... Proportion with services ...........
48 million 22%
Part B: 45 million Part D: 36 million Part B: 87% Part D: Approximately 86%
Benefits* ...................................... * Subject to certain
deductible and coinsurance requirements
Inpatient hospital care Skilled nursing care Home health care (post-institutional) Hospice care
Part B:
Physician services Outpatient hospital services Home health care (general) Other services, e.g. Diagnostic tests Medical equipment Ambulance
Part D: Prescription drug benefit
CY 2012 Financing .....................
HI tax on covered earnings:
1.45% payable by employees and employers, each
2.90% payable by self-employed Following elimination of HI contribution base
(effective 1994), HI tax applies to all earnings in covered employment
Tied to worker income in 2013 and later
Revenue from income taxation of OASDI benefits (portion between 50% & 85%)
Part B premiums and general revenue transfers: $99.90 standard monthly premium Tied to beneficiary income in 2007 and later Fees on manufacturers, importers of
brand-name Rx drugs General revenues cover 76% of costs
Part D drug premiums, general revenues, and State transfers: Base premium in 2012 is $31.08; average
premium is about $30; covers 25.5% of standard benefit costs, 13% of total costs
Tied to beneficiary income in 2011 and later State payments on behalf of certain
beneficiaries cover about 12% of costs General revenues cover 75% of costs
Personal Health Care GDP0%
1%
2%
3%
4%
5%
6%
7%
8%
9%
10%
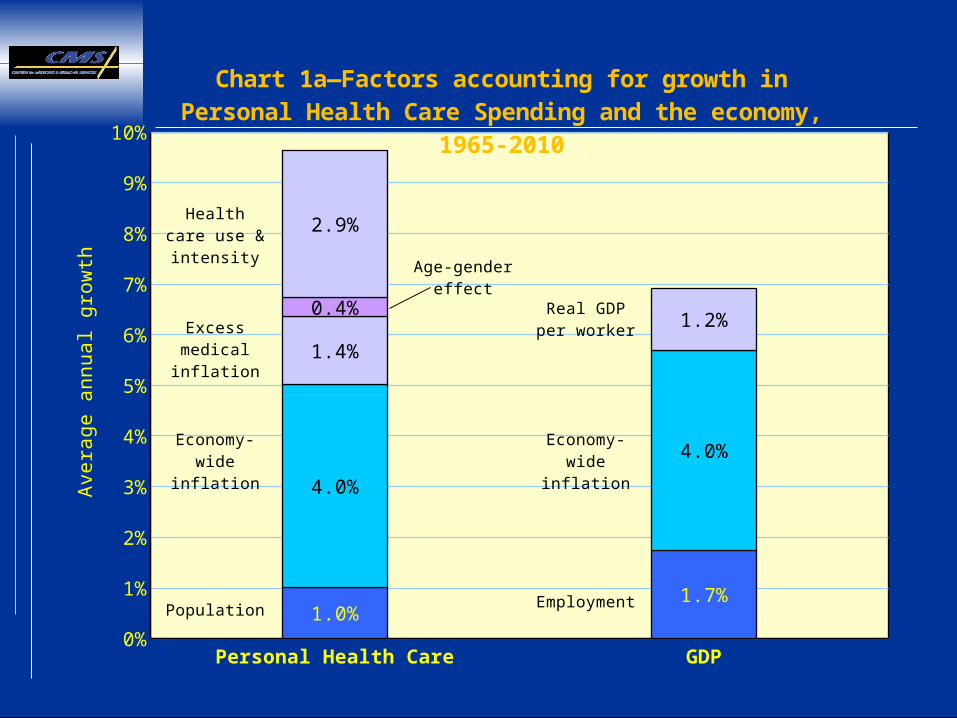
1.0%1.7%
4.0%
4.0%
1.4%
0.4%
2.9%
1.2%
Chart 1a—Factors accounting for growth in Personal Health Care Spending and the economy, 1965-2010
Ave
rage
ann
ual
grow
th
Population Employment
Economy-wide inflation
Economy-wide inflation
Excessmedical inflation
Real GDPper worker
Health care use & intensity
Age-gender ef-fect
1990199219941996199820002002200420062008201020122014201620182020$0
$100
$200
$300
$400
$500
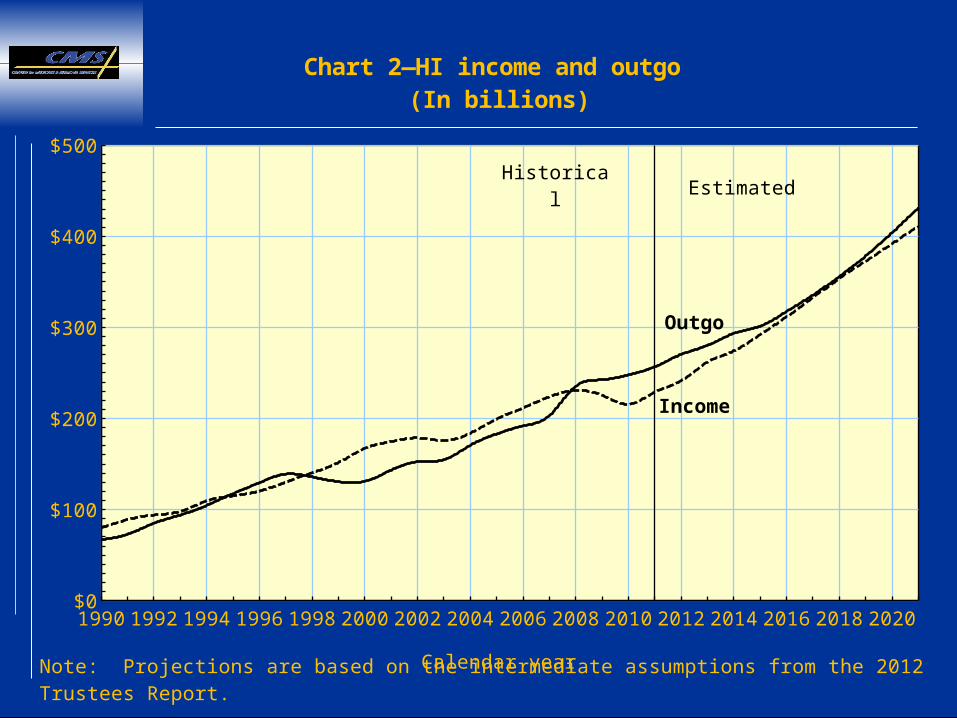
Chart 2—HI income and outgo (In billions)
Calendar year
In-come
Outgo
Note: Projections are based on the intermediate assumptions from the 2012 Trustees Re-port.
Historical Estimated
1970 1980 1990 2000 2010 2020 20300%
50%
100%
150%
200%
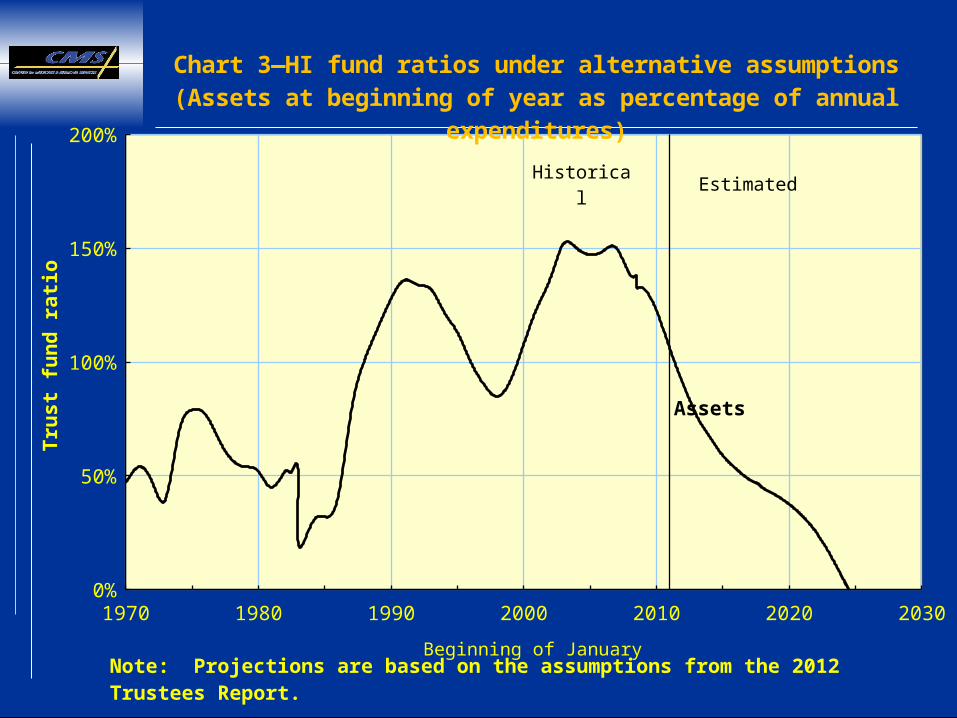
Assets
Chart 3—HI fund ratios under alternative assumptions(Assets at beginning of year as percentage of annual
expenditures)
Beginning of January
Tru
st
fun
d r
ati
o
Note: Projections are based on the assumptions from the 2012 Trustees Report.
Historical Estimated
1967 1977 1987 1997 2007 2017 2027 2037 2047 2057 2067 2077 20870%
1%
2%
3%
4%
5%
6%
7%
8%
Calendar year
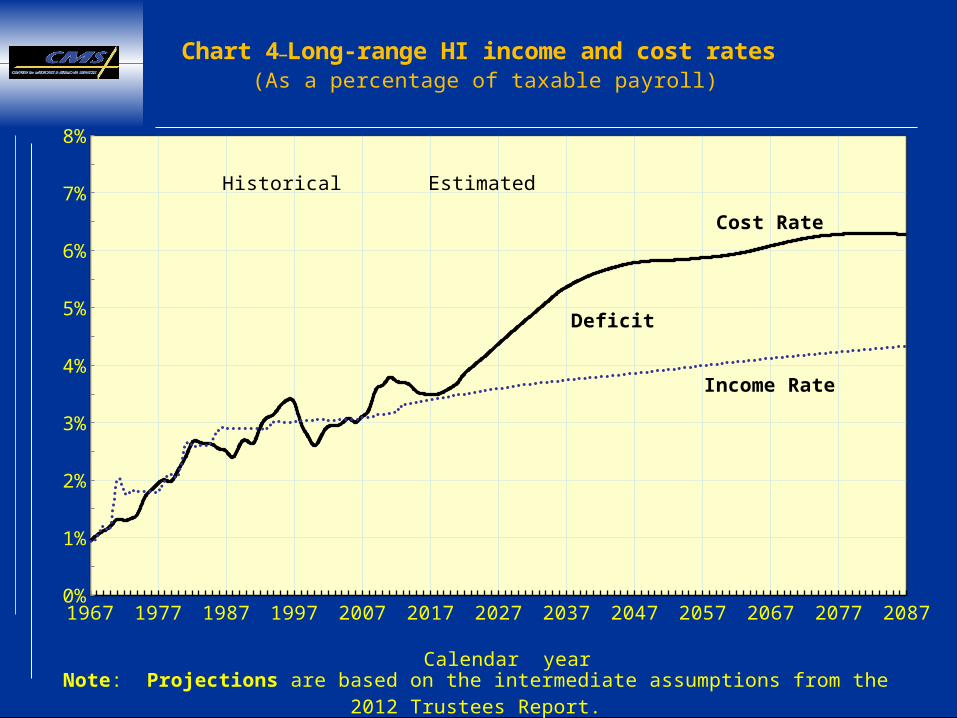
Cost Rate
Note: Projections are based on the intermediate assumptions from the 2012 Trustees Report.
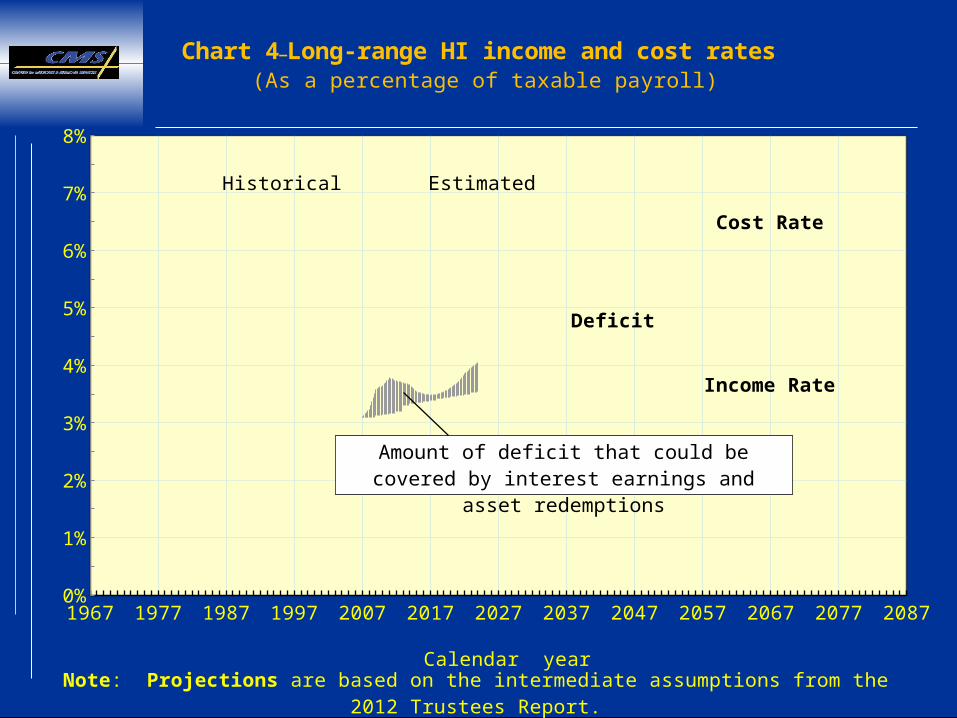
Chart 4—Long-range HI income and cost rates (As a percentage of taxable payroll)
Historical Estimated
Deficit
Income Rate
1967 1977 1987 1997 2007 2017 2027 2037 2047 2057 2067 2077 20870%
1%
2%
3%
4%
5%
6%
7%
8%
Calendar year
Cost Rate
Note: Projections are based on the intermediate assumptions from the 2012 Trustees Report.
Amount of deficit that could be covered by interest earnings and asset redemptions
Chart 4—Long-range HI income and cost rates (As a percentage of taxable payroll)
Historical Estimated
Deficit
Income Rate
1967 1977 1987 1997 2007 2017 2027 2037 2047 2057 2067 2077 20870%
1%
2%
3%
4%
5%
6%
7%
8%
9%
10%
Calendar year
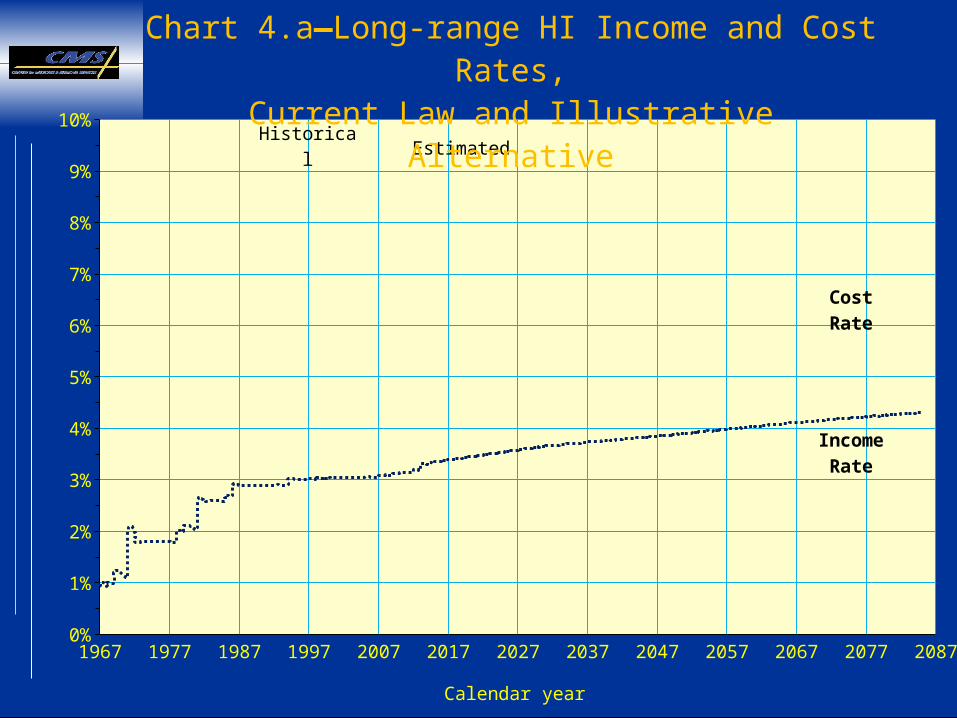
Historical Estimated
Cost Rate
Income Rate
Chart 4.a—Long-range HI Income and Cost Rates,Current Law and Illustrative Alternative
1967 1977 1987 1997 2007 2017 2027 2037 2047 2057 2067 2077 20870%
1%
2%
3%
4%
5%
6%
7%
8%
9%
10%
Calendar year
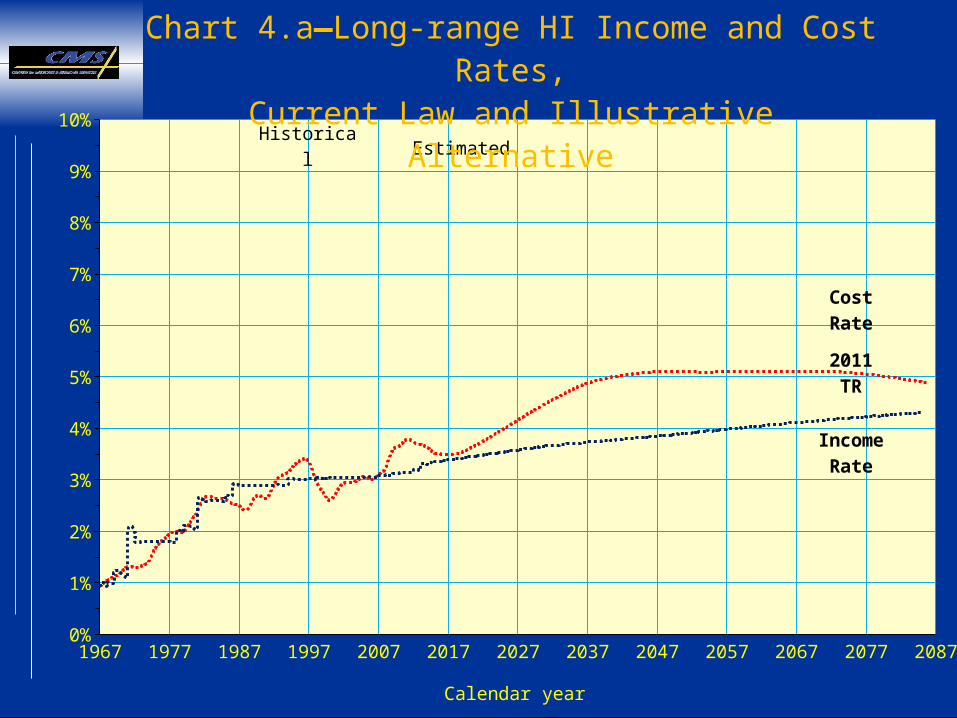
Historical Estimated
Cost Rate
Income Rate
Chart 4.a—Long-range HI Income and Cost Rates,Current Law and Illustrative Alternative
2011 TR
1967 1977 1987 1997 2007 2017 2027 2037 2047 2057 2067 2077 20870%
1%
2%
3%
4%
5%
6%
7%
8%
9%
10%
Calendar year
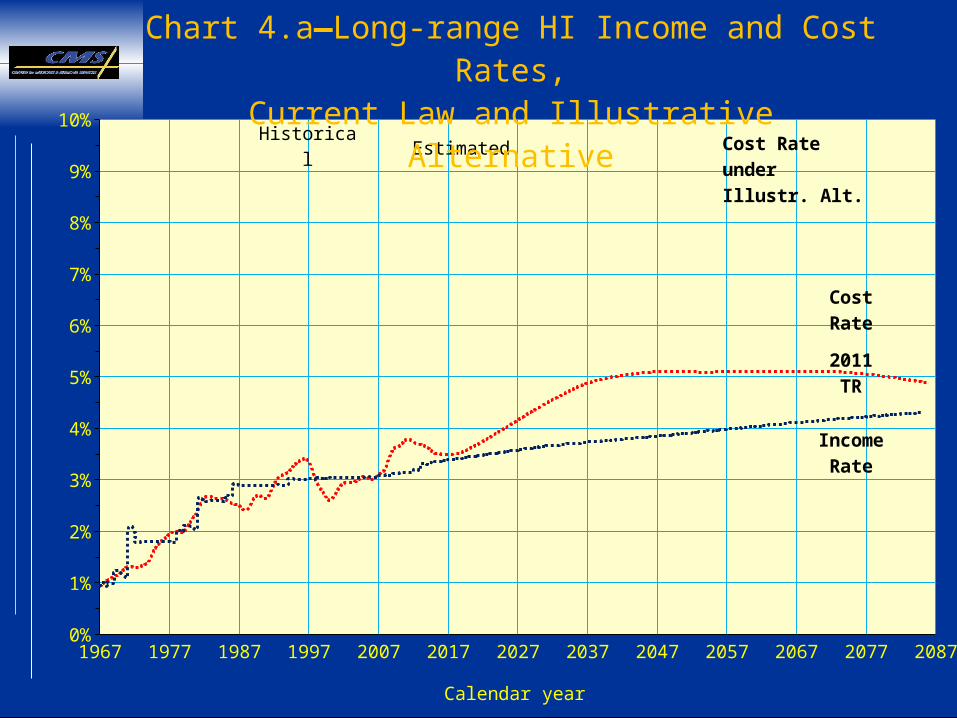
Historical Estimated
Cost Rate
Cost Rate underIllustr. Alt.
Income Rate
Chart 4.a—Long-range HI Income and Cost Rates,Current Law and Illustrative Alternative
2011 TR
1990 2000 2010 2020 2030 2040 2050 2060 2070 2080
-20%
0%
20%
40%
60%
80%
100%
120%
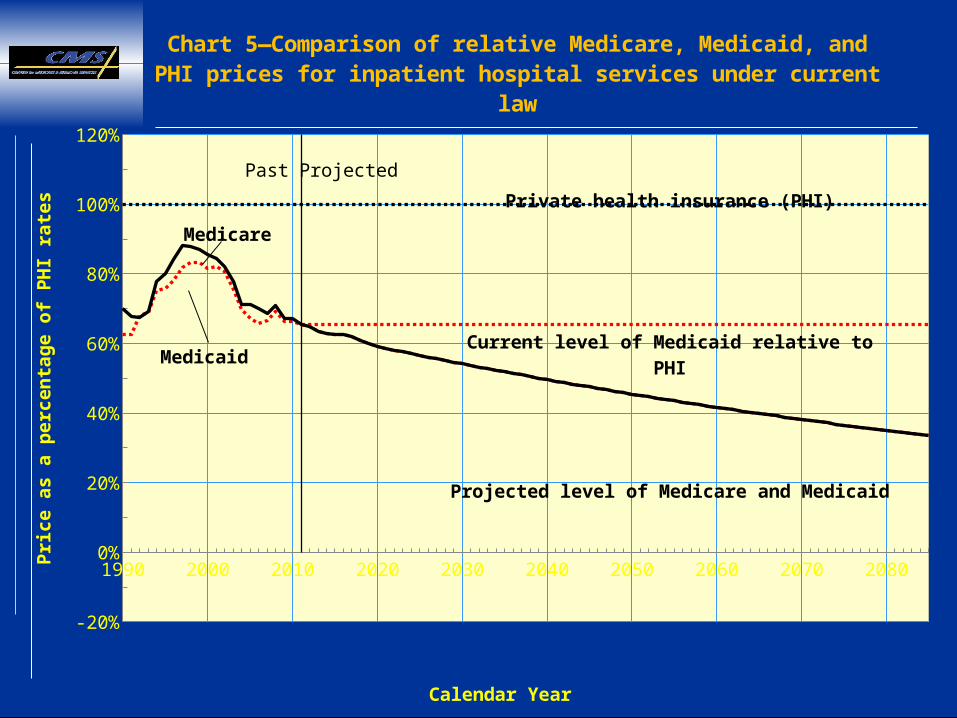
Chart 5—Comparison of relative Medicare, Medicaid, and PHI prices for inpatient hospital services under current
law
Calendar Year
Pri
ce
as a
pe
rce
nta
ge
of
PH
I ra
tes Private health insurance (PHI)
Medicare
Medicaid
Past Projected
Current level of Medicaid relative to PHI
Projected level of Medicare and Medicaid
2000 2010 2020 2030 2040 2050 2060 2070 2080
-20%
0%
20%
40%
60%
80%
100%
120%
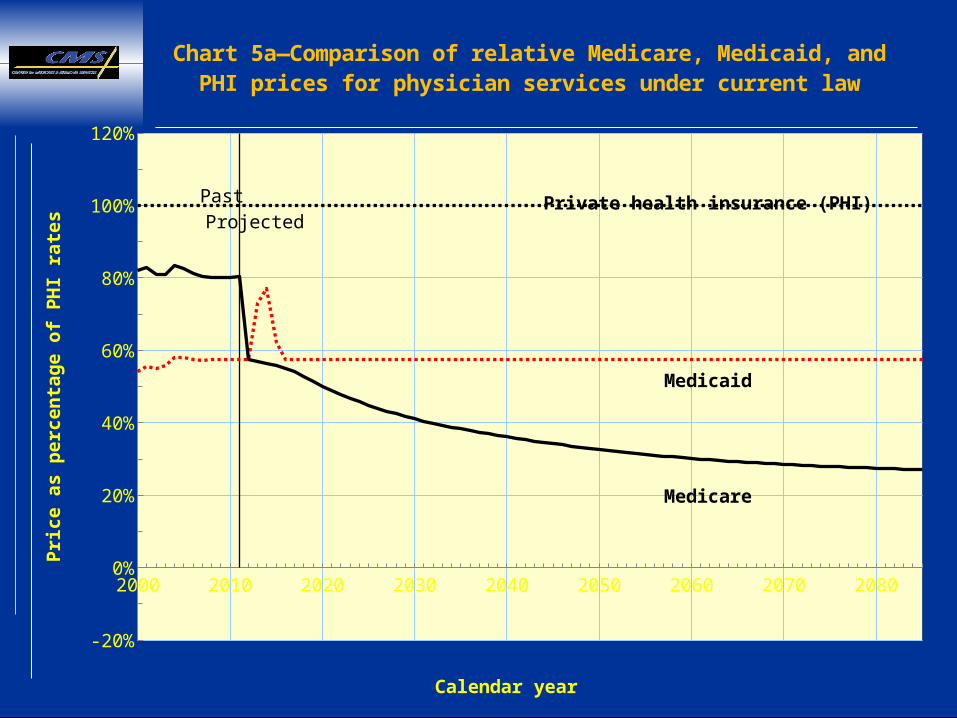
Chart 5a—Comparison of relative Medicare, Medicaid, andPHI prices for physician services under current law
Calendar year
Pri
ce
as p
erc
en
tag
e o
f P
HI
rate
s
Private health insurance (PHI)
Medicare
Medicaid
Past Pro-jected
1990 1992 1994 1996 1998 2000 2002 2004 2006 2008 2010 2012 2014 2016 2018 2020$0
$100
$200
$300
$400
$500
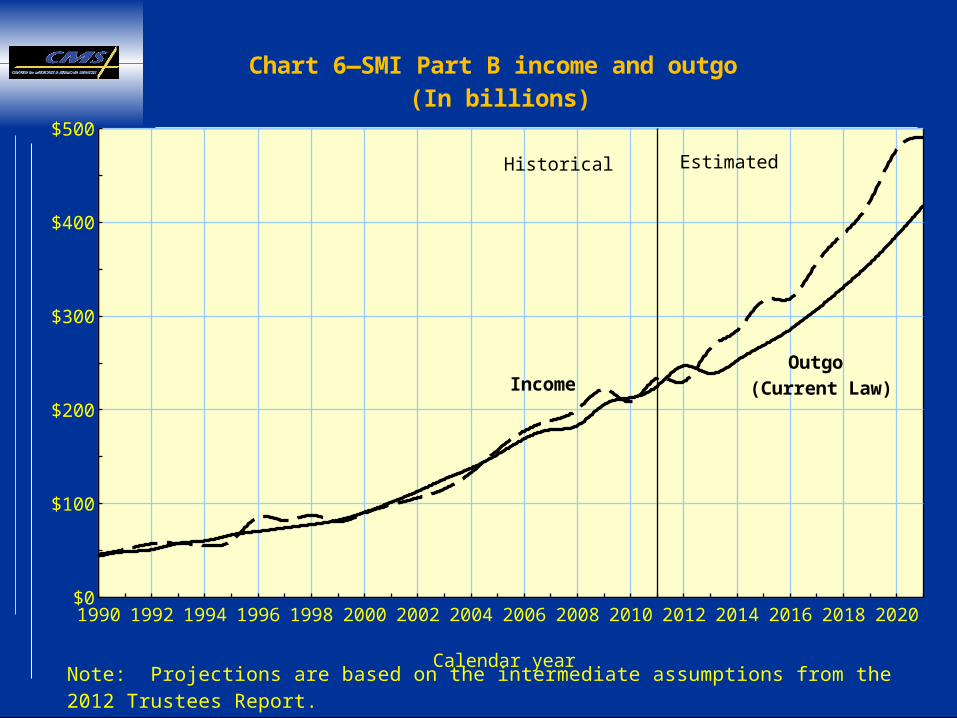
Chart 6—SMI Part B income and outgo (In billions)
Calendar year
IncomeOutgo
(Current Law)
Note: Projections are based on the intermediate assumptions from the 2012 Trustees Report.
Historical Estimated
1990 1992 1994 1996 1998 2000 2002 2004 2006 2008 2010 2012 2014 2016 2018 2020$0
$100
$200
$300
$400
$500
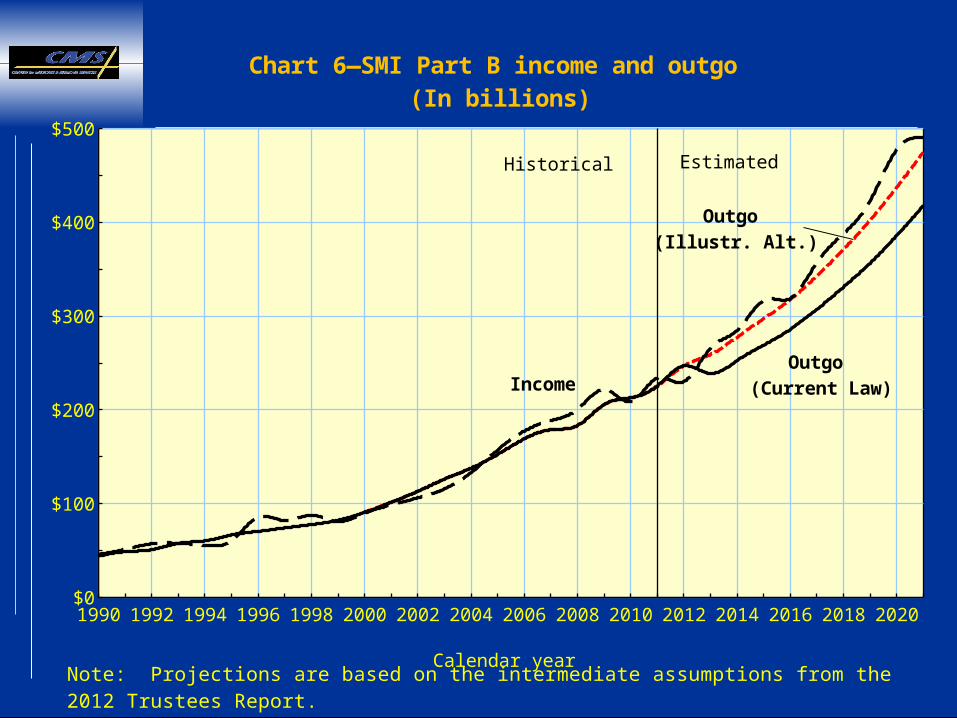
Chart 6—SMI Part B income and outgo (In billions)
Calendar year
IncomeOutgo
(Current Law)
Note: Projections are based on the intermediate assumptions from the 2012 Trustees Report.
Historical Estimated
Outgo (Illustr. Alt.)
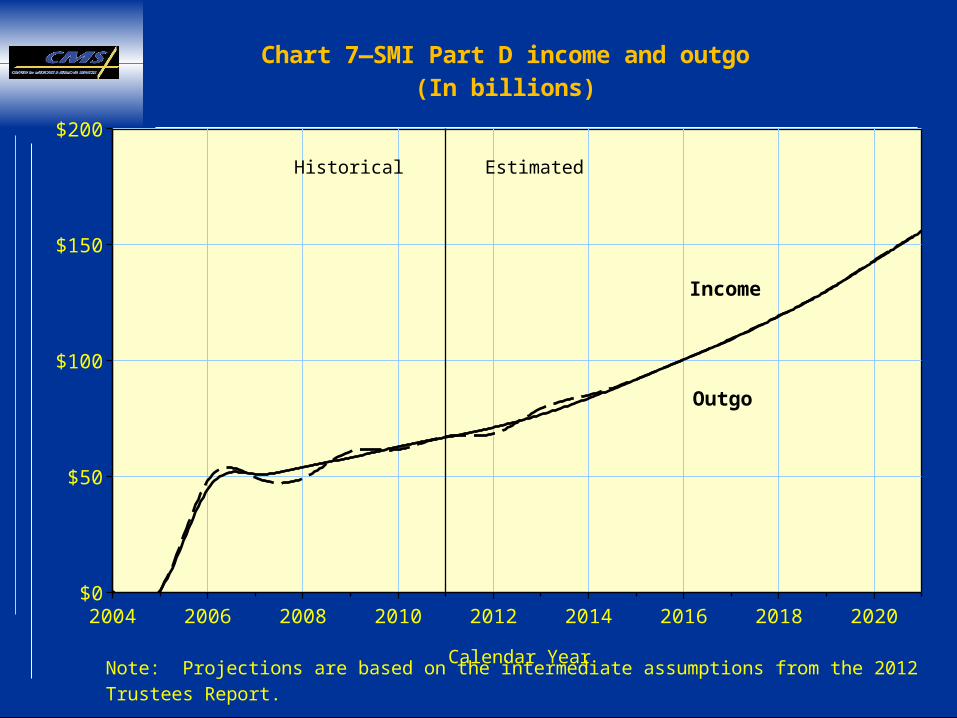
2004 2006 2008 2010 2012 2014 2016 2018 2020$0
$50
$100
$150
$200
Chart 7—SMI Part D income and outgo(In billions)
Calendar YearNote: Projections are based on the intermediate assumptions from the 2012 Trustees Report.
Outgo
Income
Historical Estimated
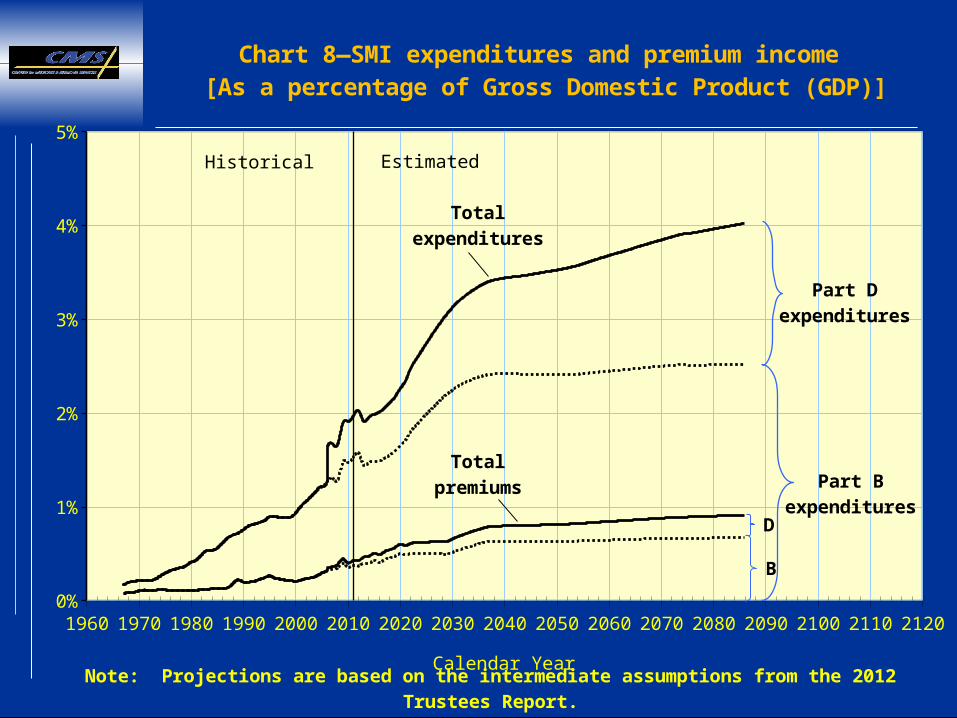
1960 1970 1980 1990 2000 2010 2020 2030 2040 2050 2060 2070 2080 2090 2100 2110 21200%
1%
2%
3%
4%
5%
Chart 8—SMI expenditures and premium income [As a percentage of Gross Domestic Product (GDP)]
Calendar YearNote: Projections are based on the intermediate assumptions from the 2012
Trustees Report.
Historical Estimated
Part B ex-penditures
Part D ex-penditures
Totalexpenditures
B
D
Totalpremiums
2000 2010 2020 2030 2040 2050 2060 2070 2080 20900%
2%
4%
6%
8%
10%
12%
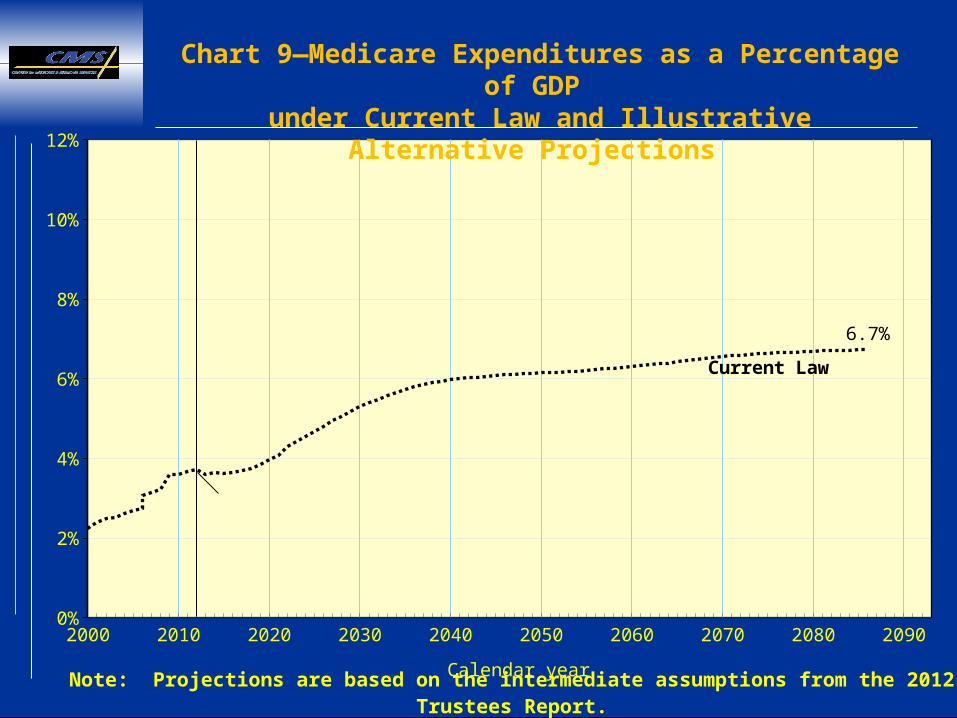
6.7%
Calendar year
Current Law
Note: Projections are based on the intermediate assumptions from the 2012 Trustees Report.
Chart 9—Medicare Expenditures as a Percentage of GDP under Current Law and Illustrative Alternative Projections
2000 2010 2020 2030 2040 2050 2060 2070 2080 20900%
2%
4%
6%
8%
10%
12%
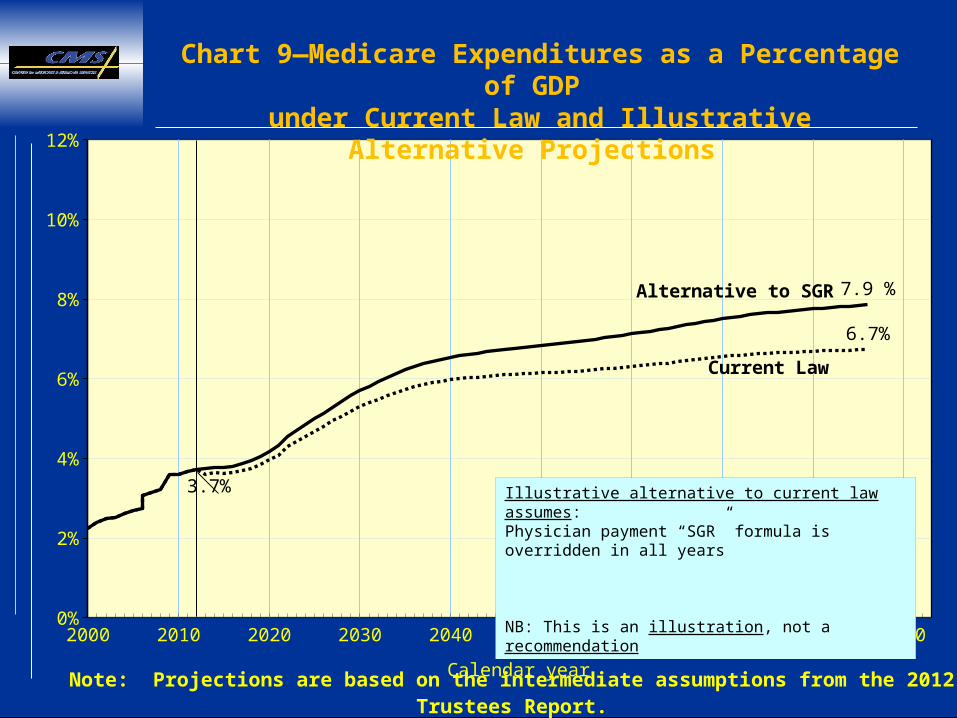
3.7%
7.9 %
6.7%
Calendar year
Current Law
Alternative to SGR
Note: Projections are based on the intermediate assumptions from the 2012 Trustees Report.
Chart 9—Medicare Expenditures as a Percentage of GDP under Current Law and Illustrative Alternative Projections
Illustrative alternative to current law assumes:Physician payment “SGR” formula is overridden in all years
NB: This is an illustration, not a recommendation
2000 2010 2020 2030 2040 2050 2060 2070 2080 20900%
2%
4%
6%
8%
10%
12%
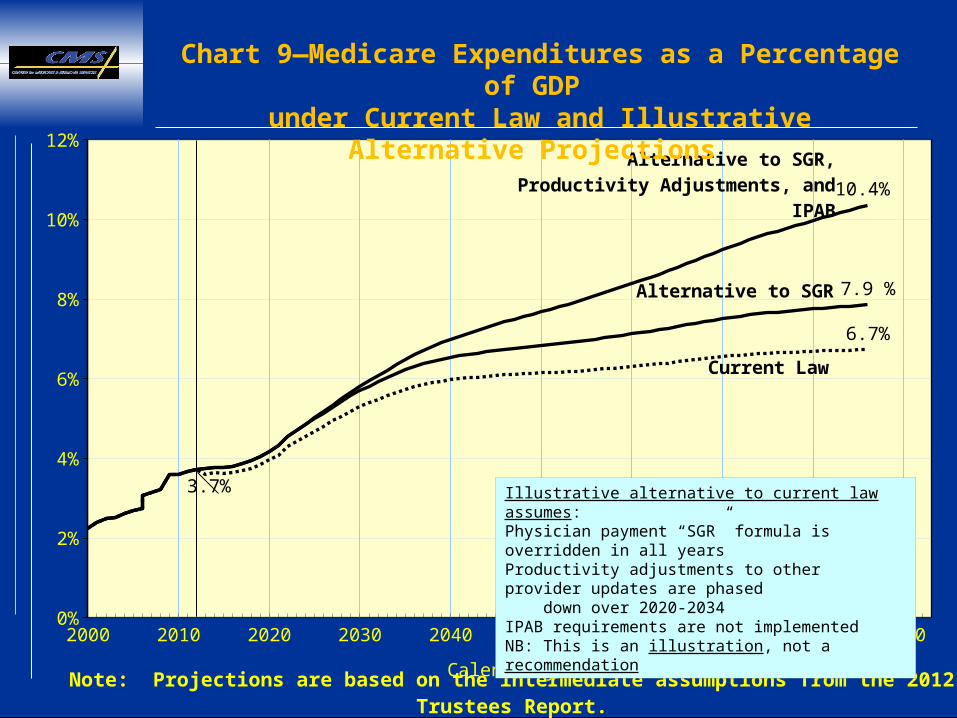
3.7%
7.9 %
10.4%
6.7%
Calendar year
Current Law
Alternative to SGR,Productivity Adjustments, and
IPAB
Alternative to SGR
Note: Projections are based on the intermediate assumptions from the 2012 Trustees Report.
Chart 9—Medicare Expenditures as a Percentage of GDP under Current Law and Illustrative Alternative Projections
Illustrative alternative to current law assumes:Physician payment “SGR” formula is overridden in all yearsProductivity adjustments to other provider updates are phased down over 2020-2034IPAB requirements are not implementedNB: This is an illustration, not a recommendation