Embed Size (px)
Citation preview

Leading the Northern Cape Province to prosperity with a quality life for all.
Tel: 053 838-2600, Fax: 053 838-2767JW Sauer Building, Cnr Roper & Quinn Road, Kimberley, 8301
PR260/2014 ISBN: 978-0-621-43004-2
Designed and Printed by SwiftPrint, Tel 053 839-2900, Kimberley
Office of the Premier Annual Report
2013/2014

Northern Cape Office of the Premier Vote 1 | Annual Report for 2013/14 Financial Year
1
Table of ContentsPART A: General Information ___________________________________________________________________ 3
A.1 Department’s General Information ________________________________________________________ 4A.2 List of Abbreviations /Acronyms ___________________________________________________________ 5A.3 Foreword by the Premier ________________________________________________________________ 6A.4 Introduction by Director-General __________________________________________________________ 7A.5 Report of the Accounting Officer __________________________________________________________ 8A.6 Statement of Responsibility and Confirmation of the Accuracy of the Annual Report ________________12A.7 Strategic Overview _____________________________________________________________________13
7.1) Vision ___________________________________________________________________________137.2) Mission __________________________________________________________________________137.3) Values ___________________________________________________________________________13
A.8 Legislative and Other Mandates __________________________________________________________14A.9 Organisational Structure ________________________________________________________________16A.10 Entities Reporting to the Premier _________________________________________________________16
PART B: Performance Information ______________________________________________________________17B.1 Overview of Departmental Performance ___________________________________________________18
1.1) Service delivery environment ________________________________________________________181.2) Service Delivery Improvement Plan ___________________________________________________211.3) Organisational environment Guideline ________________________________________________211.4) Key policy developments and legislative changes ______________________________________ 22
B.2 Strategic Outcome Oriented Goals _______________________________________________________ 22B.3 Performance Information by Programme __________________________________________________ 23
3.1) PROGRAMME 1: ADMINISTRATION ___________________________________________________ 233.2) PROGRAMME 2: INSTITUTIONAL DEVELOPMENT ________________________________________ 293.3) PROGRAMME 3: POLICY AND GOVERNANCE ____________________________________________413.4) Strategy to overcome areas of under performance ______________________________________ 503.5) Changes to planned targets _________________________________________________________513.6) Linking performance with budgets ___________________________________________________53
B.4 Transfer Payments _____________________________________________________________________ 544.1) Transfer payments to Public Entities _________________________________________________ 544.2) Transfer payments to all organisations other than public entities __________________________ 54
B.5 Conditional Grants ____________________________________________________________________ 545.1) Conditional grants and earmarked funds paid _________________________________________ 545.2) Conditional grants and earmarked funds received ______________________________________ 54
B.6 Donor Funds __________________________________________________________________________556.1) Donor Funds Received _____________________________________________________________55
B.7 Capital Investment _____________________________________________________________________55

Northern Cape Office of the Premier Vote 1 | Annual Report for 2013/14 Financial Year
2
PART C: Governance _________________________________________________________________________ 56C.1 Introduction ___________________________________________________________________________57C.2 Risk Management ______________________________________________________________________57C.3 Fraud and Corruption ___________________________________________________________________57C.4 Minimising Conflict of Interest ____________________________________________________________57C.5 Code of Conduct ______________________________________________________________________ 58C.6 Health Safety and Environmental Issues ___________________________________________________ 58C.7 Portfolio Committees __________________________________________________________________ 58C.8 SCOPA Resolutions ____________________________________________________________________ 58C.9 Prior modifications to audit reports _______________________________________________________ 58C.10 Internal Control Unit ___________________________________________________________________ 58C.11 Internal Audit and Audit Committees ______________________________________________________59C.12 Audit Committee Report ________________________________________________________________ 60
PART D: Human Resource Management ________________________________________________________ 64D.1 Human Resources Oversight Statistics _____________________________________________________ 65
PART E: Financial Information _________________________________________________________________ 86 Report of the Auditor General ____________________________________________________________87 Annual Financial Statements _____________________________________________________________92

Northern Cape Office of the Premier Vote 1 | Annual Report for 2013/14 Financial Year
3
PART A: General Information
Northern Cape Office of the Premier Vote 1 | Annual Report for 2013/14 Financial Year
4
PART A: General Information A.1 Department’s General Information
Full name of the department Northern Cape Office of the Premier
Physical address of Head Office JW Sauer BuildingCorner of Roper and Quinn StreetsKimberley
Postal Address of Head Office Private Bag X5016Kimberley8300
Contact telephone numbers 053 8382950
Email address:[email protected]@ncpg.gov.za
Website address www.northern-cape.gov.za

Northern Cape Office of the Premier Vote 1 | Annual Report for 2013/14 Financial Year
5
A.2 List of Abbreviations /Acronyms
AFS Annual Financial Statements
AGSA Auditor-General of South Africa
AO Accounting Officer
BBBEE Broad Based Black Economic Empowerment
CFO Chief Financial Officer
CJS Criminal Justice Systems
DORA Division of Revenue Act
DPSA Department of Public Service Administration
EU European Union
GIAMA Government Immovable Asset Management Act
HOD Head of Department
HR Human Resources
MEC Member of Executive Council
MPSA Minister for the Public Service and Administration
MTEF Medium Term Expenditure Framework
MTS Provincial Maths, Science and Technology
NC Northern Cape
NED Northern Cape Education Department
PFMA Public Finance Management Act
PPP Public Private Partnerships
RWOPS Remuneration for work performed outside Public Service
SCM Supply Chain Management
SCOPA Standing Committee on Public Accounts
SDIP Service Delivery Improvement Plan
SITA State Information Technology Agency
SMME Small Medium and Micro Enterprises
SNE Special Needs Education
TFR Total Fertility Rate
TR Treasury Regulations

Northern Cape Office of the Premier Vote 1 | Annual Report for 2013/14 Financial Year
6
A.3 Foreword by the Premier
This 2013/14 annual report is significant as it is a last one for the fourth term of government. Furthermore it is at a backdrop of our celebrations of 20 years of democracy and freedom. I have no doubt in my mind that work performed by the Office of the Premier which is documented elsewhere in this report has contributed in some ways in the betterment of lives of people of Northern Cape. The work of the Office was guided by the outcomes approach of the government as well as its focus policy priority areas. I take this opportunity to thank the Director-General, his management collective and all staff of the Office of the Premier for all their endeavors to discharge coordination and monitoring responsibilities within the Northern Cape Provincial administration during 2013/14 financial year. I congratulate the Director-General and his team for obtaining a financially unqualified audit opinion for Vote 1. I am convinced that the Office of the
Premier will continue to improve in its service offerings to the Provincial administration in the upcoming financial year.
Finally, I take this opportunity to thank internal and external stakeholders in their various roles for their support and cooperation with the Office of the Premier during the 2013/14 financial year.
Sylvia LucasHonourable Premier: Northern Cape

Northern Cape Office of the Premier Vote 1 | Annual Report for 2013/14 Financial Year
7
A.4 Introduction by the Director-General
In presenting this annual report, I thank the Premier for guidance and support in my execution of functions as the Director-General for the Northern Cape as well as the Accounting Officer for Vote 1. I also appreciate the support and cooperation that I received from the Heads of department in the Provincial administration and all relevant stakeholders.
I am very pleased that the Office of the Premier obtained a financially unqualified audit opinion from our external auditors in the audit of 2013/14 annual financial statements. I am also equally pleased that the external auditors were satisfied with our pre-determined objectives in that they did not detect any material findings in our performance information documented elsewhere in this annual report. For these, I salute my management team as a collective as well as all staff of the Office of the
Premier as this was possible through a team effort.
On the other side of the coin, I am a bit disappointed that there were one or two non-compliance issues of concern to the external auditors, that is mainly irregular expenditure, which was an inhibition for us to reach a pinnacle audit outcome with no findings. Without being seen as making excuses, there were exogenous causation elements on the material portion of the reported irregular expenditure due to idiosyncratic nature of the Office of the Premier’s operations at times. Some of the reported irregular expenditure could have been circumvented due its endogeniety, for that we have taken appropriate disciplinary action on the affected officials as reported elsewhere in this report. In my view, these non-compliance findings are not insurmountable since they are not pervasive in totality, therefore, we are instituting realistic action plans for improvement.
Nationally, the Office of the Premier is one of the leading Offices on the turnaround time in terms resolving queries and complaints lodged by citizens of Northern Cape in the Presidential hotline. On a province-wide scale, through our coordination role, we played a significant role to ensure 100% disclosure of senior management financial disclosures to the Public service commission. Through its corporate governance institutional structures such as Executive Council meetings, HOD & other fora, Provincial Lekgotla, PIGF’s (Premier’s Inter Governmental fora), cabinet cluster meetings and many others, the Office played a central coordinating role throughout the 2013/14 financial year on issues affecting the entire Provincial administration on key projects and initiatives around key policy priority areas.
Overall, I am satisfied without performance of the Office of the Premier. Of course there is always a room for improvement as we are always striving for perfection.
Advocate Justice BekebekeDirector-GeneralNorthern Cape

Northern Cape Office of the Premier Vote 1 | Annual Report for 2013/14 Financial Year
8
A.5 Report of the Accounting Officer
Overview of the operations of the department:
The Office of the Premier is responsible for coordinating, monitoring and evaluating of national government policies in the province. The department derives its mandate from the constitution of South Africa, Act 108 of 1996.
Advocate Justice Bekebeke was the Director-General for the Northern Cape Provincial Administration (as well as the Accounting Officer: Officer of the Premier) for the entire 2013/14 financial year.
Overview of the financial results of the department:
Departmental receipts
Departmental receipts
2013/2014 2012/2013
Estimate(R’000)
Actual Amount Collected
(R’000)
(Over)/Under Collection
(R’000)
Estimate (R’000)
Actual Amount
Collected (R’000)
(Over)/Under Collection
(R’000)
Sale of goods and services other than capital assets
110 88 22 104 73 31
Sale of capital assets 90 200 (110) - - -
Financial transactions in assets and liabilities
48 (48) 85 100 (15)
Total 200 336 (136) 189 173 16
The Office of the Premier is not a revenue collecting department. Revenue collected consists of sale of bid documents, garnishee orders, agency fees received by Insurance companies and debts paid by government officials and departments.
Programme Expenditure
Programme Name2013/2014 2012/2013
Final Appropriation
Actual Expenditure
(Over)/ Under Expenditure
Final Appropriation
Actual Expenditure
(Over)/ Under
Expenditure
R’000 R’000 R’000 R’000 R’000 R’000
Administration 81 959 79 663 2 296 69 862 69 219 643
Institutional Development
72 477 71 526 951 52 510 52 509 1
Policy and Governance
32 736 28 931 3 805 34 605 30 059 4 546
Total 187 172 180 120 7 052 156 977 151 787 5 190
Variance of R2 296 000 under Programme 1 is as a result of furniture and infrastructure expenditure specifically earmarked for the relocation of officials from Templar building to JW Sauer Building, which was committed but could not be finalised at year end due to delays in renovations by Transnet Properties. The finalisation of this project was postponed to 31 August 2014 and a rollover of funds has been requested to re-allocate funds in the 2014/15 financial year.

Northern Cape Office of the Premier Vote 1 | Annual Report for 2013/14 Financial Year
9
Variance of R951 000 under Programme 2 is attributed to delays in the renewal of Symantec software licences on the part of SITA to procure the service of an approved SITA service provider. As at year end the funds were committed and a rollover of funds request has been submitted to Provincial Treasury for funds to be re-allocated in the 2014/15 financial year.
Variance of R3 805 000 is attributed to earmarked funds for the Northern Cape Provincial Government’s 20 year review project, which was committed but not finalised at year end due to delays in the appointment process to ensure compliance with supply chain management processes. Furthermore delays in the delivery of some capital assets contributed to the saving. A rollover request for both occurrences has been submitted to Provincial Treasury for re-allocation of funds during the 2014/15 financial year.
Virements/roll overs
Virements
At financial year end, virements between all three programmes of the vote were processed to defray excess expenditure on goods and services utilising savings from compensation of employees. Refer to the detailed breakdown of the virements as reflecting on the appropriation statement.
The virements were approved by the Accounting Officer in compliance with provisions of section 43 of the Public Finance Management Act (PFMA). Detailed reports pertaining to the virements were submitted to Provincial Treasury and the Executing Authority in compliance with paragraph 43 (2) of the PFMA.
Roll-overs
At financial year end savings of R643 000, R1 000 and R4 546 000 were realised under Programme 1, 2 and 3 respectively. These savings relate to specific earmarked funds, which could not be spent by financial year end and requests for roll-over was subsequently submitted to Provincial Treasury. Refer to Programme Expenditure for details thereof.
Public Private Partnerships
None concluded during 2013/14.
Discontinued activities / activities to be discontinued
None.
New or proposed activities
With effect from 1 April 2013, Provincial Human Resources Development (HRD) was transferred from the Department of Education to the Office of the Premier. The rationale of the aforementioned transfer was to raise the profile of the function to the strategic level of the Office of the Premier which is an apex of provincial government thereby ensuring better coordination of the provincial HRD strategy.

Northern Cape Office of the Premier Vote 1 | Annual Report for 2013/14 Financial Year
10
The following are the financial implications of the aforesaid transfer to the 2013/14 annual financial statements to the receiving department:
• Three(3)employeesweretransferredinwithanimpacttotheopeningbalanceoftheemployeebenefitsnote.Refer to note 31 in the annual financial statements.
• The budget relating to the transferred functionwas adjusted centrally through the Provincial Treasury tocoincide with the 2013/14 budget allocation letter. Therefore there is no financial impact of the budget transfer of the function in the 2013/14 appropriation statement.
Supply chain management
The provincial administration through the Office of the Premier concluded and participated in a tripartite, Nation @ Work project, involving the South African Broadcasting Corporation, the Department of Communications and the Office of the Premier. The value of the project was R13 543 508. All due processes were conformed to.
Due to the unique nature of the Office of the Premier, irregular expenditure to the value of R5 022 000.00 was incurred. Detailed motivations were documented citing reasons for the supply chain management processes followed. Examples of the irregular expenditure include rendering of services in remote areas, high profile provincial events held at short notice, engagement of service providers biased towards quality and capacity considerations, etc. Unfortunately there was a potential risk that this expenditure would not meet the narrow definition of deviation as per the supply chain management framework. To avoid qualification and different interpretation risks as well as inevitable debates on the regularity and irregularity of such expenditure, the Office of the Premier decided to report it as irregular as the broad definition of deviation may not meet the narrow one. We are confident that the condoning authority will understand the context and circumstances that gave rise to the expenditure.
For other transactions, preventative controls are in place for the prevention of irregular expenditure. However, there are instances where officials did not implement those controls. The value of this irregular expenditure that could have been avoided is R1 500 000. We have charged the officials after they were given appropriate training.
Gifts and Donations received in kind from non-related parties
Gifts and donations to the value of R130 000 were received by the Office of the Premier. Refer to Annexure 1D for a detailed breakdown.
Exemptions and deviations received from the National Treasury
None

Northern Cape Office of the Premier Vote 1 | Annual Report for 2013/14 Financial Year
11
Events after the reporting date
During the post balance sheet period, a final settlement of R 699 334.50 was reached by both affected parties on a legal dispute that existed at balance sheet date and was in its final stage of being settled. The settlement was a prudent measure to avoid escalation of costs on the issue.
The impact of the aforementioned post balance sheet event at financial statement level is an upward adjustment of the specific provision on the dispute raised at reporting date to R 699 334.50 to ensure fair presentation. The legal provision that was initially under-provided for at reporting date based on available information at the time. Refer to note 27: Provisions.
R’000
Upward of the legal Adjustment Provision 699
699
Acknowledgement/s or Appreciation
I would like to take this opportunity to thank the Premier for guidance, my management team and staff in general for support throughout the financial year.
Approval and sign off
_________________Advocate Justice BekebekeAccounting Officer Office of the PremierDate: 31 May 2014

Northern Cape Office of the Premier Vote 1 | Annual Report for 2013/14 Financial Year
12
A.6 Statement of Responsibility and Confirmation of the Accuracy of the Annual Report
To the best of my knowledge and belief, I confirm the following:
All information and amounts disclosed throughout the annual report are consistent.
The annual report is complete, accurate and is free from any omissions.
The annual report has been prepared in accordance with the guidelines on the annual report as issued by National Treasury.
The Annual Financial Statements (Part E) have been prepared in accordance with the modified cash standard and the relevant frameworks and guidelines issued by the National Treasury.
The Accounting Officer is responsible for the preparation of the annual financial statements and for the judgements made in this information.
The Accounting Officer is responsible for establishing and implementing a system of internal control that has been designed to provide reasonable assurance as to the integrity and reliability of the performance information, the human resources information and the annual financial statements.
The external auditors are engaged to express an independent opinion on the annual financial statements.
In my opinion, the annual report fairly reflects the operations, the performance information, the human resources information and the financial affairs of the department for the financial year ended 31 March 2014.
Yours faithfully
___________________ Accounting OfficerAdvocate Justice BekebekeDate 31 May 2014

Northern Cape Office of the Premier Vote 1 | Annual Report for 2013/14 Financial Year
13
A.7 Strategic Overview
7.1 Vision
Leading the Northern Cape Province to prosperity with a quality life for all.
7.2 Mission
To provide strategic leadership that will stimulate economic growth to its full potential and ensure high levels of social development.
7.3 Values
In order that it may realise its vision and mission the Office of the Premier has adopted the following values and guiding principles:
• Leadership—Wewillprovide leadership in all aspectsofprovincialgovernmentoperationsandpromoteevidence-based decision making;
• Transparencyandaccountability-Wewillbetransparentinallourservicedeliveryprocessandfosteracultureof fairness, honesty and integrity;
• Operational excellence—We are committed to rooting out irregular and corrupt activities and promotecontinuous learning, professionalism and efficient operations;
• Responsivenessandeffectiveness—Wewillberesponsivetotheneedsofourpeopleanddeliverhighqualityvalue added services;
• Equity and accessibility—We will improve access to services and treat our people equitably, especially,mainstreaming vulnerable groups; and
• Teamwork andparticipation—Wewillworkwithdepartments in theprovince andother stakeholders tostreamline and fast track the delivery of public services in the province.

Northern Cape Office of the Premier Vote 1 | Annual Report for 2013/14 Financial Year
14
A8 Legislative and Other Mandates
The Office of the Premier is centrally positioned within the provincial government and derives its mandates from the following but not exhaustive legislation and regulatory framework.
• TheConstitutionoftheRepublicofSouthAfrica,1996;• ThePublicFinanceManagementAct,(ActNo.1of1999);• TreasuryRegulations;• AnnualDivisionofRevenueAct;• ThePublicServiceActandRegulations;• BasicConditionsofEmploymentAct,1997(ActNo.75of1997);• LabourRelationsAct,1995(ActNo.66of1995);• EmploymentEquityAct,1998(ActNo.55of1998);• SkillsDevelopmentAct,1998(ActNo.97of1998);• SkillsDevelopmentLevyAct,1999(ActNo.9of1999);• OccupationalHealthandSafetyAct,1983(ActNo.85of1993);• PromotionofAccesstoInformationAct,2000(ActNo.2of2000);• PromotionofAdministrativeofJusticeAct,2000(ActNo.3of2000);• TheIntegratedNationalDisabilityStrategyof1997;• NorthernCapePromotionofYouthAffairsAct,(ActNo.8of1994);• NationalPolicyFrameworkforWomen’sEmpowermentandGenderEquality;• ChildCareAct,2005(ActNo.38of2005);• PreferentialProcurementPolicyFrameworkAct,2000(ActNo.2of2000);• BroadBasedBlackEconomicEmpowermentAct,2000;• VariousagreementsnegotiatedattheprovincialCouncil,PSCBCandGeneralPublicServiceSectoralBargaining
Council;• PromotionofEquality&PreventionofUnfairDiscriminationAct4of2000;• TraditionalLeadershipandGovernanceFrameworkActof2003;• Inter-GovernmentalRelationsFrameworkAct13of2005;
Constitutional Mandates
The Premier exercises the executive authority, together with the other members of the Executive Council, by-• implementingprovinciallegislationintheprovince;• implementingallnational legislationwithinthefunctionalareaslistedinSchedule4or5exceptwherethe
Constitution or an Act of Parliament provides otherwise;• administeringintheprovince,nationallegislationoutsidethefunctionalareaslistedinSchedule4and5,the
administration of which has been assigned to the provincial executive in terms of an Act of Parliament;• developingandimplementingprovincialpolicy;• co-ordinatingthefunctionsoftheprovincialadministrationanditsdepartments;• preparingandinitiatingprovinciallegislation;and• performinganyotherfunctionassignedtotheprovincialexecutiveintermsoftheConstitutionoranActof
Parliament;• assentingtoandsigningBills;• referringaBillbacktotheprovinciallegislatureforreconsiderationoftheBill’sconstitutionality;• referringaBilltotheConstitutionalCourtforadecisionontheBill’sconstitutionality;summoningthelegislature
to an extraordinary sitting to conduct special business;• appointingcommissionsofinquiry;and

Northern Cape Office of the Premier Vote 1 | Annual Report for 2013/14 Financial Year
15
• callingareferendumintheprovinceinaccordancewithnationallegislation;• appointingthemembersoftheExecutiveCouncil,assigningtheirpowersandfunctions,andbydismissing
them;• transferringtoamemberoftheExecutiveCouncil–• theadministrationofanylegislationentrustedtoanothermember;or• anypowerorfunctionentrustedbylegislationtoanothermember;• byensuringthatorgansofstate,throughlegislativeandothermeasures,assistandprotectandthecourtsto
ensure the independence, impartiality, dignity, accessibility and effectiveness of the courts;
Legislative Mandates
The Premier is responsible for the -• establishmentandabolishmentofanydepartmentoftheprovincialadministration;• determination regarding the allocationof any function to, or to abolitionof any functionof, anyofficeor
department of the provincial administration concerned or the transfer of any function from one such office or department to another or from such office or department or any body establish by or under any law of the provincial legislature or from any such body to such office or department;
• appointment,promotionandtransferofemployeesintheOfficeofthePremier;• appointment and other career incidents of a head of provincial administration and Provincial Heads of
Department;• determinationof areaof jurisdictionof traditional communities and recognitionof traditional leaders and
withdrawal of such recognition.
Relevant Court Rulings• DingaanHendrikNyathicaseagainstMemberoftheExecutiveCouncilfortheDepartmentofHealth,Gauteng
and Minister of Justice and Constitutional Development with Centre for Constitutional rights 2008 (9) BCLR 865 (CC);
• On2June2008theorderofconstitutionalinvaliditymadebythePretoriaHighcourtwasconfirmedbytheConstitutional Court in the following terms: Section 3 of the State Liability Act is declared to be inconsistent with the Constitution to the extent that it does not allow for execution or attachment against the state and that it does not provide for an express procedure for the satisfaction of judgment debts;
• Thedeclarationofinvalidityissuspendedforaperiodof12monthstoallowParliamenttopasslegislationthatprovides for the effective enforcement of court orders. Currently all such bills have not yet been adopted by Parliament and Department of Justice and Constitutional Development is in court requesting for extension of time to satisfy the court order;
• MatatieleMunicipalityandOthersvsPresidentoftheRepublicofSouthAfricaCCT37/05–Theprincipleinthiscase is the importance of consultation with 3rd parties in particular communities by Government when taken decisions that will affect them;
• Presidentof theRSAandOthersvsSouthAfricaRugbyFootballUnionandOthers (1999)– InthiscasethePresident of South Africa was summoned by the court to come and give evidence in a civil matter and he did appear. Which means members of the Executive Council may be summoned to appear in court;
• Governmentof theRSAvsGrootboom(2000)–Theprincipal: right tohousing intermsofsection2of theConstitution of the Republic of South Africa, 1996;
• HoffmanvsSouthAfricanAirways-employmentdiscriminationagainstanHIV-positivepersonwasfoundtobe in contravention of the provisions of Promotion of Equality and Prevention of Unfair Discrimination Act 4 of 2000;

Northern Cape Office of the Premier Vote 1 | Annual Report for 2013/14 Financial Year
16
• Larb-OdamvsMECintheDepartmentofEducationoftheNorth-WestProvince(1997)–thecourtstruckdownthe regulation made in terms of the Employment Educators Act, 1996 which prevents permanent residents from holding permanent posts in the Department of Education.
A.9 Organisational Structure
A.10 Entities Reporting to the Premier
Name of Entity Legislative Mandate
Financial Relationship Nature of Operations
Premier’s Bursary Trust Fund
Trust Deed Premier is the patron of the fund. OTP makes annual transfers to the trust fund.
Study loans for students
Mme Re Ka Thusa Trust Fund
Trust Deed Premier is the patron of the fund. OTP makes annual transfers to the trust fund.
Financial assistance for previously disadvantaged women to empower them to become economically active
Northern Cape Office of the Premier Vote 1 | Annual Report for 2013/14 Financial Year
17
PART B: Performance Information
Northern Cape Office of the Premier Vote 1 | Annual Report for 2013/14 Financial Year
18
PART B: Performance Information
B.1 Overview of Departmental Performance 1.1 Service delivery environment
The Northern Cape Province is the largest province, covering approximately 30% of South Africa’s landmass. But it has the smallest population of 1 145 861 people, and contributing only 2.2% to the total population of South Africa (Mid-year population estimates, 2011: 10).
The development regions and corridors constitute a clustering of nodes and the creation of a system that will synergise the capacity of stakeholders and entities within these nodes. The map below summarises and illustrates the spatial context of the current development regions, corridors and anchor projects in the Northern Cape.
The Provincial Administration have made strides to address service delivery backlogs, challenges still remains but progress have been made in a wide range of the following areas:
• TheofficialunemploymentratefortheNorthernCapehasdeclinedfromahighof35.7%in2001to27.4%in2011, while the average household income more than doubled over the same period;
• 82.4%ofhouseholdsresideinformalstructures;• Thepercentageofpersons20yearsorolderwithnoschoolinghasdecreasedfrom22.7%in1996to11.3%in
2011, while the percentage of persons with matric or higher more than doubled from 11.1% in 1996 to 23% in 2011;
• TheNorthernCape,despitebeingbyfarthemostwaterscarceprovince,managedtoreducethepercentageofhouseholds without access to piped water from 6% in 2001 to 2.6% in 2011. This is far better than the national average of 8.8% and places the Northern Cape in 4th position nationally. Also, more than 90% of households have access to water inside their dwellings or in their yards;
• Morethan85%ofhouseholdsuseelectricityasapowersource;and• Twothirdsofourhouseholdshaveaccesstoflushtoilets.Althoughthepercentageofhouseholdsusingthe
bucket system has significantly decreased from 10% in 2001 to 4% in 2011, the issue of acceptable levels of sanitation still needs attention.
• SquareKilometreArray(SKA)andMeerkat:Radiotelescope• SolarPark:Generationofelectricityfromsolarradiation• GamagaraCorridor:Miningbelt(Iron,Manganese,Lime)• TourismCorridors:AlongtheN7inNamaqualandandtheNIinthesouth-east• MaricultureCorridor:Fishingandcommercialfishfarming• NamaquaIndustrialMineralCorridor:Miningofgranite,slateetc.• Cargoandfreighthubs• Orange/VaalCorridor:Agricultureandtoalesserextendalluvialdiamondmining• LakeXhariep!

Northern Cape Office of the Premier Vote 1 | Annual Report for 2013/14 Financial Year
19

Northern Cape Office of the Premier Vote 1 | Annual Report for 2013/14 Financial Year
20
ORGANISATIONAL ENVIRONMENT
The fourth democratic government of South Africa under the leadership of President Jacob Zuma agreed on 12 outcomes as a key focus of work between 2010 and 2014. In order to achieve these 12 outcomes greater emphasis; during this electoral period; is placed on coordination, monitoring and evaluation. The Office of the Premier, as a centre of government, has the primary responsibility of coordinating, monitoring and evaluating the work of government across the entire provincial administration. The scope of application of this responsibility includes, in some instances, the local sphere of government. In addition, the Office of the Premier has the task to carry out its internal departmental obligations aimed at improving service delivery.
Furthermore, the organisational environment within the Office of the Premier is also largely influenced by an evolving developmental state that is aimed at addressing the triple challenges of poverty, unemployment and inequality. All efforts are being made to ensure that the Batho Pele values consistently permeate the organisational environment of the Office of the Premier.
The primary challenge faced by the Office of the Premier is that the organisational structure of the department is not adequately responsive to the demands of the current environment that calls for more coordination, monitoring and evaluation. In essence the current structure is designed for more internal functions and limits the department with regards to its primary responsibility of coordination, monitoring and evaluation of the provincial administration. In order to address this challenge, the Office of the Premier is in the process of realigning its organisational structure with the national generic framework to enable it to perform its primary responsibility and thereby pursue the achievement of the outcomes of government.
Time was invested in strengthening administrative systems that could bring about achieving most of the indicators of good governance amongst others:
• Anupandrunningperformancemanagementanddevelopmentsystem(level1uptoSMS);• 100%complianceondisclosureofinterestforms;• AnincreaseintheproductionofcredibleIntegratedDevelopmentPlansbymunicipalities;• RegularInter-governmentalRelationsFora(bothPremier’sandDistrict);• Improvedinternalcontrolenvironmentwithsoundoperationalandfinancialcontrols.
The challenge still remains meeting the increasing expectation of the previously disadvantaged people of the Northern Cape for quality services that really make a difference in their lives.
Northern Cape Office of the Premier Vote 1 | Annual Report for 2013/14 Financial Year
21
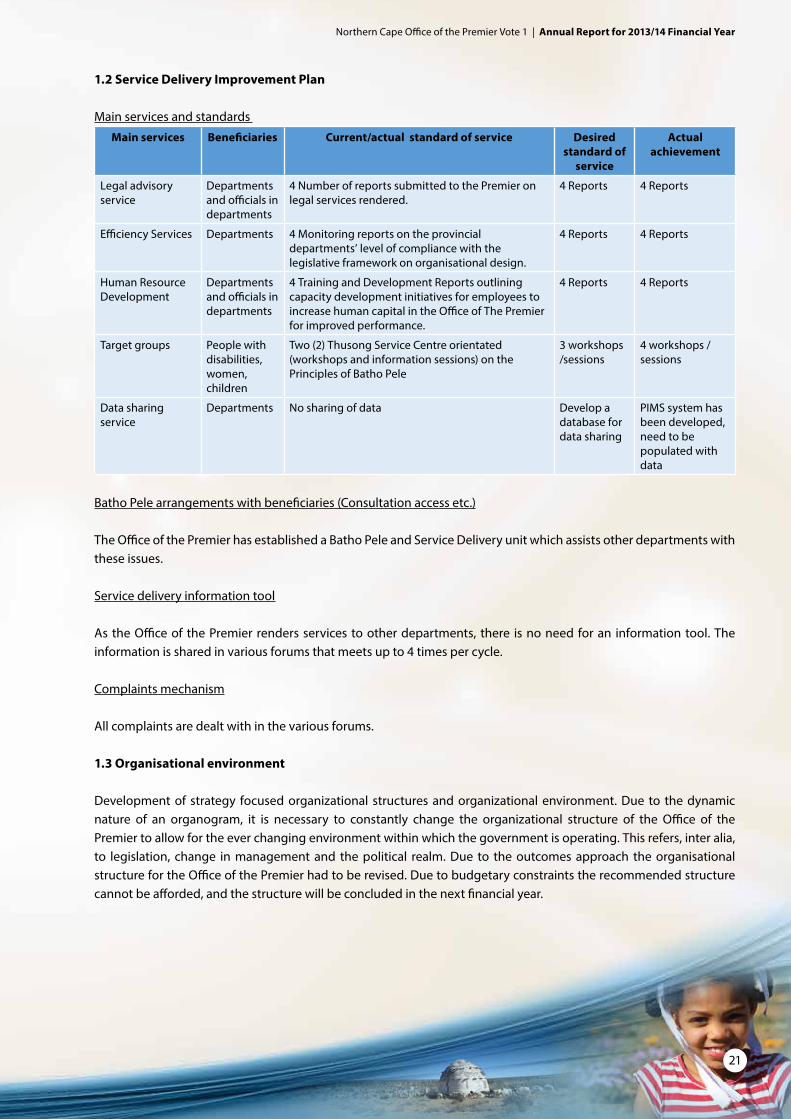
1.2 Service Delivery Improvement Plan
Main services and standards
Main services Beneficiaries Current/actual standard of service Desired standard of
service
Actual achievement
Legal advisory service
Departments and officials in departments
4 Number of reports submitted to the Premier on legal services rendered.
4 Reports 4 Reports
Efficiency Services Departments 4 Monitoring reports on the provincial departments’ level of compliance with the legislative framework on organisational design.
4 Reports 4 Reports
Human Resource Development
Departments and officials in departments
4 Training and Development Reports outlining capacity development initiatives for employees to increase human capital in the Office of The Premier for improved performance.
4 Reports 4 Reports
Target groups People with disabilities, women, children
Two (2) Thusong Service Centre orientated (workshops and information sessions) on the Principles of Batho Pele
3 workshops /sessions
4 workshops /sessions
Data sharing service
Departments No sharing of data Develop a database for data sharing
PIMS system has been developed, need to be populated with data
Batho Pele arrangements with beneficiaries (Consultation access etc.)
The Office of the Premier has established a Batho Pele and Service Delivery unit which assists other departments with these issues.
Service delivery information tool
As the Office of the Premier renders services to other departments, there is no need for an information tool. The information is shared in various forums that meets up to 4 times per cycle.
Complaints mechanism
All complaints are dealt with in the various forums.
1.3 Organisational environment
Development of strategy focused organizational structures and organizational environment. Due to the dynamic nature of an organogram, it is necessary to constantly change the organizational structure of the Office of the Premier to allow for the ever changing environment within which the government is operating. This refers, inter alia, to legislation, change in management and the political realm. Due to the outcomes approach the organisational structure for the Office of the Premier had to be revised. Due to budgetary constraints the recommended structure cannot be afforded, and the structure will be concluded in the next financial year.

Northern Cape Office of the Premier Vote 1 | Annual Report for 2013/14 Financial Year
22
1.4 Key policy developments and legislative changes
The office ensures that it generally improves the efficiency and effectiveness of governance within the office and throughout the provincial government system.The Office of the Premier derives its mandate from the Constitution of the Republic of South Africa of 1999.
The office is responsible for:• Theimplementationofprovinciallegislationandnationallegislationwithinthefunctionalareasinschedules4
and 5 and administering national legislation outside those listed in sections 4 and 5 which have been assigned to the province in terms of an Act of Parliament;
• Developmentandimplementationofprovincialpolicy;• Coordinatingthefunctionsoftheprovincialadministrationanditsdepartments;• Preparingandinitiatingprovinciallegislation.
Key policy areas of focus derive not only from its legislative mandates but also draws heavily from the Northern Cape Provincial Growth and Development Strategy. These include, inter alia, the following:
• Providingstrategicleadershipforgrowingtheprovincialeconomy;• Ensuringthatbasicservicesaredeliveredspeedily;• Promotinggoodgovernance;• Mainstreamingtherightsofvulnerablegroupsacrossdepartmentalpolicies;• DrivetheimplementationofthePGDSandmonitorandevaluateacrosstheprovince;• Strengtheninterandintra-governmentalrelationsaswellasinternationalrelations;• Ensuringgoodfiscaldiscipline.
B.2 Strategic Outcome Oriented Goals
GOAL 1: Improved transparency and accountability through coordination, monitoring and evaluation of the Office of the Premier’s implementation of policies and providing support to the Executive Council and the Premier
GOAL 2: Objectives and targets of the Northern Cape Provincial Growth and Development Strategy progressively realized through facilitation, monitoring and provision of strategic leadership and guidance to the Provincial Administration
GOAL 3: Improved efficiency through coordinated, integrated policy development, planning and implementation of the Government Programme of Action
GOAL 4: Efficient and effective service delivery established and maintained through sound intergovernmental, inter-departmental and sectoral relations throughout the Provincial Government
GOAL 5: Improved quality of life of all citizens of the province, in particular mainstreaming issues of the vulnerable groups across all government programmes and through promotion of people-centred good governance
GOAL 6: An effective, efficient, developmental Northern Cape Provincial Government through increased service quality and access, human resource management and development, improved business processes and effective anti-corruption initiatives
Northern Cape Office of the Premier Vote 1 | Annual Report for 2013/14 Financial Year
23
B.3 Performance Information by Programme
3.1 PROGRAMME 1: ADMINISTRATION
PURPOSE
This programme is responsible for rendering efficient management, administrative and financial support to the Executive Council, the Premier and the Office of the Premier and to monitor and evaluate departmental implementation of all policies and programmes.
SUB-PROGRAMMES
1.1 Premier Support1.2 Director General Support1.3 Security & Records Management1.4 Executive Council Support1.5 Financial Management
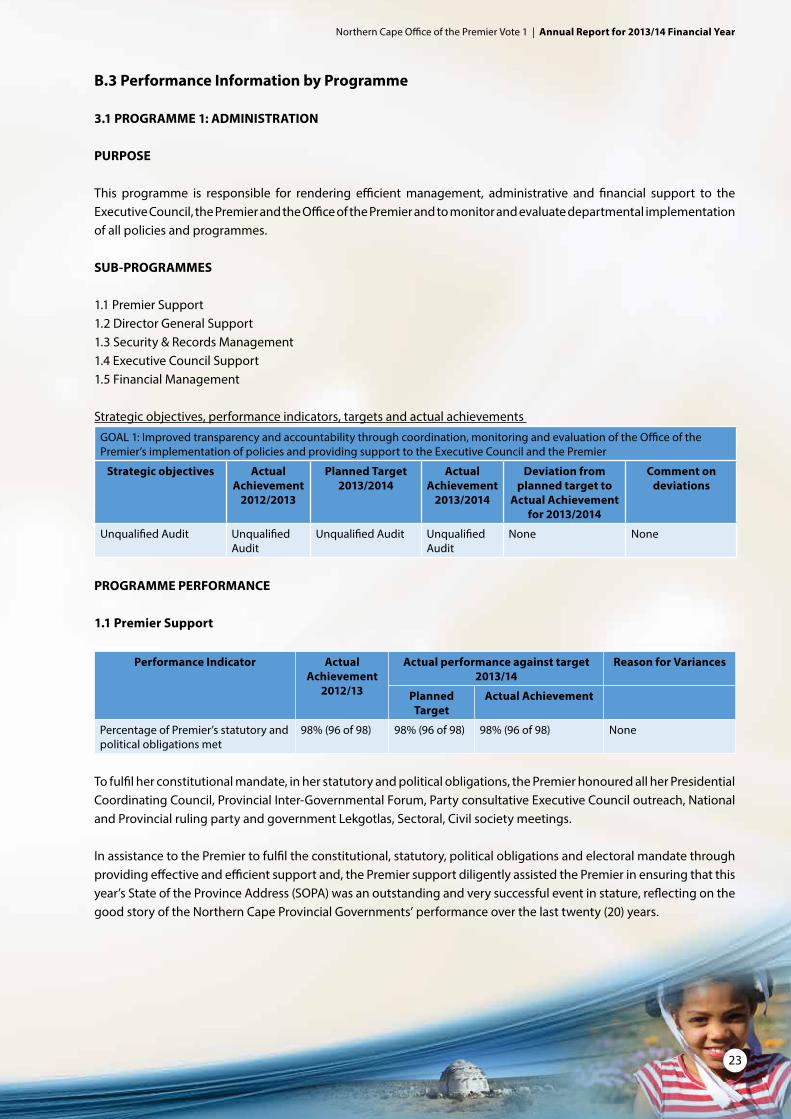
Strategic objectives, performance indicators, targets and actual achievements
GOAL 1: Improved transparency and accountability through coordination, monitoring and evaluation of the Office of the Premier’s implementation of policies and providing support to the Executive Council and the Premier
Strategic objectives Actual Achievement
2012/2013
Planned Target2013/2014
Actual Achievement
2013/2014
Deviation from planned target to
Actual Achievement for 2013/2014
Comment on deviations
Unqualified Audit Unqualified Audit
Unqualified Audit Unqualified Audit
None None
PROGRAMME PERFORMANCE
1.1 Premier Support
Performance Indicator Actual Achievement
2012/13
Actual performance against target 2013/14
Reason for Variances
Planned Target
Actual Achievement
Percentage of Premier’s statutory and political obligations met
98% (96 of 98) 98% (96 of 98) 98% (96 of 98) None
To fulfil her constitutional mandate, in her statutory and political obligations, the Premier honoured all her Presidential Coordinating Council, Provincial Inter-Governmental Forum, Party consultative Executive Council outreach, National and Provincial ruling party and government Lekgotlas, Sectoral, Civil society meetings.
In assistance to the Premier to fulfil the constitutional, statutory, political obligations and electoral mandate through providing effective and efficient support and, the Premier support diligently assisted the Premier in ensuring that this year’s State of the Province Address (SOPA) was an outstanding and very successful event in stature, reflecting on the good story of the Northern Cape Provincial Governments’ performance over the last twenty (20) years.
Northern Cape Office of the Premier Vote 1 | Annual Report for 2013/14 Financial Year
24
Subsequent to the SOPA, the Premier successfully tabled the Votes budget speech, giving clear indication what the key policy priorities of the Office of the Premier were and how they were going to be funded.
Furthermore, emanating from the State of the Nation Address (SONA) and Vote 1’s budget speech, the Premier Support provided guidance and support in its central coordinating role, throughout the financial year on issues affecting the entire provincial administration on key projects and initiatives around the following key policy priority areas:
• Creatingdecentjobs• Education• Thefightagainstcrime• Womenandyouthdevelopmentissues• Infrastructuredevelopment• Health• Ruraldevelopmentandagrarianreform
The Public Participation protocol continues to be high on our agenda and this financial year the Office held a successful outreach to the John Taolo Gaetsewe District and Frances Baard Districts with support from the Cabinet Secretariat.
The Northern Cape Premiers Bursary Trust Fund continued to fund academically deserving students that form part of the scarce skills identification programme of the Provincial Government. 487 young people have received assistance through the Premiers Bursary Trust Fund; of which 159 are new students and 328 continuing students from various parts of the Province were granted bursaries to take up further study at universities, colleges and Further Education and Training (FET) Colleges for the 2013 academic year. The funding covers costs for registration, tuition and study material.
Furthermore, the Mme Reka Thusa Women’s Development Trust Fund, established to help speed up the advancement and economic development of women entrepreneurs across the province, in line with the Millennium Development Goals Objectives i.e. to half unemployment and eliminating poverty and capacitating woman with relevant skills, expertise and resources. During 2013, under the auspices of the Trust, the Premier presided over five awareness summits in all five regions of the Province reaching out to 4 185 women. After the awareness programs, thirty two (32) interest free loans had been granted to qualifying women and 35 women are being given business training which will culminate into grants for their business initiatives.
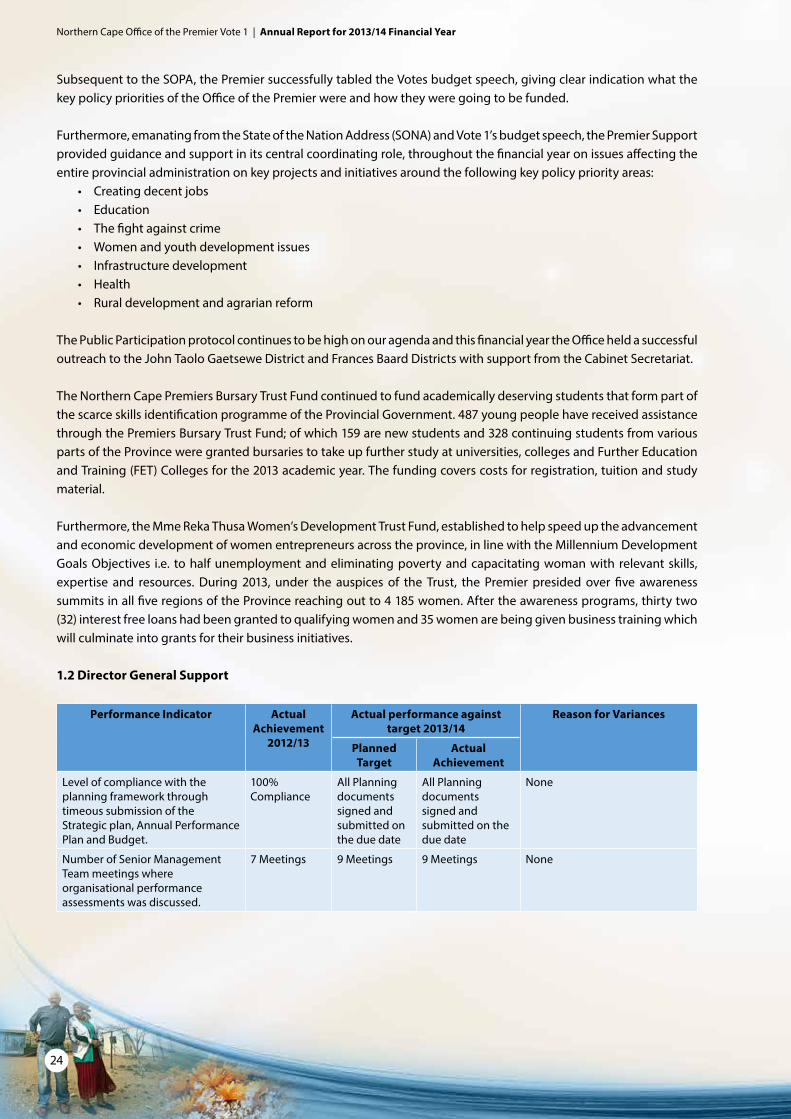
1.2 Director General Support
Performance Indicator Actual Achievement
2012/13
Actual performance against target 2013/14
Reason for Variances
Planned Target
Actual Achievement
Level of compliance with the planning framework through timeous submission of the Strategic plan, Annual Performance Plan and Budget.
100% Compliance
All Planning documents signed and submitted on the due date
All Planning documents signed and submitted on the due date
None
Number of Senior Management Team meetings where organisational performance assessments was discussed.
7 Meetings 9 Meetings 9 Meetings None

Northern Cape Office of the Premier Vote 1 | Annual Report for 2013/14 Financial Year
25
Performance Indicator Actual Achievement
2012/13
Actual performance against target 2013/14
Reason for Variances
Planned Target
Actual Achievement
Number of Head Of Department meetings where provincial performance assessments was discussed.
16 Meetings 12 Meetings 10 Meetings (2) Head Of Departments forum could not convene due to unavailability of the Head Of Department Forum members
The office of the Director General Support continued to ensured improved provincial government operations through providing strategic coordination, logistical and committee support services to the Head of Department (HOD) structure and other sub structures of the Provincial Administration during this 2013/14 financial year under review.
The unit provided efficient and effective operational, strategic and administrative support to the Director General (DG) to enable the DG to execute statutory functions of the province such as the HOD forums, the Forum of South African Director Generals (FOSAD), the Senior Management Team (SMT) meetings, the Cluster meetings and Presidential Council meetings and ensuring that the operations of the office of the DG runs optimally.
To strengthen governance and provide strategic direction, leadership and improved service delivery, the Director General attended the following key provincial and national engagements amongst others;
• GovernanceLeadershipSummit• MunicipalFinancialManagementAct:AuditorGeneralSouthAfricaMeeting• ExecutiveCouncilMeetings• President’sCo-ordinatingCouncil(PCC)Meeting• RenewableEnergyengagementswiththeSpanishGovernment• SpecialEconomicZone• KleinzeeProject• RegionalBulkInfrastructureEngagements• Abroad–Mission–TriptoIrelandwiththePremierandentourage• Premier’sInter-GovernmentalForumMeetings• AidsCouncilSecretariatmeetingswithcivilsociety• ExecutiveCouncilOutreachProgrammesinNamakwa,HantamMunicipalities,Andriesvaleetc.• CooperativeGovernanceandTraditionalAffairs(COGTA)BudgetVote• LandsclaimMeetingsinHartswater• PANSouthAfricanLanguageBoard(SALB)/SouthAfricanBroadcastingCooperationMeetings• ProvincialEnterpriseEngagements• DepartmentalInter-GovernmentalForum(DIGF):FrancesBaard,JohnTaoloGaetseweandSiyanda
To strengthen the fight against crime and corruption, an independent anti-corruption official has been appointed in the Office of the Premier as a governance issue reporting directly to the Director General. Secondly, the Provincial Crime Prevention Strategy was launched on the 12 September 2013 in Kuruman by the Premier.
There was 100% Compliance with respect to the signing and submission of SMS Performance Agreements within the stipulated date.
To comply with corporate governance, financial disclosure forms for all senior management members of the Northern Cape government were 100% submitted on time to the Public service commission.

Northern Cape Office of the Premier Vote 1 | Annual Report for 2013/14 Financial Year
26
To improve and provide support on audit outcomes, the Director General as the chairperson of Operation Clean Audit 2014, at an extended Inter-Governmental forum meeting, ensured that all municipalities reported audit improvement progress reports and 2013/14 approved audit improvement plans towards Operation Clean Audit 2014 objectives. AG action plans were submitted to Treasury that were consolidated for the Province and presented to HOD forum, cluster and EXCO.
As relates to HIV/AIDS, the office made presentations to all departmental senior management fora to strengthen planning frameworks on implementing HIV. Furthermore, the office launched the formation of the Interdepartmental Committee (IDC) on HIV/AIDS comprising of designated senior managers. This was important because it put the governance of HIV/AIDS at the apex of departmental planning. The IDC will further serve as technical support to the Provincial Council on AIDS.
1.3 Security & Records ManagementSUB- PROGRAMME: Security & Records Management
Performance Indicator Actual Achievement
2012/13
Actual performance against target 2013/14 Reason for Variances
Planned Target Actual Achievement
Monitoring and report on the implementation and compliance with Records management legislation on a quarterly basis.
4 reports 4 reports 4 reports None
Monitoring the implementation of the Security policy through quarterly reports to ensure compliance
3 reports 4 reports 4 reports None
The Security and Records management unit continued to ensure that it efficiently, accounted and enhanced transparency through the implementation of sound Records Management Systems, telecommunication and messenger service in office of the Premier, thus preserving the corporate memory of the Office.
Furthermore, the unit contributed to improved productivity through provision of a safe and secure working environment.
During the year under review, the President visited the Province twice where one (1) visit was for the FETSA TLALA Project in Kuruman, and the unit attended meetings with the Department of Agriculture whereby the assistance was provided with security arrangements and other logistical arrangements. Furthermore, the unit ensured that the necessary structural engineers’ certificates were in place.
The unit also assisted in the Joint Operational Centre for the Former President, Nelson Mandela. The Ministers of Energy, Water Affairs and Communications visited the Province and the Office of the Premier was responsible for all security arrangements during these events.

Northern Cape Office of the Premier Vote 1 | Annual Report for 2013/14 Financial Year
27
1.4 Executive Council Support
Performance Indicator Actual Achievement
2012/13
Actual performance against target 2013/14
Reason for Variances
Planned Target
Actual Achievement
Number of Executive Council (EXCO) and the Clusters engagement where support was rendered effectively
25 Meetings 24 Meetings 31 Meetings 7 MeetingsDuring the fourth quarter, the unit intensified its programmes i.e. 5 x Executive Council Meetings, Final Executive Council Outreach Programme and 1 x close out cluster and technical cluster meetings that were deemed priority as it will be the last of the current Administration in the electoral cycle.
The Executive Council Support effectively rendered quality secretariat and administrative services to the Executive Council and its Committees and outreach service to communities in the Northern Cape during the year under review.
A public meeting with the community of Dingleton and the Executive Council took place, where matters in relation to the Dingleton Resettlement Project were discussed as an intervention by the office.
The unit played a critical role with the coordination and planning of the Strategic Integrated Projects (SIPS) for the Northern Cape Provincial Government.
Other matter that the unit was also involved in amongst others was the following:• RenewableEnergyengagementswiththeSpanishGovernment• SpecialEconomicZone• KleinzeeProject• RegionalBulkInfrastructureEngagements• DistrictIntergovernmentalForummeetings
1.5 Financial Management
Performance Indicator Actual Achievement
2012/13
Actual performance against target 2013/14
Reason for Variances
Planned Target Actual Achievement
Compliance with financial accounting reporting requirements and relevant accounting legislation/prescripts resulting in financial unqualified audit outcomes.
5 5 5 None

Northern Cape Office of the Premier Vote 1 | Annual Report for 2013/14 Financial Year
28
Performance Indicator Actual Achievement
2012/13
Actual performance against target 2013/14
Reason for Variances
Planned Target Actual Achievement
Effectively managed budget in line with budget guidelines and timeframes issued by provincial treasury (99% of budget spent)
97% expenditure of budget
99% expenditure of budget
96% expenditure of budget
(3%)The budget is 3% under the expected norm, as a result of due processes followed to source service providers for the relocation from Templar/Sauer project, 20 year review, etc. through tender process, RT Contractors, etc. as at 31 March 2014 the funds have already been committed through service provider appointment letters and contracts. A roll over request has been submitted to Provincial Treasury to re-allocate these funds to 2014/15 financial year.
Reduction of Non-compliance with supply chain management legislation & other relevant prescripts for the office of the Premier through monitoring and capacitating of officials.
5% of cases resolved
5% of cases resolved
5% of cases resolved
None
Compliance with public sector risk management framework
4 risk management report
4 risk management report
4 risk management report
None
No material findings on pre-determined objectives through performing quality checks on quarterly reports and annual report.
5 reports 5 reports 5 reports None
The Financial management unit ensured the effective and efficient financial management and administration of the resources of the Office of the Premier, in complying with all relevant legislation and prescripts thus achieving fiscal discipline and a healthy, transparent state of financial affairs and influencing positive audit outcomes on the financial position of the Office of the Premier.
To ensure its commitment to efficient, effective and prudent financial management of government resources, the main opinion paragraph on fairness of Annual Financial Statements (AFS), the Office of the Premier received a financially unqualified external audit report for the 2013/14 year.
The Office also received a positive report on predetermined objectives/performance information section, were the Auditor General pronounced that ‘no material findings on predetermined objectives were detected’.The unit achieved 100% statutory financial management reporting compliance with all relevant legislation and prescripts.

Northern Cape Office of the Premier Vote 1 | Annual Report for 2013/14 Financial Year
29
The implementation of Logistical Information System (LOGIS) was successful and all officials have been trained on systems utilisation. Continuous engagement and support is being provided by the Shared Information and Financial Services of Provincial Treasury after implementation, to ensure a smooth transition for the Office of the Premier.
3.2 PROGRAMME 2: INSTITUTIONAL DEVELOPMENT
PURPOSE
The purpose of this programme is to coordinate and provide strategic leadership to all provincial departments with regards to transversal cooperate issues to enhance transformation of the public service
SUB-PROGRAMMES
2.1 Strategic Human Resources2.1.1 Human Resource Administration (HRA)2.1.2 Human Resource Development (HRD)2.1.3 Efficiency Services2.1.4 Labour Relations Unit2.1.5 Employee Health and Wellness2.2 Information Communication Technology2.3 Legal Services2.4 Communication Services2.5 Programme Support
PROGRAMME PERFORMANCE
GOAL 4: Efficient and effective service delivery established and maintained through sound intergovernmental, inter-departmental and sectoral relations throughout the Provincial GovernmentGOAL 6: An effective, efficient, developmental Northern Cape Provincial Government through increased service quality and access, human resource management and development, improved business processes and effective anti-corruption initiatives
Strategic objectives
Actual Achievement
2012/2013
Planned Target2013/2014
Actual Achievement
2013/2014
Deviation from planned target to Actual Achievement
for 2013/2014
Comment on deviations
Unit costs of key service delivery outputs
Not measured - Not measured Producing unit cost information requires knowledge of costing activities and outputs which is not readily available in the public sector. As such unit costs are rarely computed. Some department such as Office of the Premier do not have tangible deliverables and therefore it is hard to produce unit cost information
Experience has shown that an indicator of this nature is impractical to compute, as the cost of data gathering exceeds the usefulness of the indicator
Northern Cape Office of the Premier Vote 1 | Annual Report for 2013/14 Financial Year
30
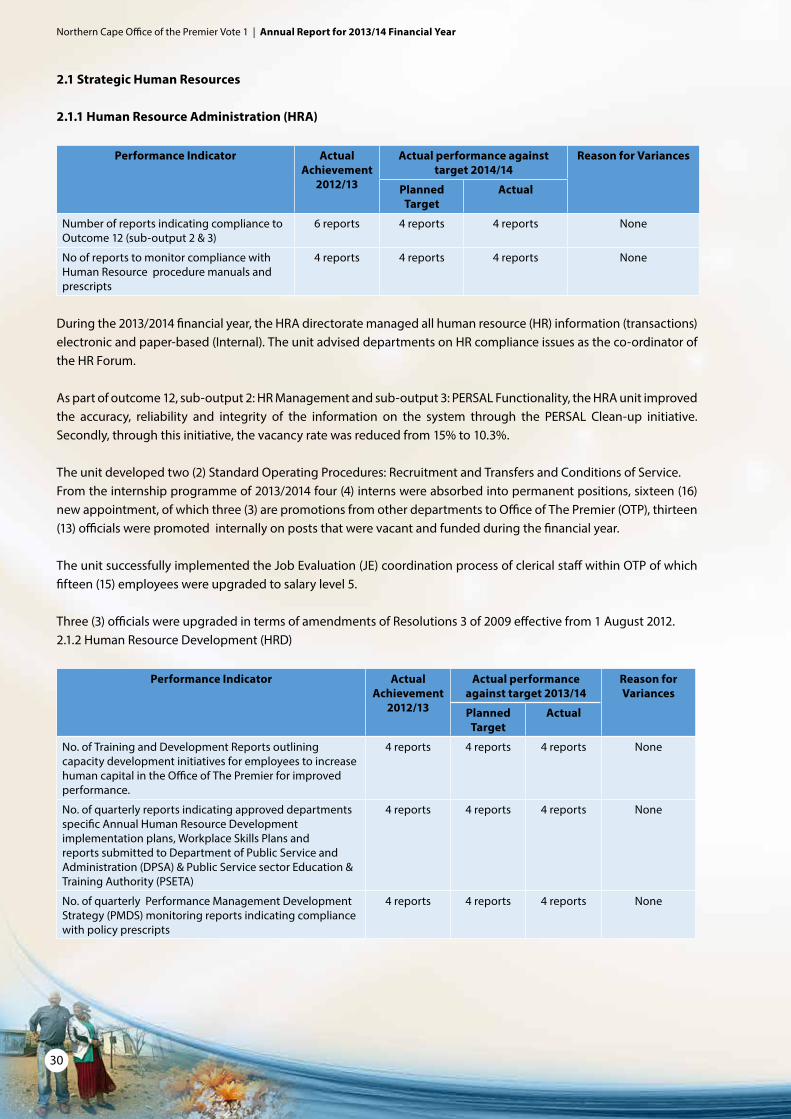
2.1 Strategic Human Resources
2.1.1 Human Resource Administration (HRA)
Performance Indicator Actual Achievement
2012/13
Actual performance against target 2014/14
Reason for Variances
Planned Target
Actual
Number of reports indicating compliance to Outcome 12 (sub-output 2 & 3)
6 reports 4 reports 4 reports None
No of reports to monitor compliance with Human Resource procedure manuals and prescripts
4 reports 4 reports 4 reports None
During the 2013/2014 financial year, the HRA directorate managed all human resource (HR) information (transactions) electronic and paper-based (Internal). The unit advised departments on HR compliance issues as the co-ordinator of the HR Forum.
As part of outcome 12, sub-output 2: HR Management and sub-output 3: PERSAL Functionality, the HRA unit improved the accuracy, reliability and integrity of the information on the system through the PERSAL Clean-up initiative. Secondly, through this initiative, the vacancy rate was reduced from 15% to 10.3%.
The unit developed two (2) Standard Operating Procedures: Recruitment and Transfers and Conditions of Service.From the internship programme of 2013/2014 four (4) interns were absorbed into permanent positions, sixteen (16) new appointment, of which three (3) are promotions from other departments to Office of The Premier (OTP), thirteen (13) officials were promoted internally on posts that were vacant and funded during the financial year.
The unit successfully implemented the Job Evaluation (JE) coordination process of clerical staff within OTP of which fifteen (15) employees were upgraded to salary level 5.
Three (3) officials were upgraded in terms of amendments of Resolutions 3 of 2009 effective from 1 August 2012.2.1.2 Human Resource Development (HRD)
Performance Indicator Actual Achievement
2012/13
Actual performance against target 2013/14
Reason for Variances
Planned Target
Actual
No. of Training and Development Reports outlining capacity development initiatives for employees to increase human capital in the Office of The Premier for improved performance.
4 reports 4 reports 4 reports None
No. of quarterly reports indicating approved departments specific Annual Human Resource Development implementation plans, Workplace Skills Plans and reports submitted to Department of Public Service and Administration (DPSA) & Public Service sector Education & Training Authority (PSETA)
4 reports 4 reports 4 reports None
No. of quarterly Performance Management Development Strategy (PMDS) monitoring reports indicating compliance with policy prescripts
4 reports 4 reports 4 reports None

Northern Cape Office of the Premier Vote 1 | Annual Report for 2013/14 Financial Year
31
All departments submitted their HRD Implementation plans and reports, an improvement compared to last year.
In terms of Performance Management Development (PMDS), 100% Compliance with respect to the signing and submission of SMS Performance Agreements within the stipulated date.
The Office of the Premier bursary policy was reviewed and aligned with the latest HRD policy imperatives as the old policy was developed and approved in 2008.
The key highlight with regards to Outcome 12 for the period under review is that the Executive Council adopted a set of interventions aimed at strengthening the coordination and implementation of Human Resource Development Initiatives.
These interventions were the establishment of a Provincial Human Resource Development Council for the Northern Cape that will serve as a platform for all public and private sector stakeholders to engage on common matters related to human resource development, identify skills restrictions and recommending appropriate solutions to unblock such restrictions and to mobilise senior leadership in organised business, government, organised labour, civil society and professional bodies, the education and training and science technology institutions to address the provincial HRD priorities in a coordinated and targeted way.
In terms of training and placements, the unit coordinated and achieved the following;• Internally
- The office placed 5 interns on identified priority areas - 10 FET learners were place in the office on the Work Integrated Learning Programme championed by the
Department of Higher Education• Externaltransversalcoordination
- Supported the Department of Culture, Arts, Tourism, Hospitality & Sport SETA (CATHSSETA) and assisted with the placement of 29 learners on a heritage practice Learnerships.
- The placement of 157 Further Education Training (FET) learners on the Work Integrated Learning Programme in departments and municipalities throughout the province was coordinated by the HRD unit.
- Training of 47 HRD practitioners on Training of Trainers (TOT’s) and Assessor Training was coordinated by the HRD unit, to build capacity in the province for the implementation of the Compulsory Induction Programme (CIP).
- Took part in the Northern Cape Provincial Skills Consultative Workshop which was convened by the National Skills Authority (NSA), in partnership with the Provincial Skills Development Forum (PSDF) under the theme “Taking the National Skills Development Strategy to the People.” In attendance were 274 delegates comprising business, labour, and delegates from education and training sector, government and non-governmental organisations. The purpose of the consultative workshop was to ensure a creation of a platform for continued engagement and consultation with stakeholders on the National Skills Development Strategy III (NSDS) and the post school education and training systems currently sponsored by the newly released Green Paper on post school landscape on higher education and training.
To comply with outcome 4 in addressing skills shortage in the province, this office successfully co-ordinated the Riemvasmaak rural youth development project and monitored its implementation. Stakeholder meetings on the project took place in Upington to discuss the learners’ progress and way forward.

Northern Cape Office of the Premier Vote 1 | Annual Report for 2013/14 Financial Year
32
HRD successfully coordinated the signing of a Memorandum of Understanding (MoU) with Safety and Security Sector Education and Training Authority (SASSETA) and the Office of the Premier.
Employees from the HRD unit formed part of a task team for the launch of the Local Government Sector Education Training Authority (LGSETA) office in province.
The unit attended the Transport Education Training Authority (TETA) awareness road show which resulted in an agreement that the unit will facilitate signing of MoU between Transport Education Training Authority (TETA) and Department of Safety and Liaison as well as the after exam and adopt a school projects with the department of Education.
Unit employees also attended the Wholesale and Retail (W&R) SETA certification programme and discretionary grant session where inputs were made on the role of the Sector Education Training Authority (SETA) in the Province.
2.1.3 Efficiency Services
Performance Indicator Actual Achievement
2012/13
Actual performance against target 2013/14
Reason for Variances
Planned Target Actual
Monitoring reports on the provincial departments’ level of compliance with the legislative framework on organisational design.
4 reports 4 reports 4 reports None
Monitoring reports on the departments’ level of compliance with the legislative framework on Job Evaluation and the application of EQUATE
4 reports 4 reports 4 reports None
No. Of reports compiled with regards to the implementation of the Office of The Premier Human Resource plan.
4 reports 4 reports 4 reports None
The Efficiency Services unit coordinated a departmental monitoring visit that focuses on the status of organisational design that took place during the 2013-14 financial year. The findings during these visits, as well as additional information received from departments, informed the content of the produced provincial reports in this regard. Organisational design interventions also took place within the Office of the Premier, the Department of Environment and Nature Conservation, and the Department of Health.
Guidance, facilitation, coordination and monitoring of the Implementation of Resolution 1 of 2012, relating to post previously prevented to be advertised and filled on levels 10 and 12 by Resolution 3 of 2009, was successfully provided by the unit and all the necessary cases of concurrence were referred to the Minister of Public Service and Administration. Furthermore, all compliance reports were submitted to the DPSA and all other related outstanding matters are continuously receiving attention and monitored.
The unit had engagements with departments, as well as quality assurance sittings (consisting of Preliminary quality assurance and Job Evaluation panel sittings). In ensuring provincial compliance with regard to the prescripts of Job Evaluation, eleven (11) Provincial Job Evaluation panel sittings were held during the 2013/14 financial year, to enhance provincial consistency in the application of the EQUATE grading system.

Northern Cape Office of the Premier Vote 1 | Annual Report for 2013/14 Financial Year
33
During the 2013-14 financial year, significant inroads were made in terms of enhancing the level of human resource planning capacity provincially, as well as improving the quality of departmental strategic Human Resource plans. A provincial assessment committee, consisting of all trained Human Resource Planning officials within our provincial departments, was established during the second (2nd) quarter.
2.1.4 Labour Relations Unit
SUB- PROGRAMME: LABOUR RELATIONS
Performance Indicator Actual Achievement
2012/13
Actual performance against target 2013/14
Reason for Variances
Planned Target Actual
Number of reports submitted to Department Public Service Administration and Public Service Commission on misconducts and grievances
2 Misconducts(Department Public Service Administration)
Misconducts2 (Department Public Service Administration)
0 Misconducts (Department Public Service Administration)
(2)Reports were compiled but not submitted due to lack of compliance from departments to report as a province
2 Grievances Grievances: 2 2 Grievances None
Turnaround times for Prosecuting & Presiding over Misconduct, Grievances & Disputes in months
3 Grievances Grievance–30Days
4Grievance–30Days
None
1 Misconduct Misconduct–3Months
9Misconduct–3Months
None
3 Disputes Disputes–3Months
8Disputes–3Months
None
Implementation and level of compliance with National/Provincial Labour Relations Strategy through quarterly reports
2 reports 4 reports 0 report (4)Line departments not responding timeously in terms of submission of reports
Implementation of Resolutions/Agreements from the General Public Service Sectoral Bargaining Council (GPSSBC) , Safety and Security Sectoral Bargaining Council, Public Health Social Development Sectoral Bargaining Council, Public Service Coordinating Bargaining Council and Labour Relations Forum monitored through monthly reports
4 reports 4 reports 1 report (3) reportsNo agreement was signed during this period under review
The Labour Relations unit ensured that there was sound labour relations and industrial stability through effective Dispute Management, Collective Bargaining and support to the Office of the Premier and Provincial Departments.The unit facilitated training for twenty (20) employees which covered areas of effective management of presiding over cases.
Labour Relations successfully hosted the National Labour Relations Forum, and attended all National Labour Relations Forums and employer courses organised by the Department of Public Service and Administration.
Northern Cape Office of the Premier Vote 1 | Annual Report for 2013/14 Financial Year
34
Through the units’ initiative, the Department of Public Service and Administration (DPSA) presented the Case Management System at the Head of Department Forum, which will ensure for the registration of all cases on a centralised database. This will effectively allow the Office of the Premier access to all cases registered in different Provincial Departments and integrate coordination, reporting, monitoring and evaluation.
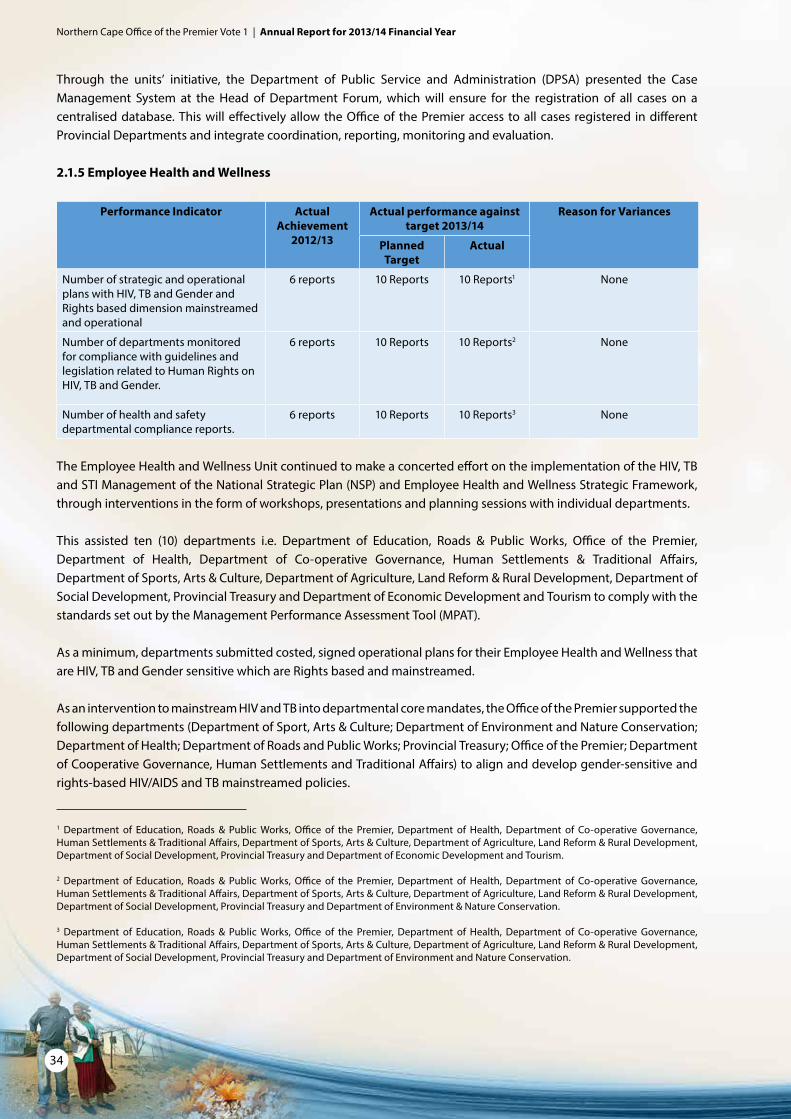
2.1.5 Employee Health and Wellness
Performance Indicator Actual Achievement
2012/13
Actual performance against target 2013/14
Reason for Variances
Planned Target
Actual
Number of strategic and operational plans with HIV, TB and Gender and Rights based dimension mainstreamed and operational
6 reports 10 Reports 10 Reports1 None
Number of departments monitored for compliance with guidelines and legislation related to Human Rights on HIV, TB and Gender.
6 reports 10 Reports 10 Reports2 None
Number of health and safety departmental compliance reports.
6 reports 10 Reports 10 Reports3 None
The Employee Health and Wellness Unit continued to make a concerted effort on the implementation of the HIV, TB and STI Management of the National Strategic Plan (NSP) and Employee Health and Wellness Strategic Framework, through interventions in the form of workshops, presentations and planning sessions with individual departments.
This assisted ten (10) departments i.e. Department of Education, Roads & Public Works, Office of the Premier, Department of Health, Department of Co-operative Governance, Human Settlements & Traditional Affairs, Department of Sports, Arts & Culture, Department of Agriculture, Land Reform & Rural Development, Department of Social Development, Provincial Treasury and Department of Economic Development and Tourism to comply with the standards set out by the Management Performance Assessment Tool (MPAT).
As a minimum, departments submitted costed, signed operational plans for their Employee Health and Wellness that are HIV, TB and Gender sensitive which are Rights based and mainstreamed.
As an intervention to mainstream HIV and TB into departmental core mandates, the Office of the Premier supported the following departments (Department of Sport, Arts & Culture; Department of Environment and Nature Conservation; Department of Health; Department of Roads and Public Works; Provincial Treasury; Office of the Premier; Department of Cooperative Governance, Human Settlements and Traditional Affairs) to align and develop gender-sensitive and rights-based HIV/AIDS and TB mainstreamed policies.
1 Department of Education, Roads & Public Works, Office of the Premier, Department of Health, Department of Co-operative Governance, Human Settlements & Traditional Affairs, Department of Sports, Arts & Culture, Department of Agriculture, Land Reform & Rural Development, Department of Social Development, Provincial Treasury and Department of Economic Development and Tourism.
2 Department of Education, Roads & Public Works, Office of the Premier, Department of Health, Department of Co-operative Governance, Human Settlements & Traditional Affairs, Department of Sports, Arts & Culture, Department of Agriculture, Land Reform & Rural Development, Department of Social Development, Provincial Treasury and Department of Environment & Nature Conservation.
3 Department of Education, Roads & Public Works, Office of the Premier, Department of Health, Department of Co-operative Governance, Human Settlements & Traditional Affairs, Department of Sports, Arts & Culture, Department of Agriculture, Land Reform & Rural Development, Department of Social Development, Provincial Treasury and Department of Environment and Nature Conservation.

Northern Cape Office of the Premier Vote 1 | Annual Report for 2013/14 Financial Year
35
To ensure that everyone in South Africa is voluntarily tested for HIV and screened for TB every year, the Office of the Premier partnered with various provincial departments (Department of Sport, Arts & Culture; Department of Environment and Nature Conservation; Department of Health; Department of Roads and Public Works; Provincial Treasury; Office of the Premier; Department of Cooperative Governance, Human Settlements and Traditional Affairs) as well as GEMS and other external partners to provide a comprehensive package of health screening services.
In collaboration with GEMS, the unit hosted a Northern Cape Administration interdepartmental Health and Services Open day in Upington. This day afforded public servants in the hinterland of our province an opportunity to access a wide range of services.
The implementation of Safety, Health, Environment, Risk and Quality Management (SHERQ) was effectively monitored in the following departments (Department of Sport, Arts & Culture, Department of Environment and Nature Conservation, Department of Health, Department of Roads and Public Works, Provincial Treasury, Office of the Premier, and Department of Cooperative Governance, Human Settlements and Traditional Affairs).
Periodic reporting on key programme implementation in provincial departments has enabled the Office of the Premier to respond with appropriate support and technical interventions. This is evident from the reports that the unit managed to collect, collate and develop during the period.
2.2 Information Communication Technology
Performance Indicator Actual Achievement
2012/13
Actual performance against target 2013/14
Reason for Variances
Planned Target Actual
Province-wide Information Technology Plan and its implementation monitored
1 Plan Approved 1 Plan Approved 1 Plan Approved None
Monitor State Information Technology Agency (SITA) Service Level Agreement (SLA)
99% Connectivity
95% connectivity 97.74% connectivity
2.74% Positive variance as a result of improved efficiencies on the side of SITA
A Provincially adopted Second Generation Thusong Service Centre Plan
1 Draft 1 Plan approved 1 draft plan (1) draft plan2nd Generation Business Plan was sent to the relevant Forums for approval, feedback awaited.
The number of Memorandum of Agreement signed with Municipalities
1 1 1 None
Turnaround time in days it took to resolve issues logged through the helpdesk
7 Days 8 Days 0.9 days 7.1 daysImproved turnaround to provide support services to users and other departments
During the financial year 2013/14 under review, the Information Communication Technology (ICT) unit continued to provide technical support, web services, advisory services to provincial departments and technical support function to finance’s supply chain management section for the procurement of IT goods and services.

Northern Cape Office of the Premier Vote 1 | Annual Report for 2013/14 Financial Year
36
The unit has developed and started the implementation of the Corporate Governance of ICT Framework.
The Provincial Internal Audit Unit found that the “overall management of Information Technology Governance within Office of the Premier is in line with nationally set goals and objectives”.
Support was also given to Thusong Service Centre Programmes in the Province, and recorded approximately 165,175 transactions for the period under review.
Easy access to Thusong Service Centres has been made available by the unit and the office of the Premier to traditional service points.
The types of services that were accessed through the Thusong Service Centres; include amongst others municipal services, including payments, Department of Home Affairs, Department of Labour, and South African Social Services Agency.
2.3 Legal Services
Performance Indicator Actual Achievement
2012/13
Actual performance against target 2013/14
Reason for Variances
Planned Target Actual
Number of reports submitted to the Premier on legal services rendered.
4 Reports 4 Reports 4 Reports None
Number of reports submitted to the Premier on legislation.
4 Reports 4 Reports 4 Reports None
Number of reports submitted to the Premier on compliance with Outcome 12 (Promotion of Access to Justice Act & Promotion of Access to Information Act)
4 Reports 4 Reports 4 Reports None
The unit rendered comprehensive, coordinated legal advisory service to the Northern Cape Provincial Government and Local Government with regard to contracts, litigation, drafting and certification of legislation and legal opinions to ensure compliance with the law.
CONTRACTS
BIODIVERSITY CONTRACT/AGREEMENT
The unit was involved in the drafting and negotiations of the Biodiversity Offset Agreement which has no precedent within the Republic and which when fully implemented would pave the way forward to ensure an equivalent or better biodiversity outcome to the effected sites where biodiversity may be lost due to impacts that may be caused by mining operations.
These mining operations are to be undertaken by the Black Mountain Mining company on its various landholdings in and around Aggeneys, Northern Cape Province. Additional sites are also to be acquired to give effect to the Biodiversity Offset Agreement.
This Biodiversity Offset Agreement has indeed solicited a lot of interest judging from the recent Inter-Provincial State Law Advisors Forum where participants were eager to be assisted by the Northern Cape Province for similar agreements within their own jurisdictions.

Northern Cape Office of the Premier Vote 1 | Annual Report for 2013/14 Financial Year
37
SISHEN IRON ORE COMPANY PTY (LTD) / NORTHERN CAPE PROVINCIAL ADMINISTRATIONRELOCATION OF DINGLETON
The unit monitored Legal Compliance issues with regard to this agreement which was ultimately signed in June 2013 by the parties. The model on which the relocation of Dingleton is structured i.e. International Finance Corporation Standard 5 was considered one of the best models by Provincial State Law Advisors during a meeting held on 27-28 March 2014 in Rustenburg which can be used by other provinces.
LITIGATION There has been a drastic reduction in new cases. A large number of cases that are pending have been carried over from previous years.
One matter that requires specific mention is Lourens vs. Premier in which an order was sought compelling the Premier to come up with legislation to regulate the use of official language in the province. The matter has since been settled and a new legislation called Northern Cape Use of Official Language Act has been passed.
This is a positive achievement in that litigation that arises out of non-compliance with legal prescripts has been reduced in line with our strategic objectives.
DOIGE & OTHERS: TRANSFER OF THE ASBESTOS RELIEF TRUST / MASTER OF THE NORTH GAUTENG HIGH COURT & PREMIER OF THE NORTHERN CAPE PROVINCE
The unit managed to persuade/convince the Master to release documents of the Asbestos Relief Trust to the Premier in order for the Premier to determine whether the complaints raised by the asbestos affected communities in Kuruman are against Spoor / Trustees. The trustees have since lost an application to interdict the Master from releasing the documents as agreed and also lodge an application to review the decision of the Master. The matter is still pending in the North Gauteng high Court.
LEGISLATION
The following legislation drafting and certification has been assented to by the Premier;• NorthernCapeGeneralLawsAmendmentAct–Assentedto23July2013• NorthernCapeAppropriationAct–Assentedto21June2013• NorthernCapeLegislatureWitnessAct–AssentedtoNovember2013• NorthernCapeRepealofLawsAct–AssentedtoNov2013(nodateonlyMonth)• NorthernCapeUseofOfficialLanguagesAct-Assentedto20February2014• NorthernCapeAdjustmentAppropriationAct–Assentedto15November2013• NorthernCapeProvincialArchivesAct–Assentedto20February2014• NorthernCapeArts&CultureCouncilAct–Assentedto20February2014• NorthernCapeHeritageResourcesAuthorityAct-Assentedto20February2014
REMUNERATIVE WORK OUTSIDE THE PUBLIC SERVICE POLICY
The department has drafted a policy in order to give effect to section 30 of the Public Service Act which prohibits public servants from performing Remunerative Work Outside of the Public Service without the requisite permission from the executing Authority. The policy has been approved and is in full operation and binding on all public servants in the office of the Premier.

Northern Cape Office of the Premier Vote 1 | Annual Report for 2013/14 Financial Year
38
PROMOTION OF ADMINITRATIVE JUSTICE ACT
In our continued effort to ensure good governance, a training session on Promotion of Administrative Justice Act (PAJA) was arranged for Heads of Departments and Senior Managers to ensure that decisions of government are lawful, reasonable and procedurally fair.
The department in collaboration with the department of Justice and Constitutional Development developed a guide for the implementation of PAJA.
2.4 Communication Services
Performance Indicator Actual Achievement
2012/13
Actual performance against target 2013/14
Reason for Variances
Planned Target Actual
A provincial communications framework and communications system developed and approved
Draft Review Approved Document
Review Approved Document
None
Communicate Government initiatives and inform the public on critical decisions that affect them on a monthly basis.
55 times 40 times 80 times 40 timesMore government work has been communicated than initially planned as a result of the implementation of the provincial government wide communication strategy.
A key aspect of the work of this unit during the year under review was communication linked to Output 12 of the outcomes based performance model. This included work done in the drafting of the Provincial Communication Strategy, media liaison, production of media adverts and events management services.
Key communication activities included follow up and resolving queries received through the Presidential Hotline, the Communications Directorate serves as an interface between the various Government Departments and Municipalities. This led us to achieving a 100% reporting rate and receiving a commendation from the Presidency.
The unit also served as a support in providing content pertaining to the office and other provincial departments for the update of the website. The unit also played a critical role in collecting content and drafting of speeches.
The unit was also responsible for strategically managing the media and utilising it to communicate government messages and programmes as well as supporting the Premier in all her media activities. Support was also rendered to the provincial government in all its activities and functions.
To ensure a healthy relationship between the provincial government and the media the unit arranged regular media briefings to deepen the understanding of the media on certain policies and pronouncements. Daily media monitoring takes place to allow the unit to respond intelligently and rapidly to issues that affect the provincial government. The unit drove Communications programme during the Budget Speeches of the various votes by getting Departments to broadcast the event live on all community radio stations as well as do summaries in the local newspapers and radio interviews to unpack the speech. The unit also held a successful media breakfast with the Premier as an introduction to the media and also to discuss her plans as outlined in her Inaugural address and Budget speeches.

Northern Cape Office of the Premier Vote 1 | Annual Report for 2013/14 Financial Year
39
The unit also makes use of Information Communication Technology to communicate Government programmes and messages to the Public. They therefore provide content management support to the web programmers.
The unit served on various Departmental Task teams such as the Premier’s Service Excellence Awards, Moral Regeneration; interdepartmentally on task teams responsible for Commemorative Days and on those of National Government that celebrate national days so as to provide a strategic communications support function.
The unit also assisted with:• NationalDisabilityMonthLaunch• 16DaysofActivism• WorldAIDSDay• Children’sDay• FreedomDay• YouthDay• Women’sDay• HeritageDay,and• ProvincialStudentFinancialAidbodywithcareerexhibitionsinallfivedistricts
Assistance in terms of speech compilation and translating, photograph and media services as well as communications support to Africa Public Service Day and monthly programme.
The Unit also supported the Department of Cooperative Governance, Human Settlements and Traditional Affairs (COGHSTA) with the launch of Lerato Park Housing Project, Department of Agriculture with the launch of Fetsa Tlala Integrated Food Production Initiative and the launch of infrastructure projects at the Kgalagadi Manganese Mine.
The unit was seconded to attend a first discussion workshop on the Medium Term Strategic Framework (MTSF) Outcome 14 called by the National Department of Arts and Culture.
A highlight for the Communications Directorate was the support given to the Provincial Crime Prevention Strategy in John Taolo Gaetsewe District, the Sol Plaatje University Launch in Kimberley and the successful New Age (TNA) business briefing on Morning Live and ground-breaking work that started on the Nation @ Work TV Programme as well as the National campaign of the 5.6 million house electrification project. Support was also given to the Renosterberg Renewable energy project. The unit was also central in arranging the memorial service and all other activities related to the passing of the former State President. Support was also given to the SABC 2 Morning Live with the elections broadcast from Droogfontein solar Farm.
The unit supported Cooperative Governance Human Settlements and Traditional Affairs with the launch of a housing project in Jan Kempdorp and the National Department of Transport with the launch of the Warrenton Bridge, and Department of Sport, Arts and Culture on initial discussions on the celebration of Freedom Day and the 20 Year Celebrations.

Northern Cape Office of the Premier Vote 1 | Annual Report for 2013/14 Financial Year
40
2.5 Programme Support
Performance Indicator Actual Achievement
2012/13
Actual performance against target 2013/14
Reason for Variances
Planned Target
Actual
Outcome 12 (All four sub-outputs) implementation managed and coordinated through the implementation forum and the Governance & Administration Cluster
4 reports 4 reports 4 reports None
To support the Director General by ensuring all planning instruments are in place and implemented in Units under the Deputy Director-General’s management by developing implementation reports
4 reports 4 reports 4 reports None
In providing support to the units under programme 2, the unit ensured that an effective and efficient developmental provincial government through administrative as well as provision of management support through its Governance & Administration, branch, Executive council makgotla, Head of Department (HOD), Senior Management Team (SMT) and Premier Inter-governmental Forum (PIGF) meetings.
In relation to Outcome 12 (All four sub-outputs) implementation managed and coordinated through the implementation forum and the Governance & Administration Cluster; The Governance and Administration Cluster Report was developed and presented to the Extended Executive Council Lekgotla on the 19th March 2014.
The report was subsequently adopted as a Resolution of the Executive Council. The Report highlights the progress made between 2009 and 2014 with regards to the implementation of Government’s Five year medium Term Strategic framework,withspecialfocusonoutcomes12and9ofan“efficient,effectiveandDevelopment–orientedPublicService” as well as ‘A Responsive, Accountable Effective and Efficient Local Government System.’
The report highlights inter alias the following:• By31December2013about177482householdsintheNorthernCapehadaccesstowater,whichis93.6%• Householdswithaccesstobasiclevelofelectricityis82%,whichis141488HouseholdsintheProvince• 160000households,whichis79.9%wereprovidedwithbasicsanitation• 91232ofHouseholds,whichis64%,hadaccesstorefuseremoval.• Compliance with regards to the signing of Performance Agreements by Senior Management across the
Provincial departments significantly increased from 50.5% in 2010 to 90.7% during 2013/14.• Thevacancyrateacrosstheprovincehasprogressivelyimprovedfromanaverageof17%in2011to14%in
2013.• Theaverageperiod(9months)takentofillvacancieswithinthePublicServicehasbeenreducedtoabout3.9
Months between 2009 and 2014.
The unit continued to coordinate the processes related to the Repositioning of the Public service in the Northern Cape. This project is being driven at a national level from the Department of Public Service and Administration. The project is essentially a Research Project aimed at Repositioning the Public Service for a developmental state. The Research Project is premised on four pillars of which one is to professionalise the public service.

Northern Cape Office of the Premier Vote 1 | Annual Report for 2013/14 Financial Year
41
Progress made during the period under review includes the following amongst others:• TheestablishmentofaProvincialhumanResourceDevelopmentCouncilfortheNorthernCapethatwillserve
as a platform for all public and private sector stakeholders to engage on common matters related to human resource development;
• TheestablishmentofaProvincialPublicServiceAcademyinlinewiththeenvisagedSchoolofGovernmentmooted by the national Department of Public Service and Administration;
• Themerger of theMunicipal Training Institute with the proposed Provincial Training Academy to ensureseamless training across the provincial and local spheres of government;
• InadditiontheOfficeofthePremierhasfinalised itsAnnualAdjustedHumanResourcePlanfortheperiod2013/14 to ensure that the Department has well-coordinated and focused approach to Human Resource Development.
3.3 PROGRAMME 3: POLICY AND GOVERNANCE
PURPOSE
The purpose of this program is to strategically manage policies and strategies towards the achievement of sustainable provincial growth and development and monitoring and evaluation of Government Programme of Action.
SUB-PROGRAMMES3.1 Intergovernmental Relations; International Relations; Official Development Assistance; & Protocol
3.2 Special ProgrammesThe Special Programmes unit continue to ensure that an enabling environment, advancement and socio-economic development for women, children and persons with disabilities is created in the Northern Cape by successfully transforming public service in the Northern Cape to be in line with the set Batho Pele principles and also certifying that protection and promotion of human dignity, equality, freedom for women, children, persons with disabilities and Moral Regeneration Movement (MRM) and Transformation are placed on the Provincial Agenda.
3.3 Provincial Policy Management3.3.1 Policy Coordination, Research and Development3.3.2 Development Planning3.3.3 Monitoring & Evaluation
3.4. Programme support

Northern Cape Office of the Premier Vote 1 | Annual Report for 2013/14 Financial Year
42
PROGRAMME PERFORMANCEGOAL 2: Objectives and targets of the Northern Cape Provincial Growth and Development Strategy progressively realized through facilitation, monitoring and provision of strategic leadership and guidance to the Provincial Administration GOAL 3: Improved efficiency through coordinated, integrated policy development, planning and implementation of the Government Programme of Action GOAL 5: Improved quality of life of all citizens of the province, in particular mainstreaming issues of the vulnerable groups across all government programmes and through promotion of people-centred good governance
Strategic objectives Actual Achievement
2012/2013
Planned Target
2013/2014
Actual Achievement
2013/2014
Deviation from planned
target to Actual Achievement for
2013/2014
Comment on deviations
Number of coordinated; integrated planning and reporting instruments
Not measured Develop a province-wide reporting system
The PIMS system went operational in March 2014, and it will be populated with indicators based on the NDP, new MTSF and other sources
None
Percentage of people living in poverty
None
Number of participants in programmes aimed at benefiting vulnerable groups whose lives have been improved
Not Measured Not Measured This indicator proved to be too vague and it need to be improved
Experience has shown that an indicator of this nature is impractical to compute, as the cost of data gathering exceeds the usefulness of the indicator
3.1 Intergovernmental Relations; International Relations; Official Development Assistance; & ProtocolSUB- PROGRAMME: Inter-governmental Relations
Performance Indicator Actual Achievement
2012/13
Actual performance against target 2013/14
Reason for Variances
Planned Target Actual Achievement
Approved Provincial Inter Governmental Relations Framework Document.
Draft 1 0 (1)Approval of the Premier’s Intergovernmental Forum Document due to outstanding consultation process with John Taolo Gaetsewe district Intergovernmental forum.
Quarterly Report on effectiveness of Departmental Inter-Governmental Forum DIGF and Premier’s Inter-governmental Forum (PIGF)
0 3 Quarterly Departmental Inter-Governmental Forum (DIGF) Reports.
3 Quarterly Departmental Inter-Governmental Forum (DIGF) Reports.
None
Provincial Database on International Relations (IR) Agreement & Activities developed.
1 Provincial database
1 1 None
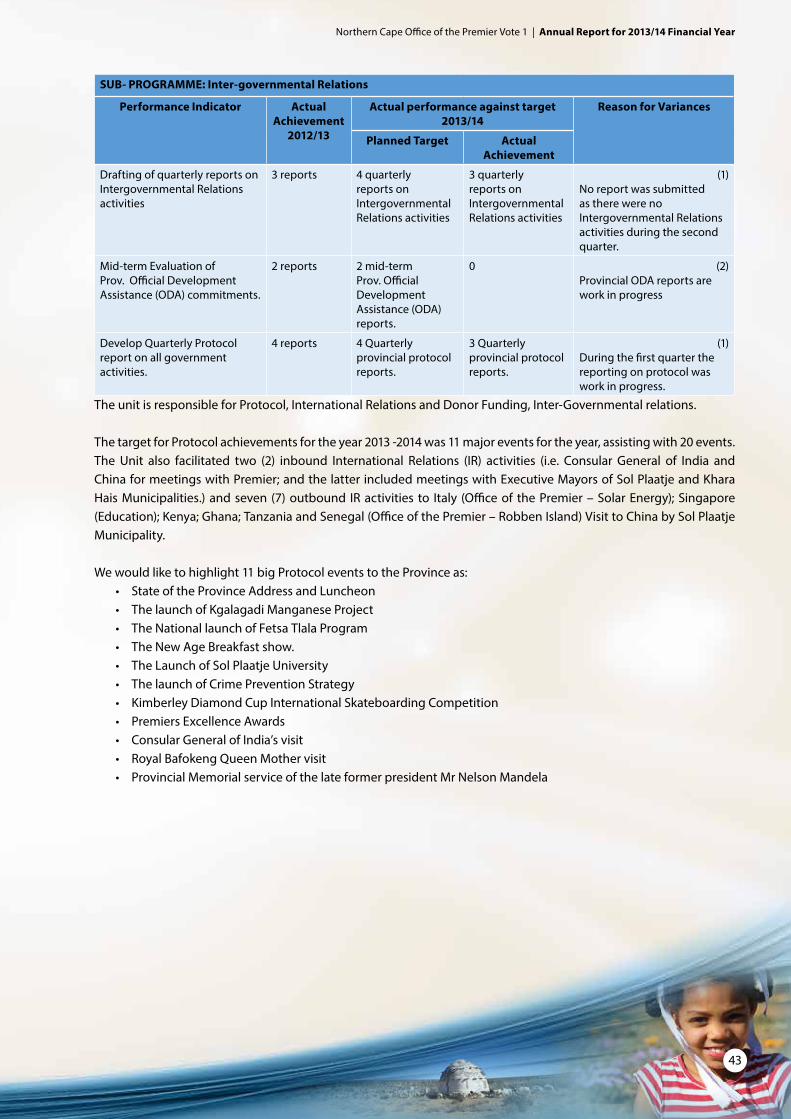
Northern Cape Office of the Premier Vote 1 | Annual Report for 2013/14 Financial Year
43
SUB- PROGRAMME: Inter-governmental Relations
Performance Indicator Actual Achievement
2012/13
Actual performance against target 2013/14
Reason for Variances
Planned Target Actual Achievement
Drafting of quarterly reports on Intergovernmental Relations activities
3 reports 4 quarterly reports on Intergovernmental Relations activities
3 quarterly reports on Intergovernmental Relations activities
(1)No report was submitted as there were no Intergovernmental Relations activities during the second quarter.
Mid-term Evaluation of Prov. Official Development Assistance (ODA) commitments.
2 reports 2 mid-term Prov. Official Development Assistance (ODA) reports.
0 (2)Provincial ODA reports are work in progress
Develop Quarterly Protocol report on all government activities.
4 reports 4 Quarterly provincial protocol reports.
3 Quarterly provincial protocol reports.
(1)During the first quarter the reporting on protocol was work in progress.
The unit is responsible for Protocol, International Relations and Donor Funding, Inter-Governmental relations.
The target for Protocol achievements for the year 2013 -2014 was 11 major events for the year, assisting with 20 events.The Unit also facilitated two (2) inbound International Relations (IR) activities (i.e. Consular General of India and China for meetings with Premier; and the latter included meetings with Executive Mayors of Sol Plaatje and Khara HaisMunicipalities.)andseven (7)outbound IRactivities to Italy (Officeof thePremier–SolarEnergy);Singapore(Education);Kenya;Ghana;TanzaniaandSenegal(OfficeofthePremier–RobbenIsland)VisittoChinabySolPlaatjeMunicipality.
We would like to highlight 11 big Protocol events to the Province as:• StateoftheProvinceAddressandLuncheon• ThelaunchofKgalagadiManganeseProject• TheNationallaunchofFetsaTlalaProgram• TheNewAgeBreakfastshow.• TheLaunchofSolPlaatjeUniversity• ThelaunchofCrimePreventionStrategy• KimberleyDiamondCupInternationalSkateboardingCompetition• PremiersExcellenceAwards• ConsularGeneralofIndia’svisit• RoyalBafokengQueenMothervisit• ProvincialMemorialserviceofthelateformerpresidentMrNelsonMandela

Northern Cape Office of the Premier Vote 1 | Annual Report for 2013/14 Financial Year
44
3.2 Special ProgrammesPerformance Indicator Actual
Achievement 2012/13
Actual performance against target 2013/14
Reason for Variances
Planned Target Actual Achievement
An integrated Mainstreaming for Special Programmes (Children’s Rights, Disability, Gender and Women)
New Indicator An Approved Strategy
0 (1)Mainstreaming framework not yet finalized, unit still consulting with departments.
Quarterly monitoring reports on the implementation of the Employment Equity Plan
4 reports 4 reports 4 reports None
Number of Thusong Service Centre orientated (workshops and information sessions) on the Principles of Batho Pele
2 workshops 3 Workshops & Information Sessions
4 Workshops & Information Sessions
1 Workshop & Information Session–1 Thusong centre was visited though not on the planned programme
Quarterly assessment reports on the mainstreaming of Moral Regeneration Movement
3 reports 4 reports 4 reports None
Other matter that the unit was involved in amongst others was the following:
Participated in the National Department of Social Development commemoration of the International Day against Abuse and Illicit Drug Trafficking held in Kimberley.
Moral Regeneration Movement partnered with Business against Crime & the Religious Sector in conducting a prayer service for former President Nelson Mandela.
The Office of the Premier hosted a Women’s Seminar; part of the program was for the women from the office of the Premier to empower disadvantaged women/teenage girls by donating sanitary towels which were an entrance fee to the seminar. In partnership with the Department of Education, a total amount of 132 sanitary towels were presented to a farm school GN Pressly Intermediate. A presentation on Puberty by MRM was also conducted.
Successfully hosted and coordinated key events such as the Africa Day celebrations, Women’s Day, Children’s Day, People with disability Day, 16 Days of activism against Women and Child Violence, Youth Day and the Premier’s Service Excellence Awards, where the Premier gave key note addresses to give impetus to the importance of these celebrations in line with the vision and policy priorities of National and Provincial Government.
The unit conducted a diversity and change management training session with //Khara Hais Municipality.
Progress reports were compiled by the unit, stating that a women representation on Senior Management System (SMS) level was on 46% and representation for persons with disabilities was on 2.02% in February 2014.
The Women Empowerment and Gender Equality (WEGE) Bill consultative process held in Cape Town was attended by 30 women from our province to engage and participate in discussions. The objective of the consultation process was to present the WEGE Bill to all participants, sensitise awareness on the content of the Bill, educate stakeholders on the Bill and solicit further comments and inputs.

Northern Cape Office of the Premier Vote 1 | Annual Report for 2013/14 Financial Year
45
3.3 Provincial Policy Management
3.3.1 Policy Coordination, Research and DevelopmentPerformance Indicator Actual
Achievement 2012/13
Actual performance against target 2013/14
Reason for Variances
Planned Target
Actual Achievement
Number of transversal policies coordinated to ensure uniformity and compliance.
23 Policies 4 Policies 0 (4) Policies Poor attendance of meetings affected the development of Policies
Reports on policy compliance, uniformity and review produced.
2 reports 4 reports 2 reports (2) reportsPolicy procedure template developed and circulated to all departments and no responses were received from departments in the first quarter. A list of Policies and Procedures was sent to departments during the third quarter, and only one department response was received.
Research conducted to establish impact of public policies.
1 research paper 2 research papers
0 (2) research papersThe unit was unable to conclude the last milestone in the research on PLAS due to the late response from the Department of Rural Development on the Project Officers availability and dates of visits to beneficiaries.
Annual Performance plan document aligned to reporting guidelines and policy directives reviewed annually.
1 1 1 None
Verification of quarterly reports and annual report to be submitted by due date to Treasury and the Legislature
New indicator 4 quarterly +1 annual
4 quarterly +1 annual
None
Credible monitoring reports on the implementation of the Annual Performance Plan tabled at governance structures.
3 reports 4 reports 4 reports None
The Policy coordination, research and development unit ensured that integrated policy for the provincial administration functions are performed effectively in the Northern Cape Provincial Administration and the Office of the Premier.
Continuous intervention was done on implementing the Annual Performance Plan of Office of The Premier and the review thereof.
The unit has further successfully improved accountability through the establishment and maintenance of integrated planning and reporting mechanisms for the Office of the Premier.

Northern Cape Office of the Premier Vote 1 | Annual Report for 2013/14 Financial Year
46
3.3.2 Development PlanningPerformance Indicator Actual
Achievement 2012/13
Actual performance against target 2013/14
Reason for Variances
Planned Target Actual Achievement
Number of instances where assistance was provided to municipalities in the development of spatial development frameworks.
8 7 64 (1)Due to the intensified priority projects programmes the unit had to attend to.
Number of assistances provided in the development of Integrated Development Plans through physical visits or other mechanisms
14 9 115 2As a result of presentations done at Head of Department Forum and Economic Cluster & Executive Council regarding Integrated Development Plans which informs the other two mechanisms.
% of provincial sector departments supported in the alignment of their Annual Performance Plans with Integrated Development Plans , National Spatial Development Perspective, Provincial Spatial Development Framework, Programme of Action and Provincial Growth Development Strategy
50%(6/12) 100% (12/12) 100% (12/12) 6 None
Number of meetings convened for co-ordination of strategic projects through project working groups
New indicator 8 meetings convened
8 meetings convened
None
Number of Planning sessions convened with sector Departments, Municipalities and other stakeholders
New indicator 4 Planning sessions convened
5 Planning sessions convened
1There was a need to improve the quality of reports to convene a planning session in the Executive Council Lekgotla.
The unit provided leadership and support to all structures to contribute towards the achievement of the development targets set in the Provincial Growth and Development Strategy (PGDS) and ensured improved spatial and economic planning though the harmonisation and alignment of the National Spatial Development Framework (NSDP), PGDS, Spatial Development Framework (SDFs), Provincial Spatial Development Framework (PSDF) and Integrated Development Plan (IDPs).
4 Frances Baard District Municipality, Khara Hais Local Municipality, Phokwane Local Municipality, Pixley Ka Seme District Municipality, Kheis Local Municipality and Namakhoi Local Municipality.
5 Magareng Local Municipality, Kamiesberg Local Municipality, Ubuntu Local Municipality, Umsobomvu Local Municipality, Kamiesberg Municipality, John Taolo Gaetsewe, Joe Morolong Municipality, Gasegonyana Municipality, Gamagara Municipality, Head of Department Forum and Economic Cluster and Executive Council.
6 Department of Education, Roads & Public Works, Office of the Premier, Department of Health, Department of Co-operative Governance, Human Settlements & Traditional Affairs, Department of Sports, Arts & Culture, Department of Agriculture, Land Reform & Rural Development, Department of Social Development, Provincial Treasury and Department of Environment and Nature Conservation, Department of Transport, Safety and Liaison and Department of Economic Development and Tourism.

Northern Cape Office of the Premier Vote 1 | Annual Report for 2013/14 Financial Year
47
The unit played a pivotal role in the development of the Northern Cape Provincial Spatial Development Framework (NCPSDF), and the Spatial Planning Land Use Management Bill (SPLUMB).
3.3.3 Monitoring & Evaluation Performance Indicator Actual
Achievement 2012/13
Actual performance against target 2013/14
Reason for Variances
Planned Target Actual Achievement
Number of advisory services provided and supported on the implementation of Monitoring and Evaluation Frameworks and plan in all departments and municipalities.
New indicator 12 11 (1) Monitoring and Evaluation forum meeting: 12 March 2014 did not sit due to lack of a quorum
To manage and oversee the implementation of the Outcome Based Priorities through the provincial nerve centre.
New indicator 5 5 None
Number of Coordinated, executed and monitored Performance Evaluations and Impact Studies on Service Delivery, Programme Performance and Policy implementation
New indicator 4 4 None
Number Coordinated Monitored and Reports on the implementation of Management Performance Assessment Tool (MPAT) and assistance provided to departments to implement their MPAT improvement plans.
4 reports 4 Reports 4 Reports None
Number of programmes, service delivery site visits Monitored and Reports on frontline service delivery as well as follow reports on the implementation of recommendations.
0 40 site visits 58 site visits 7 and 1 Frontline Service Delivery Programme for 2014/15
18 site visits
The Monitoring and Evaluation unit ensured that the Premier and the Executive Council can effectively and efficiently utilize quality data to track performance of the provincial government and support service delivery initiatives and interventions.
The unit has successfully coordinated the following amongst others;• FrontlineServiceDelivery(FSD)monitoringprogrammeintheprovince.• ManagementPerformanceAssessmentTool(MPAT)intheadministration
7 Springbok SASSA Offices, Springbok Home Affairs, Nama-Khoi drivers licence testing centre, Nama-Khoi Municipal Customer Care Centre-Steinkopf, Steinkopf Community Safety Centre, Theron High School-Britstown, Britstown Primary Health Centre, Jan-Kempdorp Primary and Community Health Centre, Kgomotso High School Pampierstad, Jan Witbooi Primary Health Care, Langberg High School, SASSA Kakamas, Community Service Centre- South African Police Service Kakamas, De Aar Magistrates Court, Kimberley Family Law Court, Tshwaragano Hospital, Augrabies Municipal Customer Care Centre, Nababeep Combined school, Nababeep High School, Springbok Magistrate Court, Tshwaragano Community Health Care, Nababeep Primary Health Centre, Kimberley Hospital Complex, Greenpoint Primary Health Care, Britstown Clinic, SASSA-Barkly West, Manne Dipico MPCC, Lopeng Clinic, Mothibistad Drivers Licence Testing Centre, Tsineng CSC, Sol Plaatje Drivers Licence Testing Centre, Witdom CSC, Pabalelo High School, Betty Gaetsewe Primary Health Centre

Northern Cape Office of the Premier Vote 1 | Annual Report for 2013/14 Financial Year
48
The unit visited 58 sites viz. (Springbok SASSA Offices, Springbok Home Affairs, Nama-Khoi drivers licence testing centre, Nama-Khoi Municipal Customer Care Centre-Steinkopf, Steinkopf Community Safety Centre, Theron High School-Britstown, Britstown Primary Health Centre, Jan-Kempdorp Primary and Community Health Centre, Kgomotso High School Pampierstad, Jan Witbooi Primary Health Care, Langberg High School, SASSA Kakamas, Community Service Centre- South African Police Service Kakamas, De Aar Magistrates Court, Kimberley Family Law Court, Tshwaragano Hospital, Augrabies Municipal Customer Care Centre, Nababeep Combined school, Nababeep High School, Springbok Magistrate Court, Tshwaragano Community Health Care, Nababeep Primary Health Centre, Kimberley Hospital Complex, Greenpoint Primary Health Care, Britstown Clinic, SASSA-Barkly West, Manne Dipico MPCC, Lopeng Clinic, Mothibistad Drivers Licence Testing Centre, Tsineng CSC, Sol Plaatje Drivers Licence Testing Centre, Witdom CSC, Pabalelo High School, Betty Gaetsewe Primary Health Centre) and reviewed them and also had feedback sessions and a performance improvement plan put in place to address performance weaknesses identified on Frontline Service Delivery Programmes.
Frontline Service Delivery Monitoring (FSDM) entails announced and unannounced visitations to service delivery sites to monitor the level of services offered at identified sites. During the given financial year, 16 baseline site visits were conducted, 16 feedback and 27 improvement monitoring site visits were undertaken. The visits are carried out in partnership with the Department of Performance Monitoring and Evaluation in the Presidency (DPME) and continue to register desired improvements in service levels.
The unit successfully coordinated the launch and implementation of version 1.3 of the Management Performance Assessment Tool (MPAT) in the provincial administration, aimed at progressively improving management practices in the public service. The instrument has been successfully institutionalized in the provincial administration and continues to register improved compliance with regulations and legislative prescripts. Improvement plans monitoring were periodically conducted.
In terms of the coordination and implementation of the 12 outcomes, the unit participated in the departmental launches of the Technical Implementation forums; the Strategic Annual Performance Plans review sessions and various other platforms to deepen M&E practices in organizations.
Participated in provincial and national monitoring and evaluation activities e.g. M&E Forums; War on Poverty meetings and Learning Network sessions etc.
The unit provided guidance and support to departments on the development and alignment of strategic Plans and Annual Performance Plans to the NDP and MTSF Priorities.
The Terms of Reference for the M&E Forum finalized and approved.
The unit conducted three (3) desktop evaluations (i.e. Kimberley Diamond Jewellery Association, Social Relief and Food Provision and Lerato Park) on programmes identified by departments, two (2) of which have been successfully completed and Lerato Park is still to be finalised.
The Evaluation Plan is also completed, although because of protocol structures, it will be implemented in the 2014-15 financial year.
The unit continued to implement the electronic M&E system in the administration as well as to provide related training to ensure its successful implementation and proper utilization.
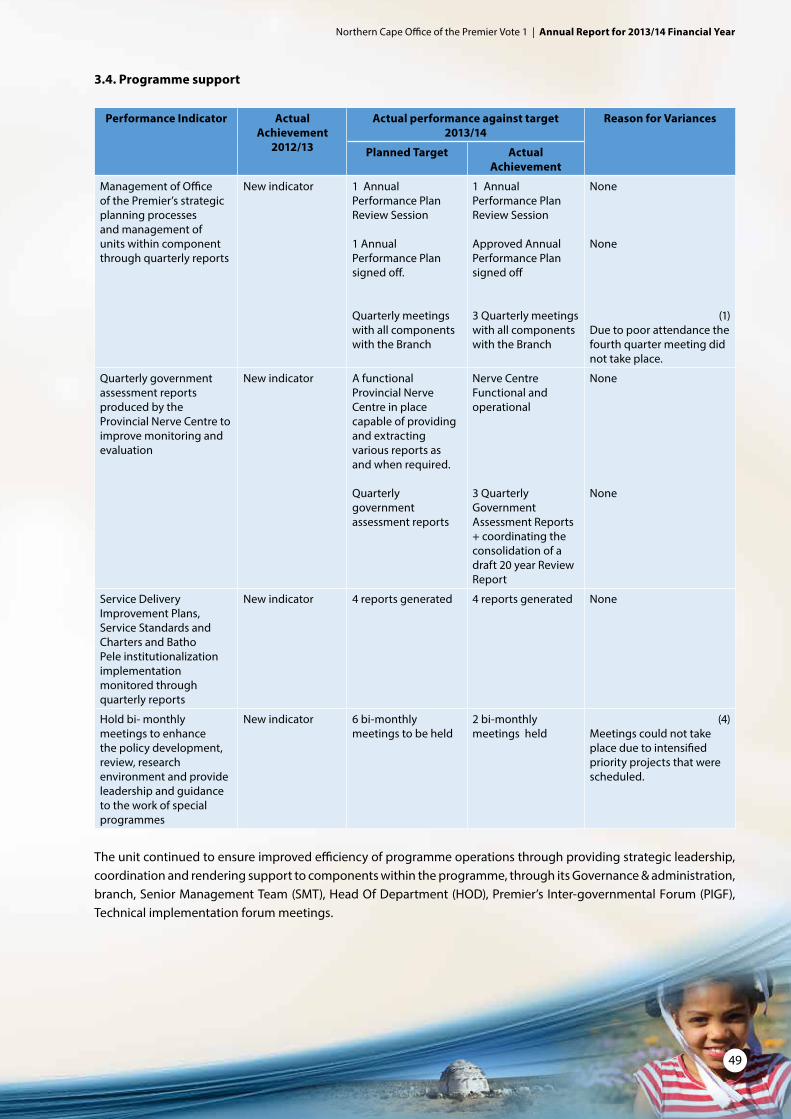
Northern Cape Office of the Premier Vote 1 | Annual Report for 2013/14 Financial Year
49
3.4. Programme support
Performance Indicator Actual Achievement
2012/13
Actual performance against target 2013/14
Reason for Variances
Planned Target Actual Achievement
Management of Office of the Premier’s strategic planning processes and management of units within component through quarterly reports
New indicator 1 Annual Performance Plan Review Session
1 Annual Performance Plan signed off.
Quarterly meetings with all components with the Branch
1 Annual Performance Plan Review Session
Approved Annual Performance Plan signed off
3 Quarterly meetings with all components with the Branch
None
None
(1)Due to poor attendance the fourth quarter meeting did not take place.
Quarterly government assessment reports produced by the Provincial Nerve Centre to improve monitoring and evaluation
New indicator A functional Provincial Nerve Centre in place capable of providing and extracting various reports as and when required.
Quarterly government assessment reports
Nerve CentreFunctional and operational
3 Quarterly Government Assessment Reports + coordinating the consolidation of a draft 20 year Review Report
None
None
Service Delivery Improvement Plans, Service Standards and Charters and Batho Pele institutionalization implementation monitored through quarterly reports
New indicator 4 reports generated 4 reports generated None
Hold bi- monthly meetings to enhance the policy development, review, research environment and provide leadership and guidance to the work of special programmes
New indicator 6 bi-monthly meetings to be held
2 bi-monthly meetings held
(4)Meetings could not take place due to intensified priority projects that were scheduled.
The unit continued to ensure improved efficiency of programme operations through providing strategic leadership, coordination and rendering support to components within the programme, through its Governance & administration, branch, Senior Management Team (SMT), Head Of Department (HOD), Premier’s Inter-governmental Forum (PIGF), Technical implementation forum meetings.

Northern Cape Office of the Premier Vote 1 | Annual Report for 2013/14 Financial Year
50
The programme played a critical role with the coordination and planning of the Strategic Integrated Projects (SIPS) for the Northern Cape Provincial Government, viz. the new University Steering Project Committee, engagement with mines with regards to John Taolo Gaetsewe Development, Solar Energy in Upington and Square Kilometre Array (SKA) Site Visit and others.
As part of the overseeing functions, the Office facilitated the Energy and Water Sector Education and Training Authority service level Agreement that was signed to provide funding for the Renewable Energy in the Province and also facilitated the proposal for appointment of a Project leader for the Northern Cape Renewable Energy Sonar Energy Zone Project Steering Committee. The signing of the Memorandum of Understanding between the Communal Property Association and Buckland’s Community Development Trust also took place.
In line with ensuring service delivery at a local level, a total of seventeen (17) municipalities were visited with the purpose to check the status and institutionalization of Batho Pele in the Municipalities, to gather information around challenges on access to services, to identify officials assigned with the responsibility of dealing with Batho Pele, to popularize the customer care workshop, and to do follow-ups on issues on Service Standards and Charters at all Municipalities.
Furthermore, in line with the assessment of government performance, the office has a functional Nerve Centre which is capable of providing and extracting various reports as and when required. 3 assessment reports were produced to improve monitoring and evaluation and the programme coordinated the consolidation of a draft 20 years Review Report
3.4 Strategy to overcome areas of under performance
All units are required to submit quarterly assessments of their performance. They must also submit documentary proof of achievements. Any deviation must be explained. The relevant supervisors will then have follow-up discussions with unit heads where there is a risk of under-performance.
Where there is a significant probability of underperformance, these risks are elevated to the risk plan where it is monitored as part of the risk management strategy.
Of the 75 targets 57 were achieved, while 9 were over-achieved. The strategy outlined above will assure that we also will achieve the 18 targets that were partially achieved in this cycle.

Northern Cape Office of the Premier Vote 1 | Annual Report for 2013/14 Financial Year
51
3.5
Chan
ges
to p
lann
ed ta
rget
s
Prog
Uni
tPe
rfor
man
ce In
dica
tor
Ann
ual T
arge
tRe
vise
d Pe
rfor
man
ce
Indi
cato
r
Revi
sed
Targ
etRe
ason
Programme 1_Administration
DG
Sup
port
Num
ber o
f Sen
ior M
anag
emen
t Te
am m
eetin
gs w
here
org
anis
atio
nal
perf
orm
ance
ass
essm
ents
was
di
scus
sed.
12N
/A9
Oth
er K
ey S
trat
egic
issu
es a
re d
iscu
ssed
du
ring
mid
-yea
r per
form
ance
revi
ew,
quar
terly
per
form
ance
ass
essm
ents
and
A
nnua
l Per
form
ance
Pla
n re
view
Ses
sion
s.
EXCO
Num
ber o
f Exe
cutiv
e co
unci
l and
the
clus
ters
eng
agem
ent w
here
sup
port
w
as re
nder
ed e
ffect
ivel
y
48N
/A24
This
targ
et is
bey
ond
Offi
ce o
f The
Pre
mie
r’s
cont
rol a
s it
invo
lves
the
enga
gem
ent o
f Po
litic
al P
rinci
ples
in o
ther
pro
gram
mes
an
d th
eref
ore
not “
SMA
RT”.
It ne
eds
to b
e re
duce
d to
wha
t we
have
con
trol
ove
r and
no
t som
eone
els
e’s
prer
ogat
ive.
Programme 2_Institutional Development
Labo
ur
Rela
tions
Mon
itorin
g th
e St
rike
Man
agem
ent
Plan
for t
he P
rovi
ncia
l Adm
inis
trat
ion
1 Pl
an, Q
uart
erly
st
rike
man
agem
ent
com
mitt
ee m
eetin
g
Rem
ove
Rem
ove
Rem
ove
indi
cato
r. A
long
-ter
m c
olle
ctiv
e ag
reem
ent i
s in
pla
ce. T
arge
ts a
re a
mbi
guou
s an
d no
t “SM
ART
” as
it w
ill n
ot b
e ap
plic
able
du
ring
this
yea
r of a
sses
smen
t.
Hum
an
Reso
urce
A
dmin
istr
atio
n
Num
ber o
f Rep
orts
indi
catin
g co
mpl
ianc
e to
Out
com
e 12
N/A
Num
ber o
f Re
port
s in
dica
ting
com
plia
nce
to
Out
com
e 12
(sub
-ou
tput
2 &
3)
N/A
The
indi
cato
r is
broa
d an
d no
t spe
cific
Prog
ram
me
supp
ort
Out
com
e 12
impl
emen
tatio
n m
anag
ed a
nd c
oord
inat
ed th
roug
h th
e im
plem
enta
tion
foru
m a
nd th
e G
over
nanc
e &
Adm
inis
trat
ion
Clus
ter.
N/A
Out
com
e 12
(All
four
sub
-out
puts
) im
plem
enta
tion
man
aged
and
co
ordi
nate
d th
roug
h th
e im
plem
enta
tion
foru
m a
nd th
e G
over
nanc
e &
A
dmin
istr
atio
n Cl
uste
r.
N/A
The
indi
cato
r is
broa
d an
d no
t spe
cific
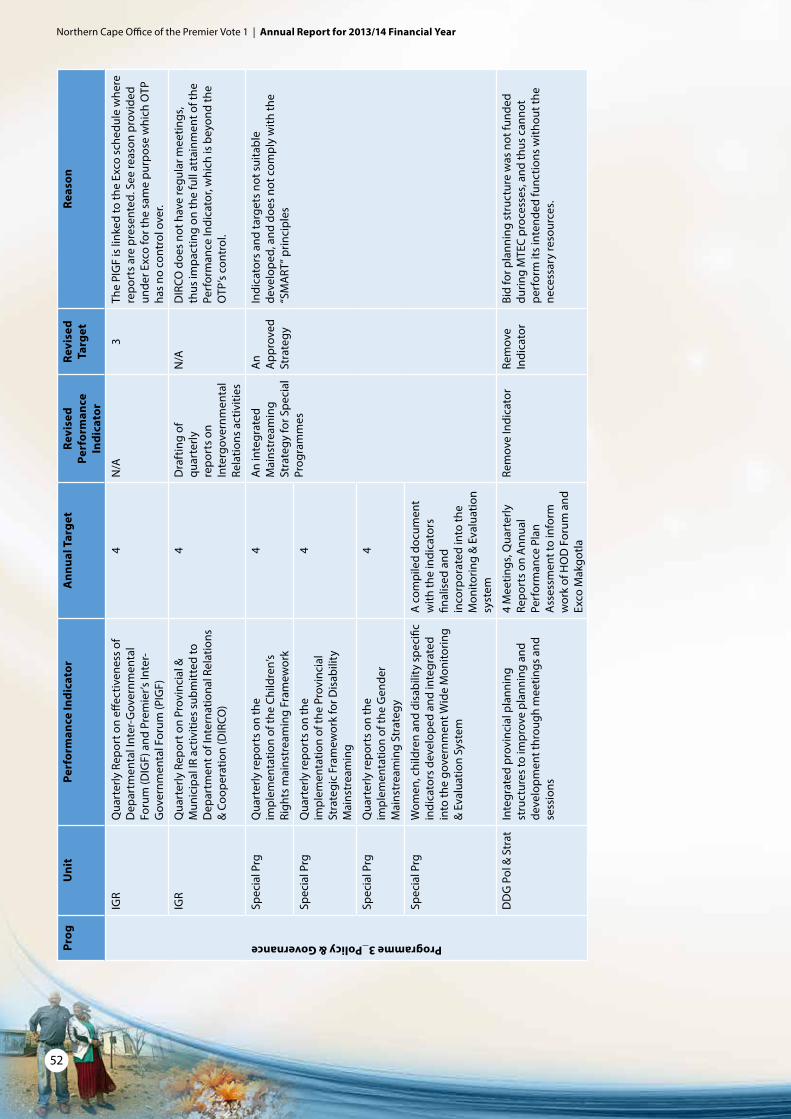
Northern Cape Office of the Premier Vote 1 | Annual Report for 2013/14 Financial Year
52
Prog
Uni
tPe
rfor
man
ce In
dica
tor
Ann
ual T
arge
tRe
vise
d Pe
rfor
man
ce
Indi
cato
r
Revi
sed
Targ
etRe
ason
Programme 3_Policy & Governance
IGR
Qua
rter
ly R
epor
t on
effec
tiven
ess
of
Dep
artm
enta
l Int
er-G
over
nmen
tal
Foru
m (D
IGF)
and
Pre
mie
r’s In
ter-
Gov
ernm
enta
l For
um (P
IGF)
4N
/A3
The
PIG
F is
link
ed to
the
Exco
sch
edul
e w
here
re
port
s ar
e pr
esen
ted.
See
reas
on p
rovi
ded
unde
r Exc
o fo
r the
sam
e pu
rpos
e w
hich
OTP
ha
s no
con
trol
ove
r.
IGR
Qua
rter
ly R
epor
t on
Prov
inci
al &
M
unic
ipal
IR a
ctiv
ities
sub
mitt
ed to
D
epar
tmen
t of I
nter
natio
nal R
elat
ions
&
Coo
pera
tion
(DIR
CO)
4D
raft
ing
of
quar
terly
re
port
s on
In
terg
over
nmen
tal
Rela
tions
act
iviti
es
N/A
DIR
CO d
oes
not h
ave
regu
lar m
eetin
gs,
thus
impa
ctin
g on
the
full
atta
inm
ent o
f the
Pe
rfor
man
ce In
dica
tor,
whi
ch is
bey
ond
the
OTP
’s co
ntro
l.
Spec
ial P
rgQ
uart
erly
repo
rts
on th
e im
plem
enta
tion
of th
e Ch
ildre
n’s
Righ
ts m
ains
trea
min
g Fr
amew
ork
4A
n in
tegr
ated
M
ains
trea
min
g St
rate
gy fo
r Spe
cial
Pr
ogra
mm
es
An
App
rove
d St
rate
gy
Indi
cato
rs a
nd ta
rget
s no
t sui
tabl
e de
velo
ped,
and
doe
s no
t com
ply
with
the
“SM
ART
” prin
cipl
es
Spec
ial P
rgQ
uart
erly
repo
rts
on th
e im
plem
enta
tion
of th
e Pr
ovin
cial
St
rate
gic
Fram
ewor
k fo
r Dis
abili
ty
Mai
nstr
eam
ing
4
Spec
ial P
rgQ
uart
erly
repo
rts
on th
e im
plem
enta
tion
of th
e G
ende
r M
ains
trea
min
g St
rate
gy
4
Spec
ial P
rgW
omen
, chi
ldre
n an
d di
sabi
lity
spec
ific
indi
cato
rs d
evel
oped
and
inte
grat
ed
into
the
gove
rnm
ent W
ide
Mon
itorin
g &
Eva
luat
ion
Syst
em
A c
ompi
led
docu
men
t w
ith th
e in
dica
tors
fin
alis
ed a
nd
inco
rpor
ated
into
the
Mon
itorin
g &
Eva
luat
ion
syst
em
DD
G P
ol &
Str
atIn
tegr
ated
pro
vinc
ial p
lann
ing
stru
ctur
es to
impr
ove
plan
ning
and
de
velo
pmen
t thr
ough
mee
tings
and
se
ssio
ns
4 M
eetin
gs, Q
uart
erly
Re
port
s on
Ann
ual
Perf
orm
ance
Pla
n A
sses
smen
t to
info
rm
wor
k of
HO
D F
orum
and
Ex
co M
akgo
tla
Rem
ove
Indi
cato
rRe
mov
e In
dica
tor
Bid
for p
lann
ing
stru
ctur
e w
as n
ot fu
nded
du
ring
MTE
C pr
oces
ses,
and
thus
can
not
perf
orm
its
inte
nded
func
tions
with
out t
he
nece
ssar
y re
sour
ces.

Northern Cape Office of the Premier Vote 1 | Annual Report for 2013/14 Financial Year
53
3.6 Linking performance with budgets Sub- Programme
Name2013/2014 2012/2013
Final Appropriation
(R’000)
Actual Expenditure
(R’000)
(Over)/Under Expenditure
(R’000)
Final Appropriation
(R’000)
Actual Expenditure
(R’000)
(Over)/Under
Expenditure (R’000)
Premier Support 14,045 14,045 0 16,486 16,486 0
Director General Support
28,243 25,947 2,296 20,086 19,445 641
Executive Council Support
6,672 6,672 0 4,884 4,885 (1)
Financial Management 32,999 32,999 0 28,405 28,403 2
Programme 1 81,959 79,663 2,296 69,862 69,218 642
Strategic Human Resources
36,549 36,549 0 33,426 33,426 0
ICT 9,024 8,373 651 1,086 1,086 0
Legal Services 4,972 4,972 0 4,231 4,231 0
Communications 19,183 18,883 300 3,102 3,101 1
Programme Support 2,749 2,749 0 2,355 2,355 0
Programme 2 72,477 71,526 951 52,510 52,509 1
Special Programmes 12,983 12,983 0 19,196 16,559 2,637
IGR 2,063 2,063 0 2,030 2,030 0
Provincial Policy Management
15,139 12,619 2,520 10,833 8,924 1,909
Programme Support 2,551 1,266 1,285 1,337 1,337 0
Programme 3 32,736 28,931 3,805 34,605 30,059 4,546

Northern Cape Office of the Premier Vote 1 | Annual Report for 2013/14 Financial Year
54
B.4 Transfer Payments
4.1 Transfer payments to Public Entities
PSETA – R306 000At reporting date the amount was unspent by the entity, but has been committed for projects to be executed during 2014/15 financial year.
4.2 Transfer payments to all organisations other than public entities
The table below reflects the transfer payments made for the period 1 April 2013 to 31 March 2014
Name of transferee
Type of organisation
Purpose for which the funds
were used
Did the dept. comply with s 38 (1) (j) of the PFMA
Amount transferred
(R’000)
Amount spent by the
entity
Reasons for the funds
unspent by the entity
Premier’s Bursary Trust Fund
Trust Study loans for students
Yes 13 504 13 504 -
Mme Re Ka Thusa Trust Financial assistance for previously disadvantaged women to empower them to become economically active
Yes 3 948 3 343 Grant allocations will be processed further during 2014/15
The table below reflects the transfer payments which were budgeted for in the period 1 April 2013 to 31 March 2014, but no transfer payments were made.
None
B5. Conditional Grants
5.1 Conditional grants and earmarked funds paid
The table/s below details the conditional grants and ear marked funds paid during for the period 1 April 2013 to 31 March 2014. None
5.2 Conditional grants and earmarked funds received
The table/s below details the conditional grants and ear marked funds received during for the period 1 April 2013 to 31 March 2014.
None

Northern Cape Office of the Premier Vote 1 | Annual Report for 2013/14 Financial Year
55
B.6 Donor Funds
6.1 Donor Funds Received
A foreign donation of R 187 467.02 was received and spent during the financial year for exclusive purpose of payment of external audit fees pertaining to the INSPIRE (Information Society Strategy Programme in the Republic of South Africa) close-out project. The donors commissioned an external audit regarding the usage of donor funding for intended purposes. The donors were satisfied with the audit report on the project. INSPIRE was an inter-provincial programme between Northern Cape, Limpopo and the Presidential National Planning Commission. It was funded by the Finish and South African governments. The purpose of INSPIRE programme was to develop provincial information society strategies for the two provinces, aligned to the National Plan.
The table/s below details the donor funds received during for the period 1 April 2013 to 31 March 2014.
Name of donor INSPIRE (Information Society Strategy Programme in the Republic of South Africa)
Full amount of the funding R 187 467.02
Period of the commitment Project has closed out
Purpose of the funding Payment of external audit fees
Expected outputs External Audit Document
Actual outputs achieved External Audit Document
Amount received in current period (R’000) R 187 467.02
Amount spent by the department (R’000) R 187 467.02
Reasons for the funds unspent No funds were unspent
Monitoring mechanism by the donor The external audit was an auditing instrument utilised by the donor as part of the closing out process. The funds were solely for the associated audit cost
B.7 Capital Investment Capital investment, maintenance and asset management plan
Refer to Note 5.7 for maintenance appropriated and expensed during the financial year. The user asset management plan was compiled and approved for 2013/14 financial year.
Infrastructure projects
2013/2014 2012/2013
Final Appropriation
R’000
Actual Expenditure
R’000
(Over)/Under Expenditure
R’000
Final Appropriation
R’000
Actual Expenditure
R’000
(Over)/Under Expenditure
R’000
Maintenance and repairs
168 168 - - - -
Total 168 168 - - - -

Northern Cape Office of the Premier Vote 1 | Annual Report for 2013/14 Financial Year
56
PART C: Governance

Northern Cape Office of the Premier Vote 1 | Annual Report for 2013/14 Financial Year
57
PART C: Governance
C.1 Introduction
The Office of the Premier has committed itself to maintain the highest standards of governance. This includes the prudent management of public finances and resources, as it would give the necessary assurance that the OTP has good governance structures in place to effectively, efficiently and economically utilize the state resources, which is funded by the tax payer.
C.2 Risk Management
A comprehensive risk assessment was performed for 2013/14 financial year resulting in an approved risk register for the financial year. This register was continuously updated with new emerging risks by the Risk Manager on a regular basis during the financial year. Using the approved risk register, action plans were devised to mitigate prioritised top risks. Furthermore, the approved risk register was also provided to the Internal Audit unit to serve as the basis for the development of their rolling internal audit plans.
A risk management committee, appointed in writing by the Accounting Officer, to assist him to discharge his risk management organisation-wide responsibilities was in place for the entire 2013/14 financial year. The Risk management Committee is composed of Senior Executives of the organisation with appropriate diverse skills mix. The committee monitors progress on the implementation of risk mitigation measures to the top risks facing the organisation.
The committee, chaired by Accounting Officer, met four times on the following dates:Date
18 September 2013
26 November 2013
31 January 2014
25 February 2014
C.3 Fraud and Corruption
The Office is not aware of any fraud that was conducted during the year under review.
C.4 Minimising Conflict of Interest
• Bidcommitteemembersdeclaretheirinterestpereachbid• A policy for remuneration for work performed outside the public service (RWOPS) was approved and
implemented during the financial year• Seniormanagersandsupplychainmanagementofficialsdisclosetheirbusinessinterestsonanannualbasis
that are noted by the Executing Authority. Noted declarations are forwarded to the Public Service Commission for compliance.

Northern Cape Office of the Premier Vote 1 | Annual Report for 2013/14 Financial Year
58
C.5 Code of Conduct
A code of conduct was developed in previous financial years and it is renewed on an annual basis for any updates/deletions. The updated document is disseminated to all departmental officials for awareness and implementation.
C.6 Health Safety and Environmental Issues
During the financial year the term of office of the Health Safety Committee expired. The composition and appointment of the new committee will be during the 2014/15 financial year and this committee will work closely with the existing department wide Risk Management Committee. While the new Health and Safety Committee is being re-established, all safety and environmental risks are being managed through the Risk Management Committee.
C.7 Portfolio Committees
The department appeared before the Portfolio Committee on Finance during the financial year to present the 2012/13 annual report.
C.8 SCOPA Resolutions
Resolution No. Subject Details Response by the department Resolved (Yes/No)
Resolution 1 Predetermined objectives
The Director General should ensure that all predetermined objectives are adequately addressed and officials are capacitated and monitored on a monthly basis to ensure adequate reporting on predetermined objectives.
A control was put in place for Management Accounting section of Finance, to independently verify quarterly performance information that was consolidated by Policy and Planning Unit. The purpose of this control was to improve accuracy, validity and completeness of performance information when comparing with the annual performance plan and supporting evidence.
Yes
Resolution 2 Operation Clean Audit
The Director General should submit a progress report within 30 days on operation clean audit 2014, detailing the following:State of readiness of government departments, municipalities, and entities in respect of expected unqualified audit outcomes without matters of emphasis.
The Director General submitted a detailed state of readiness report to the Standing Committee on Public Accounts (SCOPA) within 30 days as requested. Copies of the submitted reports have been provided to the external auditors as evidence thereto.
Yes
C.9 Prior modifications to audit reports
None
C.10 Internal Control Unit
The Office of the Premier does not have a separate Internal control Unit. However, preventative, detective and management controls are embedded in organization-wide business processes for execution by the line function officials.

Northern Cape Office of the Premier Vote 1 | Annual Report for 2013/14 Financial Year
59
Internal control
There was no material breakdown of internal controls during the year under review. The internal control environment was sound.
C.11 Internal Audit and Audit Committees
C.11.1 Internal Audit
Key activities and objectives of the internal audit: The Executive Council of the Northern Cape Provincial Government has established a Shared Provincial Internal Audit Unit (PIAU) to provide internal audit services to all 12 departments within the province. The shared PIAU is divided into 4 clusters, Office of the Premier being serviced by the PIAU - Health Cluster. The PIAU is an independent, objective assurance and consulting activity designed to add value and improve the client’s operations.
The following internal audit work was completed during the year under review: • InformationTechnologyGovernancereview• GIAMAandNorthernCapeLandAdministrationActreview• ManagementPerformanceAssessmentToolcertification• InterimFinancialStatementsreview• AnnualFinancialStatementsreview• VerificationofBASsecurity• Transferpaymentcontrols• HumanResourceManagement• AuditofPerformanceInformation• SupplyChainManagement• FraudRiskevaluation
The internal audit unit also attended and contributed to the departmental risk management committee meetings and ad hoc management meetings as and when requested.
C.11.2 Audit Committee
Key activities and objectives of the audit committee:The Executive Council of the Northern Cape Provincial Government has established Cluster Audit Committees for the 12 Provincial Departments. The Health Cluster Audit Committee deals with 3 departments including the Office of the Premier. The Audit Committee assists the department by providing advice relating to the reporting process, the system of internal control, the risk management processes, the internal and external audit process and the departments processes for monitoring compliance with laws and regulations and the code of conduct.
The Audit Committee consists of the members listed below. It meets as frequent as mandated by the approved Audit Committee charter and as often as it deems necessary.
During the financial year under review, 4 meetings were convened as per its charter.
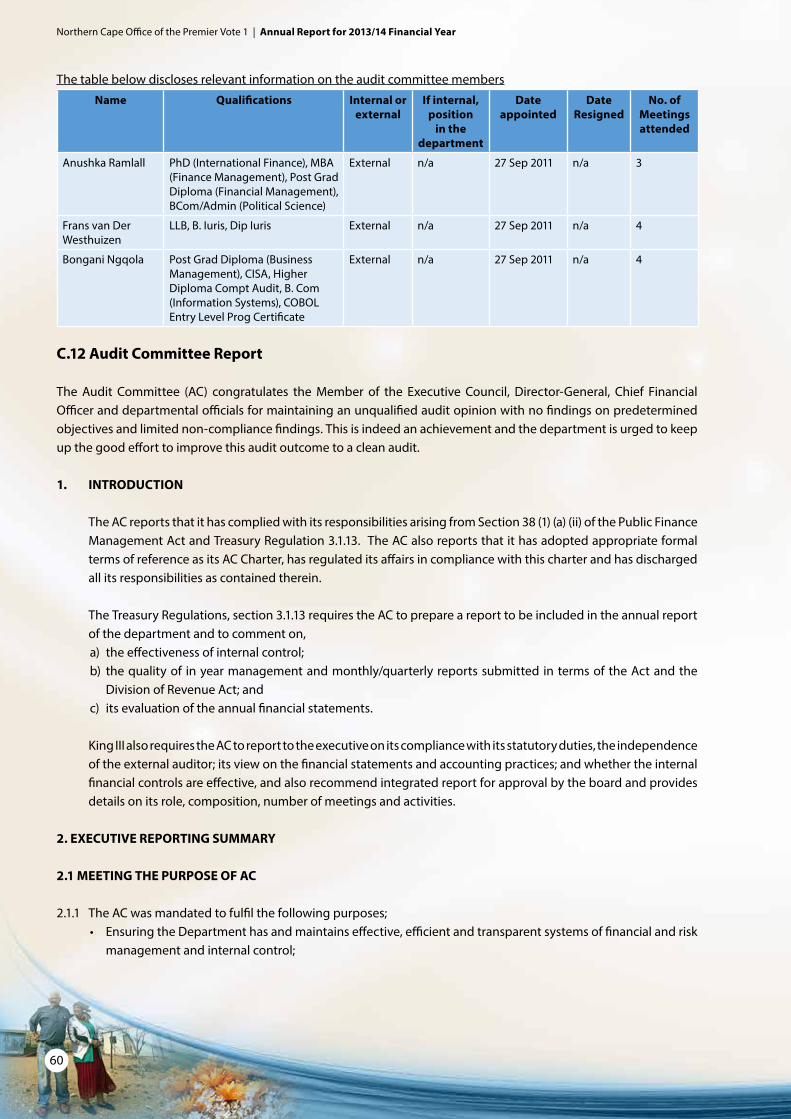
Northern Cape Office of the Premier Vote 1 | Annual Report for 2013/14 Financial Year
60
The table below discloses relevant information on the audit committee members
Name Qualifications Internal or external
If internal, position
in the department
Date appointed
Date Resigned
No. of Meetings attended
Anushka Ramlall PhD (International Finance), MBA (Finance Management), Post Grad Diploma (Financial Management), BCom/Admin (Political Science)
External n/a 27 Sep 2011 n/a 3
Frans van Der Westhuizen
LLB, B. Iuris, Dip Iuris External n/a 27 Sep 2011 n/a 4
Bongani Ngqola Post Grad Diploma (Business Management), CISA, Higher Diploma Compt Audit, B. Com (Information Systems), COBOL Entry Level Prog Certificate
External n/a 27 Sep 2011 n/a 4
C.12 Audit Committee Report
The Audit Committee (AC) congratulates the Member of the Executive Council, Director-General, Chief Financial Officer and departmental officials for maintaining an unqualified audit opinion with no findings on predetermined objectives and limited non-compliance findings. This is indeed an achievement and the department is urged to keep up the good effort to improve this audit outcome to a clean audit.
1. INTRODUCTION
The AC reports that it has complied with its responsibilities arising from Section 38 (1) (a) (ii) of the Public Finance Management Act and Treasury Regulation 3.1.13. The AC also reports that it has adopted appropriate formal terms of reference as its AC Charter, has regulated its affairs in compliance with this charter and has discharged all its responsibilities as contained therein.
The Treasury Regulations, section 3.1.13 requires the AC to prepare a report to be included in the annual report of the department and to comment on, a) the effectiveness of internal control;b) the quality of in year management and monthly/quarterly reports submitted in terms of the Act and the
Division of Revenue Act; andc) its evaluation of the annual financial statements.
King III also requires the AC to report to the executive on its compliance with its statutory duties, the independence of the external auditor; its view on the financial statements and accounting practices; and whether the internal financial controls are effective, and also recommend integrated report for approval by the board and provides details on its role, composition, number of meetings and activities.
2. EXECUTIVE REPORTING SUMMARY
2.1 MEETING THE PURPOSE OF AC
2.1.1 The AC was mandated to fulfil the following purposes; • EnsuringtheDepartmenthasandmaintainseffective,efficientandtransparentsystemsoffinancialandrisk
management and internal control;

Northern Cape Office of the Premier Vote 1 | Annual Report for 2013/14 Financial Year
61
• Ensuringtheenforcementofadequatesystemsandcontrolprocessinthedepartmentforsafeguardingofassets and the management of the revenue, expenditure and liabilities of the department;
• Ensuringthepreparationofaccuratefinancialreportingandmonitoringcompliancewithallapplicablelegalrequirements and accounting standards;
• Ensuringdepartment’saccountabilityandmanagingtheassociatedriskintermsofmanagement,assuranceand reporting.
2.1.2 While carrying its mandate in ensuring achievement of the above-listed requirements to achieve its stated purpose, the AC for the Office of the Premier (OTP) experienced some challenges. However, significant strides have been made in the last year and a half by OTP to achieve and maintain the effective system of internal controls. The following are the weaknesses that were resolved: • Thesystemofinternalcontrolisnotyeteffectivebutimprovingcontinuously;• RiskManagementprocessesarenowestablishedandoperational;• There are nomaterialweaknesses that have been identifiedduring theAC’s reviewof the draft Annual
Financial Statements; 2.2 AUTHORITY OF THE AC
The AC has for the past financial year ended 31 March 2014 maintained its authority. The AC still maintained; • Unrestrictedaccesstopersonnelandrecords;andwasabletocommandtheDepartment’sresourcesthat
are necessary for carrying out its duties. • TheACcontinuedtomakerecommendationstothemanagementofOTP,whichrecommendationshave
been implemented.
2.3 COMPOSITION OF THE COMMITTEE
2.3.1 As at the end of the financial year, the AC consisted of only 3 external members who just making quorum of 3 members as required by the Charter as 2 internal AC members were not replaced since resignation.
2.3.2 The request for the filling of the two vacant posts has been made to the Provincial Treasury but these has not been filled.
2.3.3 The AC members are suitably skilled, experienced and have sufficient qualifications and experience to fulfil their duties as AC members. The AC members have collectively demonstrated good understanding of; • CorporateGovernance;RiskManagement&PerformanceManagement;• SystemofInternalControls,FinancialandSustainabilityReporting;• InternalandExternalAuditprocesses;• ExternalLegislation,Regulations,ActsandLaws,including;PFMAandTreasuryRegulationsand;• InformationTechnology.
2.3.4 The AC members have sufficiently, individually and collectively demonstrated independence, objectivity and integrity and have also demonstrated ethical and moral values while executing and discharging their duties.
Northern Cape Office of the Premier Vote 1 | Annual Report for 2013/14 Financial Year
62
2.4 MEETINGS
2.4.1 Meeting Schedules AC meetings have been scheduled to sit 4 times a year. All meetings were attended as planned and all had their
quorum fully constituted and were therefore valid.
2.4.2 Attendance and Quorum Three of the four meetings were chaired by the AC Chairperson and one meeting chaired by a delegated
external AC member.
All meetings were fully constituted based on the quorum of at least 3 members, two being external and one being internal member. The meetings always had 3 external audit members and made a full quorum.
2.4.3 Agenda, Minutes and AC Documentation Pack All meetings held had agenda and minutes were recorded. The Agenda and minutes formed part of the AC
pack, which was distributed prior to the meeting dates.
2.4.4 Decisions No resistance of the AC decisions was encountered.
2.4.5 Reporting The AC has a reporting line to the Head of Treasury. The AC has not reported anything to the stakeholders of the relevant areas such as the Office of the Premier.
2.5 ROLES AND RESPONSIBILITIES OF THE COMMITTEE
During the AC meetings the AC reviewed per Treasury Regulations, section 27.1.8 the:• effectivenessofinternalcontrol;• effectivenessofinternalaudit;• theriskareasoftheentity’soperationstobecoveredinthescopeofinternalandexternalaudits;• theadequacy,reliabilityandaccuracyoffinancialinformationprovidedtomanagementandotherusersof
such information;• anyaccountingandauditingconcernsidentifiedasaresultofinternalandexternalaudits;• theentity’scompliancewithlegalandregulatoryprovisions;• theactivitiesoftheinternalauditfunction, includingitsannualworkprogramme,co-ordinationwiththe
external auditors, the reports of significant investigations and the responses of management to specific recommendations.
Northern Cape Office of the Premier Vote 1 | Annual Report for 2013/14 Financial Year
63
2.5.1 ANNUAL FINANCIAL STATEMENTS (AFS)
The AC had reviewed the Annual Financial Statements for the Department of OTP, prior to them being handed over to the Auditor-General and found the following:• TheAFSsubmittedtotheACwerefinalandwasapprovedbytheAccountingOfficer;• TheAFSsubmittedtotheACwereofgoodqualityandsupportedbysufficientworkingpapers.
2.5.2 QUARTERLY REPORTING
The AC were provided with quarterly financial reports for review and reviewed the Interim Financial Statements for the period ending 30 September 2013.
2.6 INTERNAL AUDIT PERFORMANCE
The internal audit unit was formally assessed by the Auditor-General in March to May 2014. For the second year the Auditor-General did not report any findings related to the internal audit unit. The internal audit unit executed 100% of the audit plan for the year.
2.7 EXTERNAL AUDIT
2.7.1 AC has reviewed and approved the External Audit Strategy, including the terms, nature and scope of the audit and the audit fees as required by the AC Charter.
2.7.2 AC has reviewed the overall audit roles to ensure the avoidance of the duplication of work by both internal and external auditors. The AC adopted a Combined Assurance Plan which is refined annually.
2.7.3 AC has determined and assisted in the significant difference of opinion between Management and Auditors regarding issues of accounting and financial reporting.
2.8 AUDITOR-GENERAL’S REPORT
2.8.1 The AC concurs and accepts the conclusions of the Auditor-General on the annual financial statements and is of the opinion that the audited annual financial statements be accepted and read together with the report of the Auditor-General.
_________________Dr Anushka RamlallChairperson of the AC - Office of the Premier31 July 2014
Northern Cape Office of the Premier Vote 1 | Annual Report for 2013/14 Financial Year
64
PART D: Human Resource
Management

Northern Cape Office of the Premier Vote 1 | Annual Report for 2013/14 Financial Year
65
PART D: Human Resource Management
D.1 Human Resources Oversight Statistics
3.1. Personnel related expenditure
The following tables summarises the final audited personnel related expenditure by programme and by salary bands. In particular, it provides an indication of the following:
• amountspentonpersonnel• amountspentonsalaries,overtime,homeowner’sallowancesandmedicalaid
Table 3.1.1 Personnel expenditure by programme for the period 1 April 2013 and 31 March 2014
Programme Expenditure (R’000) Personnel Expenditure
as a % of total expenditure
Average personnel; cost per employee
(R’000)
Total Personnel Training Professional and Special
Services
1: Administration 79,663 35,902 0 0 45.1% 341.9
2: Institutional development
7,1526 36,844 717 0 51.5% 418.7
3. Policy and governance 28,931 20,246 0 0 69.9% 397.0
TOTAL 180,120 92,992 717 0 51.6% 381.1
Table 3.1.2 Personnel costs by salary band for the period 1 April 2013 and 31 March 2014
Salary Band Personnel Expenditure (R’000)
Personnel Expenditure
as a % of total expenditure
No of employees
Average personnel cost per employee
(R’000)
Lower Skilled (Levels 1-2)
Skilled (Levels 3-5) 10,503 11,3 67 157
Highly skilled production (Levels 6-8) 15,166 16,3 59 257
Highly skilled supervision (Levels 9-12) 32,551 35 74 440
Senior management (Levels 13-16) 28,789 31 26 1,107
Contract (Levels 3-5) 1,036 1,1 7 148
Contract (Levels 6-8) 205 0,2 1 205
Contract (Levels 9-12) 2,814 3 6 469
Contract (Levels 13-16) 1,688 1,8 4 422
Abnormal Appointment 240 0,3 14 17
TOTAL 92,992 100 258 360

Northern Cape Office of the Premier Vote 1 | Annual Report for 2013/14 Financial Year
66
Table 3.1.3 Salaries, Overtime, Home Owners Allowance and Medical Aid by programme for the period 1 April 2013 and 31 March 2014
Programme
Salaries Overtime Home Owners Allowance
Medical Aid
Amount (R’000)
Salaries as a % of
personnel costs
Amount (R’000)
Overtime as a % of
personnel costs
Amount (R’000)
HOA as a % of
personnel costs
Amount (R’000)
Medical aid as a % of
personnel costs
1:Administration 27,106 75,5 246 0,7 1156 3,2 1,450 4
2:Institutional development
29,245 79,4 1 0 764 2,1 1,350 3,7
3: Policy and governance
16,180 79,9 39 0,2 392 1,9 764 3,8
TOTAL 72,531 78 286 0,3 2312 2,5 3,564 3,8
Table 3.1.4 Salaries, Overtime, Home Owners Allowance and Medical Aid by salary band for the period 1 April 2013 and 31 March 2014
Salary bandSalaries Overtime Home Owners
AllowanceMedical Aid
Amount (R’000
Salaries as a % of
personnel costs
Amount (R’000)
Overtime as a % of
personnel costs
Amount (R’000)
HOA as a % of
personnel costs
Amount (R’000)
Medical aid as a % of
personnel costs
Skilled (level 1-2) 0 0 0 0 0 0 0 0
Skilled (Levels 3-5) 7,110 67,7 27 0,3 616 5,9 1,130 10,8
Highly skilled production (Levels 6-8) 11,062 72,9 105 0,7 576 3,8 932 6,1
Highly skilled supervision (Levels 9-12) 25,330 77,8 152 0,5 645 2 1,038 3,2
Senior management (Levels 13-16) 23,558 81,8 0 0 475 1,6 464 1,6
Contract (Levels 3-5) 1,034 99,8 2 0,2 0 0 0 0
Contract (Levels 6-8) 205 100 0 0 0 0 0 0
Contract (Levels 9-12) 2,564 91,1 0 0 0 0 0 0
Contract (Levels 13-16) 1,428 84,6 0 0 0 0 0 0
Abnormal Appointment 240 100 0 0 0 0 0 0
TOTAL 72,531 78 286 0,3 2312 2,5 3,564 3,8
3.2. Employment and Vacancies
The tables in this section summarise the position with regard to employment and vacancies.

Northern Cape Office of the Premier Vote 1 | Annual Report for 2013/14 Financial Year
67
The following tables summarise the number of posts on the establishment, the number of employees, the vacancy rate, and whether there are any staff that are additional to the establishment.
This information is presented in terms of three key variables: • programme• salaryband• criticaloccupations(seedefinitioninnotesbelow).
Departments have identified critical occupations that need to be monitored. In terms of current regulations, it is possible to create a post on the establishment that can be occupied by more than one employee. Therefore, the vacancy rate reflects the percentage of posts that are not filled.
Table 3.2.1 Employment and vacancies by programme as on 31 March 2014
Programme Number of Posts on Approved
Establishment
Number of Posts
Filled
Vacancy Rate
Number of Employees
Additional to the Establishment
1: Administration 115 105 8,7 0
2: Institutional development 100 88 12 0
3: Policy and governance 57 51 10,5 0
TOTAL 272 244 10,3 0
Table 3.2.2 Employment and vacancies by salary band as on 31 March 2014
Salary Band Number of Posts on Approved
Establishment
Number of Posts
Filled
Vacancy Rate
Number of Employees
Additional to the Establishment
Skilled (Levels 3-5) 71 67 5,6 0
Highly skilled production (Levels 6-8) 66 59 10,6 0
Highly skilled supervision (Levels 9-12) 85 74 12,9 0
Senior management (Levels 13-16) 32 26 18,8 0
Contract (Levels 3-5) 7 7 0 0
Contract (Levels 6-8) 1 1 0 0
Contract (Levels 9-12) 6 6 0 0
Contract (Levels 13-16) 4 4 0 0
TOTAL 272 244 10,3 0
Table 3.2.3 Employment and vacancies by critical occupations as on 31 March 2014
Critical Occupations Number of Posts on Approved
Establishment
Number of Posts
Filled
Vacancy Rate
Number of Employees
Additional to the Establishment
Administrative related 74 65 12,2 0
Cleaners in offices workshops hospitals etc. 5 5 0 0
Client inform clerks(switchb recept inform clerks) 3 3 0 0
Computer system designers and analysts. 3 2 33,3 0

Northern Cape Office of the Premier Vote 1 | Annual Report for 2013/14 Financial Year
68
Critical Occupations Number of Posts on Approved
Establishment
Number of Posts
Filled
Vacancy Rate
Number of Employees
Additional to the Establishment
Finance and economics related 7 7 0 0
Financial clerks and credit controllers 16 15 6,3 0
Food services aids and waiters 6 6 0 0
General legal administration & rel. professionals 11 11 0 0
Head of department/chief executive officer 1 1 0 0
Household food and laundry services related 2 2 0 0
Human resources & organisat developm & relate prof 14 10 28,6 0
Human resources clerks 11 11 0 0
Human resources related 13 12 7,7 0
Language practitioners interpreters & other commun 3 2 33,3 0
Library mail and related clerks 10 9 10 0
Messengers porters and deliverers 5 5 0 0
Other administrat & related clerks and organisers 17 15 11,8 0
Other administrative policy and related officers 12 11 8,3 0
Other information technology personnel. 5 3 40 0
Other occupations 1 1 0 0
Psychologists and vocational counsellors 1 1 0 0
Risk management and security services 2 2 0 0
Secretaries & other keyboard operating clerks 19 19 0 0
Security guards 8 7 12,5 0
Security officers 2 2 0 0
Senior managers 21 17 19 0
TOTAL 272 244 10,3 0
3.3. Filling of SMS Posts
The tables in this section provide information on employment and vacancies as it relates to members of the Senior Management Service by salary level. It also provides information on advertising and filling of SMS posts, reasons for not complying with prescribed timeframes and disciplinary steps taken.
Table 3.3.1 SMS post information as on 31 March 2014
SMS Level Total number of
funded SMS posts
Total number of SMS posts filled
% of SMS posts filled
Total number of SMS posts
vacant
% of SMS posts vacant
Director General/ Head of Department
1 1 100% 0 0%
Salary Level 16 1 1 100% 0 0%
Salary Level 15 3 2 66.7% 1 33.3%
Salary Level 14 7 7 100% 0 0%
Salary Level 13 25 22 88% 3 12%
TOTAL 37 33 89% 4 11%
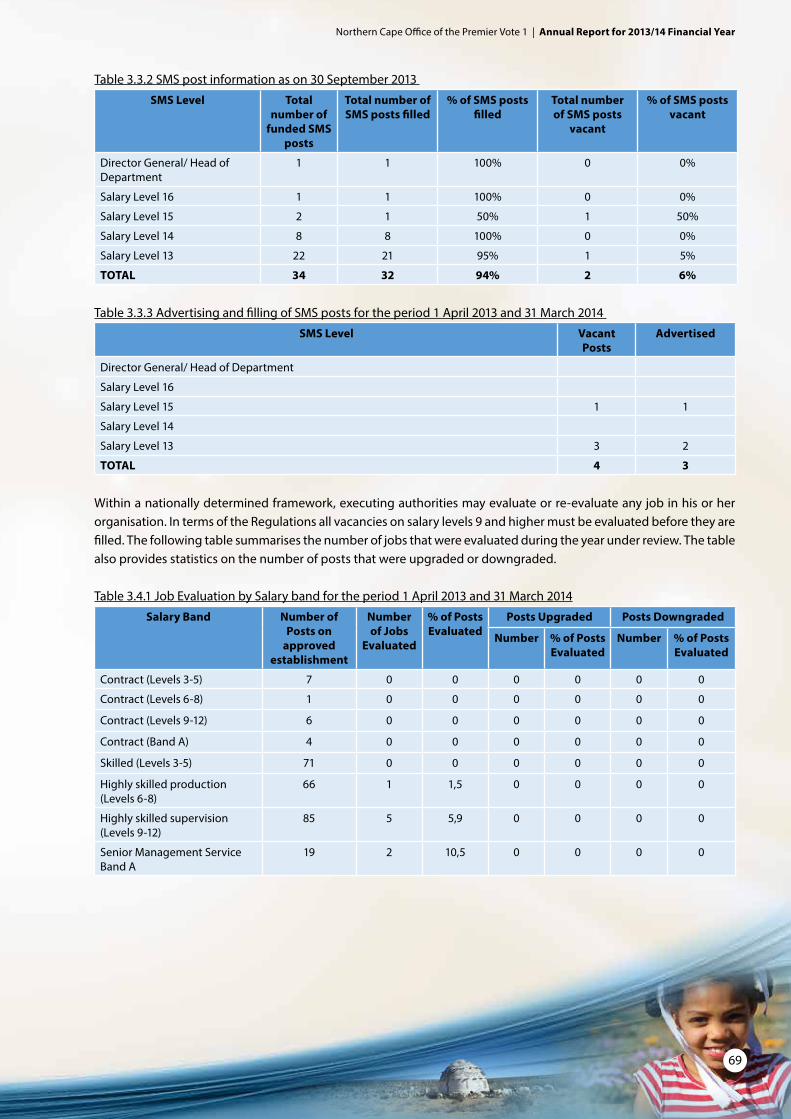
Northern Cape Office of the Premier Vote 1 | Annual Report for 2013/14 Financial Year
69
Table 3.3.2 SMS post information as on 30 September 2013
SMS Level Total number of
funded SMS posts
Total number of SMS posts filled
% of SMS posts filled
Total number of SMS posts
vacant
% of SMS posts vacant
Director General/ Head of Department
1 1 100% 0 0%
Salary Level 16 1 1 100% 0 0%
Salary Level 15 2 1 50% 1 50%
Salary Level 14 8 8 100% 0 0%
Salary Level 13 22 21 95% 1 5%
TOTAL 34 32 94% 2 6%
Table 3.3.3 Advertising and filling of SMS posts for the period 1 April 2013 and 31 March 2014
SMS Level Vacant Posts
Advertised
Director General/ Head of Department
Salary Level 16
Salary Level 15 1 1
Salary Level 14
Salary Level 13 3 2
TOTAL 4 3
Within a nationally determined framework, executing authorities may evaluate or re-evaluate any job in his or her organisation. In terms of the Regulations all vacancies on salary levels 9 and higher must be evaluated before they are filled. The following table summarises the number of jobs that were evaluated during the year under review. The table also provides statistics on the number of posts that were upgraded or downgraded.
Table 3.4.1 Job Evaluation by Salary band for the period 1 April 2013 and 31 March 2014
Salary Band Number of Posts on
approved establishment
Number of Jobs
Evaluated
% of Posts Evaluated
Posts Upgraded Posts Downgraded
Number % of Posts Evaluated
Number % of Posts Evaluated
Contract (Levels 3-5) 7 0 0 0 0 0 0
Contract (Levels 6-8) 1 0 0 0 0 0 0
Contract (Levels 9-12) 6 0 0 0 0 0 0
Contract (Band A) 4 0 0 0 0 0 0
Skilled (Levels 3-5) 71 0 0 0 0 0 0
Highly skilled production (Levels 6-8)
66 1 1,5 0 0 0 0
Highly skilled supervision (Levels 9-12)
85 5 5,9 0 0 0 0
Senior Management Service Band A
19 2 10,5 0 0 0 0

Northern Cape Office of the Premier Vote 1 | Annual Report for 2013/14 Financial Year
70
Salary Band Number of Posts on
approved establishment
Number of Jobs
Evaluated
% of Posts Evaluated
Posts Upgraded Posts Downgraded
Number % of Posts Evaluated
Number % of Posts Evaluated
Senior Management Service Band B
8 1 12,5 0 0 0 0
Senior Management Service Band C
3 0 0 0 0 0 0
Senior Management Service Band D
2 0 0 0 0 0 0
TOTAL 272 9 3,3 0 0 0 0
The following table provides a summary of the number of employees whose positions were upgraded due to their post being upgraded. The number of employees might differ from the number of posts upgraded since not all employees are automatically absorbed into the new posts and some of the posts upgraded could also be vacant.
Table 3.4.2 Profile of employees whose positions were upgraded due to their posts being upgraded for the period 1 April 2013 and 31 March 2014
Beneficiaries African Asian Coloured White Total
Female 6 0 3 0 9
Male 4 0 2 0 6
Total 10 0 5 0 15
Employees with a Disability 0 0 0 0 0
The following table summarises the number of cases where remuneration bands exceeded the grade determined by job evaluation. Reasons for the deviation are provided in each case.
Table 3.4.3 Employees with salary levels higher than those determined by job evaluation by occupation for the period 1 April 2013 and 31 March 2014
Total number of Employees whose salaries exceeded the grades determine by job evaluation None
The following table summarises the beneficiaries of the above in terms of race, gender, and disability. Table 3.4.4 Profile of employees who have salary levels higher than those determined by job evaluation for the period 1 April 2013 and 31 March 2014
Total number of Employees whose salaries exceeded the grades determine by job evaluation None
3.5. Employment Changes
This section provides information on changes in employment over the financial year. Turnover rates provide an indication of trends in the employment profile of the department. The following tables provide a summary of turnover rates by salary band and critical occupations (see definition in notes below).

Northern Cape Office of the Premier Vote 1 | Annual Report for 2013/14 Financial Year
71
Table 3.5.1 Annual turnover rates by salary band for the period 1 April 2013 and 31 March 2014
Salary band Number of employees at beginning of
period-1 April 2013
Appointments and transfers
into the department
Terminations and transfers
out of the department
Turnover rate
Skilled (Levels 3-5) 65 1 1 1,5
Highly skilled production (Levels 6-8) 59 1 2 3,4
Highly skilled supervision (Levels 9-12) 65 7 6 9,2
Senior Management Service Band A 20 0 4 20
Senior Management Service Band B 7 0 2 28,6
Senior Management Service Band C 2 0 1 50
Senior Management Service Band D 2 0 1 50
Contract (Levels 3-5) 4 4 6 150
Contract (Levels 6-8) 1 0 1 100
Contract (Levels 9-12) 5 1 2 40
Contract (Band A) 1 1 0 0
Contract (Band B) 1 0 0 0
Abnormal Appointments 9 0 0 0
TOTAL 241 15 26 11
Table 3.5.2 Annual turnover rates by critical occupation for the period 1 April 2013 and 31 March 2014
Critical occupation Number of employees at beginning of
period-April 2014
Appointments and transfers
into the department
Terminations and transfers
out of the department
Turnover rate
Administrative related 59 8 4 6,8
Civil engineering technicians 1 0 0 0
Cleaners in offices workshops hospitals etc. 5 0 0 0
Client information clerks(switchb recept inform clerks) 4 0 0 0
Computer system designers and analysts. 2 0 0 0
Finance and economics related 6 0 0 0
Financial clerks and credit controllers 14 1 0 0
Food services aids and waiters 6 1 0 0
General legal administration & rel. professionals 11 0 0 0
Head of department/chief executive officer 1 0 0 0
Household food and laundry services related 2 0 0 0
Human resources & organisat developm & relate prof 9 0 2 22,2
Human resources clerks 10 0 0 0
Human resources related 12 0 1 8,3
Language practitioners interpreters & other commun 1 0 0 0
Library mail and related clerks 10 0 3 30
Messengers porters and deliverers 5 0 1 20
Other administrat & related clerks and organisers 20 2 3 15
Other administrative policy and related officers 9 0 1 11,1

Northern Cape Office of the Premier Vote 1 | Annual Report for 2013/14 Financial Year
72
Critical occupation Number of employees at beginning of
period-April 2014
Appointments and transfers
into the department
Terminations and transfers
out of the department
Turnover rate
Other information technology personnel. 5 1 2 40
Other occupations 1 0 1 100
Psychologists and vocational counsellors 1 0 0 0
Risk management and security services 1 1 0 0
Secretaries & other keyboard operating clerks 17 1 3 17,6
Security guards 8 0 0 0
Security officers 1 0 0 0
Senior managers 20 0 5 25
TOTAL 241 15 26 11
The table below identifies the major reasons why staff left the department.
Table 3.5.3 Reasons why staff left the department for the period 1 April 2013 and 31 March 2014
Termination Type Number % of Total Resignations
Death 1 3,8
Resignation 15 53,8
Expiry of contract 8 30,8
Dismissal-misconduct 1 3,8
Retirement 1 3,8
TOTAL 26 100
Table 3.5.4 Promotions by critical occupation for the period 1 April 2013 and 31 March 2014
Occupation Employees 1 April
2013
Promotions to another salary level
Salary level promotions as a % of employees by occupation
Progressions to another notch within a salary
level
Notch progression as a % of employees by occupation
Administrative related 59 4 6,8 40 67,8
Civil engineering technicians 1 0 0 1 100
Cleaners in offices workshops hospitals etc.
5 0 0 5 100
Client inform clerks(switchb recept inform clerks)
4 0 0 1 25
Computer system designers and analysts.
2 0 0 1 50
Finance and economics related 6 1 16,7 4 66,7
Financial clerks and credit controllers
14 2 14,3 9 64,3
Food services aids and waiters 6 0 0 3 50
General legal administration & rel. professionals
11 0 0 9 81,8
Head of department/chief executive officer
1 0 0 0 0
Household food and laundry services related
2 0 0 1 50
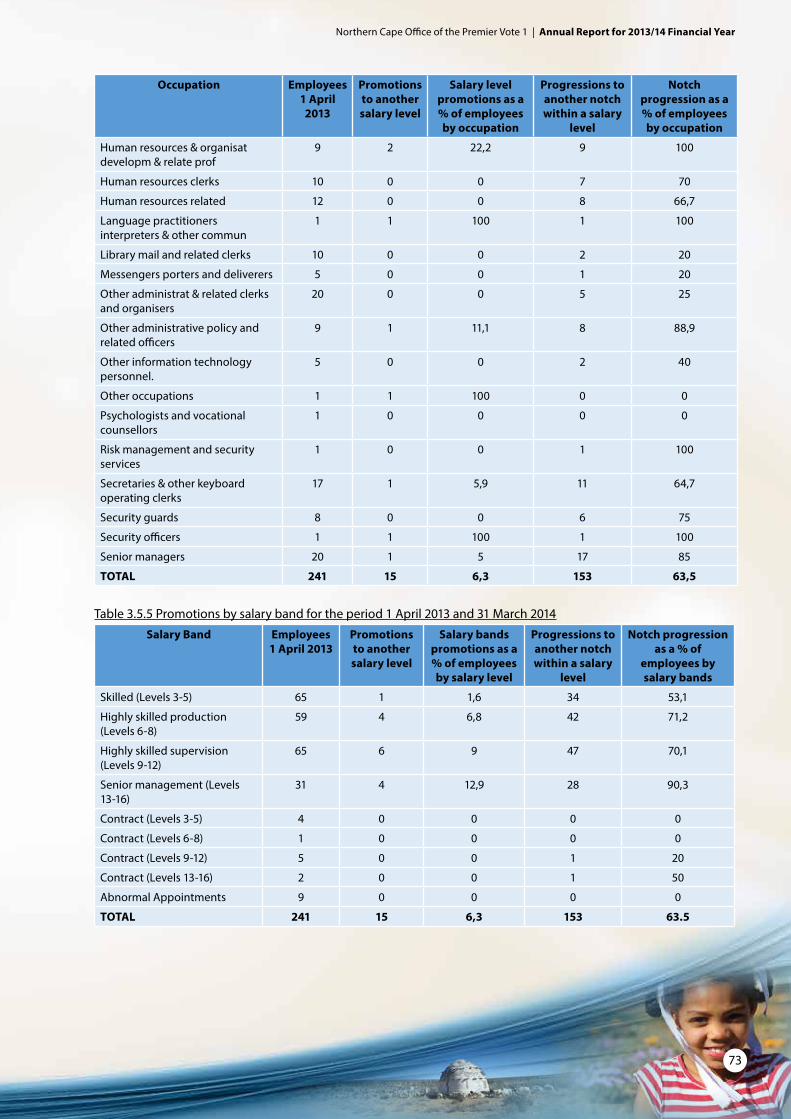
Northern Cape Office of the Premier Vote 1 | Annual Report for 2013/14 Financial Year
73
Occupation Employees 1 April
2013
Promotions to another salary level
Salary level promotions as a % of employees by occupation
Progressions to another notch within a salary
level
Notch progression as a % of employees by occupation
Human resources & organisat developm & relate prof
9 2 22,2 9 100
Human resources clerks 10 0 0 7 70
Human resources related 12 0 0 8 66,7
Language practitioners interpreters & other commun
1 1 100 1 100
Library mail and related clerks 10 0 0 2 20
Messengers porters and deliverers 5 0 0 1 20
Other administrat & related clerks and organisers
20 0 0 5 25
Other administrative policy and related officers
9 1 11,1 8 88,9
Other information technology personnel.
5 0 0 2 40
Other occupations 1 1 100 0 0
Psychologists and vocational counsellors
1 0 0 0 0
Risk management and security services
1 0 0 1 100
Secretaries & other keyboard operating clerks
17 1 5,9 11 64,7
Security guards 8 0 0 6 75
Security officers 1 1 100 1 100
Senior managers 20 1 5 17 85
TOTAL 241 15 6,3 153 63,5
Table 3.5.5 Promotions by salary band for the period 1 April 2013 and 31 March 2014
Salary Band Employees 1 April 2013
Promotions to another salary level
Salary bands promotions as a % of employees by salary level
Progressions to another notch within a salary
level
Notch progression as a % of
employees by salary bands
Skilled (Levels 3-5) 65 1 1,6 34 53,1
Highly skilled production (Levels 6-8)
59 4 6,8 42 71,2
Highly skilled supervision (Levels 9-12)
65 6 9 47 70,1
Senior management (Levels 13-16)
31 4 12,9 28 90,3
Contract (Levels 3-5) 4 0 0 0 0
Contract (Levels 6-8) 1 0 0 0 0
Contract (Levels 9-12) 5 0 0 1 20
Contract (Levels 13-16) 2 0 0 1 50
Abnormal Appointments 9 0 0 0 0
TOTAL 241 15 6,3 153 63.5

Northern Cape Office of the Premier Vote 1 | Annual Report for 2013/14 Financial Year
74
3.6. Employment Equity
Table 3.6.1 Total number of employees (including employees with disabilities) in each of the following occupational categories as on 31 March 2014
Occupational category Male Female Total
African Coloured Indian White African Coloured Indian White
Legislators, senior officials and managers
9 3 0 1 3 1 1 1 19
Professionals 18 9 0 1 10 7 0 3 48
Technicians and associate professionals
26 8 1 1 27 9 0 4 76
Clerks 15 6 0 1 28 17 0 5 72
Service and sales workers 8 1 0 0 3 1 0 0 13
Elementary occupations 9 1 0 0 6 0 0 0 16
TOTAL 85 28 1 4 77 35 1 13 244
Legislators, senior officials and managers
9 3 0 1 3 1 1 1 19
Professionals 18 9 0 1 10 7 0 3 48
Technicians and associate professionals
26 8 1 1 27 9 0 4 76
Employees with disabilities 1 2 0 0 0 0 0 0 3
Table 3.6.2 Total number of employees (including employees with disabilities) in each of the following occupational bands as on 31 March 2014
Occupational band Male Female Total
African Coloured Indian White African Coloured Indian White
Top Management 3 0 0 0 0 1 0 0 4
Senior Management 8 2 0 2 6 1 1 2 22
Professionally qualified and experienced specialists and mid-management
28 11 0 1 20 10 0 4 74
Skilled technical and academically qualified workers, junior management, supervisors, foremen
19 5 0 0 21 10 0 4 59
Semi-skilled and discretionary decision making
22 6 0 1 25 10 0 3 67
Contract (Senior Management)
0 2 1 0 0 1 0 0 4
Contract (Professionally qualified)
3 1 0 0 0 2 0 0 6
Contract (Skilled technical) 1 0 0 0 0 0 0 0 1
Contract (Semi-skilled) 1 1 0 0 5 0 0 0 7
TOTAL 85 28 1 4 77 35 1 13 244
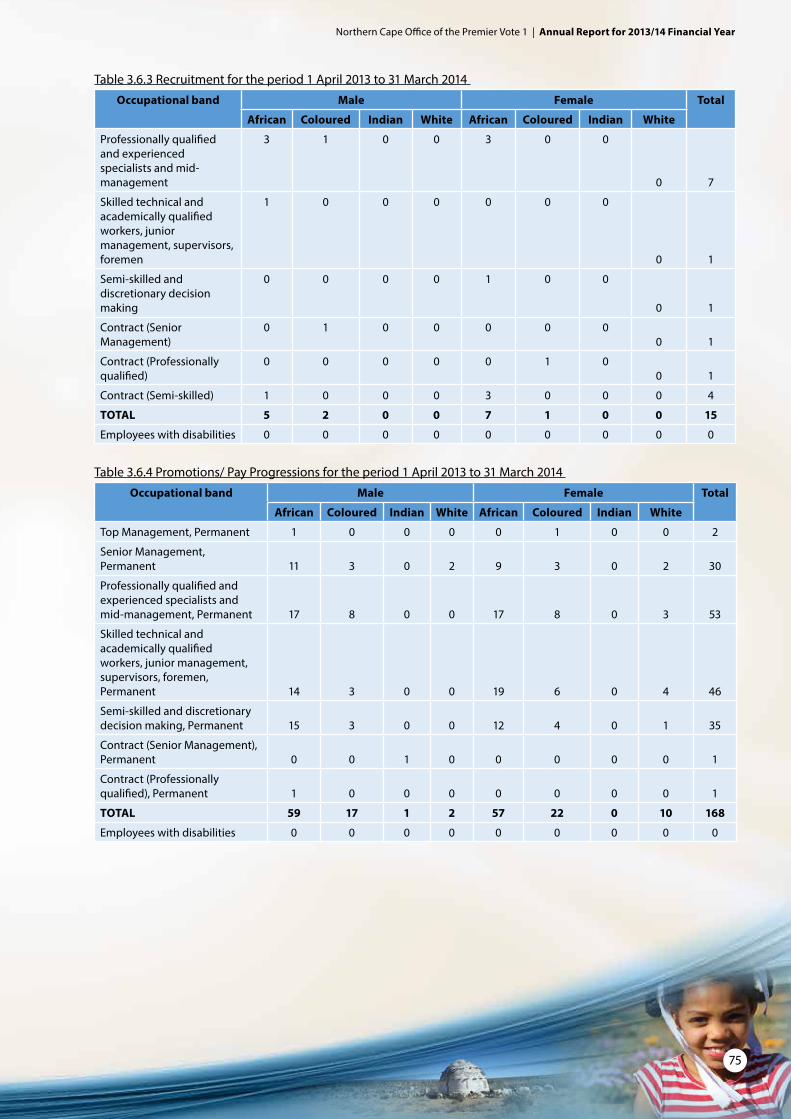
Northern Cape Office of the Premier Vote 1 | Annual Report for 2013/14 Financial Year
75
Table 3.6.3 Recruitment for the period 1 April 2013 to 31 March 2014
Occupational band Male Female Total
African Coloured Indian White African Coloured Indian White
Professionally qualified and experienced specialists and mid-management
3 1 0 0 3 0 0
0 7
Skilled technical and academically qualified workers, junior management, supervisors, foremen
1 0 0 0 0 0 0
0 1
Semi-skilled and discretionary decision making
0 0 0 0 1 0 0
0 1
Contract (Senior Management)
0 1 0 0 0 0 00 1
Contract (Professionally qualified)
0 0 0 0 0 1 00 1
Contract (Semi-skilled) 1 0 0 0 3 0 0 0 4
TOTAL 5 2 0 0 7 1 0 0 15
Employees with disabilities 0 0 0 0 0 0 0 0 0
Table 3.6.4 Promotions/ Pay Progressions for the period 1 April 2013 to 31 March 2014
Occupational band Male Female Total
African Coloured Indian White African Coloured Indian White
Top Management, Permanent 1 0 0 0 0 1 0 0 2
Senior Management, Permanent 11 3 0 2 9 3 0 2 30
Professionally qualified and experienced specialists and mid-management, Permanent 17 8 0 0 17 8 0 3 53
Skilled technical and academically qualified workers, junior management, supervisors, foremen, Permanent 14 3 0 0 19 6 0 4 46
Semi-skilled and discretionary decision making, Permanent 15 3 0 0 12 4 0 1 35
Contract (Senior Management), Permanent 0 0 1 0 0 0 0 0 1
Contract (Professionally qualified), Permanent 1 0 0 0 0 0 0 0 1
TOTAL 59 17 1 2 57 22 0 10 168
Employees with disabilities 0 0 0 0 0 0 0 0 0

Northern Cape Office of the Premier Vote 1 | Annual Report for 2013/14 Financial Year
76
Table 3.6.5 Terminations for the period 1 April 2013 to 31 March 2014
Occupational band Male Female Total
African Coloured Indian White African Coloured Indian White
Top Management, Permanent 0 0 0 0 1 1 0 0 2
Senior Management, Permanent 2 0 1 0 1 1 0 0 5
Professionally qualified and experienced specialists and mid-management, Permanent
3 0 0 0 0 3 0 0 6
Skilled technical and academically qualified workers, junior management, supervisors, foremen, Permanent
1 0 0 0 0 1 0 1 3
Semi-skilled and discretionary decision making, Permanent
1 0 0 0 0 0 0 0 1
Contract (Senior Management), Permanent
0 0 0 0 0 1 0 0 1
Contract (Professionally qualified), Permanent
1 0 0 0 2 0 0 0 3
Contract (Semi-skilled), Permanent
1 0 0 0 3 1 0 0 5
TOTAL 9 0 1 0 7 8 0 1 26
Employees with Disabilities 0 0 0 0 0 0 0 0 0
Table 3.6.6 Disciplinary action for the period 1 April 2013 to 31 March 2014
Disciplinary action Male Female Total
African Coloured Indian White African Coloured Indian White
TOTAL 0 0 0 0 0 0 0 0 0
Table 3.6.7 Skills development for the period 1 April 2013 to 31 March 2014
Occupational category Male Female Total
African Coloured Indian White African Coloured Indian White
Legislators, senior officials and managers
1 0 0 3 1 2 2 1 11
Professionals 20 0 0 0 7 2 1 4 34
Technicians and associate professionals
5 7 0 4 2 0 1 19
Clerks 4 0 0 0 4 3 0 0 11
Service and sales workers 0 0 0 0 0 0 0 0 0
Skilled agriculture and fishery workers
0 0 0 0 0 0 0 0 0
Craft and related trades workers
0 0 0 0 0 0 0 0 0
Plant and machine operators and assemblers
0 0 0 0 0 0 0 0 0
Elementary occupations 1 1 0 0 15 1 0 0 18
Total 32 8 0 3 31 10 3 6 93
Employees with disabilities 1 0 0 0 0 0 0 0 1

Northern Cape Office of the Premier Vote 1 | Annual Report for 2013/14 Financial Year
77
3.7. Signing of Performance Agreements by SMS Members
All members of the SMS must conclude and sign performance agreements within specific timeframes. Information regarding the signing of performance agreements by SMS members, the reasons for not complying within the prescribed timeframes and disciplinary steps taken is presented here.
Table 3.7.1 Signing of Performance Agreements by SMS members as on 31 May 2013
SMS Level Total number of
funded SMS posts
Total number of SMS
members
Total number of signed
performance agreements
Signed performance agreements as % of
total number of SMS members
Director-General/ Head of Department 1 1 1 100%
Salary Level 16 1 1 1 100%
Salary Level 15 2 2 2 100%
Salary Level 14 8 8 8 100%
Salary Level 13 21 21 21 100%
Total 33 33 33 100%
Notes In the event of a National or Provincial election occurring within the first three months of a financial year all members of the SMS must conclude and sign their performance agreements for that financial year within three months following the month in which the elections took place. For example if elections took place in April, the reporting date in the heading of the table above should change to 31 July 2014.
Table 3.7.2 Reasons for not having concluded Performance agreements for all SMS members as on 31 March 2014
Reasons
All SMS members concluded Performance agreements
Table 3.7.3 Disciplinary steps taken against SMS members for not having concluded Performance agreements as on 31 March 2014
Reasons
Not Applicable
3.8. Performance Rewards
To encourage good performance, the department has granted the following performance rewards during the year under review. The information is presented in terms of race, gender, disability, salary bands and critical occupations (see definition in notes below).
Table 3.8.1 Performance Rewards by race, gender and disability for the period 1 April 2013 to 31 March 2014
Race and GenderBeneficiary Profile Cost
Number of beneficiaries
Number of employees
% of total within group
Cost (R’000)
Average cost per
employee
African 17 162 10,5 277 16,294
Male 7 85 8,2 122 17,429
Female 10 77 13 155 15,500

Northern Cape Office of the Premier Vote 1 | Annual Report for 2013/14 Financial Year
78
Race and GenderBeneficiary Profile Cost
Number of beneficiaries
Number of employees
% of total within group
Cost (R’000)
Average cost per
employee
Asian 0 2 0 0 0
Male 0 1 0 0 0
Female 0 1 0 0 0
Coloured 7 63 11,1 168 24,000
Male 3 27 11,1 88 29,333
Female 4 36 11,1 80 20,000
White 2 17 11,8 27 26,922
Male 0 4 0 0 0
Female 2 13 15,4 27 13,500
Total 24 244 9,8 472 19,667
Table 3.8.2 Performance Rewards by salary band for personnel below Senior Management Service for the period 1 April 2013 to 31 March 2014
Salary bandBeneficiary Profile Cost Total cost as a
% of the total personnel
expenditure
Number of beneficiaries
Number of employees
% of total within salary bands
Total Cost (R’000)
Average cost per
employee
Skilled (Levels 3-5) 4 67 6 11 2,750 0.01%
Highly skilled production (Levels 6-8) 8 60 13,3 68 8,500 0.07%
Highly skilled supervision (Levels 9-12) 8 73 11 182 22,750 0.02%
Contract (Levels 3-5) 0 6 0 0 0 0%
Contract (Levels 6-8) 0 1 0 0 0 0%
Contract (Levels 9-12) 0 6 0 0 0 0%
Abnormal Appointment 0 7 0 0 0 0%
TOTAL 20 220 9,1 261 13,050 0.28%
Table 3.8.3 Performance Rewards by critical occupation for the period 1 April 2013 to 31 March 2014
Critical occupationBeneficiary Profile Cost
Number of beneficiaries
Number of employees
% of total within
occupation
Total Cost
(R’000)
Average cost per
employee
Administrative related 3 49 4,6 152 50,667
Cleaners in offices workshops hospitals etc. 0 5 0 0 0
Client inform clerks(switchb recept inform clerks) 0 3 0 0 0
Computer system designers and analysts. 1 3 50 12 12,000
Finance and economics related 1 11 14,3 23 23,000
Financial clerks and credit controllers 0 11 0 19 0
Food services aids and waiters 0 8 0 0 0
General legal administration & rel. professionals 1 7 9,1 67 67,000
Head of department/chief executive officer 0 1 0 0 0
Household food and laundry services related 0 0 0 0 0
Human resources & organisat developm & relate prof 0 10 0 16 0
Human resources clerks 0 5 0 0 0

Northern Cape Office of the Premier Vote 1 | Annual Report for 2013/14 Financial Year
79
Critical occupationBeneficiary Profile Cost
Number of beneficiaries
Number of employees
% of total within
occupation
Total Cost
(R’000)
Average cost per
employee
Human resources related 2 19 16,7 0 0
Language practitioners interpreters & other commun 1 2 50 12 12,000
Library mail and related clerks 1 16 11,1 8 8,000
Messengers porters and deliverers 0 6 0 0 0
Other administrat & related clerks and organisers 1 12 6,7 6 6,000
Other administrative policy and related officers 0 11 0 0 0
Other information technology personnel. 0 4 0 0 0
Other occupations 0 1 0 0 0
Psychologists and vocational counsellors 0 1 0 0 0
Risk management and security services 0 2 0 0 0
Secretaries & other keyboard operating clerks 6 19 31,6 47 7,833
Security guards 1 7 14,3 5 5,000
Security officers 2 2 100 12 6,000
Senior managers 4 29 23,5 92 23,000
TOTAL 24 244 9,8 471 19,625
Table 3.8.4 Performance related rewards (cash bonus), by salary band for Senior Management Service for the period 1 April 2013 to 31 March 2014
Salary bandBeneficiary Profile Cost Total cost as a
% of the total personnel
expenditure
Number of beneficiaries
Number of employees
% of total within salary
bands
Total Cost (R’000)
Average cost per
employee
Band A 3 20 20 93 31,000 0,1
Band B 1 6 0 119 119,000 0,2
Band C 0 2 0 0 0 0
Band D 0 2 0 0 0 0
TOTAL 4 30 13,3 212 53,000 0,3
3.9. Foreign Workers
The tables below summarise the employment of foreign nationals in the department in terms of salary band and major occupation.
Table 3.9.1 Foreign workers by salary band for the period 1 April 2013 and 31 March 2014
Salary band 01 April 2013 31 March 2014 Change
Number % of total Number % of total Number % Change
Lower skilled 1 100 1 100 0 0
Highly skilled production (Lev. 6-8) - - - - - -
Highly skilled supervision (Lev. 9-12) - - - - - -
Contract (level 9-12) - - - - - -
Contract (level 13-16) - - - - - -
Total 1 100 1 100 0 0

Northern Cape Office of the Premier Vote 1 | Annual Report for 2013/14 Financial Year
80
Table 3.9.2 Foreign workers by major occupation for the period 1 April 2013 and 31 March 2014
Major occupation 01 April 2013 31 March 2014 Change
Number % of total Number % of total Number % Change
Administrative office workers 1 100 1 100 0 0
TOTAL 1 100 1 100 0 0
3.10. Leave utilisation
The Public Service Commission identified the need for careful monitoring of sick leave within the public service. The following tables provide an indication of the use of sick leave and disability leave. In both cases, the estimated cost of the leave is also provided. Table 3.10.1 Sick leave for the period 1 January 2013 to 31 December 2014
Salary band Total days % Days with Medical
certification
Number of Employees using sick
leave
% of total employees using sick
leave
Average days per
employee
Estimated Cost
(R’000)
Skilled (Levels 3-5) 541 88,9 50 25,8 11 265
Highly skilled production (Levels 6-8)
568 66,7 56 28,9 10 345
Highly skilled supervision (Levels 9-12)
489 83,8 54 27,8 9 766
Senior management (Levels 13-16)
162 92,6 21 10,8 8 719
Contract (Levels 3-5) 15 33,3 7 3,6 2 1
Contract (Levels 9-12) 19 52,6 4 2,1 5 81
Contract (Levels 13-16) 3 33,3 2 1 2 35
TOTAL 1,797 79,9 194 100 9 2,212
Table 3.10.2 Disability leave (temporary and permanent) for the period 1 January 2013 to 31 December 2014
Salary band Total days
% Days with Medical
certification
Number of Employees
using disability
leave
% of total employees
using disability
leave
Average days per
employee
Estimated Cost (R’000)
Lower skilled (Levels 1-2)
Skilled (Levels 3-5) 214 100 2 40 107 117
Highly skilled production (Levels 6-8)
154 100 2 40 77 111
Highly skilled supervision (Levels 9-12)
13 100 1 20 13 13
Senior management (Levels 13-16) - - - - - -
Total 381 100 5 100 76 241

Northern Cape Office of the Premier Vote 1 | Annual Report for 2013/14 Financial Year
81
The table below summarises the utilisation of annual leave. The wage agreement concluded with trade unions in the PSCBC in 2000 requires management of annual leave to prevent high levels of accrued leave being paid at the time of termination of service.
Table 3.10.3 Annual Leave for the period 1 January 2013 to 31 December 2014
Salary band Total days taken
Number of Employees using
annual leave
Average per employee
Skilled (Levels 3-5) 1,396 61 23
Highly skilled production (Levels 6-8) 1,450 63 23
Highly skilled supervision (Levels 9-12) 1,675 69 24
Senior management (Levels 13-16) 688 29 24
Contract (Levels 3-5) 108 7 15
Contract (Levels 6-8) 3 1 3
Contract (Levels 9-12) 96 4 24
Contract (Levels 13-16) 18 2 9
TOTAL 5,434 236 23
Table 3.10.4 Capped leave for the period 1 January 2013 to 31 December 2014
Salary band Total days of capped
leave taken
Number of Employees
using capped leave
Average number of
days taken per employee
Average capped leave per
employee as on 31 March 2014
Skilled Levels 3-5) - - - -
Highly skilled production (Levels 6-8) - - - -
Highly skilled supervision(Levels 9-12) 0 2 0 29
Senior management (Levels 13-16) 5 1 5 32
Total 5 3 2 30
The following table summarise payments made to employees as a result of leave that was not taken.
Table 3.10.5 Leave pay-outs for the period 1 April 2013 and 31 March 2014
Reason Total amount (R’000)
Number of employees
Average per employee
(R’000)
Leave pay-out for 2013/14 due to non-utilisation of leave for the previous cycle
- - -
Capped leave pay-outs on termination of service for 2013/14 - - -
Current leave pay-out on termination of service for 2013/14 290 7 41
TOTAL 290 7 41

Northern Cape Office of the Premier Vote 1 | Annual Report for 2013/14 Financial Year
82
3.11. HIV/AIDS & Health Promotion Programmes
Table 3.11.1 Steps taken to reduce the risk of occupational exposure
Units/categories of employees identified to be at high risk of contracting HIV & related diseases (if any)
Key steps taken to reduce the risk
All employees at the OTP are equally at risk. There is no discernable category with a higher inherent risk.
The Employee Health and Wellness unit performs health risk assessments
Table 3.11.2 Details of Health Promotion and HIV/AIDS Programmes
Question Yes No Details, if yes
1. Has the department designated a member of the SMS to implement the provisions contained in Part VI E of Chapter 1 of the Public Service Regulations, 2001? If so, provide her/his name and position.
X Senior Manager Employee Health and Wellness unit
2. Does the department have a dedicated unit or has it designated specific staff members to promote the health and well-being of your employees? If so, indicate the number of employees who are involved in this task and the annual budget that is available for this purpose.
X Employee Health and Wellness unit
3. Has the department introduced an Employee Assistance or Health Promotion Programme for your employees? If so, indicate the key elements/services of this Programme.
X HIV Counselling and Testing ProgrammeImplemented a IEC (Information, Education and Communication) Programme
4. Has the department established (a) committee(s) as contemplated in Part VI E.5 (e) of Chapter 1 of the Public Service Regulations, 2001? If so, please provide the names of the members of the committee and the stakeholder(s) that they represent.
X The committee has 23 members and is headed by Liezl Anthony (Manager EHWP)
5. Has the department reviewed its employment policies and practices to ensure that these do not unfairly discriminate against employees on the basis of their HIV status? If so, list the employment policies/practices so reviewed.
X
6. Has the department introduced measures to protect HIV-positive employees or those perceived to be HIV-positive from discrimination? If so, list the key elements of these measures.
X Zero tolerance for discrimination based on HIV/AIDS status
7. Does the department encourage its employees to undergo Voluntary Counselling and Testing? If so, list the results that you have you achieved.
X Established a workplace testing centre.
8. Has the department developed measures/indicators to monitor & evaluate the impact of its health promotion programme? If so, list these measures/indicators.
X
3.12. Labour Relations
Table 3.12.1 Collective agreements for the period 1 April 2013 and 31 March 2014
Number of Collective Agreements None
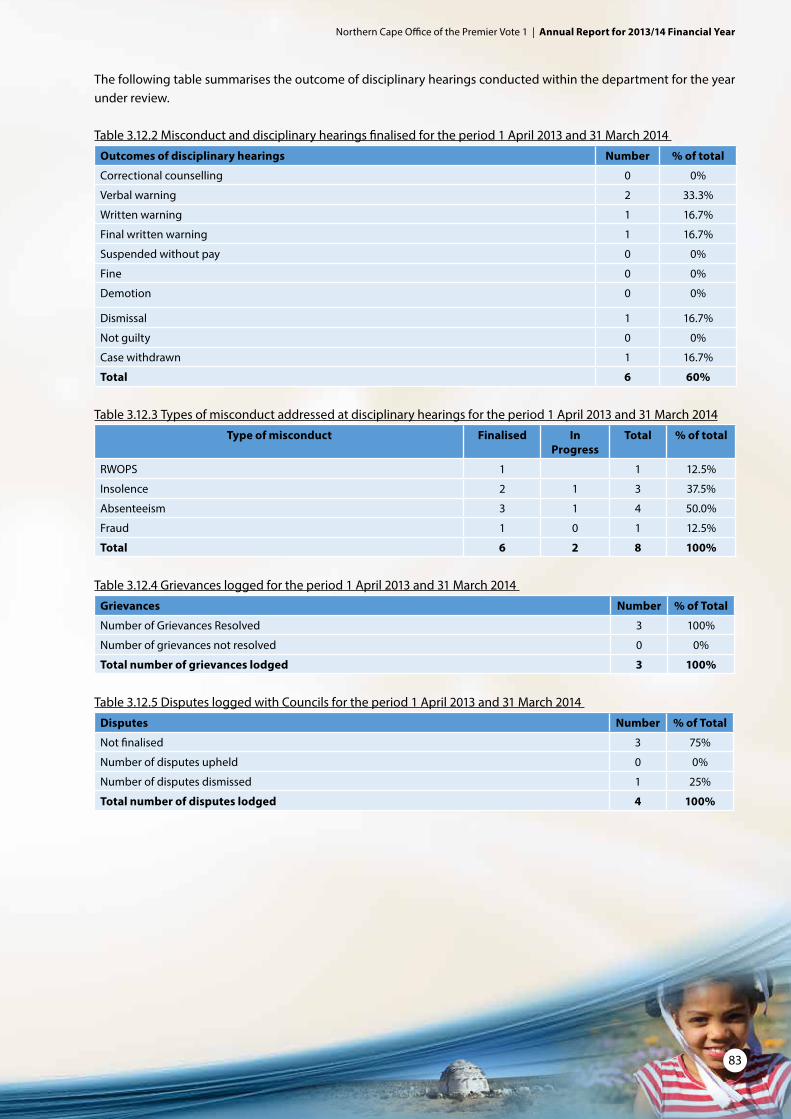
Northern Cape Office of the Premier Vote 1 | Annual Report for 2013/14 Financial Year
83
The following table summarises the outcome of disciplinary hearings conducted within the department for the year under review.
Table 3.12.2 Misconduct and disciplinary hearings finalised for the period 1 April 2013 and 31 March 2014
Outcomes of disciplinary hearings Number % of total
Correctional counselling 0 0%
Verbal warning 2 33.3%
Written warning 1 16.7%
Final written warning 1 16.7%
Suspended without pay 0 0%
Fine 0 0%
Demotion 0 0%
Dismissal 1 16.7%
Not guilty 0 0%
Case withdrawn 1 16.7%
Total 6 60%
Table 3.12.3 Types of misconduct addressed at disciplinary hearings for the period 1 April 2013 and 31 March 2014
Type of misconduct Finalised In Progress
Total % of total
RWOPS 1 1 12.5%
Insolence 2 1 3 37.5%
Absenteeism 3 1 4 50.0%
Fraud 1 0 1 12.5%
Total 6 2 8 100%
Table 3.12.4 Grievances logged for the period 1 April 2013 and 31 March 2014
Grievances Number % of Total
Number of Grievances Resolved 3 100%
Number of grievances not resolved 0 0%
Total number of grievances lodged 3 100%
Table 3.12.5 Disputes logged with Councils for the period 1 April 2013 and 31 March 2014
Disputes Number % of Total
Not finalised 3 75%
Number of disputes upheld 0 0%
Number of disputes dismissed 1 25%
Total number of disputes lodged 4 100%

Northern Cape Office of the Premier Vote 1 | Annual Report for 2013/14 Financial Year
84
Table 3.12.6 Strike actions for the period 1 April 2013 and 31 March 2014
Total number of persons working days lost 0
Total costs working days lost 0
Amount recovered as a result of no work no pay (R’000) 0
Table 3.12.7 Precautionary suspensions for the period 1 April 2013 and 31 March 2014
Number of people suspended 0
Number of people whose suspension exceeded 30 days 0
Average number of days suspended 0
Cost of suspension(R’000) 0
3.13. Skills development
This section highlights the efforts of the department with regard to skills development.
Table 3.13.1 Training needs identified for the period 1 April 2013 and 31 March 2014
Occupational category Gender Number of employees as at 1 April
2013
Training needs identified at start of the reporting period
Learnerships Skills Programmes & other short
courses
Other forms of training
Total
Legislators, senior officials and managers
Female 6 0 16 2 18
Male 13 0 16 3 19
Professionals Female 20 0 7 3 10
Male 28 0 14 2 16
Technicians and associate professionals
Female 40 0 10 14 24
Male 36 0 3 5 8
Clerks Female 50 0 31 11 42
Male 22 0 14 3 17
Service and sales workers Female 4 0 0 0 0
Male 9 0 0 0 0
Skilled agriculture and fishery workers
Female 6 0 0 0 0
Male 10 0 0 0 0
Craft and related trades workers
Female 6 0 0 0 0
Male 13 0 0 0 0
Plant and machine operators and assemblers
Female 20 0 0 0 0
Male 28 0 0 0 0
Elementary occupations Female 40 9 0 0 0
Male 36 0 0 0 0
Sub Total Female 126 9 64 30 94
Male 118 0 47 13 60
Total 244 9 111 86 154

Northern Cape Office of the Premier Vote 1 | Annual Report for 2013/14 Financial Year
85
Table 3.13.2 Training provided for the period 1 April 2013 and 31 March 2014
Occupational category Gender Number of employees as at 1 April 2013
Training provided within the reporting period
Learnerships Skills Programmes & other short
courses
Other forms of training
Total
Legislators, senior officials and managers
Female 6 0 6 3 9
Male 13 0 5 3 8
Professionals Female 20 0 14 5 19
Male 28 0 20 7 27
Technicians and associate professionals
Female 40 0 7 9 16
Male 36 0 11 5 16
Clerks Female 50 0 7 10 17
Male 22 0 3 3 6
Service and sales workers Female 4 0 17 0 17
Male 9 0 3 0 6
Skilled agriculture and fishery workers
Female 6 0 0 0 0
Male 10 0 0 0 0
Craft and related trades workers Female 6 0 0 0 0
Male 13 0 0 0 0
Plant and machine operators and assemblers
Female 20 0 0 0 0
Male 28 0 0 0 0
Elementary occupations Female 40 0 0 0 27
Male 36 0 0 0 18
Sub Total Female 126 9 0 27 105
Male 118 0 0 18 81
Total 244 9 93 90 186
3.14. Injury on duty
The following tables provide basic information on injury on duty. Table 3.14.1 Injury on duty for the period 1 April 2013 and 31 March 2014
Nature of injury on duty Number % of total
Required basic medical attention only 0
Temporary Total Disablement 0
Permanent Disablement 0
Fatal 0
Total 0
3.16. Severance Packages
Table 3.16.1 Granting of employee initiated severance packages for the period 1 April 2013 and 31 March 2014
No Severance Packages granted

Northern Cape Office of the Premier Vote 1 | Annual Report for 2013/14 Financial Year
86
PART E: Financial Information

Northern Cape Office of the Premier Vote 1 | Annual Report for 2013/14 Financial Year
87
REPORT OF THE AUDITOR-GENERAL TO THE NORTHERN CAPE PROVINCIAL LEGISLATURE ON VOTE NO. 1: OFFICE OF THE PREMIERREPORT ON THE FINANCIAL STATEMENTS
Introduction
1. I have audited the financial statements of the Office of the Premier set out on pages 92 to 138, which comprise the appropriation statement, the statement of financial position as at 31 March 2014, the statement of financial performance, statement of changes in net assets and the cash flow statement for the year then ended, and the notes, comprising a summary of significant accounting policies and other explanatory information.
Accounting officer’s responsibility for the financial statements
2. The accounting officer is responsible for the preparation and fair presentation of these financial statements in accordance with the Modified Cash Standard prescribed by the National Treasury and the requirements of the Public Finance Management Act of South Africa, 1999 (Act No. 1 of 1999) (PFMA), and for such internal control as the accounting officer determines is necessary to enable the preparation of financial statements that are free from material misstatement, whether due to fraud or error.
Auditor-General’s responsibility
3. My responsibility is to express an opinion on these financial statements based on my audit. I conducted my audit in accordance with the Public Audit Act of South Africa, 2004 (Act No. 25 of 2004) (PAA), the General Notice issued in terms thereof and International Standards on Auditing. Those standards require that I comply with ethical requirements and plan and perform the audit to obtain reasonable assurance about whether the financial statements are free from material misstatement.
4. An audit involves performing procedures to obtain audit evidence about the amounts and disclosures in the financial statements. The procedures selected depend on the auditor’s judgement, including the assessment of the risks of material misstatement of the financial statements, whether due to fraud or error. In making those risk assessments, the auditor considers internal control relevant to the entity’s preparation and fair presentation of the financial statements in order to design audit procedures that are appropriate in the circumstances, but not for the purpose of expressing an opinion on the effectiveness of the entity’s internal control. An audit also includes evaluating the appropriateness of accounting policies used and the reasonableness of accounting estimates made by management, as well as evaluating the overall presentation of the financial statements.
5. I believe that the audit evidence I have obtained is sufficient and appropriate to provide a basis for my audit opinion.
Opinion
6. In my opinion, the financial statements present fairly, in all material respects, the financial position of the Office of the Premier as at 31 March 2014, and its financial performance and cash flows for the year then ended in accordance with the Modified Cash Standard prescribed by the National Treasury and the requirements of the PFMA.

Northern Cape Office of the Premier Vote 1 | Annual Report for 2013/14 Financial Year
88
Additional matter
7. I draw attention to the matter below. My opinion is not modified in respect of this matter.
Unaudited supplementary schedules
8. The supplementary information set out on pages 139 to 150 does not form part of the financial statements and is presented as additional information. I have not audited these schedules and, accordingly, I do not express an opinion thereon.
REPORT ON OTHER LEGAL AND REGULATORY REQUIREMENTS
9. In accordance with the PAA and the general notice issued in terms thereof, I report the following findings on the reported performance information against predetermined objectives for selected programmes presented in the annual performance report, non-compliance with legislation as well as internal control. The objective of my tests was to identify reportable findings as described under each subheading but not to gather evidence to express assurance on these matters. Accordingly, I do not express an opinion or conclusion on these matters.
Predetermined objectives
10. I performed procedures to obtain evidence about the usefulness and reliability of the reported performance information for the following selected programmes presented in the annual performance report of the department for the year ended 31 March 2014:• Programme2:InstitutionalDevelopmentonpages29to41• Programme3:PolicyandGovernanceonpages41to50
11. I evaluated the reported performance information against the overall criteria of usefulness and reliability.
12. I evaluated the usefulness of the reported performance information to determine whether it was presented in accordance with the National Treasury’s annual reporting principles and whether the reported performance was consistent with the planned programmes. I further performed tests to determine whether indicators and targets were well defined, verifiable, specific, measurable, time bound and relevant, as required by the National Treasury’s Framework for managing programme performance information (FMPPI).
13. I assessed the reliability of the reported performance information to determine whether it was valid, accurate and complete.
14. I did not raise any material findings on the usefulness and reliability of the reported performance information for the selected programmes.
Additional matters
15. Although I raised no material findings on the usefulness and reliability of the reported performance information for the selected programmes, I draw attention to the following matters:

Northern Cape Office of the Premier Vote 1 | Annual Report for 2013/14 Financial Year
89
Achievement of planned targets
16. Refer to the annual performance report on pages 29 to 41, regarding the Institutional Development programme; 41 to 50, regarding the Policy and Governance programme; for information on the achievement of planned targets for the year.
Unaudited supplementary information
17. The supplementary information set out on pages 51 to 85 does not form part of the annual performance report and is presented as additional information. We have not audited this information and, accordingly, we do not express a conclusion thereon
Compliance with legislation
18. I performed procedures to obtain evidence that the Office had complied with applicable legislation regarding financial matters, financial management and other related matters. My findings on material non-compliance with specific matters in key legislation, as set out in the general notice issued in terms of the PAA, are as follows:
Annual financial statements, performance and annual reports
19. The financial statements submitted for auditing were not prepared in accordance with the prescribed financial reporting framework and supported by full and proper records as required by section 40(1)(a) of the Public Finance Management Act.
20. Material misstatements of disclosure items identified by the auditors in the submitted financial statement were subsequently corrected and the supporting records were provided subsequently, resulting in the financial statements receiving an unqualified audit opinion.
Liability management
21. There was no evidence that credit cards were used for the permitted purpose, as set out in Treasury Regulation 15.10.3.6, and these were not cancelled as per the specified date, as required by Treasury Regulation 15.10.3.4.
Human resource management
22. Funded vacant posts were not filled within 12 months as required by Public Service Regulation 1/VII/C.1A.2.
Expenditure management
23. Effective steps were not taken to prevent irregular expenditure, as required by section 38(1) (c)(ii) of the Public Finance Management Act and Treasury Regulation 9.1.1.
Procurement and Contract management
24. Some IT related goods and services, classified as mandatory, were not procured through SITA as required by Treasury Regulation 16A6.3 (e).

Northern Cape Office of the Premier Vote 1 | Annual Report for 2013/14 Financial Year
90
Internal control
25. I considered internal control relevant to my audit of the financial statements, annual performance report and compliance with legislation. The matters reported below are limited to the significant internal control deficiencies that resulted in the findings on the annual performance report and the findings on non-compliance with legislation included in this report.
Leadership
26. The accounting officer did not ensure that internal control deficiencies are identified and communicated in order to mitigate the risks of financial and performance reporting, resulting in material misstatements and non-compliance to laws and regulations.
27. Actions plans to address prior year audit findings developed; however were not efficiently monitored by the leadership of the department resulting in the reoccurrence of material misstatements in the annual financial statements and non-compliance with legislation.
Financial and performance management
28. The financial statements were not adequately reviewed for completeness, occurrence and accuracy prior to the submission of the information for audit purposes. As a result, the financial statements were subject to material amendments resulting from the audit. The accounting officer must ensure that a proper review is performed on the financial statements, prior to the submission of the financial statements to the auditors.
29. Non-compliance with laws and regulations could have been prevented had compliance been properly reviewed and monitored. There were number of instances where non-compliance issues were identified during the audit.
OTHER REPORTSPerformance audits
30. The Report of the Auditor-General of South Africa on the readiness of government to report on its performance willbetabledduring2014.TheOfficeofthePremier–NorthernCapewasoneofthe61institutions/departmentsaudited during this audit. The performance audit focused on the following:• Thesystemsandprocessesthatgovernmentdepartmentshaveputinplacetoreportontheirperformance• Theperformancereportingguidanceandoversightgovernmentdepartmentsreceived.
Kimberley31 July 2014
Northern Cape Office of the Premier Vote 1 | Annual Report for 2013/14 Financial Year
91
Table of Contents
Appropriation Statement 92
Notes to the Appropriation Statement 101
Statement of Financial Performance 103
Statement of Financial Position 104
Statement of Changes in Net Assets 105
Cash Flow Statement 106
Notes to the Annual Financial Statements (including Accounting policies) 107
Annexures 139

Northern Cape Office of the Premier Vote 1 | Annual Report for 2013/14 Financial Year
92
App
ropr
iati
on p
er p
rogr
amm
e20
13/1
420
12/1
3A
PPRO
PRIA
TIO
N
STAT
EMEN
TA
djus
ted
App
ropr
iati
onSh
ifti
ng
of F
unds
Vir
emen
tFi
nal
App
ropr
iati
onA
ctua
l Ex
pend
itur
eVa
rian
ceEx
pend
itur
e as
% o
f fina
l ap
prop
riat
ion
Fina
l A
ppro
pria
tion
Act
ual
Expe
ndit
ure
R’00
0R’
000
R’00
0R’
000
R’00
0R’
000
%R’
000
R’00
01.
A
DM
INIS
TRAT
ION
Cu
rren
t pay
men
t78
,668
-1,
264
79,9
3277
,636
2,29
697
.1%
69,2
0668
,564
Tr
ansf
ers
and
subs
idie
s21
-36
5757
-10
0.0%
376
375
Pa
ymen
t for
cap
ital
asse
ts44
9-
1,36
61,
815
1,81
5-
100.
0%10
410
4
Pa
ymen
t for
fina
ncia
l as
sets
--
155
155
155
-10
0.0%
176
176
2. I
NST
ITU
TIO
NA
L D
EVEL
OPM
ENT
Cu
rren
t pay
men
t 57
,712
-(4
47)
57,2
6556
,964
301
99.5
%39
,198
39,1
97
Tran
sfer
s an
d su
bsid
ies
13,8
34-
9013
,924
13,9
24-
100.
0%12
,864
12,8
64
Paym
ent f
or c
apita
l as
sets
1,10
4-
184
1,28
863
865
049
.5%
448
448
Pa
ymen
t for
fina
ncia
l as
sets
--
--
--
--
-
3.
POLI
CY
&
GO
VER
NA
NCE
Cu
rren
t pay
men
t 31
,336
-(3
,977
)27
,359
24,8
392,
520
90.8
%29
,121
24,5
75
Tran
sfer
s an
d su
bsid
ies
4,04
8-
444,
092
4,09
2-
100.
0%3,
761
3,76
1
Paym
ent f
or c
apita
l as
sets
--
1,28
51,
285
-1,
285
-1,
723
1,72
3
Pa
ymen
t for
fina
ncia
l as
sets
Subt
otal
187,
172
--
187,
172
180,
120
7,05
296
.2%
156,
977
151,
787
APP
ROPR
IATI
ON
STA
TEM
ENT
for t
he y
ear e
nded
31
Mar
ch 2
014

Northern Cape Office of the Premier Vote 1 | Annual Report for 2013/14 Financial Year
93
App
ropr
iati
on p
er p
rogr
amm
e20
13/1
420
12/1
3A
PPRO
PRIA
TIO
N
STAT
EMEN
TA
djus
ted
App
ropr
iati
onSh
ifti
ng
of F
unds
Vir
emen
tFi
nal
App
ropr
iati
onA
ctua
l Ex
pend
itur
eVa
rian
ceEx
pend
itur
e as
% o
f fina
l ap
prop
riat
ion
Fina
l A
ppro
pria
tion
Act
ual
Expe
ndit
ure
R’00
0R’
000
R’00
0R’
000
R’00
0R’
000
%R’
000
R’00
01.
A
DM
INIS
TRAT
ION
Cu
rren
t pay
men
t78
,668
-1,
264
79,9
3277
,636
2,29
697
.1%
69,2
0668
,564
Tr
ansf
ers
and
subs
idie
s21
-36
5757
-10
0.0%
376
375
Pa
ymen
t for
cap
ital
asse
ts44
9-
1,36
61,
815
1,81
5-
100.
0%10
410
4
Pa
ymen
t for
fina
ncia
l as
sets
--
155
155
155
-10
0.0%
176
176
2. I
NST
ITU
TIO
NA
L D
EVEL
OPM
ENT
Cu
rren
t pay
men
t 57
,712
-(4
47)
57,2
6556
,964
301
99.5
%39
,198
39,1
97
Tran
sfer
s an
d su
bsid
ies
13,8
34-
9013
,924
13,9
24-
100.
0%12
,864
12,8
64
Paym
ent f
or c
apita
l as
sets
1,10
4-
184
1,28
863
865
049
.5%
448
448
Pa
ymen
t for
fina
ncia
l as
sets
--
--
--
--
-
3.
POLI
CY
&
GO
VER
NA
NCE
Cu
rren
t pay
men
t 31
,336
-(3
,977
)27
,359
24,8
392,
520
90.8
%29
,121
24,5
75
Tran
sfer
s an
d su
bsid
ies
4,04
8-
444,
092
4,09
2-
100.
0%3,
761
3,76
1
Paym
ent f
or c
apita
l as
sets
--
1,28
51,
285
-1,
285
-1,
723
1,72
3
Pa
ymen
t for
fina
ncia
l as
sets
Subt
otal
187,
172
--
187,
172
180,
120
7,05
296
.2%
156,
977
151,
787
2013/14 2012/13
Final Appropriation
Actual Expenditure
Final Appropriation
Actual Expenditure
TOTAL (brought forward)
Reconciliation with statement of financial performance
ADD
Departmental receipts 336 173 -
Aid assistance 187
Actual amounts per statement of financial performance (total revenue)
187,695 157,150
ADD
Aid assistance 187 2,982
Prior year unauthorised expenditure approved without funding
Actual amounts per statement of financial performance (total expenditure)
180,307 154,769
APPROPRIATION STATEMENTfor the year ended 31 March 2014

Northern Cape Office of the Premier Vote 1 | Annual Report for 2013/14 Financial Year
94
App
ropr
iati
on p
er e
cono
mic
cla
ssifi
cati
on
2013
/14
2012
/13
Adj
uste
d A
ppro
pria
tion
Shif
ting
of
Fun
dsV
irem
ent
Fina
l A
ppro
pria
tion
Act
ual
Expe
ndit
ure
Vari
ance
Expe
ndit
ure
as %
of fi
nal
appr
opri
atio
n
Fina
l A
ppro
pria
tion
Act
ual
expe
ndit
ure
R’00
0R’
000
R’00
0R’
000
R’00
0R’
000
%R’
000
R’00
0
Curr
ent p
aym
ents
Com
pens
atio
n of
em
ploy
ees
102,
463
-(9
,351
)93
,112
92,9
9212
099
.9%
85,1
9583
,419
Goo
ds a
nd s
ervi
ces
65,2
53-
6,19
271
,445
66,4
484,
997
93.0
%52
,330
48,9
17
Tran
sfer
s an
d su
bsid
ies
Dep
artm
enta
l age
ncie
s an
d ac
coun
ts30
9-
-30
930
9-
100.
0%3
2
Non
-pro
fit in
stitu
tions
17
,452
--
17,4
5217
,452
-10
0.0%
16,6
2116
,621
Hou
seho
lds
142
-16
831
031
0-
100.
0%37
737
7
Paym
ents
for c
apit
al
asse
ts
Mac
hine
ry a
nd e
quip
men
t96
6-
2,75
43,
720
2,43
51,
285
65.5
%84
984
9
Inta
ngib
le a
sset
s58
7-
8266
919
650
2.8%
1,42
61,
426
Paym
ents
for fi
nanc
ial
asse
ts-
-15
515
515
5-
100.
0%17
617
6
Tota
l18
7,17
2-
-18
7,17
218
0,12
07,
052
96.2
%15
6,97
715
1,78
7
APP
ROPR
IATI
ON
STA
TEM
ENT
for t
he y
ear e
nded
31
Mar
ch 2
014

Northern Cape Office of the Premier Vote 1 | Annual Report for 2013/14 Financial Year
95
2013
/14
2012
/13
PRO
GR
AM
1 P
ER S
UB
PRO
GR
AM
ME
A
djus
ted
App
ropr
iati
onSh
ifti
ng
of F
unds
Vir
emen
tFi
nal
App
ropr
iati
onA
ctua
l Ex
pend
itur
eVa
rian
ceEx
pend
itur
e as
% o
f fina
l ap
prop
riat
ion
Fina
l A
ppro
pria
tion
Act
ual
expe
ndit
ure
R’00
0R’
000
R’00
0R’
000
R’00
0R’
000
%R’
000
R’00
0
1.1
PREM
IER
SUPP
ORT
Cu
rren
t pay
men
t13
,582
7538
814
,045
14,0
45-
100.
0%16
,486
16,4
86
Tr
ansf
ers
and
subs
idie
s-
--
--
--
1-
Pa
ymen
t for
cap
ital a
sset
s-
--
--
--
--
1.2
EXEC
UTI
VE
COU
NCI
L
Cu
rren
t pay
men
t7,
252
-(5
80)
6,67
26,
672
-10
0.0%
4,88
44,
885
Tr
ansf
ers
and
subs
idie
s-
--
--
--
--
Pa
ymen
t for
cap
ital a
sset
s-
--
--
--
--
1.3
DG
SU
PPO
RT
Cu
rren
t pay
men
t26
,885
(102
)(2
8)26
,755
24,4
592,
296
91.4
%19
,535
18,8
94
Tr
ansf
ers
and
subs
idie
s21
--
2121
-10
0.0%
375
375
Pa
ymen
t for
cap
ital a
sset
s20
-1,
292
1,31
21,
312
-10
0.0%
--
Pa
ymen
t for
fina
ncia
l as
sets
--
155
155
155
-10
0.0%
176
176
1.4
FIN
AN
CIA
L M
AN
AG
EMEN
T
Cu
rren
t pay
men
t30
,949
271,
484
32,4
6032
,460
-10
0.0%
28,3
0128
,299
Tr
ansf
ers
and
subs
idie
s-
-36
3636
-10
0.0%
--
Pa
ymen
t for
cap
ital a
sset
s42
9-
7450
350
3-
100.
0%10
410
4
Tota
l79
,138
-2,
821
81,9
5979
,663
2,29
697
.2%
69,8
6269
,219
APP
ROPR
IATI
ON
STA
TEM
ENT
for t
he y
ear e
nded
31
Mar
ch 2
014

Northern Cape Office of the Premier Vote 1 | Annual Report for 2013/14 Financial Year
96
2013
/14
2012
/13
PRO
GR
AM
1 P
ER E
CON
OM
IC
CLA
SSIF
ICAT
ION
Adj
uste
d A
ppro
pria
tion
Shif
ting
of
Fun
dsV
irem
ent
Fina
l A
ppro
pria
tion
Act
ual
Expe
ndit
ure
Vari
ance
Expe
ndit
ure
as %
of fi
nal
appr
opri
atio
n
Fina
l A
ppro
pria
tion
Act
ual
expe
ndit
ure
R’00
0R’
000
R’00
0R’
000
R’00
0R’
000
%R’
000
R’00
0
Curr
ent p
aym
ents
Com
pens
atio
n of
em
ploy
ees
40,3
78-
(4,4
76)
35,9
0235
,902
-10
0.0%
32,9
1532
,273
Goo
ds a
nd s
ervi
ces
38,2
90-
5,74
044
,030
41,7
342,
296
94.8
%36
,291
36,2
91
Tran
sfer
s an
d su
bsid
ies
to:
Dep
artm
enta
l age
ncie
s an
d ac
coun
ts3
--
33
-10
0.0%
1-
Non
-pro
fit in
stitu
tions
-
--
--
--
--
Hou
seho
lds
18-
3553
53-
100.
0%37
537
5
Paym
ent
for
capi
tal a
sset
s
Mac
hine
ry a
nd e
quip
men
t44
9-
1,36
71,
816
1,81
6-
100.
0%10
410
4
Inta
ngib
le a
sset
s-
--
--
--
--
Paym
ents
for fi
nanc
ial
asse
ts-
-15
515
515
5-
100.
0%17
617
6
Tota
l79
,138
-2,
821
81,9
5979
,663
2,29
697
.2%
69,8
6269
,219
APP
ROPR
IATI
ON
STA
TEM
ENT
for t
he y
ear e
nded
31
Mar
ch 2
014

Northern Cape Office of the Premier Vote 1 | Annual Report for 2013/14 Financial Year
97
2013
/14
2012
/13
PRO
GR
AM
2 P
ER S
UB
PRO
GR
AM
ME
A
djus
ted
App
ropr
iati
onSh
ifti
ng
of F
unds
Vir
emen
tFi
nal
App
ropr
iati
onA
ctua
l Ex
pend
itur
eVa
rian
ceEx
pend
itur
e as
% o
f fina
l ap
prop
riat
ion
Fina
l A
ppro
pria
tion
Act
ual
expe
ndit
ure
R’00
0R’
000
R’00
0R’
000
R’00
0R’
000
%R’
000
R’00
0
2.1
STR
ATEG
IC H
R
Cu
rren
t pay
men
t24
,874
(1,9
39)
(287
)22
,649
22,6
49-
100.
0%20
,563
20,5
63
Tr
ansf
ers
and
subs
idie
s13
,810
-90
13,9
0013
,900
-10
0.0%
12,8
6312
,863
2.2
ICT
Cu
rren
t pay
men
t9,
092
(1,0
49)
(307
)7,
736
7,73
51
100.
0%8,
948
8,94
8
Tr
ansf
ers
and
subs
idie
s-
--
--
--
--
Pa
ymen
t for
cap
ital a
sset
s1,
104
-18
41,
288
638
650
49.5
%44
844
8
2.3
LEG
AL
SERV
ICES
Cu
rren
t pay
men
t5,
202
46(2
76)
4,97
24,
972
-10
0.0%
4,23
14.
231
Tr
ansf
ers
and
subs
idie
s-
--
--
--
--
2.4
COM
MU
NIC
ATIO
NS
Cu
rren
t pay
men
t15
,447
3,04
766
519
,159
18,8
5930
098
.4%
3,10
13,
100
Tr
ansf
ers
and
subs
idie
s24
--
2424
-10
0.0%
11
2.5
PRO
GR
AM
ME
SUPP
ORT
Cu
rren
t pay
men
t3,
097
(106
)(2
42)
2,74
92,
749
-10
0.0%
2,35
52,
355
Tr
ansf
ers
and
subs
idie
s-
--
--
--
--
Tota
l72
,650
-(1
73)
72,4
7771
,526
951
98.7
%52
,510
52,5
09
APP
ROPR
IATI
ON
STA
TEM
ENT
for t
he y
ear e
nded
31
Mar
ch 2
014

Northern Cape Office of the Premier Vote 1 | Annual Report for 2013/14 Financial Year
98
2013
/14
2012
/13
PRO
GR
AM
ME
2 PE
R EC
ON
OM
IC C
LASS
IFIC
ATIO
NA
djus
ted
App
ropr
iati
onSh
ifti
ng
of F
unds
Vir
emen
tFi
nal
App
ropr
iati
onA
ctua
l Ex
pend
itur
eVa
rian
ceEx
pend
itur
e as
% o
f fina
l ap
prop
riat
ion
Fina
l A
ppro
pria
tion
Act
ual
expe
ndit
ure
R’00
0R’
000
R’00
0R’
000
R’00
0R’
000
%R’
000
R’00
0
Curr
ent p
aym
ents
Com
pens
atio
n of
em
ploy
ees
38,3
63-
(1,5
19)
36,8
4436
,844
-10
0.0%
32,4
4532
,445
Goo
ds a
nd s
ervi
ces
19,3
49-
1,07
320
,422
20,12
130
198
.5%
6,75
36,
752
Tran
sfer
s an
d su
bsid
ies
to:
Dep
artm
enta
l age
ncie
s an
d ac
coun
ts30
6-
-30
630
6-
100.
0%1
1
Non
-pro
fit in
stitu
tions
13
,504
--
13,5
0413
,504
-10
0.0%
12,8
6112
,861
Hou
seho
lds
24-
8911
311
3-
100.
0%2
2
Paym
ent
for
capi
tal a
sset
s
Mac
hine
ry a
nd e
quip
men
t51
7-
102
619
619
-10
0.0%
448
448
Inta
ngib
le a
sset
s58
7-
8266
919
650
2.8%
--
Paym
ents
for fi
nanc
ial a
sset
s-
--
--
--
--
Tota
l72
,650
-(1
73)
72,4
7771
,526
951
98.7
%52
,510
52,5
09
APP
ROPR
IATI
ON
STA
TEM
ENT
for t
he y
ear e
nded
31
Mar
ch 2
014

Northern Cape Office of the Premier Vote 1 | Annual Report for 2013/14 Financial Year
99
2013
/14
2012
/13
PRO
GR
AM
3 P
ER S
UB
PRO
GR
AM
ME
A
djus
ted
App
ropr
iati
onSh
ifti
ng
of F
unds
Vir
emen
tFi
nal
App
ropr
iati
onA
ctua
l Ex
pend
itur
eVa
rian
ceEx
pend
itur
e as
% o
f fina
l ap
prop
riat
ion
Fina
l A
ppro
pria
tion
Act
ual
expe
ndit
ure
R’00
0R’
000
R’00
0R’
000
R’00
0R’
000
%R’
000
R’00
0
3.1
SPEC
IAL
PRO
GR
AM
MES
Cu
rren
t pay
men
t9,
899
182
(1,0
46)
9,03
59,
035
-10
0.0%
14,9
2112
,284
Tr
ansf
ers
and
subs
idie
s3,
948
--
3,94
83,
948
-10
0.0%
3,76
13,
761
Pa
ymen
t for
cap
ital
asse
ts-
--
--
--
514
514
3.2
IGR
Cu
rren
t pay
men
t2,
176
17(1
74)
2,01
92,
019
-10
0.0%
2,03
02,
030
Tr
ansf
ers
and
subs
idie
s-
-44
4444
-10
0.0%
--
Pa
ymen
t for
cap
ital
asse
ts-
--
--
--
--
3.3
PRO
VIN
CIA
L PO
LIC
Y M
AN
AG
EMEN
T
Cu
rren
t pay
men
t16
,447
(65)
(1,2
43)
15,13
912
,619
2,52
083
.4%
10,8
338,
924
Tr
ansf
ers
and
subs
idie
s-
--
--
--
--
Pa
ymen
t for
cap
ital
asse
ts-
--
--
--
1,20
91,
209
3.4
PRO
GR
AM
ME
SUPP
ORT
Cu
rren
t pay
men
t2,
814
(134
)(1
,514
)1,
166
1,16
6-
100.
0%1,
337
1,33
7
Tr
ansf
ers
and
subs
idie
s10
0-
-10
010
0-
100.
0%-
-
Pa
ymen
t for
cap
ital
asse
ts-
-1,
285
1,28
5-
1,28
5-
--
Tota
l35
,384
-(2
,648
)32
,736
28,9
313,
805
88.4
%34
,605
30,0
59
APP
ROPR
IATI
ON
STA
TEM
ENT
for t
he y
ear e
nded
31
Mar
ch 2
014
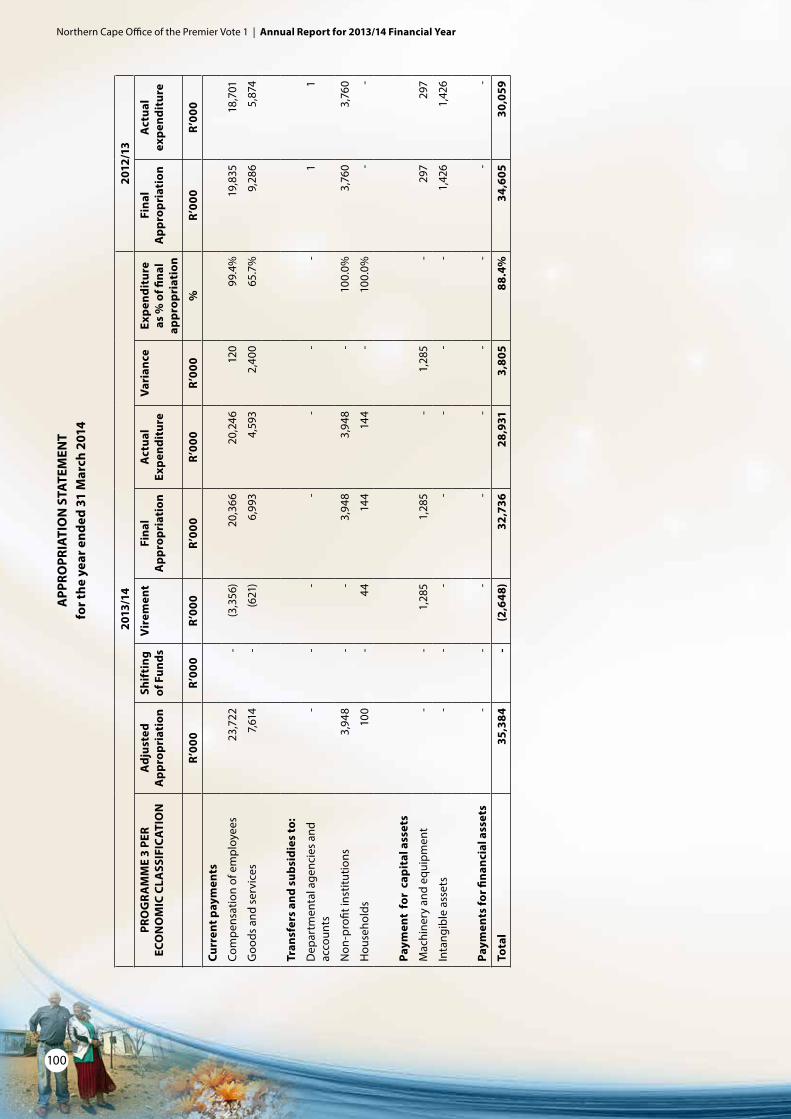
Northern Cape Office of the Premier Vote 1 | Annual Report for 2013/14 Financial Year
100
2013
/14
2012
/13
PRO
GR
AM
ME
3 PE
R EC
ON
OM
IC C
LASS
IFIC
ATIO
NA
djus
ted
App
ropr
iati
onSh
ifti
ng
of F
unds
Vir
emen
tFi
nal
App
ropr
iati
onA
ctua
l Ex
pend
itur
eVa
rian
ceEx
pend
itur
e as
% o
f fina
l ap
prop
riat
ion
Fina
l A
ppro
pria
tion
Act
ual
expe
ndit
ure
R’00
0R’
000
R’00
0R’
000
R’00
0R’
000
%R’
000
R’00
0
Curr
ent p
aym
ents
Com
pens
atio
n of
em
ploy
ees
23,7
22-
(3,3
56)
20,3
6620
,246
120
99.4
%19
,835
18,7
01
Goo
ds a
nd s
ervi
ces
7,61
4-
(621
)6,
993
4,59
32,
400
65.7
%9,
286
5,87
4
Tran
sfer
s an
d su
bsid
ies
to:
Dep
artm
enta
l age
ncie
s an
d ac
coun
ts-
--
--
--
11
Non
-pro
fit in
stitu
tions
3,
948
--
3,94
83,
948
-10
0.0%
3,76
03,
760
Hou
seho
lds
100
-44
144
144
-10
0.0%
--
Paym
ent
for
capi
tal a
sset
s
Mac
hine
ry a
nd e
quip
men
t-
-1,
285
1,28
5-
1,28
5-
297
297
Inta
ngib
le a
sset
s-
--
--
--
1,42
61,
426
Paym
ents
for fi
nanc
ial a
sset
s-
--
--
--
--
Tota
l35
,384
-(2
,648
)32
,736
28,9
313,
805
88.4
%34
,605
30,0
59
APP
ROPR
IATI
ON
STA
TEM
ENT
for t
he y
ear e
nded
31
Mar
ch 2
014

Northern Cape Office of the Premier Vote 1 | Annual Report for 2013/14 Financial Year
101
1. Detail of transfers and subsidies as per Appropriation Act (after Virement):
Detail of these transactions can be viewed in the note on Transfers and subsidies, disclosure notes and Annexure 1 (A-C) to the Annual Financial Statements.
2. Detail of specifically and exclusively appropriated amounts voted (after Virement):
Detail of these transactions can be viewed in note 1 (Annual Appropriation) to the Annual Financial Statements.
3. Detail on payments for financial assets
Detail of these transactions per programme can be viewed in the note on Payments for financial assets to the Annual Financial Statements.
4. Explanations of material variances from Amounts Voted (after Virement):
4.1 Per programme Final Appropriation
Actual Expenditure
Variance Variance as a % of Final
Appropriation
R’000 R’000 R’000 R’000
Administration 81,959 79,663 2,296 2.80%
Institutional Development 72,477 71,526 951 1.31%
Policy & Governance 32,736 28,931 3,805 11.62%
4.2 Per economic classification Final Appropriation
Actual Expenditure
Variance Variance as a % of Final
Appropriation
R’000 R’000 R’000 R’000
Current payments
Compensation of employees 93,112 92,992 120 0.13%
Goods and services 71,445 66,448 4,997 6.99%
Transfers and subsidies
Departmental agencies and accounts 309 309 - 0.00%
Non-profit institutions 17,452 17,452 - 0.00%
Households 310 310 - 0.00%
Payments for capital assets
Machinery and equipment 3,720 2,435 1,285 34.54%
Intangible assets 669 19 650 97.16%
Payments for financial assets 155 155 0 0.00%
NOTES TO THE APPROPRIATION STATEMENTfor the year ended 31 March 2014

Northern Cape Office of the Premier Vote 1 | Annual Report for 2013/14 Financial Year
102
The variance of R 2,296,000 in Program 1 is as a result of furniture and infrastructure expenditure specifically earmarked for the relocation of officials from Templar building to JW Sauer building, which was committed but could not be finalised at year end due to delays in renovations by Transnet Properties. The finalisation of this project was postponed to 31 August 2014 and a rollover of funds has been requested to re-allocate funds in the 2014/15 financial year.
The variance of R 951,000 under Program 2 is attributed to delays in the renewal of Symantec software licences on the part of SITA to procure the service of an approved SITA service provider. As at year end the funds were committed and a rollover of funds were requested from Provincial Treasury for funds to be re-allocated in the 2014/15 financial year.
The variance of R 3,805,000 is attributed to earmarked funds for the Northern Cape Provincial Government 20 year review project, which was committed but not finalised at year end due to delays in the appointment process to ensure compliance with Supply Chain Management processes. Furthermore delays in the delivery of some capital assets contributed to the saving. A rollover request for both occurrences has been submitted to Provincial Treasury to re-allocate these funds during the 2014/15 financial year.
NOTES TO THE APPROPRIATION STATEMENTfor the year ended 31 March 2014

Northern Cape Office of the Premier Vote 1 | Annual Report for 2013/14 Financial Year
103
Note 2013/14 2012/13
R’000 R’000
REVENUE
Annual appropriation 1 187,172 156,977
Departmental revenue 2 336 173
Aid assistance 3 187 -
TOTAL REVENUE 187,695 157,150
EXPENDITURE
Current expenditure 159,626 135,318
Compensation of employees 4 92,991 83,716
Goods and services 5 66,448 48,620
Aid assistance 3 187 2,982
Transfers and subsidies 18,071 17,000
Transfers and subsidies 7 18,071 17,000
Expenditure for capital assets 2,455 2,275
Tangible assets 8 2,436 849
Intangible assets 8 19 1,426
Payments for financial assets 6 155 176
TOTAL EXPENDITURE 180,307 154,769
SURPLUS/(DEFICIT) FOR THE YEAR 7,388 2,381
Reconciliation of Net Surplus/(Deficit) for the year
Voted funds 7,052 5,190
Departmental revenue and NRF Receipts 2 336 173
Aid assistance 3 - (2,982)
SURPLUS/(DEFICIT) FOR THE YEAR 7,388 2,381
STATEMENT OF FINANCIAL PERFORMANCEfor the year ended 31 March 2014

Northern Cape Office of the Premier Vote 1 | Annual Report for 2013/14 Financial Year
104
Note 2013/14 2012/13
R’000 R’000
ASSETS
Current assets 7,749 7,401
Unauthorised expenditure 9 - 4,557
Cash and cash equivalents 10 330 5
Prepayments and advances 11 586 598
Receivables 12 6,833 2,241
TOTAL ASSETS 7,749 7,401
LIABILITIES
Current liabilities 7,546 7,198
Voted funds to be surrendered to the Revenue Fund 13 7,052 5,190
Departmental revenue and NRF Receipts to be surrendered to the Revenue Fund 14 475 464
Bank overdraft 15 - 1,544
Payables 16 19 -
TOTAL LIABILITIES 7,546 7,198
NET ASSETS 203 203
Note 2013/14 2012/13
R’000 R’000
Represented by:
Recoverable revenue 203 203
TOTAL 203 203
STATEMENT OF FINANCIAL POSITIONfor the year ended 31 March 2014

Northern Cape Office of the Premier Vote 1 | Annual Report for 2013/14 Financial Year
105
Note 2013/14 2012/13
R’000 R’000
Recoverable revenue
Opening balance 203 203
Transfers: - -
Closing balance 203 203
TOTAL 203 203
STATEMENT OF CHANGES IN NET ASSETSfor the year ended 31 March 2014

Northern Cape Office of the Premier Vote 1 | Annual Report for 2013/14 Financial Year
106
Note 2013/14 2012/13
R’000 R’000
CASH FLOWS FROM OPERATING ACTIVITIES
Receipts 187,495 157,150
Annual appropriated funds received 1.1 187,172 156,977
Departmental revenue received 2 136 173
Aid assistance received 3 187 -
Net (increase)/decrease in working capital (4) 1,046
Surrendered to Revenue Fund (5,515) (3,852)
Surrendered to RDP Fund/Donor - (679)
Current payments (159,626) (135,318)
Payments for financial assets (155) (176)
Transfers and subsidies paid (18,071) (17,000)
Net cash flow available from operating activities 17 4,124 1,171
CASH FLOWS FROM INVESTING ACTIVITIES
Payments for capital assets 8 (2,455) (2,275)
Proceeds from sale of capital assets 2.2 200 -
Net cash flows from investing activities (2,255) (2,275)
CASH FLOWS FROM FINANCING ACTIVITIES
Distribution/dividend received - -
Increase/(decrease) in net assets - -
Increase/(decrease) in non-current payables - -
Net cash flows from financing activities - -
Net increase/(decrease) in cash and cash equivalents 1,869 (1,104)
Cash and cash equivalents at beginning of period (1,539) (435)
Cash and cash equivalents at end of period 18 330 (1,539)
CASH FLOW STATEMENTfor the year ended 31 March 2014

Northern Cape Office of the Premier Vote 1 | Annual Report for 2013/14 Financial Year
107
ACCOUNTING POLICIESfor the year ended 31 March 2014
Summary of significant accounting policies The financial statements have been prepared in accordance with the following policies, which have been applied consistently in all material aspects, unless otherwise indicated. The historical cost convention has been used, except where otherwise indicated. Management has used assessments and estimates in preparing the annual financial statements. These are based on the best information available at the time of preparation.Where appropriate and meaningful, additional information has been disclosed to enhance the usefulness of the financial statements and to comply with the statutory requirements of the Public Finance Management Act (PFMA), Act 1 of 1999 (as amended by Act 29 of 1999), and the Treasury Regulations issued in terms of the PFMA and the annual Division of Revenue Act.
1 Basis of preparation The financial statements have been prepared in accordance with the Modified Cash Standard.
2 Going concern The financial statements have been prepared on a going concern basis.
3 Presentation currencyAmounts have been presented in the currency of the South African Rand (R) which is also the functional currency of the department.
4 Rounding Unless otherwise stated financial figures have been rounded to the nearest one thousand Rand (R’000).
5 Foreign currency translationCash flows arising from foreign currency transactions are translated into South African Rand using the exchange rates prevailing at the date of payment / receipt.
6 Current year comparison with budget A comparison between the approved, final budget and actual amounts for each programme and economic classification is included in the appropriation statement.
7 Revenue
7.1 Appropriated fundsAppropriated funds comprises of departmental allocations as well as direct charges against the revenue fund (i.e. statutory appropriation).Appropriated funds are recognised in the statement of financial performance on the date the appropriation becomes effective. Adjustments made in terms of the adjustments budget process are recognised in the statement of financial performance on the date the adjustments become effective.The net amount of any appropriated funds due to / from the relevant revenue fund at the reporting date is recognised as a payable / receivable in the statement of financial position.
7.2 Departmental revenue Departmental revenue is recognised in the statement of financial performance when received and is subsequently paid into the relevant revenue fund, unless stated otherwise.Any amount owing to the relevant revenue fund at the reporting date is recognised as a payable in the statement of financial position.

Northern Cape Office of the Premier Vote 1 | Annual Report for 2013/14 Financial Year
108
7.3 Accrued departmental revenue Accruals in respect of departmental revenue (excluding tax revenue) are recorded in the notes to the financial statements when:• itisprobablethattheeconomicbenefitsorservicepotentialassociatedwiththetransactionwillflowto
the department; and• theamountofrevenuecanbemeasuredreliably.The accrued revenue is measured at the fair value of the consideration receivable.Accrued tax revenue (and related interest and / penalties) is measured at amounts receivable from collecting agents.
8 Expenditure
8.1 Compensation of employees
8.1.1 Salaries and wagesSalaries and wages are recognised in the statement of financial performance on the date of payment.
8.1.2 Social contributionsSocial contributions made by the department in respect of current employees are recognised in the statement of financial performance on the date of payment. Social contributions made by the department in respect of ex-employees are classified as transfers to households in the statement of financial performance on the date of payment.
8.2 Other expenditureOther expenditure (such as goods and services, transfers and subsidies and payments for capital assets) is recognised in the statement of financial performance on the date of payment. The expense is classified as a capital expense if the total consideration paid is more than the capitalisation threshold.
8.3 Accrued expenditure payableAccrued expenditure payable is recorded in the notes to the financial statements when the goods are received or, in the case of services, when they are rendered to the department.Accrued expenditure payable is measured at cost.
8.4 Leases
8.4.1 Operating leasesOperating lease payments made during the reporting period are recognised as current expenditure in the statement of financial performance on the date of payment.The operating lease commitments are recorded in the notes to the financial statements.
8.4.2 Finance leases Finance lease payments made during the reporting period are recognised as capital expenditure in the statement of financial performance on the date of payment.The finance lease commitments are recorded in the notes to the financial statements and are not apportioned between the capital and interest portions. Finance lease assets acquired at the end of the lease term are recorded and measured at the lower of:• cost,beingthefairvalueoftheasset;or• thesumoftheminimumleasepaymentsmade,includinganypaymentsmadetoacquireownershipat
the end of the lease term, excluding interest.
ACCOUNTING POLICIESfor the year ended 31 March 2014

Northern Cape Office of the Premier Vote 1 | Annual Report for 2013/14 Financial Year
109
9 Aid Assistance
9.1 Aid assistance receivedAid assistance received in cash is recognised in the statement of financial performance when received. In-kind aid assistance is recorded in the notes to the financial statements on the date of receipt and is measured at fair value.Aid assistance not spent for the intended purpose and any unutilised funds from aid assistance that are required to be refunded to the donor are recognised as a payable in the statement of financial position.
9.2 Aid assistance paidAid assistance paid is recognised in the statement of financial performance on the date of payment. Aid assistance payments made prior to the receipt of funds are recognised as a receivable in the statement of financial position.
10 Cash and cash equivalentsCash and cash equivalents are stated at cost in the statement of financial position. Bank overdrafts are shown separately on the face of the statement of financial position.For the purposes of the cash flow statement, cash and cash equivalents comprise cash on hand, deposits held, other short-term highly liquid investments and bank overdrafts.
11 Prepayments and advancesPrepayments and advances are recognised in the statement of financial position when the department receives or disburses the cash. Prepayments and advances are initially and subsequently measured at cost.
12 Loans and receivablesLoans and receivables are recognised in the statement of financial position at cost plus accrued interest, where interest is charged, less amounts already settled or written-off.
13 InvestmentsInvestments are recognised in the statement of financial position at cost.
14 Impairment of financial assetsWhere there is an indication of impairment of a financial asset, an estimation of the reduction in the recorded carrying value, to reflect the best estimate of the amount of the future economic benefits expected to be received from that asset, is recorded in the notes to the financial statements.
15 PayablesLoans and receivables are recognised in the statement of financial position at cost.
ACCOUNTING POLICIESfor the year ended 31 March 2014

Northern Cape Office of the Premier Vote 1 | Annual Report for 2013/14 Financial Year
110
ACCOUNTING POLICIESfor the year ended 31 March 2014
16 Capital Assets
16.1 Immovable capital assetsImmovable capital assets are initially recorded in the notes to the financial statements at cost. Immovable capital assets acquired through a non-exchange transaction is measured at fair value as at the date of acquisition. Where the cost of immovable capital assets cannot be determined accurately, the immovable capital assets are measured at R1 unless the fair value of the asset has been reliably estimated, in which case the fair value is used. All assets acquired prior to 1 April 2002 (or a later date as approved by the OAG) are recorded at R1.Immovable capital assets are subsequently carried at cost and are not subject to depreciation or impairment.Subsequent expenditure that is of a capital nature is added to the cost of the asset at the end of the capital project unless the immovable asset is recorded by another department in which case the completed project costs are transferred to that department.
16.2 Movable capital assetsMovable capital assets are initially recorded in the notes to the financial statements at cost. Movable capital assets acquired through a non-exchange transaction is measured at fair value as at the date of acquisition. Where the cost of movable capital assets cannot be determined accurately, the movable capital assets are measured at fair value and where fair value cannot be determined; the movable assets are measured at R1. All assets acquired prior to 1 April 2002 (or a later date as approved by the OAG) are recorded at R1.Movable capital assets are subsequently carried at cost and are not subject to depreciation or impairment.Subsequent expenditure that is of a capital nature is added to the cost of the asset at the end of the capital project unless the movable asset is recorded by another department/entity in which case the completed project costs are transferred to that department.
16.3 Intangible assetsIntangible assets are initially recorded in the notes to the financial statements at cost. Intangible assets acquired through a non-exchange transaction are measured at fair value as at the date of acquisition. Internally generated intangible assets are recorded in the notes to the financial statements when the department commences the development phase of the project. Where the cost of intangible assets cannot be determined accurately, the intangible capital assets are measured at fair value and where fair value cannot be determined; the intangible assets are measured at R1. All assets acquired prior to 1 April 2002 (or a later date as approved by the OAG) are recorded at R1.Intangible assets are subsequently carried at cost and are not subject to depreciation or impairment.Subsequent expenditure that is of a capital nature is added to the cost of the asset at the end of the capital project unless the intangible asset is recorded by another department/entity in which case the completed project costs are transferred to that department.

Northern Cape Office of the Premier Vote 1 | Annual Report for 2013/14 Financial Year
111
ACCOUNTING POLICIESfor the year ended 31 March 2014
17 Provisions and Contingents
17.1 ProvisionsProvisions are recorded in the notes to the financial statements when there is a present legal or constructive obligation to forfeit economic benefits as a result of events in the past and it is probable that an outflow of resources embodying economic benefits or service potential will be required to settle the obligation and a reliable estimate of the obligation can be made. The provision is measured as the best estimate of the funds required to settle the present obligation at the reporting date.
17.2 Contingent liabilitiesContingent liabilities are recorded in the notes to the financial statements when there is a possible obligation that arises from past events, and whose existence will be confirmed only by the occurrence or non-occurrence of one or more uncertain future events not within the control of the department or when there is a present obligation that is not recognised because it is not probable that an outflow of resources will be required to settle the obligation or the amount of the obligation cannot be measured reliably
17.3 Contingent assetsContingent assets are recorded in the notes to the financial statements when a possible asset arises from past events, and whose existence will be confirmed by the occurrence or non-occurrence of one or more uncertain future events not within the control of the department
17.4 Commitments Commitments are recorded at cost in the notes to the financial statements when there is a contractual arrangement or an approval by management in a manner that raises a valid expectation that the department will discharge its responsibilities thereby incurring future expenditure that will result in the outflow of cash
18 Unauthorised expenditureUnauthorised expenditure is recognised in the statement of financial position until such time as the expenditure is either:• approvedbyParliamentortheProvincialLegislaturewithfundingandtherelatedfundsarereceived;or• approvedbyParliamentor theProvincial Legislaturewithout funding and iswrittenoff against the
appropriation in the statement of financial performance; or• transferredtoreceivablesforrecovery.Unauthorised expenditure is measured at the amount of the confirmed unauthorised expenditure.
19 Fruitless and wasteful expenditureFruitless and wasteful expenditure is recorded in the notes to the financial statements when confirmed. The amount recorded is equal to the total value of the fruitless and or wasteful expenditure incurred. Fruitless and wasteful expenditure is removed from the notes to the financial statements when it is resolved or transferred to receivables for recovery.Fruitless and wasteful expenditure receivables are measured at the amount that is expected to be recoverable and are de-recognised when settled or subsequently written-off as irrecoverable.

Northern Cape Office of the Premier Vote 1 | Annual Report for 2013/14 Financial Year
112
20 Irregular expenditureIrregular expenditure is recorded in the notes to the financial statements when confirmed. The amount recorded is equal to the total value of the irregularity unless it is impracticable to determine, in which case reasons therefor are provided in the note. Irregular expenditure is removed from the note when it is either condoned by the relevant authority or transferred to receivables for recovery. Irregular expenditure receivables are measured at the amount that is expected to be recoverable and are de-recognised when settled or subsequently written-off as irrecoverable.
21 Changes in accounting estimates [Insert the nature and amounts of the changes in accounting estimates for current and future periods (if applicable). If the effect on future periods could not reasonably be determined the fact should be disclosed.]
22 Prior period errors
[Insert the nature and amounts of the errors along with whether the errors were corrected retrospectively. Where the amounts could not be reasonably determined the fact should be disclosed.]
23 Non-adjusting events after the reporting date [Insert the nature of the event and an estimate of its financial effect (or a statement to that effect where such estimate cannot be made) for each material category of non-adjusting event after the reporting date and refer to the relevant note to the financial statements.]
24 Agent-Principal arrangements [Insert a description of the nature, circumstances and terms related to agency-principal arrangements and refer to the relevant note to the financial statements]
ACCOUNTING POLICIESfor the year ended 31 March 2014

Northern Cape Office of the Premier Vote 1 | Annual Report for 2013/14 Financial Year
113
1. Annual Appropriation
1.1 Annual Appropriation Included are funds appropriated in terms of the Appropriation Act (and the Adjustments Appropriation Act) for
(Voted funds) for Provincial Departments:
2013/14 2012/13
Final
Appropriation
Actual Funds
Received
Funds not requested/
not received
Appropriationreceived
R’000 R’000 R’000 R’000
Administration 81,959 81,959 - 69,862
Institutional Development 72,477 72,477 - 52,510
Policy & Governance 32,736 32,736 - 34,605
Total 187,172 187,172 - 156,977
2. Departmental revenue
Note 2013/14 2012/13
R’000 R’000
Sales of goods and services other than capital assets 2.1 88 73
Sales of capital assets 2.2 200 -
Transactions in financial assets and liabilities 2.3 48 100
Departmental revenue collected 336 173
2.1 Sales of goods and services other than capital assets
Note 2013/14 2012/13
2 R’000 R’000
Sales of goods and services produced by the department
Other sales 88 73
Total 88 73
NOTES TO THE ANNUAL FINANCIAL STATEMENTSfor the year ended 31 March 2014

Northern Cape Office of the Premier Vote 1 | Annual Report for 2013/14 Financial Year
114
2.2 Sale of capital assets
Note 2013/14 2012/13
R’000 R’000
Tangible assets
Machinery and equipment 39 200 -
Total 200 -
2.3 Transactions in financial assets and liabilities2013/14 2012/13
R’000 R’000
Other receipts including Recoverable Revenue 48 100
Total 48 100
3. Aid assistance
3.1 Aid assistance received in cash from RDP
Note 2013/14 2012/13
R’000 R’000
Foreign
Opening Balance - 3,661
Revenue 187 -
Expenditure (187) (2,982)
Current (187) (2,982)
Surrendered to the RDP - (679)
Closing Balance - -
3.2 Total assistance2013/14 2012/13
R’000 R’000
Opening Balance - 3,661
Revenue 187 -
Expenditure (187) (2,982)
Current (187) (2,982)
Surrendered to RDP/Donor - (679)
Closing Balance - -
NOTES TO THE ANNUAL FINANCIAL STATEMENTSfor the year ended 31 March 2014

Northern Cape Office of the Premier Vote 1 | Annual Report for 2013/14 Financial Year
115
NOTES TO THE ANNUAL FINANCIAL STATEMENTSfor the year ended 31 March 2014
4. Compensation of employees
4.1 Salaries and WagesNote 2013/14 2012/13
R’000 R’000
Basic salary 63,482 56,322
Performance award 434 979
Service Based 117 4
Compensative/circumstantial 1,502 1,484
Other non-pensionable allowances 15,877 14,747
Total 81,412 73,536
4.2 Social contributions
Note 2013/14 2012/13
R’000 R’000
Employer contributions
Pension 7,991 6,893
Medical 3,574 3,275
Bargaining council 14 12
Total 11,579 10,180
Total compensation of employees 92,991 83,716
Average number of employees 245 236
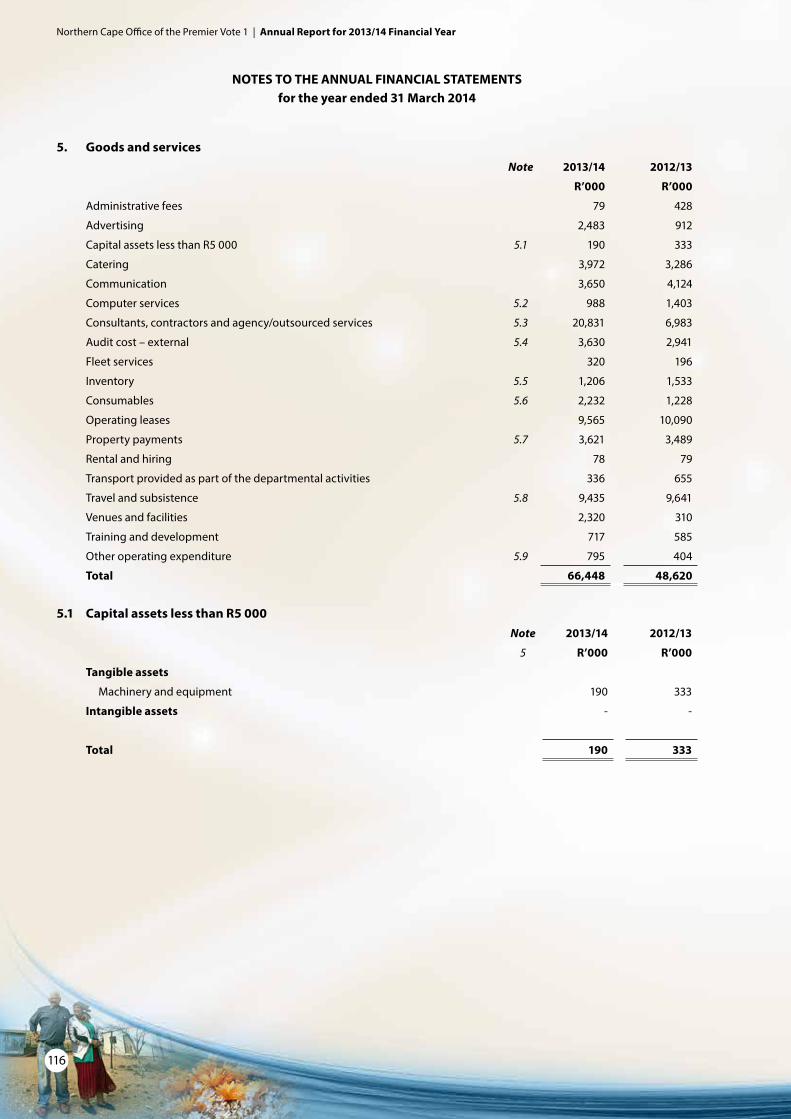
Northern Cape Office of the Premier Vote 1 | Annual Report for 2013/14 Financial Year
116
NOTES TO THE ANNUAL FINANCIAL STATEMENTSfor the year ended 31 March 2014
5. Goods and services Note 2013/14 2012/13
R’000 R’000
Administrative fees 79 428
Advertising 2,483 912
Capital assets less than R5 000 5.1 190 333
Catering 3,972 3,286
Communication 3,650 4,124
Computer services 5.2 988 1,403
Consultants, contractors and agency/outsourced services 5.3 20,831 6,983
Auditcost–external 5.4 3,630 2,941
Fleet services 320 196
Inventory 5.5 1,206 1,533
Consumables 5.6 2,232 1,228
Operating leases 9,565 10,090
Property payments 5.7 3,621 3,489
Rental and hiring 78 79
Transport provided as part of the departmental activities 336 655
Travel and subsistence 5.8 9,435 9,641
Venues and facilities 2,320 310
Training and development 717 585
Other operating expenditure 5.9 795 404
Total 66,448 48,620
5.1 Capital assets less than R5 000Note 2013/14 2012/13
5 R’000 R’000
Tangible assets
Machinery and equipment 190 333
Intangible assets - -
Total 190 333

Northern Cape Office of the Premier Vote 1 | Annual Report for 2013/14 Financial Year
117
NOTES TO THE ANNUAL FINANCIAL STATEMENTSfor the year ended 31 March 2014
5.2 Computer servicesNote 2013/14 2012/13
5 R’000 R’000
SITA computer services 979 1,380
External computer service providers 9 23
Total 988 1,403
5.3 Consultants, contractors and agency/outsourced servicesNote 2013/14 2012/13
5 R’000 R’000
Legal costs 63 161
Contractors 2,102 1,050
Agency and support/outsourced services 18,666 5,772
Total 20,831 6,983
5.4 Audit cost – External Note 2013/14 2012/13
5 R’000 R’000
Regularity audits 3,630 2,941
Total 3,630 2,941
5.5 InventoryNote 2013/14 2012/13
5 R’000 R’000
Food and food supplies - 313
Fuel, oil and gas 1,159 837
Materials and supplies 47 28
Other supplies - 355
Total 1,206 1,533
5.6 ConsumablesNote 2013/14 2012/13
5 R’000 R’000
Consumable supplies 1,686 617
Uniform and clothing 3 -
Household supplies 643 -
IT consumables 422 305
Other consumables 618 312
Stationery, printing and office supplies 546 611
Total 2,232 1,228

Northern Cape Office of the Premier Vote 1 | Annual Report for 2013/14 Financial Year
118
5.7 Property paymentsNote 2013/14 2012/13
5 R’000 R’000
Municipal services 1,510 1,575
Property maintenance and repairs 168 -
Other 1,943 1,914
Total 3,621 3,489
5.8 Travel and subsistenceNote 2013/14 2012/13
5 R’000 R’000
Local 8,354 9,218
Foreign 1,081 423
Total 9,435 9,641
5.9 Other operating expenditureNote 2013/14 2012/13
5 R’000 R’000
Professional bodies, membership and subscription fees 40 2
Resettlement costs 11 -
Other 744 402
Total 795 404
6 Payments for financial assetsNote 2013/14 2012/13
R’000 R’000
Debts written off 6.1 155 176
Total 155 176
6.1 Debts written offNote 2013/14 2012/13
6 R’000 R’000
Nature of debts written off
Staff debt 29 -
Intergovernmental debt 126 176
Total debt written off 155 176
NOTES TO THE ANNUAL FINANCIAL STATEMENTSfor the year ended 31 March 2014

Northern Cape Office of the Premier Vote 1 | Annual Report for 2013/14 Financial Year
119
NOTES TO THE ANNUAL FINANCIAL STATEMENTSfor the year ended 31 March 2014
7. Transfers and subsidies2013/14 2012/13
R’000 R’000
Note
Departmental agencies and accounts Annex 1A 309 2
Non-profit institutions Annex 1B 17,452 16,621
Households Annex 1C 310 377
Total 18,071 17,000
8. Expenditure for capital assets Note 2013/14 2012/13
R’000 R’000
Tangible assets 2,436 849
Machinery and equipment 29.1 2,436 849
Intangible assets 19 1,426
Software 30.1 19 1,426
Total 2,455 2,275
8.1 Analysis of funds utilised to acquire capital assets – 2013/14
Voted funds
Aid assistance Total
R’000 R’000 R’000
Tangible assets 2,436 - 2,436
Machinery and equipment 2,436 - 2,436
Intangible assets 19 - 19
Software 19 - 19
Total 2,455 - 2,455

Northern Cape Office of the Premier Vote 1 | Annual Report for 2013/14 Financial Year
120
NOTES TO THE ANNUAL FINANCIAL STATEMENTSfor the year ended 31 March 2014
8.2 Analysis of funds utilised to acquire capital assets – 2012/13
Voted funds
Aid assistance Total
R’000 R’000 R’000
Tangible assets 849 - 849
Machinery and equipment 849 - 849
Intangible assets 1,426 - 1,426
Software 1,426 - 1,426
Total 2,275 - 2,275
9. Unauthorised expenditure
9.1 Reconciliation of unauthorised expenditureNote 2013/14 2012/13
R’000 R’000
Opening balance 4,557 4,557
As restated 4,557 4,557
Less: Amounts approved by Parliament/Legislature with funding (4,557) -
Unauthorised expenditure awaiting authorisation / written off - 4,557
Analysis of awaiting authorisation per economic classification
Current - 4,557
Total - 4,557
9.2 Analysis of unauthorised expenditure awaiting authorisation per economic classification2013/14 2012/13
R’000 R’000
Current 4,557
Total - 4,557
10. Cash and cash equivalentsNote 2013/14 2012/13
R’000 R’000
Consolidated Paymaster General Account 325 -
Cash on hand 5 5
Total 330 5

Northern Cape Office of the Premier Vote 1 | Annual Report for 2013/14 Financial Year
121
NOTES TO THE ANNUAL FINANCIAL STATEMENTSfor the year ended 31 March 2014
11. Prepayments and advancesNote 2013/14 2012/13
R’000 R’000
Staff advances 80 -
Prepayments 506 598
Total 586 598
12. Receivables2013/14 2012/13
R’000 R’000 R’000 R’000 R’000
NoteLess than one year
One to three years
Older than three years Total Total
Claims recoverable 12.1Annex 4
5,373 412 - 5,785 1,204
Staff debt 12.2 798 19 231 1,048 1,037
Total 6,171 431 231 6,833 2,241
12.1 Claims recoverableNote 2013/14 2012/13
12 R’000 R’000
National departments 46 323
Provincial departments 5,498 451
Public entities 148 430
Private enterprises 93 -
Total 5,785 1,204
12.2 Staff debtNote 2013/14 2012/13
12 R’000 R’000
Ex-officials 231 271
Current officials 817 751
Deceased officials - 15
Total 1,048 1,037
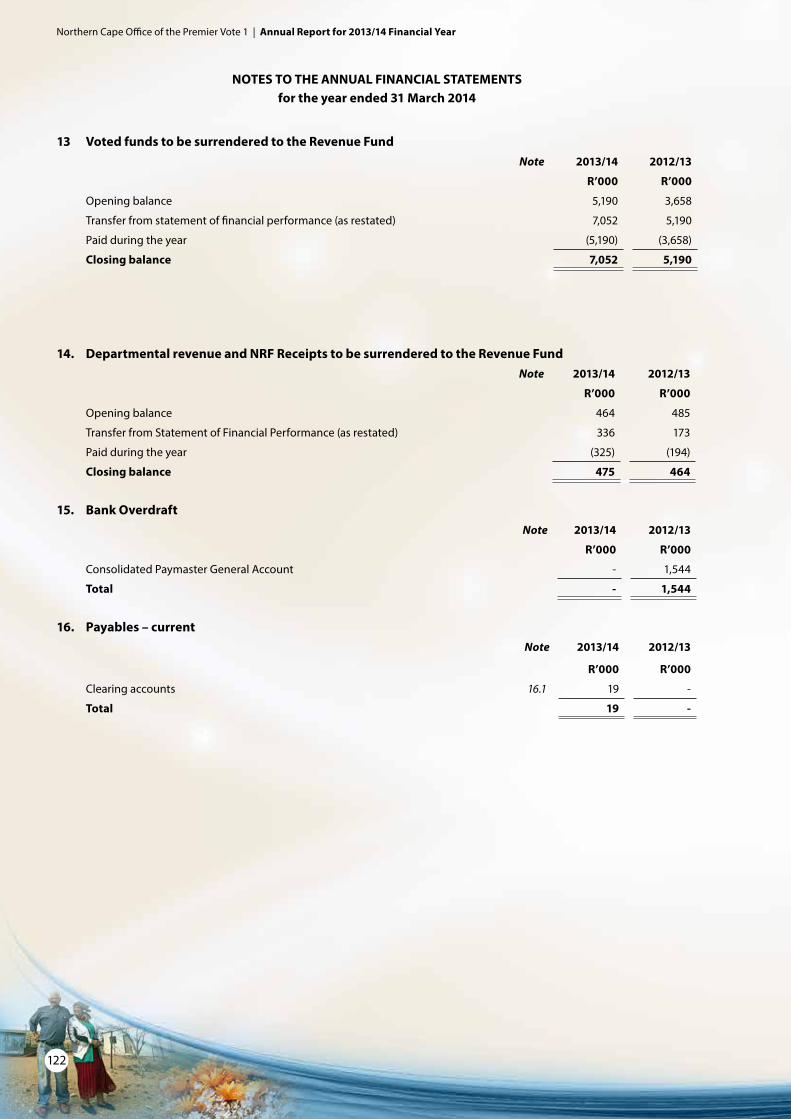
Northern Cape Office of the Premier Vote 1 | Annual Report for 2013/14 Financial Year
122
13 Voted funds to be surrendered to the Revenue FundNote 2013/14 2012/13
R’000 R’000
Opening balance 5,190 3,658
Transfer from statement of financial performance (as restated) 7,052 5,190
Paid during the year (5,190) (3,658)
Closing balance 7,052 5,190
14. Departmental revenue and NRF Receipts to be surrendered to the Revenue FundNote 2013/14 2012/13
R’000 R’000
Opening balance 464 485
Transfer from Statement of Financial Performance (as restated) 336 173
Paid during the year (325) (194)
Closing balance 475 464
15. Bank OverdraftNote 2013/14 2012/13
R’000 R’000
Consolidated Paymaster General Account - 1,544
Total - 1,544
16. Payables – currentNote 2013/14 2012/13
R’000 R’000
Clearing accounts 16.1 19 -
Total 19 -
NOTES TO THE ANNUAL FINANCIAL STATEMENTSfor the year ended 31 March 2014

Northern Cape Office of the Premier Vote 1 | Annual Report for 2013/14 Financial Year
123
NOTES TO THE ANNUAL FINANCIAL STATEMENTSfor the year ended 31 March 2014
16.1 Clearing accountsNote 2013/14 2012/13
16 R’000 R’000
Suspenseaccount–PERSAL 19 -
Total 19 -
17. Net cash flow available from operating activitiesNote 2013/14 2012/13
R’000 R’000
Net surplus/(deficit) as per Statement of Financial Performance 7,388 2,381
Add back non cash/cash movements not deemed operating activities (3,264) (1,210)
(Increase)/decreaseinreceivables–current (4,592) 2,504
(Increase)/decrease in prepayments and advances 12 (598)
(Increase)/decrease in other current assets 4,557 -
Increase/(decrease)inpayables–current 19 (860)
Proceeds from sale of capital assets (200) -
Expenditure on capital assets 2,455 2,275
Surrenders to Revenue Fund (5,515) (3,852)
Surrenders to RDP Fund/Donor - (679)
Net cash flow generated by operating activities 4,124 1,171
18. Reconciliation of cash and cash equivalents for cash flow purposesNote 2013/14 2012/13
R’000 R’000
Consolidated Paymaster General account 325 (1,544)
Cash on hand 5 5
Total 330 (1,539)

Northern Cape Office of the Premier Vote 1 | Annual Report for 2013/14 Financial Year
124
19. Contingent liabilities and contingent assets
19.1 Contingent liabilitiesNote 2013/14 2012/13
R’000 R’000
Liable to Nature
Housing loan guarantees Employees Annex 2A 55 110
Claims against the department Annex 2B 3,609 855
Intergovernmental payables (unconfirmed balances) Annex 4 465 926
Total 4,129 1,891
19.2 Contingent assetsNote 2013/14 2012/13
R’000 R’000
Strike 7 March 2012 Annex 2C - 11
Total - 11
20. CommitmentsNote 2013/14 2012/13
R’000 R’000
Current expenditure
Approved and contracted 20,469 8,163
Capital expenditure
Approved and contracted 444 -
Total Commitments 20,913 8,163
The following commitments (R 5,805) is for longer than 1 year:SAS–R804SITA–R3,813Pro-Activehealthsolutions–R20MPCC’s–R1,168Included in the commitments are contracts awarded to travel agents, car rental agency and also a qualifying vetting agency. The contract values of the three service providers are included at nil values.
DISCLOSURE NOTES TO THE ANNUAL FINANCIAL STATEMENTSfor the year ended 31 March 2014
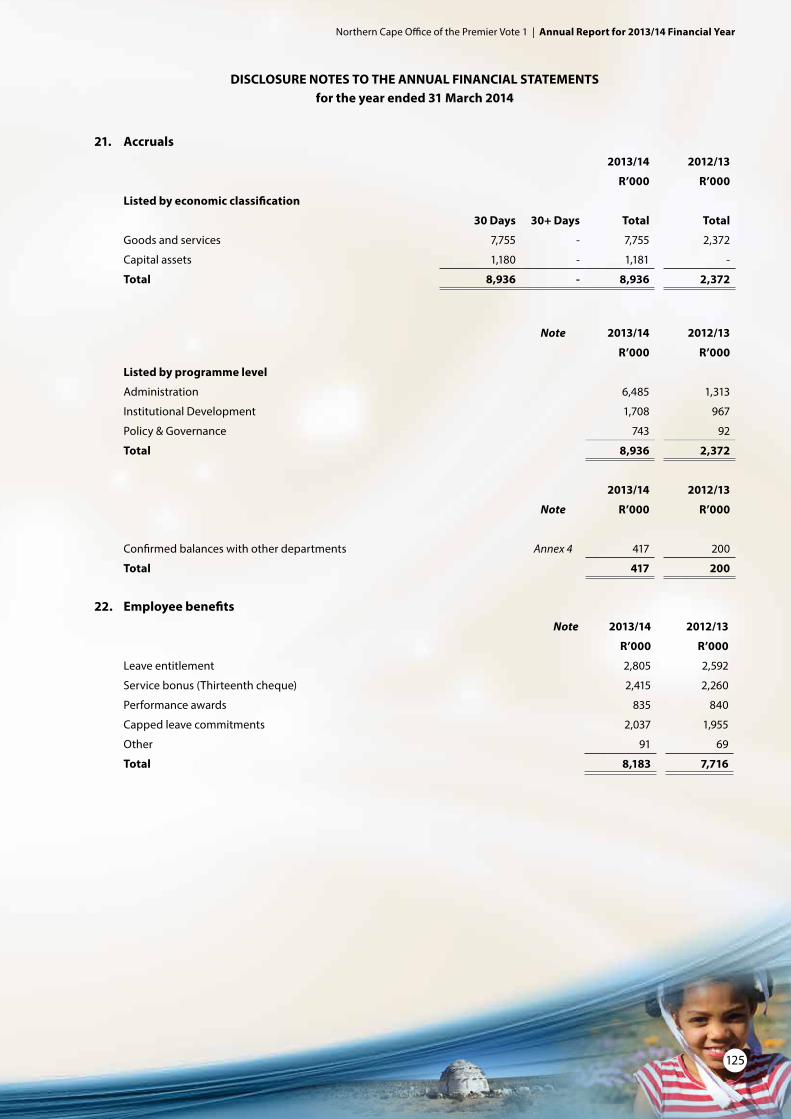
Northern Cape Office of the Premier Vote 1 | Annual Report for 2013/14 Financial Year
125
DISCLOSURE NOTES TO THE ANNUAL FINANCIAL STATEMENTSfor the year ended 31 March 2014
21. Accruals2013/14 2012/13
R’000 R’000
Listed by economic classification
30 Days 30+ Days Total Total
Goods and services 7,755 - 7,755 2,372
Capital assets 1,180 - 1,181 -
Total 8,936 - 8,936 2,372
Note 2013/14 2012/13
R’000 R’000
Listed by programme level
Administration 6,485 1,313
Institutional Development 1,708 967
Policy & Governance 743 92
Total 8,936 2,372
2013/14 2012/13
Note R’000 R’000
Confirmed balances with other departments Annex 4 417 200
Total 417 200
22. Employee benefitsNote 2013/14 2012/13
R’000 R’000
Leave entitlement 2,805 2,592
Service bonus (Thirteenth cheque) 2,415 2,260
Performance awards 835 840
Capped leave commitments 2,037 1,955
Other 91 69
Total 8,183 7,716

Northern Cape Office of the Premier Vote 1 | Annual Report for 2013/14 Financial Year
126
Included in the amounts of leave entitlement and capped leave commitments are negative balances for both years. The negative balances are as follows:
Note 2013/14 2012/13
R’000 R’000
Leave entitlement 266 330
Capped leave commitments 89 126
Total 355 456
23. Lease commitments
23.1 Operating leases expenditure
2013/14
Specialised military
equipment Land
Buildings and other
fixed structures
Machinery and
equipment Total
Not later than 1 year - - 4,804 3,348 8,152
Later than 1 year and not later than 5 years - - - 865 865
Total lease commitments - - 4,804 4,213 9,017
2012/13
Specialised military
equipment Land
Buildings and other
fixed structures
Machinery and
equipment Total
Not later than 1 year - - 7,837 3,897 11,734
Later than 1 year and not later than 5 years - - - 170 170
Total lease commitments - - 7,837 4,067 11,904
23.2 Finance leases expenditure**
2013/14
Specialised military
equipment Land
Buildings and other
fixed structures
Machinery and
equipment
Total
Not later than 1 year - - - 605 605
Later than 1 year and not later than 5 years - - - 553 553
Total lease commitments - - - 1,158 1,158
DISCLOSURE NOTES TO THE ANNUAL FINANCIAL STATEMENTSfor the year ended 31 March 2014
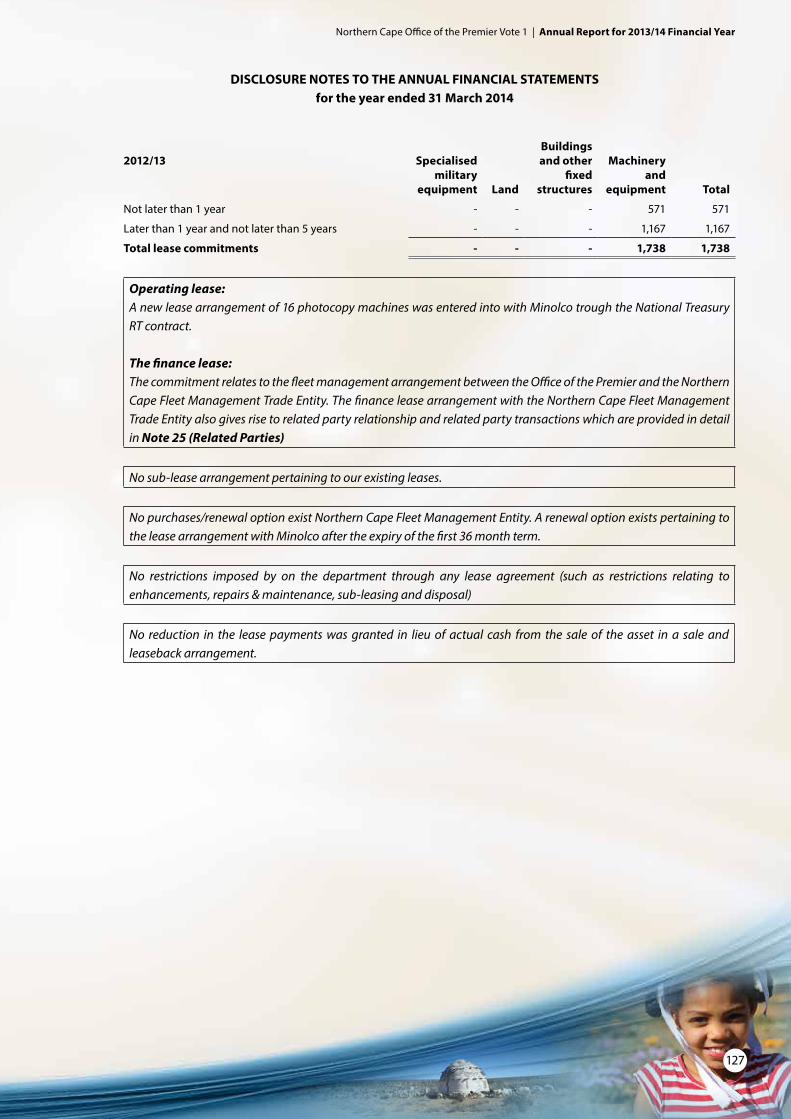
Northern Cape Office of the Premier Vote 1 | Annual Report for 2013/14 Financial Year
127
DISCLOSURE NOTES TO THE ANNUAL FINANCIAL STATEMENTSfor the year ended 31 March 2014
2012/13 Specialised military
equipment Land
Buildings and other
fixed structures
Machinery and
equipment Total
Not later than 1 year - - - 571 571
Later than 1 year and not later than 5 years - - - 1,167 1,167
Total lease commitments - - - 1,738 1,738
Operating lease: A new lease arrangement of 16 photocopy machines was entered into with Minolco trough the National Treasury RT contract.
The finance lease:The commitment relates to the fleet management arrangement between the Office of the Premier and the Northern Cape Fleet Management Trade Entity. The finance lease arrangement with the Northern Cape Fleet Management Trade Entity also gives rise to related party relationship and related party transactions which are provided in detail in Note 25 (Related Parties)
No sub-lease arrangement pertaining to our existing leases.
No purchases/renewal option exist Northern Cape Fleet Management Entity. A renewal option exists pertaining to the lease arrangement with Minolco after the expiry of the first 36 month term.
No restrictions imposed by on the department through any lease agreement (such as restrictions relating to enhancements, repairs & maintenance, sub-leasing and disposal)
No reduction in the lease payments was granted in lieu of actual cash from the sale of the asset in a sale and leaseback arrangement.

Northern Cape Office of the Premier Vote 1 | Annual Report for 2013/14 Financial Year
128
24. Irregular expenditure
24.1 Reconciliation of irregular expenditureNote 2013/14 2012/13
R’000 R’000
Opening balance 15,228 8,550
Add:Irregularexpenditure–relatingtocurrentyear 6,780 6,678
Less: Prior year amounts condoned - -
Irregular expenditure awaiting condonation 22,008 15,228
Analysis of awaiting condonation per age classification
Current year 6,780 6,678
Prior years 15,228 8,550
Total 22,008 15,228
24.2 Details of irregular expenditure – current yearIncident Disciplinary steps taken/criminal proceedings 2013/14
R’000
New original tax clearance certificate not obtained after expiry of validity of an old certificate.
Misconduct case: written warning given 1,500
SCM deviations that did not meet the normal SCM definition.
In various instances where non-compliance was unavoidable, a business case will be made to Accounting Officer/condoning authority regarding context and nature of the circumstances that contributed to the occurrence of the irregular expenditure
5,022
Potentially attributable to split to conform with certain due processes.
None 200
Procurement with deregistered companies
Requested National Treasury to blacklist companies 58
Total 6,780
DISCLOSURE NOTES TO THE ANNUAL FINANCIAL STATEMENTSfor the year ended 31 March 2014

Northern Cape Office of the Premier Vote 1 | Annual Report for 2013/14 Financial Year
129
25. Related party transactions
Transfer Payments made by the Officer of the Premier2013/14 2012/13
R’000 R’000
18,071 17,000
Total 18,071 17,000
Key Management Personnel
Key management personnel were identified as having a related party relationship as they are having significant influence to the reporting entity (Office of the Premier). The aforesaid personnel are responsible for the strategic direction and operational management of the reporting entity. Furthermore, such key management personnel are entrusted with fudiciary responsibility and significant authority over the reporting entity. Due to its qualitative nature, it was decided to disclose that an arm’s length transaction to the value of R 44,528.00 was concluded between the reporting department and a member of its key management personnel. All appropriate due processes were conformed with in this once-off transaction.
Remuneration of key management personnel is as follows:Payments made Note 2013/14 2012/13
R’000 R’000
13,788 13,743
Total 13,788 13,743
Northern Cape Premier’s Education Trust Fund
The primary objective of the Trust Fund is to make higher education opportunities accessible by providing bursary loans to academically and financially deserving students studying on a full time basis at institutions of Higher learning situated in the Republic of South Africa and are registered for the field of study as determined by the trustees.
In terms of the trust deed, the Board of trustees are subject to prior approval by the Premier of the Northern Cape Province, who is a patron to the Northern Cape Premiers Education Trust Fund.Payments made Note 2013/14 2012/13
R’000 R’000
13,504 12,861
Total 13,504 12,861
DISCLOSURE NOTES TO THE ANNUAL FINANCIAL STATEMENTSfor the year ended 31 March 2014

Northern Cape Office of the Premier Vote 1 | Annual Report for 2013/14 Financial Year
130
Mme Re Ka Thusa Trust Fund
The main objective of the fund is to promote the economic empowerment of women in the province through provision of grant allocations to the qualifying beneficiaries. Due to capacity constraints experienced by the Trust, the Office of the Premier assisted the Trust on financial management matters such as Supply Chain Management for 9 months (01 April 2013 to 31 December 2013) for the 2013/14 financial year. Payments made Note 2013/14 2012/13
R’000 R’000
3,948 3,760
Total 3,948 3,760
Northern Cape Fleet Management Trading Entity
In terms of the fleet arrangement with the Northern Cape Fleet Management Trading Entity, the trading entity acquires fleet on behalf of the Provincial Government which it then leases to Provincial Departments. At reporting date, eleven (11) cars were allocated to the Office of the Premier. Payments made to the entity amounts to R 1,027,170.54.
Disclosure relating to other provincial government departments and entities RelatWed party relationship The Office of the Premier has related party relationships with the following provincial departments and provincial
entities due to common control by the Provincial Legislature as follows:
Provincial Departments Agriculture, Land Reform and rural Development Co-operative Governance, Human Settlements and Traditional Affairs Economic Development Education Environment and Nature Conservation Health Northern Cape Provincial Legislature Northern Cape Provincial Treasury Roads and Public Works Social Development Sports, Arts and Culture Transport, Safety and Liaison
DISCLOSURE NOTES TO THE ANNUAL FINANCIAL STATEMENTSfor the year ended 31 March 2014

Northern Cape Office of the Premier Vote 1 | Annual Report for 2013/14 Financial Year
131
Provincial Entities Housing Fund Kalahari Kid Corporation (KKC) McGregor Museum Ngwao Boswa Kapa Bokone Northern Cape Arts and Culture Council Northern Cape Economic Development, Trade and Investment Promotion (NCEDA) Northern Cape Gambling Board Northern Cape Liquor Board Northern Cape Political Party Fund Northern Cape Tourism Authority
Related party transactions There were no related party transactions concluded with the aforementioned related parties other than those
specifically disclosed in separate sub-headings above.
26. Key management personnel
No. of Individuals
2013/14 2012/13
R’000 R’000
Political office bearers (provide detail below) 2 2,214 1,888
Officials:
Level 15 to 16 4 3,757 4,305
Level 14 (incl. CFO if at a lower level) 9 7,817 7,550
Total 13,788 13,743
27. Provisions2013/14 2012/13
R’000 R’000
Groupwise licences - 222
Microsoft licences 214 -
Litigation 1,037 21
Total 1,251 243
DISCLOSURE NOTES TO THE ANNUAL FINANCIAL STATEMENTSfor the year ended 31 March 2014

Northern Cape Office of the Premier Vote 1 | Annual Report for 2013/14 Financial Year
132
27.1 Reconciliation of movement in provisions – 2013/14
Groupwise licences
Litigation Microsoft licences
Total provisions
R’000 R’000 R’000 R’000
Opening balance 222 21 0 243
Provisions raised - 968 214 1,182
Settlement of provision without cost to the department (222) (6) - (228)
Change in provision due to change is estimation inputs - 54 - 54
Closing balance - 1,037 214 1,251
LitigationThis provision relates to legal fees and other probable litigation fees whose obligating events are claims that have been logged against the Office of the Premier at reporting date through its lawyers. These claims are in various stages of the court roll. Accumulated legal knowledge and experience have been used in the estimation of the aforesaid amounts. There is uncertainty on the payment timing of the aforementioned provisions due to certain dependencies such as the court roll etc.
Microsoft licencesThis provision relates to Microsoft licences that were downloaded and used for certain computer equipment during the financial year. The uncertainty pertaining this provision relates to payment timing most probable during the course of the next two financial years.
28. Adjusting events after reporting date
During the post balance sheet period, a final settlement of R 699,334.50 was reached by both affected parties on legal disputes that existed at balance sheet date and was in its final stages of being settled. The settlement was a prudent measure to avoid escalation of costs on the issue.
The impact of the aforementioned post balance sheet event at financial statement level is an upward adjustment of the specific provision on the dispute raised at reporting date to R 699,344.50 to ensure fair presentation. The legal provision that was initially under-provided for at reporting date based on available information at the time. Refer to note 27, Provisions.
DISCLOSURE NOTES TO THE ANNUAL FINANCIAL STATEMENTSfor the year ended 31 March 2014

Northern Cape Office of the Premier Vote 1 | Annual Report for 2013/14 Financial Year
133
2013/14
Nature of event R’000
Upward of legal Adjustment Provision 699
Total 699
29. Movable Tangible Capital Assets
MOVEMENT IN MOVABLE TANGIBLE CAPITAL ASSETS PER ASSET REGISTER FOR THE YEAR ENDED 31 MARCH 2014
Opening balance
Curr Year Adjust-ments
to prior year balances
Additions Disposals Closing Balance
R’000 R’000 R’000 R’000 R’000
MACHINERY AND EQUIPMENT 16,586 1,932 (1,425) 17,093
Transport assets 2,631 - 856 (1,078) 2,409
Computer equipment 7,702 - 510 (347) 7,865
Furniture and office equipment 5,647 - 566 - 6.213
Other machinery and equipment 606 - - - 606
TOTAL MOVABLE TANGIBLE CAPITAL ASSETS 16,586 - 1,932 (1,425) 17,093
A transport asset to the value of R 1,131,017.20 was received by the reporting date and has been accrued accordingly.
DISCLOSURE NOTES TO THE ANNUAL FINANCIAL STATEMENTSfor the year ended 31 March 2014

Northern Cape Office of the Premier Vote 1 | Annual Report for 2013/14 Financial Year
134
29.1 Additions
ADDITIONS TO MOVABLE TANGIBLE CAPITAL ASSETS PER ASSET REGISTER FOR THE YEAR ENDED 31 MARCH 2014
Opening balance
Curr Year Adjust-ments
to prior year balances
Additions Disposals Closing Balance
R’000 R’000 R’000 R’000 R’000
MACHINERY AND EQUIPMENT 2,436 - (504) - 1,932
Transport assets 1,360 - (504) - 856
Computer equipment 510 - - - 510
Furniture and office equipment 566 - - - 566
Other machinery and equipment - - - - -
TOTAL ADDITIONS TO MOVABLE TANGIBLE CAPITAL ASSETS 2,436 - (504) - 1,932
29.2 Disposals
DISPOSALS OF MOVABLE TANGIBLE CAPITAL ASSETS PER ASSET REGISTER FOR THE YEAR ENDED 31 MARCH 2014
Sold for cash
Transfer out or destroyed
or scrapped
Total disposals
Cash Received
Actual
R’000 R’000 R’000 R’000
MACHINERY AND EQUIPMENT - 1,425 1,425 200
Transport assets - 1,078 1,078 200
Computer equipment - 347 347 -
TOTAL DISPOSAL OF MOVABLE TANGIBLE CAPITAL ASSETS - 1,425 1,425 200
DISCLOSURE NOTES TO THE ANNUAL FINANCIAL STATEMENTSfor the year ended 31 March 2014

Northern Cape Office of the Premier Vote 1 | Annual Report for 2013/14 Financial Year
135
DISCLOSURE NOTES TO THE ANNUAL FINANCIAL STATEMENTSfor the year ended 31 March 2014
29.3 Movement for 2012/13Opening balance
Curr Year Adjust-ments
to prior year balances
Additions Disposals Closing Balance
R’000 R’000 R’000 R’000 R’000
MACHINERY AND EQUIPMENT 16,144 - 745 (303) 16,586
Transport assets 2,631 - - - 2,631
Computer equipment 7,480 - 473 (251) 7,702
Furniture and office equipment 5,427 - 272 (52) 5,647
Other machinery and equipment 606 - - - 606
TOTAL MOVABLE TANGIBLE CAPITAL ASSETS 16,144 - 745 (303) 16,586
29.4 Minor assets
MOVEMENT IN MINOR ASSETS PER THE ASSET REGISTER FOR THE YEAR ENDED AS AT 31 MARCH 2014
Specialised military
assets
Intangible assets
Heritage assets
Machinery and
equipment
Biological assets
Total
R’000 R’000 R’000 R’000 R’000 R’000
Opening balance - - - 7,098 - 7,098
Additions - - - 189 - 189
Disposals - - - (117) - (117)
TOTAL MINOR ASSETS - - - 7,170 - 7,170
Specialised military
assets
Intangible assets
Heritage assets
Machinery and
equipment
Biological assets
Total
Number of minor assets at cost - - - 3,804 - 3,804
TOTAL NUMBER OF MINOR ASSETS - - - 3,804 - 3,804

Northern Cape Office of the Premier Vote 1 | Annual Report for 2013/14 Financial Year
136
MOVEMENT IN MINOR ASSETS PER THE ASSET REGISTER FOR THE YEAR ENDED AS AT 31 MARCH 2013
Specialised military
assets
Intangible assets
Heritage assets
Machinery and
equipment
Biological assets
Total
R’000 R’000 R’000 R’000 R’000 R’000
Opening balance - - - 7116 - 7116
Curr Year Adjustments to Prior Year balances
- - - (15) - (15)
Additions - - - 145 - 145
Disposals - - - (148) - (148)
TOTAL MINOR ASSETS - - - 7,098 - 7,098
Specialised military
assets
Intangible assets
Heritage assets
Machinery and
equipment
Biological assets
Total
Number of minor assets at cost - - - 3,782 - 3,782
TOTAL NUMBER OF MINOR ASSETS - - - 3,782 - 3,782
30. Intangible Capital Assets
MOVEMENT IN INTANGIBLE CAPITAL ASSETS PER ASSET REGISTER FOR THE YEAR ENDED 31 MARCH 2014
Opening balance
Current Year Adjust-ments
to prior year balances
Additions Disposals Closing Balance
R’000 R’000 R’000 R’000 R’000
SOFTWARE 15,512 - 19 - 15,531
TOTAL INTANGIBLE CAPITAL ASSETS 15,512 - 19 - 15,531
DISCLOSURE NOTES TO THE ANNUAL FINANCIAL STATEMENTSfor the year ended 31 March 2014

Northern Cape Office of the Premier Vote 1 | Annual Report for 2013/14 Financial Year
137
DISCLOSURE NOTES TO THE ANNUAL FINANCIAL STATEMENTSfor the year ended 31 March 2014
30.1 Additions
ADDITIONS TO INTANGIBLE CAPITAL ASSETS PER ASSET REGISTER FOR THE YEAR ENDED 31 MARCH 2014
Opening balance
Current Year Adjust-ments
to prior year balances
Additions Disposals Closing Balance
R’000 R’000 R’000 R’000 R’000
SOFTWARE 19 - - - 19
TOTAL ADDITIONS TO INTANGIBLE CAPITAL ASSETS 19 - - - 19
30.2 Movement for 2012/13
MOVEMENT IN INTANGIBLE CAPITAL ASSETS PER ASSET REGISTER FOR THE YEAR ENDED 31 MARCH 2013
Opening balance
Current Year Adjust-ments
to prior year balances
Additions Disposals Closing Balance
R’000 R’000 R’000 R’000 R’000
SOFTWARE 14,745 (659) 1,426 - 15,512
TOTAL INTANGIBLE CAPITAL ASSETS 14,745 (659) 1,426 - 15,512

Northern Cape Office of the Premier Vote 1 | Annual Report for 2013/14 Financial Year
138
31. Transfer of functions
With effect from 01 April 2013, Provincial Human Resources Development (HRD) was transferred from Department of Education to the Office of the Premier. The rationale of the aforementioned transfer was to raise the profile of the function to the strategic level of the Office of the Premier which as an apex of provincial government thereby ensuring better coordination of the provincial HRD strategy, refer to Executive Council Resolution 008/2012(02).
• Threeemployeesweretransferredinwithanimpacttotheopeningbalanceoftheemployeebenefitsnote.Refer to note 22 in the annual financial statements.
• ThebudgetrelatingtothetransferredfunctionwasadjustedcentrallythroughtheProvincialTreasurytocoincide with the 2013/14 budget allocation letter. Therefore there is no financial impact of the budget transfer of function in the 2013/14mappropriation statement.
Notes
Note Bal per dept 2012/13
AFS before transfer
Functions per dept
(transferred) / received
Functions per dept
(transferred) / received
Functions per dept
(transferred) / received
2012/13 Bal after transfer
2012/13 2012/13 2012/13 2012/13 2012/13
R’000 R’000 R’000 R’000 R’000
Employee benefits 7,716 116 - - 7,832
DISCLOSURE NOTES TO THE ANNUAL FINANCIAL STATEMENTSfor the year ended 31 March 2014

Northern Cape Office of the Premier Vote 1 | Annual Report for 2013/14 Financial Year
139
ANNEXURES TO THE ANNUAL FINANCIAL STATEMENTSfor the year ended 31 March 2014
ANNEXURE 1ASTATEMENT OF TRANSFERS TO DEPARTMENTAL AGENCIES AND ACCOUNTS
DEPARTMENT/ AGENCY/ ACCOUNT
TRANSFER ALLOCATION TRANSFER 2012/13
AdjustedAppro-
priation
Roll
Overs
Adjust-ments
Total Available
Actual Transfer
% of Available
funds Transferred
Appro-priation
Act
R’000 R’000 R’000 R’000 R’000 % R’000
South African Broadcasting Corporation
3 - - 3 3 100% 2
Public Sector Education & Training Authority
306 - - 306 306 100% -
309 - - 309 309 100% 2
The transfer to Public Sector Education & Training Authority (PSETA) of R 306,000.00 has not been utilised at reporting date. However, a written commitment was received from PSETA indicating that the aforesaid transfer has been committed for discretionary projects that will be rolled out during the 2014/15 financial year.
The R 3,000.00 to South African Broadcasting Corporation relates to licences pertaining to the 2013/14 financial year.

Northern Cape Office of the Premier Vote 1 | Annual Report for 2013/14 Financial Year
140
ANNEXURE 1BSTATEMENT OF TRANSFERS TO NON-PROFIT INSTITUTIONS
NON-PROFIT INSTITUTIONS
TRANSFER ALLOCATION EXPENDITURE 2012/13
AdjustedApprop-riation
Act
Roll
overs
Adjust-ments
Total
Available
Actual Transfer
% of Available
funds transferred
Appro-priation
Act
R’000 R’000 R’000 R’000 R’000 % R’000
Transfers
Premiers Bursary Trust Fund 13,504 - - 13,504 13,504 100% 12,861
Mme Re Ka Thusa Trust Fund 3,948 - - 3,948 3,948 100% 3,760
Total 17,452 - - 17,452 17,452 100% 16,621
ANNEXURES TO THE ANNUAL FINANCIAL STATEMENTSfor the year ended 31 March 2014

Northern Cape Office of the Premier Vote 1 | Annual Report for 2013/14 Financial Year
141
ANNEXURES TO THE ANNUAL FINANCIAL STATEMENTSfor the year ended 31 March 2014
ANNEXURE 1CSTATEMENT OF TRANSFERS TO HOUSEHOLDS
HOUSEHOLDS
TRANSFER ALLOCATION EXPENDITURE 2012/13
AdjustedAppropriation
Act
Roll Overs
Adjust-ments
Total
Available
Actual Transfer
% of Available
funds Transferred
Appro-priation
Act
R’000 R’000 R’000 R’000 R’000 % R’000
Transfers
Leave pay-outs 310 - - 310 310 100% 377
Total 310 - - 310 310 100% 377

Northern Cape Office of the Premier Vote 1 | Annual Report for 2013/14 Financial Year
142
ANNEXURE 1DSTATEMENT OF GIFTS, DONATIONS AND SPONSORSHIPS RECEIVED
NAME OF ORGANISATION NATURE OF GIFT, DONATION OR SPONSORSHIP
2013/14 2012/13
R’000 R’000
Received in cash
ABSA State of the Province Address - 200
De Beers State of the Province Address - 150
Kumba Iron Ore State of the Province Address - 200
Belgorosite TNA Breakfast 3 -
Old Mutual TNA Breakfast 9 -
ABSA TNA Breakfast 89 -
Kumba Iron Ore TNA Breakfast 174 -
ABSA Batho Pele Awards 30 -
Subtotal 305 550
Received in kind
FNB TNA Breakfast 30 -
Standard Bank TNA Breakfast 100 -
Subtotal 130 -
TOTAL 435 550
ANNEXURES TO THE ANNUAL FINANCIAL STATEMENTSfor the year ended 31 March 2014

Northern Cape Office of the Premier Vote 1 | Annual Report for 2013/14 Financial Year
143
ANNEXURE 1ESTATEMENT OF AID ASSISTANCE RECEIVED
NAME OF DONOR PURPOSE
OPENING CLOSING
BALANCE REVENUEEXPENDI-
TURE BALANCE
R’000 R’000 R’000 R’000
Received in cash
FINLAND–INSPIRE INSPIRE Project - 187 (187) -
Subtotal - 187 (187) -
TOTAL - 187 (187) -
ANNEXURES TO THE ANNUAL FINANCIAL STATEMENTSfor the year ended 31 March 2014

Northern Cape Office of the Premier Vote 1 | Annual Report for 2013/14 Financial Year
144
ANNEXURE 1FSTATEMENT OF GIFTS, DONATIONS AND SPONSORSHIPS MADE AND REMMISSIONS, REFUNDS AND PAYMENTS MADE AS AN ACT OF GRACE
NATURE OF GIFT, DONATION OR SPONSORSHIP(Group major categories but list material items including name of organisation
2013/14 2012/13
R’000 R’000
Paid in cash
Gifts, donations and sponsorship made from the Discretionary Fund 393 5
Financial Assistance 65 30
Subtotal 458 35
Made in kind
Gifts, donations and sponsorship made from the Discretionary Fund 1,419 2,204
Corporate gifts 56 90
Social responsibility 332 11
Funeral assistance 59 139
Farewell gifts 8 15
Mothers & Fathers day gifts 34 27
Hospital hampers 5 -
Christmas gifts 9 -
Subtotal 1,922 2,486
TOTAL 2,380 2,521
ANNEXURES TO THE ANNUAL FINANCIAL STATEMENTSfor the year ended 31 March 2014

Northern Cape Office of the Premier Vote 1 | Annual Report for 2013/14 Financial Year
145
AN
NEX
URE
2A
STAT
EMEN
T O
F FI
NA
NCI
AL
GU
ARA
NTE
ES IS
SUED
AS
AT 3
1 M
ARC
H 2
014
– LO
CAL
Gua
rant
or
inst
itut
ion
Gua
rant
ee
in
resp
ect o
f
Ori
gina
l gu
aran
teed
ca
pita
l am
ount
Ope
ning
ba
lanc
e 1
Apr
il 20
13
Gua
rant
ees
draw
dow
nsdu
ring
the
year
Gua
rant
ees
repa
ymen
ts/
canc
elle
d/
redu
ced/
re
leas
ed
duri
ng th
e ye
ar
Reva
luat
ions
Clos
ing
bala
nce
31 M
arch
20
14
Gua
rant
eed
inte
rest
for
year
end
ed
31 M
arch
20
14
Real
ised
lo
sses
not
re
cove
rabl
e i.e
. cla
ims
paid
out
R’00
0R’
000
R’00
0R’
000
R’00
0R’
000
R’00
0R’
000
Hou
sing
Ned
bank
-55
--
-55
--
Ned
cor
-41
-41
--
--
FNB
-14
-14
--
--
Subt
otal
-11
0-
55-
55-
-
TOTA
L-
110
-55
-55
--
ANNEXURES TO THE ANNUAL FINANCIAL STATEMENTSfor the year ended 31 March 2014

Northern Cape Office of the Premier Vote 1 | Annual Report for 2013/14 Financial Year
146
ANNEXURE 2BSTATEMENT OF CONTINGENT LIABILITIES AS AT 31 MARCH 20ZZ
Nature of Liability
Liabilities incurred
during the year
Liabilities paid/
cancelled/reduced
during the year
Liabilities recoverable
(Provide details
hereunder)
Opening Closing
Balance Balance
1 April 2013 31 March 2014
R’000 R’000 R’000 R’000 R’000
Claims against the department
Damages 855 2,904 (150) - 3,609
Subtotal 855 2,904 (150) - 3,609
TOTAL 855 2,904 (150) - 3,609
ANNEXURES TO THE ANNUAL FINANCIAL STATEMENTSfor the year ended 31 March 2014

Northern Cape Office of the Premier Vote 1 | Annual Report for 2013/14 Financial Year
147
ANNEXURE 2CSTATEMENT OF CONTINGENT ASSET AS AT 31 MARCH 2014
Nature of Liability
Assets incurred
during the year
Assets paid/cancelled/
reduced during the
year
Assets recoverable
(Provide details
hereunder)
Opening Closing
Balance Balance
1 April 201331 March
2014
R’000 R’000 R’000 R’000 R’000
Claims against the department
Salaries potentially recoverable 11 - 11 - -
Subtotal 11 - 11 - -
TOTAL 11 - 11 - -
ANNEXURES TO THE ANNUAL FINANCIAL STATEMENTSfor the year ended 31 March 2014

Northern Cape Office of the Premier Vote 1 | Annual Report for 2013/14 Financial Year
148
ANNEXURE 3CLAIMES RECOVERABLE
Government Entity
Confirmed balance outstanding
Unconfirmed balance outstanding Total
31/03/2014 31/03/2013 31/03/2014 31/03/2013 31/03/2014 31/03/2013
R’000 R’000 R’000 R’000 R’000 R’000
Department
Agriculture - - 313 - 313 -
CoGHSTA 391 16 - - 391 16
Economic Development 313 - - - 313 -
Education 76 - 313 - 389 -
Environment & Nature Conservation 355 - - - 355 -
Health - - 1,234 - 1,234 -
Roads & Public Works 397 - 396 264 793 264
Social Development - - 313 - 313 -
Sports Arts & Culture - - 313 - 313 -
Transport, Safety & Liaison - - 313 - 313 -
Treasury 130 171 643 - 773 171
Foreign Affairs - 197 - 126 - 323
Rural Development - - 46 - 46 -
1,662 384 3,884 390 5,546 774
Other Government Entities
NYDA - - 148 146 148 146
NCEDA - - - 284 - 284
MSCC - - 89 - 89 -
Lefatshe - - 2 - 2 -
- - 239 430 239 430
TOTAL 1,662 384 4,123 820 5,785 1,204
ANNEXURES TO THE ANNUAL FINANCIAL STATEMENTSfor the year ended 31 March 2014

Northern Cape Office of the Premier Vote 1 | Annual Report for 2013/14 Financial Year
149
ANNEXURE 4INTER-GOVERNMENT PAYABLES
GOVERNMENT ENTITY
Confirmed balance outstanding
Unconfirmed balance outstanding TOTAL
31/03/2014 31/03/2013 31/03/2014 31/03/2013 31/03/2014 31/03/2013
R’000 R’000 R’000 R’000 R’000 R’000
DEPARTMENTS
Current
Roads & Public Works 193 - 142 142 335 142
Legislature - - 2 9 2 9
Treasury - - 136 135 136 135
Environmental Affairs 33 - 20 135 53 135
Economic Development - - 126 126 126 126
SAPS - 32 - - - 32
Labour - - - 75 - 75
PALAMA - - - 284 - 284
Justice 191 168 39 20 230 188
Subtotal 417 200 465 926 882 1,126
Total 417 200 465 926 882 1,126
ANNEXURES TO THE ANNUAL FINANCIAL STATEMENTSfor the year ended 31 March 2014
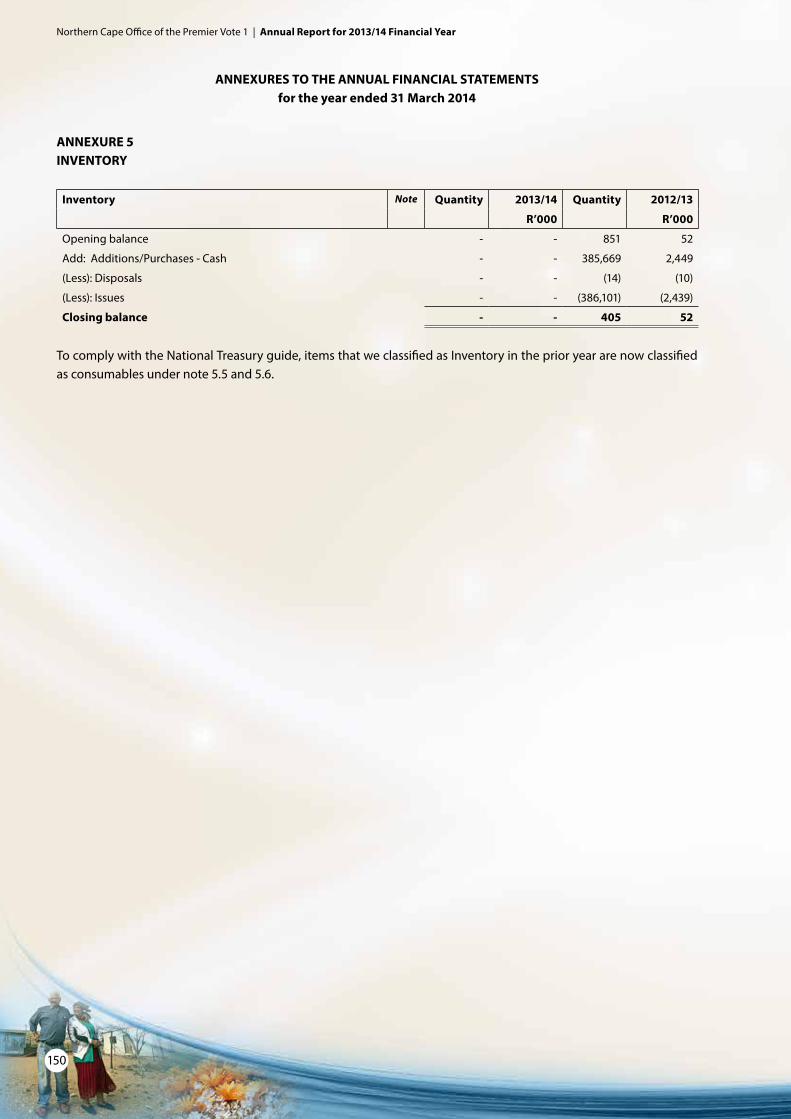
Northern Cape Office of the Premier Vote 1 | Annual Report for 2013/14 Financial Year
150
ANNEXURE 5INVENTORY
Inventory Note Quantity 2013/14 Quantity 2012/13
R’000 R’000
Opening balance - - 851 52
Add: Additions/Purchases - Cash - - 385,669 2,449
(Less): Disposals - - (14) (10)
(Less): Issues - - (386,101) (2,439)
Closing balance - - 405 52
To comply with the National Treasury guide, items that we classified as Inventory in the prior year are now classified as consumables under note 5.5 and 5.6.
ANNEXURES TO THE ANNUAL FINANCIAL STATEMENTSfor the year ended 31 March 2014

Northern Cape Office of the Premier Vote 1 | Annual Report for 2013/14 Financial Year
151
Notes

Northern Cape Office of the Premier Vote 1 | Annual Report for 2013/14 Financial Year
152
Notes