Embed Size (px)
Citation preview

INTERNATIONAL MONETARY FUND
Offshore Financial Centers Report on the Assessment Program and Proposal for Integration with the Financial
Sector Assessment Program
Supplementary Information
Prepared by the Monetary and Capital Markets Department (In consultation with Other Departments)
Approved by Jaime Caruana
May 8, 2008
Contents Page
Information Framework Initiative .............................................................................................2 A. Monitoring ................................................................................................................2 B. Transparency .............................................................................................................4 C. Data Issues ................................................................................................................5 D. Next Steps .................................................................................................................6
Tables 1. Status of Participation in the Information Framework Initiative...........................................7 2. Banking Sector Indicators (2004-2006).................................................................................8 3. Banking: External Assets and Loans (end-2006) OFCs and Selected Advanced Economies9 4. Banking: External Liabilities and Deposits (end-2006) OFCs and Selected Advanced Economies.........................................................................................................................10 5. Banking Sector External Assets (2004-2006)......................................................................11 6. Banking Sector External Liabilities (2004-2006)................................................................12 7. Number of Insurance Companies (2004-2006)....................................................................13 8. Number of Insurance Branches (2004-2006).......................................................................14 9. Gross Premiums of Insurance Companies (2004-2006) ......................................................15 10. Gross Premiums of Insurance Branches (2004-2006) .......................................................16 11. Collective Investment Schemes (CIS) Incorporated (Registered) in the Jurisdiction (2004-2006) .....................................................................................................................17 12. Collective Investment Schemes (CIS) Managed in the Jurisdiction (2004-2006) ............18 13. Other Financial Sector Indicators (2004-2006) .................................................................19 Figures 1. Banking Sector (end 2006) ..................................................................................................20 2. Geographical Distribution of Banks' Cross-Border Assets and Liabilities of Reporting Jurisdictions (2006)..........................................................................................................21 3. Insurance and Collective Investment Schemes Sectors (end 2006) ....................................22 4. Other Sectors (end 2006) .....................................................................................................23
2
INFORMATION FRAMEWORK INITIATIVE
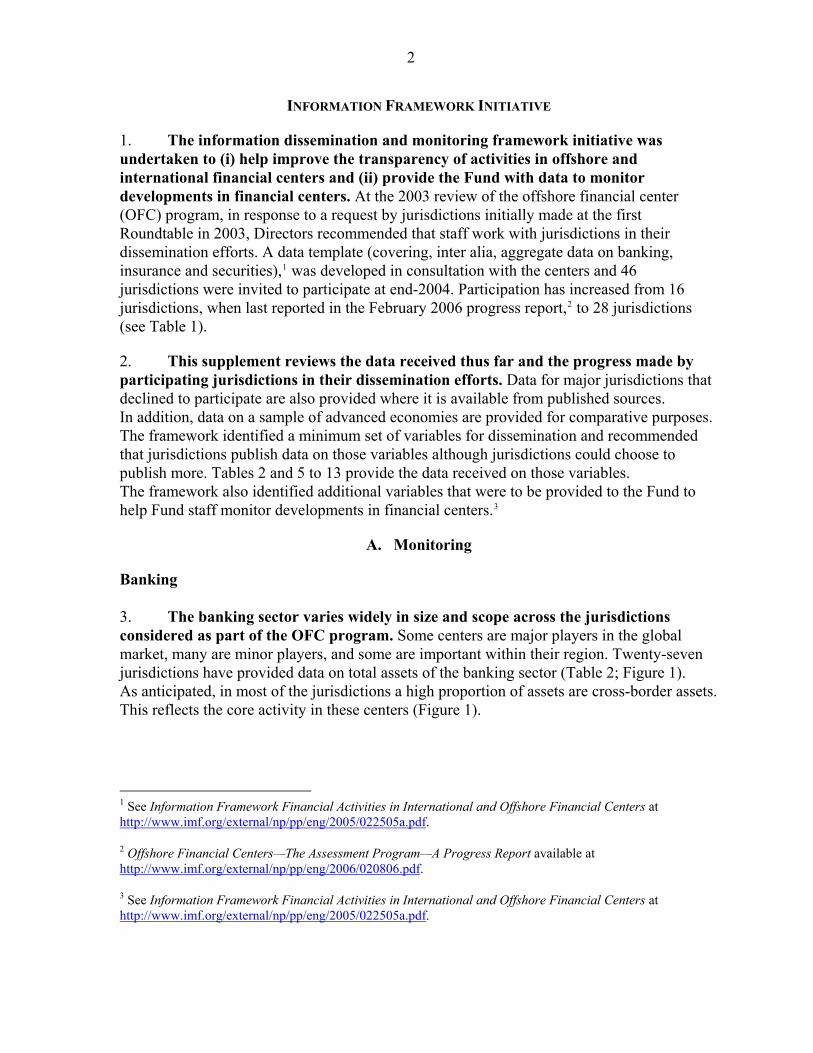
1. The information dissemination and monitoring framework initiative was undertaken to (i) help improve the transparency of activities in offshore and international financial centers and (ii) provide the Fund with data to monitor developments in financial centers. At the 2003 review of the offshore financial center (OFC) program, in response to a request by jurisdictions initially made at the first Roundtable in 2003, Directors recommended that staff work with jurisdictions in their dissemination efforts. A data template (covering, inter alia, aggregate data on banking, insurance and securities),1 was developed in consultation with the centers and 46 jurisdictions were invited to participate at end-2004. Participation has increased from 16 jurisdictions, when last reported in the February 2006 progress report,2 to 28 jurisdictions (see Table 1).
2. This supplement reviews the data received thus far and the progress made by participating jurisdictions in their dissemination efforts. Data for major jurisdictions that declined to participate are also provided where it is available from published sources. In addition, data on a sample of advanced economies are provided for comparative purposes. The framework identified a minimum set of variables for dissemination and recommended that jurisdictions publish data on those variables although jurisdictions could choose to publish more. Tables 2 and 5 to 13 provide the data received on those variables. The framework also identified additional variables that were to be provided to the Fund to help Fund staff monitor developments in financial centers.3
A. Monitoring
Banking 3. The banking sector varies widely in size and scope across the jurisdictions considered as part of the OFC program. Some centers are major players in the global market, many are minor players, and some are important within their region. Twenty-seven jurisdictions have provided data on total assets of the banking sector (Table 2; Figure 1). As anticipated, in most of the jurisdictions a high proportion of assets are cross-border assets. This reflects the core activity in these centers (Figure 1).
1 See Information Framework Financial Activities in International and Offshore Financial Centers at http://www.imf.org/external/np/pp/eng/2005/022505a.pdf.
2 Offshore Financial Centers—The Assessment Program—A Progress Report available at http://www.imf.org/external/np/pp/eng/2006/020806.pdf.
3 See Information Framework Financial Activities in International and Offshore Financial Centers at http://www.imf.org/external/np/pp/eng/2005/022505a.pdf.

3
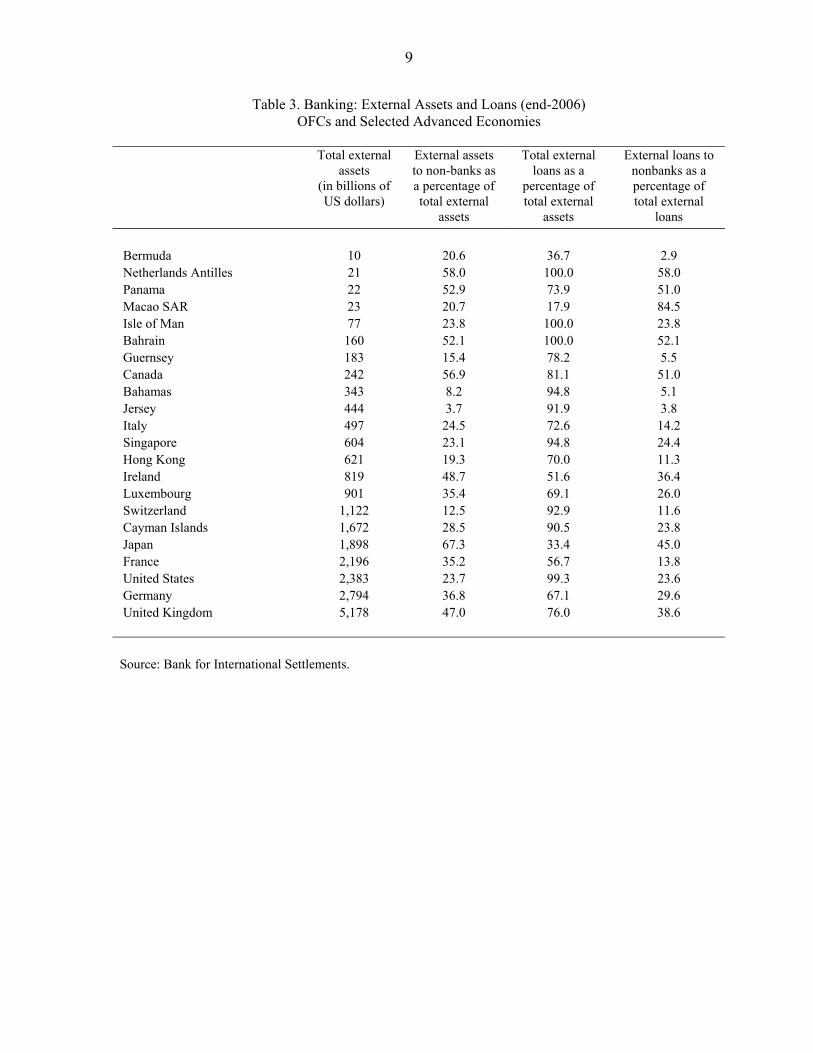
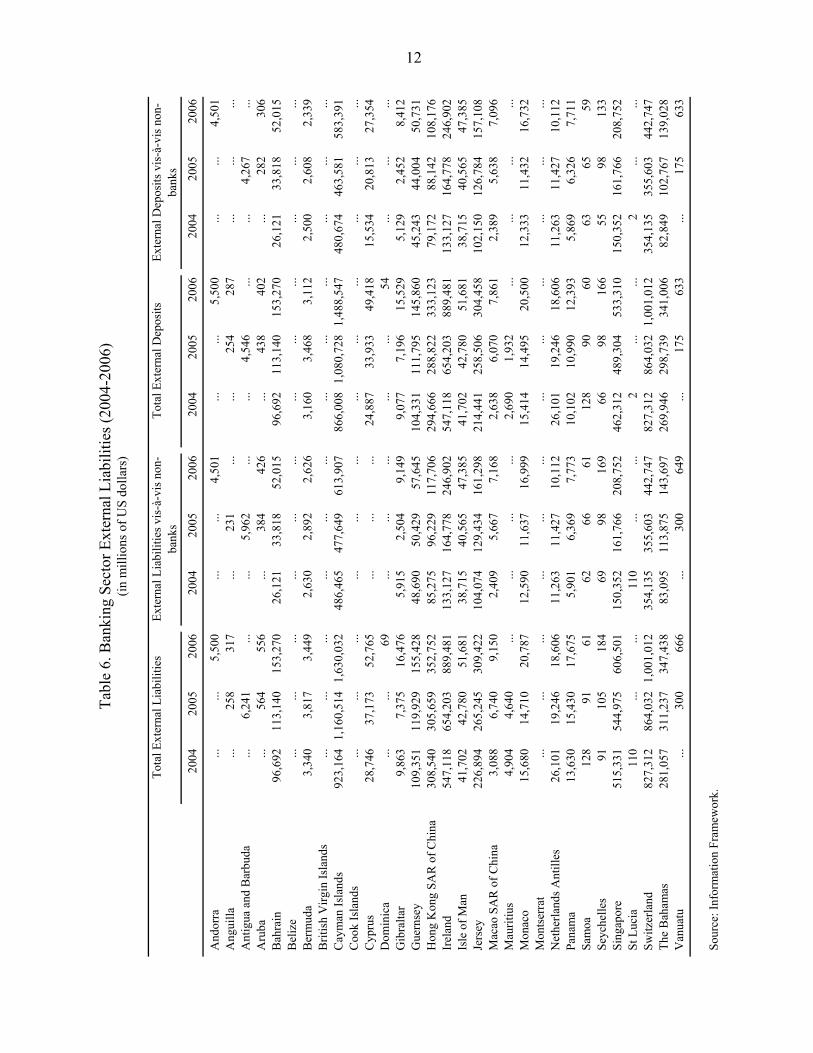
4. In general, offshore banks deal mostly with other banks. Tables 3–6 show the proportion and value of external nonbank assets and liabilities in OFCs. Most banks deal with banks on both sides of their balance sheets, with only a few having a relatively large exposure to the nonbank sector. Generally, centers have less than 30 percent of their external assets placed with nonbanks and only three centers have as much as 50 percent of their external assets placed with nonbanks. External nonbank liabilities range from 30 to 90 percent of total external liabilities.
5. There is a pronounced regional bias in the direction of funds to and from these centers. As shown in Figure 2, the European offshore centers gather funds from the rest of Europe and channel them to institutions in Europe. Similar patterns emerge in Asian and Western Hemisphere centers. OFCs do most of their business with the major markets in their regions (U.K. for Europe, Japan for Asia, and the U.S. for Western Hemisphere). Major financial markets account for a significant share of the claims and liabilities of offshore banks located in their respective regions.
6. For many offshore banks the provision of investment or fiduciary services are an important activity. Banks provide a range of services related to wealth or asset management. In some cases fiduciary deposits include those from parent banks. Eighteen participants reported data on fees and commission as a percent of gross income. The average was 23 percent with the highest being 56 percent. Twelve jurisdictions reported data on assets under management. For three of these jurisdictions, such assets were larger than their on-balance sheet assets.
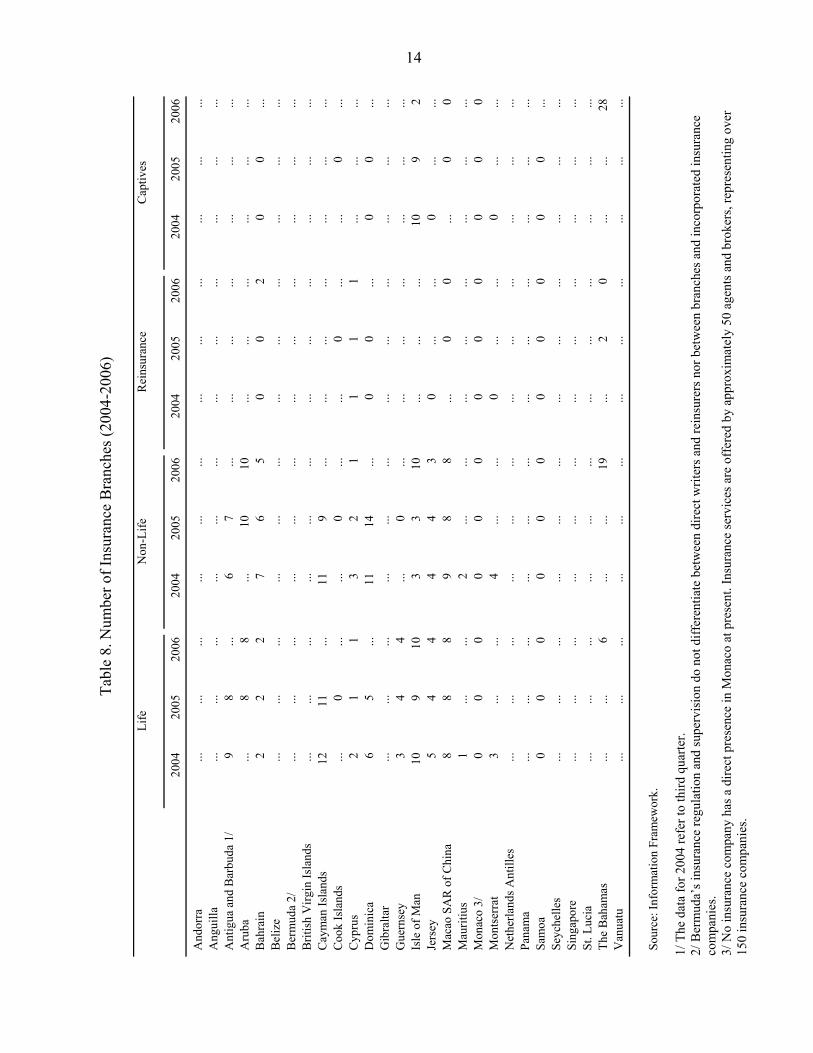
Insurance 7. The insurance industry reflects almost as wide a range in size of activity as the banking sector, with one exception. Bermuda, one of the largest centers for reinsurance business in the world, accounts for the bulk of insurance business conducted in OFCs. While some other centers also play a significant role in the global market, several small centers have only limited activity and a small volume of business relative to the major players (Figure 3; Tables 7–10).
8. Captives4 and reinsurance companies dominate the insurance business in OFCs. The growth in captives and reinsurance was in part facilitated by the regulatory and legal framework put in place by the centers. Indeed, captive insurance was initially established as a significant business activity in offshore jurisdictions. Reinsurance companies based in OFCs (primarily in Bermuda) share many of the characteristics of those in onshore jurisdictions. However, there is one key difference—catastrophe reinsurance is the dominant line of business. Onshore companies seem to have a more diversified business mix, and a more balanced mixture of long and short-term liabilities. Catastrophe insurers hold relatively large
4 Defined by the IAIS (Glossary of Terms, February 2005) as “an insurance company established by a parent firm for the purpose of insuring the exposures of the parent or its affiliates”.
4
amounts of capital to meet sudden large outflows of cash. One of the advantages of OFCs in this area appears to be the speed with which they can authorize the deployment of new capital in additional insurance capacity (new companies). Bermuda illustrates that, as in banking, geography is important—the reinsurance business was launched there in response to a shortage of US liability insurance in the mid-1980s, and at end-2005, three quarters of captives’ gross premiums were sourced from North American companies, indicating that most captives were established by North American companies.
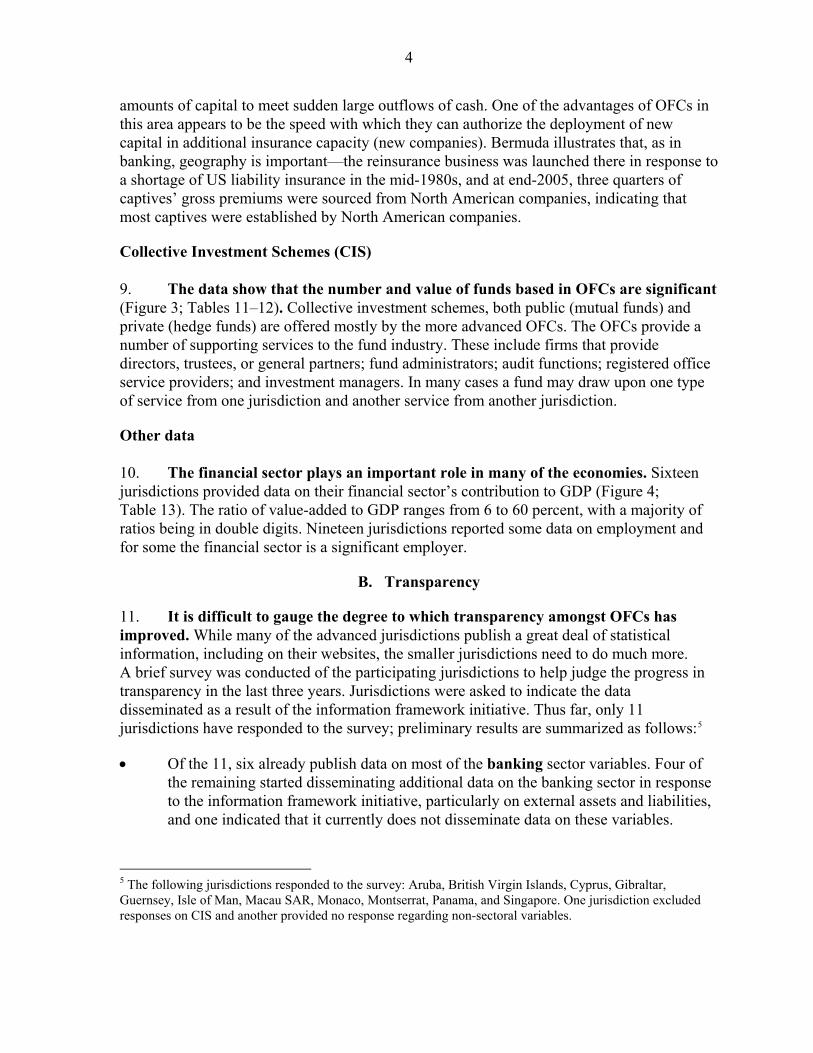
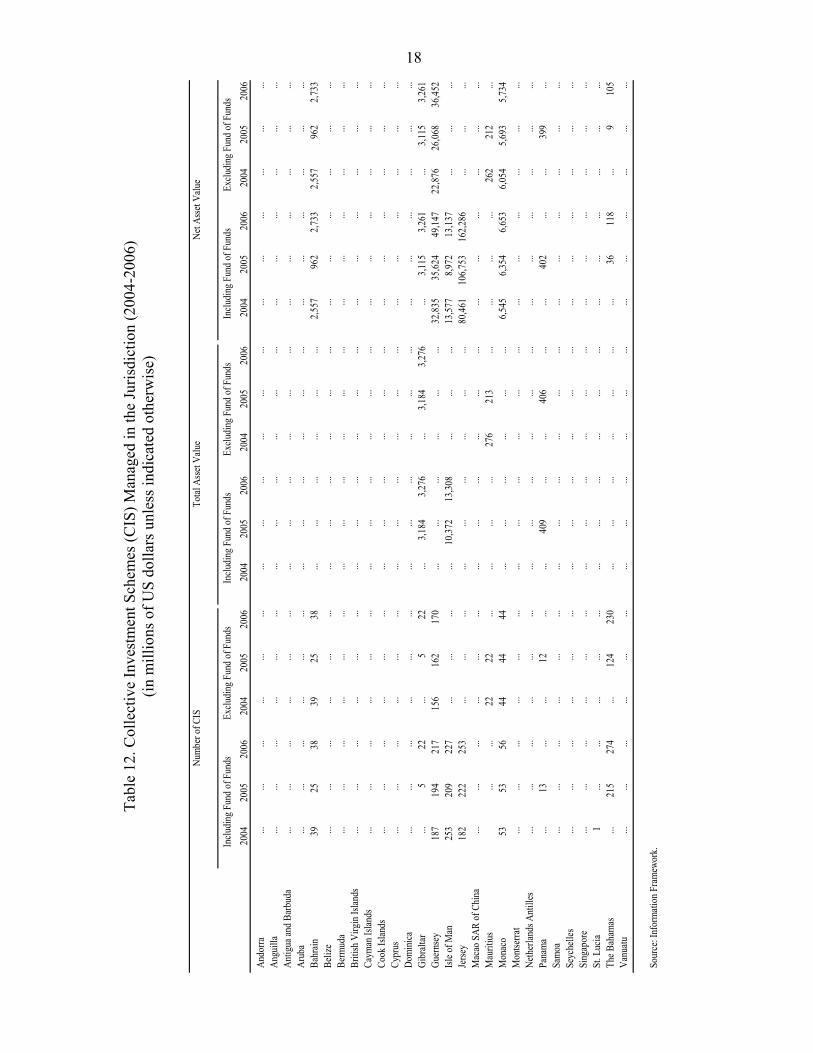
Collective Investment Schemes (CIS) 9. The data show that the number and value of funds based in OFCs are significant (Figure 3; Tables 11–12). Collective investment schemes, both public (mutual funds) and private (hedge funds) are offered mostly by the more advanced OFCs. The OFCs provide a number of supporting services to the fund industry. These include firms that provide directors, trustees, or general partners; fund administrators; audit functions; registered office service providers; and investment managers. In many cases a fund may draw upon one type of service from one jurisdiction and another service from another jurisdiction.
Other data 10. The financial sector plays an important role in many of the economies. Sixteen jurisdictions provided data on their financial sector’s contribution to GDP (Figure 4; Table 13). The ratio of value-added to GDP ranges from 6 to 60 percent, with a majority of ratios being in double digits. Nineteen jurisdictions reported some data on employment and for some the financial sector is a significant employer.
B. Transparency
11. It is difficult to gauge the degree to which transparency amongst OFCs has improved. While many of the advanced jurisdictions publish a great deal of statistical information, including on their websites, the smaller jurisdictions need to do much more. A brief survey was conducted of the participating jurisdictions to help judge the progress in transparency in the last three years. Jurisdictions were asked to indicate the data disseminated as a result of the information framework initiative. Thus far, only 11 jurisdictions have responded to the survey; preliminary results are summarized as follows:5
• Of the 11, six already publish data on most of the banking sector variables. Four of the remaining started disseminating additional data on the banking sector in response to the information framework initiative, particularly on external assets and liabilities, and one indicated that it currently does not disseminate data on these variables.
5 The following jurisdictions responded to the survey: Aruba, British Virgin Islands, Cyprus, Gibraltar, Guernsey, Isle of Man, Macau SAR, Monaco, Montserrat, Panama, and Singapore. One jurisdiction excluded responses on CIS and another provided no response regarding non-sectoral variables.
5
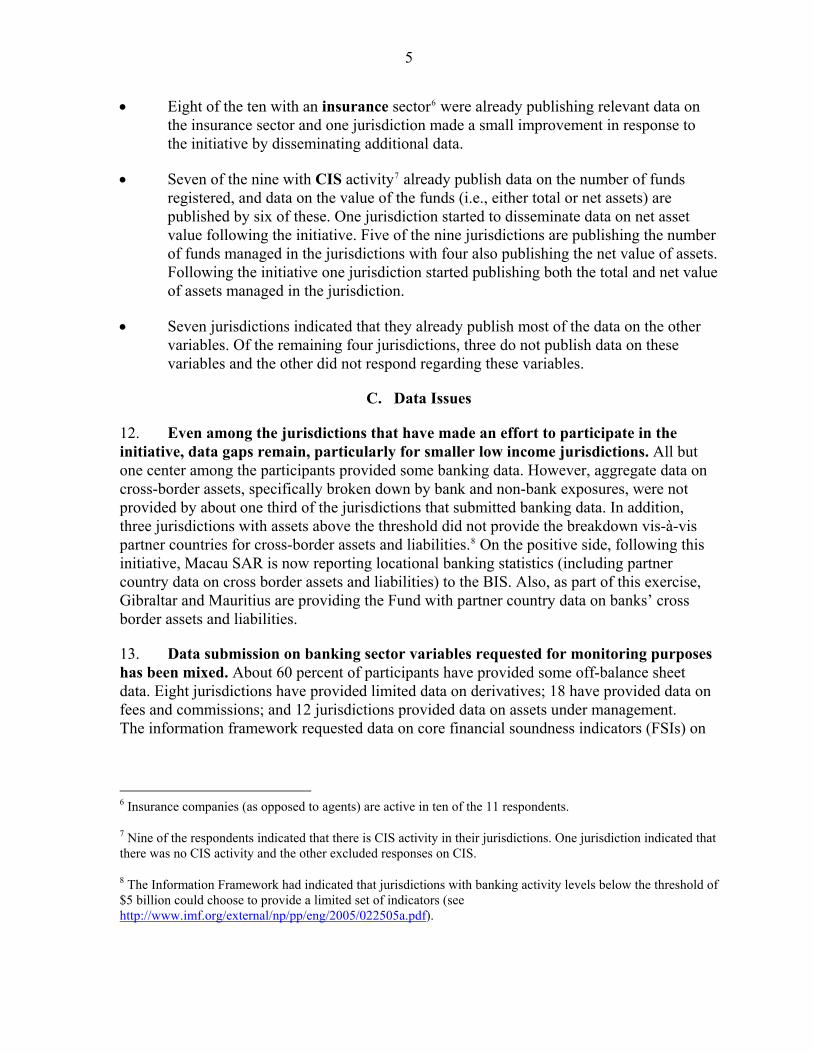
• Eight of the ten with an insurance sector6 were already publishing relevant data on the insurance sector and one jurisdiction made a small improvement in response to the initiative by disseminating additional data.
• Seven of the nine with CIS activity7 already publish data on the number of funds registered, and data on the value of the funds (i.e., either total or net assets) are published by six of these. One jurisdiction started to disseminate data on net asset value following the initiative. Five of the nine jurisdictions are publishing the number of funds managed in the jurisdictions with four also publishing the net value of assets. Following the initiative one jurisdiction started publishing both the total and net value of assets managed in the jurisdiction.
• Seven jurisdictions indicated that they already publish most of the data on the other variables. Of the remaining four jurisdictions, three do not publish data on these variables and the other did not respond regarding these variables.
C. Data Issues
12. Even among the jurisdictions that have made an effort to participate in the initiative, data gaps remain, particularly for smaller low income jurisdictions. All but one center among the participants provided some banking data. However, aggregate data on cross-border assets, specifically broken down by bank and non-bank exposures, were not provided by about one third of the jurisdictions that submitted banking data. In addition, three jurisdictions with assets above the threshold did not provide the breakdown vis-à-vis partner countries for cross-border assets and liabilities.8 On the positive side, following this initiative, Macau SAR is now reporting locational banking statistics (including partner country data on cross border assets and liabilities) to the BIS. Also, as part of this exercise, Gibraltar and Mauritius are providing the Fund with partner country data on banks’ cross border assets and liabilities.
13. Data submission on banking sector variables requested for monitoring purposes has been mixed. About 60 percent of participants have provided some off-balance sheet data. Eight jurisdictions have provided limited data on derivatives; 18 have provided data on fees and commissions; and 12 jurisdictions provided data on assets under management. The information framework requested data on core financial soundness indicators (FSIs) on
6 Insurance companies (as opposed to agents) are active in ten of the 11 respondents.
7 Nine of the respondents indicated that there is CIS activity in their jurisdictions. One jurisdiction indicated that there was no CIS activity and the other excluded responses on CIS.
8 The Information Framework had indicated that jurisdictions with banking activity levels below the threshold of $5 billion could choose to provide a limited set of indicators (see http://www.imf.org/external/np/pp/eng/2005/022505a.pdf).
6
an optional basis. Eighteen of the 27 jurisdictions who provided banking sector data provided data on FSIs.9
14. Data gaps on insurance sector and CIS are somewhat greater than in the banking sector. In part this could be because many small jurisdictions do not offer offshore insurance services and/or CIS, but did not report this explicitly. Twenty jurisdictions provided data on gross premiums in the insurance sector, while 13 jurisdictions provided data on net asset value of CIS. In addition, 10 jurisdictions provided separate data on assets of private CIS (hedge funds) and public CIS (mutual funds). Following the implementation of this initiative, the Cayman Islands has initiated measures to collect and compile data on CIS.
D. Next Steps
15. Consistent with the recommendations in the main paper, the Information Framework Initiative would continue with the integration of the OFC program with the Financial Sector Assessment Program (FSAP). The initiative would focus, in particular, on jurisdictions that do not receive Article IV consultations. Of these, only one jurisdiction active in offshore business (Turks and Caicos Islands) is yet to commit to participate (Table 1).10 Staff will follow-up with jurisdictions to improve the coverage of data being submitted and to encourage jurisdictions to improve data collection and dissemination.
9 Only two of these jurisdictions also participated in the wider Coordinated Compilation Exercise for FSIs.
10 The other two which do not receive Article IV consultations and which have either declined or not committed to participate, Niue and Nauru, no longer have offshore financial business.

7
Table 1. Status of Participation in the Information Framework Initiative
Jurisdictions that have submitted data
Jurisdictions that have committed or indicated intent to participate but not
yet submitted data Jurisdictions that have yet to
confirm participation Jurisdictions that have declined to participate
Article IV Antigua & Barbuda Barbados Grenada Costa Rica Aruba Marshall Islands Hong Kong SAR 1/ Bahamas, The Palau Ireland 1/ Bahrain St. Kitts & Nevis Lebanon Belize St. Vincent and the Grenadines Luxembourg Cyprus Malaysia (Labuan) Malta Dominica Switzerland 1/ Mauritius Netherlands Antilles Panama Samoa Seychelles Singapore St. Lucia Vanuatu
Non-Article IV 2/ Andorra Liechtenstein Nauru Niue Anguilla Turks and Caicos Islands Bermuda British Virgin Islands Cayman Islands Cook Islands Gibraltar Guernsey Isle of Man Jersey Macao SAR Monaco Montserrat
Total
28 7 3 8
1/ These jurisdictions, while declining to participate in the initiative, have authorized the Bank for International Settlements (BIS) to forward data on banks' external assets/liabilities to the Fund. 2/ Excepting Andorra, Monaco, Nauru, and Liechtenstein, these jurisdictions are Fund members, and member territories or dependencies but do not currently receive Article IV consultations.

Tabl
e 2.
Ban
king
Sec
tor I
ndic
ator
s (20
04-2
006)
(i
n m
illio
ns o
f US
dolla
rs u
nles
s ind
icat
ed o
ther
wis
e)
2004
2005
2006
2004
2005
2006
2004
2005
2006
2004
2005
2006
And
orra
......
7...
...16
,324
......
12,8
99...
...13
,426
Ang
uilla
...3
......
282
317
...19
925
2...
254
287
Ant
igua
and
Bar
buda
1/
16...
...4,
160
6,71
8...
386
727
...3,
557
4,54
6...
Aru
ba...
66
...2,
610
2,26
3...
1,45
51,
397
...1,
861
1,82
4B
ahra
in
111
103
102
135,
882
166,
964
209,
673
50,8
1291
,862
116,
802
65,4
3713
2,69
416
4,34
3B
eliz
e13
......
976
......
697
......
747
......
Ber
mud
a4
55
20,4
8922
,371
16,3
945,
498
5,89
05,
398
18,2
7619
,586
4,09
8B
ritis
h V
irgin
Isla
nds
...9
9...
2,52
32,
150
...99
41,
248
...2,
207
1,76
5C
aym
an Is
land
s32
230
127
71,
227,
804
1,24
4,47
21,
646,
141
447,
636
469,
554
725,
754
1,03
9,75
41,
093,
943
1,46
9,91
0C
ook
Isla
nds
......
......
......
......
......
......
Cyp
rus
4042
4051
,855
60,8
3884
,413
35,8
3545
,377
54,6
0640
,474
47,7
9156
,851
Dom
inic
a...
67
...39
846
0...
186
223
...33
538
7G
ibra
ltar
1818
189,
863
11,8
8716
,496
9,39
411
,287
15,5
609,
077
10,6
8415
,459
Gue
rnse
y54
5050
143,
601
150,
364
197,
003
10,4
2710
,284
11,0
9813
4,93
613
8,75
518
0,87
7Is
le o
f Man
5551
4893
,989
97,7
9411
5,15
813
,247
12,7
4817
,044
89,2
2292
,881
109,
922
Jers
ey51
4746
397,
322
419,
097
542,
295
347,
105
356,
145
453,
491
304,
691
317,
362
371,
643
Mac
ao S
AR
of C
hina
2326
2719
,487
27,0
5334
,157
...8,
567
10,2
15...
23,6
0629
,637
Mau
ritiu
s20
19...
14,3
0314
,541
...6,
449
6,93
8...
10,0
5310
,053
...M
onac
o31
2728
24,8
9425
,097
33,0
8019
,673
21,0
4927
,435
22,9
9623
,359
30,8
11M
onts
erra
t13
......
1,02
2...
...61
8...
...80
5...
...N
ethe
rland
s Ant
illes
......
......
34,0
55...
...10
,996
......
23,1
92...
Pana
ma
...70
77...
38,6
5245
,101
...22
,858
26,4
41...
27,0
7931
,945
Sam
oa
89
614
211
274
126
9664
128
9059
Seyc
helle
s6
66
973
1,06
21,
228
245
281
284
825
876
1,03
9Si
ngap
ore
...11
010
879
0,63
475
6,33
088
7,47
563
1,86
559
9,61
769
1,16
969
6,73
766
1,19
676
5,75
4St
. Luc
ia5
......
139
......
5...
...2
......
The
Bah
amas
...14
512
4...
422,
538
467,
263
...40
,211
65,0
94...
348,
838
312,
364
Van
uatu
...9
9...
789
1,32
6...
326
310
...58
094
4
Sour
ce: I
nfor
mat
ion
Fram
ewor
k.
1/ T
he d
ata
for 2
004
refe
r to
third
qua
rter.
Tota
l Ass
ets
Tota
l Loa
nsTo
tal D
epos
itsN
umbe
r of B
anks
8
9
Table 3. Banking: External Assets and Loans (end-2006) OFCs and Selected Advanced Economies
Total external assets
(in billions of US dollars)
External assets to non-banks as a percentage of total external
assets
Total external loans as a
percentage of total external
assets
External loans to nonbanks as a percentage of total external
loans
Bermuda 10 20.6 36.7 2.9 Netherlands Antilles 21 58.0 100.0 58.0 Panama 22 52.9 73.9 51.0 Macao SAR 23 20.7 17.9 84.5 Isle of Man 77 23.8 100.0 23.8 Bahrain 160 52.1 100.0 52.1 Guernsey 183 15.4 78.2 5.5 Canada 242 56.9 81.1 51.0 Bahamas 343 8.2 94.8 5.1 Jersey 444 3.7 91.9 3.8 Italy 497 24.5 72.6 14.2 Singapore 604 23.1 94.8 24.4 Hong Kong 621 19.3 70.0 11.3 Ireland 819 48.7 51.6 36.4 Luxembourg 901 35.4 69.1 26.0 Switzerland 1,122 12.5 92.9 11.6 Cayman Islands 1,672 28.5 90.5 23.8 Japan 1,898 67.3 33.4 45.0 France 2,196 35.2 56.7 13.8 United States 2,383 23.7 99.3 23.6 Germany 2,794 36.8 67.1 29.6 United Kingdom 5,178 47.0 76.0 38.6 Source: Bank for International Settlements.

10
Table 4. Banking: External Liabilities and Deposits (end-2006)
OFCs and Selected Advanced Economies
Total external liabilities (in
billions of US dollars)
External liabilities to
non-banks as a percentage of total external
liabilities
Total external deposits as a percentage of total external
liabilities
External deposits to nonbanks as a
percentage of total external deposits
Bermuda 3 76.1 90.2 75.2 Macao SAR 9 77.6 86.0 89.4 Panama 18 44.0 70.1 62.2 Netherlands Antilles 19 54.3 100.0 54.3 Isle of Man 52 91.7 100.0 91.7 Bahrain 153 33.9 100.0 33.9 Guernsey 155 37.1 93.8 34.8 Canada 209 22.5 98.9 22.8 Jersey 309 52.1 98.4 51.6 Bahamas 347 41.4 98.1 40.8 Hong Kong 353 33.4 94.4 32.5 Singapore 607 34.4 87.9 39.1 Luxembourg 607 33.0 93.8 35.2 Italy 678 7.0 100.0 7.0 Japan 682 21.5 96.6 22.3 Ireland 889 27.8 100.0 27.8 Switzerland 1,001 44.2 100.0 44.2 Cayman Islands 1,630 37.7 91.3 39.2 Germany 1,722 23.7 76.4 31.0 France 2,123 6.6 77.2 8.5 United States 3,111 28.9 96.9 27.9 United Kingdom 5,432 28.6 85.2 27.7 Source: Bank for International Settlements.

Tabl
e 5.
Ban
king
Sec
tor E
xter
nal A
sset
s (20
04-2
006)
(in
mill
ions
of U
S do
llars
)
2004
2005
2006
2004
2005
2006
2004
2005
2006
2004
2005
2006
And
orra
......
5,68
4...
...1,
038
......
5,68
4...
...1,
038
Ang
uilla
...28
231
7...
229
......
199
252
...19
9...
Ant
igua
and
Bar
buda
...6,
689
......
6,31
5...
...72
7...
...72
7...
Aru
ba...
614
587
...27
117
7...
282
160
...28
216
0B
ahra
in
100,
685
119,
015
159,
674
46,0
9459
,775
83,1
6510
0,68
511
9,01
515
9,67
446
,094
59,7
7583
,165
Bel
ize
......
......
......
......
......
......
Ber
mud
a8,
694
11,7
9310
,313
2,08
42,
487
2,12
42,
583
4,99
33,
789
376
267
109
Brit
ish
Virg
in Is
land
s...
......
......
......
......
......
...C
aym
an Is
land
s96
4,74
81,
216,
137
1,67
1,92
224
3,30
631
2,36
647
5,75
183
4,98
91,
099,
806
1,51
3,51
217
3,73
523
3,30
636
0,00
1C
ook
Isla
nds
......
......
......
......
......
......
Cyp
rus
24,4
0433
,490
51,3
0712
,109
15,5
5423
,923
17,2
7124
,648
33,5
537,
400
9,20
812
,225
Dom
inic
a...
...91
......
......
...5
......
...G
ibra
ltar
9,86
310
,691
16,4
864,
073
3,26
25,
250
9,39
410
,519
15,4
113,
605
3,12
15,
235
Gue
rnse
y13
5,04
114
2,39
118
2,97
042
,538
38,0
1128
,133
82,2
0810
6,58
014
3,10
89,
001
10,9
417,
822
Hon
g K
ong
SAR
of C
hina
508,
050
512,
622
621,
332
86,8
4597
,581
119,
638
369,
793
364,
995
434,
812
34,2
2839
,355
49,0
30Ir
elan
d51
5,06
659
7,16
481
9,13
727
4,37
330
0,14
639
9,22
926
6,96
230
4,75
742
2,49
995
,476
108,
758
153,
877
Isle
of M
an59
,122
62,0
2577
,039
12,1
3210
,360
18,3
1359
,122
62,0
2577
,039
12,1
3210
,360
18,3
13Je
rsey
307,
022
360,
077
444,
064
11,7
2812
,455
16,2
5229
8,11
932
6,23
440
7,94
310
,429
11,6
9915
,328
Mac
ao S
AR
of C
hina
12,8
7117
,451
22,6
533,
003
3,46
34,
674
2,40
43,
141
4,36
02,
136
2,75
53,
429
Mau
ritiu
s7,
448
7,82
2...
......
...2,
817
2,61
2...
......
...M
onac
o15
,642
16,9
7021
,780
4,48
34,
166
5,74
413
,285
15,0
7819
,206
2,12
72,
274
3,17
1M
onts
erra
t...
......
......
......
......
......
...N
ethe
rland
s Ant
illes
30,2
3122
,964
20,6
4715
,567
13,6
7511
,965
30,2
3122
,964
20,6
4715
,567
13,6
7511
,965
Pana
ma
17,1
7019
,262
22,1
766,
662
9,39
211
,727
12,9
6713
,490
16,3
974,
224
6,42
68,
358
Sam
oa
142
112
7411
695
5812
696
6310
080
48Se
yche
lles
5060
174
11
31
112
01
10
Sing
apor
e50
6,19
054
1,49
560
3,56
593
,462
120,
852
139,
470
415,
727
516,
425
572,
197
93,4
6212
0,85
213
9,47
0St
Luc
ia12
5...
......
......
5...
...5
......
Switz
erla
nd92
0,62
796
6,27
01,
122,
005
123,
590
118,
793
140,
747
863,
725
907,
164
1,04
2,82
710
9,59
210
3,86
112
0,84
3Th
e B
aham
as29
8,62
330
3,78
134
3,25
035
,672
23,2
8328
,242
280,
372
286,
517
325,
567
29,3
3418
,515
16,5
83V
anua
tu...
537
1,02
9...
9260
7...
146
114
...28
35
Sour
ce: I
nfor
mat
ion
Fram
ewor
k.
Ext
erna
l Ass
ets v
is-à
-vis
non
-ba
nks
Tota
l Ext
erna
l Loa
nsEx
tern
al L
oans
vis
-à-v
is n
on-
bank
sTo
tal E
xter
nal A
sset
s
11
Ta
ble
6. B
anki
ng S
ecto
r Ext
erna
l Lia
bilit
ies (
2004
-200
6)
(in m
illio
ns o
f US
dolla
rs)
2004
2005
2006
2004
2005
2006
2004
2005
2006
2004
2005
2006
And
orra
......
5,50
0...
...4,
501
......
5,50
0...
...4,
501
Ang
uilla
...25
831
7...
231
......
254
287
......
...A
ntig
ua a
nd B
arbu
da...
6,24
1...
...5,
962
......
4,54
6...
...4,
267
...A
ruba
...56
455
6...
384
426
...43
840
2...
282
306
Bah
rain
96
,692
113,
140
153,
270
26,1
2133
,818
52,0
1596
,692
113,
140
153,
270
26,1
2133
,818
52,0
15B
eliz
e...
......
......
......
......
......
...B
erm
uda
3,34
03,
817
3,44
92,
630
2,89
22,
626
3,16
03,
468
3,11
22,
500
2,60
82,
339
Brit
ish
Virg
in Is
land
s...
......
......
......
......
......
...C
aym
an Is
land
s92
3,16
41,
160,
514
1,63
0,03
248
6,46
547
7,64
961
3,90
786
6,00
81,
080,
728
1,48
8,54
748
0,67
446
3,58
158
3,39
1C
ook
Isla
nds
......
......
......
......
......
......
Cyp
rus
28,7
4637
,173
52,7
65...
......
24,8
8733
,933
49,4
1815
,534
20,8
1327
,354
Dom
inic
a...
...69
......
......
...54
......
...G
ibra
ltar
9,86
37,
375
16,4
765,
915
2,50
49,
149
9,07
77,
196
15,5
295,
129
2,45
28,
412
Gue
rnse
y10
9,35
111
9,92
915
5,42
848
,690
50,4
2957
,645
104,
331
111,
795
145,
860
45,2
4344
,004
50,7
31H
ong
Kon
g SA
R o
f Chi
na30
8,54
030
5,65
935
2,75
285
,275
96,2
2911
7,70
629
4,66
628
8,82
233
3,12
379
,172
88,1
4210
8,17
6Ir
elan
d54
7,11
865
4,20
388
9,48
113
3,12
716
4,77
824
6,90
254
7,11
865
4,20
388
9,48
113
3,12
716
4,77
824
6,90
2Is
le o
f Man
41,7
0242
,780
51,6
8138
,715
40,5
6547
,385
41,7
0242
,780
51,6
8138
,715
40,5
6547
,385
Jers
ey22
6,89
426
5,24
530
9,42
210
4,07
412
9,43
416
1,29
821
4,44
125
8,50
630
4,45
810
2,15
012
6,78
415
7,10
8M
acao
SA
R o
f Chi
na3,
088
6,74
09,
150
2,40
95,
667
7,16
82,
638
6,07
07,
861
2,38
95,
638
7,09
6M
aurit
ius
4,90
44,
640
......
......
2,69
01,
932
......
......
Mon
aco
15,6
8014
,710
20,7
8712
,590
11,6
3716
,999
15,4
1414
,495
20,5
0012
,333
11,4
3216
,732
Mon
tser
rat
......
......
......
......
......
......
Net
herla
nds A
ntill
es26
,101
19,2
4618
,606
11,2
6311
,427
10,1
1226
,101
19,2
4618
,606
11,2
6311
,427
10,1
12Pa
nam
a13
,630
15,4
3017
,675
5,90
16,
369
7,77
310
,102
10,9
9012
,393
5,86
96,
326
7,71
1Sa
moa
12
891
6162
6661
128
9060
6365
59Se
yche
lles
9110
518
469
9816
966
9816
655
9813
3Si
ngap
ore
515,
331
544,
975
606,
501
150,
352
161,
766
208,
752
462,
312
489,
304
533,
310
150,
352
161,
766
208,
752
St L
ucia
110
......
110
......
2...
...2
......
Switz
erla
nd82
7,31
286
4,03
21,
001,
012
354,
135
355,
603
442,
747
827,
312
864,
032
1,00
1,01
235
4,13
535
5,60
344
2,74
7Th
e B
aham
as28
1,05
731
1,23
734
7,43
883
,095
113,
875
143,
697
269,
946
298,
739
341,
006
82,8
4910
2,76
713
9,02
8V
anua
tu...
300
666
...30
064
9...
175
633
...17
563
3
Sour
ce: I
nfor
mat
ion
Fram
ewor
k.
Exte
rnal
Lia
bilit
ies v
is-à
-vis
non
-ba
nks
Tota
l Ext
erna
l Lia
bilit
ies
Exte
rnal
Dep
osits
vis
-à-v
is n
on-
bank
sTo
tal E
xter
nal D
epos
its
12

Tabl
e 7.
Num
ber o
f Ins
uran
ce C
ompa
nies
(200
4-20
06)
13
2004
2005
2006
2004
2005
2006
2004
2005
2006
2004
2005
2006
And
orra
......
......
......
......
......
......
Ang
uilla
...7
5...
1916
...2
2...
5575
Ant
igua
and
Bar
buda
1/
......
...7
7...
......
......
......
Aru
ba...
......
...1
1...
......
...2
4B
ahra
in
11
110
916
11
20
01
Bel
ize
1...
...7
......
......
......
......
Ber
mud
a 2/
7177
...35
036
6...
......
...87
986
9...
Bri
tish
Vir
gin
Isla
nds
...14
15...
1315
......
......
381
400
Cay
man
Isla
nds
21
...4
4...
......
...69
473
3...
Coo
k Is
land
s...
0...
...6
4...
00
...3
0C
ypru
s12
1111
2021
197
77
......
...D
omin
ica
00
...1
1...
00
...0
0...
Gib
ralta
r2
23
2426
321
00
1213
14G
uern
sey
1920
1727
2415
......
...35
735
836
1Is
le o
f Man
1820
1817
1718
1112
1114
313
013
1Je
rsey
55
35
55
22
22
21
Mac
ao S
AR
of C
hina
33
36
55
...0
0...
00
Mau
ritiu
s4
......
12...
...2
......
7...
...M
onac
o 3/
00
00
00
00
00
00
Mon
tser
rat
0...
...0
......
0...
...0
......
Net
herla
nds
Ant
illes
......
......
......
......
......
......
Pana
ma
...2
18...
42
...5
......
28
Sam
oa
00
01
11
00
02
23
Seyc
helle
s...
......
22
2...
......
11
2Si
ngap
ore
1214
1742
4241
2927
2857
6060
St. L
ucia
4/
1...
...15
......
1...
...13
......
The
Bah
amas
...10
5...
3911
......
0...
170
Van
uatu
......
......
......
......
......
......
Sour
ce: I
nfor
mat
ion
Fram
ewor
k.
Life
Non
-Life
Rei
nsur
ance
Cap
tives
1/ T
he d
ata
for 2
004
refe
r to
third
qua
rter.
2
/ Ber
mud
a’s i
nsur
ance
regu
latio
n an
d su
perv
isio
n do
not
diff
eren
tiate
bet
wee
n di
rect
writ
ers a
nd re
insu
rers
nor
bet
wee
n br
anch
es a
nd in
corp
orat
ed
insu
ranc
e co
mpa
nies
.
3
/ No
insu
ranc
e co
mpa
ny h
as a
dire
ct p
rese
nce
in M
onac
o at
pre
sent
. Ins
uran
ce se
rvic
es a
re o
ffer
ed b
y ap
prox
imat
ely
50 a
gent
s and
bro
kers
, rep
rese
ntin
g ov
er 1
50 in
sura
nce
com
pani
es.
4/ In
clud
es b
ranc
hes.
14
Tabl
e 8.
Num
ber o
f Ins
uran
ce B
ranc
hes (
2004
-200
6)
2004
2005
2006
2004
2005
2006
2004
2005
2006
2004
2005
2006
And
orra
......
......
......
......
......
......
Ang
uilla
......
......
......
......
......
......
Ant
igua
and
Bar
buda
1/
98
...6
7...
......
......
......
Aru
ba...
88
...10
10...
......
......
...B
ahra
in
22
27
65
00
20
0...
Bel
ize
......
......
......
......
......
......
Ber
mud
a 2/
......
......
......
......
......
......
Brit
ish
Virg
in Is
land
s...
......
......
......
......
......
...C
aym
an Is
land
s12
11...
119
......
......
......
...C
ook
Isla
nds
...0
......
0...
...0
......
0...
Cyp
rus
21
13
21
11
1...
......
Dom
inic
a6
5...
1114
...0
0...
00
...G
ibra
ltar
......
......
......
......
......
......
Gue
rnse
y3
44
...0
......
......
......
...Is
le o
f Man
109
103
310
......
...10
92
Jers
ey5
44
44
30
......
0...
...M
acao
SA
R o
f Chi
na8
88
98
8...
00
...0
0M
aurit
ius
1...
...2
......
......
......
......
Mon
aco
3/0
00
00
00
00
00
0M
onts
erra
t3
......
4...
...0
......
0...
...N
ethe
rland
s Ant
illes
......
......
......
......
......
......
Pana
ma
......
......
......
......
......
......
Sam
oa
00
00
00
00
00
0...
Seyc
helle
s...
......
......
......
......
......
...Si
ngap
ore
......
......
......
......
......
......
St. L
ucia
...
......
......
......
......
......
...Th
e B
aham
as...
...6
......
19...
20
......
28V
anua
tu...
......
......
......
......
......
...
Sour
ce: I
nfor
mat
ion
Fram
ewor
k.
Life
Non
-Life
Rei
nsur
ance
Cap
tives
1/ T
he d
ata
for 2
004
refe
r to
third
qua
rter.
2/ B
erm
uda’
s ins
uran
ce re
gula
tion
and
supe
rvis
ion
do n
ot d
iffer
entia
te b
etw
een
dire
ct w
riter
s and
rein
sure
rs n
or b
etw
een
bran
ches
and
inco
rpor
ated
insu
ranc
e co
mpa
nies
.
3/
No
insu
ranc
e co
mpa
ny h
as a
dire
ct p
rese
nce
in M
onac
o at
pre
sent
. Ins
uran
ce se
rvic
es a
re o
ffer
ed b
y ap
prox
imat
ely
50 a
gent
s and
bro
kers
, rep
rese
ntin
g ov
er
150
insu
ranc
e co
mpa
nies
.

15 Ta
ble
9. G
ross
Pre
miu
ms o
f Ins
uran
ce C
ompa
nies
(200
4-20
06)
(in m
illio
ns o
f US
dolla
rs)
2004
2005
2006
2004
2005
2006
2004
2005
2006
2004
2005
2006
And
orra
......
......
......
......
......
......
Ang
uilla
......
......
......
......
......
......
Ant
igua
and
Bar
buda
1/
......
...15
44...
......
......
......
Aru
ba...
......
...1
1...
......
...4
13B
ahra
in
57
716
418
222
013
217
416
60
00
Bel
ize
12...
...11
......
......
......
......
Ber
mud
a 2/
21,0
5222
,754
...57
,624
58,4
98...
......
...16
,652
19,4
30...
Brit
ish
Virg
in Is
land
s...
......
......
......
......
......
...C
aym
an Is
land
s9
10...
5395
......
......
5,60
26,
720
...C
ook
Isla
nds
......
......
20.
4...
......
...0.
2
...
Cyp
rus
426
446
508
345
328
390
377
469
538
......
...D
omin
ica
0...
...2
3...
0...
...0
......
Gib
ralta
r89
164
311
788
936
1,70
7...
......
241
170
222
Gue
rnse
y83
550
075
0...
......
......
...5,
228
4,40
25,
966
Isle
of M
an7,
638
11,5
67...
631
457
...45
623
9...
1,89
11,
634
...Je
rsey
...0
016
1413
1212
121
11
Mac
ao S
AR
of C
hina
1934
4435
5571
...0
0...
00
Mau
ritiu
s14
0...
...11
5...
...5
......
93...
...M
onac
o 3/
......
......
......
......
......
......
Mon
tser
rat
......
......
......
......
......
......
Net
herla
nds A
ntill
es...
......
......
......
......
......
...Pa
nam
a...
239
......
205
......
......
......
...Sa
moa
0
00
810
120
00
18
0.01
Seyc
helle
s...
66
1515
165
......
00
1Si
ngap
ore
...7,
127
9,04
81,
572
1,69
31,
858
1,21
21,
577
1,73
837
038
847
9St
. Luc
ia 4
/...
......
21...
......
......
7...
...Th
e B
aham
as...
......
......
......
......
......
...V
anua
tu...
......
......
......
......
......
...
Sour
ce: I
nfor
mat
ion
Fram
ewor
k.
Life
Non
-Life
Rei
nsur
ance
Cap
tives
1/
The
dat
a fo
r 200
4 re
fer t
o th
ird q
uarte
r.
2/
Ber
mud
a in
sura
nce
regu
latio
n an
d su
perv
isio
n do
not
diff
eren
tiate
bet
wee
n di
rect
writ
ers a
nd re
insu
rers
nor
bet
wee
n br
anch
es a
nd in
corp
orat
ed in
sura
nce
com
pani
es.
3/ N
o in
sura
nce
com
pany
has
a d
irect
pre
senc
e in
Mon
aco
at p
rese
nt. I
nsur
ance
serv
ices
are
off
ered
by
appr
oxim
atel
y 50
age
nts a
nd b
roke
rs, r
epre
sent
ing
over
150
insu
ranc
e co
mpa
nies
.
4/
Incl
udes
bra
nche
s.

Tabl
e 10
. Gro
ss P
rem
ium
s of I
nsur
ance
Bra
nche
s (20
04-2
006)
(in
mill
ions
of U
S do
llars
)
2004
2005
2006
2004
2005
2006
2004
2005
2006
2004
2005
2006
And
orra
......
......
......
......
......
......
Ang
uilla
......
......
......
......
......
......
Ant
igua
and
Bar
buda
1/
811
...16
16...
......
......
......
Aru
ba...
4237
...44
53...
......
......
...B
ahra
in
4837
5721
2623
00
00
00
Bel
ize
......
......
......
......
......
......
Ber
mud
a 2/
......
......
......
......
......
......
Brit
ish
Virg
in Is
land
s...
......
......
......
......
......
...C
aym
an Is
land
s17
32...
5313
2...
......
......
......
Coo
k Is
land
s...
......
......
......
......
......
...C
ypru
s54
3844
3216
1812
810
......
...D
omin
ica
1418
...5
9...
0...
...0
......
Gib
ralta
r...
......
......
......
......
......
...G
uern
sey
213
332
404
......
......
......
......
...Is
le o
f Man
......
......
......
......
......
......
Jers
ey...
......
......
......
......
......
...M
acao
SA
R o
f Chi
na13
017
017
514
1719
...0
0...
00
Mau
ritiu
s9
......
10...
......
......
......
...M
onac
o 3/
......
......
......
......
......
......
Mon
tser
rat
......
......
......
......
......
......
Net
herla
nds A
ntill
es...
......
......
......
......
......
...Pa
nam
a...
......
......
......
......
......
...Sa
moa
...
......
......
......
......
......
...Se
yche
lles
......
......
......
......
......
......
Sing
apor
e...
......
......
......
......
......
...St
. Luc
ia
......
......
......
......
......
......
The
Bah
amas
......
......
......
......
......
......
Van
uatu
......
......
......
......
......
......
Sour
ce: I
nfor
mat
ion
Fram
ewor
k.
Life
Non
-Life
Rei
nsur
ance
Cap
tives
16
1/ T
he d
ata
for 2
004
refe
r to
third
qua
rter.
2/
Ber
mud
a in
sura
nce
regu
latio
n an
d su
perv
isio
n do
not
diff
eren
tiate
bet
wee
n di
rect
writ
ers a
nd re
insu
rers
nor
bet
wee
n br
anch
es a
nd in
corp
orat
ed in
sura
nce
com
pani
es.
3/ N
o in
sura
nce
com
pany
has
a d
irect
pre
senc
e in
Mon
aco
at p
rese
nt. I
nsur
ance
serv
ices
are
off
ered
by
appr
oxim
atel
y 50
age
nts a
nd b
roke
rs, r
epre
sent
ing
over
150
in
sura
nce
com
pani
es.

Tabl
e 11
. Col
lect
ive
Inve
stm
ent S
chem
es (C
IS) I
ncor
pora
ted
(Reg
iste
red)
in th
e Ju
risdi
ctio
n (2
004
-200
6)
(in m
illio
ns o
f US
dolla
rs u
nles
s ind
icat
ed o
ther
wis
e)
2004
2005
2006
2004
2005
2006
2004
2005
2006
2004
2005
2006
2004
2005
2006
2004
2005
2006
Ando
rra...
...18
0...
......
......
11,6
08...
......
......
11,2
60...
......
Angu
illa
......
......
2935
......
......
150
......
......
...15
0...
Antig
ua an
d Ba
rbud
a...
......
......
......
......
......
......
......
......
...Ar
uba
......
......
......
......
......
......
......
......
......
Bahr
ain
5886
9757
8595
......
......
......
1,16
92,
803
2,72
51,
133
2,80
32,
725
Beliz
e...
......
......
......
......
......
......
......
......
...Be
rmud
a1,
149
1,18
21,
302
......
......
......
......
...15
8,18
318
7,53
121
1,52
1...
......
Briti
sh V
irgin
Islan
ds...
3,79
12,
571
......
......
......
......
......
......
......
...Ca
yman
Islan
ds...
7,10
68,
134
......
......
......
......
......
......
......
...Co
ok Is
lands
......
......
......
......
......
......
......
......
......
Cypr
us...
......
914
29...
......
391
129
585
......
...38
912
647
0Do
min
ica...
......
......
......
......
......
......
......
......
...Gi
bralt
ar4
1423
...14
2341
650
668
5...
506
685
406
488
667
...48
866
7Gu
erns
ey21
823
327
020
321
525
273
,688
91,2
5512
2,08
8...
......
64,9
3982
,959
110,
989
61,5
2577
,536
109,
582
Isle o
f Man
253
209
227
......
......
10,3
7213
,308
......
...13
,577
8,97
213
,137
......
...Je
rsey
651
743
904
......
......
......
......
...11
9,01
412
9,46
218
8,61
5...
......
Mac
ao S
AR o
f Chi
na...
......
......
......
......
......
......
......
......
...M
aurit
ius
331
381
......
......
......
......
......
12,7
0226
,957
......
......
Mon
aco
6261
6353
5250
......
......
......
8,04
57,
370
7,86
97,
554
6,70
96,
915
Mon
tserra
t...
......
......
......
......
......
......
......
......
...Ne
ther
lands
Ant
illes
......
......
......
......
......
......
......
......
......
Pana
ma
...16
......
15...
...55
7...
...55
4...
...52
7...
...52
4...
Sam
oa
......
......
......
......
......
......
......
......
......
Seyc
helle
s...
......
......
......
......
......
......
......
......
...Si
ngap
ore
379
381
374
379
381
364
19,7
9124
,646
30,2
0619
,791
24,6
4629
,730
......
......
......
St. L
ucia
3...
......
......
......
......
......
......
......
......
The B
aham
as...
484
491
...36
138
6...
......
......
......
139
87...
102
68Va
nuatu
......
......
......
......
......
......
......
......
......
Sour
ce: I
nfor
mati
on F
ram
ewor
k.
Inclu
ding
Fun
d of
Fun
dsEx
cludi
ng F
und
of F
unds
Inclu
ding
Fun
d of
Fun
dsEx
cludi
ng F
und
of F
unds
Inclu
ding
Fun
d of
Fun
dsEx
cludi
ng F
und
of F
unds
Num
ber o
f CIS
Total
Ass
et Va
lue
Net A
sset
Valu
e
17
Tabl
e 12
. Col
lect
ive
Inve
stm
ent S
chem
es (C
IS) M
anag
ed in
the
Juris
dict
ion
(200
4-20
06)
(in m
illio
ns o
f US
dolla
rs u
nles
s ind
icat
ed o
ther
wis
e)
2004
2005
2006
2004
2005
2006
2004
2005
2006
2004
2005
2006
2004
2005
2006
2004
2005
2006
Ando
rra...
......
......
......
......
......
......
......
......
...An
guill
a...
......
......
......
......
......
......
......
......
...An
tigua
and
Barb
uda
......
......
......
......
......
......
......
......
......
Arub
a...
......
......
......
......
......
......
......
......
...Ba
hrain
39
2538
3925
38...
......
......
...2,
557
962
2,73
32,
557
962
2,73
3Be
lize
......
......
......
......
......
......
......
......
......
Berm
uda
......
......
......
......
......
......
......
......
......
Briti
sh V
irgin
Islan
ds...
......
......
......
......
......
......
......
......
...Ca
yman
Islan
ds...
......
......
......
......
......
......
......
......
...Co
ok Is
lands
......
......
......
......
......
......
......
......
......
Cypr
us...
......
......
......
......
......
......
......
......
...Do
min
ica...
......
......
......
......
......
......
......
......
...Gi
bralt
ar...
522
...5
22...
3,18
43,
276
...3,
184
3,27
6...
3,11
53,
261
...3,
115
3,26
1Gu
erns
ey18
719
421
715
616
217
0...
......
......
...32
,835
35,6
2449
,147
22,8
7626
,068
36,4
52Isl
e of M
an25
320
922
7...
......
...10
,372
13,3
08...
......
13,5
778,
972
13,1
37...
......
Jerse
y18
222
225
3...
......
......
......
......
80,4
6110
6,75
316
2,28
6...
......
Mac
ao S
AR o
f Chi
na...
......
......
......
......
......
......
......
......
...M
aurit
ius
......
2222
......
......
276
213
......
......
262
212
...M
onac
o53
5356
4444
44...
......
......
...6,
545
6,35
46,
653
6,05
45,
693
5,73
4M
ontse
rrat
......
......
......
......
......
......
......
......
......
Neth
erlan
ds A
ntill
es...
......
......
......
......
......
......
......
......
...Pa
nam
a...
13...
...12
......
409
......
406
......
402
......
399
...Sa
moa
...
......
......
......
......
......
......
......
......
...Se
yche
lles
......
......
......
......
......
......
......
......
......
Sing
apor
e...
......
......
......
......
......
......
......
......
...St
. Luc
ia1
......
......
......
......
......
......
......
......
...Th
e Bah
amas
...21
527
4...
124
230
......
......
......
...36
118
...9
105
Vanu
atu...
......
......
......
......
......
......
......
......
...
Sour
ce: I
nfor
mati
on F
ram
ewor
k.
Inclu
ding
Fun
d of
Fun
dsEx
cludi
ng F
und
of F
unds
Inclu
ding
Fun
d of
Fun
dsEx
cludi
ng F
und
of F
unds
Inclu
ding
Fun
d of
Fun
dsEx
cludi
ng F
und
of F
unds
Num
ber o
f CIS
Total
Ass
et Va
lue
Net A
sset
Valu
e
18

19
2004
2005
2006
And
orra
......
...A
ngui
lla...
......
Ant
igua
and
Bar
buda
...0.
15...
Aru
ba...
12,
453
Bah
rain
7
8...
Bel
ize
......
...B
erm
uda
...7
...B
ritis
h V
irgin
Isla
nds
...1
...C
aym
an Is
land
s5
62,
442
Coo
k Is
land
s...
...C
ypru
s 1/
16...
15,9
77D
omin
ica
...0.
517
0G
ibra
ltar
......
...G
uern
sey
77
3,23
6Is
le o
f Man
1210
3,43
1Je
rsey
911
6,66
0M
acao
SA
R o
f Chi
na6
714
,285
Mau
ritiu
s10
8...
Mon
aco
33
...M
onts
erra
t0.
05...
...N
ethe
rland
s Ant
illes
......
...Pa
nam
a...
1316
,923
Sam
oa
......
...Se
yche
lles
11
773
Sing
apor
e10
811
613
2,16
1St
. Luc
ia2
......
The
Bah
amas
...4
6,23
7V
anua
tu...
......
Sour
ce: I
nfor
mat
ion
Fram
ewor
k.
d
olla
rs)
Num
ber e
mpl
oyed
in t
serv
ice
s(in
thou
sand
s
2006
2004
2005
2006
2004
2005
2006
2004
2005
2...
...43
......
......
......
......
......
......
......
......
......
......
......
905
......
47...
......
......
2,27
410
284
337
352
2,71
02,
460
...11
,012
13,3
81...
......
......
......
......
7...
3940
1,46
2...
...4,
505
...1
...16
17...
176
......
972
722
3535
275
......
1,93
92,
309
......
......
...32
3...
...80
175
21,
057
13,2
0112
,041
......
2525
...22
25...
163
......
......
......
......
...7
3131
3287
982
496
32,
734
2,59
39
4343
411,
056
980
1,23
52,
963
2,88
311
5050
502,
810
3,33
0...
5,58
65,
535
720
323
826
763
1...
...7,
949
11,5
58...
487
291
...52
155
5...
6,26
45,
405
340
4044
......
......
......
2...
...3
......
35...
......
......
......
......
...15
...1,
273
1,29
3...
1,32
51,
161
...15
,468
......
......
......
......
...1
3335
4069
7985
703
723
127
2,20
72,
320
2,49
611
,822
12,5
6014
,705
106,
818
116,
761
...64
......
......
......
...5
...17
918
2...
419
471
...5,
870
......
......
......
......
...
Con
tribu
tion
of fi
nanc
ial s
ervi
ce
sect
or to
GD
P
(in
mill
ions
of U
S do
llars
)
GD
P
(in
mill
ions
of U
She
fina
ncia
l ec
tor
)
Tota
l em
ploy
men
t in
the
econ
omy
(in th
ousa
nds)
Tabl
e 13
. Oth
er F
inan
cial
Sec
tor I
ndic
ator
s (20
04-2
006)
1/ R
eal G
DP.

20
Figure 1. Banking Sector (end-2006)1/
0
1
2
3
4
5
6
7
8C
ook
Isla
nds
Sam
oaSt
. Luc
iaD
omin
ica
Beliz
eAn
guilla
Mon
tser
rat
Seyc
helle
sVa
nuat
uBr
itish
Virg
in Is
land
sAr
uba
Antig
ua a
nd B
arbu
daM
aurit
ius
Ando
rra
Berm
uda
Gib
ralta
rM
onac
oN
ethe
rland
s An
tilles
Mac
ao S
ARPa
nam
aC
ypru
sIs
le o
f Man
Gue
rnse
yBa
hrai
nTh
e Ba
ham
asJe
rsey
Sing
apor
eH
ong
Kong
SAR
Luxe
mbo
urg
Irela
ndC
aym
an Is
land
sC
anad
aSw
itzer
land Ita
lyFr
ance
Ger
man
yJa
pan
Uni
ted
King
dom
Uni
ted
Stat
es
Tota
l Ass
ets,
(US
mil.
), lo
g sc
ale
90
20
32
14
78
26
81
54
35
6366
6166
49
6167
93
76 73
82
68
58
82
52
98
12
42
14
29 30
15
41
15
0
20
40
60
80
100
Coo
k Is
land
sSa
moa
St. L
ucia
Dom
inic
aBe
lize
Angu
illaM
onts
erra
tSe
yche
lles
Vanu
atu
Britis
h Vi
rgin
Isla
nds
Arub
aAn
tigua
and
Bar
buda
Mau
ritiu
sAn
dorr
aBe
rmud
aG
ibra
ltar
Mon
aco
Net
herla
nds
Antill
esM
acao
SAR
Pana
ma
Cyp
rus
Isle
of M
anG
uern
sey
Bahr
ain
The
Baha
mas
Jers
eySi
ngap
ore
Hon
g Ko
ng S
ARLu
xem
bour
gIre
land
Cay
man
Isla
nds
Can
ada
Switz
erla
nd Italy
Fran
ceG
erm
any
Japa
nU
nite
d Ki
ngdo
mU
nite
d St
ates
In p
erce
nt1.a. Size of the Banking Sector in Participating Jurisdictions and
Select Financial Centers (log. scale) 2/
1.b. External Assets as a Share of Total Assets in Participating Jurisdictions and Select Financial Centers 3/
Sources: Information Framework; Bank for International Settlements; and Eastern Caribbean Central Bank. 1/ 2006 or latest available. Data on non-participating jurisdictions were obtained from public sources. 2/ The data have been plotted on a logarithmic scale because of the wide dispersion in asset size among jurisdictions. 3/ Data on bank assets for Samoa and Gibraltar cover off-shore sector only, and therefore the ratio is not reported.
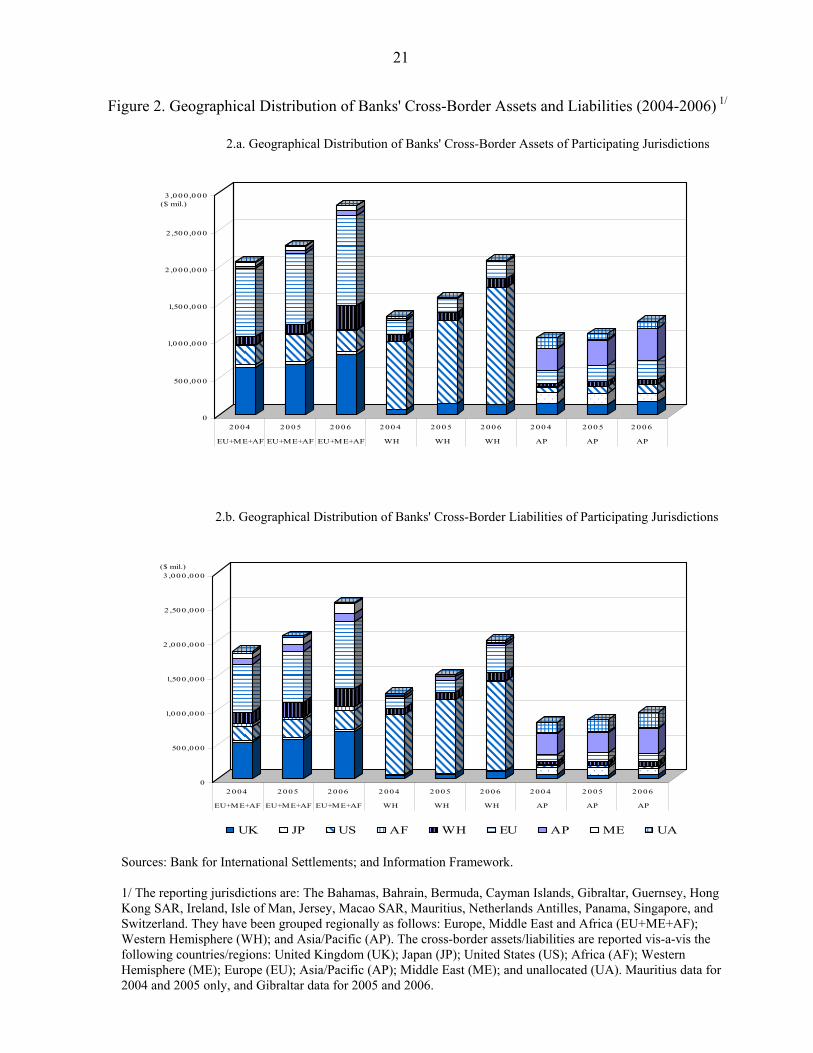
21
Figure 2. Geographical Distribution of Banks' Cross-Border Assets and Liabilities (2004-2006) 1/
0
500 ,00 0
1,0 00 ,0 00
1,500 ,0 00
2 ,0 00 ,0 00
2 ,500 ,0 00
3 ,0 00 ,0 00($ mil.)
20 04 20 05 2 00 6 200 4 20 05 2 006 200 4 200 5 2 006
EU+ME+AF EU+ME+AF EU+ME+AF WH WH WH AP AP AP
0
500 ,000
1,000 ,000
1,500 ,000
2 ,000 ,000
2 ,500 ,000
3 ,000 ,000($ mil.)
2 004 20 05 2006 2 004 2 005 2006 200 4 2 005 2006
EU+ME+AF EU+ME+AF EU+ME+AF WH WH WH AP AP AP
UK JP US AF WH EU AP ME UA
2.a. Geographical Distribution of Banks' Cross-Border Assets of Participating Jurisdictions
2.b. Geographical Distribution of Banks' Cross-Border Liabilities of Participating Jurisdictions
Sources: Bank for International Settlements; and Information Framework. 1/ The reporting jurisdictions are: The Bahamas, Bahrain, Bermuda, Cayman Islands, Gibraltar, Guernsey, Hong Kong SAR, Ireland, Isle of Man, Jersey, Macao SAR, Mauritius, Netherlands Antilles, Panama, Singapore, and Switzerland. They have been grouped regionally as follows: Europe, Middle East and Africa (EU+ME+AF); Western Hemisphere (WH); and Asia/Pacific (AP). The cross-border assets/liabilities are reported vis-a-vis the following countries/regions: United Kingdom (UK); Japan (JP); United States (US); Africa (AF); Western Hemisphere (ME); Europe (EU); Asia/Pacific (AP); Middle East (ME); and unallocated (UA). Mauritius data for 2004 and 2005 only, and Gibraltar data for 2005 and 2006.
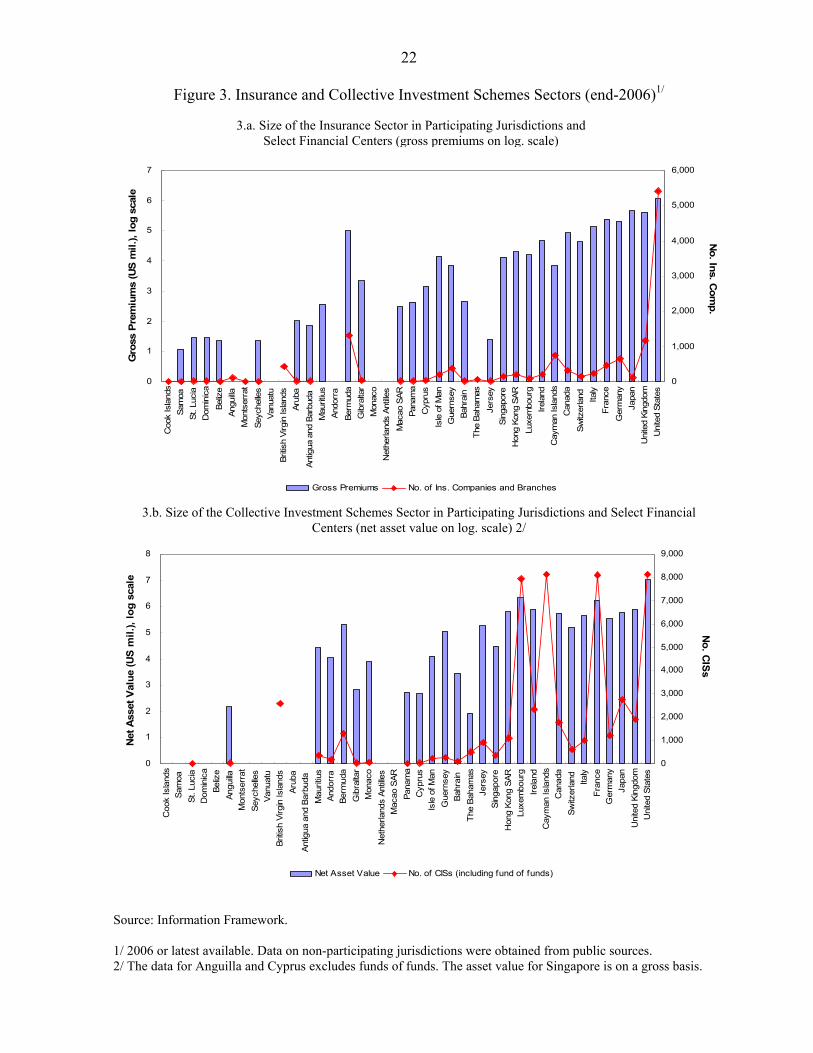
22
Figure 3. Insurance and Collective Investment Schemes Sectors (end-2006)1/
0
1
2
3
4
5
6
7C
ook
Isla
nds
Sam
oa
St. L
ucia
Dom
inic
aBe
lize
Angu
illaM
onts
erra
tSe
yche
lles
Vanu
atu
Britis
h Vi
rgin
Isla
nds
Arub
aAn
tigua
and
Bar
buda
M
aurit
ius
Ando
rra
Berm
uda
Gib
ralta
rM
onac
oN
ethe
rland
s An
tilles
Mac
ao S
ARPa
nam
aC
ypru
sIs
le o
f Man
Gue
rnse
yBa
hrai
n Th
e Ba
ham
asJe
rsey
Sing
apor
eH
ong
Kong
SAR
Luxe
mbo
urg
Irela
ndC
aym
an Is
land
sC
anad
aSw
itzer
land Ita
lyFr
ance
Ger
man
yJa
pan
Uni
ted
King
dom
Uni
ted
Stat
es
Gro
ss P
rem
ium
s (U
S m
il.),
log
scal
e
0
1,000
2,000
3,000
4,000
5,000
6,000
No. Ins. C
omp.
Gross Premiums No. of Ins. Companies and Branches
0
1
2
3
4
5
6
7
8
Coo
k Is
land
sSa
moa
St
. Luc
iaD
omin
ica
Beliz
eAn
guilla
Mon
tser
rat
Seyc
helle
sVa
nuat
uBr
itish
Virg
in Is
land
sAr
uba
Antig
ua a
nd B
arbu
da
Mau
ritiu
sAn
dorr
aBe
rmud
aG
ibra
ltar
Mon
aco
Net
herla
nds
Antill
esM
acao
SAR
Pana
ma
Cyp
rus
Isle
of M
anG
uern
sey
Bahr
ain
The
Baha
mas
Jers
eySi
ngap
ore
Hon
g Ko
ng S
ARLu
xem
bour
gIre
land
Cay
man
Isla
nds
Can
ada
Switz
erla
nd Italy
Fran
ceG
erm
any
Japa
nU
nite
d Ki
ngdo
mU
nite
d St
ates
Net A
sset
Val
ue (U
S m
il.),
log
scal
e
0
1,000
2,000
3,000
4,000
5,000
6,000
7,000
8,000
9,000
No. CISs
Net Asset Value No. of CISs (including fund of funds)
3.a. Size of the Insurance Sector in Participating Jurisdictions and Select Financial Centers (gross premiums on log. scale)
3.b. Size of the Collective Investment Schemes Sector in Participating Jurisdictions and Select Financial Centers (net asset value on log. scale) 2/
Source: Information Framework. 1/ 2006 or latest available. Data on non-participating jurisdictions were obtained from public sources. 2/ The data for Anguilla and Cyprus excludes funds of funds. The asset value for Singapore is on a gross basis.

23
Figure 4. Other Sectors (end-2006)1/
3 2 2 25
2 3 4
19
73 1
5
22 22
3 3
22
5
15
811
18
10
32
8 7 7
36
30
18
8
60
11
20
14
0
10
20
30
40
50
60
70C
ook
Isla
nds
Sam
oa
St. L
ucia
Dom
inic
a
Angu
illa
Beliz
e
Mon
tser
rat
Seyc
helle
s
Vanu
atu
Britis
h Vi
rgin
Isla
nds
Arub
a
Antig
ua a
nd B
arbu
da
Mau
ritiu
s
Ando
rra
Berm
uda
Gib
ralta
r
Mon
aco
Net
herla
nds
Antill
es
Mac
ao S
AR
Pana
ma
Cyp
rus
Isle
of M
an
Gue
rnse
y
Bahr
ain
Baha
mas
Jers
ey
Sing
apor
e
Cay
man
Isla
nds
In p
erce
nt
Employed in Financial Service Sector (% of Total Employment)Contribution of Financial Service Sector to GDP (%)
0
100
200
300
400
500
600
Coo
k Is
land
s
Sam
oa
St. L
ucia
Dom
inic
a
Angu
illa
Beliz
e
Mon
tser
rat
Seyc
helle
s
Vanu
atu
Britis
h Vi
rgin
Isla
nds
Arub
a
Antig
ua a
nd B
arbu
da
Mau
ritiu
s
Berm
uda
Gib
ralta
r
Mon
aco
Net
herla
nds
Antill
es
Mac
ao S
AR
Pana
ma
Cyp
rus
Isle
of M
an
Gue
rnse
y
Bahr
ain
Baha
mas
Jers
ey
Sing
apor
e
Cay
man
Isla
nds
No. of Company and Trust Service Providers
4.a. Financial Service Sector Contribution in Participating Jurisdictions
4.b. Number of Company and Trust Service Providers in Participating Jurisdictions
Source: Information Framework. 1/ 2006 or latest available.