Embed Size (px)
Citation preview
REFERENCE CODE GDAE1100MAR | PUBLICATION DATE JUNE 2015
OFFSHORE WIND POWER MARKET – GLOBAL MARKET SIZE, AVERAGE PRICE, TURBINE MARKET
SHARE AND KEY COUNTRY ANALYSIS TO 2025
Offshore Wind Power Market – Global Market Size, Average Price, Turbine Market Share and Key Country Analysis to 2025 2 © GlobalData. This report is a licensed product and is not to be copied, reproduced, shared or resold in any form.
OFFSHORE WIND POWER MARKET – GLOBAL MARKET SIZE, AVERAGE PRICE, TURBINE MARKET SHARE AND KEY COUNTRY
ANALYSIS TO 2025
Executive Summary
Global Wind Power Market to Register Steady Growth during Forecast Period
The global wind energy market registered
substantial growth from 2007 to 2014, with total
wind power capacity increasing by XX%. Global
installed wind energy capacity increased at a
Compound Annual Growth Rate (CAGR) of XX%
during this period, from XX Gigawatts (GW) to XX
GW, of which XX GW came online in 2014. The
global wind power market recovered in 2011 and
2012 following a XX% fall in annual additions in
2010, which was the result of the economic
problems experienced by major wind markets such
as the US, Germany and Spain following the global
economic recession. Similarly, there was a fall in
annual additions in 2013 as there was a huge drop
in annual additions in the US. Wind power has
become an important player in the global energy
market, and the growth of the equipment market
has created many employment opportunities. The
exponential growth of the wind energy market has
been fueled by the depletion of fossil fuel reserves,
the declining cost of wind power generation, and a
growing level of sensitivity towards the
environment, which has resulted in the provision of
increased support in the form of financial
incentives by various governments worldwide. The
global wind power market stood at over $XX billion
in 2014, and the market is expected to grow
exponentially in the future. China, the US,
Germany, India and Spain are the major wind
markets in the world, accounting for XX% of global
cumulative installed capacity in 2014.
The growth of major wind power markets such as
the US, Germany, Spain, France, Italy, India and
China is expected to slow from 2015 to 2025.
Emerging markets in Asia-Pacific and South and
Central America are expected to gain a
considerable market share. Countries such as
Thailand, Argentina, South Africa, Philippines,
Ukraine, Brazil, South Korea and Mexico are
examples of nascent wind markets that are set to
expand rapidly in the forecast period. Against this
backdrop, the global wind power market is
expected to grow at a CAGR of XX% to reach XX
GW in 2025.
Increasing Exploration of Global Offshore Wind Power
Offshore wind is being increasingly explored
worldwide for its high yield due to stronger and
more consistent winds compared with onshore
locations and the existing scope for the
construction of large GW-scale projects.
Cumulative offshore wind energy installations
currently form a small part of the global wind power
market, accounting for around XX% in 2012.
Substantial potential exists for offshore wind to
become a major source of energy in future.
Offshore wind power development is currently
concentrated primarily in Europe, which accounts
for more than XX GW of offshore wind power
capacity. With a number of large-scale wind power
Offshore Wind Power Market – Global Market Size, Average Price, Turbine Market Share and Key Country Analysis to 2025 3 © GlobalData. This report is a licensed product and is not to be copied, reproduced, shared or resold in any form.
OFFSHORE WIND POWER MARKET – GLOBAL MARKET SIZE, AVERAGE PRICE, TURBINE MARKET SHARE AND KEY COUNTRY
ANALYSIS TO 2025
Executive Summary
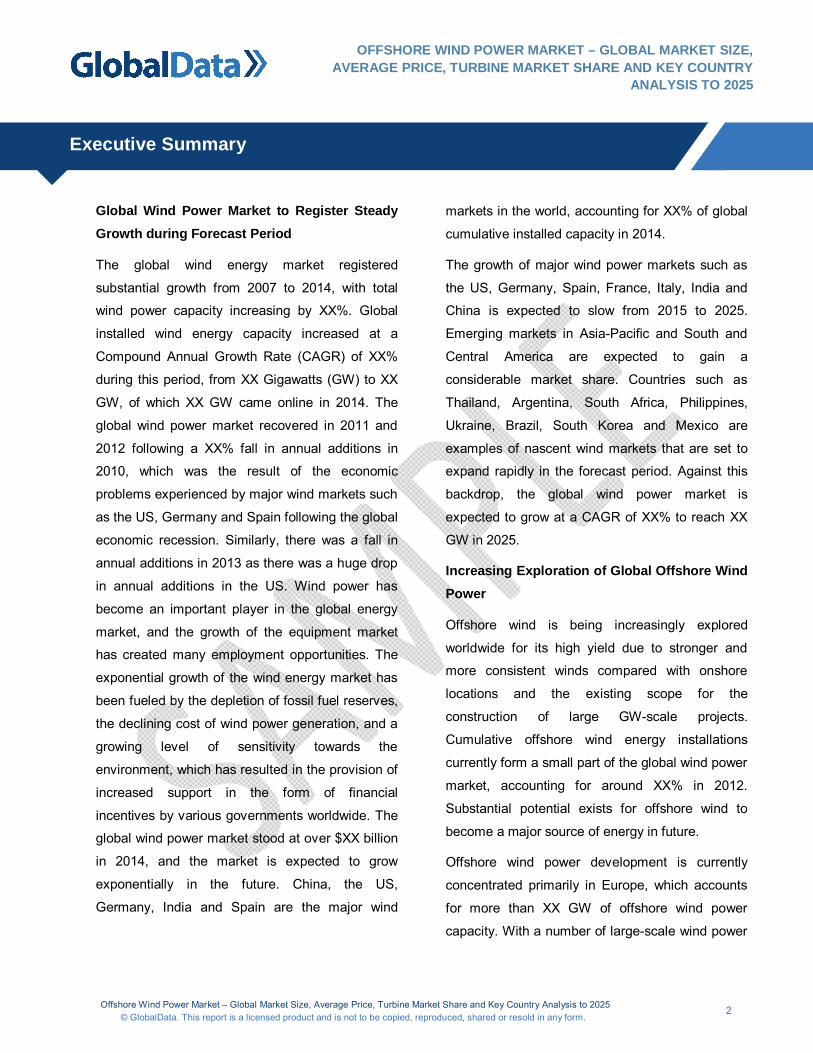
projects expected to become operational in the
near future, the offshore wind power market is set
to register substantial growth. Large-scale projects
in Europe and Asia-Pacific are scheduled to be
completed in the near future. Offshore wind power
capacity increased from XX GW in 2007 to XX GW
in 2014 at a CAGR of XX%. With large-scale
commercial offshore wind farms currently under
construction and in the planning phase, offshore
wind power capacity is expected to reach XX GW
in 2025, increasing from XX GW in 2014 at a
CAGR of XX%. This increase will be led by the UK.
Offshore Wind Power Market, Global, Cumulative Installed Capacity (GW), 2007–2025
2007 2014 2020 2025
Cum
ulat
ive
inst
alle
d ca
paci
ty (G
W)
Source: GlobalData, Capacity and Generation Database [Accessed on May 21, 2015]
Europe Driving Offshore Wind Installation
Europe has been a pioneer in terms of installing
clean energy and especially in promoting
renewable power around the world. This has been
largely due to the EU’s quick uptake of the
technology and the mandates for clean energy that
have been provided to all of its member states.
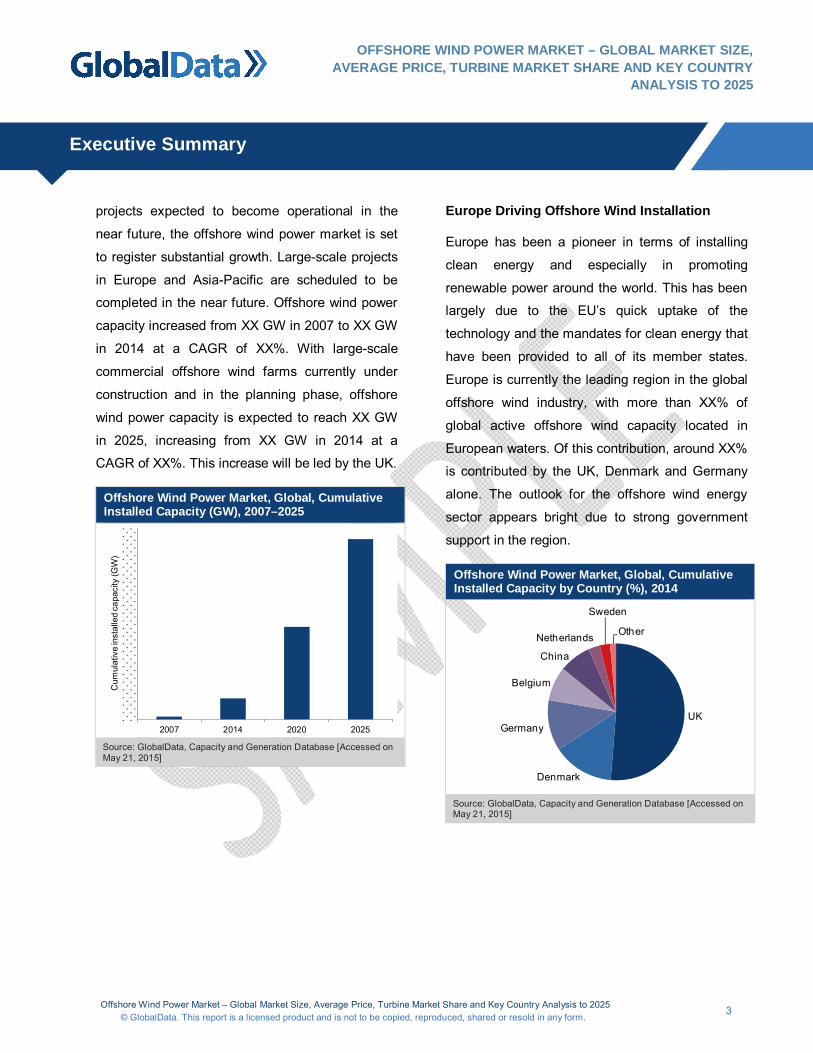
Europe is currently the leading region in the global
offshore wind industry, with more than XX% of
global active offshore wind capacity located in
European waters. Of this contribution, around XX%
is contributed by the UK, Denmark and Germany
alone. The outlook for the offshore wind energy
sector appears bright due to strong government
support in the region.
Offshore Wind Power Market, Global, Cumulative Installed Capacity by Country (%), 2014
UK
Denmark
Germany
Belgium
China
Netherlands
Sweden
Other
Source: GlobalData, Capacity and Generation Database [Accessed on May 21, 2015]
Offshore Wind Power Market – Global Market Size, Average Price, Turbine Market Share and Key Country Analysis to 2025 5 © GlobalData. This report is a licensed product and is not to be copied, reproduced, shared or resold in any form.
Table of Contents
OFFSHORE WIND POWER MARKET – GLOBAL MARKET SIZE, AVERAGE PRICE, TURBINE MARKET SHARE AND KEY COUNTRY
ANALYSIS TO 2025
1 Table of Contents
1 Table of Contents ....................................................................................................................... 5
1.1 List of Tables .................................................................................................................... 10
1.2 List of Figures ................................................................................................................... 14
2 Introduction ............................................................................................................................... 18
2.1 Wind Power Market, Technology Definition ....................................................................... 18
2.2 Wind Power Market, Technology Overview ....................................................................... 18
2.3 Wind Power Market, Turbine Components ........................................................................ 19
2.4 Global Report Guidance .................................................................................................... 22
3 Wind Power Market, Global, 2007–2025 ................................................................................... 23
3.1 Wind Power Market, Global, Overview .............................................................................. 23
3.2 Wind Power Market, Global, Installed Capacity, 2007–2025 ............................................. 23
3.3 Wind Power Market, Global, Installed Capacity by Country, 2014 ..................................... 25
3.3.1 Wind Power Market, Global, Cumulative Installed Capacity by Country, 2014............... 25
3.3.2 Wind Power Market, Global, Annual Additions by Country, 2014................................... 27
3.4 Wind Power Market, Global, Market Segmentation by Onshore and Offshore, 2007–2025 ...
....................................................................................................................................... 28
4 Offshore Wind Power Market, Global, 2007–2025 .................................................................... 30
4.1 Offshore Wind Power Market, Global, Overview ............................................................... 30
4.2 Offshore Wind Power Market, Global, Installed Capacity, 2007–2025 ............................... 31
4.3 Offshore Wind Power Market, Global, Power Generation, 2007–2025 .............................. 32
4.4 Offshore Wind Power Market, Global, Installed Capacity by Country, 2014 ...................... 35
4.4.1 Offshore Wind Power Market, Global, Cumulative Installed Capacity by Country, 2014 35
Offshore Wind Power Market – Global Market Size, Average Price, Turbine Market Share and Key Country Analysis to 2025 6 © GlobalData. This report is a licensed product and is not to be copied, reproduced, shared or resold in any form.
Table of Contents
OFFSHORE WIND POWER MARKET – GLOBAL MARKET SIZE, AVERAGE PRICE, TURBINE MARKET SHARE AND KEY COUNTRY
ANALYSIS TO 2025
4.4.2 Offshore Wind Power Market, Global, Annual Additions by Country, 2014 .................... 37
4.5 Offshore Wind Power Market, Global, Cost Analysis ......................................................... 39
4.5.1 Offshore Wind Power Market, Global, Cost Comparison with Onshore Wind Farms, 2014
..................................................................................................................................... 40
4.5.2 Offshore Wind Power Market, Global, Capital Cost in Major Countries, 2014 ................ 41
4.5.3 Offshore Wind Power Market, Global, LCOE Comparison in Major Countries, 2014 ..... 43
4.6 Offshore Wind Power Market, Global, Average Capital Cost and Market Size, 2014–2025 ...
....................................................................................................................................... 44
4.7 Offshore Wind Power Market, Global, Average Turbine Size, 2006–2020......................... 46
4.8 Offshore Wind Power Market, Global, Turbine Market Share, 2014 .................................. 48
4.9 Offshore Wind Power Market, Global, Drivers, Restraints and Challenges ........................ 49
4.9.1 Offshore Wind Power Market, Global, Drivers ............................................................... 49
4.9.2 Offshore Wind Power Market, Global, Restraints and Challenges ................................. 52
4.10 Offshore Wind Power Market, Global, Trends ................................................................... 53
4.10.1 Turbine Size .................................................................................................................. 53
4.10.2 Foundation Type ........................................................................................................... 54
4.10.3 Water Depth and Distance from the Shore .................................................................... 54
4.10.4 Vessels ......................................................................................................................... 54
5 Offshore Wind Power Market, US, 2016–2025.......................................................................... 55
5.1 Offshore Wind Power Market, US, Overview ..................................................................... 55
5.2 Offshore Wind Power Market, US, Installed Capacity, 2016–2025 .................................... 56
5.3 Offshore Wind Power Market, US, Power Generation, 2016–2025 ................................... 58
5.4 Offshore Wind Power Market, US, Top Upcoming Power Plants ....................................... 59
Offshore Wind Power Market – Global Market Size, Average Price, Turbine Market Share and Key Country Analysis to 2025 7 © GlobalData. This report is a licensed product and is not to be copied, reproduced, shared or resold in any form.
Table of Contents
OFFSHORE WIND POWER MARKET – GLOBAL MARKET SIZE, AVERAGE PRICE, TURBINE MARKET SHARE AND KEY COUNTRY
ANALYSIS TO 2025
5.5 Offshore Wind Power Market, US, Average Turbine Size, 2016–2020 .............................. 60
5.6 Offshore Wind Power Market, US, Average Capital Cost and Market Size, 2016–2025 .... 61
6 Offshore Wind Power Market, China, 2007–2025 ..................................................................... 64
6.1 Offshore Wind Power Market, China, Overview ................................................................ 64
6.2 Offshore Wind Power Market, China, Installed Capacity, 2007–2025 ................................ 65
6.3 Offshore Wind Power Market, China, Power Generation, 2007–2025 ............................... 68
6.4 Offshore Wind Power Market, China, Top Active and Upcoming Power Plants ................. 70
6.5 Offshore Wind Power Market, China, Average Turbine Size, 2007–2020 .......................... 72
6.6 Offshore Wind Power Market, China, LCOE, $/kWh, 2014–2025 ...................................... 73
6.7 Offshore Wind Power Market, China, Average Capital Cost and Market Size, 2014–2025 75
7 Offshore Wind Power Market, South Korea, 2011–2025 ........................................................... 78
7.1 Offshore Wind Power Market, South Korea, Overview ...................................................... 78
7.2 Offshore Wind Power Market, South Korea, Installed Capacity, 2011–2025 ..................... 79
7.3 Offshore Wind Power Market, South Korea, Power Generation, 2011–2025 ..................... 81
7.4 Offshore Wind Power Market, South Korea, Top Active and Upcoming Power Plants ....... 82
7.5 Offshore Wind Power Market, South Korea, Average Turbine Size, 2011–2020 ............... 84
7.6 Offshore Wind Power Market, South Korea Offshore LCOE, $/kWh, 2014–2025 .............. 85
7.7 Offshore Wind Power Market, South Korea, Average Capital Cost and Market Size, 2014–
2025 .................................................................................................................................. 87
8 Offshore Wind Power Market, UK, 2007–2025.......................................................................... 90
8.1 Offshore Wind Power Market, UK, Overview ..................................................................... 90
8.2 Offshore Wind Power Market, UK, Installed Capacity, 2007–2025 .................................... 90
8.3 Offshore Wind Power Market, UK, Power Generation, 2007–2025 ................................... 93
Offshore Wind Power Market – Global Market Size, Average Price, Turbine Market Share and Key Country Analysis to 2025 8 © GlobalData. This report is a licensed product and is not to be copied, reproduced, shared or resold in any form.
Table of Contents
OFFSHORE WIND POWER MARKET – GLOBAL MARKET SIZE, AVERAGE PRICE, TURBINE MARKET SHARE AND KEY COUNTRY
ANALYSIS TO 2025
8.4 Offshore Wind Power Market, UK, Top Active and Upcoming Power Plants ..................... 95
8.5 Offshore Wind Power Market, UK, Share by Manufacturer, 2014 ...................................... 97
8.6 Offshore Wind Power Market, UK, Average Turbine Size, 2007–2020 .............................. 98
8.7 Offshore Wind Power Market, UK, LCOE, 2014–2025 ...................................................... 99
8.8 Offshore Wind Power Market, UK, Average Capital Cost and Market Size, 2014–2025 .. 102
9 Offshore Wind Power Market, Germany, 2007–2025 .............................................................. 104
9.1 Offshore Wind Power Market, Germany, Overview ......................................................... 104
9.2 Offshore Wind Power Market, Germany, Installed Capacity, 2007–2025 ........................ 105
9.3 Offshore Wind Power Market, Germany, Power Generation, 2007–2025 ........................ 107
9.4 Offshore Wind Power Market, Germany, Top Active and Upcoming Power Plants .......... 109
9.5 Offshore Wind Power Market, Germany, Average Turbine Size, 2007–2025 .................. 110
9.6 Offshore Wind Power Market, Germany, Share by Manufacturer, 2014 .......................... 112
9.7 Offshore Wind Power Market, Germany, Levelized Cost of Electricity, 2014–2025 ......... 114
9.8 Offshore Wind Power Market, Germany, Average Capital Cost and Market Size, 2014–
2025 ................................................................................................................................ 116
10 Offshore Wind Power Market, Netherlands, 2007–2025 ......................................................... 119
10.1 Offshore Wind Power Market, Netherlands, Overview..................................................... 119
10.2 Offshore Wind Power Market, Netherlands, Installed Capacity, GW, 2007–2025 ............ 119
10.3 Offshore Wind Power Market, Netherlands, Power Generation, GWh, 2007–2025 ......... 122
10.4 Offshore Wind Power Market, Netherlands, Top Active and Upcoming Power Plants ..... 124
10.5 Offshore Wind Power Market, Netherlands, Average Turbine Size, 2007–2025 .............. 125
10.6 Offshore Wind Power Market, Netherlands, Share by Manufacturer (%), 2014 ............... 125
10.7 Offshore Wind Power Market, Netherlands, Levelized Cost of Electricity, 2014–2025 ..... 126
Offshore Wind Power Market – Global Market Size, Average Price, Turbine Market Share and Key Country Analysis to 2025 9 © GlobalData. This report is a licensed product and is not to be copied, reproduced, shared or resold in any form.
Table of Contents
OFFSHORE WIND POWER MARKET – GLOBAL MARKET SIZE, AVERAGE PRICE, TURBINE MARKET SHARE AND KEY COUNTRY
ANALYSIS TO 2025
10.8 Offshore Wind Power Market, Netherlands, Average Capital Cost and Market Size, 2007–
2025 ................................................................................................................................ 128
11 Offshore Wind Power Market, Belgium, 2007–2025 ................................................................ 131
11.1 Offshore Wind Power Market, Belgium, Overview ........................................................... 131
11.2 Offshore Wind Power Market, Belgium, Installed Capacity, 2009–2025 .......................... 132
11.3 Offshore Wind Power Market, Belgium, Power Generation, 2009–2025.......................... 134
11.4 Offshore Wind Power Market, Belgium, Top Active and Upcoming Power plants ............ 136
11.5 Offshore Wind Power Market, Belgium, Average Turbine Size, 2007–2025 .................... 137
11.6 Offshore Wind Power Market, Belgium, Share by Manufacturer, 2014 ............................ 137
11.7 Offshore Wind Power Market, Belgium, Levelized Cost of Electricity, 2014–2025 ........... 138
11.8 Offshore Wind Power Market, Belgium, Average Capital Cost and Market Size, 2007–2025
..................................................................................................................................... 140
12 Offshore Wind Power Market, Denmark, 2007–2025 .............................................................. 143
12.1 Offshore Wind Power Market, Denmark, Overview ......................................................... 143
12.2 Offshore Wind Power Market, Denmark, Installed Capacity, 2007–2025......................... 143
12.3 Offshore Wind Power Market, Denmark, Power Generation, 2007–2025 ........................ 146
12.4 Offshore Wind Power Market, Denmark, Top Active and Upcoming Power Plants .......... 148
12.5 Offshore Wind Power Market, Denmark, Average Turbine Size, 2007–2025 .................. 149
12.6 Offshore Wind Power Market, Denmark, Share by Manufacturer, 2014 .......................... 149
12.7 Offshore Wind Power Market, Denmark, LCOE ($/kWh), 2014–2025 ............................. 150
12.8 Offshore Wind Power Market, Denmark, Average Capital Cost and Market Size, 2007–
2025 ................................................................................................................................ 152
13 Appendix................................................................................................................................. 155
Offshore Wind Power Market – Global Market Size, Average Price, Turbine Market Share and Key Country Analysis to 2025 10 © GlobalData. This report is a licensed product and is not to be copied, reproduced, shared or resold in any form.
Table of Contents
OFFSHORE WIND POWER MARKET – GLOBAL MARKET SIZE, AVERAGE PRICE, TURBINE MARKET SHARE AND KEY COUNTRY
ANALYSIS TO 2025
13.1 Abbreviations .................................................................................................................. 155
13.2 Research Methodology ................................................................................................... 156
13.2.1 Report Coverage ......................................................................................................... 156
13.2.2 Secondary Research ................................................................................................... 156
13.2.3 Primary Research ....................................................................................................... 157
13.3 Disclaimer ....................................................................................................................... 157
1.1 List of Tables
Table 1: Wind Power Market, Global, Installed Capacity (GW) and Growth (%), 2007–2025 ...................... 25
Table 2: Wind Power Market, Global, Cumulative Installed Capacity Share by Country (%), 2014 ............. 26
Table 3: Wind Power Market, Global, Annual Addition Share by Country (%), 2014 ................................... 27
Table 4: Wind Power Market, Global, Offshore and Onshore Cumulative Installed Capacity Share (%),
2007–2025 .................................................................................................................................. 29
Table 5: Offshore Wind Power Market, Global, Installed Capacity (GW) and Growth (%), 2007–2025........ 32
Table 6: Offshore Wind Power Market, Global, Annual Power Generation (TWh) and Growth (%), 2007–
2025............................................................................................................................................ 34
Table 7: Offshore Wind Power Market, Global, Cumulative Installed Capacity by Country (MW) and Share
(%), 2014 .................................................................................................................................... 37
Table 8: Offshore Wind Power Market, Global, Annual Addition by Country (MW) and Share (%), 2014 .... 38
Table 9: Offshore Wind Power Market, Cost Comparison with Onshore Wind Farms, 2014 ....................... 40
Table 10: Offshore Wind Power Market, Global, Average Capital Cost in Major Countries ($/kW), 2014 ...... 42
Table 11: Offshore Wind Power Market, Global, Levelized Cost of Electricity in Major Countries ($/kWh),
2014............................................................................................................................................ 44
Table 12: Offshore Wind Power Market, Global, Market Size ($bn) and Average Capital Cost ($/kW), 2014–
2025............................................................................................................................................ 46
Offshore Wind Power Market – Global Market Size, Average Price, Turbine Market Share and Key Country Analysis to 2025 11 © GlobalData. This report is a licensed product and is not to be copied, reproduced, shared or resold in any form.
Table of Contents
OFFSHORE WIND POWER MARKET – GLOBAL MARKET SIZE, AVERAGE PRICE, TURBINE MARKET SHARE AND KEY COUNTRY
ANALYSIS TO 2025
Table 13: Offshore Wind Power Market, Global, Average Turbine Size (MW), 2006–2020 ........................... 48
Table 14: Offshore Wind Power Market, Global, Turbine Market Share by Company (%), 2014 ................... 49
Table 15: Offshore Wind Power Market, US, Installed Capacity (MW) and Growth (%), 2016–2025 ............. 57
Table 16: Offshore Wind Power, US, Annual Power Generation (GWh) and Growth (%), 2016–2025 .......... 59
Table 17: Offshore Wind Power Market, US, Top 10 Upcoming Power Plants, 2015 .................................... 59
Table 18: Offshore Wind Power Market, US, Average Turbine Size (MW), 2016–2020 ................................ 61
Table 19: Offshore Wind Power Market, US, Market Size ($bn) and Average Capital Cost ($/kW), 2016–2025
................................................................................................................................................... 63
Table 20: Offshore Wind Power, China, Installed Capacity (MW) and Growth (%), 2007–2025 .................... 67
Table 21: Offshore Wind Power Market, China, Annual Power Generation (GWh) and Growth (%), 2007–
2025............................................................................................................................................ 69
Table 22: Offshore Wind Power Market, China, Top Active Power Plants, 2015 .......................................... 70
Table 23: Offshore Wind Power Market, China, Top 10 Upcoming Power Plants, 2015 ............................... 71
Table 24: Offshore Wind Power Market, China, Average Turbine Size (MW), 2007–2020 ............................ 73
Table 25: Offshore Wind Power Market, China, Assumptions for Levelized Cost of Electricity, 2014–2025 .. 74
Table 26: Offshore Wind Power Market, China, Levelized Cost of Electricity ($/kW), 2014–2025 ................. 75
Table 27: Offshore Wind Power Market, China, Market Size ($bn) and Average Capital Cost ($/kW), 2014–
2025............................................................................................................................................ 77
Table 28: Offshore Wind Power Market, South Korea, Installed Capacity (MW) and Growth (%) 2011–2025
................................................................................................................................................... 80
Table 29: Offshore Wind Power Market, South Korea, Power Generation (GWh) and Growth (%), 2011–2025
................................................................................................................................................... 82
Table 30: Offshore Wind Power Market, South Korea, Top Active Wind Power Plants, 2015 ....................... 82
Table 31: Offshore Wind Power Market, South Korea, Top 10 Upcoming Wind Power Plants, 2015 ............ 83
Table 32: Offshore Wind Power Market, South Korea, Average Turbine Size (MW), 2011–2020 ................. 85
Offshore Wind Power Market – Global Market Size, Average Price, Turbine Market Share and Key Country Analysis to 2025 12 © GlobalData. This report is a licensed product and is not to be copied, reproduced, shared or resold in any form.
Table of Contents
OFFSHORE WIND POWER MARKET – GLOBAL MARKET SIZE, AVERAGE PRICE, TURBINE MARKET SHARE AND KEY COUNTRY
ANALYSIS TO 2025
Table 33: Offshore Wind Power Market, South Korea, Assumptions for Levelized Cost of Electricity
Calculation, 2014–2025 ............................................................................................................... 85
Table 34: Offshore Wind Power Market, China, Levelized Cost of Electricity ($/kWh), 2014–2025 ............... 87
Table 35: Offshore Wind Power Market, South Korea, Market Size ($bn) and Average Capital Cost ($/kW),
2014–2025 .................................................................................................................................. 89
Table 36: Offshore Wind Power Market, UK, Installed Capacity (GW) and Growth (%), 2007–2025 ............. 92
Table 37: Offshore Wind Power Market, UK, Annual Power Generation (GWh) and Growth (%), 2007–2025
................................................................................................................................................... 94
Table 38: Offshore Wind Power Market, UK, Top 10 Active Offshore Wind Power Plants, 2015................... 95
Table 39: Offshore Wind Power Market, UK, Top 10 Upcoming Offshore Wind Power Plants, 2015 ............ 96
Table 40: Offshore Wind Power Market, UK, Share by Manufacturer (%), 2014 ........................................... 97
Table 41: Offshore Wind Power Market, UK, Average Turbine Size (MW), 2007–2020 ................................ 99
Table 42: Offshore Wind Power Market, UK, Assumptions for Levelized Cost of Electricity Calculation, 2014–
2025.......................................................................................................................................... 100
Table 43: Offshore Wind Power Market, UK, Levelized Cost of Electricity ($/kWh), 2014–2025 ................. 101
Table 44: Offshore Wind Power Market, UK, Market Size ($bn) and Average Capital Cost ($/kW), 2014–2025
................................................................................................................................................. 103
Table 45: Offshore Wind Power Market, Germany, Installed Capacity (MW) and Growth (%), 2007–2025 . 106
Table 46: Offshore Wind Power Market, Germany, Annual Power Generation (GWh) and Growth (%), 2007–
2025.......................................................................................................................................... 108
Table 47: Offshore Wind Power Market, Germany, Top 10 Active Wind Power Plants, 2015 ..................... 109
Table 48: Offshore Wind Power Market, Germany, Top 10 Upcoming Offshore Wind Power Plants, 2015 . 110
Table 49: Offshore Wind Power Market, Germany, Average Turbine Size (MW), 2007–2020 .................... 112
Table 50: Offshore Wind Power Market, Germany, Share by Manufacturer (%), 2014 ............................... 113
Table 51: Offshore Wind Power Market, Germany, Assumptions for Levelized Cost of Electricity Calculation,
2014–2025 ................................................................................................................................ 114
Offshore Wind Power Market – Global Market Size, Average Price, Turbine Market Share and Key Country Analysis to 2025 13 © GlobalData. This report is a licensed product and is not to be copied, reproduced, shared or resold in any form.
Table of Contents
OFFSHORE WIND POWER MARKET – GLOBAL MARKET SIZE, AVERAGE PRICE, TURBINE MARKET SHARE AND KEY COUNTRY
ANALYSIS TO 2025
Table 52: Offshore Wind Power Market, Germany, Levelized Cost of Electricity ($/kWh), 2014–2025 ........ 116
Table 53: Offshore Wind Power Market, Germany, Market Size ($bn) and Average Capital Cost ($/kW),
2014–2025 ................................................................................................................................ 118
Table 54: Offshore Wind Power Market, Netherlands, Installed Capacity (GW) and Growth (%), 2007–2025
................................................................................................................................................. 121
Table 55: Offshore Wind Power Market, Netherlands, Annual Power Generation (GWh) and Growth (%),
2007–2025 ................................................................................................................................ 123
Table 56: Offshore Wind Power Market, Netherlands, Top 10 Active Wind Power Plants, 2015 ................. 124
Table 57: Offshore Wind Power Market, Netherlands, Top Upcoming Wind Power Plants, 2015 ................ 124
Table 58: Offshore Wind Power Market, Netherlands, Share by Manufacturer (%), 2014 ........................... 126
Table 59: Offshore Wind Power Market, Netherlands, Assumptions for LCOE Calculation, 2014–2025 ..... 126
Table 60: Offshore Wind Power Market, Netherlands, LCOE ($/kWh), 2014–2025 .................................... 128
Table 61: Offshore Wind Power Market, Netherlands, Market Size ($bn) and Average Capital Cost ($/kW),
2014–2025 ................................................................................................................................ 130
Table 62: Offshore Wind Power Market, Belgium, Installed Capacity (MW) and Growth (%), 2009–2025 ... 133
Table 63: Offshore Wind Power Market, Belgium, Annual Power Generation (GWh) and Growth (%), 2009–
2025.......................................................................................................................................... 135
Table 64: Offshore Wind Power Market, Belgium, Top Active Wind Power Plants, 2015 ............................ 136
Table 65: Offshore Wind Power Market, Belgium, Top Upcoming Wind Power Plants, 2015 ...................... 136
Table 66: Offshore Wind Power Market, Belgium, Share by Manufacturer (%), 2014 ................................. 138
Table 67: Offshore Wind Power Market, Belgium, Assumptions for Levelized Cost of Electricity Calculation,
2014–2025 ................................................................................................................................ 138
Table 68: Offshore Wind Power Market, Belgium, Levelized Cost of Electricity ($/kWh), 2014–2025 ......... 140
Table 69: Offshore Wind Power Market, Belgium, Market Size ($bn) and Average Capital Cost ($/kW), 2014–
2025.......................................................................................................................................... 142
Table 70: Offshore Wind Power Market, Denmark, Installed Capacity (MW) and Growth (%), 2007–2025 . 145
Offshore Wind Power Market – Global Market Size, Average Price, Turbine Market Share and Key Country Analysis to 2025 14 © GlobalData. This report is a licensed product and is not to be copied, reproduced, shared or resold in any form.
Table of Contents
OFFSHORE WIND POWER MARKET – GLOBAL MARKET SIZE, AVERAGE PRICE, TURBINE MARKET SHARE AND KEY COUNTRY
ANALYSIS TO 2025
Table 71: Offshore Wind Power Market, Denmark, Annual Power Generation (GWh) and Growth (%), 2007–
2025.......................................................................................................................................... 147
Table 72: Offshore Wind Power Market, Denmark, Top Active Offshore Wind Power Plants, 2014, ........... 148
Table 73: Offshore Wind Power Market, Denmark, Top Upcoming Offshore Wind Power Plants, 2014, ..... 148
Table 74: Offshore Wind Power Market, Denmark, Share by Manufacturer (%), 2014 ............................... 150
Table 75: Offshore Wind Power Market, Denmark, Assumptions for Levelized Cost of Electricity Calculation,
2014–2025 ................................................................................................................................ 150
Table 76: Offshore Wind Power Market, Denmark, Levelized Cost of Electricity ($/kWh), 2014–2025 ........ 152
Table 77: Offshore Wind Power Market, Denmark, Market Size ($bn) and Average Capital Cost ($/kW),
2014–2025 ................................................................................................................................ 154
Table 78: Abbreviations ............................................................................................................................ 155
1.2 List of Figures
Figure 1: Wind Power Market, Wind Turbine Components .......................................................................... 21
Figure 2: Wind Power Market, Global, Installed Capacity (GW) and Growth (%), 2007–2025 ...................... 24
Figure 3: Wind Power Market, Global, Cumulative Installed Capacity Share by Country (%), 2014 ............. 26
Figure 4: Wind Power Market, Global, Annual Addition Share by Country (%), 2014 ................................... 27
Figure 5: Wind Power Market, Global, Offshore and Onshore Cumulative Installed Capacity Share (%),
2007–2025 .................................................................................................................................. 28
Figure 6: Offshore Wind Power Market, Global, Installed Capacity (GW) and Growth (%), 2007–2025........ 31
Figure 7: Offshore Wind Power Market, Global, Annual Power Generation (TWh) and Growth (%), 2007–
2025............................................................................................................................................ 33
Figure 8: Offshore Wind Power Market, Global, Cumulative Installed Capacity Share by Country (%), 2014
................................................................................................................................................... 35
Figure 9: Offshore Wind Power Market, Global, Cumulative Installed Capacity by Country (MW), 2014 ...... 36
Figure 10: Offshore Wind Power Market, Global, Annual Addition Share by Country (%), 2014..................... 37
Offshore Wind Power Market – Global Market Size, Average Price, Turbine Market Share and Key Country Analysis to 2025 15 © GlobalData. This report is a licensed product and is not to be copied, reproduced, shared or resold in any form.
Table of Contents
OFFSHORE WIND POWER MARKET – GLOBAL MARKET SIZE, AVERAGE PRICE, TURBINE MARKET SHARE AND KEY COUNTRY
ANALYSIS TO 2025
Figure 11: Offshore Wind Power Market, Global, Annual Addition by Country (MW), 2014 ............................ 38
Figure 12: Wind Power Market, Global, Value Chain Activities...................................................................... 39
Figure 13: Offshore Wind Power Market, Global, Average Capital Cost in Major Countries ($/kW), 2014 ...... 41
Figure 14: Offshore Wind Power Market, Global, Levelized Cost of Electricity in Major Countries ($/kWh),
2014............................................................................................................................................ 43
Figure 15: Offshore Wind Power Market, Global, Market Size ($bn) and Average Capital Cost ($/kW), 2014–
2025............................................................................................................................................ 45
Figure 16: Offshore Wind Power Market, Global, Average Turbine Size (MW), 2006–2020 ........................... 47
Figure 17: Offshore Wind Power Market, Global, Turbine Market Share by Company (%), 2014 ................... 49
Figure 18: Offshore Wind Power Market, US, Installed Capacity (MW) and Growth (%), 2016–2025 ............. 56
Figure 19: Offshore Wind Power, US, Annual Power Generation (GWh) and Growth (%), 2016–2025 .......... 58
Figure 20: Offshore Wind Power Market, US, Average Turbine Size (MW), 2016–2020 ................................ 60
Figure 21: Offshore Wind Power Market, US, Market Size ($bn) and Average Capital Cost ($/kW), 2016–2025
................................................................................................................................................... 62
Figure 22: Offshore Wind Power, China, Installed Capacity (MW) and Growth (%), 2007–2025 .................... 66
Figure 23: Offshore Wind Power Market, China, Annual Power Generation (GWh) and Growth (%),(%), 2007–
2025............................................................................................................................................ 68
Figure 24: Offshore Wind Power Market, China, Average Turbine Size (MW), 2007–2020 ............................ 72
Figure 25: Offshore Wind Power Market, China, Levelized Cost of Electricity ($/kW), 2014–2025 ................. 74
Figure 26: Offshore Wind Power Market, China, Market Size ($bn) and Average Capital Cost ($/kW), 2014–
2025............................................................................................................................................ 76
Figure 27: Offshore Wind Power Market, South Korea, Installed Capacity (MW) and Growth (%), 2011–2025
................................................................................................................................................... 79
Figure 28: Offshore Wind Power Market, South Korea, Annual Power Generation (GWh) and Growth (%),
2011–2025 .................................................................................................................................. 81
Figure 29: Offshore Wind Power Market, South Korea, Average Turbine Size (MW), 2011–2020 ................. 84
Offshore Wind Power Market – Global Market Size, Average Price, Turbine Market Share and Key Country Analysis to 2025 16 © GlobalData. This report is a licensed product and is not to be copied, reproduced, shared or resold in any form.
Table of Contents
OFFSHORE WIND POWER MARKET – GLOBAL MARKET SIZE, AVERAGE PRICE, TURBINE MARKET SHARE AND KEY COUNTRY
ANALYSIS TO 2025
Figure 30: Offshore Wind Power Market, South Korea, Levelized Cost of Electricity ($/kWh), 2014–2025 ..... 86
Figure 31: Offshore Wind Power Market, South Korea, Market Size ($bn) and Average Capital Cost ($/kW),
2014–2025 .................................................................................................................................. 88
Figure 32: Offshore Wind Power Market, UK, Installed Capacity (GW), 2007–2025 ...................................... 91
Figure 33: Offshore Wind Power Market, UK, Annual Power Generation (GWh), 2007–2025 ........................ 93
Figure 34: Offshore Wind Power Market, UK, Share by Manufacturer (%), 2014 ........................................... 97
Figure 35: Offshore Wind Power Market, UK, Average Turbine Size (MW), 2007–2020 ................................ 98
Figure 36: Offshore Wind Power Market, UK, LCOE ($/kWh), 2014–2025 .................................................. 100
Figure 37: Offshore Wind Power Market, UK, Market Size ($bn) and Average Capital Cost ($/kW), 2014–2025
................................................................................................................................................. 102
Figure 38: Offshore Wind Power Market, Germany, Installed Capacity (MW) and Growth (%), 2007–2025 . 105
Figure 39: Offshore Wind Power Market, Germany, Annual Power Generation (GWh) and Growth (%), 2007–
2025.......................................................................................................................................... 107
Figure 40: Offshore Wind Power Market, Germany, Average Turbine Size (MW), 2007–2020 .................... 111
Figure 41: Offshore Wind Power Market, Germany, Share by Manufacturer (%), 2014 ............................... 113
Figure 42: Offshore Wind Power Market, Germany, Levelized Cost of Electricity ($/kWh), 2014–2025 ........ 115
Figure 43: Offshore Wind Power Market, Germany, Market Size ($bn) and Average Capital Cost ($/kW),
2014–2025 ................................................................................................................................ 117
Figure 44: Offshore Wind Power Market, Netherlands, Installed Capacity (GW) and Growth (%), 2007–2025
................................................................................................................................................. 120
Figure 45: Offshore Wind Power Market, Netherlands, Annual Power Generation (GWh) and Growth (%),
2007–2025 ................................................................................................................................ 122
Figure 46: Offshore Wind Power Market, Netherlands, Share by Manufacturer (%), 2014 ........................... 125
Figure 47: Offshore Wind Power Market, Netherlands, LCOE ($/kWh), 2014–2025 .................................... 127
Figure 48: Offshore Wind Power Market, Netherlands, Market Size ($bn) and Average Capital Cost ($/kW),
2014–2025 ................................................................................................................................ 129
Offshore Wind Power Market – Global Market Size, Average Price, Turbine Market Share and Key Country Analysis to 2025 17 © GlobalData. This report is a licensed product and is not to be copied, reproduced, shared or resold in any form.
Table of Contents
OFFSHORE WIND POWER MARKET – GLOBAL MARKET SIZE, AVERAGE PRICE, TURBINE MARKET SHARE AND KEY COUNTRY
ANALYSIS TO 2025
Figure 49: Offshore Wind Power Market, Belgium, Installed Capacity (MW) and Growth (%), 2009–2025 ... 132
Figure 50: Offshore Wind Power Market, Belgium, Annual Power Generation (GWh) and Growth (%), 2009–
2025.......................................................................................................................................... 134
Figure 51: Offshore Wind Power Market, Belgium, Share by Manufacturer (%), 2014 ................................. 137
Figure 52: Offshore Wind Power Market, Belgium, Levelized Cost of Electricity ($/kWh), 2014–2025 ......... 139
Figure 53: Offshore Wind Power Market, Belgium, Market Size ($bn) and Average Capital Cost ($/kW), 2014–
2025.......................................................................................................................................... 141
Figure 54: Offshore Wind Power Market, Denmark, Installed Capacity (MW) and Growth (%), 2007–2025 . 144
Figure 55: Offshore Wind Power Market, Denmark, Annual Power Generation (GWh) and Growth (%), 2007–
2025.......................................................................................................................................... 146
Figure 56: Offshore Wind Power Market, Denmark, Share by Manufacturer (%), 2014 ............................... 149
Figure 57: Offshore Wind Power Market, Denmark, Levelized Cost of Electricity ($/kWh), 2014–2025 ........ 151
Figure 58: Offshore Wind Power Market, Denmark, Market Size ($bn) and Average Capital Cost ($/kW),
2014–2025 ................................................................................................................................ 153
Offshore Wind Power Market – Global Market Size, Average Price, Turbine Market Share and Key Country Analysis to 2025 18 © GlobalData. This report is a licensed product and is not to be copied, reproduced, shared or resold in any form.
OFFSHORE WIND POWER MARKET – GLOBAL MARKET SIZE, AVERAGE PRICE, TURBINE MARKET SHARE AND KEY COUNTRY
ANALYSIS TO 2025
Introduction
2 Introduction
2.1 Wind Power Market, Technology Definition
Wind power is an alternative source of energy generated from the flow of air currents through a
wind turbine. It is considered a clean source of energy as it does not emit carbon.
A wind turbine harnesses kinetic energy in the wind and converts it into electricity for residential,
commercial and industrial purposes. A wind farm comprises a group of wind turbines, potentially
hundreds, in the same location and connected to an electric power transmission system.
Wind power is classified into onshore and offshore according to whether the wind farm is located
on land or in a large body of water.
2.2 Wind Power Market, Technology Overview
A wind turbine is a device that converts kinetic energy from wind into electricity, also known as a
wind generator, Wind Turbine Generator (WTG), wind power unit, wind energy converter, or aero-
generator.
Wind turbines are broadly classified into two types according to design:
Horizontal Axis Wind Turbine (HAWT)
Vertical Axis Wind Turbine (VAWT)
The HAWT is the most common and the simplest type of wind turbine. Most operate on a horizontal
axis with three blades that are attached to a rotor from which the electricity is transferred to a
generator though a gearbox, both of which are contained in a nacelle. Some turbines do not have
gearboxes and instead transfer electricity directly to the generator. Electricity is then transmitted to
the transformer and fed into the grid through transmission lines, resulting in efficient and cost-
effective turbine technology.
The VAWT, in which the main rotor shaft is arranged vertically, is less popular due to its lower
efficiency, meaning that it is largely sourced by individual inventors.
Offshore Wind Power Market – Global Market Size, Average Price, Turbine Market Share and Key Country Analysis to 2025 22 © GlobalData. This report is a licensed product and is not to be copied, reproduced, shared or resold in any form.
OFFSHORE WIND POWER MARKET – GLOBAL MARKET SIZE, AVERAGE PRICE, TURBINE MARKET SHARE AND KEY COUNTRY
ANALYSIS TO 2025
Introduction
2.4 Global Report Guidance
The report begins with an executive summary, which gives a snapshot of the offshore wind
power market.
The “Introduction” section provides a brief overview of wind power technology, covering the
different types of turbines.
The “Wind Power Market, Global, 2007–2025” section details global wind power developments
during the 2007–2014 historic period and expected market trends during the 2015–2025
forecast period. It starts with an overview of the global market, covering parameters such as
market size, power capacity and generation data, country share and split by onshore – offshore
wind.
“Offshore Wind Power Market, Global, 2007–2025” section covers information on installed
capacity, power generation, installed capacity of key countries, installed capacity of individual
manufacturers, drivers and restraints and market trends.
Section 6–13 gives information on offshore wind power markets in the following countries: the
US, China, South Korea, the UK, Germany, Netherlands, Belgium and Denmark. Under each
country, the cumulative installed offshore wind capacity and offshore wind power generation
during 2007–2025 is provided. Along with this, the average offshore turbine size expected to
come online, top active and upcoming power plants and average capital cost and market size
for the 2014–2025 period is provided.
Offshore Wind Power Market – Global Market Size, Average Price, Turbine Market Share and Key Country Analysis to 2025 23 © GlobalData. This report is a licensed product and is not to be copied, reproduced, shared or resold in any form.
Wind Power Market, Global
OFFSHORE WIND POWER MARKET – GLOBAL MARKET SIZE, AVERAGE PRICE, TURBINE MARKET SHARE AND KEY COUNTRY
ANALYSIS TO 2025
3 Wind Power Market, Global, 2007–2025
3.1 Wind Power Market, Global, Overview
Wind is one the fastest growing energy sources in the world. From an emerging fuel source XX
years ago, it has transformed into a commercial electricity-generating technology in more than XX
countries. Technological developments have paved the way for more effective and reliable
equipment and machinery, making wind one of the fastest-growing energy sources globally. The
exponential growth of the wind energy market is fueled by depleting fossil fuel reserves, the
declining cost of wind power generation, and growing environmental awareness, and is being
supported by financial incentives from various governments across the world.
The global wind power market consists primarily of onshore power capacity. However, a great deal
of potential for offshore wind installations exists. If the offshore market is properly developed, it has
the potential to meet seven times the energy demands of Europe and four times that of the US.
Offshore wind technology is currently at a nascent stage of development; construction costs are
high and more advanced materials and equipment are required. Despite this, many governments
worldwide have incorporated offshore wind in their energy plans.
More than XX% of the global offshore wind power is installed in the water bodies of Northern
Europe, and this has helped the region to keep pace with its binding targets of deriving XX% of its
energy consumption from renewable energy sources.
3.2 Wind Power Market, Global, Installed Capacity, 2007–2025
The global wind power market has grown rapidly in the past few years, with annual installations
increasing from XX Gigawatts (GW) in 2007 to XX GW in 2014. Global installed wind capacity has
almost doubled every three years since 2001. Growth in the installed capacity during the historical
period was driven largely by the favorable government policies for wind power in major countries
such as China, the US, Germany, Spain, the UK and India.
The outlook for the wind energy sector appears bright, although future growth is expected to slow
during the forecast period. This is mainly due to continuing uncertainties in the US market and the
maturing European market. Wind installations will continue to expand in the forecast period though,
mainly driven by the Asia-Pacific region. Asia-Pacific was the fastest growing wind market in 2014,
and will continue as such in the forecast period due to large-scale installations in China (although
Offshore Wind Power Market – Global Market Size, Average Price, Turbine Market Share and Key Country Analysis to 2025 24 © GlobalData. This report is a licensed product and is not to be copied, reproduced, shared or resold in any form.
Wind Power Market, Global
OFFSHORE WIND POWER MARKET – GLOBAL MARKET SIZE, AVERAGE PRICE, TURBINE MARKET SHARE AND KEY COUNTRY
ANALYSIS TO 2025
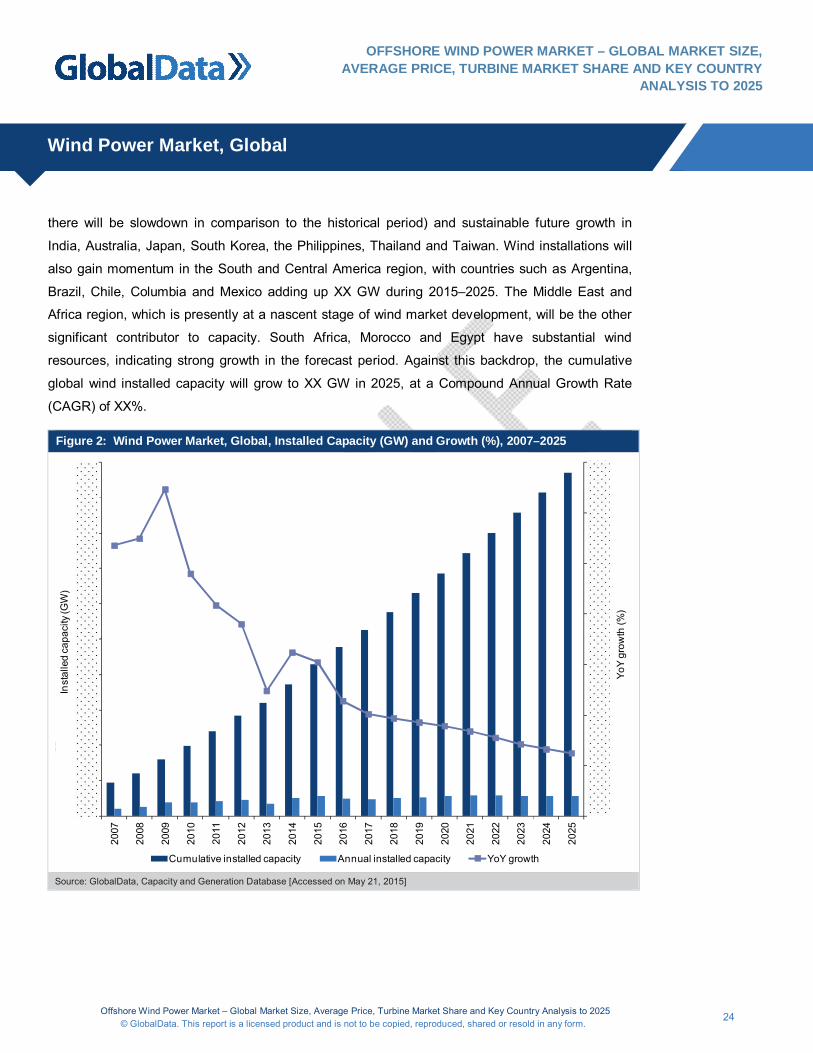
there will be slowdown in comparison to the historical period) and sustainable future growth in
India, Australia, Japan, South Korea, the Philippines, Thailand and Taiwan. Wind installations will
also gain momentum in the South and Central America region, with countries such as Argentina,
Brazil, Chile, Columbia and Mexico adding up XX GW during 2015–2025. The Middle East and
Africa region, which is presently at a nascent stage of wind market development, will be the other
significant contributor to capacity. South Africa, Morocco and Egypt have substantial wind
resources, indicating strong growth in the forecast period. Against this backdrop, the cumulative
global wind installed capacity will grow to XX GW in 2025, at a Compound Annual Growth Rate
(CAGR) of XX%.
Figure 2: Wind Power Market, Global, Installed Capacity (GW) and Growth (%), 2007–2025
2007
2008
2009
2010
2011
2012
2013
2014
2015
2016
2017
2018
2019
2020
2021
2022
2023
2024
2025
YoY
grow
th (%
)
Inst
alle
d ca
paci
ty (G
W)
Cumulative installed capacity Annual installed capacity YoY growth
Source: GlobalData, Capacity and Generation Database [Accessed on May 21, 2015]
Offshore Wind Power Market – Global Market Size, Average Price, Turbine Market Share and Key Country Analysis to 2025 27 © GlobalData. This report is a licensed product and is not to be copied, reproduced, shared or resold in any form.
Wind Power Market, Global
OFFSHORE WIND POWER MARKET – GLOBAL MARKET SIZE, AVERAGE PRICE, TURBINE MARKET SHARE AND KEY COUNTRY
ANALYSIS TO 2025
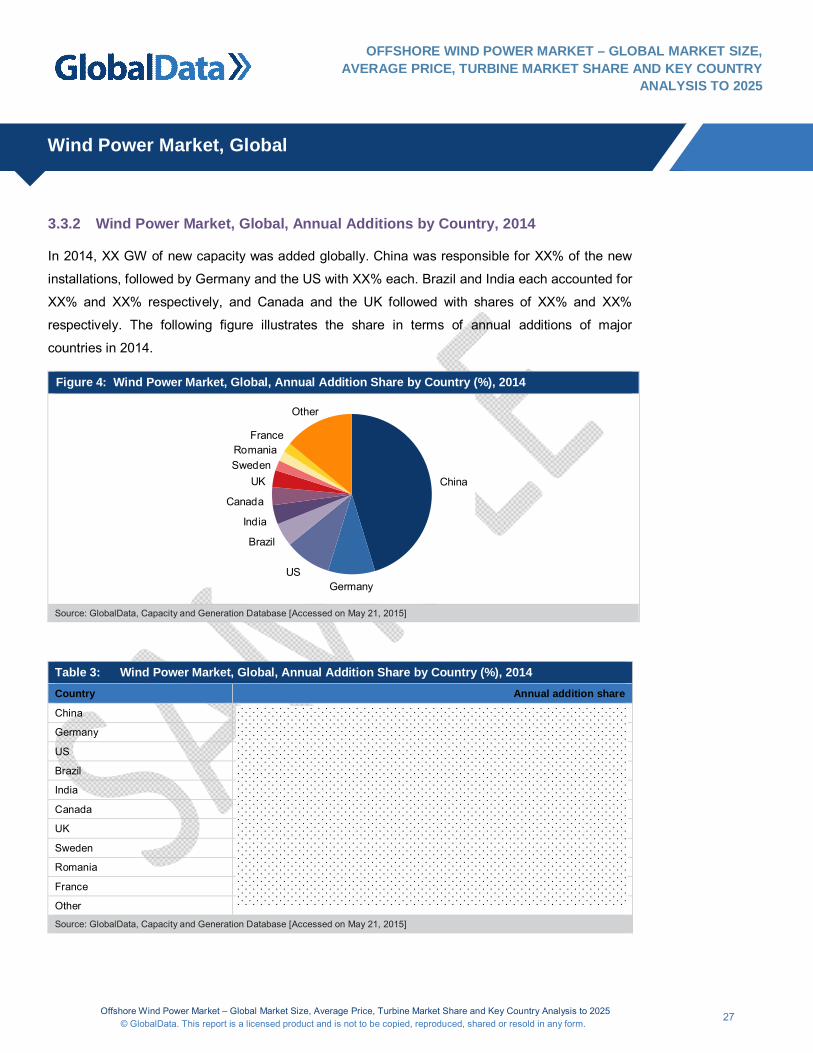
3.3.2 Wind Power Market, Global, Annual Additions by Country, 2014
In 2014, XX GW of new capacity was added globally. China was responsible for XX% of the new
installations, followed by Germany and the US with XX% each. Brazil and India each accounted for
XX% and XX% respectively, and Canada and the UK followed with shares of XX% and XX%
respectively. The following figure illustrates the share in terms of annual additions of major
countries in 2014.
Figure 4: Wind Power Market, Global, Annual Addition Share by Country (%), 2014
China
GermanyUS
Brazil
India
Canada
UKSwedenRomania
France
Other
Source: GlobalData, Capacity and Generation Database [Accessed on May 21, 2015]
Table 3: Wind Power Market, Global, Annual Addition Share by Country (%), 2014 Country Annual addition share
China
Germany
US
Brazil
India
Canada
UK
Sweden
Romania
France
Other
Source: GlobalData, Capacity and Generation Database [Accessed on May 21, 2015]
Offshore Wind Power Market – Global Market Size, Average Price, Turbine Market Share and Key Country Analysis to 2025 155 © GlobalData. This report is a licensed product and is not to be copied, reproduced, shared or resold in any form.
Appendix
OFFSHORE WIND POWER MARKET – GLOBAL MARKET SIZE, AVERAGE PRICE, TURBINE MARKET SHARE AND KEY COUNTRY
ANALYSIS TO 2025
13 Appendix
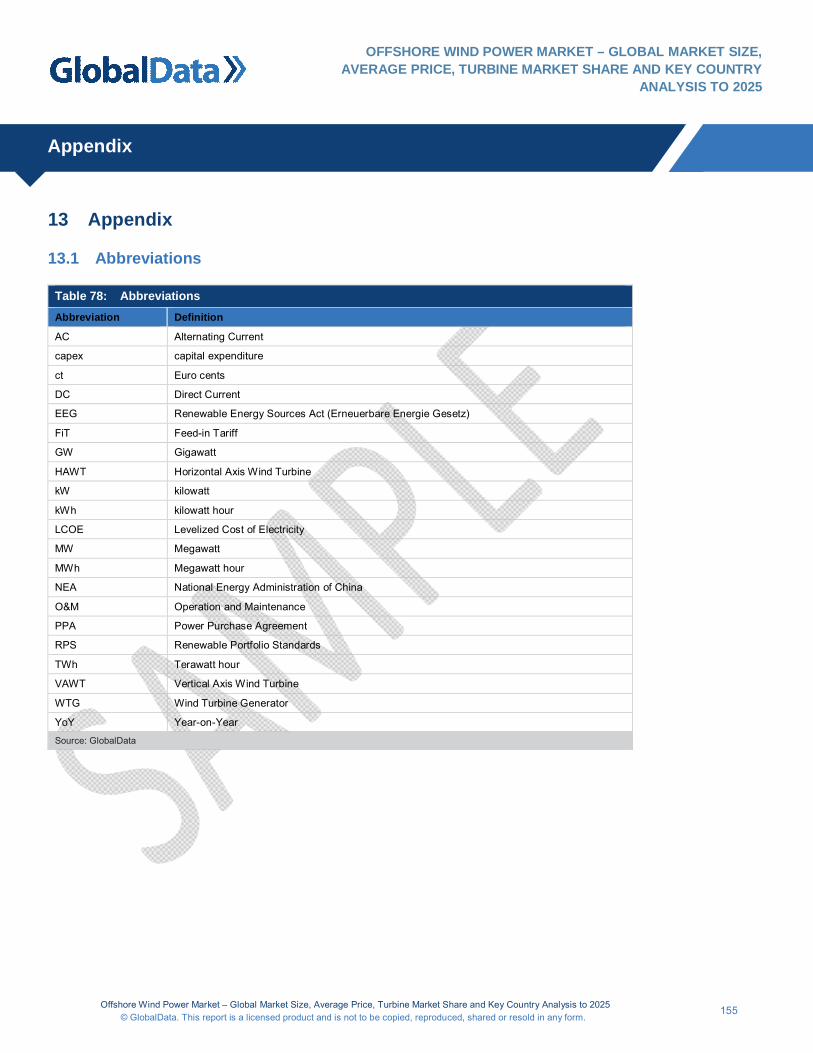
13.1 Abbreviations
Table 78: Abbreviations Abbreviation Definition
AC Alternating Current
capex capital expenditure
ct Euro cents
DC Direct Current
EEG Renewable Energy Sources Act (Erneuerbare Energie Gesetz)
FiT Feed-in Tariff
GW Gigawatt
HAWT Horizontal Axis Wind Turbine
kW kilowatt
kWh kilowatt hour
LCOE Levelized Cost of Electricity
MW Megawatt
MWh Megawatt hour
NEA National Energy Administration of China
O&M Operation and Maintenance
PPA Power Purchase Agreement
RPS Renewable Portfolio Standards
TWh Terawatt hour
VAWT Vertical Axis Wind Turbine
WTG Wind Turbine Generator
YoY Year-on-Year
Source: GlobalData
Offshore Wind Power Market – Global Market Size, Average Price, Turbine Market Share and Key Country Analysis to 2025 156 © GlobalData. This report is a licensed product and is not to be copied, reproduced, shared or resold in any form.
Appendix
OFFSHORE WIND POWER MARKET – GLOBAL MARKET SIZE, AVERAGE PRICE, TURBINE MARKET SHARE AND KEY COUNTRY
ANALYSIS TO 2025
13.2 Research Methodology
GlobalData’s dedicated research and analysis teams consist of experienced professionals with
advanced statistical expertise and marketing, market research and consulting backgrounds in the
energy industry.
GlobalData adheres to the codes of practice of the Market Research Society (www.mrs.org.uk) and
Strategic and Competitive Intelligence Professionals (www.scip.org).
All of GlobalData’s databases are continuously updated and revised. The following methodology
has been followed for the collection and analysis of data presented in this report.
13.2.1 Report Coverage
The report provides:
Information at global level and for key offshore countries: China, the US, the UK, Germany, the
Netherlands, South Korea, Belgium, and Denmark
Historic and forecast data for cumulative and annual installed offshore wind power capacity
and annual power generation during the 2007–2025 period, both globally and for key countries
Average offshore wind turbine size data and the market shares of major manufacturers in 2014
at global and key country level
Drivers and challenges related to the global offshore wind power market
Capital cost and market size at key country and global level, as well as the top active and
upcoming offshore wind power plants at country level
13.2.2 Secondary Research
The research process begins with extensive secondary research using GlobalData's proprietary
databases and external sources.
Investment estimates and market growth rates are determined by taking the following into
consideration:
Company websites: whitepapers, press releases, news and annual reports
Industry trade journals, magazines and other literature: news articles and research studies
Offshore Wind Power Market – Global Market Size, Average Price, Turbine Market Share and Key Country Analysis to 2025 157 © GlobalData. This report is a licensed product and is not to be copied, reproduced, shared or resold in any form.
Appendix
OFFSHORE WIND POWER MARKET – GLOBAL MARKET SIZE, AVERAGE PRICE, TURBINE MARKET SHARE AND KEY COUNTRY
ANALYSIS TO 2025
Industry associations, energy agencies and other government bodies
Internal proprietary databases such as our alternative energy eTrack and power eTrack
Information related to average price of towers, production capacity and actual production of tower
manufacturers individually and collectively in each country, has been obtained through extensive
secondary research.
13.2.3 Primary Research
GlobalData conducts extensive primary interviews with industry participants and commentators in
order to validate its data and analysis.
A typical research interview fulfills the following functions:
Obtains the interviewee’s perspective on the market size, growth trends, competitive landscape
and future outlook
Validates secondary research findings
Further develop the analysis team’s expertise and market understanding
Key representatives of independent tower and wind turbine generator manufacturing companies
have been interviewed in order to perform the cost analysis of wind turbine towers and also to
validate the data and analysis of average price, production capacity and production numbers of
companies that have further been used in calculating market shares.
13.3 Disclaimer
All Rights Reserved.
No part of this publication may be reproduced, stored in a retrieval system or transmitted in any
form by any means, electronic, mechanical, photocopying, recording or otherwise, without the prior
permission of the publisher, GlobalData.


![602-150211 Offshore Wind Market Analysis [WEB EDIT]](https://img.pdfslide.net/doc/110x75/577d24511a28ab4e1e9c2a6d/602-150211-offshore-wind-market-analysis-web-edit.jpg)