Embed Size (px)
Citation preview


OFFSHORE DEPLOYMENTBy
Peter Blott
Technical Director – Mayflower Energy Limited

Why offshore deployment ?
Physical area required in competition with other users (population, agriculture, leisure etc)
Environmental impact (visibility, noise etc)
Size of resource (energy density)
Lack of Suitable Onshore Sites
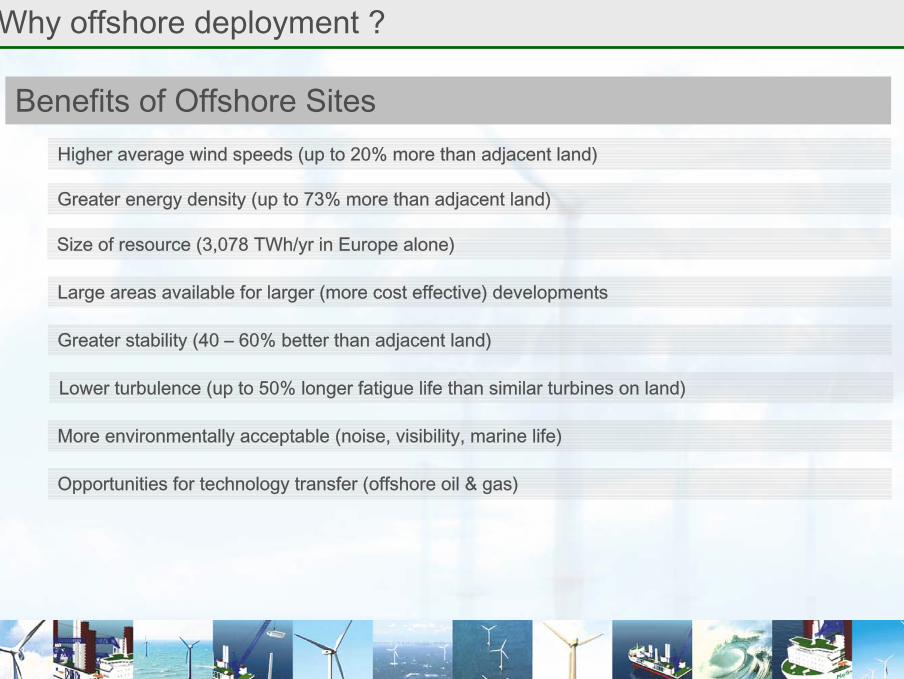
Why offshore deployment ?
Higher average wind speeds (up to 20% more than adjacent land)
Greater energy density (up to 73% more than adjacent land)
Size of resource (3,078 TWh/yr in Europe alone)
Benefits of Offshore Sites
Large areas available for larger (more cost effective) developments
Greater stability (40 – 60% better than adjacent land)
Lower turbulence (up to 50% longer fatigue life than similar turbines on land)
More environmentally acceptable (noise, visibility, marine life)
Opportunities for technology transfer (offshore oil & gas)

Why offshore deployment ?
European Wind Speed & Energy Density Distribution Wind resources over open sea (more than 10 km offshore) for five standard heights
10mms-1/Wm-
2
25mms-1/Wm-
2
50mms-1/Wm-
2
100mms-1/Wm-
2
200mms-
1/Wm-2
Blue > 8.0> 600
> 8.5> 700
> 9.0> 800
> 10.0> 1100
> 11.0> 1500
Red 7.0-8.0350-600
7.5-8.5450-700
8.0-9.0600-800
8.5-10.0650-1100
9.5-11.0900-1500
Yellow 6.0-7.0250-300
6.5-7.5300-450
7.0-8.0400-600
7.5-8.5450-650
8.0-9.5600-900
Green 4.5-6.0100-250
5.0-6.5150-300
5.5-7.0200-400
6.0-7.5250-450
6.5-8.0300-600
Light Blue
< 4.5< 100
< 5.0< 150
< 5.5< 200
< 6.0< 250
< 6.5
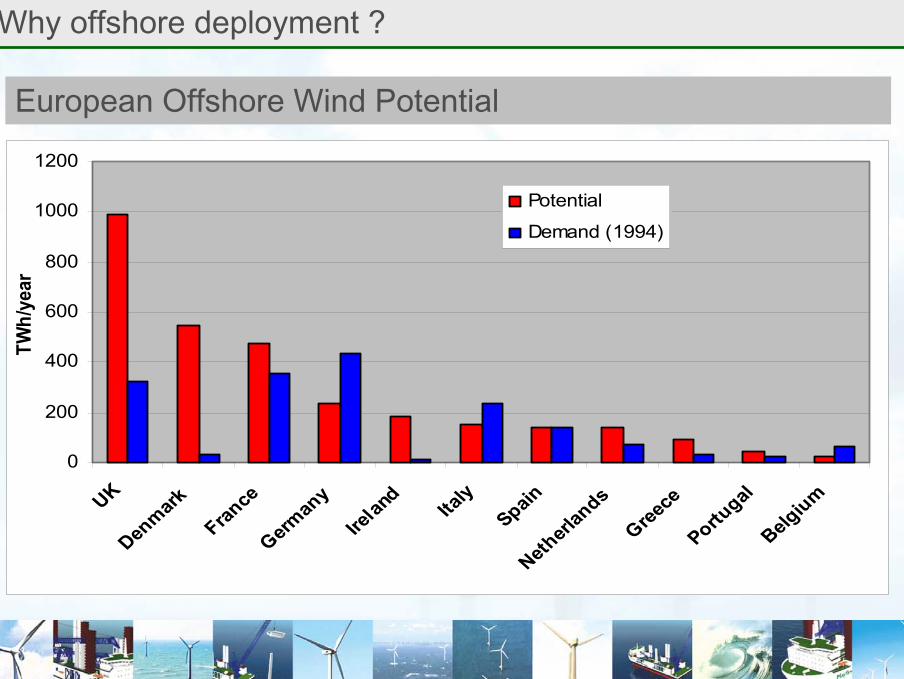
Why offshore deployment ?
European Offshore Wind Potential
0
200
400
600
800
1000
1200
UKDen
markFran
ceGerm
any
Irelan
d
Italy
SpainNeth
erlan
dsGree
cePortu
galBelg
ium
TWh/
year
Potential
Demand (1994)

Why offshore deployment ?
Current & Planned European Offshore Developments
UK : 1080 Mw Denmark : 795 Mw Sweden : 3511 Mw
Netherlands : 4148 Mw
Ireland : 910 Mw Germany : 13396 Mw
France : 50 Mw
Belgium : 500 Mw

The challenges of offshore deployment
REDUCING COST !TURBINES
Increase in cost of similar size onshore and offshore machines insignificant
Increase size of turbine : reduce cost / Mw

The challenges of offshore deployment
REDUCING COST !GRID CONNECTION
Onshore : 3% of project cost
Offshore : 14% of project cost
Increase size of turbine : reduce number of connections – reduce costs
Increase size of development : larger cable – reduced costs / Mw

The challenges of offshore deployment
REDUCING COST !FOUNDATIONS
Onshore : 6% of project cost
Onshore : 23% of project cost
Increase size of turbine : reduced number of installations / reduced costs / Mw
Technology transfer from offshore Oil & Gas development
Monopiles
Gravity Bases
Tripods / Jackets
Re-use

The challenges of offshore deployment
REDUCING COST !INSTALLATION
Increased turbine and development size : additional emphasis on installation techniques
Inshore construction methods : limited by capacity & installation rate
Offshore (Oil & Gas) construction methods : limited by water depth, cost, & installation rate
INSTALLATION IS THE KEY !

The ‘ideal’ offshore installation system
Minimal or no external support vessels such as tugs, anchor handlers, cargo barges etc
IN FIELD SUPPORT
Sufficient for all crew for 24 hour working for long periods
ACCOMODATION
Onboard capacity for a large number of turbines & foundations
TRANSPORT CAPCapable of very accurate positioningMANOUVERABILITYMust be able to operate in very shallow waterDRAUGHTMinimal downtime due to weatherWEATHER
Able to install large numbers of turbines in short period
RATEGood capacity – min number of lifts – larger turbinesCAPACITYLow cost of mobilisation & operationCOST

Review of current installation techniques
Inshore Cranes Barges
HighIN FIELD SUPPORT
PoorACCOMODATION
MediumTRANSPORT CAP
PoorMANOUVERABILITY
FairDRAUGHT
PoorWEATHER
PoorRATE
FairCAPACITY
LowCOST

Review of current installation techniques
Shear Leg Barges
HighIN FIELD SUPPORT
PoorACCOMODATION
PoorTRANSPORT CAP
PoorMANOUVERABILITY
PoorDRAUGHT
PoorWEATHER
PoorRATE
GoodCAPACITY
MediumCOST
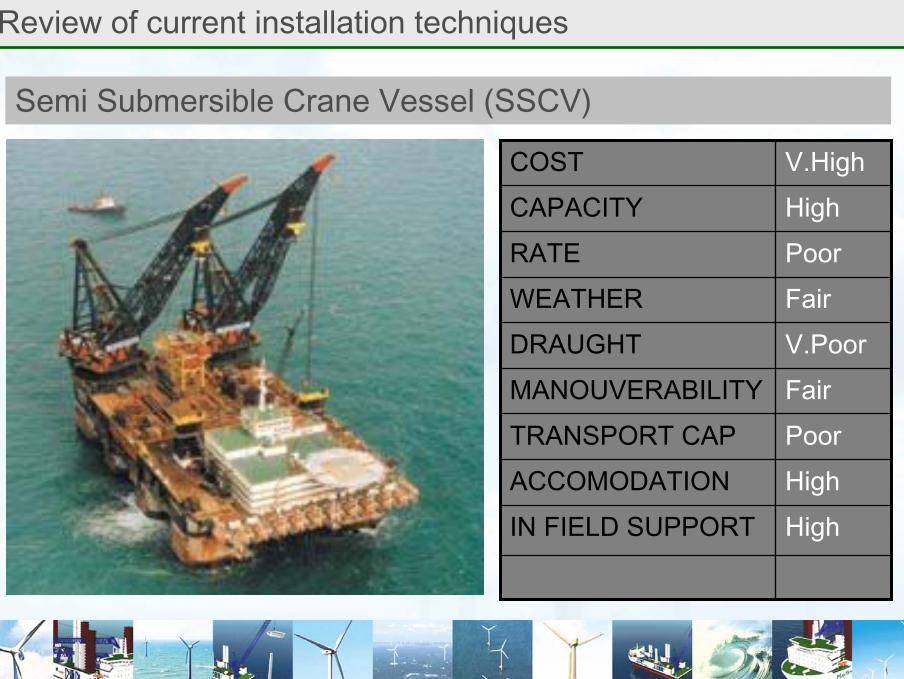
Review of current installation techniques
Semi Submersible Crane Vessel (SSCV)
HighIN FIELD SUPPORT
HighACCOMODATION
PoorTRANSPORT CAP
FairMANOUVERABILITY
V.PoorDRAUGHT
FairWEATHER
PoorRATE
HighCAPACITY
V.HighCOST
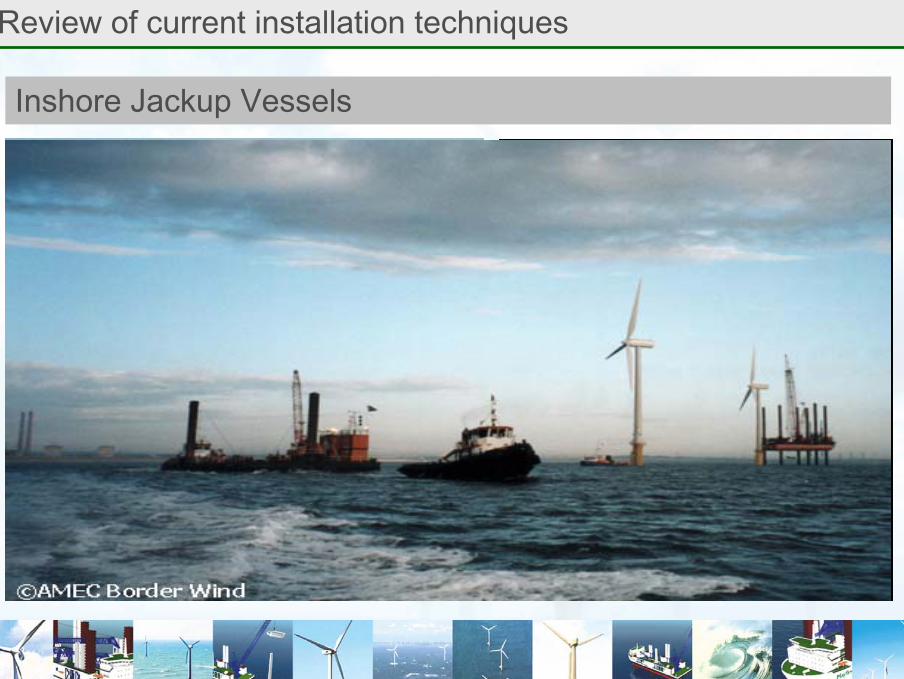
Review of current installation techniques
Inshore Jackup Vessels
HighIN FIELD SUPPORT
PoorACCOMODATION
PoorTRANSPORT CAP
PoorMANOUVERABILITY
FairDRAUGHT
FairWEATHER
PoorRATE
FairCAPACITY
LowCOST

Review of current installation techniques
Offshore Jackup Vessels
HighIN FIELD SUPPORT
FairACCOMODATION
PoorTRANSPORT CAP
PoorMANOUVERABILITY
FairDRAUGHT
FairWEATHER
PoorRATE
PoorCAPACITY
HighCOST

Review of current installation techniques
Summary of Current Offshore Installation Vessels
Offshore Jackup Vessel
Inshore Jackup Vessel
Semi Submersible
Crane Vessel
Shear Leg Barge
Inshore Crane Barge
In Field Support
Accom
mo
dation
Transport C
apacity
Manoeuvra
bility
Draught
Weather
Rate
Capacity
Cost
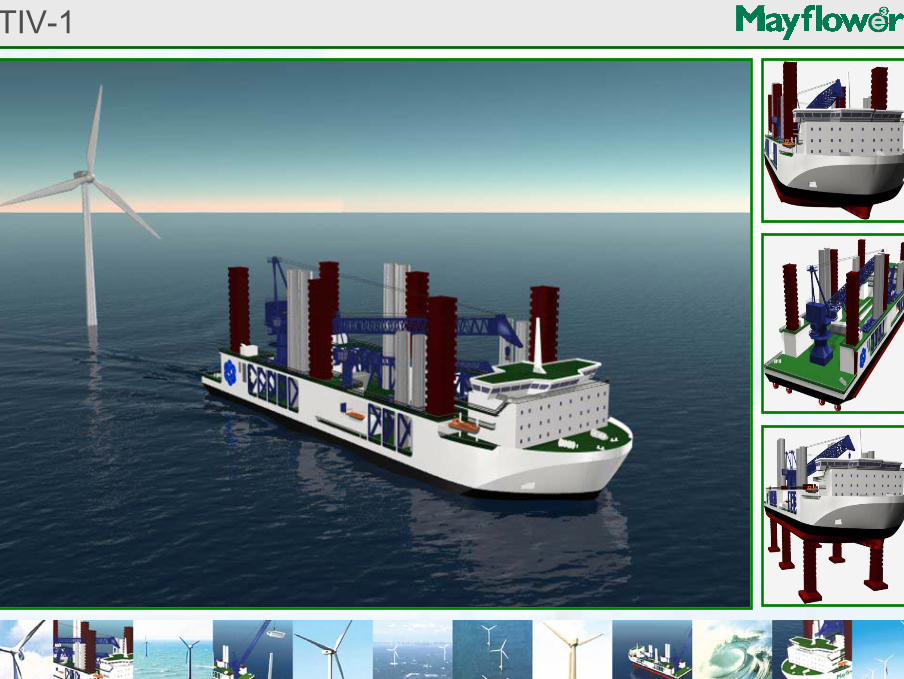
TIV-1
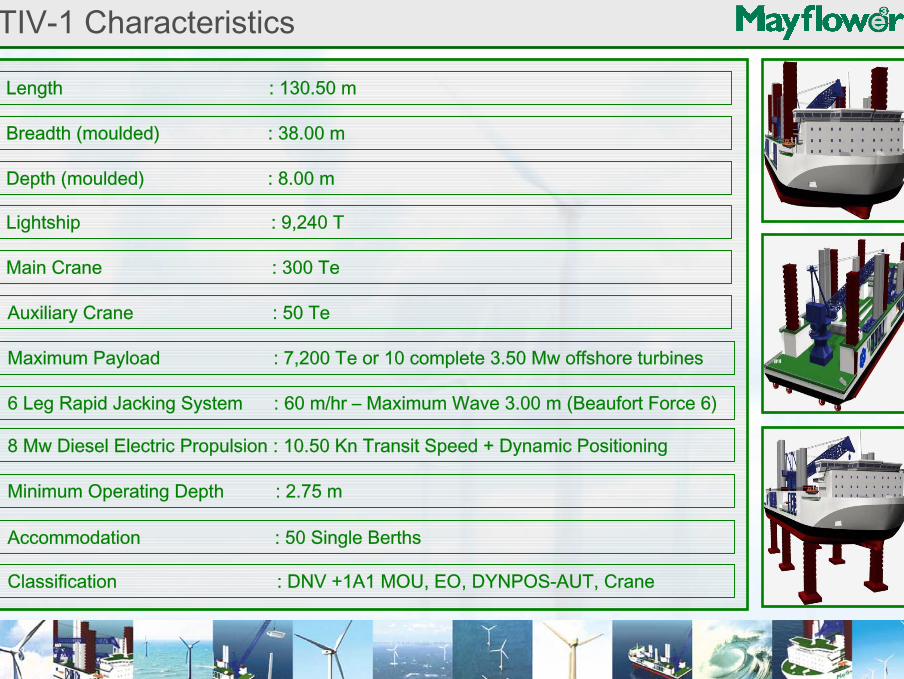
TIV-1 Characteristics
Length : 130.50 m
Breadth (moulded) : 38.00 m
Depth (moulded) : 8.00 m
Lightship : 9,240 T
Main Crane : 300 Te
Auxiliary Crane : 50 Te
Maximum Payload : 7,200 Te or 10 complete 3.50 Mw offshore turbines
6 Leg Rapid Jacking System : 60 m/hr – Maximum Wave 3.00 m (Beaufort Force 6)
8 Mw Diesel Electric Propulsion : 10.50 Kn Transit Speed + Dynamic Positioning
Minimum Operating Depth : 2.75 m
Accommodation : 50 Single Berths
Classification : DNV +1A1 MOU, EO, DYNPOS-AUT, Crane


ACKNOWLEDGEMENTSNick Goodall : British Wind Energy Association
Soren Kron : Danish Wind Energy Association
National Wind Power
Heerema Marine Contractors
Smit International
AMEC Border Wind
Greenpeace
Installation is the key