Embed Size (px)
Citation preview
Moving to reliable next-day switching
`
Moving to reliable next-day switching
Decision
Contact: Andrew Wallace, Senior Manager
Publication date: 10 February 2015 Team: Retail Markets
Tel: 020 7901 7067
Email: [email protected]
Overview:
We want consumers to be able to reliably switch supplier the next day. We believe that this
should be achieved by replacing the existing network run gas and electricity switching
services with a new centralised switching service, run by the Data and Communications
Company (DCC).
We propose to lead a programme of work to deliver these policy proposals for consumers by
2019.
Moving to reliable next-day switching
ii
Context
We want to use the opportunities provided by the roll-out of smart metering to make
the switching process faster and more reliable for consumers, open up opportunities
for time-of-use tariffs and demand-side response, and improve consumer protection
(especially for vulnerable consumers), as we move to a more sustainable economy.
Our work on switching builds on the Retail Market Review reforms to make the
market simpler, clearer and fairer for consumers and increase engagement. It also
supports our March 2014 State of the Market assessment which found that
competition, including the switching process, is not working as well as it could for
households and small businesses.
We will launch a significant code review and start the industry workgroups to design
the new switching arrangements later this year. This supports the commitment we
made in our Forward Work Programme 2014/5 and 2015/16 to develop the
programme to move to next-day switching, and commence work on this important
area.
Associated documents
Moving to reliable next-day switching: Target Operating Model and Delivery
Approach: Consultation. Ofgem, 10 February 2015
https://www.ofgem.gov.uk/publications-and-updates/target-operating-model-
reliable-next-day-switching
Moving to reliable next-day switching: Consultation. Ofgem, 16 June 2014
https://www.ofgem.gov.uk/publications-and-updates/moving-reliable-next-day-
switching
Change of Supplier update. Ofgem, 3 December 2013
https://www.ofgem.gov.uk/ofgem-
publications/84902/ofg505smartermarketsupdate1113web.pdf
Summary of findings of Change of Supplier Expert Group (COSEG). Ofgem, 3
December 2013
https://www.ofgem.gov.uk/ofgem-publications/84903/cosegsummary.pdf
Ofgem Consumer First Panel - Research to inform Ofgem’s review of the change
of supplier process. Ipsos MORI, 9 August 2013, published by Ofgem on 3
December 2013 https://www.ofgem.gov.uk/ofgem-
publications/84905/finalcospanel.pdf
Non-domestic consumers and the Change of Supplier process - Qualitative
research findings. Collaborate research, September 2013, published by Ofgem
on 3 December 2013 https://www.ofgem.gov.uk/ofgem-
publications/84908/non-domcosreportfinal181013lastandfinalforpublication.pdf

Moving to reliable next-day switching
iii
Contents
Executive Summary 1
1. Our proposals 3 Our proposals 3 Why switching is important 4 Updated assessment of reform packages 6 Metering reforms 18 Conclusions 19
2. How we will implement our proposals 21 Programme objective and scope 21 Implementation approach 23 Programme design 24 Implementation timescales 26 Programme governance 27 Implementation principles, risks and issues 29 Next Steps 30
Appendices 32
Appendix 1 – Updated detailed approach and methodology 33 Responses and clarifications 33 Methodology update 37 Scenario analysis 42 Consumer savings from switching 44
Appendix 2 – Updated detailed results 48 Base case results 48 Sensitivity analysis results 54 Scenario analysis results 56 Consumer savings from switching results 57 Annex 60
Appendix 3: Glossary 62

Moving to reliable next-day switching
1
Executive Summary
It is vital that energy consumers can easily, and with confidence, change their
energy supplier. This switching process underpins an effective energy market where
competition benefits consumers.
An improved switching process can reduce real or perceived switching costs and
increase consumer engagement. This can provide direct benefits to consumers who
become active in the market, and further improve outcomes for those who are
already “energy shoppers”. This increased engagement can strengthen competition
and lead to innovation, better service and pressure on prices. We expect suppliers to
respond by working harder to attract new consumers. An increased threat of losing
market share will also encourage suppliers to offer good service, innovative products
and competitive prices to their existing customers.
We propose to lead a work programme to implement reliable next-day switching on a
centralised registration service (CRS), governed by the Smart Energy Code (SEC)
and managed and operated by the Data and Communications Company (DCC). We
want to simplify and harmonise the gas and electricity switching arrangements where
possible. We want consumers to benefit from these new arrangements by 2019.
Our June 2014 consultation set out that the current switching processes depend on
systems that operate differently between the gas and electricity markets and were
developed in the late 1990s. They are slow, inefficient and unreliable. Consumers see
switching as a hassle, and the fear of something going wrong is off-putting for many.
The industry cost of implementing our proposed changes is around £4.21 for an
average dual fuel domestic consumer with an additional £0.27 annual cost. We
expect the dynamic competition benefits to consumers to significantly outweigh
these costs. Just by enabling next-day access to cheaper tariffs, consumers could
save up to £17m in the first year. Even if our reforms lead to just a small (less than
two percent), sustained increase in switching numbers, the costs will be outweighed
by the benefits to consumers.1
We have put together a five-stage plan to deliver our work programme. Industry
workgroups will start later in 2015 to establish the high-level, ‘blueprint’ design for
next-day switching using a new CRS building on the good engagement work to date.
In this early phase we will also consider two-day switching to assess whether this
offers a better outcome for consumers.
Alongside this decision document we have published, for consultation, a draft target
operating model for the new switching arrangements and the CRS. This will provide a
1 Our analysis shows that consumers will receive an overall benefit if our reforms lead to less than 31,000 new domestic dual fuel consumers switching each year. We have assumed that these consumers switch and continue to save over our modelling period (Q1 2020 to Q4 2030). This would be a very small increase given evidence on switching from other sectors. More information is given in Chapter 1 and Appendix 2

Moving to reliable next-day switching
2
reference and guide as we move through the design and implementation of the
programme, and will be updated as the more detailed arrangements are developed.
Implementing the programme will be challenging and require industry-wide
leadership. We recognise the risks inherent in developing the required IT systems
changes to support our ambition. Working with industry, we are committed to
managing these risks throughout the programme. We recognise that industry is
facing significant change with the roll-out of smart meters and a number of other
change programmes. We have designed our work programme with this in mind. In
the autumn we will launch a significant code review to coordinate the required
changes to industry codes and licences needed to deliver our proposals.
We welcome the offers of support we have received from industry to contribute to
the programme. As well as providing resources for the workgroups, we will be calling
on the industry to support us this year as we develop our policy work on matters
such as consumer cooling-off arrangements and the supplier objections process.2
2 Cooling-off arrangements refer to the arrangements for customers who switch supplier then change their mind during the 14-day cooling-off period. Our objections project will examine the rights of suppliers to block customer transfers to another supplier, eg on the basis of indebtedness.
Moving to reliable next-day switching
3
1. Our proposals
Chapter Summary: We think that next-day switching using a new centralised
registration service is the best solution for current and future consumers. We have
reviewed the responses to our June 2014 consultation and remain committed to
overhauling the current switching arrangements to deliver these improvements.
1.1. In June we consulted on radical options to improve the switching process for
consumers. Our preferred proposal was to deliver reliable next-day switching for
consumers and replace existing, separate, gas and electricity registration services
run by networks with a new, centralised, registration service (CRS) operated by the
Data and Communications Company (DCC).3
1.2. We also reviewed next-day, two-day and five-day options that did not
require centralised registration. Instead they would be enabled by improving existing
network-run switching services that are run separately for the gas and electricity
markets.4
Our proposals
1.3. We intend to introduce next-day switching and a CRS run by the DCC. The
CRS will provide a single, common service for the domestic and non-domestic gas
and electricity markets with rules set out in the smart energy code (SEC).
1.4. We received 38 responses to our June 2014 consultation from a wide range
of stakeholders.5 There was strong support across all respondents for this proposal.
There was also strong support for next-day or two-day switching. There was very
limited support for five-day switching.
1.5. The industry cost of implementing our proposed changes is around £4.21 for
an average dual fuel domestic consumer with an additional £0.27 annual cost. The
benefits of these changes have not been fully quantified, however as described
below, we expect them to significantly outweigh the industry costs.
1.6. Alongside this document we are now consulting on a target operating model
(TOM) for the new switching arrangements and the CRS. The TOM describes, at a
high level, how new business arrangements to support switching are expected to
3 The DCC is the licensed central body appointed to provide the communications and data transfer and management services required to support smart metering. 4 We did not present an assessment of five-day switching on a new centralised registration service in the June 2014 consultation. Our view was that the scale of the investment required to centralised registration service meant that a switching speed of faster than five working days should be the aim. We did however show this information in the appendices. Following requests from respondents, we have now included an assessment of this option. 5 This included two consumer representatives, 14 suppliers and seven network operators. Non-confidential responses can be found on our website https://www.ofgem.gov.uk/publications-and-updates/moving-reliable-next-day-switching
Moving to reliable next-day switching
4
operate. It will provide a guide as we move through design and implementation of
the programme. It will be updated as the more detailed arrangements are
developed.
1.7. We recognise that there is still uncertainty on the detailed design of a next-
day switching approach. We therefore propose to keep the switching speed under
review to understand if a two-day solution would provide a better overall outcome for
consumers, taking into account factors such as cost and reliability. We do not
propose to further develop a five-day switching model.
1.8. The remainder of this chapter outlines our response to the feedback received
following our June consultation, and sets out the reasons for our proposed solution.
Why switching is important
1.9. The switching process is critical to how consumers experience and respond
to retail energy markets. It should serve consumers’ interests so that they can:
Actively participate and understand that they can save money by switching
supplier.
Confidently interact with different parties with a role in the switching process,
for example suppliers and third party intermediaries (TPIs), such as price
comparison sites and companies offering energy management services.6
Are able to take a few, simple steps to quickly and reliably change supplier.
Switch to tariffs and services that best meet their needs and switch again to
access better deals when their needs change.
1.10. We received strong support for our qualitative assessment of the benefits of
improving the switching process that we presented in our June 2014 consultation.
1.11. Improving the speed, reliability and cost-effectiveness of switching can
provide direct benefits for consumers as well as wider competition benefits.
1.12. A more efficient, faster and more reliable process can reduce switching
costs7 and increase consumer engagement. This can directly benefit consumers who
are encouraged to become active in the market, and further improve outcomes for
those consumers who are already “energy shoppers”.
6 TPIs include switching websites, energy brokers and energy efficiency advice providers who interact with energy consumers. TPIs can offer advice and products to assist with a range of functions including energy procurement, efficiency and management for both domestic and non-domestic consumers. 7 Switching costs can be real or perceived. Economic theory suggests that their effect is to deter engagement and make consumers less reactive to price changes, which can prevent them from realising the benefits of moving to a new supplier. See: Klemperer, Network Effects and Switching Costs: two short essays for the New Palgrave (2005). An empirical estimate of drivers behind consumer switching in regulated markets has found that reducing anticipated switching times is likely to increase consumer activity. See: Waddams Price and Zhu, Searching and Switching: Empirical estimates of consumer behaviour in regulated markets (2013).

Moving to reliable next-day switching
5
1.13. Improving the switching process is one way in which we can encourage
consumers to engage with the market. However, it also needs to be easier for
consumers to choose an appropriate tariff, and consumers need to be confident that
they are getting a better deal.8 These are the areas we have targeted with our Retail
Market Review reforms for a simpler, clearer and fairer market, making it easier for
consumers to understand their energy tariff and to choose the best deal.
1.14. This increased engagement in a concentrated market can strengthen
competition, leading to greater innovation, better service and pressure on prices.9
We expect suppliers to respond in a more dynamic market by working harder to
attract new consumers. An increased threat of losing market share will also
encourage suppliers to offer improved consumer service, innovative products and
competitive prices to their existing consumers.
1.15. A more dynamic market, where consumers are increasingly likely to switch,
can encourage new parties to enter the market and existing suppliers to expand. A
faster and more reliable switching process can also contribute to new opportunities
for current and new TPIs to support consumers. TPIs can play a major role in
encouraging consumers to more easily participate in the market and provide new
ways for them to do so.
1.16. Some respondents said that further work should be undertaken to quantify
the benefits. We have addressed this issue in our summary of the specific costs and
benefits of our reform packages below. Our analysis shows that only a small increase
in switching activity, ie between 14,000 and 31,000 new consumers switching each
year and continuing to benefit from the savings currently available in the market,
would be required for our reforms to deliver an overall benefit for consumers.
1.17. A few respondents also suggested that additional qualitative or quantitative
research would provide more insight into consumer preferences around switching
speed/reliability. We are not convinced that further research of this kind could
provide substantial additional value. We expect consumers to value a switching
process that is fast, reliable and easy. The process must meet the requirements and
expectations of consumers throughout the next decade, living with next-generation
technology and consumer goods.10
8 See p36, https://www.ofgem.gov.uk/ofgem-publications/84905/finalcospanel.pdf for further discussion 9 In markets where many consumers are already taking a supply under contract, economic theory suggests that the impact of switching costs and price-inelasticity of demand is to reduce competition
between suppliers. See: OFT paper, Switching Costs (2003); and Klemperer, The Competitiveness of Markets with Switching Costs (1987b). Empirical estimates have shown that reducing switching costs in the mobile telephone market has reduced both prices and price-dispersion in some countries through greater consumer engagement and competitive pressure. See: Cho, Ferreira, and Telang, The Impact of Mobile Number Portability on Price, Competition and Consumer Welfare (2013); and Singer, The Consumer Benefits of Efficient Mobile-Number-Portability Administration (2013). 10 Our research to date has indicated that consumers find it hard to engage with questions on future requirements, with earlier stages of the consumer journey (e.g. purchasing decisions) currently acting as a bigger disincentive to switch for domestic customers. Our proposals will meet the current consumer expectations around both speed and reliability.
Moving to reliable next-day switching
6
Updated assessment of reform packages
1.18. In the June 2014 consultation we requested views on our assessment of the
reform packages against the following evaluation criteria:
reliability
speed
consumer expectations and future flexibility
efficiency of market arrangements
implementation risks, and
estimated costs.
1.19. We outline below the key issues respondents raised against each of these
criteria, together with our views. We consider that the better the option performs
against the criteria, the more likely it is to improve consumer outcomes.
Reliability
Summary of respondents’ views
1.20. Respondents supported our recognition of the importance of reliability and
noted that this reflected our consumer research. Most agreed that a CRS under the
DCC should improve reliability through one body having oversight of a single,
simplified system that aligned the gas and electricity switching arrangements. This
would ultimately make consumer switching easier. Some respondents commented
that the current systems are outdated and need updating to secure a reliable
switching process. Most agreed that reliability improvements would increase
consumer confidence, leading to more engagement in the market.
1.21. Supporters argued that a centralised registration system would allow for the
alignment of dual fuel switching arrangements. This would allow for a more vibrant
market, whereby those consumers, particularly active ones, are confident to switch
suppliers more frequently.
1.22. Some respondents thought that the consultation document appeared to
focus on switching speed at the expense of reliability, and argued that reliability was
paramount to securing consumer trust and engagement. Some also commented that
reliability was not solely a reflection of the registration system. Some respondents
considered that accurate and timely access to consumer, metering and consumption
data within the CRS was of critical importance to a reliable switching process. Those
respondents said that the CRS data must be populated accurately and called for a
change in attitude towards data quality.
1.23. One respondent noted that there could be greater complexity in maintaining
data on the system, due to a reliance on multiple parties (eg suppliers and networks)
updating data. They said that this would make synchronising data between the
different operating systems more complex and therefore risked data errors.
Moving to reliable next-day switching
7
Our view
1.24. We agree that reliability is paramount. Consumers and industry parties must
be confident that the data held in central systems is accurate, secure and that
industry parties will correctly operate robust switching arrangements. We welcome
the strong support from respondents on this matter.
1.25. We also welcome the support for our view that, while reliability can be
improved on existing network-run registration systems, a CRS provides opportunities
to make the switching process more reliable and easier for consumers to use. We
outlined some of these opportunities in our June consultation document. We will
place reliability at the heart of the switching programme design and delivery.
1.26. We welcome the industry’s work over the last six months to review data
quality that supports the switching process and make recommendations for
improvements. This has presented opportunities for incremental changes and we are
looking to industry to make good progress on these matters. However, more radical
improvements for consumers (for example introducing a common address format for
the gas and electricity markets) are more likely through new centralised industry
architecture.
Speed of switching
Summary of respondents’ views
1.27. Respondents highlighted faster switching as a necessary requirement for a
well-functioning retail energy market. Many were supportive of our lead option of
next-day switching alongside a CRS. Other respondents were also supportive of our
two-day switching option but there was little support for our five-day option. A
couple of respondents suggested a phased approach to our switching options.
1.28. Supporters highlighted that a move towards next-day switching would drive
competition within the market, with suppliers offering cheaper and innovative tariffs
to consumers and encouraging consumer participation. Most respondents cautioned
that, in moving to a faster switching process, reliability must not be jeopardised.
1.29. Some respondents questioned whether faster switching would improve
competition and market participation. A number of respondents suggested that
further analysis, particularly quantitative analysis, should be undertaken before any
of the reform packages are confirmed. Some suggested that the reforms would
appeal to active consumers but would not affect those who were not already
engaged. Others thought that very fast switching could create barriers to entry and
disadvantage smaller suppliers due to greater consumer volatility and uncertainty
over balancing arrangements.
1.30. Some respondents agreed with our analysis that, for some consumers there
may be practical reasons why a very fast switch is not possible or desirable, even
when the above reforms are implemented. They agreed that consumers with
Moving to reliable next-day switching
8
traditional prepayment meters (where additional time may be required for the new
supplier to send a new top-up key or card) fell into this category but agreed they
were unlikely to represent an issue to the programme’s successful implementation.
They noted that the number of traditional prepayment meters would reduce as smart
meters were rolled out. Respondents also agreed that a longer switching period may
be chosen for some business consumers so that a switch can coincide with the end of
their existing contract. It may also not be practical for very large volume consumers
or those with complex portfolios.
Our view
1.31. Allowing a consumer to choose a new supplier and be supplied by them by
the start of the next day means that they could benefit more quickly from cheaper
prices, better service and new and innovative products. This may also encourage
more consumers to switch. By definition, the next-day switching option performs
best against this criterion. Having a next-day switching solution does not prevent
consumers from switching on a day of their choice, which may not be the next day.
1.32. We are at an early stage in the programme and further work is required to
define the new switching arrangements. Our ambition is for next-day switching,
however we will keep a two-day switching speed option under review to see if it
would provide a better overall outcome for consumers taking into account factors
such as cost and reliability.
1.33. We have reviewed a phased approach for speeding up the switching process.
Our assessment is that this is unlikely to be cost-efficient as it would require two
major rounds of reform for the industry to implement. We do not propose to consider
this further.
1.34. As set out below, we do not consider that five-day switching will meet
consumer expectations for smart energy markets into the next decade, and is not
the best option taking into account the likely costs and benefits. A five-day option is
likely to rely on daily batch processing and communication of data. Making switching
shorter at a later point would require near real time data processing and exchange.
We therefore think that a five-day solution would act as an impediment to further
improvements to meet consumers’ expectations, and may be more costly in the long
run if further changes need to be made to meet these expectations. Therefore, we do
not propose to further develop the five-day switching option.
Consumer expectations and future flexibility
Summary of respondents’ views
1.35. Respondents who supported our lead option noted that reforming the
switching arrangements would improve the consumer experience. Supporters argued
that it would enable faster navigation of the market and increase engagement from
consumers.
Moving to reliable next-day switching
9
1.36. A number of respondents said that consumer research did not demonstrate
consumer demand to switch next-day although some argued that this did not
necessarily mean that it should be discarded as a worthwhile aim. Some respondents
thought that two-day switching would be sufficient to enable consumer expectations
to be satisfied or even exceeded. They noted that this would be faster than some
other industry switching processes.
1.37. Regarding future flexibility of market arrangements, respondents said that
using a central registration design should encourage future changes in the market.
Proposals mentioned included reform to the electricity settlement arrangements and
centralisation of electricity data processing and data aggregation arrangements.
1.38. Respondents said that the sector should understand and learn from the
experiences of other industries eg telecoms and banking, during the design and
decision-making process.
Our view
1.39. The introduction of next-day switching compares well with consumers’
current experience of switching in other markets such as telecoms (one- or two-day
switching) and banking (seven days).11
1.40. Consumer expectations and requirements do not stay the same, and we
expect them to change according to experiences in other sectors. The roll-out of
smart meters, which will allow the consumer to interact with their energy
consumption in real-time, is one example of how consumers’ understanding of their
energy use and potential appetite for interaction with the energy market is expected
to be more dynamic in the future.12
1.41. As set out in the June 2014 consultation, we think consumers’ expectations
will create demand for next-day switching. Our view is that next-day switching
performs best against this criterion and future proofs for the expected smart energy
market.
1.42. As set out in the June 2014 consultation, we think that a CRS can also more
efficiently adapt to future requirements than the current processes and governance,
which are separate. The switching programme offers a unique opportunity to
upgrade existing systems for the benefit of current, and future, consumers.
1.43. We have already engaged with the banking and telecommunications sectors
and will continue to do so as the programme progresses.
11 Switching supplier is also much quicker in other international energy markets. It can happen the next day in Norway, Greece, Victoria (Australia) and Ireland. 12 Our domestic consumer research has shown that most participants could see the potential for a more streamlined switching process as a result of automated real-time meter readings.
Moving to reliable next-day switching
10
Efficiency of market arrangements
Summary of respondents’ views
1.44. Respondents were split on whether a change in the switching process would
affect supplier energy balancing arrangements. Some said that faster switching could
create market fluctuations due to volatility in consumer numbers. This was thought
to be particularly burdensome for smaller suppliers, who may not have the resources
to accommodate such volatility. Some respondents therefore considered that
consumers may face higher prices due to suppliers’ hedging strategies, as well as a
greater risk of imbalance.13
1.45. Some respondents, notably independent suppliers, said that they expected a
faster switching process to have minimal effect on the balancing or settlement
arrangements. Some predicted that small forecasting errors may arise but that they
would not be particularly detrimental.
1.46. A few respondents suggested that faster switching could lead to “serial
switching” by some consumers, in order to avoid paying bills. This could lead to them
being “lost in the system”, making it more difficult to build accurate consumption
profiles for these consumers.
1.47. One respondent also highlighted the importance of ensuring that the system
is designed to enable same-day exchange of the consumer’s smart meter security
key.
Our view
1.48. Making the switching arrangements simpler can reduce costs to suppliers
and other industry parties. This could encourage competition and market entry and
expansion. The current arrangements have developed incrementally and have not
been subject to a fundamental review to reduce complexity and integrate more than
a decade’s worth of industry workarounds into the enduring arrangements.
1.49. Centralising registration services provides an important opportunity to
simplify switching arrangements. Improvements include harmonising processes, and
bringing together and rationalising data flows. These benefits are unlikely to be
achieved by building on the existing registration systems, so centralisation will
perform better against this criterion.
1.50. As described in the June 2014 consultation, the next-day switching proposals
offer more benefits to consumers as outlined above, but they also present additional
13 Suppliers are incentivised to match the amount of gas and electricity that they purchase against the amount that their consumers use. Suppliers will pay imbalance changes if they do not match this supply and demand.
Moving to reliable next-day switching
11
technical challenges for market participants. For example, suppliers will want to
ensure that they can load their security key14 and new tariff details on to a smart
meter before the start of the next day to support next-day switching. For the two-
day and five-day options, suppliers would have more time to send these messages to
a smart meter.
1.51. We recognise that very fast switching will create a new market environment
for suppliers to adapt to and note the specific issue raised on consumer volatility and
balancing. We will examine the effect of these issues as we move through the
programme and in particular we will continue to engage with independent suppliers
to understand their views. We will update our impact assessment accordingly and we
will consider what practical measures could reduce concerns.
Implementation risks
Summary of respondents’ views
1.52. Most respondents strongly agreed that we had identified the appropriate
risks in implementing our lead option of next-day switching alongside a CRS.
Likewise, nearly all respondents supported our recognition of the level of industry
change that would be taking place over the same timeframe as the switching
programme. It was noted that the proposed reforms may be particularly stretching
for smaller suppliers.
1.53. Some respondents noted additional risks. In addition to energy balancing
(see previous section), these included data quality. Some respondents said that
unreliable switching was related to poor data. One respondent suggested that a data
quality project should exist alongside the switching programme.
1.54. Some respondents said that our identified risks had not sufficiently taken
account of the non-domestic market.
1.55. A few respondents were concerned that a programme governance structure,
with a ‘design by committee’ approach, could lead to delay and dilute creativity.
1.56. One respondent noted the importance of designing the CRS governance
arrangements in a way that can efficiently enable future market development, such
as to electricity settlement. It was suggested that a phased approach to the
switching reforms may mitigate our highlighted risks.
14 Before a consumer with a smart meter transfers, it is preferable for that meter to have been loaded with the new supplier’s security key. This allows the new supplier to have access control and, for example, to configure the meter with its tariff details.

Moving to reliable next-day switching
12
Our view
1.57. The reforms to deliver next-day switching on a CRS are more complex and
carry a greater degree of risk than other reform packages considered. They will need
careful planning and management. This will include input across all stakeholders in
the industry to identify requirements and to undertake the required design, build,
testing and implementation.
1.58. We consider that these risks are manageable and we will continue to work to
mitigate these as the programme develops. The next chapter gives more detail on
how we propose to manage the risks of the switching programme.
1.59. We agree that it is important to review the opportunity to improve data
quality now and as part of the switching programme. We welcome the industry’s
work to provide recommendations on data quality and to move these forward. We
will also incorporate plans to improve and maintain data quality in the design of the
CRS and new switching arrangements.
1.60. We recognise the effect that major reforms can have on small suppliers in
the market. We will continue to seek to engage with these parties to understand
their views and incorporate potential impacts into our impact assessment. Many of
these companies may be more nimble in adapting to the new environment and
developing new and innovate ways of meeting consumers’ requirements.
1.61. We will also seek to ensure that non-domestic suppliers are represented in
the programme and that the specific features of that sector are recognised in the
solution design. However, to promote simplicity and efficiency, we want to make the
processes that support the domestic and non-domestic markets as similar as
possible.
1.62. We recognise the vital importance that good governance will play in
delivering our proposals. We have set out in the next chapter how we expect these
governance arrangements to work.
Estimated costs
Summary of respondents’ views
1.63. Respondents were divided on our assessment of the costs of implementing
and operating the proposed reform packages.
1.64. Some respondents disagreed with our view that the implementation costs of
next-day and two-day switching were similar. Some argued that the lack of
quantifiable benefits make this difficult to agree with and suggested that the cost
information factored in to our analysis may not be robust.

Moving to reliable next-day switching
13
1.65. Some respondents said that, should we implement our lead option, costs
could rise substantially for smaller suppliers. There was also a concern that we had
taken a homogeneous approach to the effect our lead option would have on smaller
suppliers. Likewise it was highlighted that our lead option would require all suppliers
to upgrade to an automated objections system, again further adding costs to those
parties who did not currently possess such a system.
Our view
1.66. We have worked with the industry to quantify the direct costs of our reform
packages. Where market participants believe that a specific reform can deliver cost
savings, for example, better data reducing exception-handling costs, these have also
been captured.
1.67. We are confident that the information collected so far provides a good basis
for our decision. However, we recognise that the programme is at an early stage and
that the analysis will need to be updated further. We therefore intend to update our
impact assessment as the programme develops. We will publish updated
assessments for consultation at key junctures, for example, when consulting on
updated proposals at the end of the Blueprint and Detailed Level Specification phases
(see next chapter for further details). We expect to undertake a further request for
information (RFI) during the next phase to support this updated assessment.
1.68. We recognise that the direct costs of implementing and operating new
switching systems, particularly where there is a need for more automation, may
create a proportionally larger burden for some smaller suppliers. We will continue to
engage with independent suppliers during the next phases of work to understand
these effects. This is one of the reasons why we will consider two-day switching as
well as next-day switching as part of the Blueprint phase of the programme.
1.69. Further detail on our responses to specific assumptions and methodological
points that respondents questioned can be found in Appendix 1.
1.70. We have made some updates to the direct cost assessment undertaken in
June based on new information. These updates reflect: (i) additional analysis on the
estimated programme governance and administration costs across the industry and
Ofgem; (ii) updated information received from industry parties on the costs of
centralising registration for their systems and business processes; (iii) changes to
the planning assumptions and timetable for delivering the overall changes; and (iv)
updated market data on the number of consumers served by different network
companies and suppliers.15
1.71. The updated estimated costs are summarised below, with further detail in
Appendix 2. The direct costs of the reforms are only part of the picture, and in this
15 These changes are described in further detail in Figure 1 of Appendix 1.
Moving to reliable next-day switching
14
document we have described the wider benefits that we think our reforms will bring.
In particular, the cost analysis below does not capture the direct benefits for
consumers of our proposals or any wider competition benefits. The costs of next-day
switching on a CRS have increased by £20m in net present value (NPV) terms since
June. However, for the reasons set out in this chapter, we remain of the view that
benefits will significantly outweigh the costs.
1.72. Our updated analysis shows that delivering next-day switching, based on a
CRS, will cost average dual fuel consumers a £4.21 one-off payment and £0.27
annual costs.
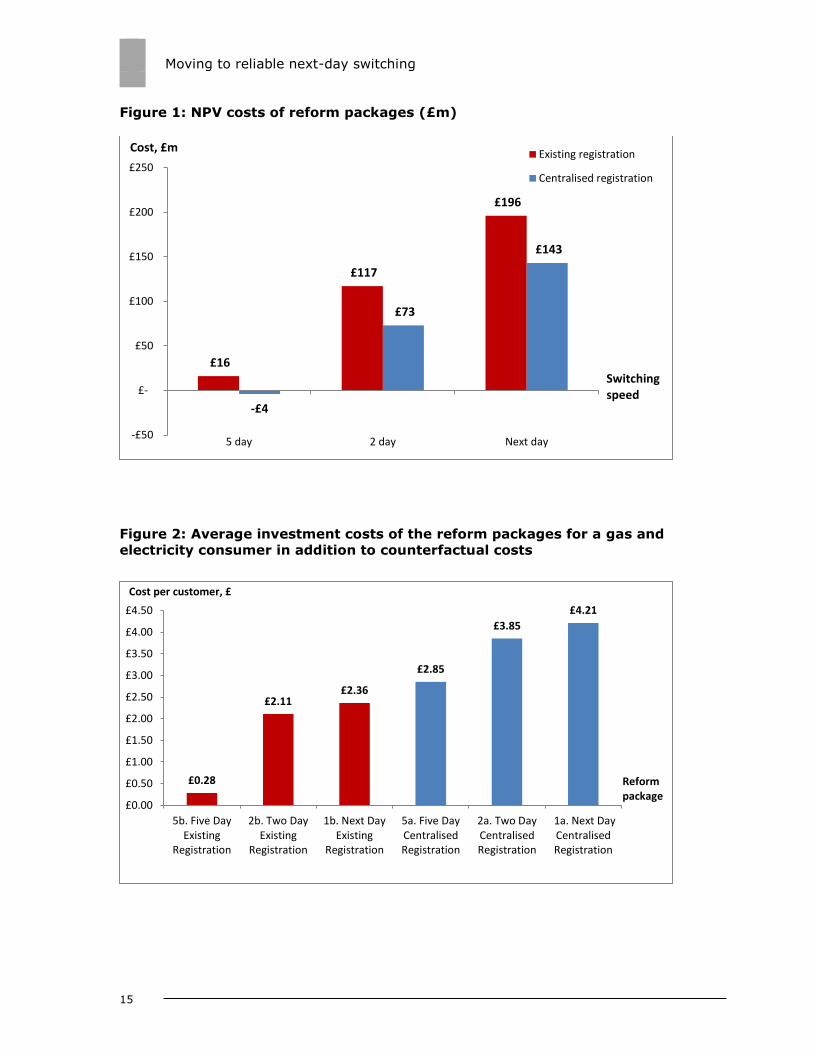
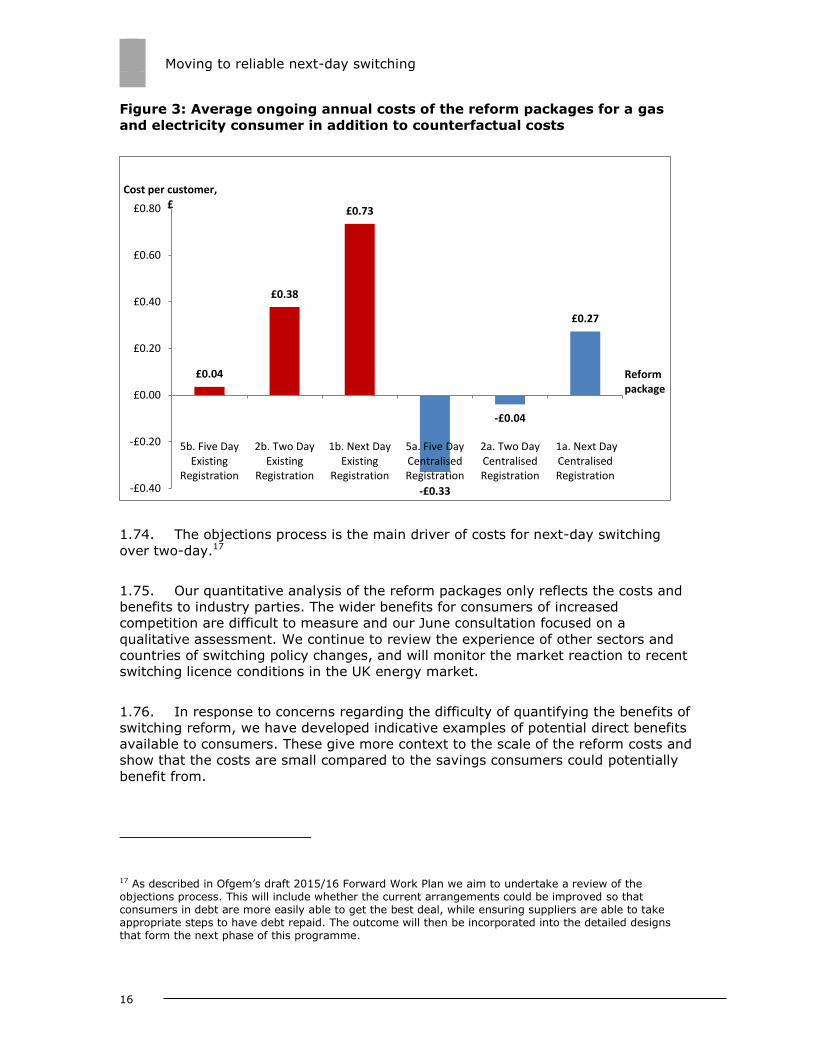
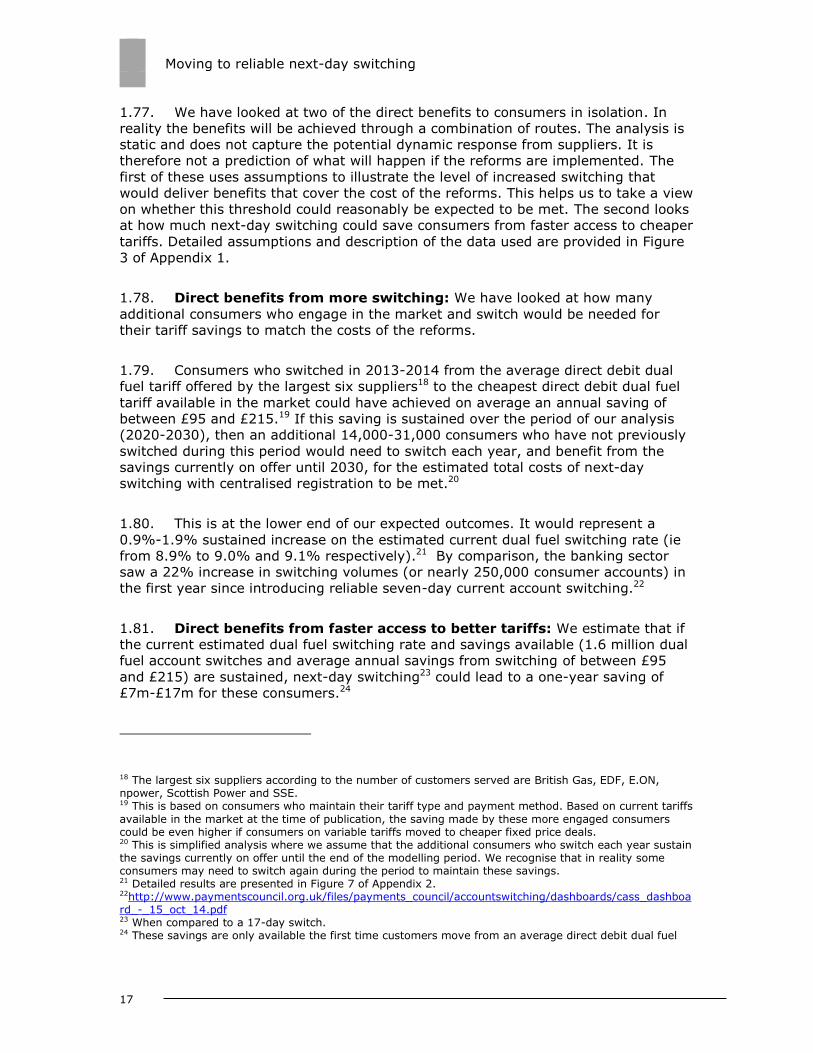
1.73. Figure 1 below shows the estimated net costs of the reform packages, in
present value terms over the period between 2016 and 2030.16 Figure 2 and 3 show
the investment (capital expenditure - capex) costs and the ongoing operational costs
(opex) for each of the reform packages, in addition to the costs consumers would
already be paying. This analysis is based on the best information available from
industry participants. Our conclusions remain unchanged:
The costs of upgrading the registration systems and developing new
standards for speed and reliability are relatively low, in particular compared
with the potential direct and indirect benefits of faster and more reliable
switching arrangements.
The ongoing operational costs for all the reform packages are broadly in line
with the costs of operating a five-week switching arrangement.
Like-for-like reform packages involving centralising registration are likely to
be cheaper than where existing network-run systems are enhanced. One-off
investment costs are higher, but ongoing operational costs are lower.
The current next-day switching option is likely to be more expensive than
two-day switching. As discussed below, this is driven primarily by the costs of
maintaining an objections register.
Five-day switching is likely to be the least expensive reform (and when built
on a CRS, shows a cost saving for the industry), but this reflects the limited
changes required, and associated limited benefits to consumers. We think
that faster switching will deliver greater net benefits for consumers.
16 Note that a negative figure represents an NPV cost saving.
Moving to reliable next-day switching
15
Figure 1: NPV costs of reform packages (£m)
Figure 2: Average investment costs of the reform packages for a gas and
electricity consumer in addition to counterfactual costs
£16
£117
£196
-£4
£73
£143
-£50
£-
£50
£100
£150
£200
£250
5 day 2 day Next day
Cost, £m
Switching speed
Existing registration
Centralised registration
£0.28
£2.11 £2.36
£2.85
£3.85
£4.21
£0.00
£0.50
£1.00
£1.50
£2.00
£2.50
£3.00
£3.50
£4.00
£4.50
5b. Five DayExisting
Registration
2b. Two DayExisting
Registration
1b. Next DayExisting
Registration
5a. Five DayCentralisedRegistration
2a. Two DayCentralisedRegistration
1a. Next DayCentralisedRegistration
Cost per customer, £
Reform package
Moving to reliable next-day switching
16
Figure 3: Average ongoing annual costs of the reform packages for a gas
and electricity consumer in addition to counterfactual costs
1.74. The objections process is the main driver of costs for next-day switching
over two-day.17
1.75. Our quantitative analysis of the reform packages only reflects the costs and
benefits to industry parties. The wider benefits for consumers of increased
competition are difficult to measure and our June consultation focused on a
qualitative assessment. We continue to review the experience of other sectors and
countries of switching policy changes, and will monitor the market reaction to recent
switching licence conditions in the UK energy market.
1.76. In response to concerns regarding the difficulty of quantifying the benefits of
switching reform, we have developed indicative examples of potential direct benefits
available to consumers. These give more context to the scale of the reform costs and
show that the costs are small compared to the savings consumers could potentially
benefit from.
17 As described in Ofgem’s draft 2015/16 Forward Work Plan we aim to undertake a review of the objections process. This will include whether the current arrangements could be improved so that consumers in debt are more easily able to get the best deal, while ensuring suppliers are able to take appropriate steps to have debt repaid. The outcome will then be incorporated into the detailed designs that form the next phase of this programme.
£0.04
£0.38
£0.73
-£0.33
-£0.04
£0.27
-£0.40
-£0.20
£0.00
£0.20
£0.40
£0.60
£0.80
5b. Five DayExisting
Registration
2b. Two DayExisting
Registration
1b. Next DayExisting
Registration
5a. Five DayCentralisedRegistration
2a. Two DayCentralisedRegistration
1a. Next DayCentralisedRegistration
Cost per customer, £
Reform package
Moving to reliable next-day switching
17
1.77. We have looked at two of the direct benefits to consumers in isolation. In
reality the benefits will be achieved through a combination of routes. The analysis is
static and does not capture the potential dynamic response from suppliers. It is
therefore not a prediction of what will happen if the reforms are implemented. The
first of these uses assumptions to illustrate the level of increased switching that
would deliver benefits that cover the cost of the reforms. This helps us to take a view
on whether this threshold could reasonably be expected to be met. The second looks
at how much next-day switching could save consumers from faster access to cheaper
tariffs. Detailed assumptions and description of the data used are provided in Figure
3 of Appendix 1.
1.78. Direct benefits from more switching: We have looked at how many
additional consumers who engage in the market and switch would be needed for
their tariff savings to match the costs of the reforms.
1.79. Consumers who switched in 2013-2014 from the average direct debit dual
fuel tariff offered by the largest six suppliers18 to the cheapest direct debit dual fuel
tariff available in the market could have achieved on average an annual saving of
between £95 and £215.19 If this saving is sustained over the period of our analysis
(2020-2030), then an additional 14,000-31,000 consumers who have not previously
switched during this period would need to switch each year, and benefit from the
savings currently on offer until 2030, for the estimated total costs of next-day
switching with centralised registration to be met.20
1.80. This is at the lower end of our expected outcomes. It would represent a
0.9%-1.9% sustained increase on the estimated current dual fuel switching rate (ie
from 8.9% to 9.0% and 9.1% respectively).21 By comparison, the banking sector
saw a 22% increase in switching volumes (or nearly 250,000 consumer accounts) in
the first year since introducing reliable seven-day current account switching.22
1.81. Direct benefits from faster access to better tariffs: We estimate that if
the current estimated dual fuel switching rate and savings available (1.6 million dual
fuel account switches and average annual savings from switching of between £95
and £215) are sustained, next-day switching23 could lead to a one-year saving of
£7m-£17m for these consumers.24
18 The largest six suppliers according to the number of customers served are British Gas, EDF, E.ON, npower, Scottish Power and SSE. 19 This is based on consumers who maintain their tariff type and payment method. Based on current tariffs
available in the market at the time of publication, the saving made by these more engaged consumers could be even higher if consumers on variable tariffs moved to cheaper fixed price deals. 20 This is simplified analysis where we assume that the additional consumers who switch each year sustain the savings currently on offer until the end of the modelling period. We recognise that in reality some consumers may need to switch again during the period to maintain these savings. 21 Detailed results are presented in Figure 7 of Appendix 2. 22http://www.paymentscouncil.org.uk/files/payments_council/accountswitching/dashboards/cass_dashboard_-_15_oct_14.pdf 23 When compared to a 17-day switch. 24 These savings are only available the first time customers move from an average direct debit dual fuel
Moving to reliable next-day switching
18
Metering reforms
1.82. Alongside our core policy proposals, we consulted on the value of holding
electricity meter technical details (MTDs) and/or consumption history centrally for
consumers with traditional and automated meter reading (AMR) meters.25 We
explained that we understood reliable next-day switching to be possible for these
consumers without the central retention of metering data. We consulted on whether
stakeholders agreed with this view and whether central retention would deliver
valuable additional efficiencies in the switching process, relative to the costs. For the
avoidance of doubt, the costs of these reforms have not been included in the reform
packages described in this chapter, although separate cost data is included in
Appendix 2.
Summary of respondents’ views
1.83. A strong majority agreed that it would not be necessary or efficient to hold
these details centrally. Respondents agreed that reliable next-day switching should
be possible without this reform, thanks to the 7WD agent requirements26 and
appropriate supplier contracting. A number agreed that the reforms would offer little
additional value, given decreasing numbers of traditional meters, and a lower
appetite for fast switching among AMR consumers because of the fixed term nature
of their contracts. Some also argued that holding these details centrally for
electricity, as in gas, could actually have negative effects on data quality relative to
the current arrangements.
1.84. A small number felt that holding these details centrally would support more
efficient switching and billing, and suggested that it could be implemented cost-
effectively given that these details would already be held on the CRS for gas.
Our view
1.85. We remain of the view that holding MTDs and consumption history on the
CRS for smart, AMR and traditional electricity meters is not necessary to deliver
reliable next-day switching for traditional, AMR or smart metered customers.27 While
there is potential for it to drive additional efficiency in the process, we do not
tariff offered by the largest six suppliers to the cheapest direct debit dual fuel tariff in the market of a given tariff type and payment method. Detailed results are presented in Figure 8 of Appendix 2. 25 For clarity, our view is that, were this reform to be implemented, any metering data would be held as part of the CRS. 26 A change to the BSC (BSC CP1405) reduced the timescales from 27 to 7 working days for metering
agents to be appointed and to exchange data on change of supplier. For further discussion please see: https://www.elexon.co.uk/change-proposal/cp1405/ 27 It should be noted that some MTDs are already held on central systems, such as meter serial number.
We envisage that these data items would continue to be held centrally.
Moving to reliable next-day switching
19
consider that this reform will offer sufficient benefit to consumers relative to the
costs.
1.86. Consultation responses confirmed our view that the existing reforms, to
reduce the time taken to appoint and exchange data between agents26, should
support reliable next-day switching. However, in the absence of holding electricity
consumption history and comprehensive MTDs centrally, it will be particularly
important to monitor the progress and success of these reforms and their ability to
support reliable next-day switching.
1.87. While we do not consider that it will be necessary to hold MTDs and
consumption history centrally in electricity, we are keen that access is improved
where barriers have been identified.
1.88. In our June consultation we said that dependencies on the transfer of
consumption history and comprehensive MTDs in electricity could be removed for
smart meters and that industry groups had been formed to design reforms that
make the most of these capabilities. Welcome progress has been made, but
discussions in the electricity group (P30228) have revealed that the dependencies on
meter operators (MOPs) to transfer MTDs for smart electricity meters will remain,
without further changes to industry rules.29 The smart meter configuration details
form part of these MTDs and are particularly time critical during a switch. Because
the new supplier configures the smart meter, we believe that it should be possible for
industry to make changes to industry rules to remove the remaining dependency on
MOPs to transfer configuration data.
1.89. In the event that existing reforms, or any further incremental improvements,
are shown to be insufficient, and there is a compelling case made by industry, there
could be scope for further review of centrally held metering data during the switching
programme.
Conclusions
1.90. We propose to radically overhaul and re-engineer the switching
arrangements and put in place a new, CRS under the DCC that can deliver next-day
switching. There is a very strong case for this and we think that it could transform
the operation of a competitive retail market.
1.91. Our updated assessment continues to shows that, for a relatively low initial
investment, the existing systems and processes developed in the late 1990s could be
replaced with reliable, efficient and flexible arrangements that support dual fuel
switching and can respond quickly to future market requirements. Moreover, placing
28 Please see https://www.elexon.co.uk/mod-proposal/p302/ 29 Unless a further change is made, the new meter operator must wait on the MTD flow from the old meter operator, before the smart meter configuration details can be passed on to the new data collector (DC) agent. The new DC needs this information to enable them to validate meter reads for settlement.

Moving to reliable next-day switching
20
the switching arrangements under the management of the DCC provides an
opportunity to improve the governance framework and incentivise behaviour that
supports better outcomes for consumers.
1.92. We consider that the benefits will significantly outweigh the identified costs.
Fast and reliable switching will help to increase consumer engagement which can
increase competitive pressure in the market (reducing overall prices, improving
service standards and driving innovation) as well as leading to direct benefits for
consumers.
Moving to reliable next-day switching
21
2. How we will implement our proposals
Chapter Summary: We will lead a programme of work to implement our switching
reforms. We want consumers to benefit from these by 2019. This year we will start
industry workgroups to design the new arrangements.
2.1. We intend to deliver next-day switching through a programme of work led by
Ofgem, including a significant code review30 (SCR).
2.2. We welcome the strong support that we received for our leadership. At
different stages of the programme, industry parties will also be required to provide
resources, support and leadership. We recognise the risks inherent in developing the
required IT systems changes to support our ambition. Working with industry, we are
committed to managing these risks throughout the programme.
2.3. In this chapter we describe how we propose to run the switching
programme, making best use of the industry’s skills and expertise.
Programme objective and scope
2.4. Our objective is to establish a switching process that is fast, reliable and
cost-effective.
2.5. The scope of this Programme will be the arrangements required to deliver
reliable next-day switching. The Programme is at an early stage; therefore we
propose to also explore a two-day switching solution to see if that would provide a
better outcome for consumers.
2.6. The scope includes:
Changes to the regulatory framework to facilitate a new CRS covering all
supply points connected to gas and electricity distribution networks, and
decommissioning the existing registration services run by electricity and gas
networks. This will include DCC price control and CRS charging arrangements.
Reviewing any remaining network licence obligations linked to registration,
including providing enquiry services.
30 The SCR mechanism enables Ofgem to direct licensee(s) to make changes to relevant industry codes to deliver outcomes specified in an SCR Direction made by Ofgem.
Moving to reliable next-day switching
22
Facilitating reforms to the switching process for all domestic and non-
domestic gas and electricity consumers (with the exception of those consumer
types detailed below).
Harmonising the switching arrangements between the gas and electricity
markets, where possible, taking into account any specific differences in
market requirements.
Defining and executing a transition and implementation scheme for the CRS
and new switching arrangements.
Implementing the new CRS service, with all relevant industry parties shown
to be able to operate in the new environment.
Delivering a consumer awareness campaign.
2.7. We will consider all parts of the switching process from the point when a
consumer enters into a contract with a new supplier until they have received a
closing bill from their old supplier, and an opening bill from their new supplier.
2.8. Further content on the scope of the Programme can be found in the Target
Operating Model (TOM) published alongside this document. The TOM has been issued
for consultation and therefore, some of the detail may be subject to change.
2.9. Our programme scope excludes:
The switching arrangements for consumers that are directly connected to the
national electricity and gas transmission networks, unmetered consumers and
those being supplied on licence-exempt networks and/or by licence-exempt
suppliers. These operate bespoke switching arrangements and we are
focusing on the arrangements for the majority of consumers.
The initial consumer acquisition activities, eg marketing, in advance of the
point when a consumer enters into a contract.
Defining new rules or requirements for how suppliers bill their consumers. It
will however need to ensure that the new arrangements support suppliers’
ability to meet any billing requirements that they have.
The design of any industry arrangements for loading the new supplier’s
security key onto a smart meter as part of a switch. Arrangements have been
developed for loading security keys at smart meter go-live. It is expected that
amended arrangements will be required once the roll-out is underway. These
enduring arrangements are being considered by the Smart Meter
Implementation Programme (SMIP). The CRS will support the enduring
industry arrangements for the loading of security keys onto smart meters
once this has been finalised.
Industry code consolidation. This programme is expected to require significant
parts of existing codes to be removed and new switching rules to be
incorporated into the SEC. While we recognise that this may result in
Moving to reliable next-day switching
23
opportunities for code consolidation, any work to progress this would be
undertaken separately, if appropriate.
Ofgem’s review of objections. This work is being progressed as a separate
project. As described in Ofgem’s draft 2015/16 Forward Work Plan31 we aim
to undertake a review of the objections process. This will include whether the
current arrangements could be improved so that consumers in debt are more
easily able to get the best deal, while ensuring suppliers are able to take
appropriate steps to have debt repaid. The outcome of this work is important
to the switching process and will feed into process design in the Blueprint
phase of the switching programme.
Consideration of centralisation of Data Processing (DP) and Data Aggregation
(DA).32
Implementation approach
2.10. Implementing our reforms will require changes to the obligations set out in
licences and industry codes. In June 2014 we said that we would make any
necessary licence changes to introduce the new arrangements, and asked for views
on three options for enacting the necessary industry code changes.
An SCR, led by Ofgem, using the powers available to make a coherent
package of code changes across multiple codes. This was our preferred
option.
An industry-led process using normal governance processes and supported by
targeted licence obligations that we would impose on industry parties to
deliver the reforms.
Secretary of State using powers to make or direct changes.33
2.11. Nearly all respondents to our consultation agreed that an SCR would be
necessary to deliver the appropriate regulatory changes to the switching
arrangements. We agree that this is an appropriate vehicle34 and later this year we
will publish a Switching SCR Launch Statement. This document will provide further
31 https://www.ofgem.gov.uk/ofgem-publications/92189/forwardworkprogramme2015-16.pdf 32 As part of our work with COSEG, we concluded that centralisation of DP and DA would not be required
to improve the speed and reliability of the switching process, so this will not be included in the scope of this programme. 33 For example, the Secretary of State can direct the DCC, under SLC15 of its licence, to make the changes necessary to centralise registration services. 34 As described in the June consultation, an SCR allows us to direct the industry to propose changes to industry codes to give effect to our policy proposals which we would then approve or reject. The SCR process gives us greater control when seeking to manage changes to multiple industry codes and licence obligations. This approach seeks to address the lack of incentives that some industry parties may have to develop and assess any code modifications as a coherent package and progress this work in a timely manner.
Moving to reliable next-day switching
24
details on how we will undertake this programme. While we recognise that the SCR
process is capable of delivering the required changes, new legislation could further
strengthen our ability to drive the programme. We intend to explore this further
with government.
Programme design
2.12. Our June consultation proposed a three-stage approach to implementation:
detailed regulatory design; enacting change to the regulatory framework; and the
design, build and test of the technical solution.
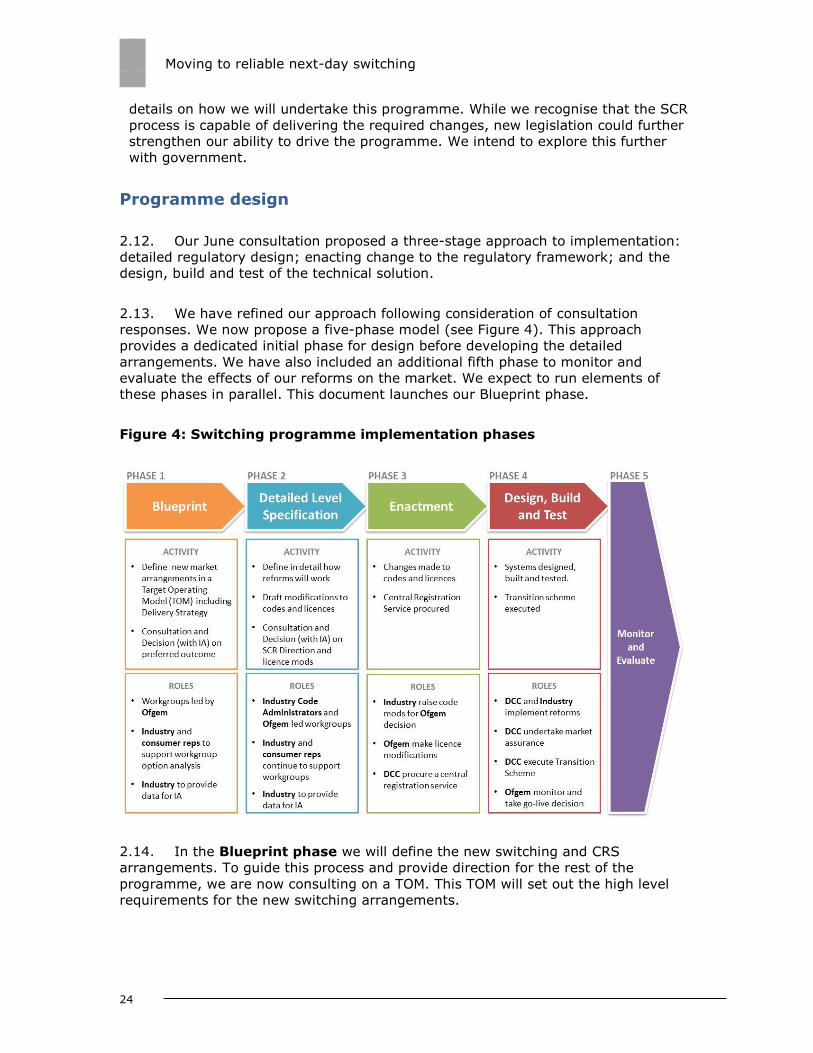
2.13. We have refined our approach following consideration of consultation
responses. We now propose a five-phase model (see Figure 4). This approach
provides a dedicated initial phase for design before developing the detailed
arrangements. We have also included an additional fifth phase to monitor and
evaluate the effects of our reforms on the market. We expect to run elements of
these phases in parallel. This document launches our Blueprint phase.
Figure 4: Switching programme implementation phases
2.14. In the Blueprint phase we will define the new switching and CRS
arrangements. To guide this process and provide direction for the rest of the
programme, we are now consulting on a TOM. This TOM will set out the high level
requirements for the new switching arrangements.

Moving to reliable next-day switching
25
2.15. We intend to form four workgroups to develop a design baseline35, which we
will chair and lead. These workgroups will be made up of industry and consumer
representatives, who will provide the expertise needed to develop the new
arrangements.
Business Process Design Workgroup: This group will design a fast, simple and
reliable switching service. It will focus on a next-day solution but also
examine two-day switching. It will set out the requirements of a CRS, what
data (including new data items) should be held in this service to support the
market, and who should maintain and access each data item. It will also
describe how the arrangements can support existing requirements (eg
settlement and network charges) and new market requirements.
Regulatory Design Workgroup: This group will define how the governance for
the new arrangements will operate, including what industry codes and
licences will need to be amended and broadly what changes need to be made.
Commercial Workgroup: This workgroup will define the overarching
commercial framework for the DCC when procuring the CRS, including licence
obligations, incentives and price control arrangements. It will define what
changes will be made to existing network obligations and price controls for
provision of registration services. It will also define the procurement
framework that DCC is expected to use.
Delivery Strategy Workgroup: This workgroup will develop a strategy for how
the CRS will be designed, built and tested, how market readiness will be
tested and assured and the transition process for current arrangements into
the new arrangements (including transitional governance, data migration and
implementation technique). This is a complex programme and it is important
to make an early start to planning these delivery arrangements.
2.16. At the end of this phase we will consult on our preferred market design with
a supporting impact assessment.
2.17. In the Detailed Level Specification (DLS) phase we will continue to
develop the detailed technical design based on the Blueprint design through the
workgroups formed as part of the Blueprint phase. We will define the outputs to be
delivered by industry code changes (eg requirements and interface specifications,
process maps and service levels) as well as the key documents needed to procure
the CRS (e.g. procurement plan). We will also further develop the delivery strategy.
2.18. Once the workgroups have concluded we expect to consult on our proposed
decision. At the end of the DLS phase we would then issue SCR Direction(s) to
35 We will define a series of design baselines through the lifetime of the programme to deliver a consolidation of all of the design products at a particular time as a point of reference (e.g. for stakeholder consultation; collecting data for our impact assessment; or to procure a CRS provider against).
Moving to reliable next-day switching
26
licensee(s) requiring them to raise the modifications that give effect to our proposals
across a range of industry codes.
2.19. In the Enactment phase we will look to the industry and code
administrators to undertake the detailed drafting of business rules and code
modifications needed to deliver the changes for their respective codes. Their
involvement and responsibility will therefore increase in this phase. We expect to
oversee this development to ensure the tight deadlines are met and the overall
integrity of the model for the new arrangements is maintained.
2.20. In this phase we expect to make licence modifications and approve changes
to industry codes. We recognise the risk of delays as the changes to industry codes
progress through the modification process. We therefore intend to take a hands-on
role in helping to progress these changes quickly. The CRS will be procured and a
contract signed. At this end of the phase, parties will have clear regulatory
requirements that establish what needs to be implemented and by when.
2.21. In the Design, Build and Test phase the CRS will be built, tested and
populated with data. Other industry parties will make the required changes to their
systems and processes. A testing process will provide assurance that the new
arrangements can be implemented and the systems will go live. A transition scheme
will be executed to ensure that all data migration and market readiness activities are
complete.
2.22. We expect specific industry parties (eg the DCC and the SEC Panel) to take a
leading role in determining market readiness. We expect to monitor overall progress
against an agreed delivery plan and transition scheme. We will take the overall
decision to go-live.
2.23. We will monitor and report on progress toward implementation during this
phase. We will also continue to own and maintain the design baseline as it develops
through this phase, and assess and implement any changes to it. At an appropriate
point, governance and control of deliverables can be passed to the industry and code
administrators.
2.24. During the Monitoring and Evaluation phase we will monitor the effects of
our reforms on the market and consider any further changes required to ensure that
the benefits for consumers are fully realised and any operational problems are
resolved.
Implementation timescales
2.25. Publishing this document signals the start of the Blueprint phase. We want to
implement our proposals by 2019 and will commence the industry workgroups for
the Blueprint phase by the end of 2015. In the coming months we intend to hold
industry expert group meetings to discuss, in more detail, the TOM for next-day
switching and our programme of work.

Moving to reliable next-day switching
27
2.26. Our plan aims to get the best outcome for consumers, balancing when they
can benefit from the new arrangements against the cost and risk of the
implementation programme.
Programme governance
2.27. To deliver the programme we have developed a governance structure for the
Blueprint phase (Figure 5). We expect this governance structure to be reviewed and
to evolve as the programme progresses.
Figure 5: Blueprint governance
2.28. The Ofgem Programme Board will be responsible for making decisions on
issues escalated from the Ofgem Design Authority on the design baseline and impact
assessment. It is also responsible for providing the Ofgem Programme Manager with
the necessary decisions for the programme to proceed and to overcome any
problems. It will approve key deliverables.
2.29. The Ofgem Design Authority owns the design baseline, and agrees this
baseline as it develops. Their role will also be to resolve regulatory issues. The
Ofgem Design Authority is the primary decision-making body, responsible for making
decisions on the design baseline and impact assessment.

Moving to reliable next-day switching
28
2.30. The Ofgem Design and Impact Assessment Team will support the
Design Authority. It will oversee the day-to-day development of the design baseline
and coordinate the workgroups. It will also lead the development of the impact
assessment. This team will be responsible for maintaining links to consumer
representatives and ensuring the programme remains focused on Ofgem’s consumer
outcomes.
2.31. We will form a Senior Stakeholder Group drawn from senior industry
representatives. This group would help keep the programme on track, maintain
industry commitment, support and resource for our work.
2.32. The External Design Advisory Group will provide industry input into the
overall design baseline and advise on links, dependencies and how best to coordinate
our work.
2.33. Ofgem will lead and chair the four proposed workgroups and will be
responsible for providing papers and recommendations for industry to review.
Membership will be made up of Ofgem team members and invited industry
representatives who will provide the expertise needed to deliver aspects of the
design baseline.
2.34. Participants will be expected to take away actions and development work
from workgroups. For transparency all workshop documentation will be made
available on our website.
2.35. We have designed our programme governance structure in a way that we
think will enable the risks of the programme to be best managed, particularly those
relating to IT or systems change. The active involvement of industry in the
workgroups and External Design Advisory Group will be invaluable in this respect.
Stakeholder Engagement
2.36. We recognise the importance of working with industry to develop our
proposals, and there will be opportunities for industry to actively participate
throughout the programme.
2.37. Our governance framework, described in the previous section, presents the
different channels through which a wide range of industry parties can participate in
the programme (workgroups, Senior Stakeholder Group and External Design
Advisory Group).
2.38. In addition to the stakeholder engagement channels described above we will
also be organising bilateral meetings with individuals and representative groups to
discuss views on a confidential basis. These meetings will also ensure that views
from all stakeholders are incorporated into the process. These will be held on an ad-
hoc basis over the course of the programme.
Moving to reliable next-day switching
29
2.39. We intend to send out a request for information (RFI) to industry towards
the end of the Blueprint workgroups in 2016. This will be an opportunity for industry
to continue to feed into the evolution of the impact assessment which underpins our
design baseline. In addition to this we intend to publish a series of consultations over
the course of the programme. The consultation periods will allow all interested
parties to formally express their views on our position.
Implementation principles, risks and issues
Implementation principles
2.40. The majority of respondents were supportive of the implementation
principles we identified in June and particularly welcomed our focus on consumer
outcomes. There was less support for our second principle that implementation
should be as soon as possible, as this could risk not developing the best process for
consumers.
2.41. Some respondents suggested additional principles around minimising costs,
and allowing independent suppliers to flourish. We consider both of these to be
consistent with our principle on consumer outcomes.
2.42. We propose to further develop the implementation principles and agree
these with the External Design Advisory Group when it starts to meet towards the
end of this year.
Implementation risks and issues
2.43. Most respondents agreed that we had identified the key risks and issues
involved with our lead option of next-day switching. There was strong agreement on
the risks of competing industry priorities and respondents noted the significant level
of change that is already underway within the industry, particularly the smart meter
roll out and Project Nexus.36 Respondents were concerned that an SCR launch, in
parallel with these competing priorities, may risk overstretching industry expertise
(in particular the DCC and independent suppliers) during for this period.
2.44. We have recognised these concerns in our decision to commence workgroups
at the end of the year.
36 Project Nexus is a work programme that has been established to review and overhaul the gas settlement arrangements.
Moving to reliable next-day switching
30
Next Steps
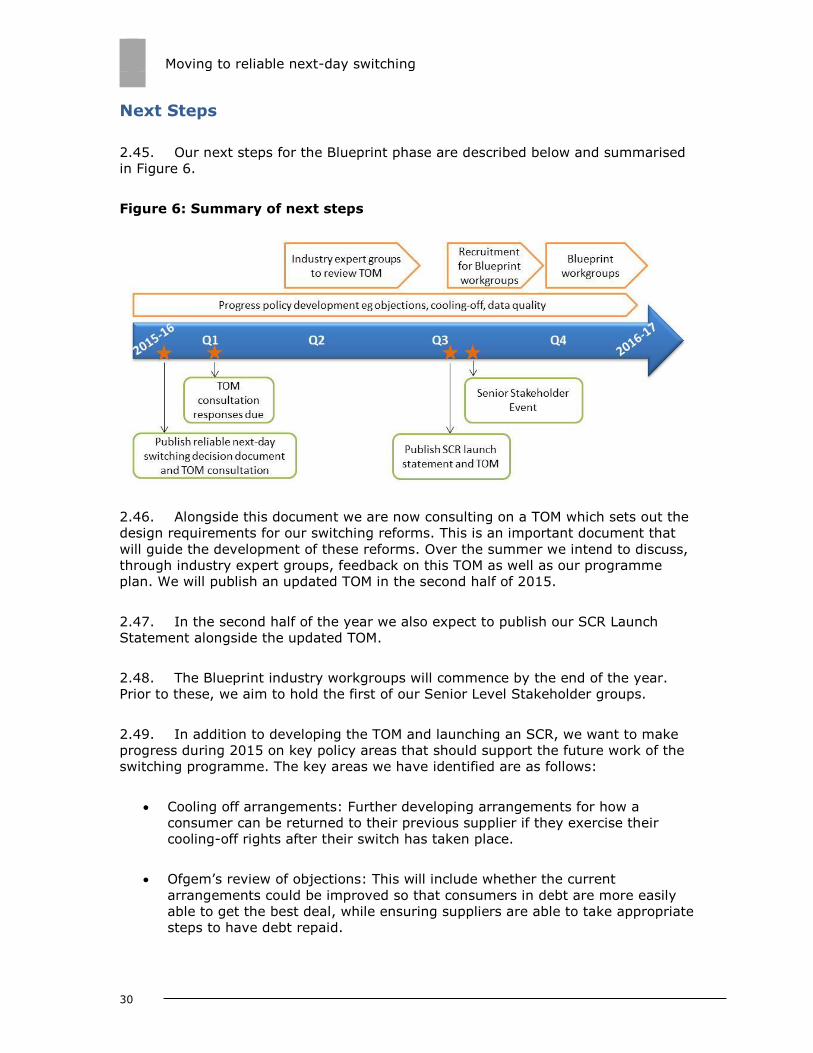
2.45. Our next steps for the Blueprint phase are described below and summarised
in Figure 6.
Figure 6: Summary of next steps
2.46. Alongside this document we are now consulting on a TOM which sets out the
design requirements for our switching reforms. This is an important document that
will guide the development of these reforms. Over the summer we intend to discuss,
through industry expert groups, feedback on this TOM as well as our programme
plan. We will publish an updated TOM in the second half of 2015.
2.47. In the second half of the year we also expect to publish our SCR Launch
Statement alongside the updated TOM.
2.48. The Blueprint industry workgroups will commence by the end of the year.
Prior to these, we aim to hold the first of our Senior Level Stakeholder groups.
2.49. In addition to developing the TOM and launching an SCR, we want to make
progress during 2015 on key policy areas that should support the future work of the
switching programme. The key areas we have identified are as follows:
Cooling off arrangements: Further developing arrangements for how a
consumer can be returned to their previous supplier if they exercise their
cooling-off rights after their switch has taken place.
Ofgem’s review of objections: This will include whether the current
arrangements could be improved so that consumers in debt are more easily
able to get the best deal, while ensuring suppliers are able to take appropriate
steps to have debt repaid.

Moving to reliable next-day switching
31
DCC licence: We will propose changes to the DCC licence to establish its role
in supporting the development of the new arrangements, covering how its
new activities will be funded through to CRS implementation.
Data quality: Supporting industry’s work to improve the quality of data
needed to support reliable and faster switching.
2.50. Throughout this year we will continue to monitor industry performance on
switching. This will include correct use of the objections process, not erroneously
transferring consumers, compliance with the five-week switching requirements and
implementation of 17-day switching.
Moving to reliable next-day switching
32
Appendices
Index
Appendix Name of Appendix Page Number
1 Updated detailed approach and methodology 33
2 Updated detailed results 48
3 Glossary 62
Moving to reliable next-day switching
33
Appendix 1 – Updated detailed approach
and methodology
Summary: We have incorporated programme governance and administration costs
into the quantitative cost assessment. We also refreshed some technical
implementation costs, planning assumptions, and market data. We have developed
some illustrative examples that put the industry costs of reform into context.
1.1. This appendix sets out the changes we have made to our methodology to
quantitatively assess the direct financial effects of our proposals to improve the
switching process following the June consultation document. The updated results are
shown in Appendix 2.
1.2. In June, we set out the methodology used to quantify the direct costs for
companies to change their systems and business processes related to change of
supply. We assessed the costs of different reform packages which met different
switching timescales based on centralising registration services or enhancing existing
network-run services. Any quantified benefits of the reforms were direct cost savings
in capex and opex against a baseline which held other factors constant, the
‘counterfactual’. The costs were estimated using quantitative evidence gathered from
stakeholders. For further details, please refer to Appendix 4 of the ‘Moving to
Reliable Next Day Switching’ consultation document.
1.3. We have taken into account comments and questions on this from
stakeholders. This appendix responds to these comments. It updates the
methodology used previously where we have made changes to reflect new
information. It also incorporates additional analysis to help parties better understand
the costs of the proposals.
Responses and clarifications
Baseline costs
1.4. To help us assess the costs of the switching reforms, we considered their
effect against the counterfactual baseline (see paragraph 1.2 above). Some
respondents questioned the baseline for measuring the costs and benefits of the
reform packages we considered. To clarify, the direct costs we requested from
stakeholders (including the counterfactual) assumed that changes due to be
implemented by the planned go-live year for the reforms were implemented as
anticipated. These included Project Nexus and 17-day switching.
1.5. We acknowledge the comments from some stakeholders that there is
significant uncertainty in forecasting counterfactual and reform option costs several
years ahead while many system changes are in the pipeline. This uncertainty should
fall as we update our impact assessment throughout the programme.
Moving to reliable next-day switching
34
Smart meter roll-out
1.6. The number of traditional energy meters will decline significantly during the
modelling period which ends in 2030. Therefore, we assumed that the opex costs
that could be directly attributed to traditional meters would decline. Several
respondents commented that assumptions regarding the roll-out of smart metering
seemed unrealistic. They argued that the continued presence of traditional meters
would increase the estimated costs of the reform packages. They said that the cost
of running different systems in parallel for smart and traditional meters should be
taken into account.
1.7. An assumption on the run-down of traditional meters was only applied to the
counterfactual costs for the electricity meter reading arrangements and the reform
option to hold electricity metering data centrally. The latter is a reform option that
did not form part of our proposed reform package in the June consultation document,
and we presented the cost estimate (a NPV cost of around £45m) separately. While
we recognise that there could be benefits in holding metering data centrally for
traditional electricity meters, we agree with those respondents that felt it would not
be efficient over the longer term as the population of these meters decreases. In the
event existing reforms are shown to be insufficient and further industry work reveals
a compelling case for central retention of this data, there could be scope for further
review during the switching programme.
1.8. For other reform areas such as registration and objections, we had not made
an assumption on the potential reduction in disputed reads and exceptions due to
smart meters due to a lack of such detailed information. We would expect any such
change in costs to occur both in the counterfactual case and with reform options.
However, we recognised that the magnitude of any change in associated costs might
vary between the counterfactual and the different reform options. Therefore, we will
discuss this aspect of cost profiling again with stakeholders to inform future cost
assessments. We will also take into account the latest information on the smart
meter roll-out, if it is likely to have a material effect, in future updates to the impact
assessment.
Missing data
1.9. In some cases data was not provided by stakeholders and we accounted for
this in different ways to represent the effects of the reforms on different energy
companies. A respondent raised concerns, given the bespoke nature of suppliers’ IT
systems, that missing capex data points for ‘large’ energy suppliers37 had been
estimated using data points from other ‘large’ suppliers.
37 The six largest energy suppliers according to the number of customers served, as per Appendix 4 of the ‘Moving to Reliable Next Day Switching’ Consultation document: https://www.ofgem.gov.uk/ofgem-publications/88157/fastandreliableswitchingcondoc-appendicies40.pdf
Moving to reliable next-day switching
35
1.10. For the ‘large’ suppliers we had a good response to our RFIs, this
approximation was therefore used infrequently. However, we acknowledge this
limitation in the dataset. Given that suppliers attributed missing data points to a lack
of visibility around the technical requirements and design of the reform options
considered, we expect any gaps to be addressed during the next assessment of
costs.
1.11. A stakeholder asked what type of smaller suppliers responded to the RFIs. All
four were non-domestic suppliers of small and medium enterprises (SME) and
industrial and commercial customers (I&C). We engaged with several domestic-only
independent suppliers but were unable to gather data from them. For this reason, we
worked with a third party service provider to develop incremental cost estimates of
the reforms.
1.12. An independent supplier voiced concern that the scale of direct costs on
suppliers of different sizes had not been considered. It considered that the
implementation costs of the reforms could have a knock-on adverse effect on smaller
suppliers’ ability to attract new consumers and on competition in the market.
1.13. We have been unable to model the direct costs on different industry parties of
more consumers transferring between suppliers (a predicted effect of our policy
proposals). This is largely due to a lack of information on the direct costs of the
proposals for smaller suppliers and information on how these may be expected to
vary as their consumer bases change.
1.14. Qualitatively, we acknowledge the risk that smaller suppliers may not be able
to obtain systems and services at the same rate and cost as larger suppliers.
Implementation costs for smaller suppliers may therefore be larger in proportion to
the size of their businesses. These risks could increase if implementation of the
proposals is required in a shorter time period.
1.15. On the other hand, smaller suppliers may be more flexible in their internal
operations and may be able to adapt to changes efficiently. Additionally, these
companies are more likely to buy services and systems from specialist third party
providers that can spread their development costs amongst a large portfolio of
clients.
1.16. We set out in Chapter 1 our intention to engage further with independent
suppliers in the Blueprint phase. We will take into account that they may be able to
commit fewer resources to the business process and regulatory design. The design of
policies such as the charging methodology for the CRS, and transitional schemes to
move towards faster switching should also consider the principle of fairness and
equality for smaller companies.
Profiling of capital expenditure
1.17. A respondent questioned the period over which industry would incur costs to
implement the reforms. We note that the direct cost assessment assumed that capex
was incurred up-front by industry parties during the implementation period of the
system changes (then Q4 2015-Q3 2018).

Moving to reliable next-day switching
36
Networks companies’ costs
1.18. Another stakeholder commented that assumed cost savings from centralising
registration linked to network companies’ current spend on registration systems
cannot affect the assessment of costs on consumers unless we commit to re-opening
the relevant price controls.
1.19. We note that our assessment of industry costs contained modest cost savings
for some network companies which were balanced out by net costs across other
network companies. With sharing factors in place for actual opex being above or
below allowed revenues set by price controls, we would not expect an assessment of
the costs on consumers to be materially affected by the continuation of existing price
control arrangements.
1.20. Furthermore, since the next electricity and gas price controls are due to
continue until 2023 and 2021 respectively, any ongoing costs or cost savings could
potentially be taken into account in the new price control periods.
1.21. Finally, the avoided capex modelled for registration systems was intended to
reflect avoided future expenditure over the entire modelling period (ie until 2030)
rather than avoided current planned investment. Therefore any future investment
needs for network companies to maintain existing registration systems, which would
have been captured in subsequent price controls, could be avoided due to centralised
registration.
1.22. We have considered the related issue of the independent networks and their
ability to charge for any additional costs imposed by wider industry change projects.
The mechanism by which independent networks recover any additional costs they
incur as a result of switching reforms is a matter that should be addressed within the
Commercial workgroup.
Assumptions on the costs of specific reform options
1.23. Consultation question 17 asked if the direct costs of investing in systems to
shorten the objections window and the ongoing operational costs would be similar for
a two-day objections window (proposed for a five-day switching process) and a one-
day objections window (proposed for a two-day switching process). The vast majority
of respondents agreed that costs would be similar for a two-day objections window.
1.24. A couple of respondents noted that this depends on the extent to which two-
day switching would require an element of real-time messaging within the objections
process. The speed with which data-flows must be transmitted is an aspect of the
technical specification of next-day and two-day switching solutions that we expect to
be covered in detail within the Business Process Design Workgroup in the Blueprint
phase.
1.25. Two respondents questioned the inclusion of an efficiency adjustment for
making multiple changes to the switching systems at the same time. In particular,
Moving to reliable next-day switching
37
they asked why this efficiency potential was included in the assessment of the reform
package for ‘two-day’ switching, with an upgrade of existing registration systems to
deliver instant processing (reform package 2b) but not with this switching speed and
centralised registration.
1.26. To clarify, assumptions about this type of efficiency potential were only
applied to a combination of reform options for which we had clear supporting data
from the energy suppliers (an objections register and reform to the registration
systems). In an exceptional case, we received some useful data bilaterally on the
efficiency potential of combining reform options from other stakeholders. Some of
these reform options featured in the ‘two-day old platform’ reform package. In these
cases, we applied these reported efficiencies to the costs for those individual parties
which were used in the model.
1.27. We will revisit the efficiency potential of implementing several changes at once
during the Blueprint phase.38
Methodology update
1.28. In June, we described in detail the approach and methodology used to
quantitatively assess the direct costs and cost savings to industry parties of the
switching reforms proposed. This section describes how we have updated the
detailed methodology to take into account new information since June.
1.29. We have updated cost inputs and assumptions as a result of the following
information (which are described in Figure 1 below):
(a) updated or additional information received from industry parties following
the June consultation document
(b) greater visibility of the policy workgroups involved in implementing the
reform packages considered and the timetable for undertaking these
which have costs impacts, and
(c) updated market input data.
1.30. We acknowledge that in the Blueprint phase of work, as well as requesting
updated information from industry parties on their cost submissions, we will need to
consider costs for additional activities that are not known to us at present. These
include:
38 In particular, respondents told us that there are likely to be efficiencies in implementing changes that shared common characteristics, for example on data exchange and processing speeds.
Moving to reliable next-day switching
38
(a) establishing a customer returns process that complements faster
switching to accommodate cancelations of switching requests during the
cooling-off period
(b) end-to-end testing and user interface testing for all parties that would
need to interact with the CRS
(c) data cleanse and migration activities for a CRS and activities involved in
transferring to the new governance arrangements, including change
management
(d) any changes the Data Service Provider for the central smart metering
system may need to make to allow users to interact with the new CRS
(e) monitoring market readiness as industry parties work towards meeting the
planned go-live date for the new switching processes, and
(f) a centrally-run consumer awareness campaign – if considered necessary.
1.31. We consider that the drivers of testing, data cleanse and migration costs for
the faster switching reform options with a new CRS should be considered by the
Business Process Design and Delivery Strategy workgroups in the Blueprint phase.
Such work will help shape the evolution of impact assessments in the future.
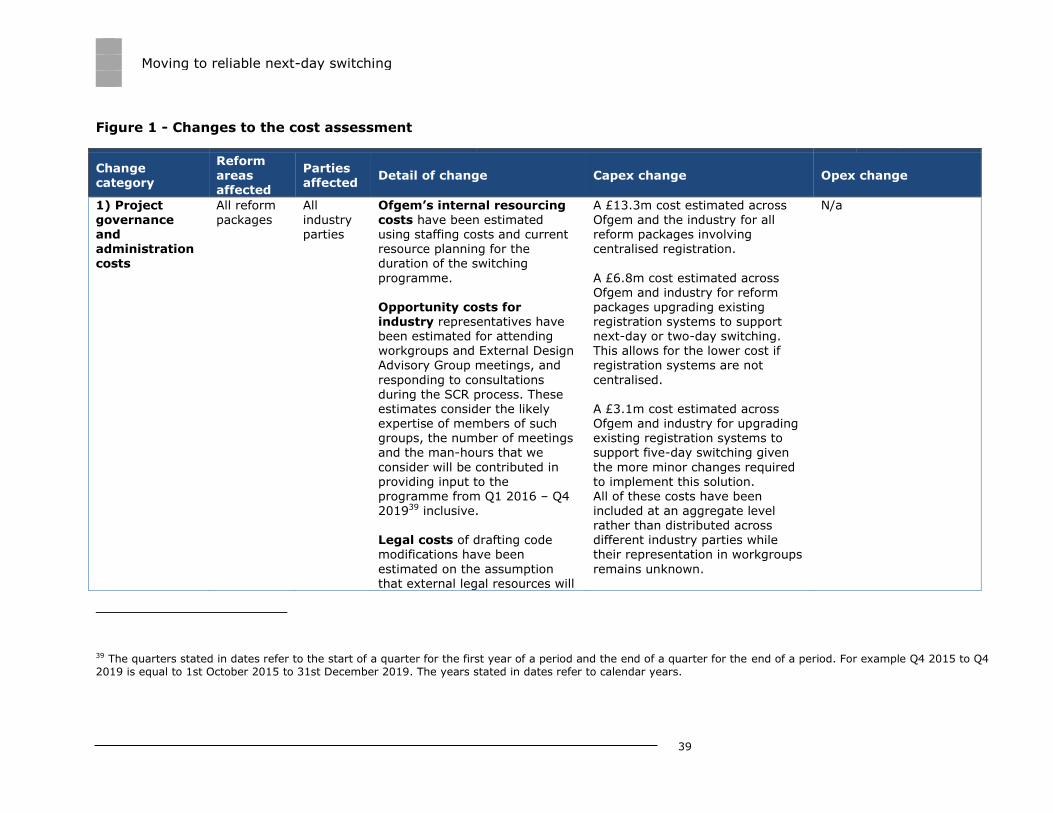
Moving to reliable next-day switching
39
Figure 1 - Changes to the cost assessment
Change category
Reform areas affected
Parties affected
Detail of change Capex change Opex change
1) Project
governance and administration costs
All reform
packages
All
industry parties
Ofgem’s internal resourcing
costs have been estimated using staffing costs and current resource planning for the duration of the switching
programme. Opportunity costs for industry representatives have been estimated for attending workgroups and External Design Advisory Group meetings, and
responding to consultations during the SCR process. These estimates consider the likely expertise of members of such groups, the number of meetings and the man-hours that we
consider will be contributed in providing input to the programme from Q1 2016 – Q4 201939 inclusive.
Legal costs of drafting code modifications have been
estimated on the assumption that external legal resources will
A £13.3m cost estimated across
Ofgem and the industry for all reform packages involving centralised registration.
A £6.8m cost estimated across Ofgem and industry for reform packages upgrading existing registration systems to support next-day or two-day switching. This allows for the lower cost if registration systems are not
centralised. A £3.1m cost estimated across Ofgem and industry for upgrading existing registration systems to support five-day switching given
the more minor changes required to implement this solution. All of these costs have been included at an aggregate level
rather than distributed across different industry parties while their representation in workgroups
remains unknown.
N/a
39 The quarters stated in dates refer to the start of a quarter for the first year of a period and the end of a quarter for the end of a period. For example Q4 2015 to Q4 2019 is equal to 1st October 2015 to 31st December 2019. The years stated in dates refer to calendar years.
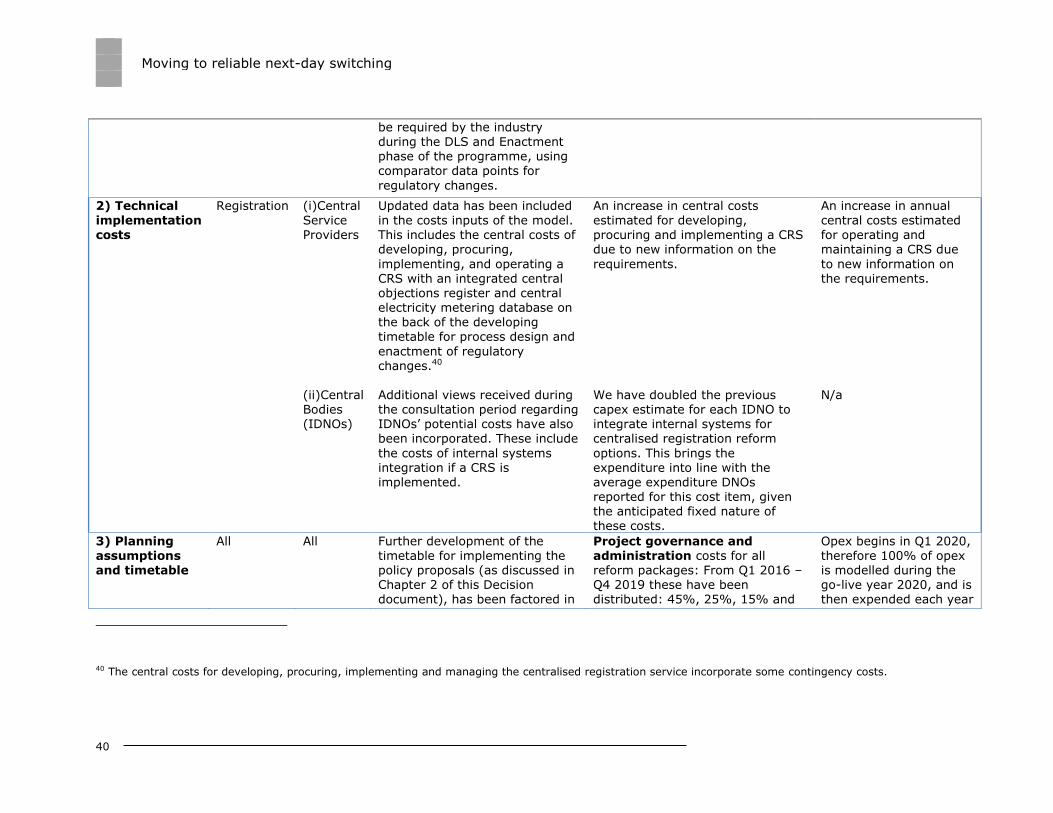
Moving to reliable next-day switching
40
be required by the industry during the DLS and Enactment phase of the programme, using comparator data points for
regulatory changes.
2) Technical
implementation costs
Registration
(i)Central
Service Providers
(ii)Central Bodies (IDNOs)
Updated data has been included
in the costs inputs of the model. This includes the central costs of developing, procuring,
implementing, and operating a CRS with an integrated central objections register and central electricity metering database on the back of the developing timetable for process design and
enactment of regulatory changes.40
Additional views received during the consultation period regarding IDNOs’ potential costs have also been incorporated. These include
the costs of internal systems integration if a CRS is implemented.
An increase in central costs
estimated for developing, procuring and implementing a CRS due to new information on the
requirements.
We have doubled the previous capex estimate for each IDNO to integrate internal systems for centralised registration reform
options. This brings the expenditure into line with the average expenditure DNOs reported for this cost item, given the anticipated fixed nature of
these costs.
An increase in annual
central costs estimated for operating and maintaining a CRS due
to new information on the requirements.
N/a
3) Planning assumptions and timetable
All All Further development of the timetable for implementing the policy proposals (as discussed in Chapter 2 of this Decision document), has been factored in
Project governance and administration costs for all reform packages: From Q1 2016 – Q4 2019 these have been distributed: 45%, 25%, 15% and
Opex begins in Q1 2020, therefore 100% of opex is modelled during the go-live year 2020, and is then expended each year
40 The central costs for developing, procuring, implementing and managing the centralised registration service incorporate some contingency costs.
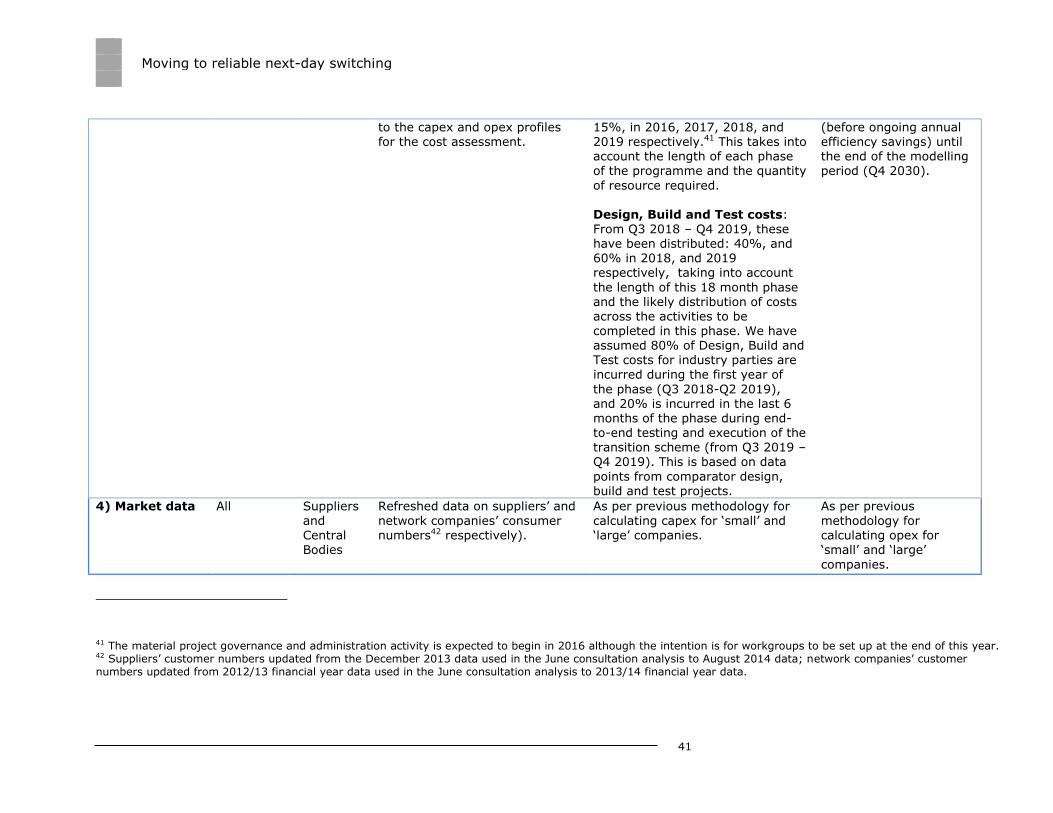
Moving to reliable next-day switching
41
to the capex and opex profiles for the cost assessment.
15%, in 2016, 2017, 2018, and 2019 respectively.41 This takes into account the length of each phase of the programme and the quantity
of resource required. Design, Build and Test costs:
From Q3 2018 – Q4 2019, these have been distributed: 40%, and 60% in 2018, and 2019 respectively, taking into account
the length of this 18 month phase and the likely distribution of costs across the activities to be completed in this phase. We have assumed 80% of Design, Build and Test costs for industry parties are
incurred during the first year of
the phase (Q3 2018-Q2 2019), and 20% is incurred in the last 6 months of the phase during end-to-end testing and execution of the transition scheme (from Q3 2019 – Q4 2019). This is based on data
points from comparator design, build and test projects.
(before ongoing annual efficiency savings) until the end of the modelling period (Q4 2030).
4) Market data All Suppliers
and Central Bodies
Refreshed data on suppliers’ and
network companies’ consumer numbers42 respectively).
As per previous methodology for
calculating capex for ‘small’ and ‘large’ companies.
As per previous
methodology for calculating opex for ‘small’ and ‘large’
companies.
41 The material project governance and administration activity is expected to begin in 2016 although the intention is for workgroups to be set up at the end of this year. 42 Suppliers’ customer numbers updated from the December 2013 data used in the June consultation analysis to August 2014 data; network companies’ customer numbers updated from 2012/13 financial year data used in the June consultation analysis to 2013/14 financial year data.
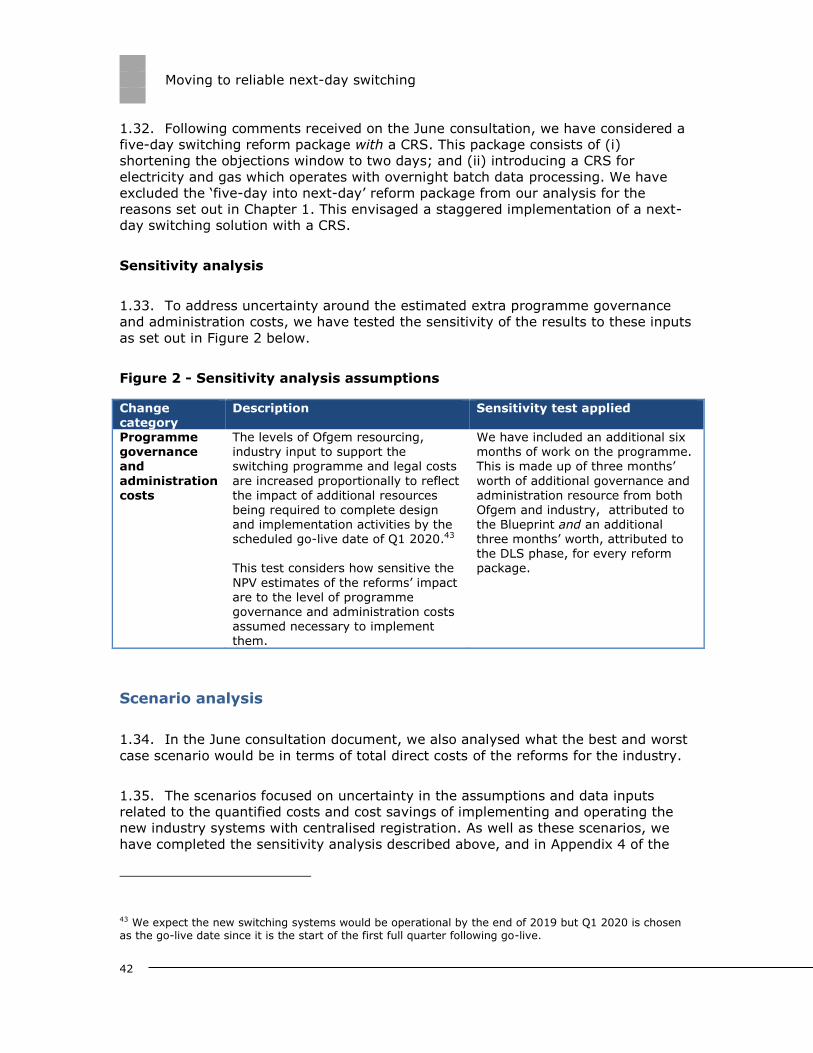
Moving to reliable next-day switching
42
1.32. Following comments received on the June consultation, we have considered a
five-day switching reform package with a CRS. This package consists of (i)
shortening the objections window to two days; and (ii) introducing a CRS for
electricity and gas which operates with overnight batch data processing. We have
excluded the ‘five-day into next-day’ reform package from our analysis for the
reasons set out in Chapter 1. This envisaged a staggered implementation of a next-
day switching solution with a CRS.
Sensitivity analysis
1.33. To address uncertainty around the estimated extra programme governance
and administration costs, we have tested the sensitivity of the results to these inputs
as set out in Figure 2 below.
Figure 2 - Sensitivity analysis assumptions
Change category
Description Sensitivity test applied
Programme governance and
administration costs
The levels of Ofgem resourcing, industry input to support the switching programme and legal costs
are increased proportionally to reflect the impact of additional resources being required to complete design
and implementation activities by the scheduled go-live date of Q1 2020.43 This test considers how sensitive the
NPV estimates of the reforms’ impact are to the level of programme governance and administration costs assumed necessary to implement them.
We have included an additional six months of work on the programme. This is made up of three months’
worth of additional governance and administration resource from both Ofgem and industry, attributed to
the Blueprint and an additional three months’ worth, attributed to the DLS phase, for every reform package.
Scenario analysis
1.34. In the June consultation document, we also analysed what the best and worst
case scenario would be in terms of total direct costs of the reforms for the industry.
1.35. The scenarios focused on uncertainty in the assumptions and data inputs
related to the quantified costs and cost savings of implementing and operating the
new industry systems with centralised registration. As well as these scenarios, we
have completed the sensitivity analysis described above, and in Appendix 4 of the
43 We expect the new switching systems would be operational by the end of 2019 but Q1 2020 is chosen as the go-live date since it is the start of the first full quarter following go-live.

Moving to reliable next-day switching
43
June 2014 consultation document. We think that they incorporate uncertainty into
our analysis in a way that is more specific to our dataset and the reform proposals
than applying more generic optimism bias percentages. However, we intend to
consider appropriate percentages of optimism bias further during the Blueprint phase
and we could incorporate these into our base case estimates.
1.36. The worst case scenario describes a set of events which we consider unlikely
to occur. However, we have developed this scenario to understand the impact on the
base case results.
1.37. We have incorporated the additional programme governance and
administration and technical implementation cost inputs into scenarios identified in
the Appendix 4 of the June consultation document, as set out below in bold.
i. Base case:
(a) The base case scenario includes the benefits and costs of each reform
package under the assumptions considered most likely to materialise
(as detailed in Figures 1-3 of the annex to Appendix 5 in the June
consultation and Figure 1 above).
ii. Best case scenario:
(a) The central costs for developing, procuring, implementing
and operating the CRS are lower than in the base case as
contingency budgets are not needed.
(b) Suppliers benefit from the highest efficiency of interacting with the
DCC for the objections register and for the CRS at the same time.
(c) Opex accuracy weights are set higher for those who reported opex
cost savings for manual processes through centralised registration
than for those who did not.
iii. Worst case scenario:
(a) Detailed feasibility studies are undertaken which take longer than
expected. To maintain the implementation timescales, total
industry capex costs for design, build and test of the new switching
systems are 20% higher than in the base case for those reforms
requiring more radical change. These reforms are: objections
Moving to reliable next-day switching
44
register (within the DCC), central electricity metering database44,
and centralised registration.
(b) Total industry opex costs are 20% higher than in the base case for
the reforms described in (a) above as implementing reforms to
tight timescales leads to greater operational issues.
(c) Annual opex efficiencies are lowered to 1% per annum as
implementing to tight timescales lowers the potential for
improvement in the operation of the new processes.
(d) Opex accuracy weights are set higher for those who did not report
opex cost savings for manual processes through centralised
registration, than for those who did.
(e) Project governance and administration costs reflect an
additional six months’ worth of resource being required from
Ofgem and industry (as detailed in Figure 2).
Consumer savings from switching
1.38. In Chapter 1 of this decision document, we presented indicative examples of
consumer bill savings arising from a given number of additional consumers switching
to a cheaper energy supplier and continuing to benefit from the same savings until
2030. These savings equal the total policy reform costs estimated in the base case
over the modelling period.
1.39. These are based on assumptions and static analysis and are not intended to
form a prediction of switching behaviour as a result of the policy proposals. They are
instead intended to illustrate a potential benefit available to consumers from
switching and add market context to the estimated costs of changing the switching
process.
1.40. As explained in Appendix 4 of the June consultation document, the reform
packages were developed to address the issues identified with the reliability, hassle
and length of the current switching process. Economic theory suggests that the effect
of switching costs is to deter engagement and make consumers less reactive to price
changes, which can prevent them from realising the benefits of moving to a new
supplier45. An empirical estimate of the drivers behind consumer switching in
44 We have set out the costs of this reform option separately in Appendix 2 to help parties better understand the costs. We remain of the view that holding consumption history and comprehensive MTDs centrally for smart, AMR and traditional electricity meters is not necessary for reliable next-day switching. However, in the event existing reforms are shown to be insufficient and further industry work reveals a compelling case for central retention of this data, there could be scope for further review of centrally held metering data during the switching programme. 45 See: Klemperer, Network Effects and Switching Costs: two short essays for the New Palgrave (2005).
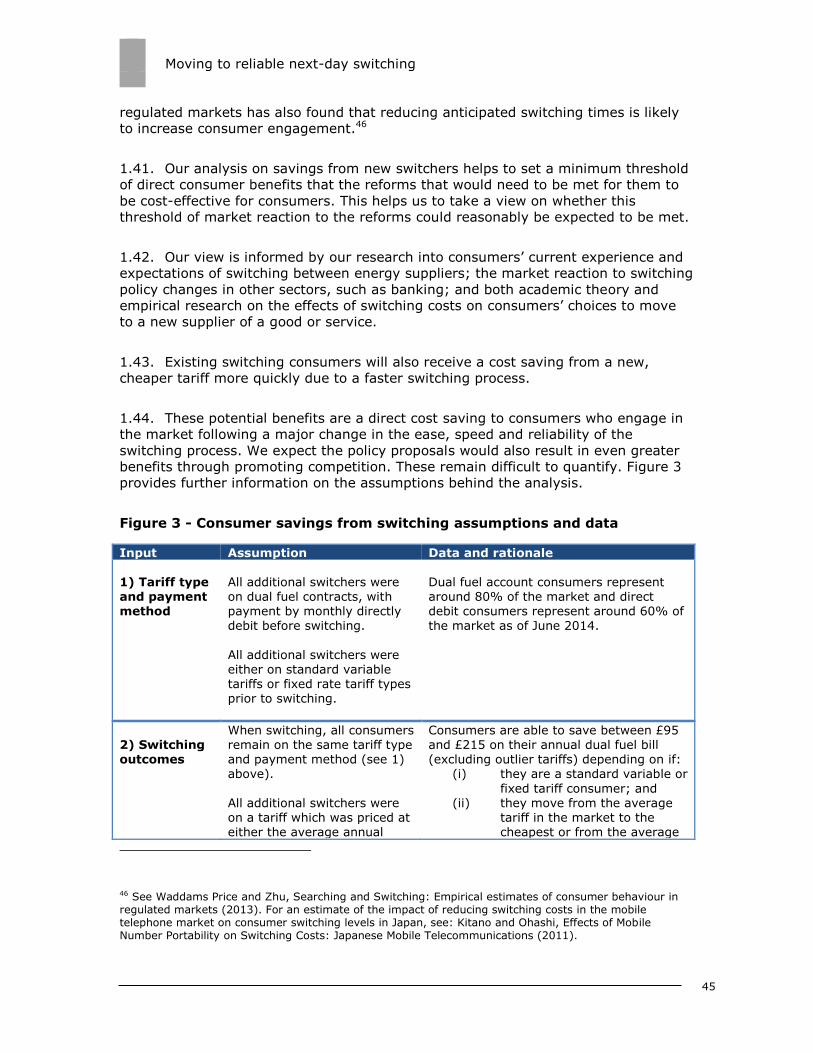
Moving to reliable next-day switching
45
regulated markets has also found that reducing anticipated switching times is likely
to increase consumer engagement.46
1.41. Our analysis on savings from new switchers helps to set a minimum threshold
of direct consumer benefits that the reforms that would need to be met for them to
be cost-effective for consumers. This helps us to take a view on whether this
threshold of market reaction to the reforms could reasonably be expected to be met.
1.42. Our view is informed by our research into consumers’ current experience and
expectations of switching between energy suppliers; the market reaction to switching
policy changes in other sectors, such as banking; and both academic theory and
empirical research on the effects of switching costs on consumers’ choices to move
to a new supplier of a good or service.
1.43. Existing switching consumers will also receive a cost saving from a new,
cheaper tariff more quickly due to a faster switching process.
1.44. These potential benefits are a direct cost saving to consumers who engage in
the market following a major change in the ease, speed and reliability of the
switching process. We expect the policy proposals would also result in even greater
benefits through promoting competition. These remain difficult to quantify. Figure 3
provides further information on the assumptions behind the analysis.
Figure 3 - Consumer savings from switching assumptions and data
Input Assumption Data and rationale
1) Tariff type and payment method
All additional switchers were on dual fuel contracts, with payment by monthly directly debit before switching.
All additional switchers were either on standard variable tariffs or fixed rate tariff types prior to switching.
Dual fuel account consumers represent around 80% of the market and direct debit consumers represent around 60% of the market as of June 2014.
2) Switching outcomes
When switching, all consumers remain on the same tariff type and payment method (see 1) above).
All additional switchers were on a tariff which was priced at either the average annual
Consumers are able to save between £95 and £215 on their annual dual fuel bill (excluding outlier tariffs) depending on if:
(i) they are a standard variable or
fixed tariff consumer; and (ii) they move from the average
tariff in the market to the cheapest or from the average
46 See Waddams Price and Zhu, Searching and Switching: Empirical estimates of consumer behaviour in regulated markets (2013). For an estimate of the impact of reducing switching costs in the mobile telephone market on consumer switching levels in Japan, see: Kitano and Ohashi, Effects of Mobile Number Portability on Switching Costs: Japanese Mobile Telecommunications (2011).
Moving to reliable next-day switching
46
price in the market for their tariff type and payment method or on the average annual price offered by the largest six suppliers for their
tariff type and payment method, prior to switching. All switchers then switch to the cheapest available tariff in the market.
The retail market offerings are assumed to remain static over
the modelling period. Consumers are assumed to benefit from bill savings relative to their tariff prior to
switching, each year from the year that they first switch until the end of the modelling period (2030). This is simplified analysis. We recognise that in reality some consumers may need to
switch again during the period to maintain these savings. Therefore, our analysis
assumes that each year, the same number of additional consumers switch and make
savings..
tariff offered by the largest six suppliers to the cheapest in the market.
Annual bill savings available in the market
are calculated using an average of monthly tariff data collected by Ofgem in 2013 and the first half of 2014. Elements (i) and (ii) above are used to calculate a conservative estimate of the savings that are available to consumers who may have
switched before and therefore are not on the most expensive tariffs available in the market and/or cannot maximise potential
savings by changing their tariff type. Note that we are only considering switches between suppliers, not switches between tariffs offered by the same supplier.
3) Baseline switching levels
Only dual fuel accounts are counted in the base level of consumer accounts and
account switches.
Estimates of the base dual fuel account switching rates are calculated using data from the largest six suppliers on gains
only as this information is available directly. The base number of dual fuel accounts is taken from 2013 data (18,000,000); this is not expected to have changed to any great extent in 2014.
The base number of dual fuel account switches (1,600,000) is calculated using an average: of (i) the actual figure recorded for 2013; and (ii) an estimate of the 2014 figure.
The 2014 estimate is calculated using: (i) the actual data available as of August 2014; and (ii) the mid-point of the range of September-December actual data in 2012 and in 2013, respectively. This is to account for the seasonal peak in switching
during autumn and winter that was
missing from the latest available 2014
Moving to reliable next-day switching
47
actual validated data, and to account for the fall in annual switching volumes from 2013 to 2014. This results in a 2013/2014 average dual
fuel account switching rate of 9%. A pessimistic 2014 estimate was also used in sensitivity analysis. It draws on the 2012 September-December switching figures. An optimistic 2014 estimate was calculated using the 2013 September-
December switching figures.
4) Policy costs
It is assumed that the average yearly capital expenditure
modelled in the base case to implement the systems changes to deliver the policy proposal from Q1 2016 – Q4 2019 is incurred up-front during these years. Average annual operational
expenditure modelled in the base case is assumed to be incurred each year from Q1 2020 (go-live of the reforms) - Q4 2030 (end of the
modelling period).
The data is calculated using industry RFI data as per the methodology outlined in
Appendix 4 of the June consultation document and in this Appendix. The base case capital expenditure modelled over the implementation years is averaged across those years, and the base case operational expenditure modelled from go-live to the end of the modelling period is
also averaged over the years. In practice, industry parties may recoup the investment and operational expenditure in different ways.
5) Baseline switching speed
The baseline switching time is assumed to be 17 calendar days. The baseline 2013/14
switching consumers are assumed to benefit from a one-off additional saving on their energy bill by being able to switch faster than 17 days due to the reform packages
considered.
Ofgem approved suppliers’ proposals to cut switching times to 17 days (which includes the statutory two-week cooling
off period for domestic consumers), by the end of 2014. This is the baseline against which the speed aspect of the reform packages should be compared. We have estimated the direct monetary
benefit that consumers (who would have switched regardless of the policy reform) can access through faster access to a new
tariff. We have done this by calculating the average daily saving that can be made by switching suppliers and scaling by the number of days the reform package could
reduce the switching completion speed by.
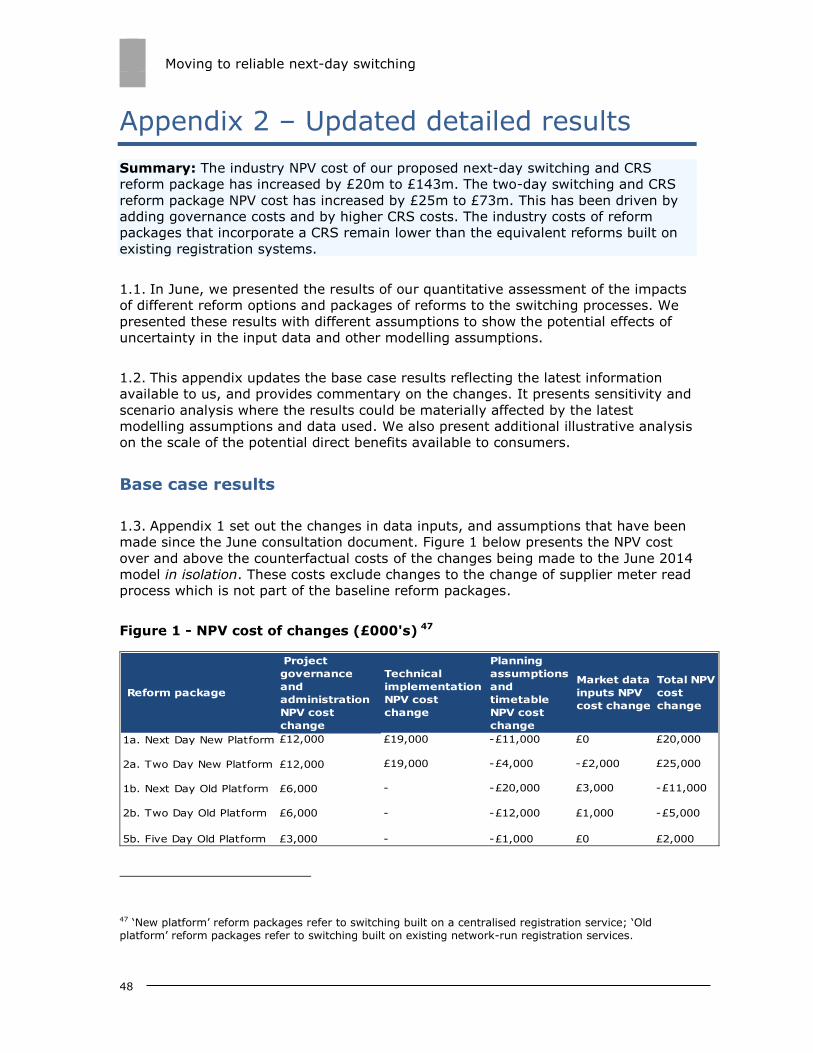
Moving to reliable next-day switching
48
Appendix 2 – Updated detailed results
Summary: The industry NPV cost of our proposed next-day switching and CRS
reform package has increased by £20m to £143m. The two-day switching and CRS
reform package NPV cost has increased by £25m to £73m. This has been driven by
adding governance costs and by higher CRS costs. The industry costs of reform
packages that incorporate a CRS remain lower than the equivalent reforms built on
existing registration systems.
1.1. In June, we presented the results of our quantitative assessment of the impacts
of different reform options and packages of reforms to the switching processes. We
presented these results with different assumptions to show the potential effects of
uncertainty in the input data and other modelling assumptions.
1.2. This appendix updates the base case results reflecting the latest information
available to us, and provides commentary on the changes. It presents sensitivity and
scenario analysis where the results could be materially affected by the latest
modelling assumptions and data used. We also present additional illustrative analysis
on the scale of the potential direct benefits available to consumers.
Base case results
1.3. Appendix 1 set out the changes in data inputs, and assumptions that have been
made since the June consultation document. Figure 1 below presents the NPV cost
over and above the counterfactual costs of the changes being made to the June 2014
model in isolation. These costs exclude changes to the change of supplier meter read
process which is not part of the baseline reform packages.
Figure 1 - NPV cost of changes (£000's) 47
Reform package
Project
governance
and
administration
NPV cost
change
Technical
implementation
NPV cost
change
Planning
assumptions
and
timetable
NPV cost
change
Market data
inputs NPV
cost change
Total NPV
cost
change
1a. Next Day New Platform £12,000 £19,000 -£11,000 £0 £20,000
2a. Two Day New Platform £12,000 £19,000 -£4,000 -£2,000 £25,000
£6,000 - -£20,000 £3,000 -£11,000
£6,000 - -£12,000 £1,000 -£5,000
5b. Five Day Old Platform £3,000 - -£1,000 £0 £2,000
1b. Next Day Old Platform
2b. Two Day Old Platform
47 ‘New platform’ reform packages refer to switching built on a centralised registration service; ‘Old platform’ reform packages refer to switching built on existing network-run registration services.
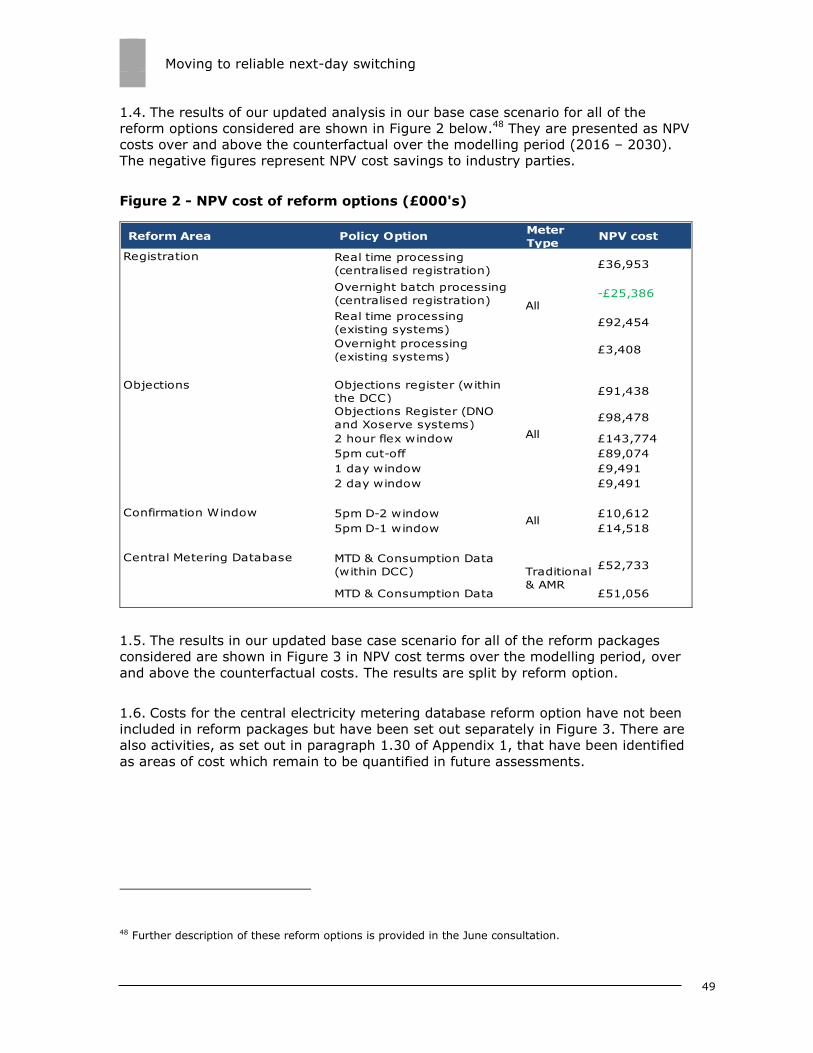
Moving to reliable next-day switching
49
1.4. The results of our updated analysis in our base case scenario for all of the
reform options considered are shown in Figure 2 below.48 They are presented as NPV
costs over and above the counterfactual over the modelling period (2016 – 2030).
The negative figures represent NPV cost savings to industry parties.
Figure 2 - NPV cost of reform options (£000's)
Reform Area Policy Option Meter
TypeNPV cost
Real time processing
(centralised registration)£36,953
Overnight batch processing
(centralised registration)-£25,386
Real time processing
(existing systems)£92,454
Overnight processing
(existing systems)£3,408
Objections register (within
the DCC)£91,438
Objections Register (DNO
and Xoserve systems)£98,478
2 hour flex window £143,774
5pm cut-off £89,074
1 day window £9,491
2 day window £9,491
5pm D-2 window £10,612
5pm D-1 window £14,518
MTD & Consumption Data
(within DCC)£52,733
MTD & Consumption Data £51,056
Confirmation Window
Objections
Registration
Central Metering Database
All
Traditional
& AMR
All
All
1.5. The results in our updated base case scenario for all of the reform packages
considered are shown in Figure 3 in NPV cost terms over the modelling period, over
and above the counterfactual costs. The results are split by reform option.
1.6. Costs for the central electricity metering database reform option have not been
included in reform packages but have been set out separately in Figure 3. There are
also activities, as set out in paragraph 1.30 of Appendix 1, that have been identified
as areas of cost which remain to be quantified in future assessments.
48 Further description of these reform options is provided in the June consultation.
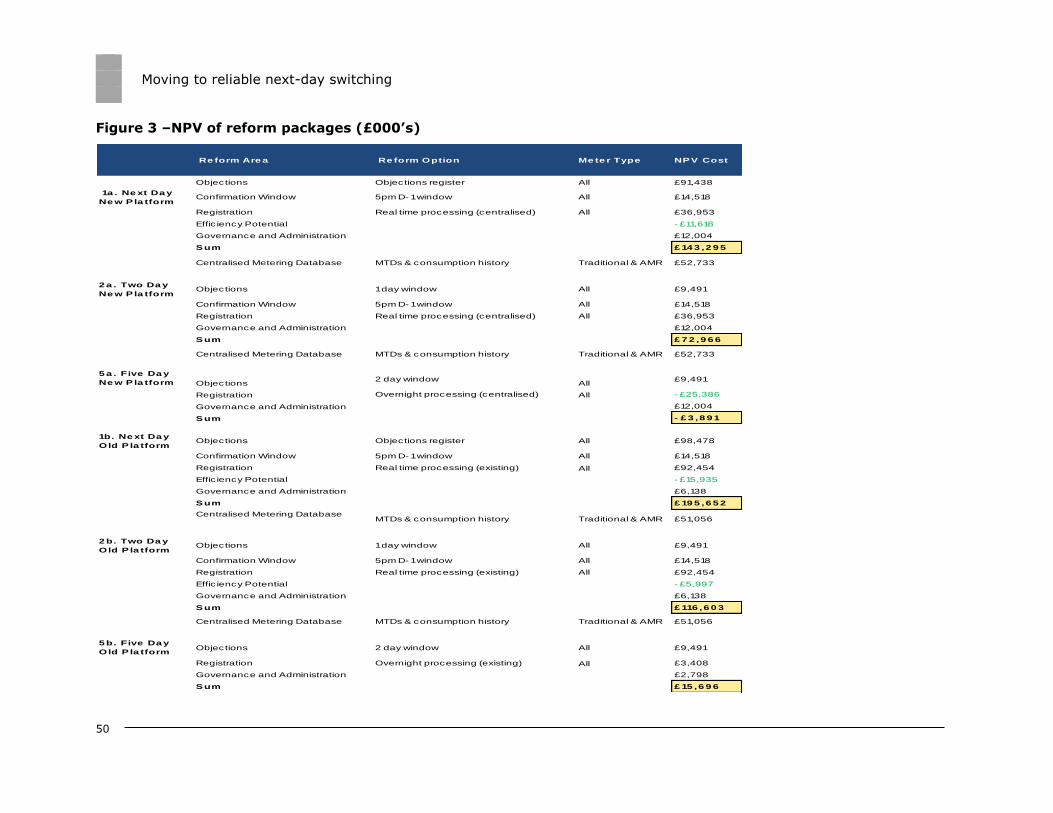
Moving to reliable next-day switching
50
Figure 3 –NPV of reform packages (£000’s)
Re form Are a Re form Option Me te r Type NPV Cost
Objections Objections register All £91,438
1a . Ne xt Da y
Ne w P la tformConfirmation Window 5pm D- 1 window All £14,518
Registration Real time processing (centralised) All £36,953
Effic iency Potential - £11,618
Governance and Administration £12,004
Sum £ 14 3 ,2 9 5
Centralised Metering Database MTDs & consumption history Traditional & AMR £52,733
2 a . Two Da y
Ne w P la tformObjections 1 day window All £9,491
Confirmation Window 5pm D- 1 window All £14,518
Registration Real time processing (centralised) All £36,953
Governance and Administration £12,004
Sum £ 7 2 ,9 6 6
Centralised Metering Database MTDs & consumption history Traditional & AMR £52,733
5 a . Five Da y
Ne w P la tform Objections2 day window
All£9,491
Registration Overnight processing (centralised) All - £25,386
Governance and Administration £12,004
Sum - £ 3 ,8 9 1
1b. Ne xt Da y
Old P la tformObjections Objections register All £98,478
Confirmation Window 5pm D- 1 window All £14,518
Registration Real time processing (existing) All £92,454
Effic iency Potential - £15,935
Governance and Administration £6,138
Sum £ 19 5 ,6 5 2
Centralised Metering DatabaseMTDs & consumption history Traditional & AMR £51,056
2 b. Two Da y
Old P la tformObjections 1 day window All £9,491
Confirmation Window 5pm D- 1 window All £14,518
Registration Real time processing (existing) All £92,454
Effic iency Potential - £5,997
Governance and Administration £6,138
Sum £ 116 ,6 0 3
Centralised Metering Database MTDs & consumption history Traditional & AMR £51,056
5 b. Five Da y
Old P la tformObjections 2 day window All £9,491
Registration Overnight processing (existing) All £3,408
Governance and Administration £2,798
Sum £ 15 ,6 9 6
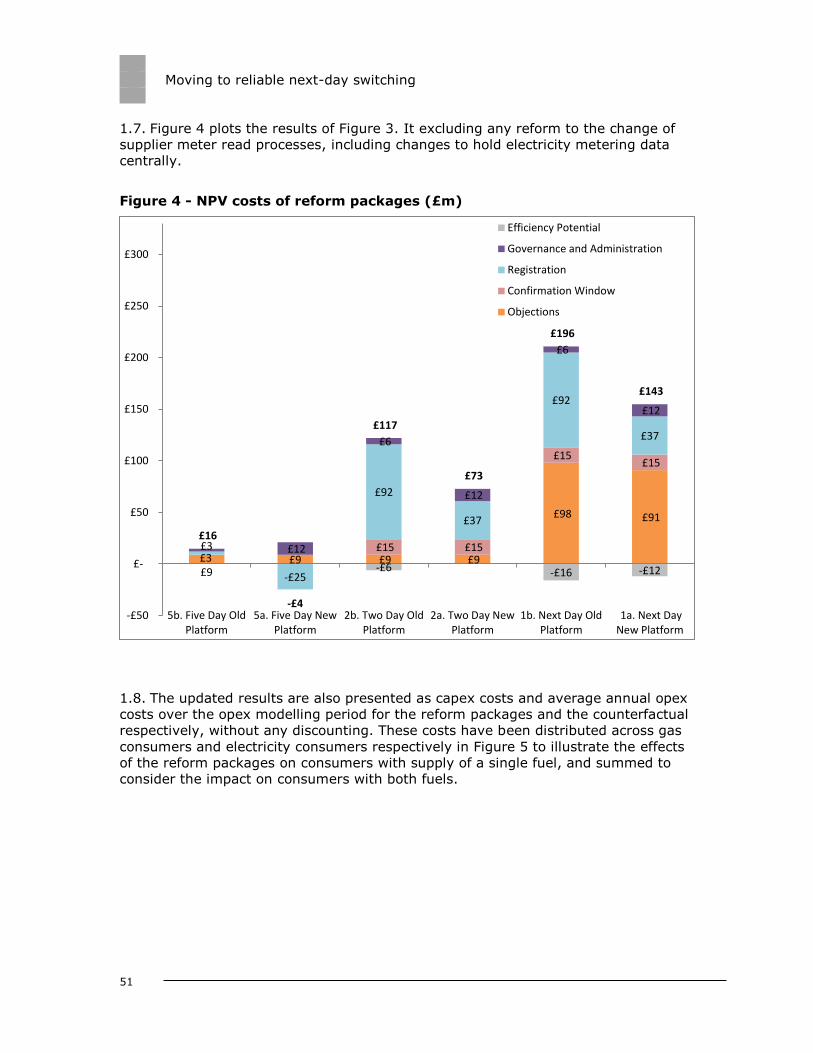
Moving to reliable next-day switching
51
1.7. Figure 4 plots the results of Figure 3. It excluding any reform to the change of
supplier meter read processes, including changes to hold electricity metering data
centrally.
Figure 4 - NPV costs of reform packages (£m)
1.8. The updated results are also presented as capex costs and average annual opex
costs over the opex modelling period for the reform packages and the counterfactual
respectively, without any discounting. These costs have been distributed across gas
consumers and electricity consumers respectively in Figure 5 to illustrate the effects
of the reform packages on consumers with supply of a single fuel, and summed to
consider the impact on consumers with both fuels.
£9 £9 £9 £9
£98 £91
£15 £15
£15 £15
£3
-£25
£92
£37
£92
£37
£3 £12
£6
£12
£6
£12
£16
-£4
£117
£73
£196
£143
-£6 -£16 -£12
-£50
£-
£50
£100
£150
£200
£250
£300
5b. Five Day OldPlatform
5a. Five Day NewPlatform
2b. Two Day OldPlatform
2a. Two Day NewPlatform
1b. Next Day OldPlatform
1a. Next DayNew Platform
Efficiency Potential
Governance and Administration
Registration
Confirmation Window
Objections
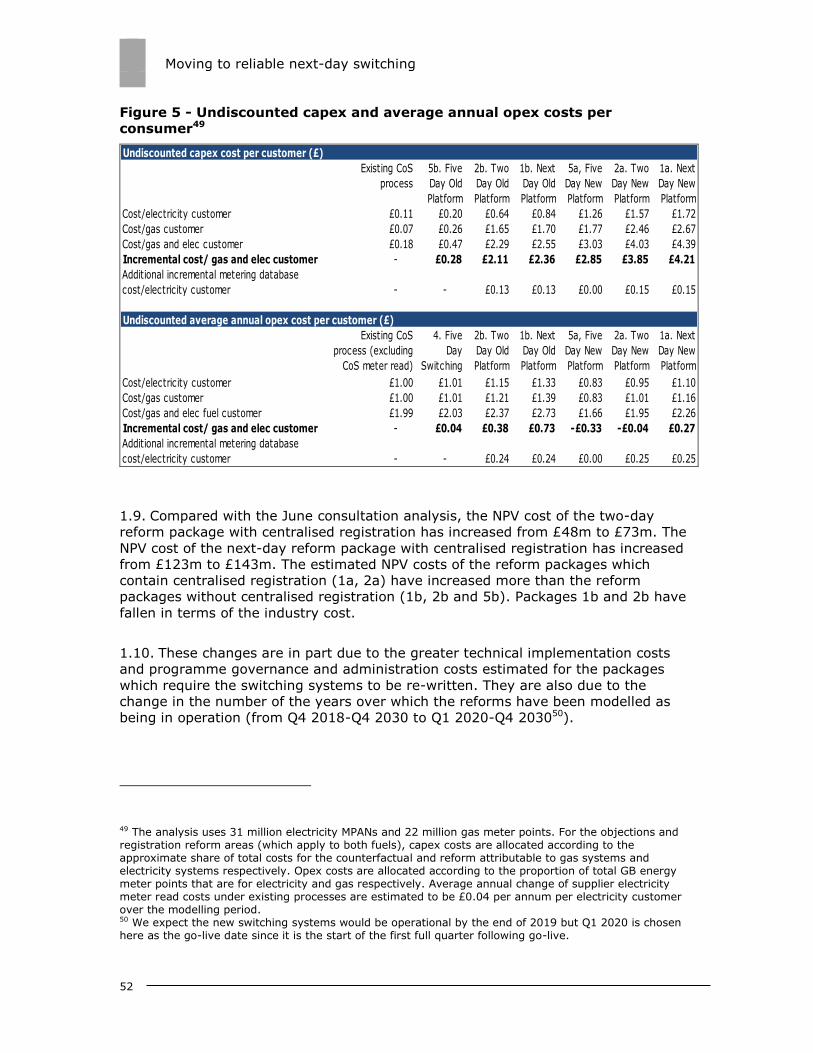
Moving to reliable next-day switching
52
Figure 5 - Undiscounted capex and average annual opex costs per
consumer49
Undiscounted capex cost per customer (£)
Existing CoS
process
5b. Five
Day Old
Platform
2b. Two
Day Old
Platform
1b. Next
Day Old
Platform
5a, Five
Day New
Platform
2a. Two
Day New
Platform
1a. Next
Day New
Platform
Cost/electricity customer £0.11 £0.20 £0.64 £0.84 £1.26 £1.57 £1.72
Cost/gas customer £0.07 £0.26 £1.65 £1.70 £1.77 £2.46 £2.67
Cost/gas and elec customer £0.18 £0.47 £2.29 £2.55 £3.03 £4.03 £4.39
Incremental cost/ gas and elec customer - £0.28 £2.11 £2.36 £2.85 £3.85 £4.21
Additional incremental metering database
cost/electricity customer - - £0.13 £0.13 £0.00 £0.15 £0.15
Undiscounted average annual opex cost per customer (£)
Existing CoS
process (excluding
CoS meter read)
4. Five
Day
Switching
2b. Two
Day Old
Platform
1b. Next
Day Old
Platform
5a, Five
Day New
Platform
2a. Two
Day New
Platform
1a. Next
Day New
Platform
Cost/electricity customer £1.00 £1.01 £1.15 £1.33 £0.83 £0.95 £1.10
Cost/gas customer £1.00 £1.01 £1.21 £1.39 £0.83 £1.01 £1.16
Cost/gas and elec fuel customer £1.99 £2.03 £2.37 £2.73 £1.66 £1.95 £2.26
Incremental cost/ gas and elec customer - £0.04 £0.38 £0.73 -£0.33 -£0.04 £0.27
Additional incremental metering database
cost/electricity customer - - £0.24 £0.24 £0.00 £0.25 £0.25
1.9. Compared with the June consultation analysis, the NPV cost of the two-day
reform package with centralised registration has increased from £48m to £73m. The
NPV cost of the next-day reform package with centralised registration has increased
from £123m to £143m. The estimated NPV costs of the reform packages which
contain centralised registration (1a, 2a) have increased more than the reform
packages without centralised registration (1b, 2b and 5b). Packages 1b and 2b have
fallen in terms of the industry cost.
1.10. These changes are in part due to the greater technical implementation costs
and programme governance and administration costs estimated for the packages
which require the switching systems to be re-written. They are also due to the
change in the number of the years over which the reforms have been modelled as
being in operation (from Q4 2018-Q4 2030 to Q1 2020-Q4 203050).
49 The analysis uses 31 million electricity MPANs and 22 million gas meter points. For the objections and registration reform areas (which apply to both fuels), capex costs are allocated according to the approximate share of total costs for the counterfactual and reform attributable to gas systems and electricity systems respectively. Opex costs are allocated according to the proportion of total GB energy meter points that are for electricity and gas respectively. Average annual change of supplier electricity meter read costs under existing processes are estimated to be £0.04 per annum per electricity customer over the modelling period. 50 We expect the new switching systems would be operational by the end of 2019 but Q1 2020 is chosen here as the go-live date since it is the start of the first full quarter following go-live.
Moving to reliable next-day switching
53
1.11. Reform packages 1b and 2b have the largest ongoing opex over and above the
counterfactual, therefore the NPV costs over the modelling period are reduced more
significantly for these packages by the change in planning assumptions and
timetable. The other reform packages have smaller ongoing opex or cost savings
compared to the counterfactual, and so the impact of the later go-live date for the
reforms on their estimated NPV costs is smaller.
1.12. There is also a small impact on the NPV costs of delaying the capex required to
implement the reforms further given the new planning assumptions and timetable.
This has a greater proportional impact on reducing the NPV costs (through a greater
discounting effect) of those reform packages with higher capex costs (reform
packages 1a and 2a).
1.13. The market data input changes have a small impact on the estimated NPV
costs of the reform packages. The impact of the growing position of independent
suppliers in the market is seen more clearly in the costs of those reform packages
which have the largest estimated changes in opex relative to the counterfactual
costs. This is due to the methodology for calculating opex for smaller companies
whereby costs estimated from the data-points we collected are scaled up by the
number of smaller companies in the market. This methodology aimed to reflect a
fixed element of the opex for smaller companies.
1.14. The reform package 5a is presented in the updated results as a distinct
package. It consists of a reduction in the objections window to two days and a CRS
which harmonises registration arrangements between gas and electricity. This CRS
would operate with overnight batch processing to allow for a five-day overall
switching process. This reform package has an incremental NPV cost saving when
considering only the direct costs and savings for the industry parties of implementing
and operating the new systems. We believe the direct benefits to consumers and
wider competition benefits of faster switching on a new CRS are likely to be greater
than this quantified cost saving on the industry processes.
1.15. As explained in Chapter 1, a five-day option is likely to rely on daily batch
processing and communication of data. Making switching shorter at a later point
would require near real time data processing and exchange. We therefore think that
a five-day solution would act as an impediment to further improvements to meet
consumers’ expectations and may be more costly in the long run as further changes
are made to meet future expectations. Therefore, we do not propose to further
develop the five-day switching option.
1.16. The results of our updated base case scenario show, as in the June document,
that for the impacts we quantified, the reform packages with the lowest NPV cost or
highest NPV benefit deliver the smallest overall improvement in switching speed
(five-days). The reform packages which deliver next-day or two-day switching
require instant or near real-time processing which is a key driver of capex and opex
costs for the industry. The opex costs reported by suppliers of moving to near real-
time processing reflect an increase in staff costs for information systems (IS) support
and manual intervention to manage exceptions as well as efficiency savings from
greater automation of processes. Package 5b has only one change to the existing
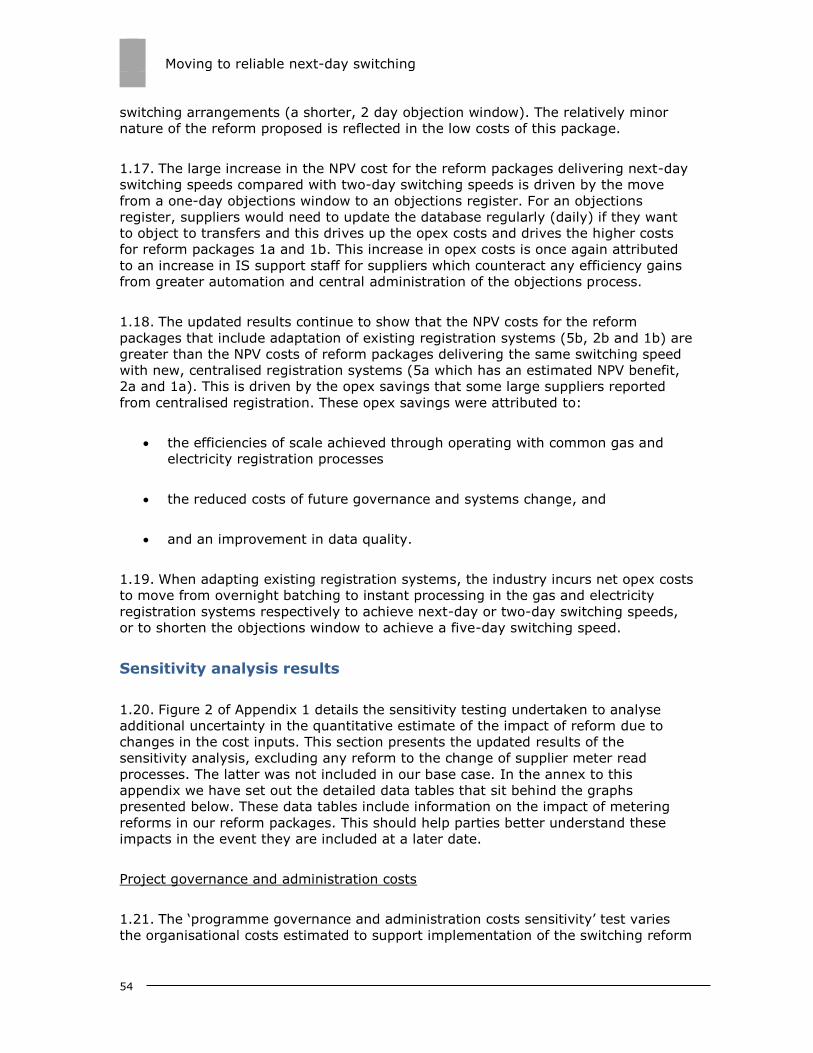
Moving to reliable next-day switching
54
switching arrangements (a shorter, 2 day objection window). The relatively minor
nature of the reform proposed is reflected in the low costs of this package.
1.17. The large increase in the NPV cost for the reform packages delivering next-day
switching speeds compared with two-day switching speeds is driven by the move
from a one-day objections window to an objections register. For an objections
register, suppliers would need to update the database regularly (daily) if they want
to object to transfers and this drives up the opex costs and drives the higher costs
for reform packages 1a and 1b. This increase in opex costs is once again attributed
to an increase in IS support staff for suppliers which counteract any efficiency gains
from greater automation and central administration of the objections process.
1.18. The updated results continue to show that the NPV costs for the reform
packages that include adaptation of existing registration systems (5b, 2b and 1b) are
greater than the NPV costs of reform packages delivering the same switching speed
with new, centralised registration systems (5a which has an estimated NPV benefit,
2a and 1a). This is driven by the opex savings that some large suppliers reported
from centralised registration. These opex savings were attributed to:
the efficiencies of scale achieved through operating with common gas and
electricity registration processes
the reduced costs of future governance and systems change, and
and an improvement in data quality.
1.19. When adapting existing registration systems, the industry incurs net opex costs
to move from overnight batching to instant processing in the gas and electricity
registration systems respectively to achieve next-day or two-day switching speeds,
or to shorten the objections window to achieve a five-day switching speed.
Sensitivity analysis results
1.20. Figure 2 of Appendix 1 details the sensitivity testing undertaken to analyse
additional uncertainty in the quantitative estimate of the impact of reform due to
changes in the cost inputs. This section presents the updated results of the
sensitivity analysis, excluding any reform to the change of supplier meter read
processes. The latter was not included in our base case. In the annex to this
appendix we have set out the detailed data tables that sit behind the graphs
presented below. These data tables include information on the impact of metering
reforms in our reform packages. This should help parties better understand these
impacts in the event they are included at a later date.
Project governance and administration costs
1.21. The ‘programme governance and administration costs sensitivity’ test varies
the organisational costs estimated to support implementation of the switching reform
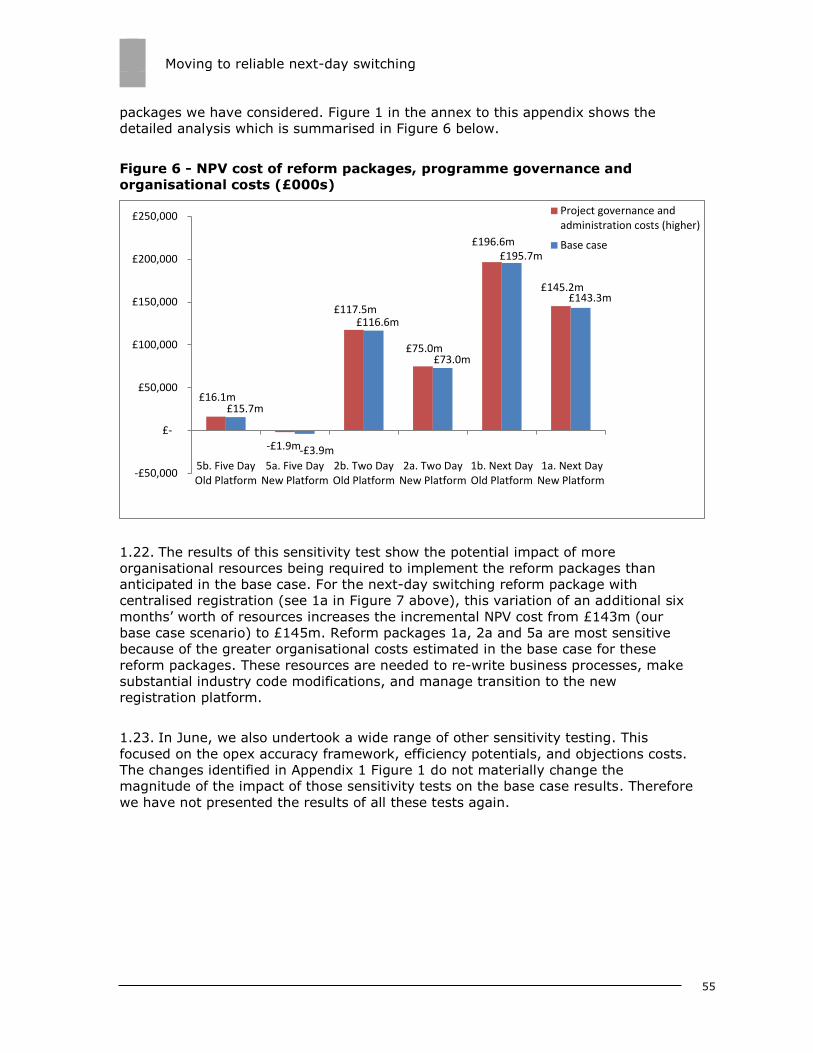
Moving to reliable next-day switching
55
packages we have considered. Figure 1 in the annex to this appendix shows the
detailed analysis which is summarised in Figure 6 below.
Figure 6 - NPV cost of reform packages, programme governance and
organisational costs (£000s)
1.22. The results of this sensitivity test show the potential impact of more
organisational resources being required to implement the reform packages than
anticipated in the base case. For the next-day switching reform package with
centralised registration (see 1a in Figure 7 above), this variation of an additional six
months’ worth of resources increases the incremental NPV cost from £143m (our
base case scenario) to £145m. Reform packages 1a, 2a and 5a are most sensitive
because of the greater organisational costs estimated in the base case for these
reform packages. These resources are needed to re-write business processes, make
substantial industry code modifications, and manage transition to the new
registration platform.
1.23. In June, we also undertook a wide range of other sensitivity testing. This
focused on the opex accuracy framework, efficiency potentials, and objections costs.
The changes identified in Appendix 1 Figure 1 do not materially change the
magnitude of the impact of those sensitivity tests on the base case results. Therefore
we have not presented the results of all these tests again.
£16.1m
-£1.9m
£117.5m
£75.0m
£196.6m
£145.2m
£15.7m
-£3.9m
£116.6m
£73.0m
£195.7m
£143.3m
-£50,000
£-
£50,000
£100,000
£150,000
£200,000
£250,000
5b. Five DayOld Platform
5a. Five DayNew Platform
2b. Two DayOld Platform
2a. Two DayNew Platform
1b. Next DayOld Platform
1a. Next DayNew Platform
Project governance andadministration costs (higher)
Base case
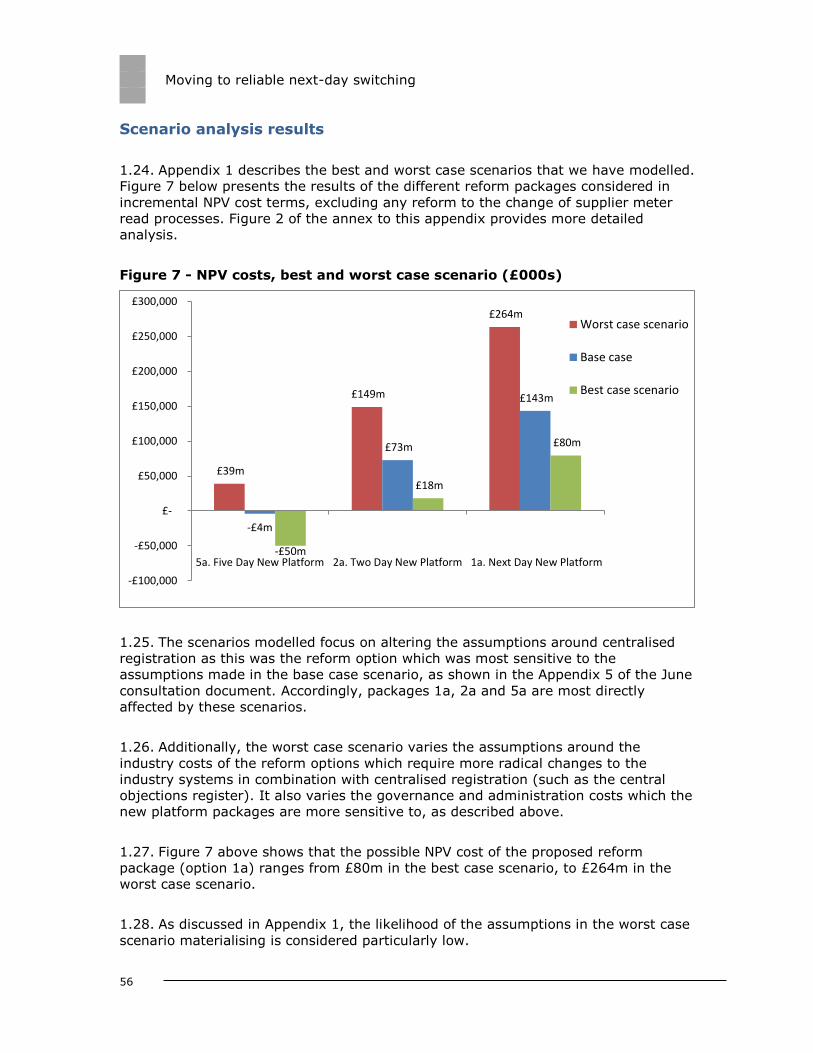
Moving to reliable next-day switching
56
Scenario analysis results
1.24. Appendix 1 describes the best and worst case scenarios that we have modelled.
Figure 7 below presents the results of the different reform packages considered in
incremental NPV cost terms, excluding any reform to the change of supplier meter
read processes. Figure 2 of the annex to this appendix provides more detailed
analysis.
Figure 7 - NPV costs, best and worst case scenario (£000s)
1.25. The scenarios modelled focus on altering the assumptions around centralised
registration as this was the reform option which was most sensitive to the
assumptions made in the base case scenario, as shown in the Appendix 5 of the June
consultation document. Accordingly, packages 1a, 2a and 5a are most directly
affected by these scenarios.
1.26. Additionally, the worst case scenario varies the assumptions around the
industry costs of the reform options which require more radical changes to the
industry systems in combination with centralised registration (such as the central
objections register). It also varies the governance and administration costs which the
new platform packages are more sensitive to, as described above.
1.27. Figure 7 above shows that the possible NPV cost of the proposed reform
package (option 1a) ranges from £80m in the best case scenario, to £264m in the
worst case scenario.
1.28. As discussed in Appendix 1, the likelihood of the assumptions in the worst case
scenario materialising is considered particularly low.
£39m
£149m
£264m
-£4m
£73m
£143m
-£50m
£18m
£80m
-£100,000
-£50,000
£-
£50,000
£100,000
£150,000
£200,000
£250,000
£300,000
5a. Five Day New Platform 2a. Two Day New Platform 1a. Next Day New Platform
Worst case scenario
Base case
Best case scenario

Moving to reliable next-day switching
57
Consumer savings from switching results
1.29. As outlined in Figure 3 in Appendix 1, the illustrative examples of potential
savings available to consumers from switching make assumptions on the monetary
outcomes from switching. They assume that additional consumers who switch remain
on either (A1) standard variable tariffs or (A2) fixed rate tariffs, and that they move
from either (B1) the average annual tariff available in the market, or (B2) the
average annual tariff offered by the six largest suppliers.
1.30. The inputs that are chosen from the variations (A1-B2) above affect the level of
consumer savings from additional dual fuel switching each year that would equate to
the total industry costs of the different reform packages. Figure 8 presents the
results of our analysis when the different inputs (A1-B2) are applied for each of the
reform packages.
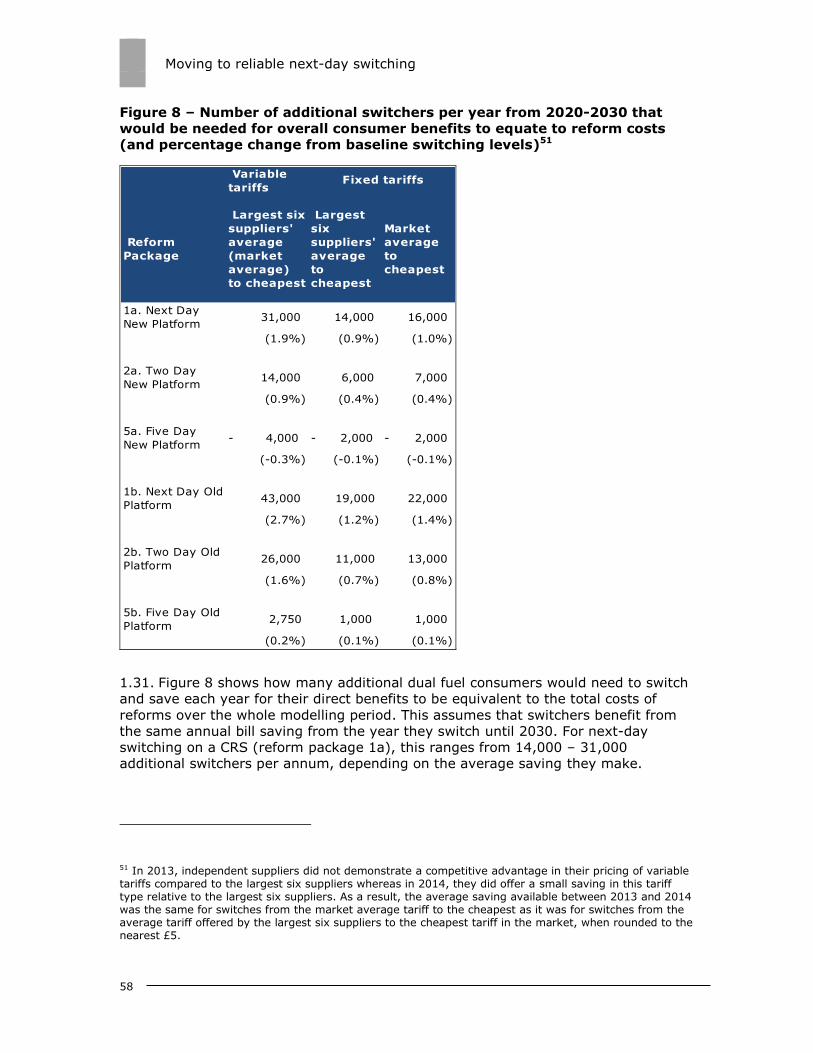
Moving to reliable next-day switching
58
Figure 8 – Number of additional switchers per year from 2020-2030 that
would be needed for overall consumer benefits to equate to reform costs
(and percentage change from baseline switching levels)51
Variable
tariffs
Reform
Package
Largest six
suppliers'
average
(market
average)
to cheapest
Largest
six
suppliers'
average
to
cheapest
Market
average
to
cheapest
1a. Next Day
New Platform 31,000 14,000 16,000
(1.9%) (0.9%) (1.0%)
2a. Two Day
New Platform 14,000 6,000 7,000
(0.9%) (0.4%) (0.4%)
5a. Five Day
New Platform- 4,000 - 2,000 2,000-
(-0.3%) (-0.1%) (-0.1%)
1b. Next Day Old
Platform 43,000 19,000 22,000
(2.7%) (1.2%) (1.4%)
2b. Two Day Old
Platform 26,000 11,000 13,000
(1.6%) (0.7%) (0.8%)
5b. Five Day Old
Platform 2,750 1,000 1,000
(0.2%) (0.1%) (0.1%)
Fixed tariffs
1.31. Figure 8 shows how many additional dual fuel consumers would need to switch
and save each year for their direct benefits to be equivalent to the total costs of
reforms over the whole modelling period. This assumes that switchers benefit from
the same annual bill saving from the year they switch until 2030. For next-day
switching on a CRS (reform package 1a), this ranges from 14,000 – 31,000
additional switchers per annum, depending on the average saving they make.
51 In 2013, independent suppliers did not demonstrate a competitive advantage in their pricing of variable tariffs compared to the largest six suppliers whereas in 2014, they did offer a small saving in this tariff type relative to the largest six suppliers. As a result, the average saving available between 2013 and 2014 was the same for switches from the market average tariff to the cheapest as it was for switches from the average tariff offered by the largest six suppliers to the cheapest tariff in the market, when rounded to the nearest £5.
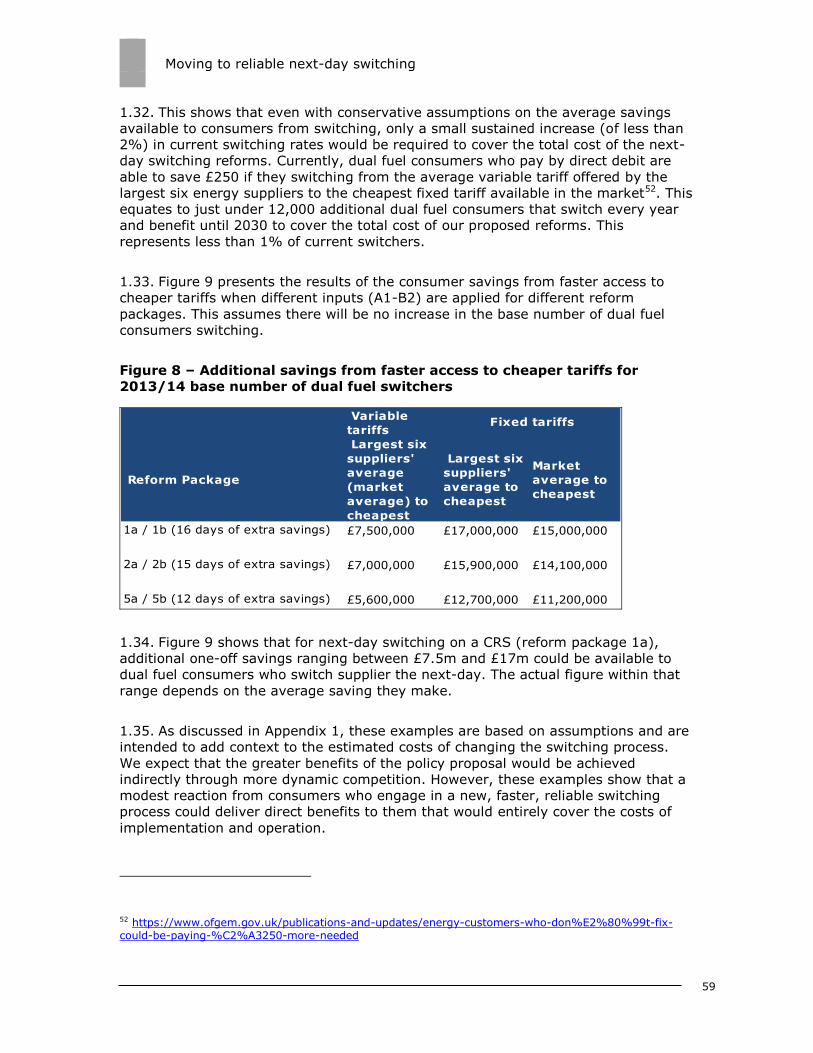
Moving to reliable next-day switching
59
1.32. This shows that even with conservative assumptions on the average savings
available to consumers from switching, only a small sustained increase (of less than
2%) in current switching rates would be required to cover the total cost of the next-
day switching reforms. Currently, dual fuel consumers who pay by direct debit are
able to save £250 if they switching from the average variable tariff offered by the
largest six energy suppliers to the cheapest fixed tariff available in the market52. This
equates to just under 12,000 additional dual fuel consumers that switch every year
and benefit until 2030 to cover the total cost of our proposed reforms. This
represents less than 1% of current switchers.
1.33. Figure 9 presents the results of the consumer savings from faster access to
cheaper tariffs when different inputs (A1-B2) are applied for different reform
packages. This assumes there will be no increase in the base number of dual fuel
consumers switching.
Figure 8 – Additional savings from faster access to cheaper tariffs for
2013/14 base number of dual fuel switchers
Variable
tariffs
Reform Package
Largest six
suppliers'
average
(market
average) to
cheapest
Largest six
suppliers'
average to
cheapest
Market
average to
cheapest
1a / 1b (16 days of extra savings) £7,500,000 £17,000,000 £15,000,000
2a / 2b (15 days of extra savings) £7,000,000 £15,900,000 £14,100,000
5a / 5b (12 days of extra savings) £5,600,000 £12,700,000 £11,200,000
Fixed tariffs
1.34. Figure 9 shows that for next-day switching on a CRS (reform package 1a),
additional one-off savings ranging between £7.5m and £17m could be available to
dual fuel consumers who switch supplier the next-day. The actual figure within that
range depends on the average saving they make.
1.35. As discussed in Appendix 1, these examples are based on assumptions and are
intended to add context to the estimated costs of changing the switching process.
We expect that the greater benefits of the policy proposal would be achieved
indirectly through more dynamic competition. However, these examples show that a
modest reaction from consumers who engage in a new, faster, reliable switching
process could deliver direct benefits to them that would entirely cover the costs of
implementation and operation.
52 https://www.ofgem.gov.uk/publications-and-updates/energy-customers-who-don%E2%80%99t-fix-could-be-paying-%C2%A3250-more-needed
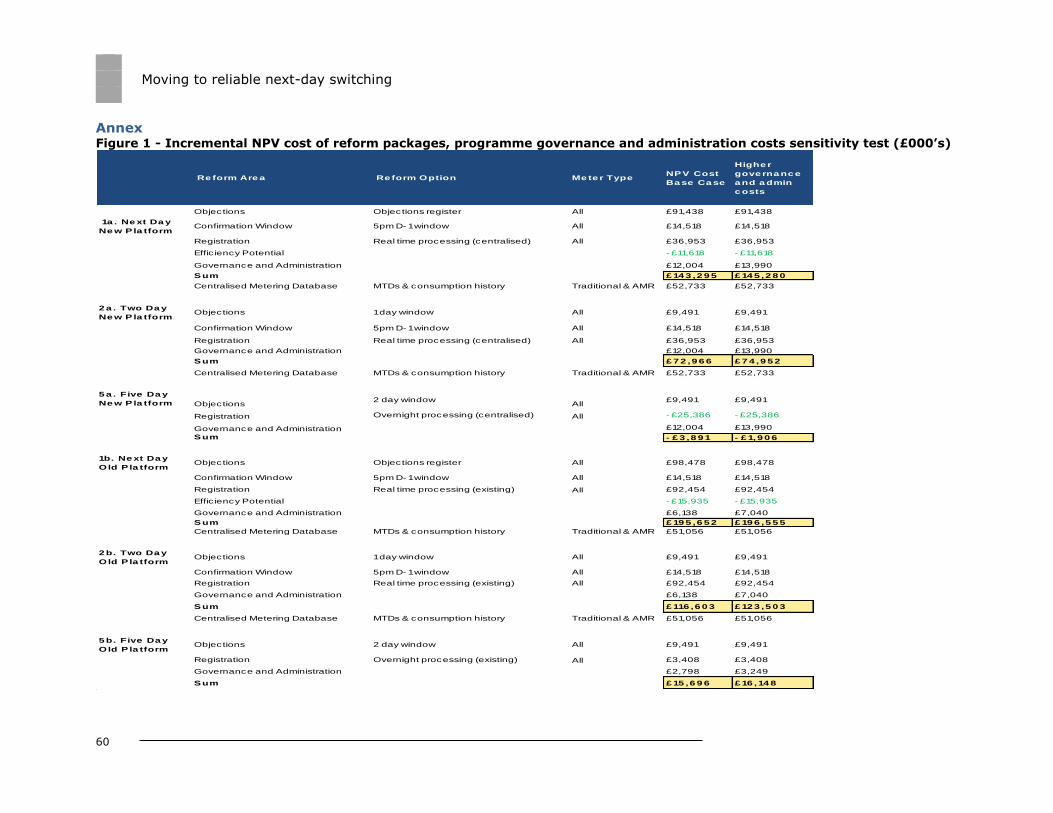
Moving to reliable next-day switching
60
Annex Figure 1 - Incremental NPV cost of reform packages, programme governance and administration costs sensitivity test (£000’s)
Re form Are a Re form Option Me te r TypeNPV Cost
Ba se Ca se
Highe r
gove rna nc e
a nd a dmin
c osts
Objections Objections register All £91,438 £91,438
1a . Ne xt Da y
Ne w P la tformConfirmation Window 5pm D- 1 window All £14,518 £14,518
Registration Real time processing (centralised) All £36,953 £36,953
Effic iency Potential - £11,618 - £11,618
Governance and Administration £12,004 £13,990
Sum £ 14 3 ,2 9 5 £ 14 5 ,2 8 0
Centralised Metering Database MTDs & consumption history Traditional & AMR £52,733 £52,733
2 a . Two Da y
Ne w P la tformObjections 1 day window All £9,491 £9,491
Confirmation Window 5pm D- 1 window All £14,518 £14,518
Registration Real time processing (centralised) All £36,953 £36,953
Governance and Administration £12,004 £13,990
Sum £ 7 2 ,9 6 6 £ 7 4 ,9 5 2
Centralised Metering Database MTDs & consumption history Traditional & AMR £52,733 £52,733
5 a . Five Da y
Ne w P la tform Objections2 day window
All£9,491 £9,491
Registration Overnight processing (centralised) All - £25,386 - £25,386
Governance and Administration £12,004 £13,990
Sum - £ 3 ,8 9 1 - £ 1,9 0 6
1b. Ne xt Da y
Old P la tformObjections Objections register All £98,478 £98,478
Confirmation Window 5pm D- 1 window All £14,518 £14,518
Registration Real time processing (existing) All £92,454 £92,454
Effic iency Potential - £15,935 - £15,935
Governance and Administration £6,138 £7,040
Sum £ 19 5 ,6 5 2 £ 19 6 ,5 5 5
Centralised Metering Database MTDs & consumption history Traditional & AMR £51,056 £51,056
2 b. Two Da y
Old P la tformObjections 1 day window All £9,491 £9,491
Confirmation Window 5pm D- 1 window All £14,518 £14,518
Registration Real time processing (existing) All £92,454 £92,454
Governance and Administration £6,138 £7,040
Sum £ 116 ,6 0 3 £ 12 3 ,5 0 3
Centralised Metering Database MTDs & consumption history Traditional & AMR £51,056 £51,056
5 b. Five Da y
Old P la tformObjections 2 day window All £9,491 £9,491
Registration Overnight processing (existing) All £3,408 £3,408
Governance and Administration £2,798 £3,249
Sum £ 15 ,6 9 6 £ 16 ,14 8
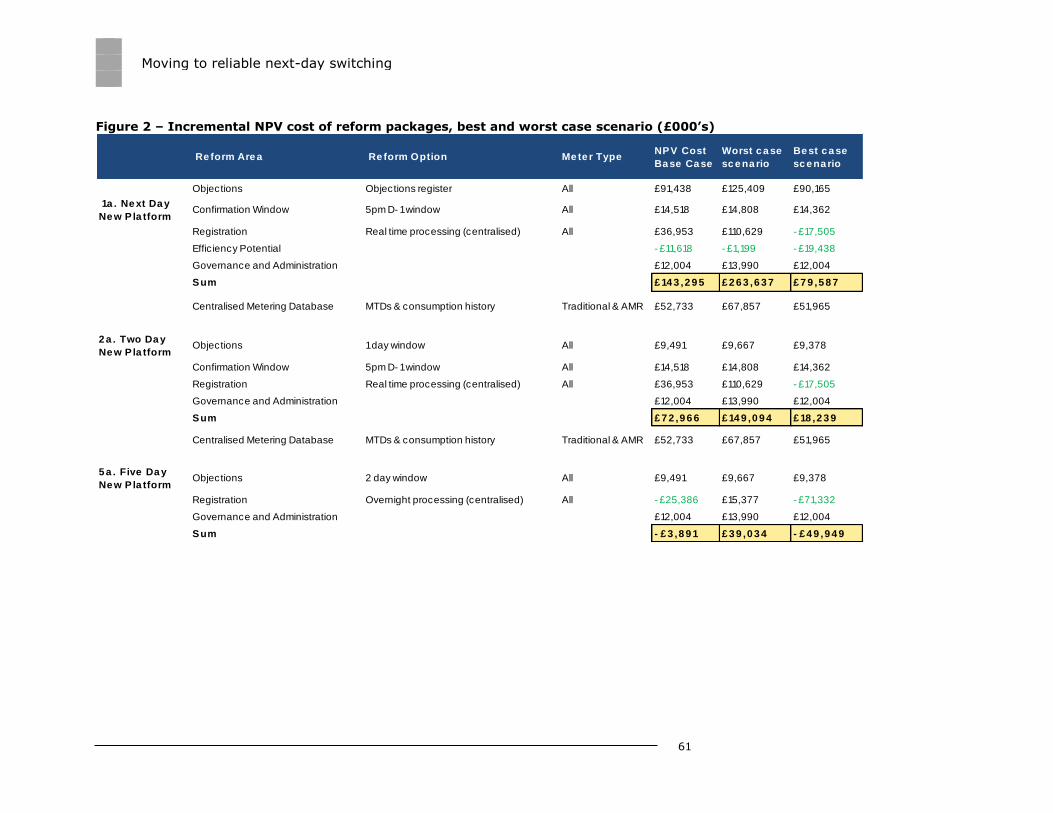
Moving to reliable next-day switching
61
Figure 2 – Incremental NPV cost of reform packages, best and worst case scenario (£000’s)
Re form Are a Re form Option Me te r TypeNPV Cost
Ba se Ca se
Worst c a se
sc e na rio
Be st c a se
sc e na rio
Objections Objections register All £91,438 £125,409 £90,165
1a . Ne xt Da y
Ne w P la tformConfirmation Window 5pm D- 1 window All £14,518 £14,808 £14,362
Registration Real time processing (centralised) All £36,953 £110,629 - £17,505
Effic iency Potential - £11,618 - £1,199 - £19,438
Governance and Administration £12,004 £13,990 £12,004
Sum £ 14 3 ,2 9 5 £ 2 6 3 ,6 3 7 £ 7 9 ,5 8 7
Centralised Metering Database MTDs & consumption history Traditional & AMR £52,733 £67,857 £51,965
2 a . Two Da y
Ne w P la tformObjections 1 day window All £9,491 £9,667 £9,378
Confirmation Window 5pm D- 1 window All £14,518 £14,808 £14,362
Registration Real time processing (centralised) All £36,953 £110,629 - £17,505
Governance and Administration £12,004 £13,990 £12,004
Sum £ 7 2 ,9 6 6 £ 14 9 ,0 9 4 £ 18 ,2 3 9
Centralised Metering Database MTDs & consumption history Traditional & AMR £52,733 £67,857 £51,965
5 a . Five Da y
Ne w P la tformObjections 2 day window All £9,491 £9,667 £9,378
Registration Overnight processing (centralised) All - £25,386 £15,377 - £71,332
Governance and Administration £12,004 £13,990 £12,004
Sum - £ 3 ,8 9 1 £ 3 9 ,0 3 4 - £ 4 9 ,9 4 9
Moving to reliable next-day switching
62
Appendix 3: Glossary
A
Automated meter reading (AMR)
A type of smart meter that allows one way communication to remotely collect
consumption data.
C
Central electricity metering database
A reform proposal to hold Meter Technical Details (MTD) and historic meter read data
centrally for electricity AMR and traditional meters in order to avoid the need to
transfer these details between agents at change of supplier.
Change of Supplier Expert Group (COSEG)
Expert group formed by Ofgem with representatives from suppliers, networks,
industry code experts, consumer representatives and government to help develop
key aspects of the change of supplier process.
Consumer Empowerment and Protection Project
This project seeks to ensure that regulation enables consumers to engage effectively
in smarter markets.
Cooling-off period
Domestic consumers will typically have a 14-day cooling off period when they enter
into a contract with a new energy supplier. During this time a domestic consumer
can cancel the service contract it has entered into with the energy supplier.
D
Data Aggregator
As part of the electricity settlement process, the party appointed by a supplier to
package up consumption data to meet the requirements set out in the Balancing and
Settlement Code.
Moving to reliable next-day switching
63
Data and Communications Company (DCC)
The Data and Communications Company (DCC) is a central communications body
appointed to provide the communications and data transfer and management
required to support smart metering. It is responsible for linking smart meters in
homes and small businesses with the systems of energy suppliers, network operators
and other companies. The DCC will deliver data and communications services for
smart meters through its external providers.
Distribution Network Operator (DNOs)
Distribution Network Operators (DNOs) own and operate the distribution network of
towers and cables that bring electricity from our national transmission network to
homes and businesses.
Dual fuel
A type of energy contract where a consumer takes gas and electricity from the same
supplier.
E
Electricity and gas supplier
A company licensed by Ofgem to sell energy to and bill consumers in Great Britain.
Erroneous transfer
An erroneous transfer occurs when a consumer has their supplier switched without
having given consent to that transfer.
I
Industry codes
Industry codes and agreements underpin the gas and electricity markets and set out
detailed rules for the gas and electricity markets that govern market operation and
the terms of connection and access to the energy networks. The codes are contracts
between signatories and provide a level playing field for services provided by
central/monopoly providers, and contain interoperability requirements between
competitors.
Moving to reliable next-day switching
64
M
Meter Operator (MOP)
Meter operators are responsible for installing and maintaining electricity meters.
N
Net present value
The HM Treasury Green Book defines a net present value as the discounted value of
a stream of either future costs or benefits. The term Net Present Value (NPV) is used
to describe the difference between the present value of a stream of costs and a
stream of benefits.
O
Objections
The objections process permits an energy supplier to prevent a consumer from
switching to another supplier in accordance with circumstances defined in the
standard conditions of the supply licence.
Ofgem
Ofgem is the Office of Gas and Electricity Markets, which supports the Gas and
Electricity Markets Authority (GEMA), the body established by section 1 of the
Utilities Act 2000 to regulate the gas and electricity markets in Great Britain. It does
this by promoting competition, wherever appropriate, and regulating the monopoly
companies that run the gas and electricity networks.
P
Prepayment meter (PPM)
A prepayment meter is a type of meter that allows consumers to pay as they go for
their energy.
Project Nexus
Project Nexus is an industry project that aims to introduce new gas settlements and
IGT registration arrangements.
R
Registration
Moving to reliable next-day switching
65
Each network company is required by its licence to maintain a register of supply
points connected to its network. This register includes an address and unique
reference number for each supply point as well as the identity of the supplier
responsible for it.
Retail Market Review
The Retail Market Review was an Ofgem project with the aims of making the retail
energy market work better at serving the interests of consumers and enabling
individual consumers to get a better deal from energy suppliers.
S
Significant code review
The significant code review (SCR) mechanism is designed to facilitate complex and
significant changes to the codes that energy companies are required to abide by. It
enables Ofgem to undertake a review of a code-based issue and play a leading role
in facilitating code changes through a review process.
Smart Energy Code (SEC)
The Smart Energy Code (SEC) came into force on 23 September 2013, when the
Data Communication Company’s (DCC) licence was granted. The SEC is a multiparty
contract which sets out the terms for the provision of the DCC’s services and
specifies other provisions to govern the end-to-end management of smart metering
in gas and electricity.
The DCC, suppliers and network operators are required by licence to become a party
to the SEC and comply with its provisions. Other bodies who wish to use the DCC’s
services, such as energy efficiency and energy service companies, must accede to
the SEC to do so.
Smart meter
A meter which, in addition to traditional metering functionality (measuring and
registering the amount of energy that passes through it), is capable of providing
additional functionality, for example two way communication allowing it to transmit
meter reads and receive data remotely. It must also comply with the technical
specification set out by the government.
Smarter Markets Programme The Smarter Markets Programme is Ofgem’s way of coordinating our work to use the
opportunity that smart metering presents to make retail energy markets work better
for consumers.
Moving to reliable next-day switching
66
Switching programme
This programme concerns the process used by industry to transfer a consumer from
one supplier to another. Smart metering presents an opportunity to improve this
process. Ofgem’s ambition is for a fast, reliable and cost-effective process that
facilitates competition and builds consumer confidence.
Switching process
The process by which a consumer transfers from one supplier to another.
Supply point register
A system that maintains the lists of supply points on a network and holds the postal
address, identity of the supplier and information on the characteristics of the supply
and installed metering system for each supply point. Each supply point will have a
unique identifier (the Meter Point Administration Number in electricity or Meter Point
Registration Number in gas).
T
Third Party Intermediaries
Third Party Intermediaries (TPIs) include switching websites, energy brokers and
energy efficiency advice providers who interact with energy consumers. TPIs can
offer advice and products to assist with a range of functions including energy
procurement, efficiency and management.
U
Unmetered supply
Electronic equipment that draws a current and is connected to the distribution
network without a meter recording its energy consumption.
X
Xoserve
Xoserve is the Gas Distribution Networks’ Agent and provides centralised information
and data services for gas transporters and shippers in Great Britain.