Embed Size (px)
Citation preview
Introduction toofiNovember 2021
Rishi KalraCFO
• Joined Olam
Group in 2000
• CFO of ofi since
January 2020
Today’s presenters
2
A. ShekharCEO
• Joined Olam
Group in 1992
• CEO of ofi since
January 2020
Cautionary note (1/2)
3
BY ELECTING TO VIEW THIS PRESENTATION, YOU REPRESENT, WARRANT AND AGREE THAT YOU WILL NOTVIDEOTAPE, RECORD OR OTHERWISE ATTEMPT TO REPRODUCE OR RE-TRANSMIT THE CONTENTS OF THISPRESENTATION OR ITS TRANSMISSION. ATTENDING OR ACCESSING THIS PRESENTATION FROM CERTAINJURISDICTIONS MAY BE RESTRICTED BY LAW, AND PERSONS INTENDING TO ATTEND OR VIEW THIS PRESENTATIONSHOULD INFORM THEMSELVES ABOUT, AND OBSERVE, ANY SUCH RESTRICTIONS. BY ATTENDING OR VIEWINGTHIS PRESENTATION, YOU REPRESENT THAT YOU ARE A PERSON WHO IS PERMITTED UNDER APPLICABLE LAWSAND REGULATIONS TO RECEIVE INFORMATION OF THE KIND CONTAINED IN THIS PRESENTATION.
This presentation has been prepared by Olam International Limited (the "Company") in respect of its newoperating group, Olam Food Ingredients or ofi (“ofi”). ofi was created after the re-organisation of theCompany’s global food and agri-business into two distinct reporting segments. For the purposes of thisnotice, "presentation" means this document, any oral presentation, any question and answer session andany written or oral material discussed or distributed relating to its contents, and “Group” means theCompany and its subsidiaries. The presentation has not been independently verified and no representationor warranty, express or implied, is made or given by or on behalf of the Banks (as defined below) Companyor any member of the Group, or any of such person's respective directors, officers, employees, agents,affiliates or advisers, as to, and no reliance should be placed on, the accuracy, completeness or fairness ofthe information or opinions contained in this presentation and no responsibility or liability is assumed by anysuch persons for any such information or opinions or for any errors or omissions. All information presented orcontained in this presentation is subject to verification, correction, completion and change without notice.The presentation serves information purposes only and does not constitute a prospectus or any offer for saleor subscription of, or solicitation or invitation to buy or subscribe for, any securities of ofi (the "Securities") forthe purposes of Regulation (EU) 2017/1129 (the “Prospectus Regulation”) (a "Prospectus").
You are reminded that any acquisition of Securities may be made solely on the basis of informationcontained in a Prospectus, together with any supplement that may be issued in connection with an offering,which may be different from the information contained in the presentation. You understand that thepresentation is solely for viewing by you, and by electing to view the presentation you represent, warrantand agree that you will not download, print, videotape, record, or otherwise attempt to reproduce orredistribute the presentation in whole or in part by mail, facsimile, electronic or computer transmission or byany other means to any other person, or use it in any manner to sell securities to the general public. You areresponsible for protecting yourself against viruses and other destructive items. You are accessing thepresentation at your own risk and it is your responsibility to take precautions to ensure that they are free fromviruses or other items of a destructive nature.
None of the Company, ofi or Citigroup Global Markets Limited, HSBC Bank plc, JPMorgan Chase & Co.,Morgan Stanley & Co. LLC (together, the “Banks”), any of their subsidiary undertakings or affiliates, or theirdirectors, officers, employees, advisers or agents, makes any representations or warranties, express or
implied, as to the accuracy, completeness, correctness or fairness of the presentation, and no responsibilityor liability is accepted for their accuracy or sufficiency. Furthermore, neither the Company, ofi nor the Banks,any of their affiliates, directors, employees, advisers or representatives shall have any responsibility or liabilityfor any loss arising from any use of the presentation or its contents or otherwise in connection with thepresentation. Prospective investors must conduct their own due diligence and none of the presentationtakes into account any personal objectives, financial situation or needs of a prospective investor and noneof the presentation contains or constitutes financial product, legal or tax advice. The Banks and any of theirsubsidiary undertakings or affiliates, directors, officers, employees, advisers or agents are acting for theCompany and ofi and no one else and will not be responsible to anyone other than the Company and ofifor providing the protections afforded to their respective clients or for providing advice.
The information contained in the presentation is subject to change without prior notice. The presentationshall not create any implication that there has been no change in the information contained in thepresentation since the date hereof or that there has been no change in the business or financial position ofthe Company or ofi since the date hereof. The Company, ofi nor the Banks undertake to provide anyadditional information, update or keep current information contained in the presentation, or to remedy anyomissions in or from the presentation and any opinions expressed in the presentation is subject to changewithout prior notice.
To the extent available, the industry and market data contained in this presentation has come from officialor third party sources. Third party industry publications, studies and surveys generally state that the datacontained therein have been obtained from sources believed to be reliable, but that there is no guaranteeof the accuracy or completeness of such data. While the Group believes that each of these publications,studies and surveys has been prepared by a reputable source, the Group has not independently verified thedata contained therein. In addition, certain of the industry and market data contained in this presentationcome from the Group's own internal research and estimates based on the knowledge and experience ofthe Group's management in the market in which the Group operates. While the Group believes that suchresearch and estimates are reasonable and reliable, they, and their underlying methodology andassumptions, have not been verified by any independent source for accuracy or completeness and aresubject to change without notice. Accordingly, undue reliance should not be placed on any of the industryor market data contained in this presentation.
This presentation includes forward-looking statements. The words "expect", "anticipate", "intends", "plan","estimate", "aim", "forecast", "project" and similar expressions (or their negative) identify certain of theseforward- looking statements. These forward-looking statements are statements regarding the Company'sand ofi’s intentions, beliefs or current expectations concerning, among other things, the Company's and/orofi’s results of operations, financial condition, liquidity, prospects, growth, strategies and the industry in whichthe Group operates. The forward-looking
Cautionary note (2/2)
4
statements in this presentation are based on numerous assumptions regarding the Group’s present andfuture business strategies and the environment in which ofi will operate in the future. Forward-lookingstatements involve inherent known and unknown risks, uncertainties and contingencies because they relateto events and depend on circumstances that may or may not occur in the future and may cause the actualresults, performance or achievements of the Company or ofi to be materially different from those expressedor implied by such forward looking statements. Many of these risks and uncertainties relate to factors thatare beyond the Group's ability to control or estimate precisely, such as future market conditions, currencyfluctuations, the behaviour of other market participants, the actions of regulators and other factors such asthe Group’s ability to continue to obtain financing to meet its liquidity needs, changes in the political, socialand regulatory framework in which the Company or ofi operates or in economic or technological trends orconditions. Past performance should not be taken as an indication or guarantee of future results, and norepresentation or warranty, express or implied, is made regarding future performance. The Company and ofiexpressly disclaim any obligation or undertaking to release any updates or revisions to these forward-lookingstatements to reflect any change in the Company's or ofi’s expectations with regard thereto or any change
in events, conditions or circumstances on which any statement is based after the date of this presentation orto update or to keep current any other information contained in this presentation. Accordingly, unduereliance should not be placed on the forward- looking statements, which speak only as of the date of thispresentation.
On 26 February 2021 the Company announced that it was preparing ofi for listing (“Proposed Listing”). Thispresentation does not constitute or form part of, and should not be construed as, any offer, invitation orrecommendation to purchase, sell or subscribe for any securities in any jurisdiction and neither the issue ofthe information nor anything contained herein shall form the basis of or be relied upon in connection with, oract as an inducement to enter into, any investment activity including in connection with the ProposedListing. Notwithstanding the preceding sentence, this presentation should not be released into, or accessedby, any person (either on their own account or on their behalf) in any jurisdiction where it would be unlawfulto do so. This presentation does not purport to contain all of the information that may be required toevaluate any investment in ofi or the Proposed Listing and should not be relied upon to form the basis of, orbe relied on in connection with, any contract or commitment or investment decision whatsoever. Thispresentation is intended to present background information on ofi, its business and the industry in which itoperates and is not intended to provide complete disclosure upon which an investment decision could bemade if and when the Proposed Listing is implemented. Any investment decision at the time of anyProposed Listing should be made solely on the basis of an approved prospectus (together with anysupplementary prospectus, if relevant) published as part of the Proposed Listing and not on the basis of thecontents of this presentation. Any person considering such an investment in the Proposed Listing, should itoccur, should obtain their own independent professional advice.
Nothing in this transmission constitutes an offer of securities for sale in the EEA, the United Kingdom,Switzerland, Japan, the United States or elsewhere. The securities of ofi will not be registered under the U.S.
Securities Act of 1933, as amended (the "Securities Act") and may not be offered, sold or otherwisetransferred within the United States (as such term is defined in Regulation S under the Securities Act) unlessregistered under the Securities Act or pursuant to an exemption from such registration. There is no intentionto register securities of ofi under the Securities Act. The presentation is not for publication or distribution inthe United States or to persons in the United States (within the meaning of Regulation S under the SecuritiesAct, other than to qualified institutional buyers (as defined below), Canada, Japan, Australia or any otherjurisdiction where such distribution or offer is unlawful. The presentation is directed only at (i) persons in theUnited States who are qualified institutional buyers as defined in and in reliance on Rule 144A under theSecurities Act, and (ii) persons outside the United States in reliance on Regulation S under the Securities Act,in each case in accordance with any applicable securities laws of any state or jurisdictions of the UnitedStates.
The presentation does not constitute an offer document or an offer of transferable securities to the public inthe United Kingdom to which Section 85 of the Financial Services and Markets Act 2000 of the UnitedKingdom, as amended(the "Financial Services and Markets Act"), applies, and should not be considered asa recommendation that any person should subscribe for or purchase any of the Securities. The Securities willnot be offered or sold to any person in the United Kingdom except in circumstances which have not resultedand will not result in an offer to the public in the United Kingdom in contravention of Section 85(1) of theFinancial Services and Markets Act.
By accessing and attending the presentation, you also agree and represent that:
(a) If you are accessing or attending the presentation from the United States (as defined in Regulation Sunder the Securities Act), you are a Qualified Institutional Buyer (as defined in Rule144A thereunder);
(b) If you are accessing or attending the presentation from the United Kingdom, you are both: (i) a“qualified investor” (as defined in Article 2(e) of Regulation (EU) 2017/1129 as it forms part of retained EU lawby virtue of the European Union (Withdrawal) Act 2018; and (ii) an investment professional (as defined inArticle 19(5) of the Financial Services and Markets Act 2000 (Financial Promotion) Order 2005 (the "Order")) ora person to whom Article 49(2)(a)-(d) of the Order applies;
(c) If you are accessing or attending the presentation from anywhere within the European Economic Area,you are a "qualified investor" (as defined in Article 2(e) of the Prospectus Regulation; and
(d) You are a person who is permitted under applicable law and regulation to receive information of thekind contained in the presentation.
You acknowledge that all industrial and intellectual property rights to this presentation are and shall remainvested in ofi. By attending or accessing this presentation, you shall not acquire any right, title, license to use,or interest in the presentation.
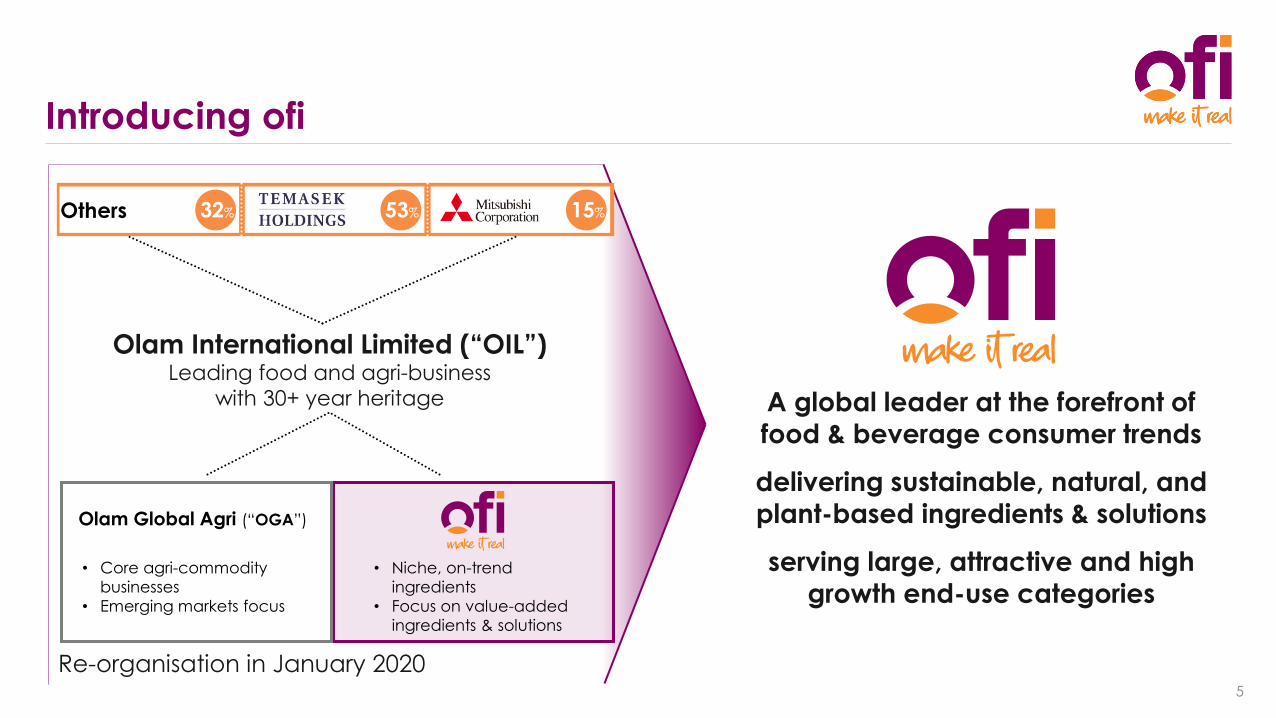
Introducing ofi
5
A global leader at the forefront of
food & beverage consumer trends
delivering sustainable, natural, and
plant-based ingredients & solutions
serving large, attractive and high
growth end-use categories
Others 15%53%32%
Olam International Limited (“OIL”)Leading food and agri-business
with 30+ year heritage
Re-organisation in January 2020
Olam Global Agri (“OGA”)
• Core agri-commodity
businesses
• Emerging markets focus
• Niche, on-trend
ingredients
• Focus on value-added
ingredients & solutions
DairySpicesNuts
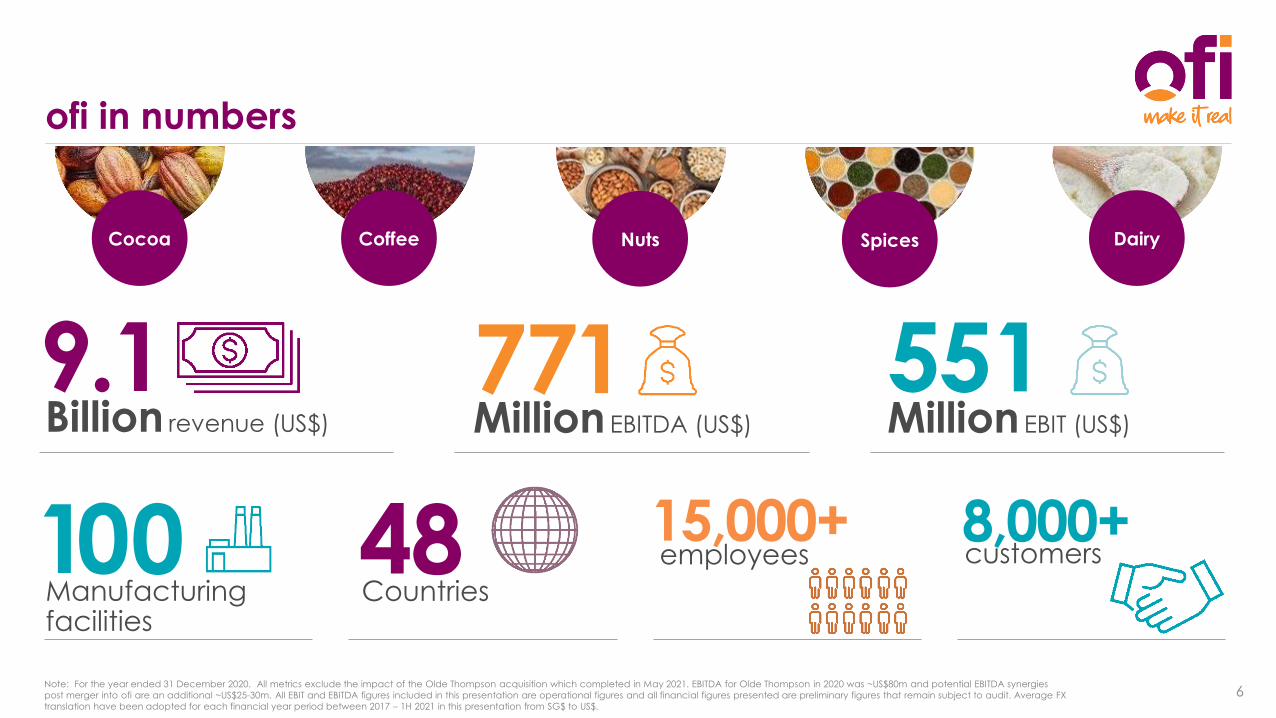
ofi in numbers
6
Cocoa Coffee
Billion revenue (US$)
9.1
Manufacturingfacilities
100
Million EBIT (US$)
551Million EBITDA (US$)
771
Countries48 employees
15,000+customers8,000+
Note: For the year ended 31 December 2020. All metrics exclude the impact of the Olde Thompson acquisition which completed in May 2021. EBITDA for Olde Thompson in 2020 was ~US$80m and potential EBITDA synergies
post merger into ofi are an additional ~US$25-30m. All EBIT and EBITDA figures included in this presentation are operational figures and all financial figures presented are preliminary figures that remain subject to audit. Average FX
translation have been adopted for each financial year period between 2017 – 1H 2021 in this presentation from SG$ to US$.
7Confidential
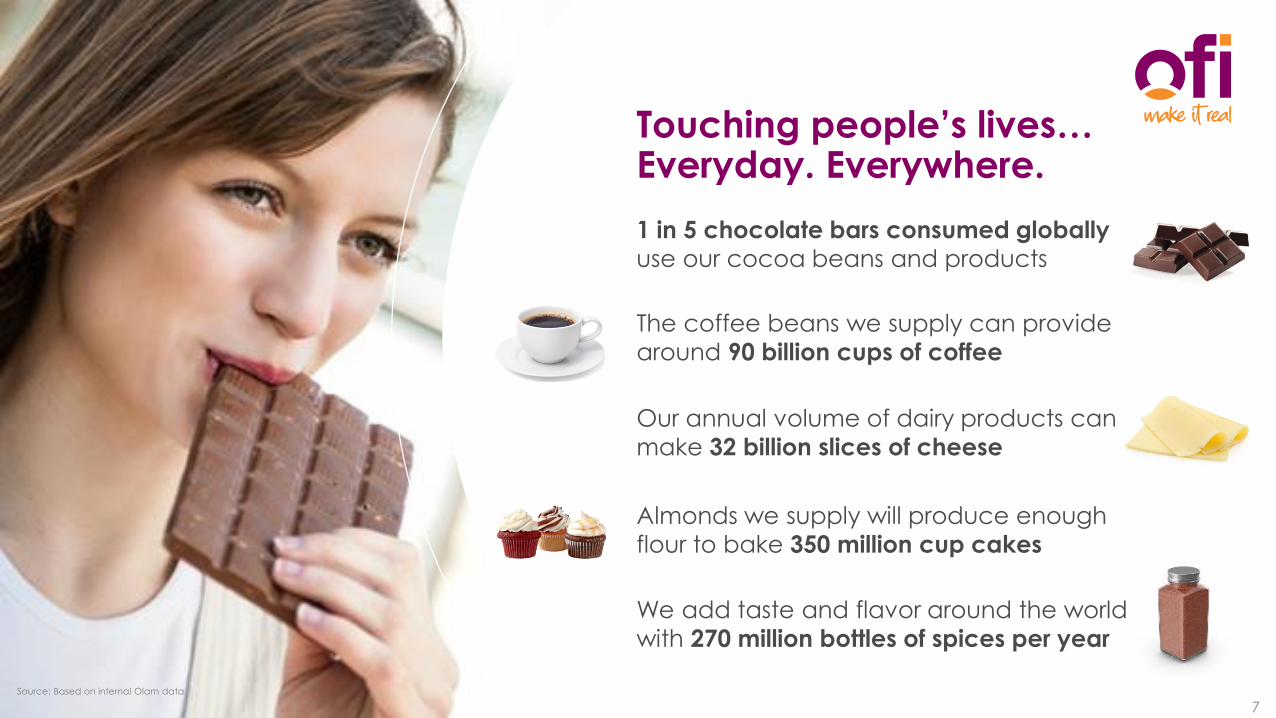
1 in 5 chocolate bars consumed globally
use our cocoa beans and products
The coffee beans we supply can provide
around 90 billion cups of coffee
Our annual volume of dairy products can
make 32 billion slices of cheese
Almonds we supply will produce enough
flour to bake 350 million cup cakes
Touching people’s lives…Everyday. Everywhere.
We add taste and flavor around the world
with 270 million bottles of spices per year
7
Source: Based on internal Olam data
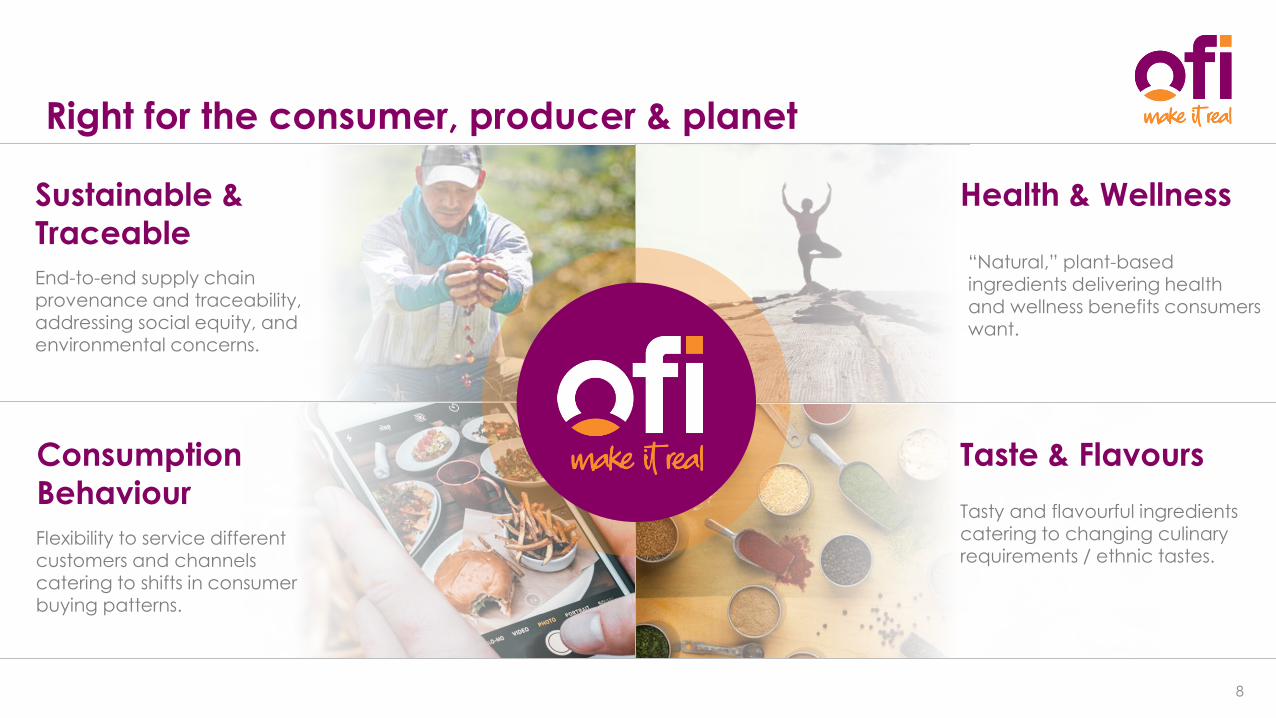
Right for the consumer, producer & planet
8
Sustainable &
Traceable
End-to-end supply chain provenance and traceability, addressing social equity, and environmental concerns.
Health & Wellness
“Natural,” plant-based ingredients delivering health and wellness benefits consumers want.
Taste & Flavours
Tasty and flavourful ingredients catering to changing culinary requirements / ethnic tastes.
Consumption
Behaviour
Flexibility to service different customers and channels catering to shifts in consumer buying patterns.
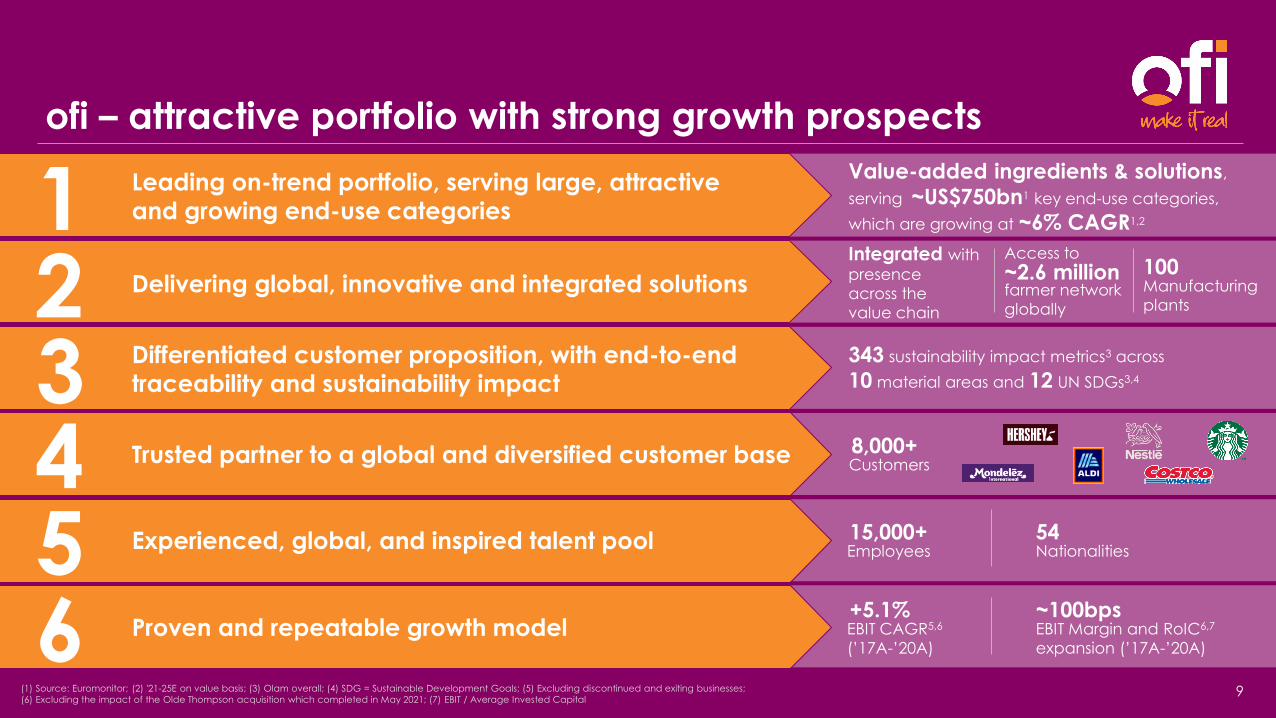
ofi – attractive portfolio with strong growth prospects
9(1) Source: Euromonitor; (2) '21-25E on value basis; (3) Olam overall; (4) SDG = Sustainable Development Goals; (5) Excluding discontinued and exiting businesses;
(6) Excluding the impact of the Olde Thompson acquisition which completed in May 2021; (7) EBIT / Average Invested Capital
Leading on-trend portfolio, serving large, attractive
and growing end-use categories
Value-added ingredients & solutions,
serving ~US$750bn1 key end-use categories,
which are growing at ~6% CAGR1,21
Proven and repeatable growth model EBIT CAGR5,6
(’17A-’20A)
+5.1% EBIT Margin and RoIC6,7
expansion (’17A-’20A)
~100bps
6
Experienced, global, and inspired talent poolEmployees15,000+
Nationalities545
Trusted partner to a global and diversified customer base Customers8,000+4
Delivering global, innovative and integrated solutions
Integrated with
presence
across the
value chain
farmer network
globally
~2.6 millionManufacturing
plants
100
2Access to
Differentiated customer proposition, with end-to-end
traceability and sustainability impact
343 sustainability impact metrics3 across
10 material areas and 12 UN SDGs3,43
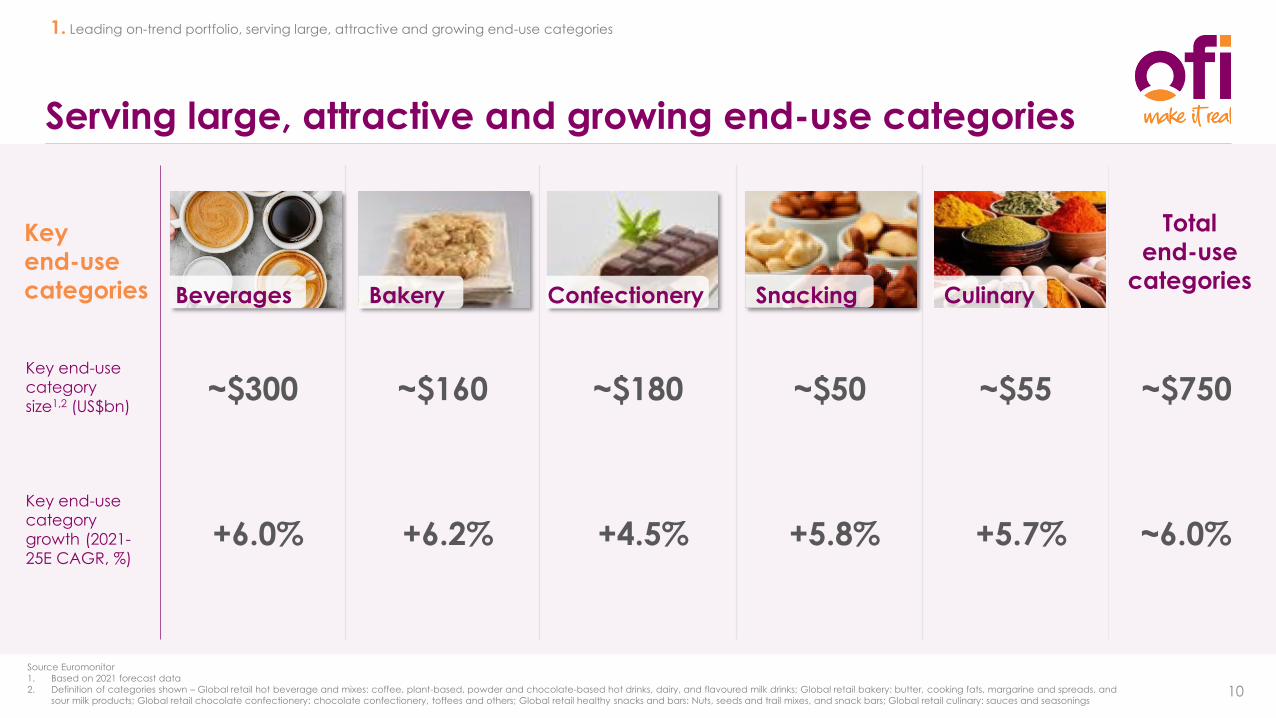
Serving large, attractive and growing end-use categories
10
Source Euromonitor
1. Based on 2021 forecast data
2. Definition of categories shown – Global retail hot beverage and mixes: coffee, plant-based, powder and chocolate-based hot drinks, dairy, and flavoured milk drinks; Global retail bakery: butter, cooking fats, margarine and spreads, and
sour milk products; Global retail chocolate confectionery: chocolate confectionery, toffees and others; Global retail healthy snacks and bars: Nuts, seeds and trail mixes, and snack bars; Global retail culinary: sauces and seasonings
Key
end-use
categories
Total
end-use
categories
Key end-use
category
size1,2 (US$bn)
Key end-use
category
growth (2021-
25E CAGR, %)
~$300
+6.0%
~$160
+6.2%
~$180
+4.5%
~$50
+5.8%
~$55
+5.7%
~$750
~6.0%
Beverages Snacking CulinaryBakery Confectionery
1. Leading on-trend portfolio, serving large, attractive and growing end-use categories
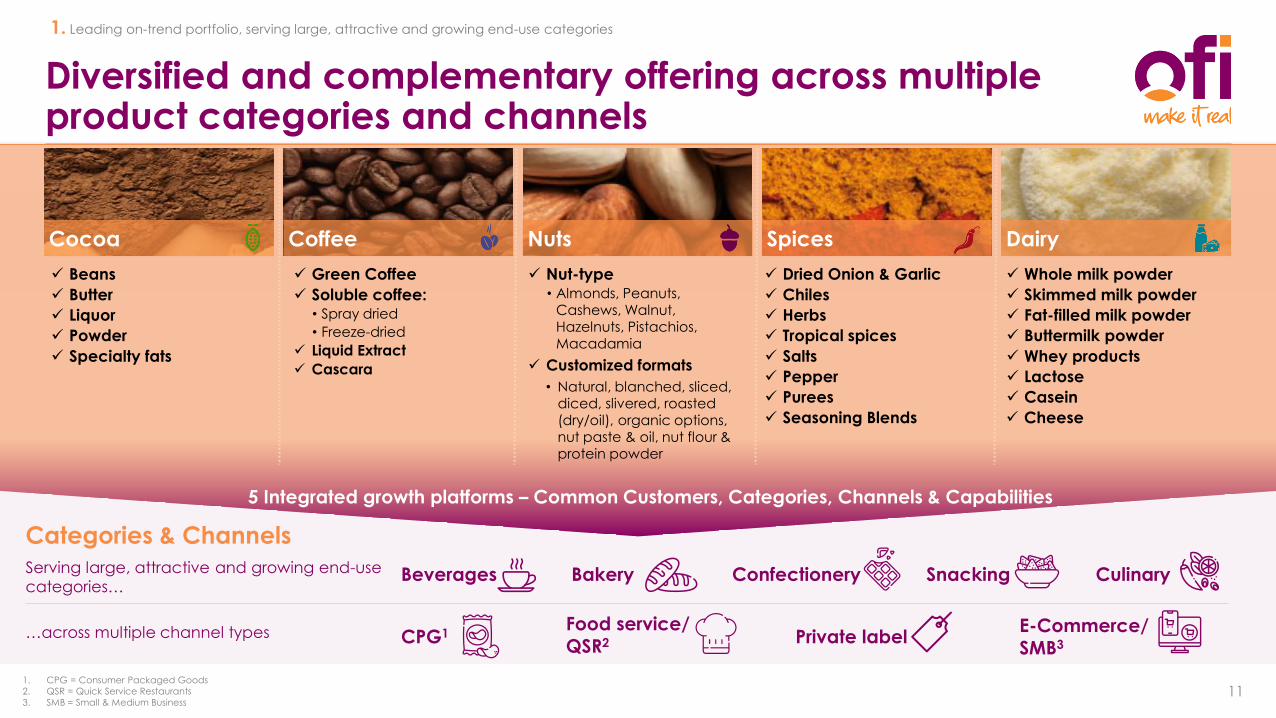
Diversified and complementary offering across multiple product categories and channels
1. CPG = Consumer Packaged Goods
2. QSR = Quick Service Restaurants
3. SMB = Small & Medium Business
CPG1Food service/ QSR2 Private label
E-Commerce/ SMB3
Serving large, attractive and growing end-use
categories…Beverages Bakery Confectionery Snacking Culinary
…across multiple channel types
Categories & Channels
11
✓ Beans
✓ Butter
✓ Liquor
✓ Powder
✓ Specialty fats
✓ Green Coffee
✓ Soluble coffee: • Spray dried
• Freeze-dried
✓ Liquid Extract
✓ Cascara
✓ Dried Onion & Garlic
✓ Chiles
✓ Herbs
✓ Tropical spices
✓ Salts
✓ Pepper
✓ Purees
✓ Seasoning Blends
✓ Whole milk powder
✓ Skimmed milk powder
✓ Fat-filled milk powder
✓ Buttermilk powder
✓ Whey products
✓ Lactose
✓ Casein
✓ Cheese
Cocoa Coffee Nuts Spices Dairy
✓ Nut-type• Almonds, Peanuts,
Cashews, Walnut, Hazelnuts, Pistachios, Macadamia
✓ Customized formats
• Natural, blanched, sliced, diced, slivered, roasted (dry/oil), organic options, nut paste & oil, nut flour & protein powder
5 Integrated growth platforms – Common Customers, Categories, Channels & Capabilities
1. Leading on-trend portfolio, serving large, attractive and growing end-use categories
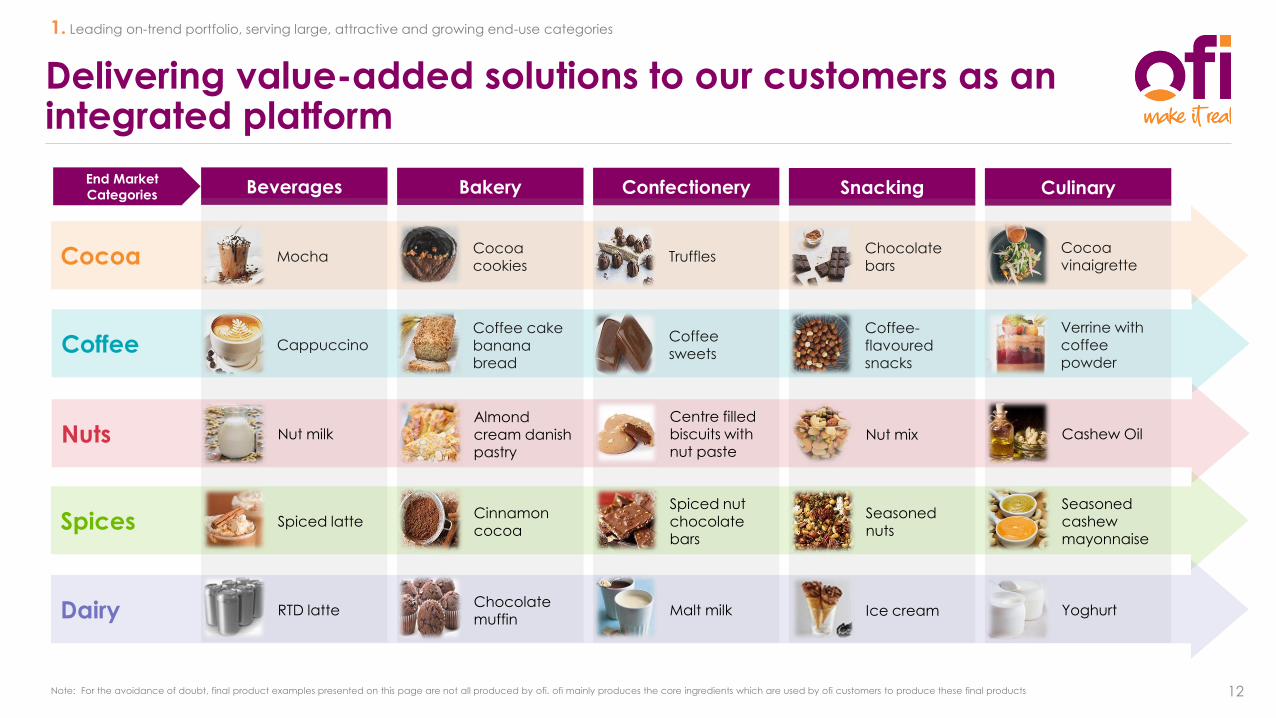
CoffeeCoffee cake banana bread
CappuccinoCoffee-flavoured snacks
Coffee
sweets
Verrine with coffee powder
Cocoa Cocoa cookies
MochaChocolate bars
TrufflesCocoa vinaigrette
Delivering value-added solutions to our customers as an integrated platform
12
Beverages Bakery Confectionery Snacking CulinaryEnd Market
Categories
Nuts
Spices
Dairy
Almond cream danish pastry
Nut milk Nut mix
Centre filled biscuits with nut paste
Cashew Oil
Cinnamon cocoa
Spiced latteSeasoned nuts
Spiced nut chocolate bars
Seasoned cashew mayonnaise
Chocolate muffin
RTD latte Ice creamMalt milk Yoghurt
Note: For the avoidance of doubt, final product examples presented on this page are not all produced by ofi. ofi mainly produces the core ingredients which are used by ofi customers to produce these final products
1. Leading on-trend portfolio, serving large, attractive and growing end-use categories
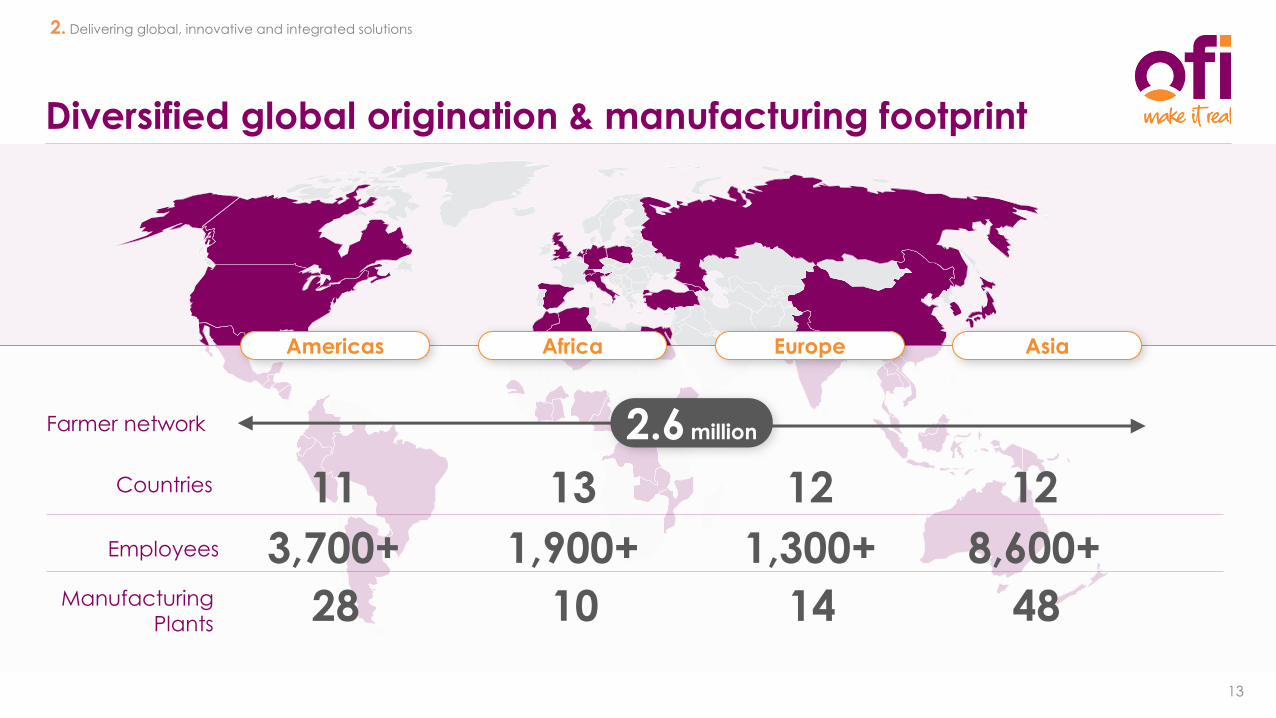
Diversified global origination & manufacturing footprint
11
28
3,700+
13
10
1,900+
12
48
8,600+
2.6 million
Countries
Employees
Manufacturing
Plants
Farmer network
12
14
1,300+
Americas Africa Europe Asia
2. Delivering global, innovative and integrated solutions
13
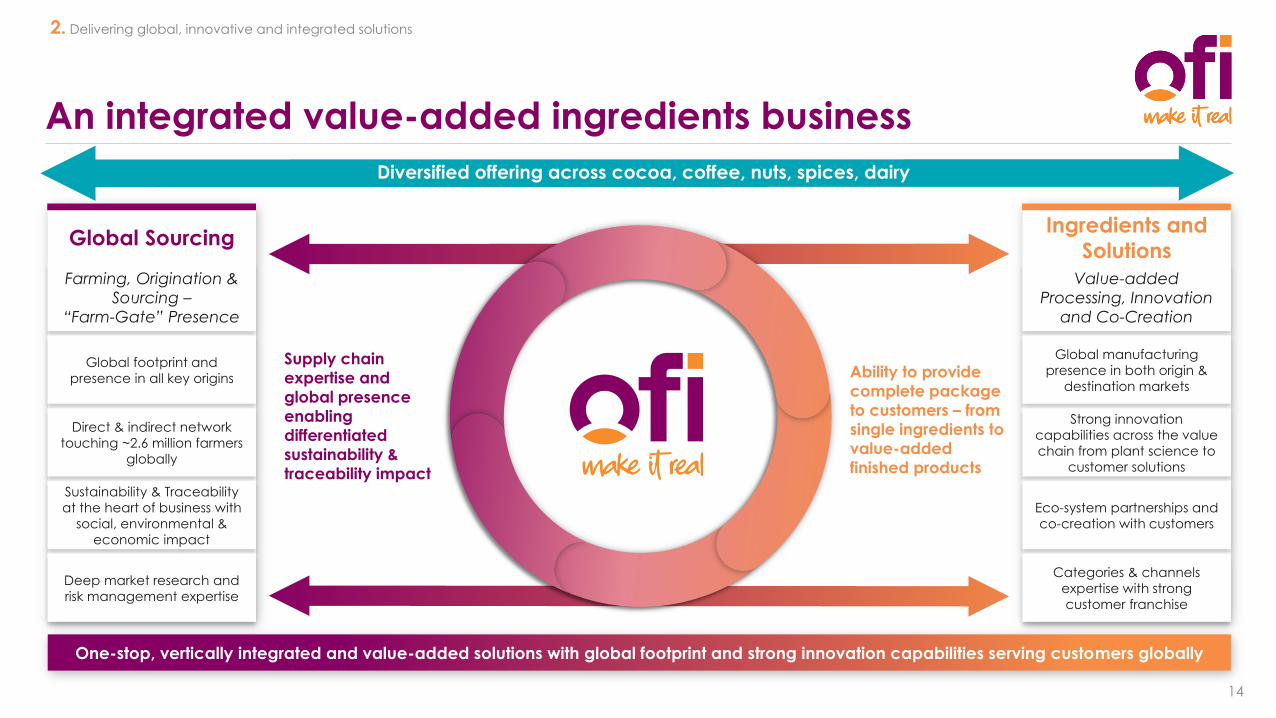
An integrated value-added ingredients business
One-stop, vertically integrated and value-added solutions with global footprint and strong innovation capabilities serving customers globally
Global Sourcing
Farming, Origination &
Sourcing –
“Farm-Gate” Presence
Global footprint and
presence in all key origins
Direct & indirect network
touching ~2.6 million farmers
globally
Sustainability & Traceability
at the heart of business with
social, environmental &
economic impact
Deep market research and
risk management expertise
Ingredients and
Solutions
Value-added
Processing, Innovation
and Co-Creation
Global manufacturing
presence in both origin &
destination markets
Strong innovation
capabilities across the value
chain from plant science to
customer solutions
Eco-system partnerships and
co-creation with customers
Categories & channels
expertise with strong
customer franchise
Supply chain
expertise and
global presence
enabling
differentiated
sustainability &
traceability impact
Ability to provide
complete package
to customers – from
single ingredients to
value-added
finished products
14
Diversified offering across cocoa, coffee, nuts, spices, dairy
2. Delivering global, innovative and integrated solutions
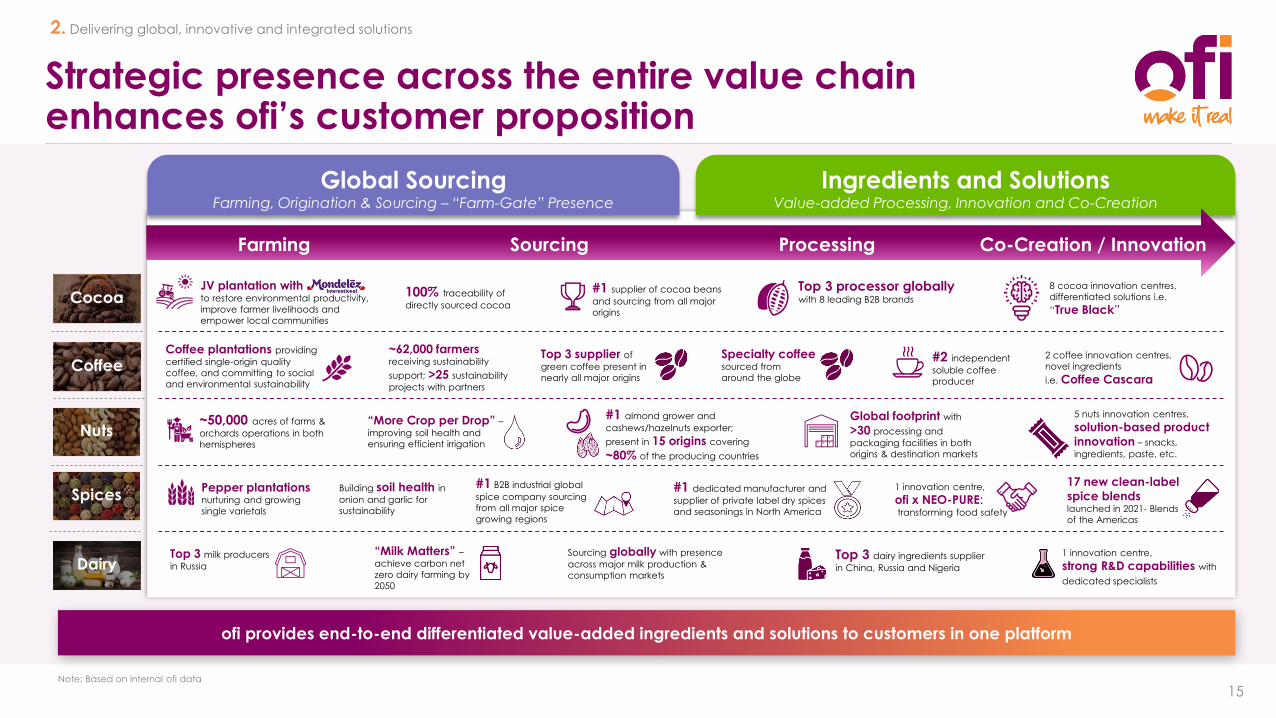
Strategic presence across the entire value chain enhances ofi’s customer proposition
Dairy
Cocoa
ofi provides end-to-end differentiated value-added ingredients and solutions to customers in one platform
2. Delivering global, innovative and integrated solutions
15
Coffee
Spices
Nuts
Note: Based on internal ofi data
Ingredients and SolutionsValue-added Processing, Innovation and Co-Creation
Global SourcingFarming, Origination & Sourcing – “Farm-Gate” Presence
JV plantation with to restore environmental productivity,
improve farmer livelihoods and
empower local communities
100% traceability of
directly sourced cocoa
Top 3 processor globallywith 8 leading B2B brands
8 cocoa innovation centres,
differentiated solutions i.e.
“True Black”
Coffee plantations providing
certified single-origin quality
coffee, and committing to social
and environmental sustainability
~62,000 farmers receiving sustainability
support; >25 sustainability
projects with partners
#2 independent
soluble coffee
producer
2 coffee innovation centres,
novel ingredients
i.e. Coffee Cascara
~50,000 acres of farms &
orchards operations in both
hemispheres
#1 almond grower and
cashews/hazelnuts exporter;
present in 15 origins covering
~80% of the producing countries
Global footprint with
>30 processing and
packaging facilities in both
origins & destination markets
5 nuts innovation centres,
solution-based product
innovation – snacks,
ingredients, paste, etc.
Pepper plantations nurturing and growing
single varietals
#1 B2B industrial global
spice company sourcing
from all major spice
growing regions
#1 dedicated manufacturer and
supplier of private label dry spices
and seasonings in North America
1 innovation centre,
ofi x NEO-PURE:transforming food safety
Top 3 milk producers
in RussiaTop 3 dairy ingredients supplier
in China, Russia and Nigeria
1 innovation centre,
strong R&D capabilities with
dedicated specialists
Farming Sourcing Processing Co-Creation / Innovation
#1 supplier of cocoa beans
and sourcing from all major
origins
Top 3 supplier of
green coffee present in
nearly all major origins
“More Crop per Drop” –improving soil health and
ensuring efficient irrigation
Building soil health in
onion and garlic for
sustainability
“Milk Matters” –achieve carbon net
zero dairy farming by
2050
Specialty coffee sourced from
around the globe
17 new clean-label
spice blends launched in 2021- Blends
of the Americas
Sourcing globally with presence
across major milk production &
consumption markets
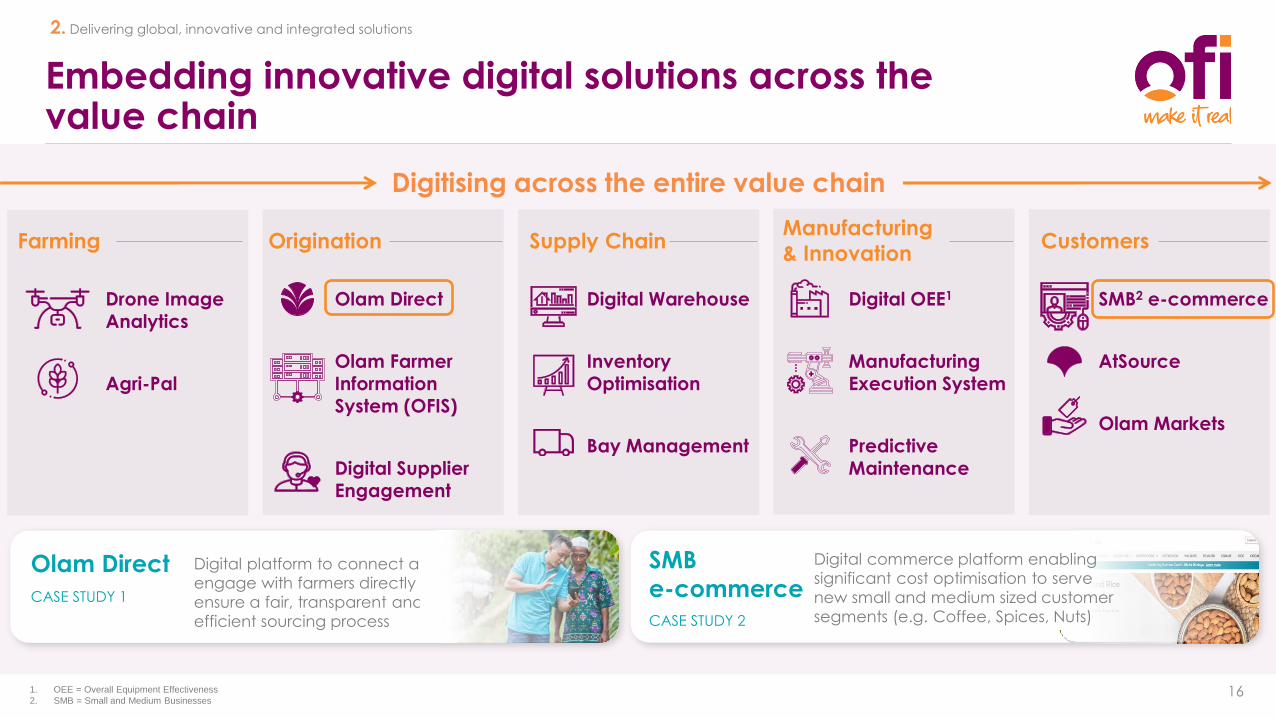
Embedding innovative digital solutions across the value chain
16
Drone Image Analytics
Agri-Pal
Farming
Olam Direct
Olam Farmer Information System (OFIS)
Digital Supplier Engagement
Origination
SMB2 e-commerce
AtSource
Olam Markets
Customers
Digital Warehouse
Inventory Optimisation
Bay Management
Supply Chain
Digital OEE1
Manufacturing Execution System
Predictive Maintenance
Manufacturing
& Innovation
Digitising across the entire value chain
Olam Direct Digital platform to connect and
engage with farmers directly to
ensure a fair, transparent and
efficient sourcing process
CASE STUDY 1
SMB
e-commerce
CASE STUDY 2
Digital commerce platform enabling
significant cost optimisation to serve
new small and medium sized customer
segments (e.g. Coffee, Spices, Nuts)
2. Delivering global, innovative and integrated solutions
1. OEE = Overall Equipment Effectiveness
2. SMB = Small and Medium Businesses
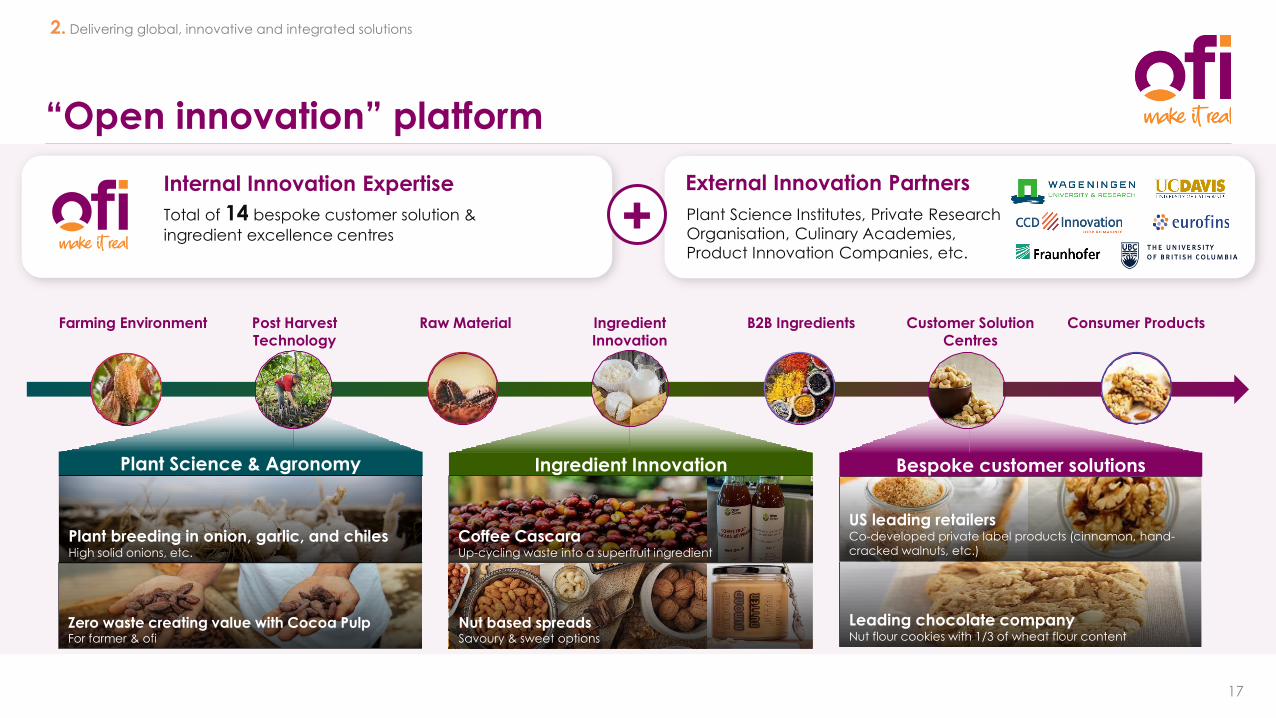
“Open innovation” platform
17
2. Delivering global, innovative and integrated solutions
Bespoke customer solutions
US leading retailers Co-developed private label products (cinnamon, hand-
cracked walnuts, etc.)
Leading chocolate companyNut flour cookies with 1/3 of wheat flour content
Plant Science & Agronomy
Zero waste creating value with Cocoa PulpFor farmer & ofi
Plant breeding in onion, garlic, and chiles High solid onions, etc.
Ingredient Innovation
Coffee Cascara Up-cycling waste into a superfruit ingredient
Nut based spreadsSavoury & sweet options
Internal Innovation Expertise
Total of 14 bespoke customer solution &
ingredient excellence centres
External Innovation Partners
Plant Science Institutes, Private Research
Organisation, Culinary Academies,
Product Innovation Companies, etc.
+
Farming Environment Post HarvestTechnology
Raw Material B2B IngredientsIngredientInnovation
Customer SolutionCentres
Consumer Products
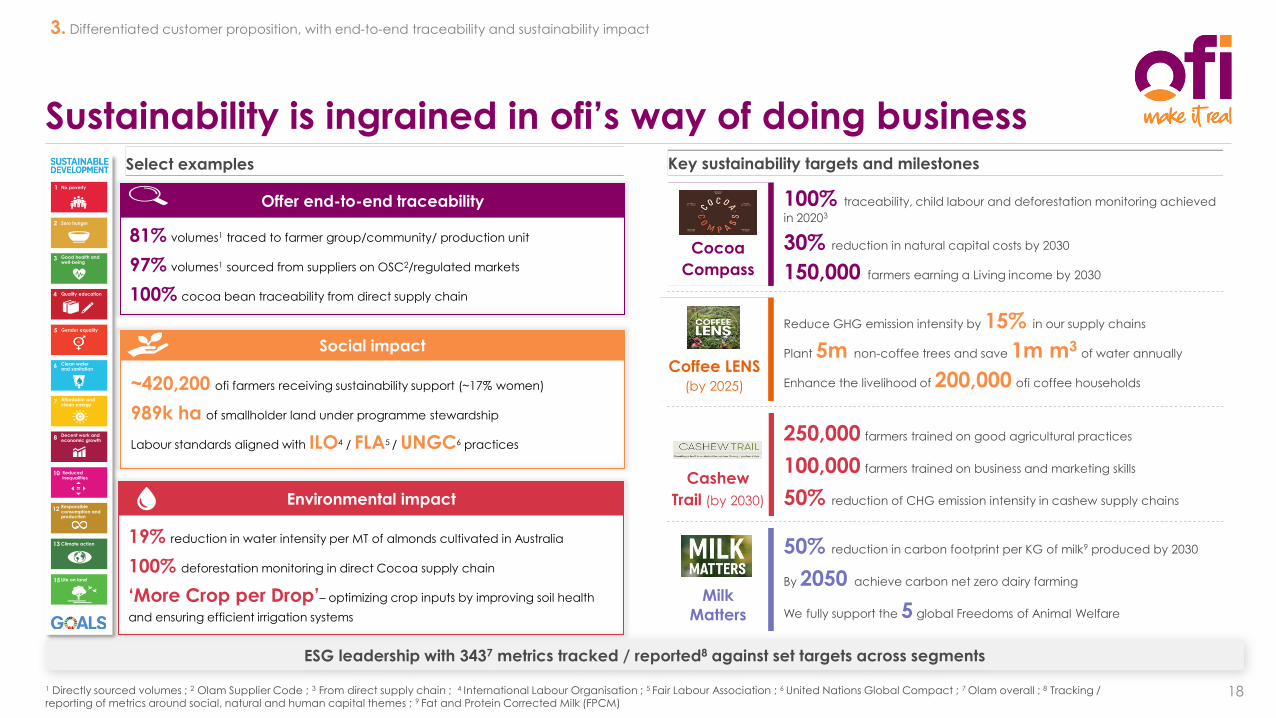
Sustainability is ingrained in ofi’s way of doing business
ESG leadership with 3437 metrics tracked / reported8 against set targets across segments
1 Directly sourced volumes ; 2 Olam Supplier Code ; 3 From direct supply chain ; 4 International Labour Organisation ; 5 Fair Labour Association ; 6 United Nations Global Compact ; 7 Olam overall ; 8 Tracking / reporting of metrics around social, natural and human capital themes ; 9 Fat and Protein Corrected Milk (FPCM)
3. Differentiated customer proposition, with end-to-end traceability and sustainability impact
18
~420,200 ofi farmers receiving sustainability support (~17% women)
989k ha of smallholder land under programme stewardship
Labour standards aligned with ILO4 / FLA5 / UNGC6 practices
Social impact
Offer end-to-end traceability
81% volumes1 traced to farmer group/community/ production unit
97% volumes1 sourced from suppliers on OSC2/regulated markets
100% cocoa bean traceability from direct supply chain
1 No poverty
3 Good health and well-being
4 Quality education
5 Gender equality
=
6 Clean water and sanitation
12 Responsible consumption and production
13 Climate action
15 Life on land
7 Affordable and clean energy
8 Decent work and economic growth
10 Reduced inequalities
=
Zero hunger2
Key sustainability targets and milestones
100% traceability, child labour and deforestation monitoring achieved
in 20203
30% reduction in natural capital costs by 2030
150,000 farmers earning a Living income by 2030
250,000 farmers trained on good agricultural practices
100,000 farmers trained on business and marketing skills
50% reduction of CHG emission intensity in cashew supply chains
Reduce GHG emission intensity by 15% in our supply chains
Plant 5m non-coffee trees and save 1m m3 of water annually
Enhance the livelihood of 200,000 ofi coffee households
Cashew
Trail (by 2030)
Coffee LENS (by 2025)
Cocoa
Compass
Milk
Matters
50% reduction in carbon footprint per KG of milk9 produced by 2030
By 2050 achieve carbon net zero dairy farming
We fully support the 5 global Freedoms of Animal Welfare
Environmental impact
19% reduction in water intensity per MT of almonds cultivated in Australia
100% deforestation monitoring in direct Cocoa supply chain
‘More Crop per Drop’– optimizing crop inputs by improving soil health
and ensuring efficient irrigation systems
Select examples
Sustainability insights platform, driving a differentiated customer proposition
19
3. Differentiated customer proposition, with end-to-end traceability and sustainability impact
Customer & Industry recognition
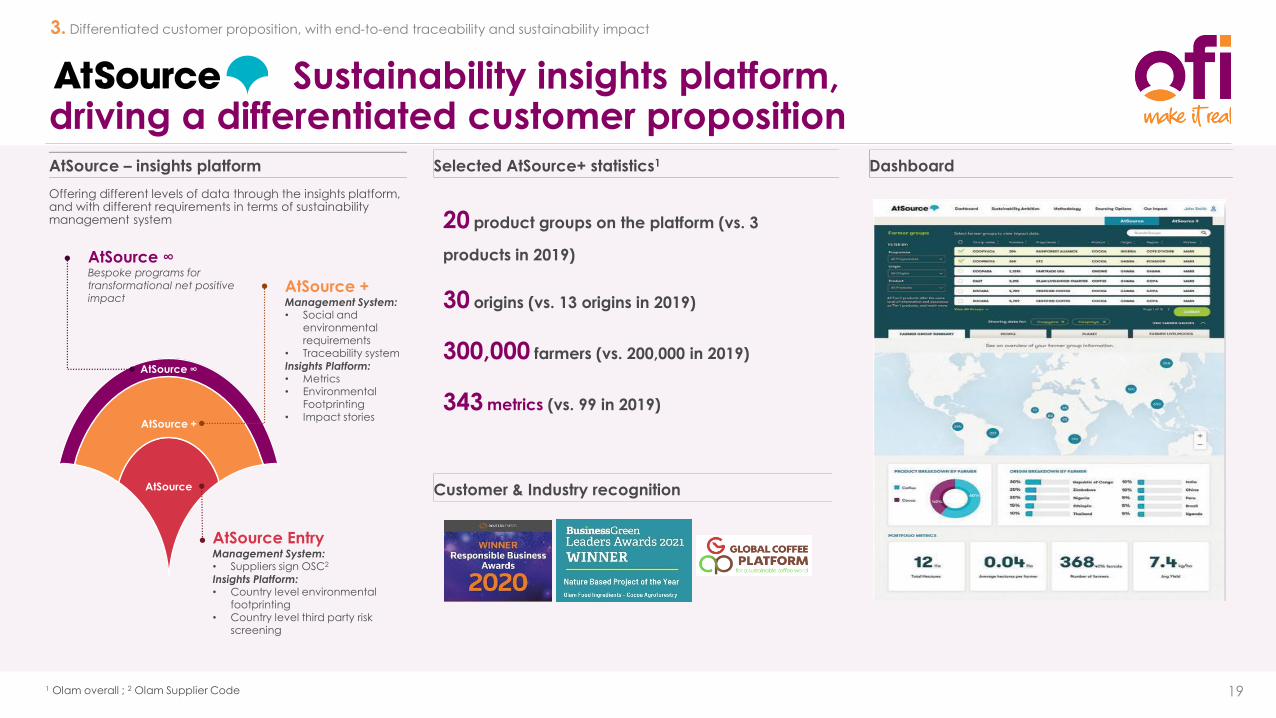
AtSource – insights platform
Offering different levels of data through the insights platform, and with different requirements in terms of sustainability management system
AtSource ∞Bespoke programs for transformational net positive impact
AtSource +Management System:• Social and
environmental requirements
• Traceability system
Insights Platform:• Metrics• Environmental
Footprinting• Impact stories
AtSource EntryManagement System:• Suppliers sign OSC2
Insights Platform:• Country level environmental
footprinting• Country level third party risk
screening
AtSource ∞
AtSource +
AtSource
Selected AtSource+ statistics1
20 product groups on the platform (vs. 3
products in 2019)
30 origins (vs. 13 origins in 2019)
300,000 farmers (vs. 200,000 in 2019)
343 metrics (vs. 99 in 2019)
1 Olam overall ; 2 Olam Supplier Code
Dashboard
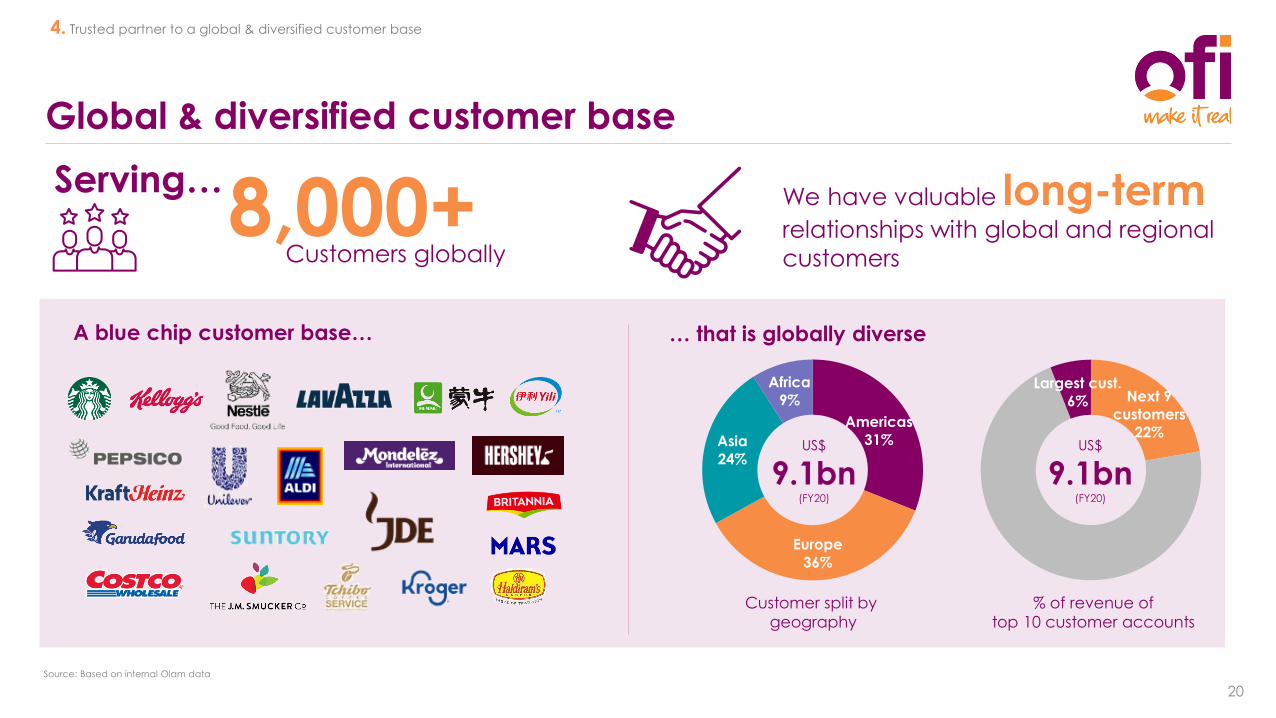
Global & diversified customer base
20
4. Trusted partner to a global & diversified customer base
8,000+Customers globally
Serving…We have valuable long-termrelationships with global and regional
customers
A blue chip customer base… … that is globally diverse
Next 9
customers
22%
Largest cust.
6%
Customer split by
geography
% of revenue of
top 10 customer accounts
US$
9.1bn(FY20)
US$
9.1bn(FY20)
Source: Based on internal Olam data
Americas
31%
Europe
36%
Asia
24%
Africa
9%
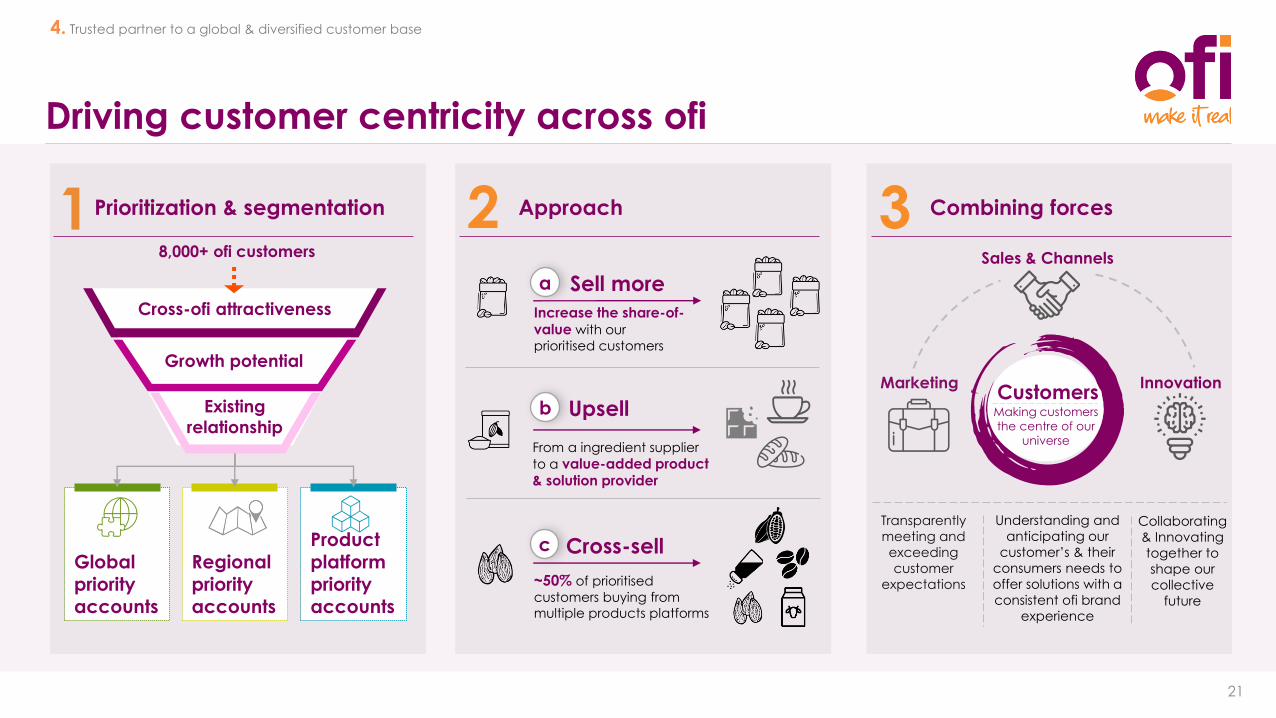
Driving customer centricity across ofi
21
4. Trusted partner to a global & diversified customer base
18,000+ ofi customers
Prioritization & segmentation
Global priority accounts
Regionalpriority accounts
Product platform priority accounts
Growth potential
Existing
relationship
Cross-ofi attractiveness
Approach2
Upsellb
Cross-sellc
Sell morea
~50% of prioritised
customers buying from
multiple products platforms
From a ingredient supplier
to a value-added product & solution provider
Increase the share-of-value with our
prioritised customers
Marketing
Transparently
meeting and
exceeding
customer
expectations
Combining forces3
Innovation
Sales & Channels
Making customers
the centre of our
universe
Customers
Understanding and
anticipating our
customer’s & their
consumers needs to
offer solutions with a
consistent ofi brand
experience
Collaborating
& Innovating
together to
shape our
collective
future
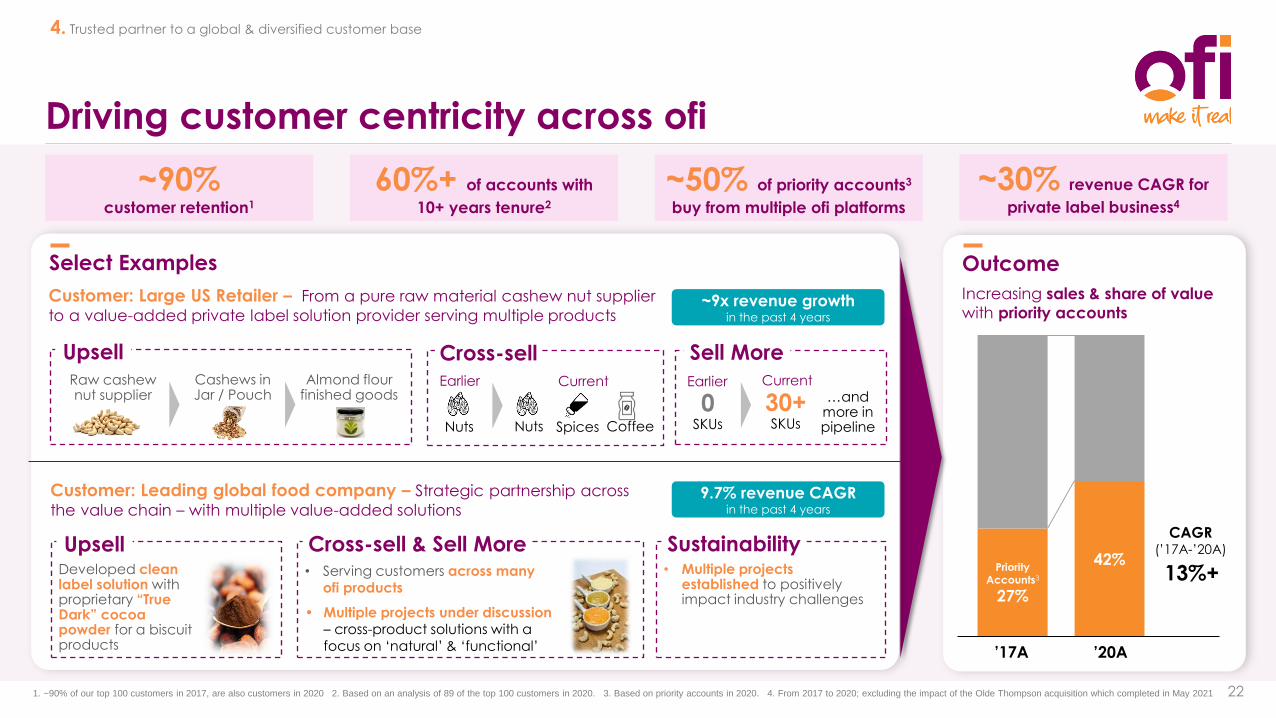
Driving customer centricity across ofi
22
4. Trusted partner to a global & diversified customer base
Outcome
Increasing sales & share of value
with priority accounts
Priority Accounts3
27%
42%
’17A ’20A
CAGR(’17A-’20A)
13%+
Customer: Large US Retailer – From a pure raw material cashew nut supplier
to a value-added private label solution provider serving multiple products
Customer: Leading global food company – Strategic partnership across
the value chain – with multiple value-added solutions
Select Examples
UpsellRaw cashew nut supplier
Cashews in Jar / Pouch
Almond flour finished goods
Cross-sellEarlier
Nuts
Current
Nuts Spices Coffee
Sell More
0SKUs
CurrentEarlier
30+SKUs
…and more in pipeline
~9x revenue growth in the past 4 years
~90%customer retention1
~50% of priority accounts3
buy from multiple ofi platforms
60%+ of accounts with
10+ years tenure2
UpsellDeveloped clean label solution with proprietary “True Dark” cocoa powder for a biscuit products
9.7% revenue CAGRin the past 4 years
Cross-sell & Sell More• Serving customers across many
ofi products
• Multiple projects under discussion– cross-product solutions with a focus on ‘natural’ & ‘functional’
Sustainability• Multiple projects
established to positively impact industry challenges
1. ~90% of our top 100 customers in 2017, are also customers in 2020 2. Based on an analysis of 89 of the top 100 customers in 2020. 3. Based on priority accounts in 2020. 4. From 2017 to 2020; excluding the impact of the Olde Thompson acquisition which completed in May 2021
~30% revenue CAGR for
private label business4
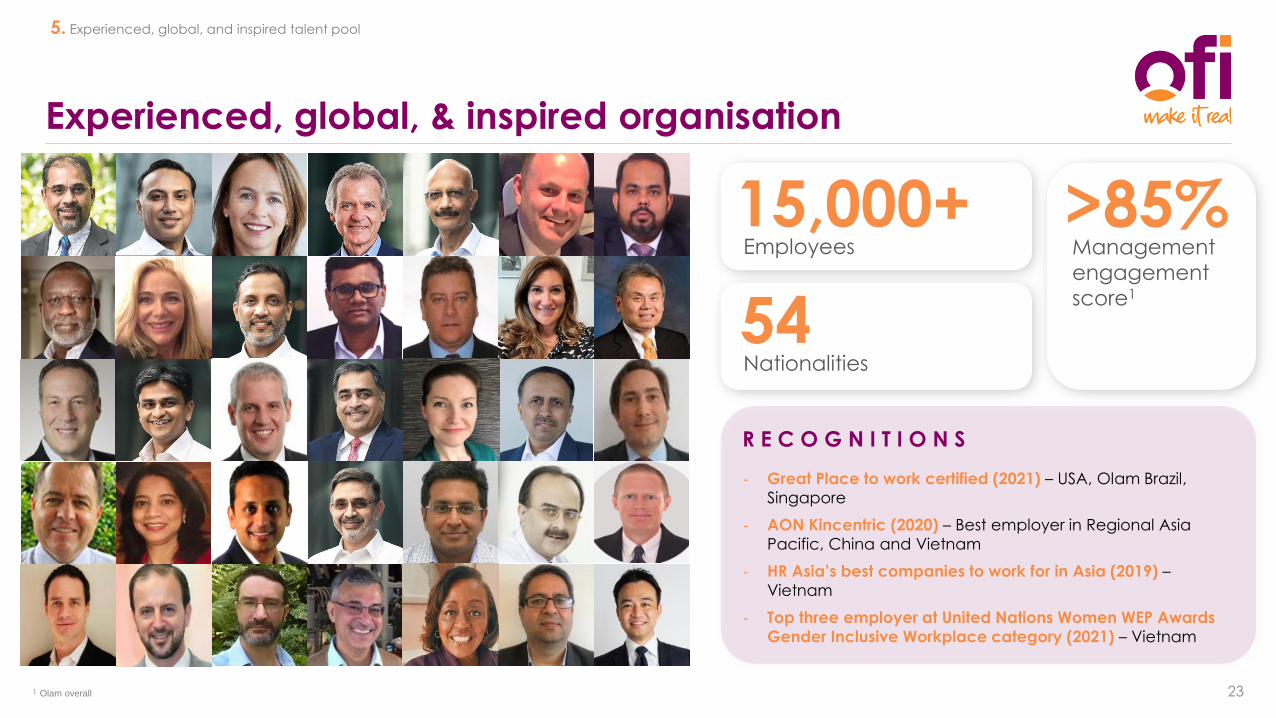
Experienced, global, & inspired organisation
23
5. Experienced, global, and inspired talent pool
Employees
15,000+
Nationalities
54
Management
engagement
score1
>85%
- Great Place to work certified (2021) – USA, Olam Brazil,
Singapore
- AON Kincentric (2020) – Best employer in Regional Asia
Pacific, China and Vietnam
- HR Asia’s best companies to work for in Asia (2019) –
Vietnam
- Top three employer at United Nations Women WEP Awards
Gender Inclusive Workplace category (2021) – Vietnam
R E C O G N I T I O N S
1 Olam overall
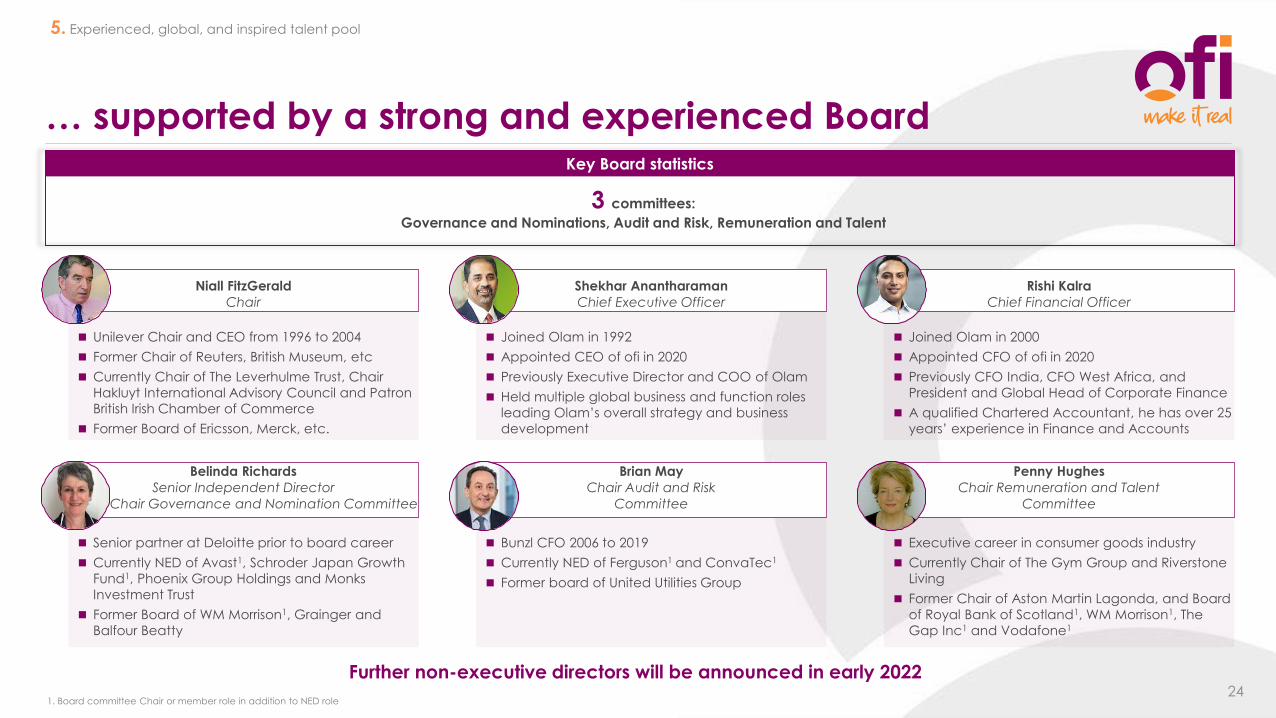
… supported by a strong and experienced Board
24
◼ Unilever Chair and CEO from 1996 to 2004
◼ Former Chair of Reuters, British Museum, etc
◼ Currently Chair of The Leverhulme Trust, Chair
Hakluyt International Advisory Council and Patron
British Irish Chamber of Commerce
◼ Former Board of Ericsson, Merck, etc.
Niall FitzGerald
Chair
◼ Joined Olam in 1992
◼ Appointed CEO of ofi in 2020
◼ Previously Executive Director and COO of Olam
◼ Held multiple global business and function roles
leading Olam’s overall strategy and business
development
Shekhar Anantharaman
Chief Executive Officer
◼ Joined Olam in 2000
◼ Appointed CFO of ofi in 2020
◼ Previously CFO India, CFO West Africa, and
President and Global Head of Corporate Finance
◼ A qualified Chartered Accountant, he has over 25
years’ experience in Finance and Accounts
Rishi Kalra
Chief Financial Officer
3 committees:
Governance and Nominations, Audit and Risk, Remuneration and Talent
Key Board statistics
5. Experienced, global, and inspired talent pool
◼ Senior partner at Deloitte prior to board career
◼ Currently NED of Avast1, Schroder Japan Growth
Fund1, Phoenix Group Holdings and Monks
Investment Trust
◼ Former Board of WM Morrison1, Grainger and
Balfour Beatty
Belinda Richards
Senior Independent Director
Chair Governance and Nomination Committee
◼ Bunzl CFO 2006 to 2019
◼ Currently NED of Ferguson1 and ConvaTec1
◼ Former board of United Utilities Group
Brian May
Chair Audit and Risk
Committee
◼ Executive career in consumer goods industry
◼ Currently Chair of The Gym Group and Riverstone
Living
◼ Former Chair of Aston Martin Lagonda, and Board
of Royal Bank of Scotland1, WM Morrison1, The
Gap Inc1 and Vodafone1
Penny Hughes
Chair Remuneration and Talent
Committee
Further non-executive directors will be announced in early 2022
1. Board committee Chair or member role in addition to NED role
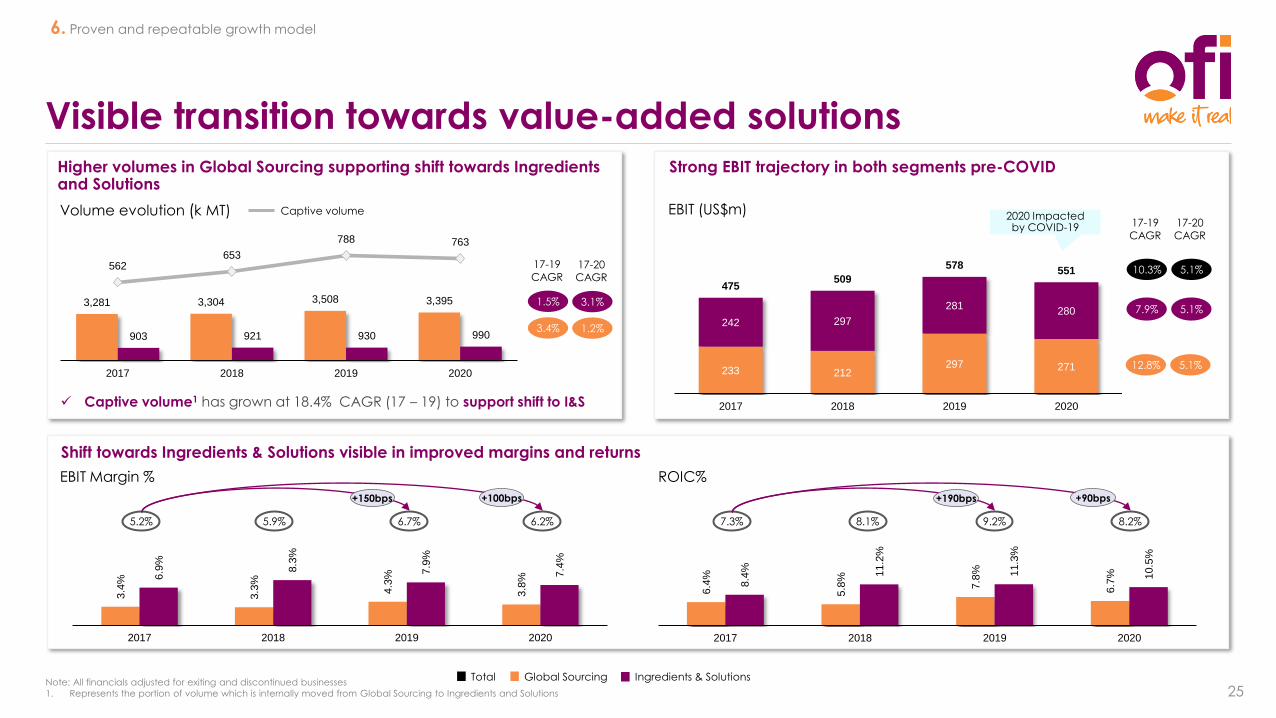
3,281 3,304 3,508 3,395
903 921 930 990
562 653
788 763
2017 2018 2019 2020
3.4
%
3.3
%
4.3
%
3.8
%
6.9
%
8.3
%
7.9
%
7.4
%
2017 2018 2019 2020
Note: All financials adjusted for exiting and discontinued businesses
1. Represents the portion of volume which is internally moved from Global Sourcing to Ingredients and Solutions
Visible transition towards value-added solutions
Ingredients & SolutionsGlobal Sourcing
Captive volumeVolume evolution (k MT)
Higher volumes in Global Sourcing supporting shift towards Ingredients and Solutions
Shift towards Ingredients & Solutions visible in improved margins and returns
6. Proven and repeatable growth model
25Total
1.2%
3.1%
17-20CAGR
Strong EBIT trajectory in both segments pre-COVID
EBIT (US$m)
5.1%
5.1%
5.1%
2020 Impacted by COVID-19 17-20
CAGR
233 212297 271
242 297
281280
475509
578551
0
100
200
300
400
500
600
700
2017 2018 2019 2020
6.4
%
5.8
%
7.8
%
6.7
%
8.4
%
11.2
%
11.3
%
10.5
%
2017 2018 2019 2020
8.1% 9.2% 8.2%7.3%
+150bps
5.9% 6.7% 6.2%5.2%
EBIT Margin % ROIC%
+190bps
✓ Captive volume1 has grown at 18.4% CAGR (17 – 19) to support shift to I&S
3.4%
1.5%
17-19CAGR
12.8%
7.9%
10.3%
17-19CAGR
+100bps +90bps
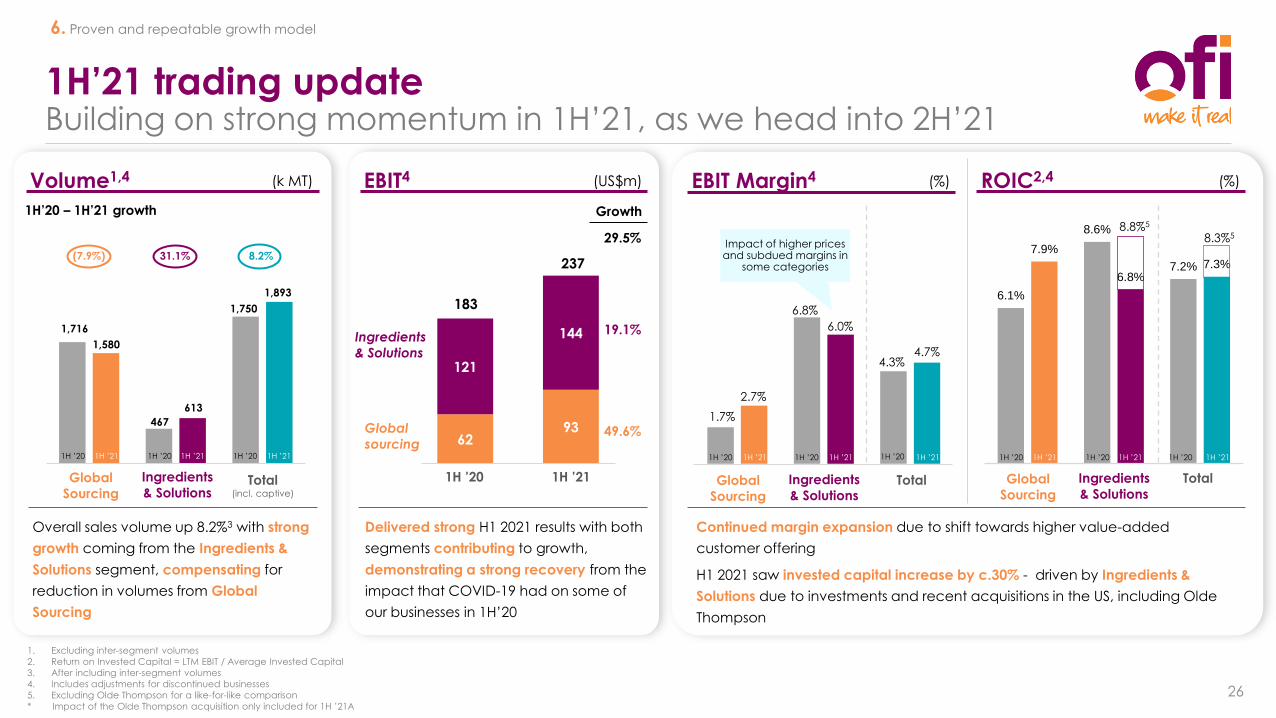
1H’21 trading updateBuilding on strong momentum in 1H’21, as we head into 2H’21
26
Delivered strong H1 2021 results with both
segments contributing to growth,
demonstrating a strong recovery from the
impact that COVID-19 had on some of
our businesses in 1H’20
1. Excluding inter-segment volumes
2. Return on Invested Capital = LTM EBIT / Average Invested Capital
3. After including inter-segment volumes
4. Includes adjustments for discontinued businesses
5. Excluding Olde Thompson for a like-for-like comparison
* Impact of the Olde Thompson acquisition only included for 1H ’21A
237
EBIT4 (US$m) EBIT Margin4 (%) ROIC2,4Volume1,4 (k MT)
1H’20 – 1H’21 growth
Global
Sourcing
Ingredients
& SolutionsTotal Global
Sourcing
Ingredients
& Solutions
Overall sales volume up 8.2%3 with strong
growth coming from the Ingredients &
Solutions segment, compensating for
reduction in volumes from Global
Sourcing
(%)
Continued margin expansion due to shift towards higher value-added
customer offering
H1 2021 saw invested capital increase by c.30% - driven by Ingredients &
Solutions due to investments and recent acquisitions in the US, including Olde
Thompson
121
62
Growth
1H ’20 1H ’21
183
144
93
29.5%
19.1%
49.6%1.7%
2.7%
6.8%
6.0%
4.3%4.7%
Global
sourcing
Ingredients
& Solutions
6.1%
8.6%
7.2%
7.9%
6.8%7.3%
1H ’20 1H ’20 1H ’211H ’21 1H ’20 1H ’21
Total
8.8%5
8.3%5
1,716
1,580
467
613
(7.9%)
Global
Sourcing
Ingredients
& Solutions
31.1%
6293
121
144
1H ’20 1H ’20 1H ’211H ’21 1H ’20 1H ’21
Total(incl. captive)
8.2%
1,750
1H ’20 1H ’20 1H ’211H ’21 1H ’20 1H ’21
1,893
Impact of higher prices and subdued margins in
some categories
6. Proven and repeatable growth model
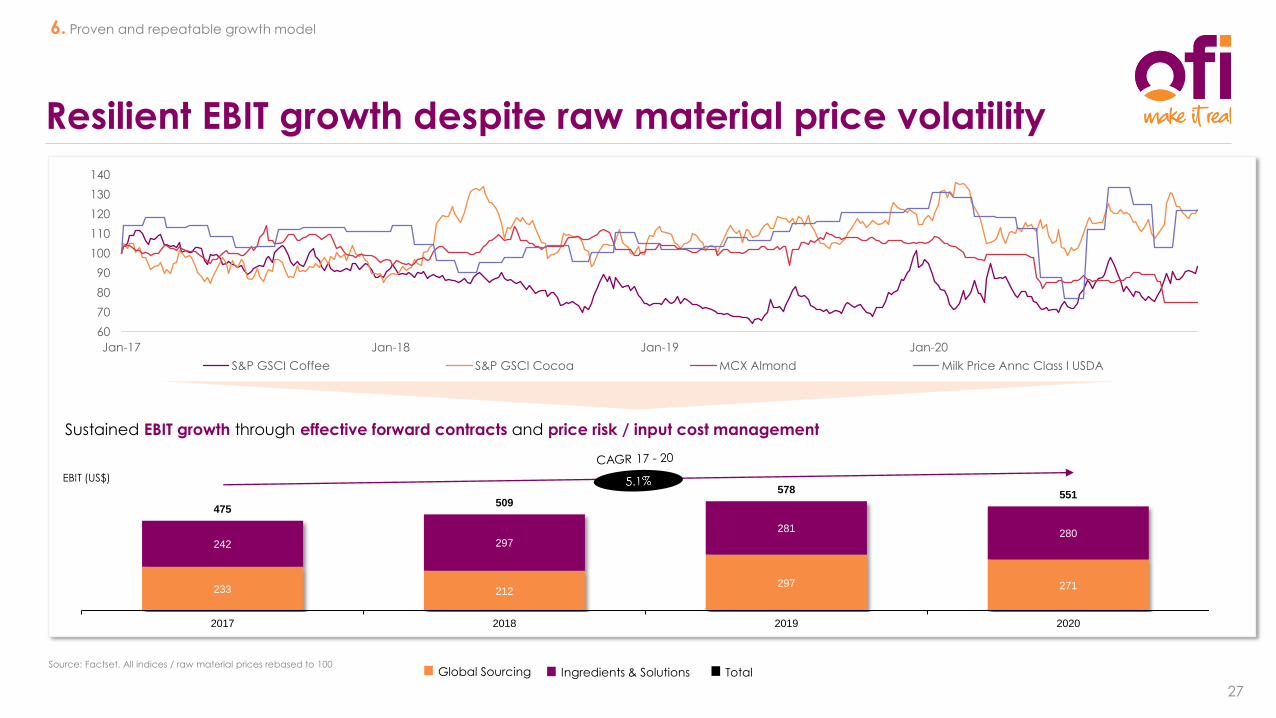
Resilient EBIT growth despite raw material price volatility
EBIT (US$)
Ingredients & SolutionsGlobal Sourcing Total
6. Proven and repeatable growth model
27
60
70
80
90
100
110
120
130
140
Jan-17 Jan-18 Jan-19 Jan-20
S&P GSCI Coffee S&P GSCI Cocoa MCX Almond Milk Price Annc Class I USDA
Source: Factset. All indices / raw material prices rebased to 100
233 212297 271
242 297
281 280
475509
578551
0
100
200
300
400
500
600
700
2017 2018 2019 2020
Sustained EBIT growth through effective forward contracts and price risk / input cost management
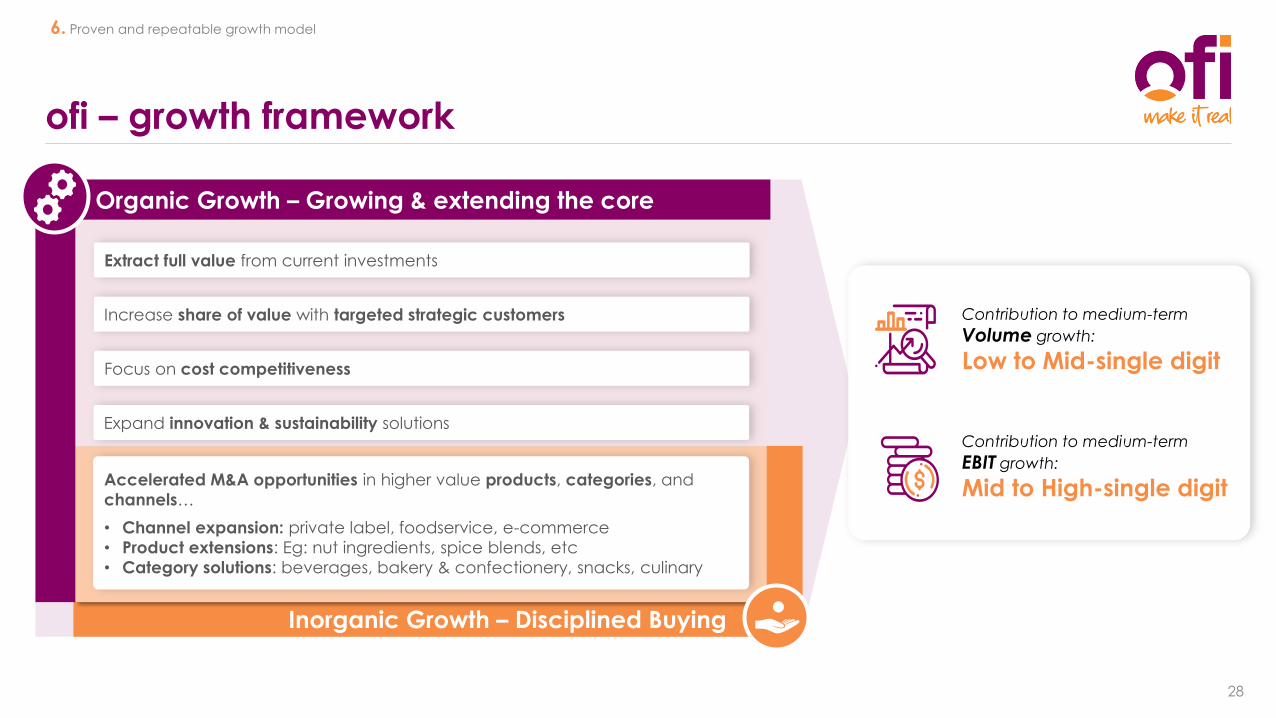
ofi – growth framework
28
Inorganic Growth – Disciplined Buying
Organic Growth – Growing & extending the core
Extract full value from current investments
Focus on cost competitiveness
Increase share of value with targeted strategic customers
Expand innovation & sustainability solutions
Accelerated M&A opportunities in higher value products, categories, and
channels…
• Channel expansion: private label, foodservice, e-commerce
• Product extensions: Eg: nut ingredients, spice blends, etc
• Category solutions: beverages, bakery & confectionery, snacks, culinary
Contribution to medium-term
Volume growth:
Low to Mid-single digit
Contribution to medium-term
EBIT growth:
Mid to High-single digit
6. Proven and repeatable growth model
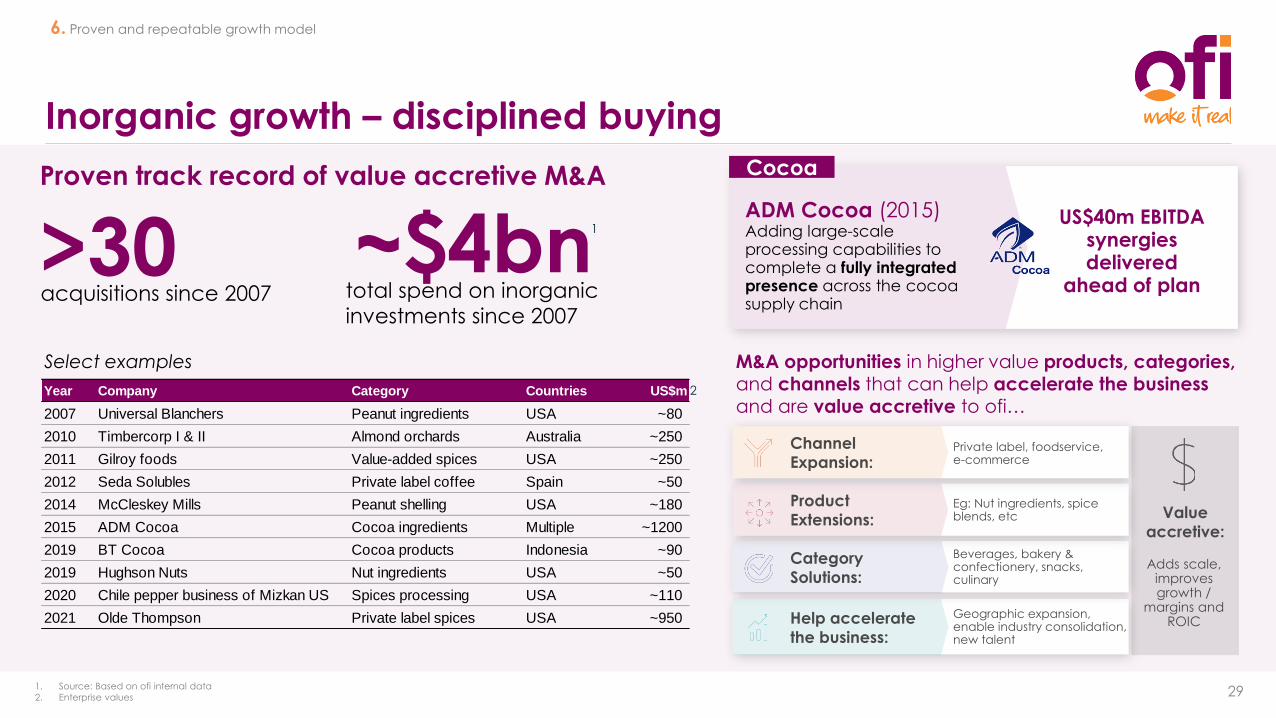
Inorganic growth – disciplined buying
29
>30acquisitions since 2007
Proven track record of value accretive M&A
~$4bntotal spend on inorganic
investments since 2007
1. Source: Based on ofi internal data
2. Enterprise values
2
1
6. Proven and repeatable growth model
ADM Cocoa (2015)Adding large-scale processing capabilities to complete a fully integrated presence across the cocoa supply chain
Cocoa
US$40m EBITDA synergies delivered
ahead of plan
M&A opportunities in higher value products, categories, and channels that can help accelerate the businessand are value accretive to ofi…
2
Value
accretive:
Adds scale, improves growth /
margins and ROIC Help accelerate
the business:
Geographic expansion, enable industry consolidation, new talent
Category
Solutions:
Beverages, bakery & confectionery, snacks, culinary
Product
Extensions:Eg: Nut ingredients, spice blends, etc
Channel
Expansion:Private label, foodservice, e-commerce
Select examples
Year Company Category Countries US$m
2007 Universal Blanchers Peanut ingredients USA ~80
2010 Timbercorp I & II Almond orchards Australia ~250
2011 Gilroy foods Value-added spices USA ~250
2012 Seda Solubles Private label coffee Spain ~50
2014 McCleskey Mills Peanut shelling USA ~180
2015 ADM Cocoa Cocoa ingredients Multiple ~1200
2019 BT Cocoa Cocoa products Indonesia ~90
2019 Hughson Nuts Nut ingredients USA ~50
2020 Chile pepper business of Mizkan US Spices processing USA ~110
2021 Olde Thompson Private label spices USA ~950
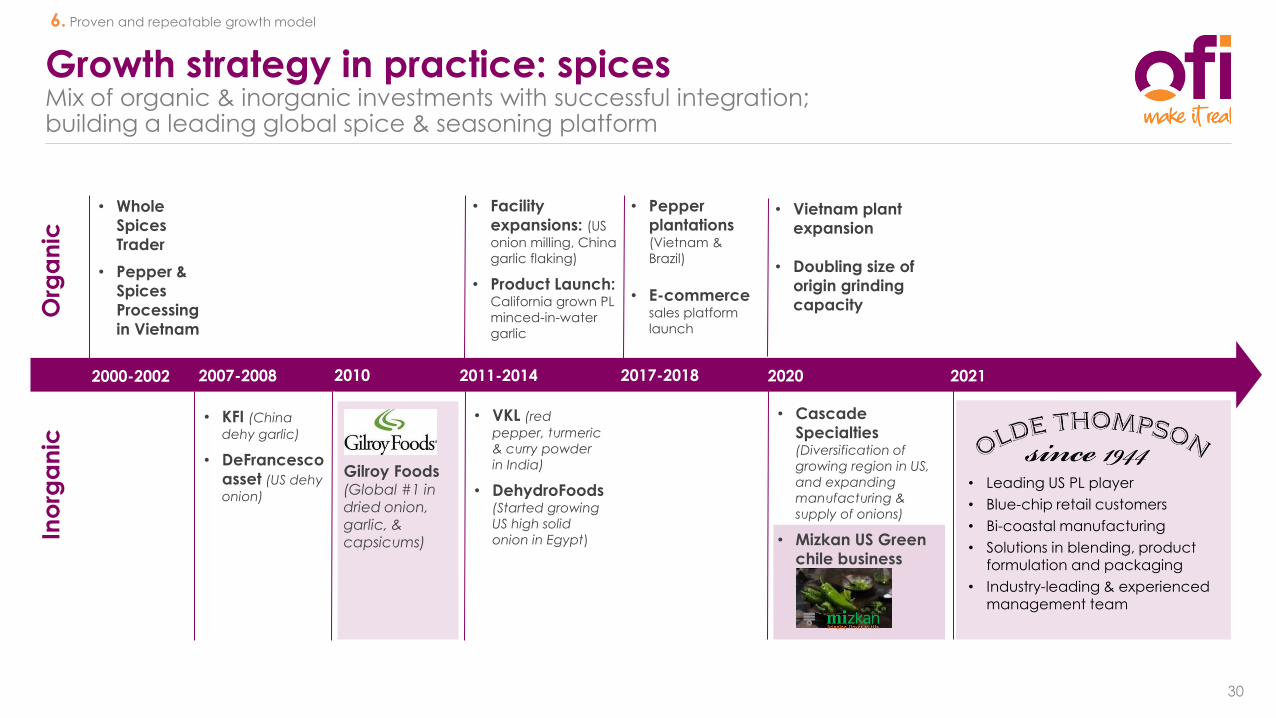
Growth strategy in practice: spices Mix of organic & inorganic investments with successful integration; building a leading global spice & seasoning platform
30
Org
an
icIn
org
an
ic
2000-2002
• Whole
Spices
Trader
• Pepper &
Spices
Processing
in Vietnam
2007-2008
• KFI (China
dehy garlic)
• DeFrancesco
asset (US dehy
onion)
2011-2014 2017-2018
• VKL (red
pepper, turmeric
& curry powder
in India)
• DehydroFoods (Started growing
US high solid
onion in Egypt)
• Facility
expansions: (US
onion milling, China
garlic flaking)
• Product Launch:California grown PL
minced-in-water
garlic
• Pepper
plantations (Vietnam &
Brazil)
• E-commerce sales platform
launch
• Leading US PL player
• Blue-chip retail customers
• Bi-coastal manufacturing
• Solutions in blending, product formulation and packaging
• Industry-leading & experienced management team
20212020
• Vietnam plant
expansion
• Doubling size of
origin grinding
capacity
2010
Gilroy Foods(Global #1 in dried onion, garlic, & capsicums)
• Cascade
Specialties (Diversification of
growing region in US,
and expanding
manufacturing &
supply of onions)
• Mizkan US Green
chile business
6. Proven and repeatable growth model
Key takeaways
31
… serving large, attractive and
growing end-use categories…
… delivering global, innovative and integrated solutions...
... with a proven and repeatable
growth model
… by being a trusted partner to a
diversified customer base…
… delivered by an experienced,
global, and inspired talent pool…
… offering end-to-end traceability
and sustainability impact...
Leading on-trend ingredients portfolio…
…

Please visit our “Unleash natural potential” series
https://www.ofiexperience.com/