Embed Size (px)
Citation preview
Ohio RPS, EE and DR Mandates
Facilitated Dialogue:
Market Restructuring & Renewable
Energy
June 10-12, 2013
Mexico City, Mexico
Hisham Choueiki, Ph.D., P.E.
Department of Energy and Environment
Public Utilities Commission of Ohio
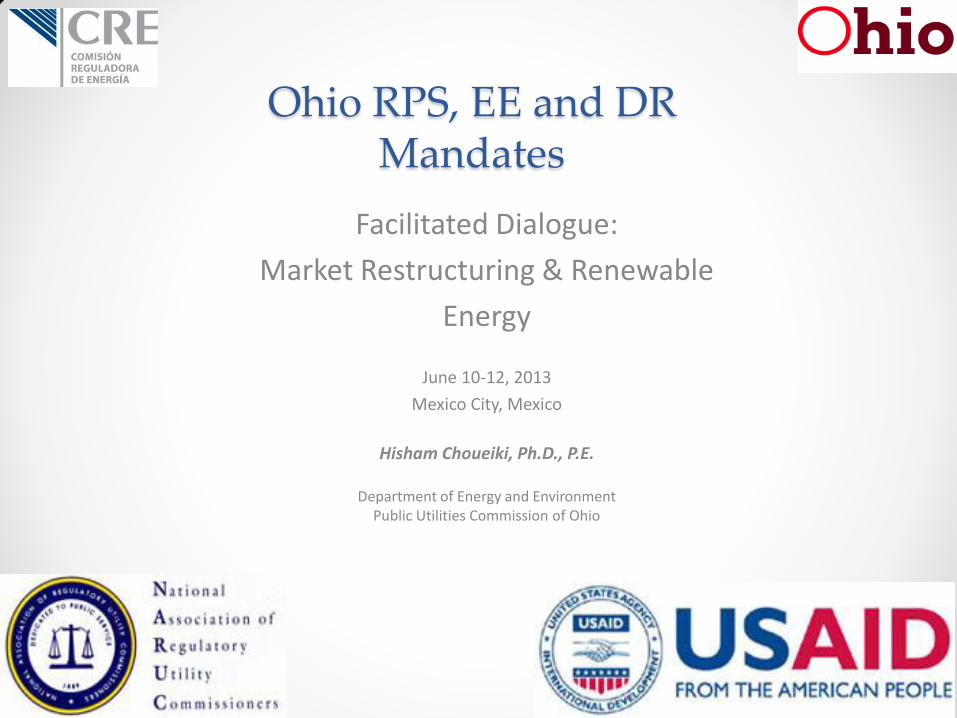
Ohio Alternative Energy Portfolio Standard
25% by 2025
• 25% of retail electricity sold by:
o Ohio’s electric distribution utilities – American
Electric Power, Dayton Power & Light, Duke Energy,
and First Energy, or;
o Competitive electric service companies
• Must be generated from alternative sources:
o Renewable energy sources
o Advanced energy technology
2
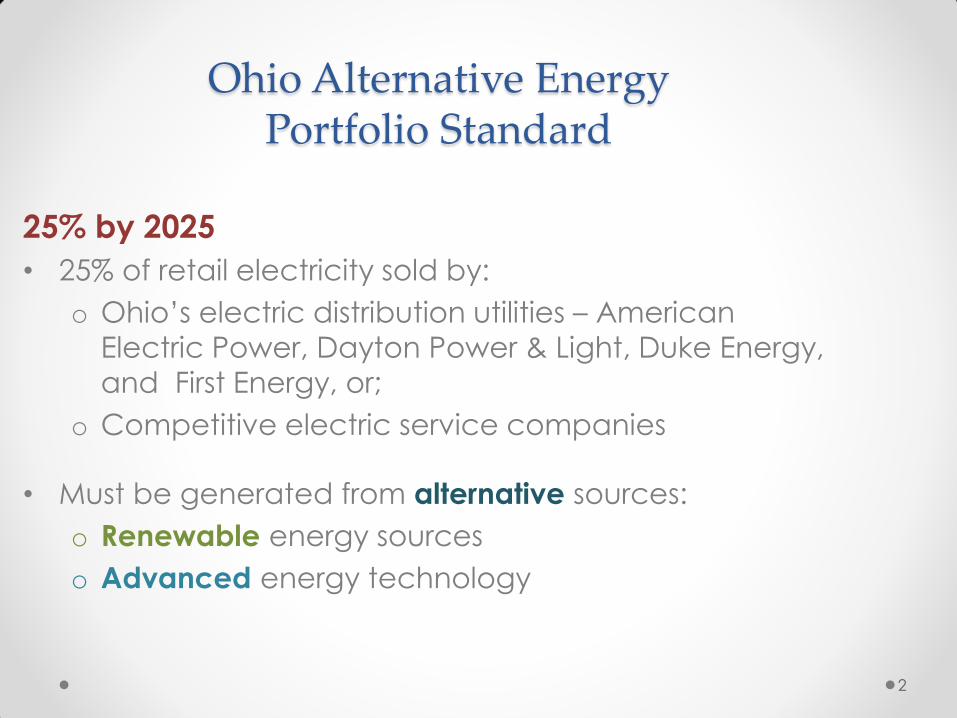
SB 221
25% (of total kWh) by 2025
• 12.5% may be from advanced energy
resources
• At least 12.5% from renewable, .5% solar
• At least 6.25% from renewable facilities
located in the state, remainder deliverable
• Compliance payments/forfeitures
3

Renewable Portfolio Standard Policies..
www.dsireusa.org / February 2013.
29 states,+ Washington DC and 2
territories,have Renewable Portfolio
Standards (8 states and 2 territories have
renewable portfolio goals).
4

Renewable Portfolio Standard Policies
with Solar / Distributed Generation Provisions.
www.dsireusa.org / February 2013.
16 states,+ Washington DC have Renewable Portfolio Standards with Solar and/or Distributed
Generation provisions
5

6
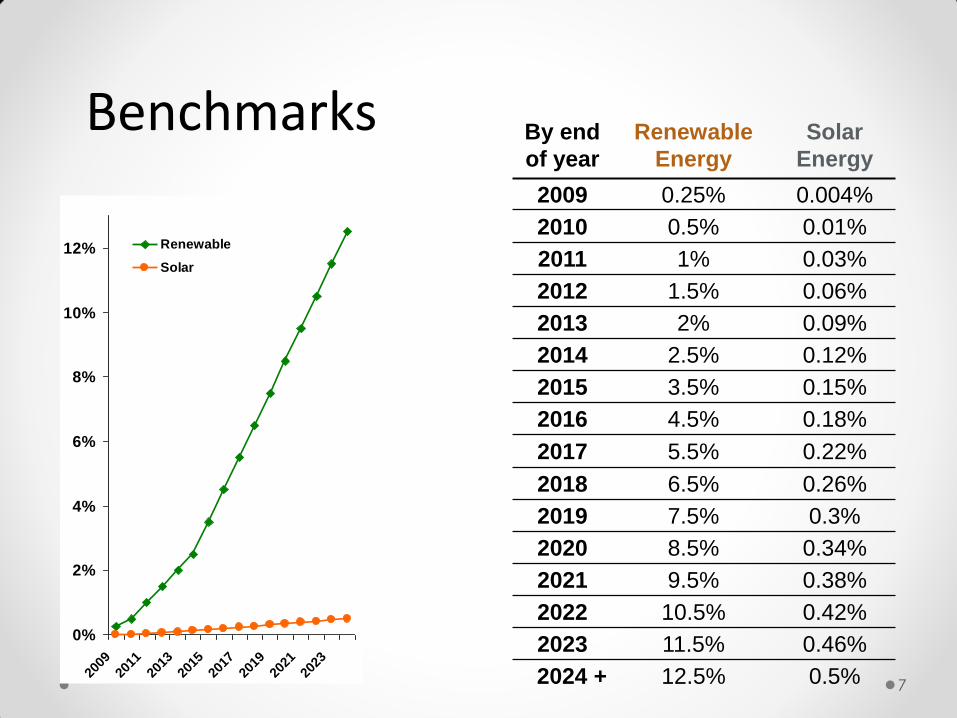
By end
of year
Renewable
Energy
Solar
Energy
2009 0.25% 0.004%
2010 0.5% 0.01%
2011 1% 0.03%
2012 1.5% 0.06%
2013 2% 0.09%
2014 2.5% 0.12%
2015 3.5% 0.15%
2016 4.5% 0.18%
2017 5.5% 0.22%
2018 6.5% 0.26%
2019 7.5% 0.3%
2020 8.5% 0.34%
2021 9.5% 0.38%
2022 10.5% 0.42%
2023 11.5% 0.46%
2024 + 12.5% 0.5%
Benchmarks
0%
2%
4%
6%
8%
10%
12%
2009
2011
2013
2015
2017
2019
2021
2023
Renewable
Solar
7
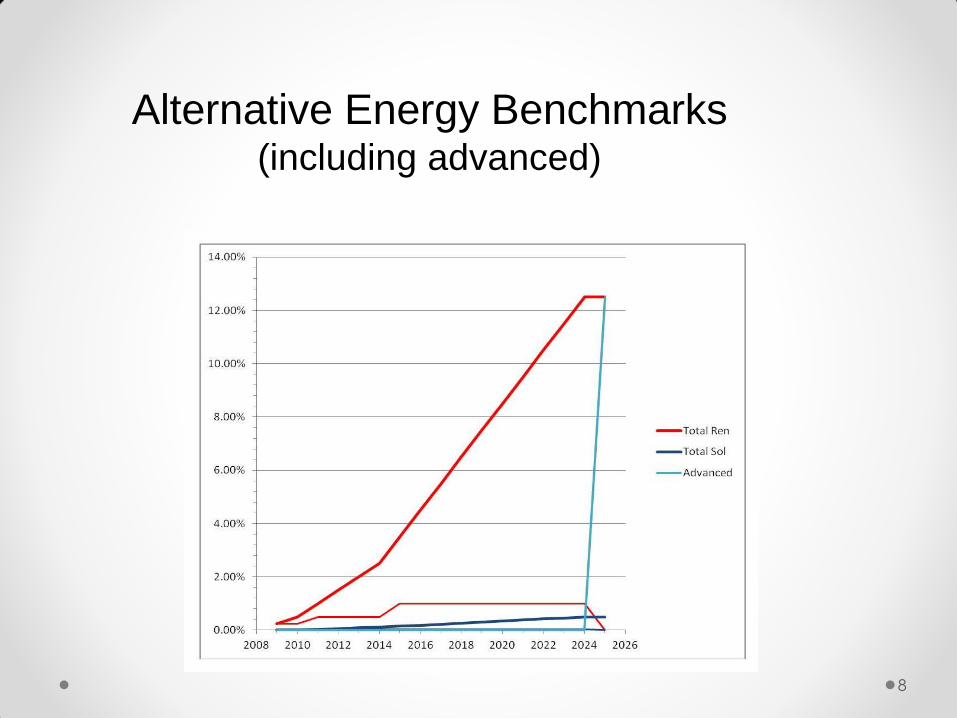
Alternative Energy Benchmarks (including advanced)
8
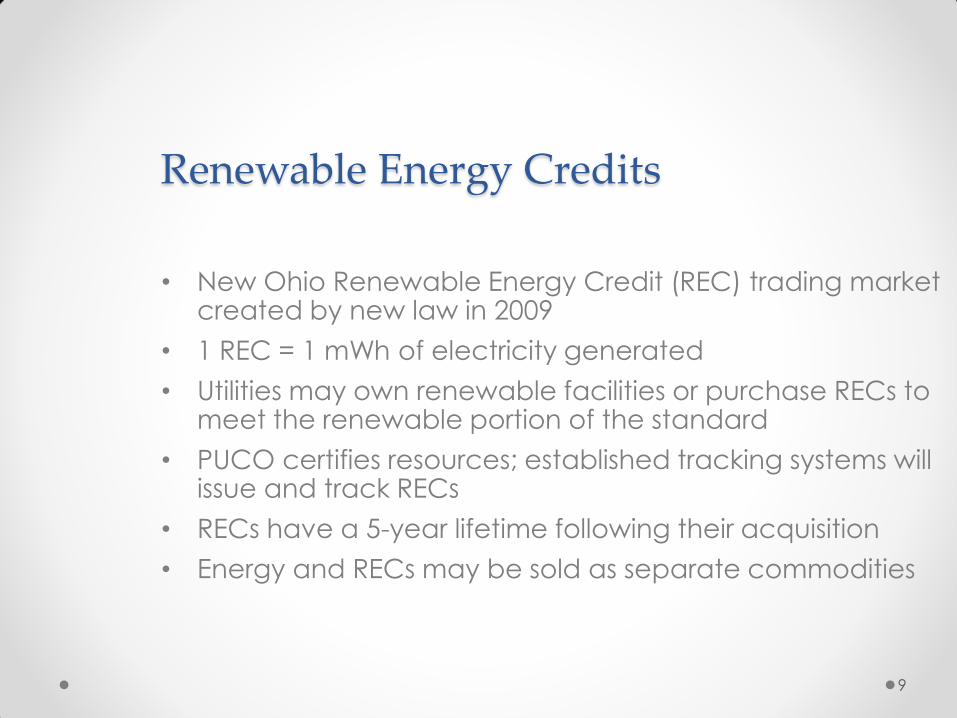
Renewable Energy Credits
• New Ohio Renewable Energy Credit (REC) trading market created by new law in 2009
• 1 REC = 1 mWh of electricity generated
• Utilities may own renewable facilities or purchase RECs to meet the renewable portion of the standard
• PUCO certifies resources; established tracking systems will issue and track RECs
• RECs have a 5-year lifetime following their acquisition
• Energy and RECs may be sold as separate commodities
9

Compliance Payments
Utilities and electric service companies subject to
compliance payments if annual renewable and solar
benchmarks are not met.
Non Solar: • Started at $45/mWh in 2009
• 2012 compliance payment was $47.56/MWh
Solar: • $450/mWh in 2009 and declines over time
• 2012 compliance payment was $350/MWh for solar
Exceptions: force majeure; 3% cost cap
10
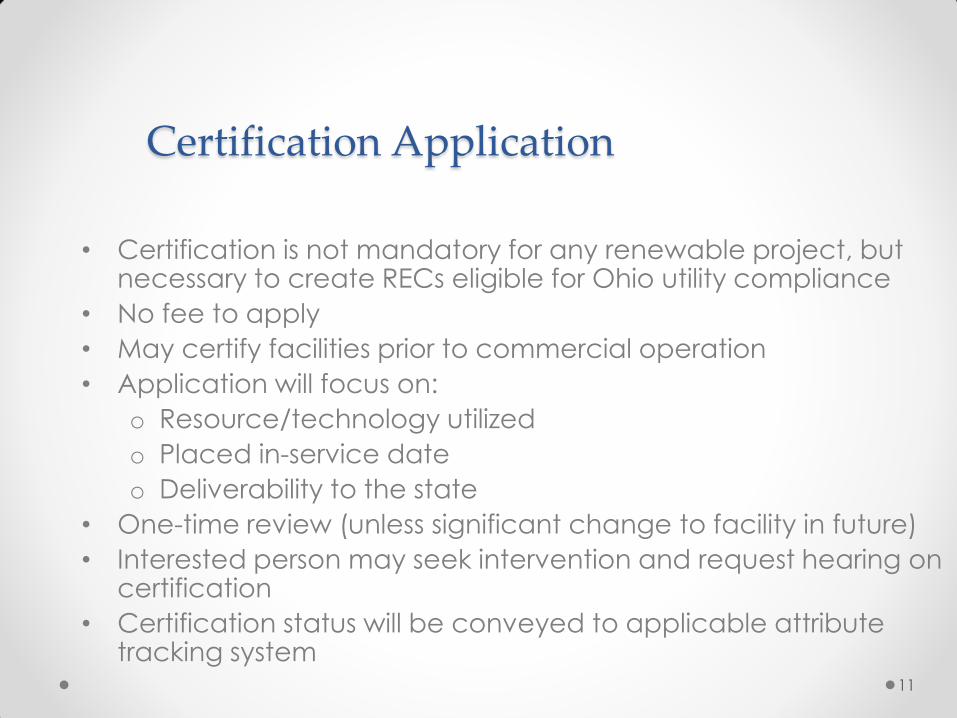
Certification Application
• Certification is not mandatory for any renewable project, but necessary to create RECs eligible for Ohio utility compliance
• No fee to apply
• May certify facilities prior to commercial operation
• Application will focus on:
o Resource/technology utilized
o Placed in-service date
o Deliverability to the state
• One-time review (unless significant change to facility in future)
• Interested person may seek intervention and request hearing on certification
• Certification status will be conveyed to applicable attribute tracking system
11
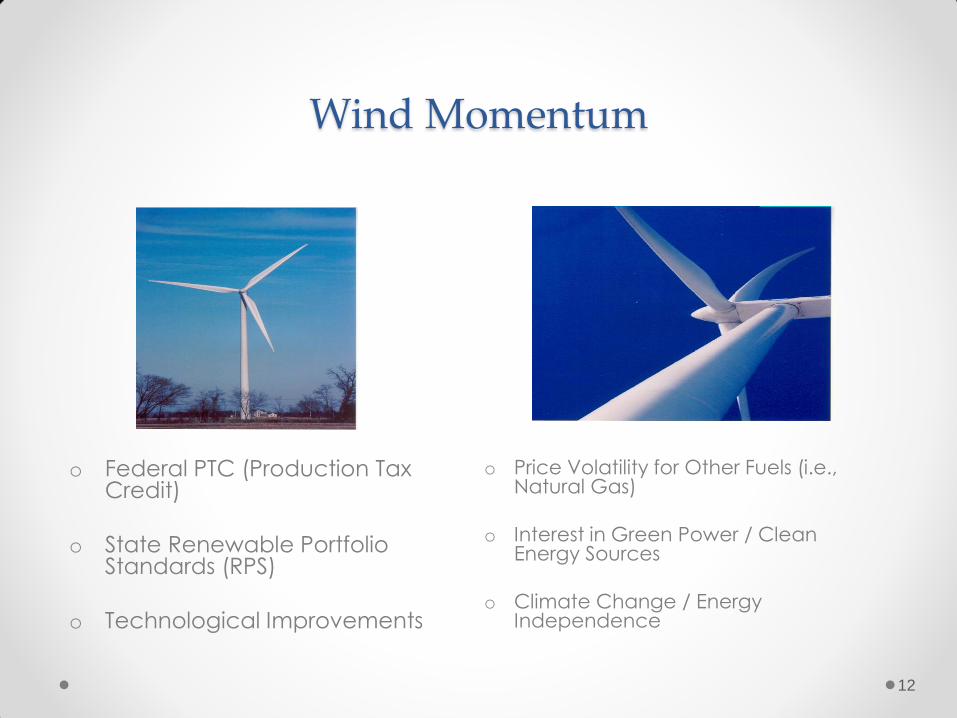
Wind Momentum
o Federal PTC (Production Tax Credit)
o State Renewable Portfolio
Standards (RPS)
o Technological Improvements
o Price Volatility for Other Fuels (i.e., Natural Gas)
o Interest in Green Power / Clean Energy Sources
o Climate Change / Energy Independence
12

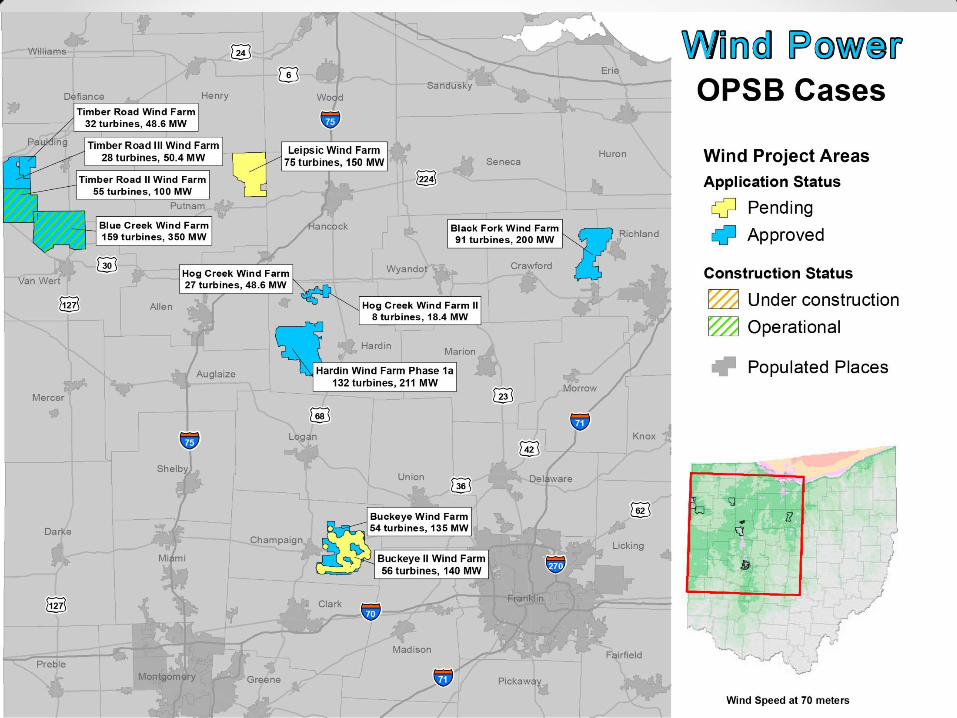
Wind farms in Ohio can help
provide renewable resources
to meet Ohio’s Alternative Energy Portfolio Standards
But Also: A small wind generator owned by a retail customer may enable the customer to use a renewable resource to offset his electrical demand and potentially earn a credit for net metering on his electric bill.
13

14
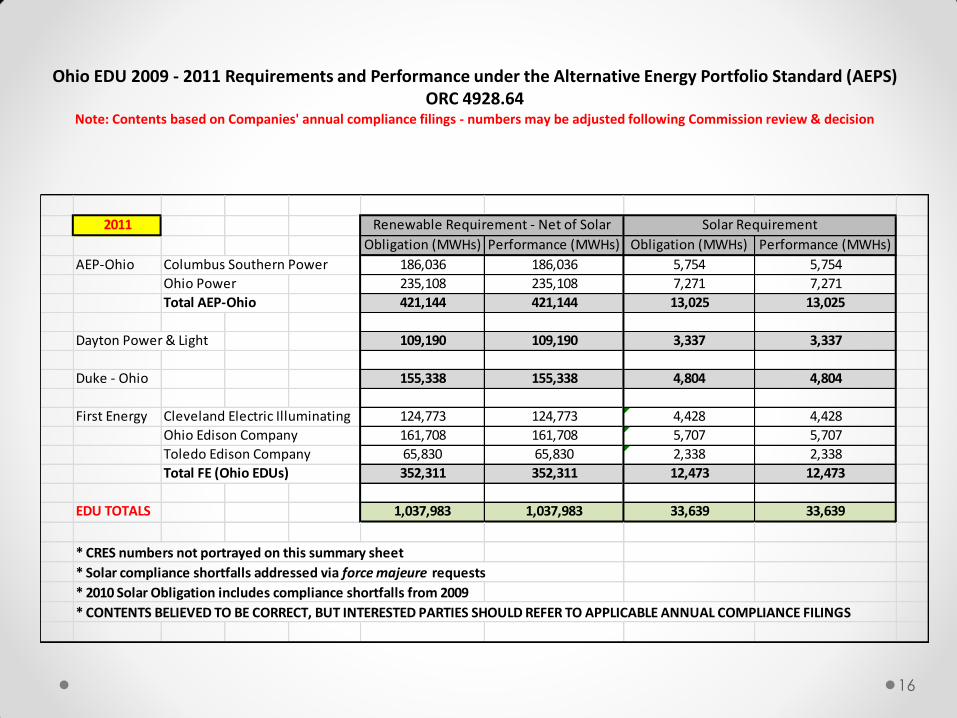
Ohio EDU 2009 - 2011 Requirements and Performance under the Alternative Energy Portfolio Standard (AEPS) ORC 4928.64
Note: Contents based on Companies' annual compliance filings - numbers may be adjusted following Commission review & decision
2011 Renewable Requirement - Net of Solar Solar Requirement
Obligation (MWHs) Performance (MWHs) Obligation (MWHs) Performance (MWHs)
AEP-Ohio Columbus Southern Power 186,036 186,036 5,754 5,754
Ohio Power 235,108 235,108 7,271 7,271
Total AEP-Ohio 421,144 421,144 13,025 13,025
Dayton Power & Light 109,190 109,190 3,337 3,337
Duke - Ohio 155,338 155,338 4,804 4,804
First Energy Cleveland Electric Illuminating 124,773 124,773 4,428 4,428
Ohio Edison Company 161,708 161,708 5,707 5,707
Toledo Edison Company 65,830 65,830 2,338 2,338
Total FE (Ohio EDUs) 352,311 352,311 12,473 12,473
EDU TOTALS 1,037,983 1,037,983 33,639 33,639
* CRES numbers not portrayed on this summary sheet
* Solar compliance shortfalls addressed via force majeure requests
* 2010 Solar Obligation includes compliance shortfalls from 2009
* CONTENTS BELIEVED TO BE CORRECT, BUT INTERESTED PARTIES SHOULD REFER TO APPLICABLE ANNUAL COMPLIANCE FILINGS
16

Advanced Energy Resources
• Clean coal • Advanced Nuclear • Fuel cells • Customer co-generation • Advanced solid waste conversion • Utility generation plant or demand-side management
efficiency measures • Uprated capacity of an existing electric generating
facility resulting from the deployment of advanced technology
• Any new, retrofitted, refueled or repowered generating facility in Ohio
• Note: RECs are not created from advanced resources
17
Energy Efficiency and Demand Reduction Benchmarks - SB 221 (OAC 4901:1-39)
• Establishes requirements and processes to determine specific benchmarks for energy efficiency and peak reduction programs
• Establishes energy usage and demand baselines for measuring annual energy savings and demand reductions
• Provides mechanisms by which investments achieve energy savings and demand reductions by mercantile customers in their own facilities and can be recognized in electric utility programs as contributing to specific levels of energy savings and demand reductions.
18
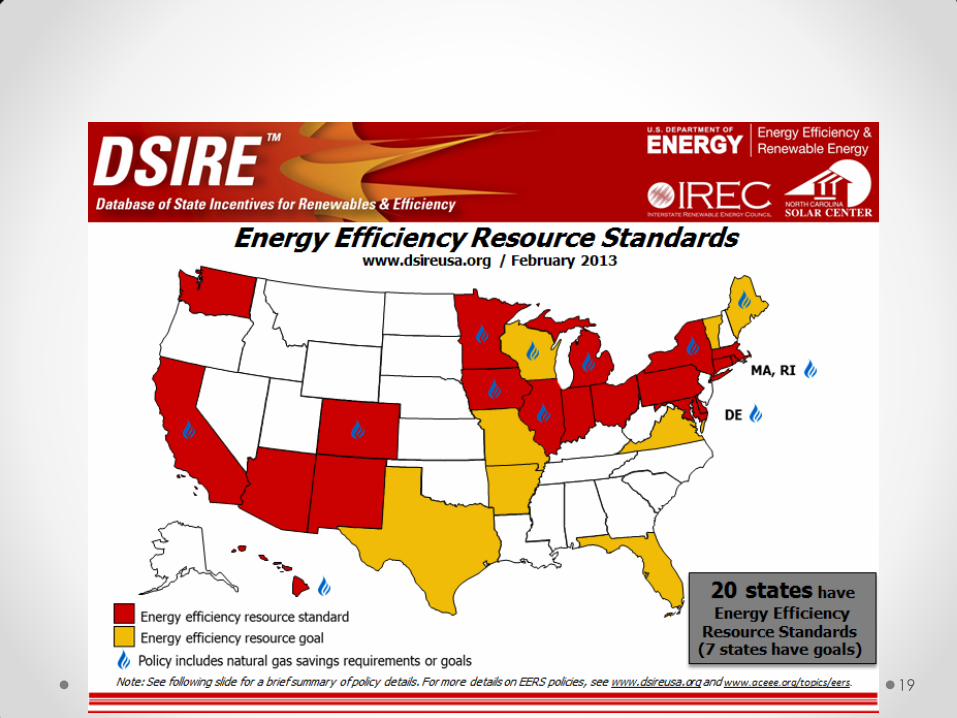
19
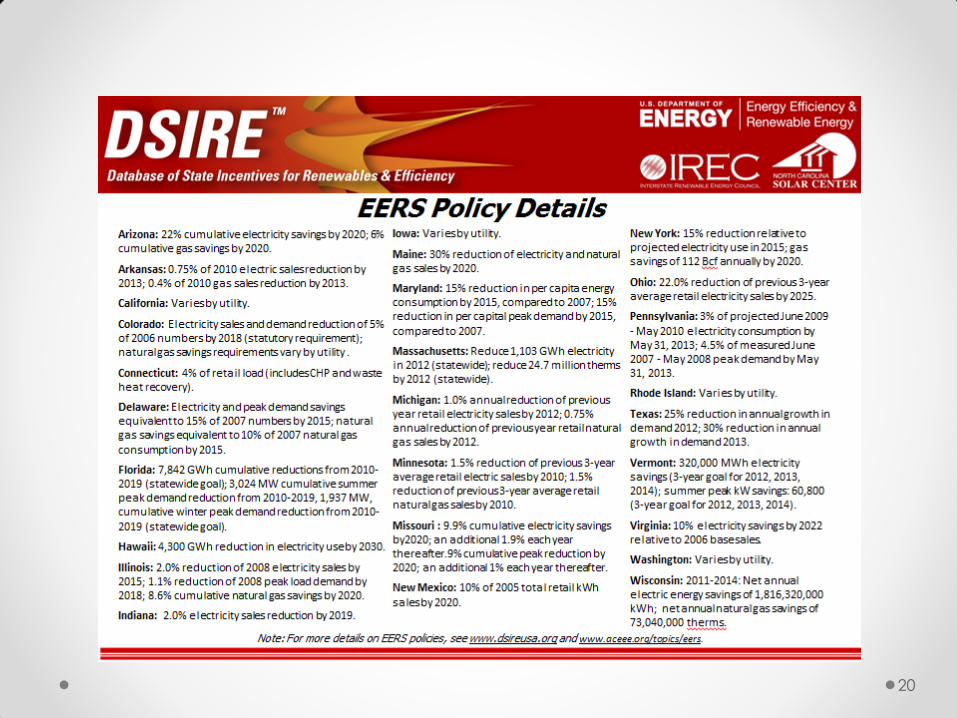
20
Energy Efficiency
Requirement
• 22% + Reduction by
2025
• Could result in annual
usage at 13.8 million
MWh below 2007
Peak Demand Reduction Standard
• 7.75% by 2018
• Tariffs and special contracts available to commit the demand reduction
• Customers enrolled in RTO demand response programs are counted if customer commits the peak demand reduction
21

Peak Demand Reduction and Energy Efficiency Benchmarks
22

Peak Demand Reduction and Energy Efficiency Benchmarks
Each Electric Distribution Utility filed a report identifying
the 2009 baselines and benchmarks.
Each Electric Distribution Utility filed a program portfolio plan for energy efficiency and peak reduction programs.
Upon approval of the program portfolio plan, an Electric distribution utility may seek cost recovery.
Each year, on April 15, the Electric Distribution Utility must file a portfolio status report that demonstrates its compliance status with its benchmarks and provides an assessment of its performance.
23
Mercantile Customer Applications to commit Energy Efficiency and
Peak Demand Reduction
Ohio Administrative Code 4901:1-39-05(F)
o Permits a mercantile customer to file individually or jointly with
an electric utility, an application to commit the customer’s
existing demand reduction, demand response, and energy efficiency programs for integration with the utility’s program
o Expectation the mercantile customers were to be exempt
from the EE/PDR Rider of the tariff they are taking service
o Pilot Program adopted by the Commission for ease of application and administration
24

THANK YOU!