Embed Size (px)
Citation preview
OIG 11G R2 PS1 Training
OIM Performance Diagnostics
Oracle Proprietary - Restricted to Personal Use in an Oracle partner training class
1 | P a g e
OIG 11G R2 PS1 Field Enablement Training
Lab27_OIM Performance Diagnostics
Disclaimer: The Virtual Machine Image and other software are provided for use
only during the workshop. Please note that you are responsible for deleting
them from your computers before you leave. If you would like to try out any of
the Oracle products, you may download them from the Oracle Technology Net-
work (http://www.oracle.com/technology/index.html) or the Oracle E-Delivery
WebSite (http://edelivery.oracle.com)
OIG 11G R2 PS1 Training
OIM Performance Diagnostics
Oracle Proprietary - Restricted to Personal Use in an Oracle partner training class
2 | P a g e
Table of Contents
OIG 11G R2 PS1 Field Enablement Training .................................................................................................. 1
DMS metrics collection .............................................................................. Error! Bookmark not defined.
1. Introduction .......................................................................................................................................... 3
2. Run the Reconciliation to gather recon metrics ................................................................................... 3
3. Analyzing the Reconciliation DMS metrics ........................................................................................... 5
4. Dumping DMS metrics to file ................................................................................................................ 9
5. Creating Incident report ……………………………………………………………………………………………………………….11
6. Resetting the DMS metrics ……………………………………………………………………………………………………………13
7. Profile validation using EM ……………………………………………………………………………………………………………….14
OIG 11G R2 PS1 Training
OIM Performance Diagnostics
Oracle Proprietary - Restricted to Personal Use in an Oracle partner training class
3 | P a g e
1. Introduction
This lab shows how to look at the Dynamic Monitoring Service (DMS) metrics specifically for reconcilia-tion. DMS allow you to analyze the metrics for looking at the performance of OIM server components , event handler , scheduled jobs etc..
2. Run the Reconciliation to gather recon metrics
Note: Make sure to start the Admin Server and OIM Server.
We need to have some data with reconciliation to look at the metrics for reconciliation. Lets run the
OUD target reconciliation so that reconciliation events gets generated which will trigger the DMS met-
rics for reconciliation collected.
1. Open the SYSADMIN console in a new browser window.
2. Login as ADMIN or XELSYSADM.
3. Click on Scheduler under System Management.
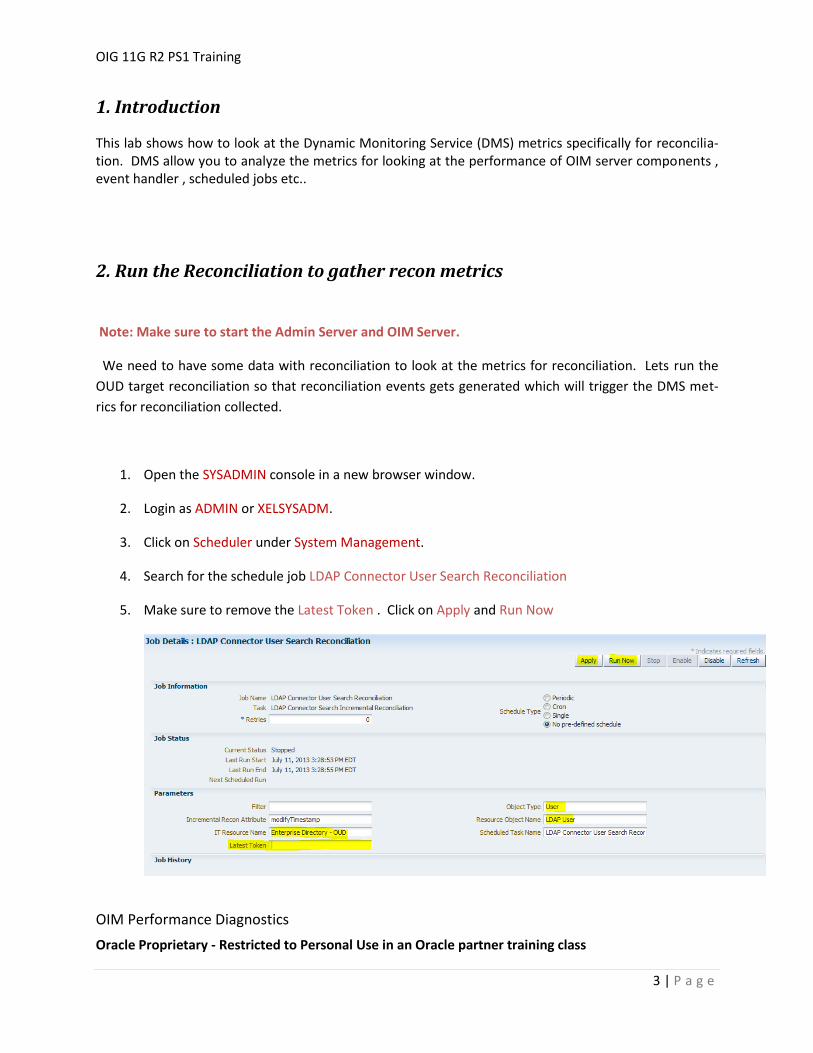
4. Search for the schedule job LDAP Connector User Search Reconciliation
5. Make sure to remove the Latest Token . Click on Apply and Run Now
OIG 11G R2 PS1 Training
OIM Performance Diagnostics
Oracle Proprietary - Restricted to Personal Use in an Oracle partner training class
4 | P a g e
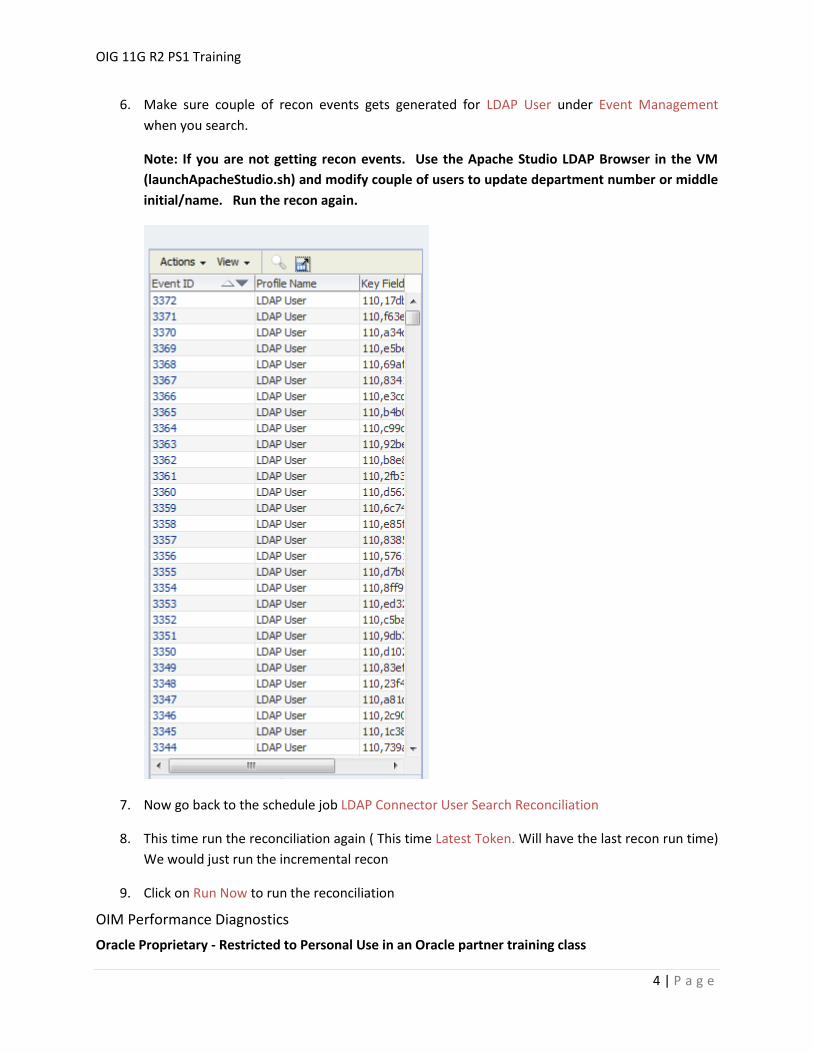
6. Make sure couple of recon events gets generated for LDAP User under Event Management
when you search.
Note: If you are not getting recon events. Use the Apache Studio LDAP Browser in the VM
(launchApacheStudio.sh) and modify couple of users to update department number or middle
initial/name. Run the recon again.
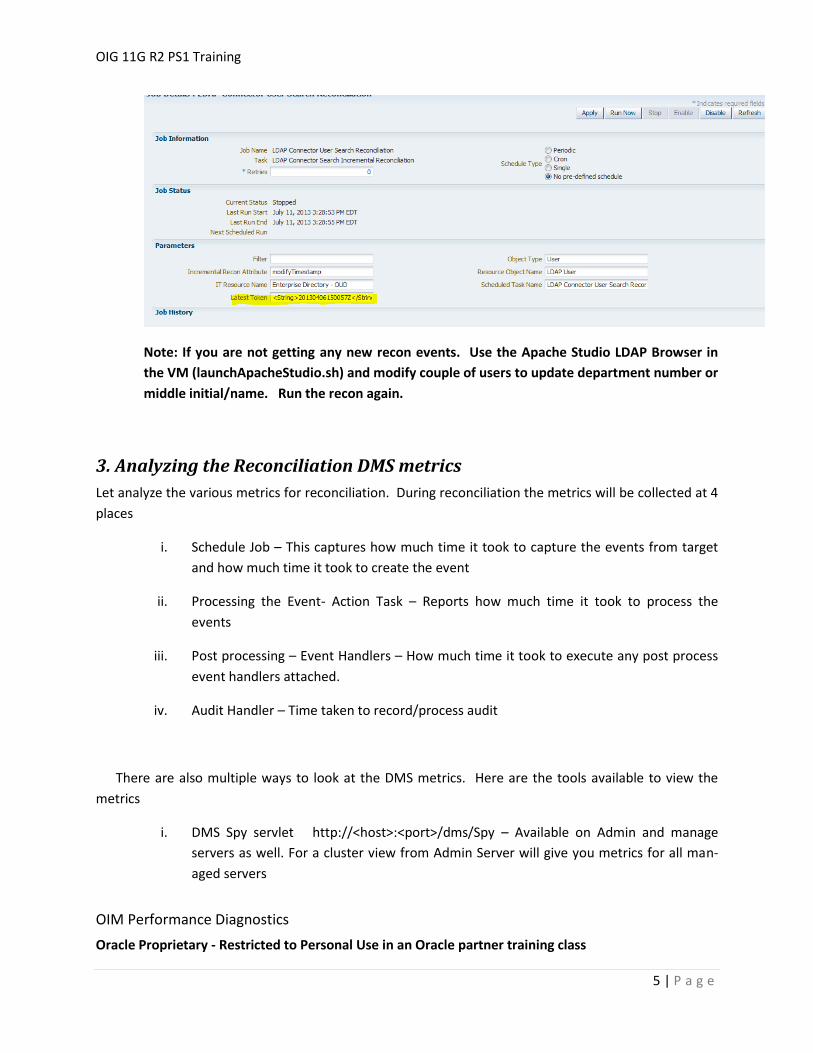
7. Now go back to the schedule job LDAP Connector User Search Reconciliation
8. This time run the reconciliation again ( This time Latest Token. Will have the last recon run time)
We would just run the incremental recon
9. Click on Run Now to run the reconciliation
OIG 11G R2 PS1 Training
OIM Performance Diagnostics
Oracle Proprietary - Restricted to Personal Use in an Oracle partner training class
5 | P a g e
Note: If you are not getting any new recon events. Use the Apache Studio LDAP Browser in
the VM (launchApacheStudio.sh) and modify couple of users to update department number or
middle initial/name. Run the recon again.
3. Analyzing the Reconciliation DMS metrics
Let analyze the various metrics for reconciliation. During reconciliation the metrics will be collected at 4
places
i. Schedule Job – This captures how much time it took to capture the events from target
and how much time it took to create the event
ii. Processing the Event- Action Task – Reports how much time it took to process the
events
iii. Post processing – Event Handlers – How much time it took to execute any post process
event handlers attached.
iv. Audit Handler – Time taken to record/process audit
There are also multiple ways to look at the DMS metrics. Here are the tools available to view the
metrics
i. DMS Spy servlet http://<host>:<port>/dms/Spy – Available on Admin and manage
servers as well. For a cluster view from Admin Server will give you metrics for all man-
aged servers
OIG 11G R2 PS1 Training
OIM Performance Diagnostics
Oracle Proprietary - Restricted to Personal Use in an Oracle partner training class
6 | P a g e
ii. WebLogic Diagnostic Framework (WLDF)
iii. WLST commands
iv. Jconsole
v. Enterprise Manager
vi. WSADMIN ( For IBM WebSphere)
We will use the dms spy servlet to view the metrics. The URL will be
http://identity.oracleads.com:7001/dms
Schedule Job Metrics:
This metrics gives information about the time taken by the schedule job to connect and pull data
from the target system as well as the time taken by the schedule job to create the events.
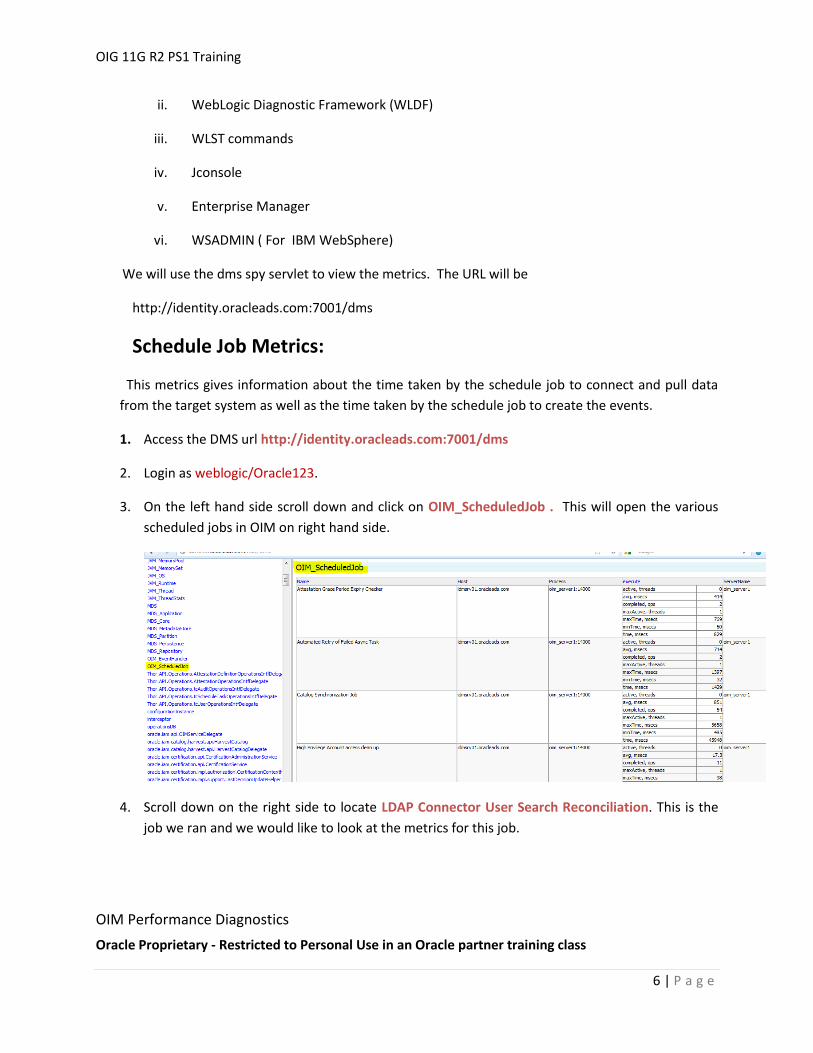
1. Access the DMS url http://identity.oracleads.com:7001/dms
2. Login as weblogic/Oracle123.
3. On the left hand side scroll down and click on OIM_ScheduledJob . This will open the various
scheduled jobs in OIM on right hand side.
4. Scroll down on the right side to locate LDAP Connector User Search Reconciliation. This is the
job we ran and we would like to look at the metrics for this job.
OIG 11G R2 PS1 Training
OIM Performance Diagnostics
Oracle Proprietary - Restricted to Personal Use in an Oracle partner training class
7 | P a g e
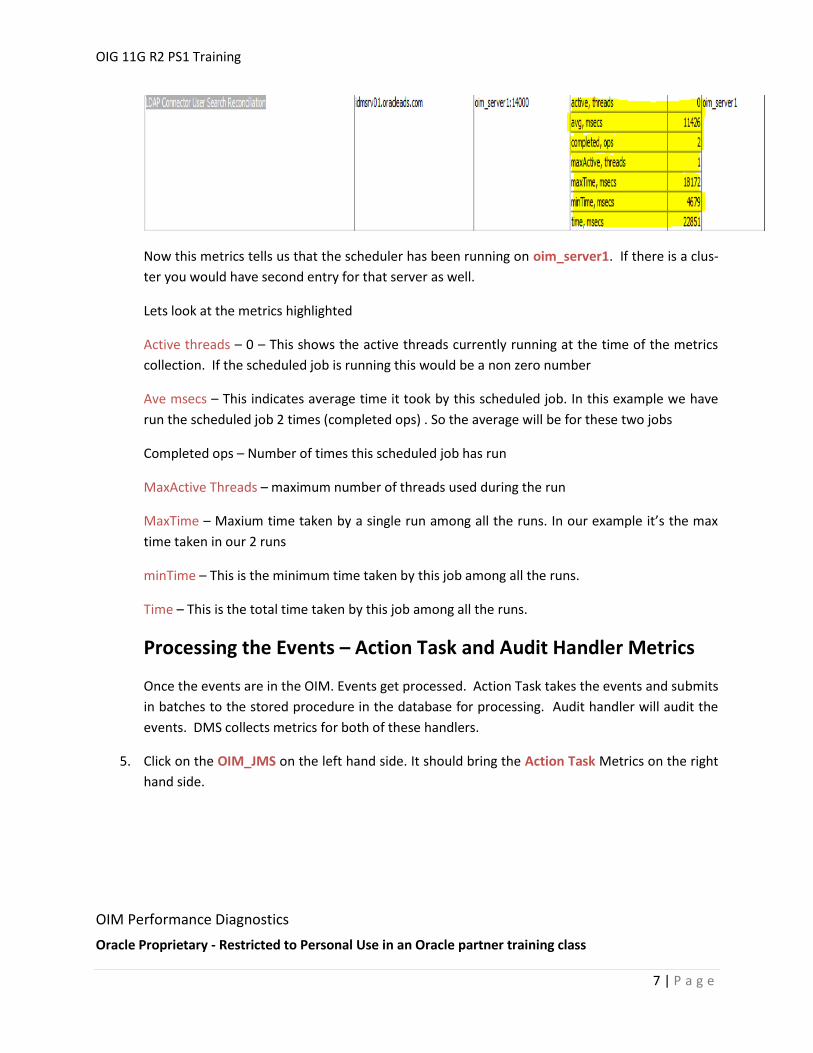
Now this metrics tells us that the scheduler has been running on oim_server1. If there is a clus-
ter you would have second entry for that server as well.
Lets look at the metrics highlighted
Active threads – 0 – This shows the active threads currently running at the time of the metrics
collection. If the scheduled job is running this would be a non zero number
Ave msecs – This indicates average time it took by this scheduled job. In this example we have
run the scheduled job 2 times (completed ops) . So the average will be for these two jobs
Completed ops – Number of times this scheduled job has run
MaxActive Threads – maximum number of threads used during the run
MaxTime – Maxium time taken by a single run among all the runs. In our example it’s the max
time taken in our 2 runs
minTime – This is the minimum time taken by this job among all the runs.
Time – This is the total time taken by this job among all the runs.
Processing the Events – Action Task and Audit Handler Metrics
Once the events are in the OIM. Events get processed. Action Task takes the events and submits
in batches to the stored procedure in the database for processing. Audit handler will audit the
events. DMS collects metrics for both of these handlers.
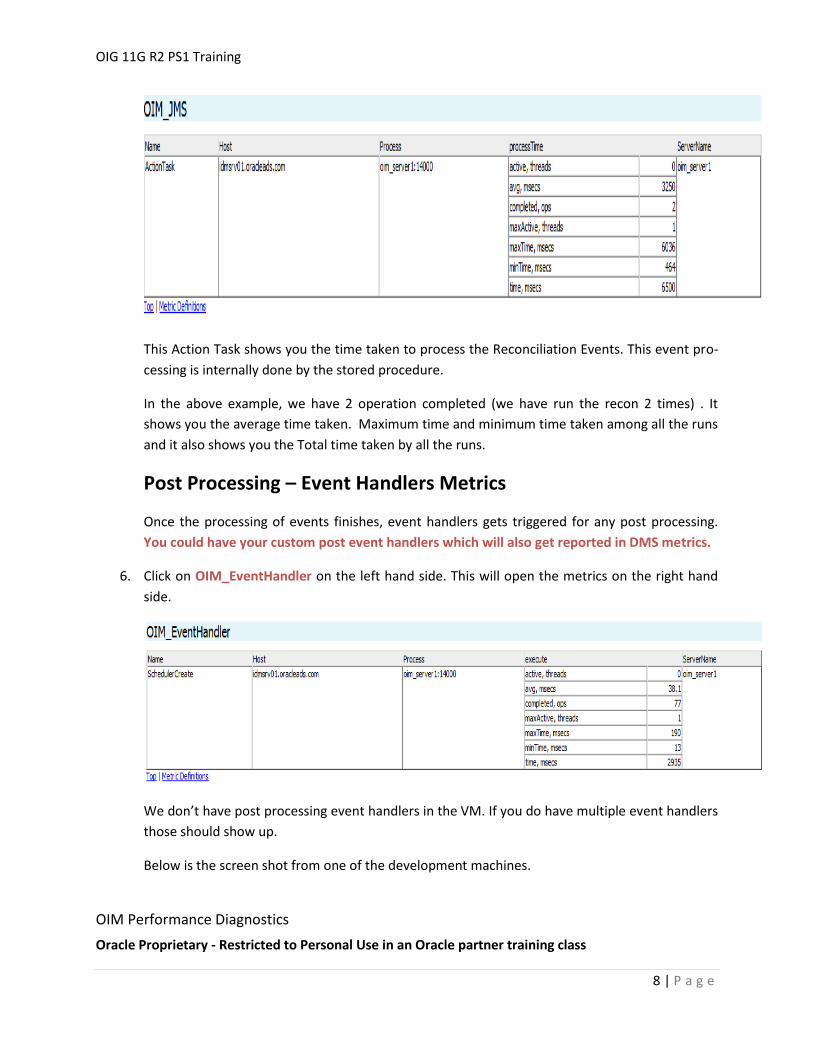
5. Click on the OIM_JMS on the left hand side. It should bring the Action Task Metrics on the right
hand side.
OIG 11G R2 PS1 Training
OIM Performance Diagnostics
Oracle Proprietary - Restricted to Personal Use in an Oracle partner training class
8 | P a g e
This Action Task shows you the time taken to process the Reconciliation Events. This event pro-
cessing is internally done by the stored procedure.
In the above example, we have 2 operation completed (we have run the recon 2 times) . It
shows you the average time taken. Maximum time and minimum time taken among all the runs
and it also shows you the Total time taken by all the runs.
Post Processing – Event Handlers Metrics
Once the processing of events finishes, event handlers gets triggered for any post processing.
You could have your custom post event handlers which will also get reported in DMS metrics.
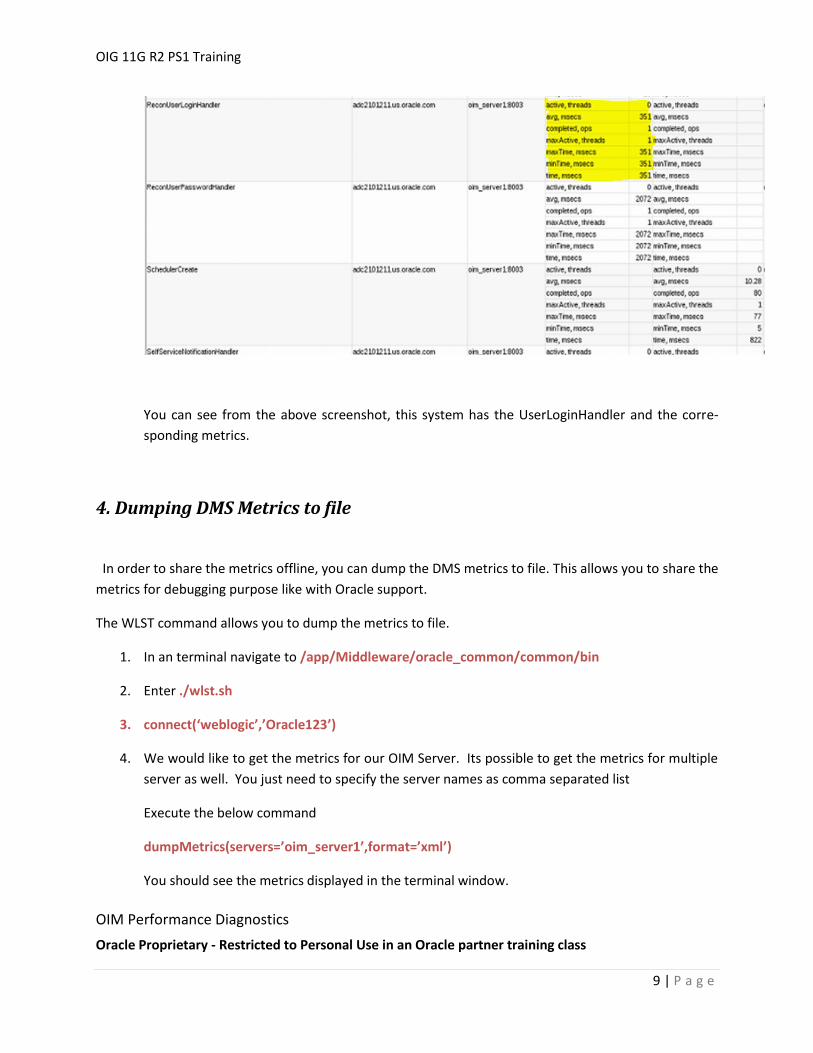
6. Click on OIM_EventHandler on the left hand side. This will open the metrics on the right hand
side.
We don’t have post processing event handlers in the VM. If you do have multiple event handlers
those should show up.
Below is the screen shot from one of the development machines.
OIG 11G R2 PS1 Training
OIM Performance Diagnostics
Oracle Proprietary - Restricted to Personal Use in an Oracle partner training class
9 | P a g e
You can see from the above screenshot, this system has the UserLoginHandler and the corre-
sponding metrics.
4. Dumping DMS Metrics to file
In order to share the metrics offline, you can dump the DMS metrics to file. This allows you to share the
metrics for debugging purpose like with Oracle support.
The WLST command allows you to dump the metrics to file.
1. In an terminal navigate to /app/Middleware/oracle_common/common/bin
2. Enter ./wlst.sh
3. connect(‘weblogic’,’Oracle123’)
4. We would like to get the metrics for our OIM Server. Its possible to get the metrics for multiple
server as well. You just need to specify the server names as comma separated list
Execute the below command
dumpMetrics(servers=’oim_server1’,format=’xml’)
You should see the metrics displayed in the terminal window.
OIG 11G R2 PS1 Training
OIM Performance Diagnostics
Oracle Proprietary - Restricted to Personal Use in an Oracle partner training class
10 | P a g e
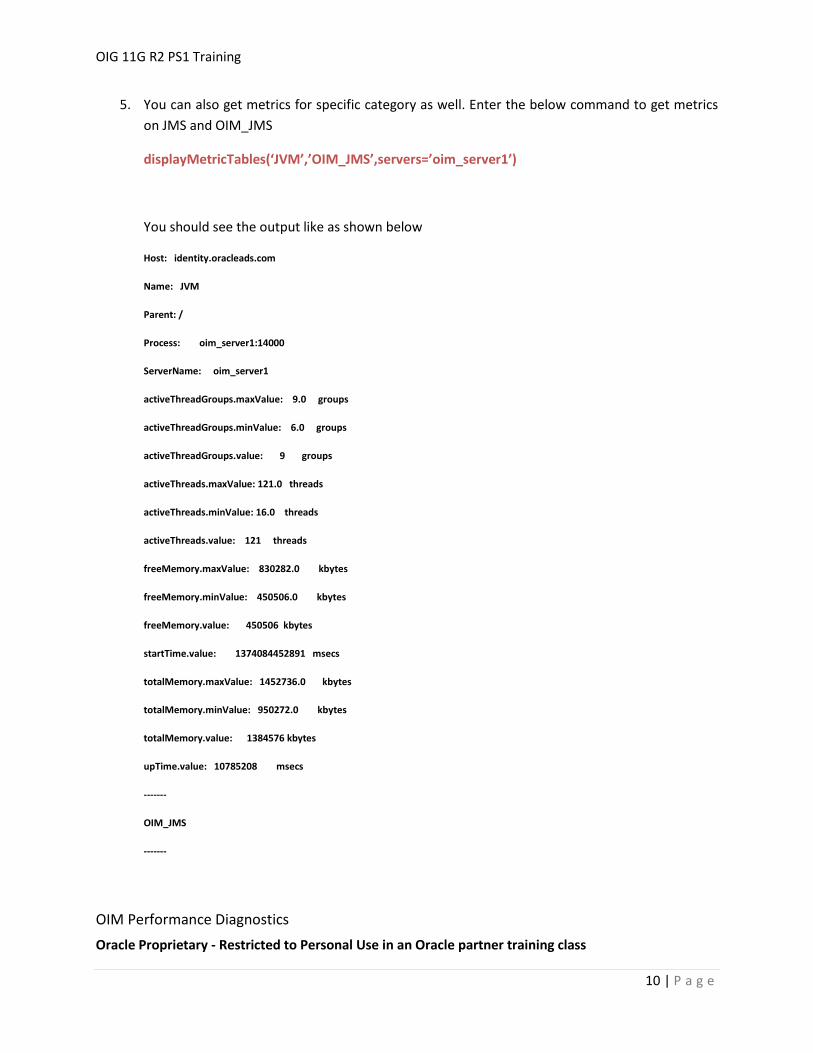
5. You can also get metrics for specific category as well. Enter the below command to get metrics
on JMS and OIM_JMS
displayMetricTables(‘JVM’,’OIM_JMS’,servers=’oim_server1’)
You should see the output like as shown below
Host: identity.oracleads.com
Name: JVM
Parent: /
Process: oim_server1:14000
ServerName: oim_server1
activeThreadGroups.maxValue: 9.0 groups
activeThreadGroups.minValue: 6.0 groups
activeThreadGroups.value: 9 groups
activeThreads.maxValue: 121.0 threads
activeThreads.minValue: 16.0 threads
activeThreads.value: 121 threads
freeMemory.maxValue: 830282.0 kbytes
freeMemory.minValue: 450506.0 kbytes
freeMemory.value: 450506 kbytes
startTime.value: 1374084452891 msecs
totalMemory.maxValue: 1452736.0 kbytes
totalMemory.minValue: 950272.0 kbytes
totalMemory.value: 1384576 kbytes
upTime.value: 10785208 msecs
-------
OIM_JMS
-------
OIG 11G R2 PS1 Training
OIM Performance Diagnostics
Oracle Proprietary - Restricted to Personal Use in an Oracle partner training class
11 | P a g e
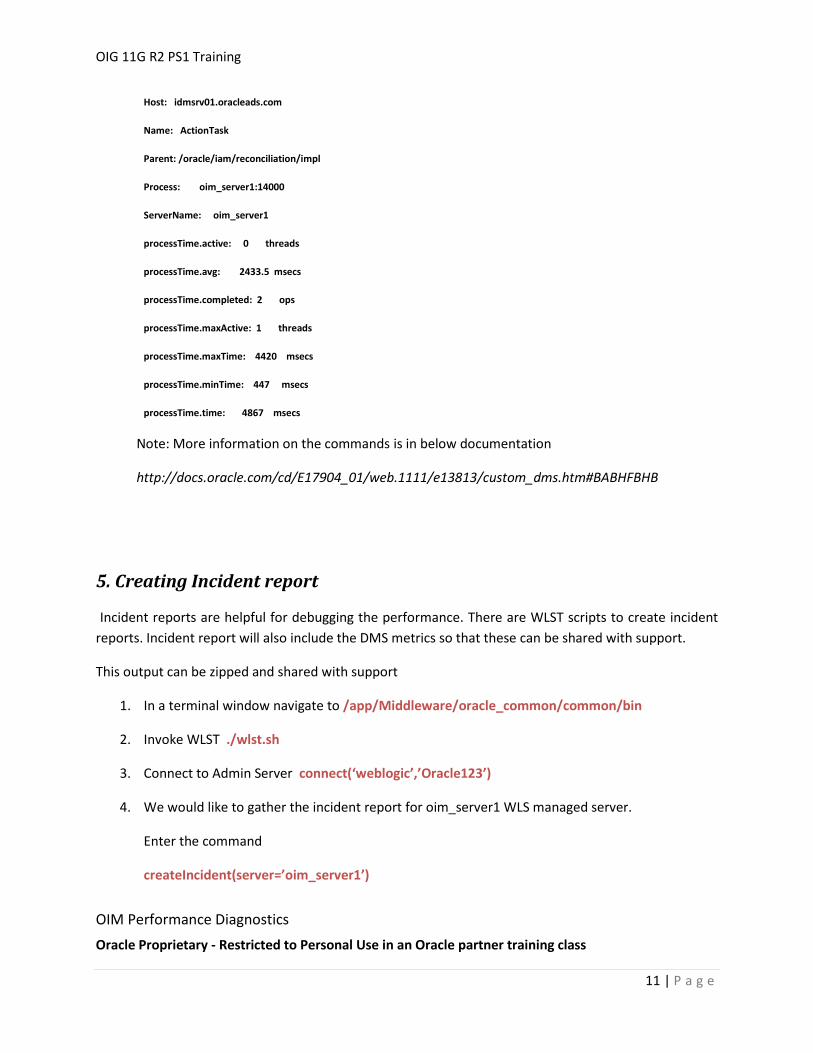
Host: idmsrv01.oracleads.com
Name: ActionTask
Parent: /oracle/iam/reconciliation/impl
Process: oim_server1:14000
ServerName: oim_server1
processTime.active: 0 threads
processTime.avg: 2433.5 msecs
processTime.completed: 2 ops
processTime.maxActive: 1 threads
processTime.maxTime: 4420 msecs
processTime.minTime: 447 msecs
processTime.time: 4867 msecs
Note: More information on the commands is in below documentation
http://docs.oracle.com/cd/E17904_01/web.1111/e13813/custom_dms.htm#BABHFBHB
5. Creating Incident report
Incident reports are helpful for debugging the performance. There are WLST scripts to create incident
reports. Incident report will also include the DMS metrics so that these can be shared with support.
This output can be zipped and shared with support
1. In a terminal window navigate to /app/Middleware/oracle_common/common/bin
2. Invoke WLST ./wlst.sh
3. Connect to Admin Server connect(‘weblogic’,’Oracle123’)
4. We would like to gather the incident report for oim_server1 WLS managed server.
Enter the command
createIncident(server=’oim_server1’)
OIG 11G R2 PS1 Training
OIM Performance Diagnostics
Oracle Proprietary - Restricted to Personal Use in an Oracle partner training class
12 | P a g e
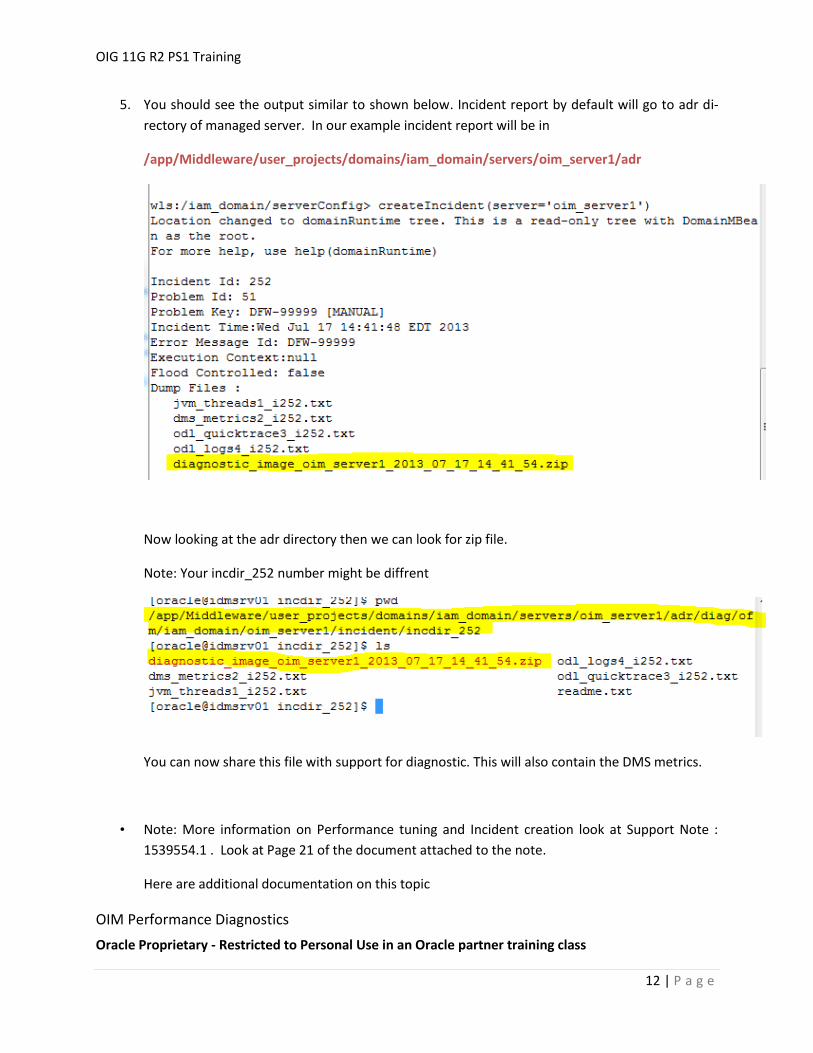
5. You should see the output similar to shown below. Incident report by default will go to adr di-
rectory of managed server. In our example incident report will be in
/app/Middleware/user_projects/domains/iam_domain/servers/oim_server1/adr
Now looking at the adr directory then we can look for zip file.
Note: Your incdir_252 number might be diffrent
You can now share this file with support for diagnostic. This will also contain the DMS metrics.
• Note: More information on Performance tuning and Incident creation look at Support Note :
1539554.1 . Look at Page 21 of the document attached to the note.
Here are additional documentation on this topic
OIG 11G R2 PS1 Training
OIM Performance Diagnostics
Oracle Proprietary - Restricted to Personal Use in an Oracle partner training class
13 | P a g e
http://docs.oracle.com/cd/E23943_01/web.1111/e13813/custom_dfw.htm#autoId1
http://docs.oracle.com/cd/E23943_01/core.1111/e10105/diagnostics.htm#autoId26
6. Resetting the DMS metrics
DMS metrics get reset automatically if you reset the server. However if you want to reset the metrics
without restart its possible using the URL to reset the metrics.
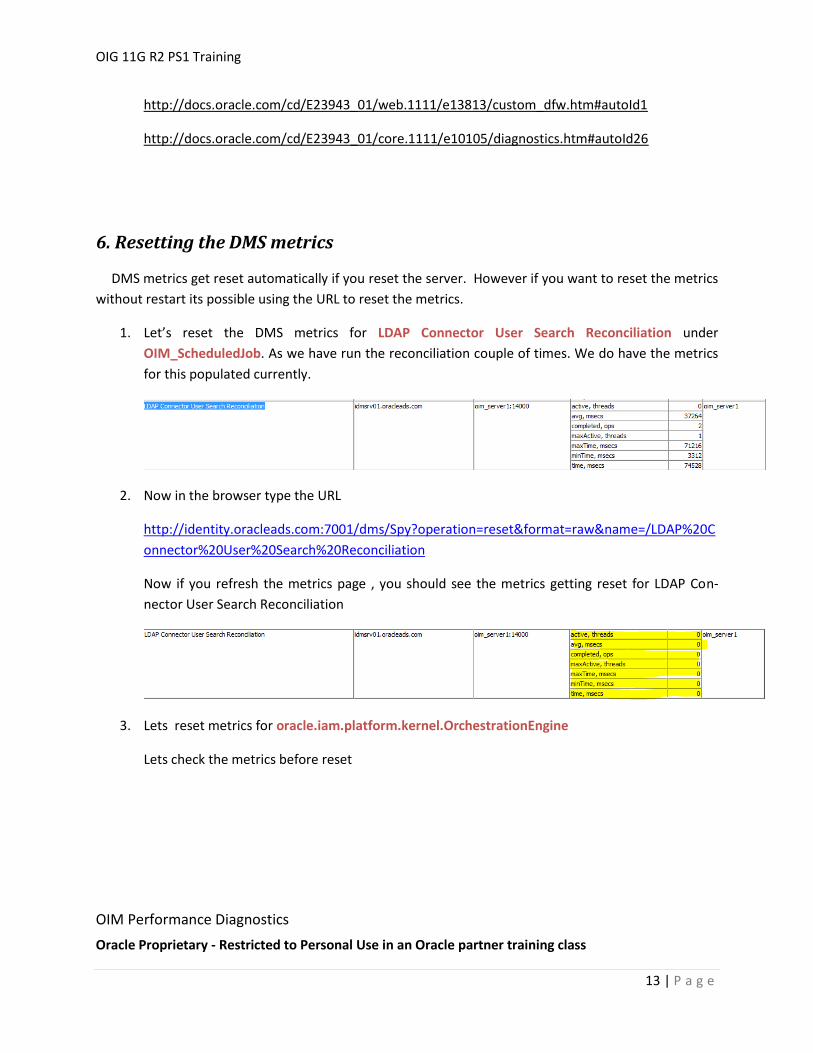
1. Let’s reset the DMS metrics for LDAP Connector User Search Reconciliation under
OIM_ScheduledJob. As we have run the reconciliation couple of times. We do have the metrics
for this populated currently.
2. Now in the browser type the URL
http://identity.oracleads.com:7001/dms/Spy?operation=reset&format=raw&name=/LDAP%20C
onnector%20User%20Search%20Reconciliation
Now if you refresh the metrics page , you should see the metrics getting reset for LDAP Con-
nector User Search Reconciliation
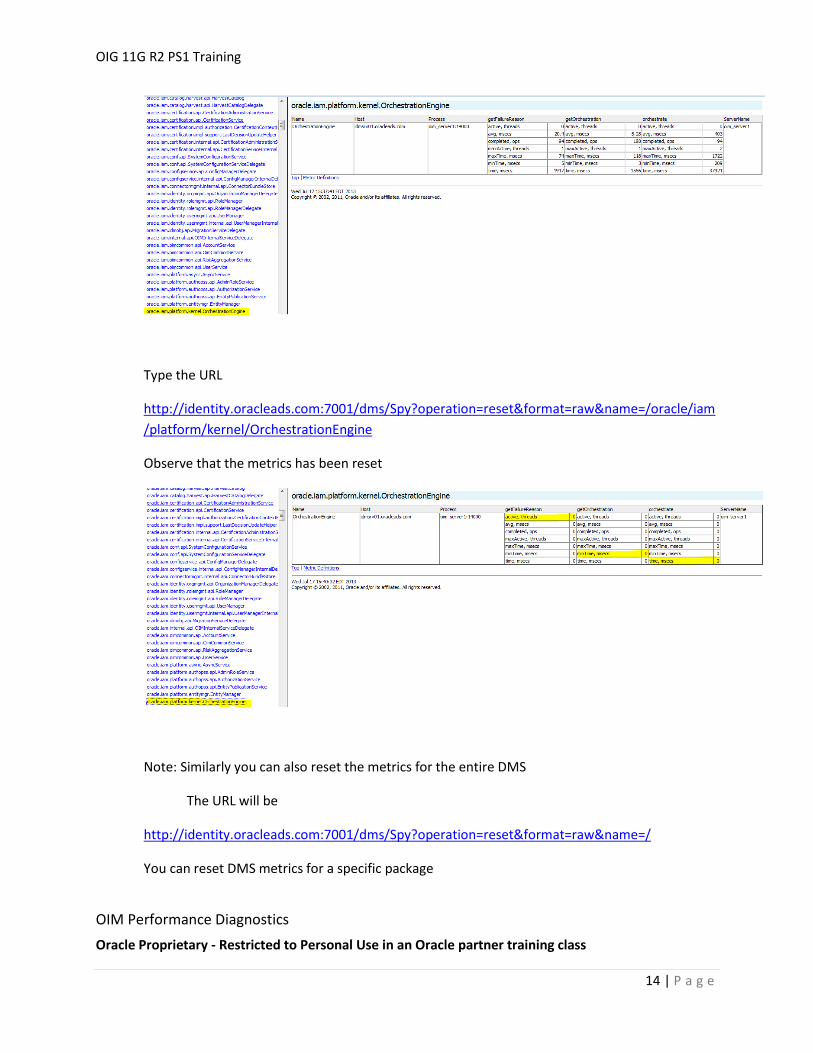
3. Lets reset metrics for oracle.iam.platform.kernel.OrchestrationEngine
Lets check the metrics before reset
OIG 11G R2 PS1 Training
OIM Performance Diagnostics
Oracle Proprietary - Restricted to Personal Use in an Oracle partner training class
14 | P a g e
Type the URL
http://identity.oracleads.com:7001/dms/Spy?operation=reset&format=raw&name=/oracle/iam
/platform/kernel/OrchestrationEngine
Observe that the metrics has been reset
Note: Similarly you can also reset the metrics for the entire DMS
The URL will be
http://identity.oracleads.com:7001/dms/Spy?operation=reset&format=raw&name=/
You can reset DMS metrics for a specific package
OIG 11G R2 PS1 Training
OIM Performance Diagnostics
Oracle Proprietary - Restricted to Personal Use in an Oracle partner training class
15 | P a g e
The URL will be like
http://identity.oracleads.com:7001/dms/Spy?operation=reset&format=raw&name=/oracle/iam
&name=/Thor/API
http://identity.oracleads.com:7001/dms/Spy?operation=reset&format=raw&name=/oracle/iam
/reconciliation
7. Profile validation using EM
Profile validation allows validation of reconciliation profiles using MBean in the Enterprise Manager.
MBean provides the information of the validity of the profile and all the indexes on the tables involved
in the reconciliation matching rule.
1. Logion to EM http://identity.oracleads.com:7001/em as weblogic/Oracle123
2. Expand the WebLogic Domain
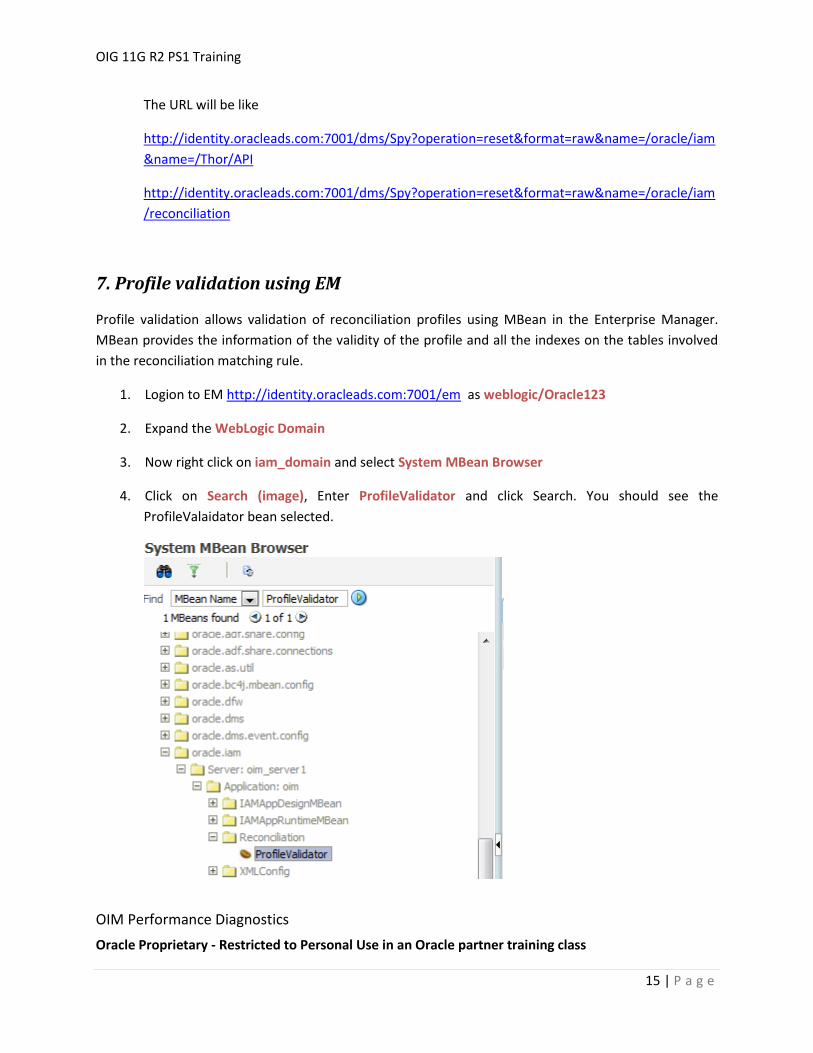
3. Now right click on iam_domain and select System MBean Browser
4. Click on Search (image), Enter ProfileValidator and click Search. You should see the
ProfileValaidator bean selected.
OIG 11G R2 PS1 Training
OIM Performance Diagnostics
Oracle Proprietary - Restricted to Personal Use in an Oracle partner training class
16 | P a g e
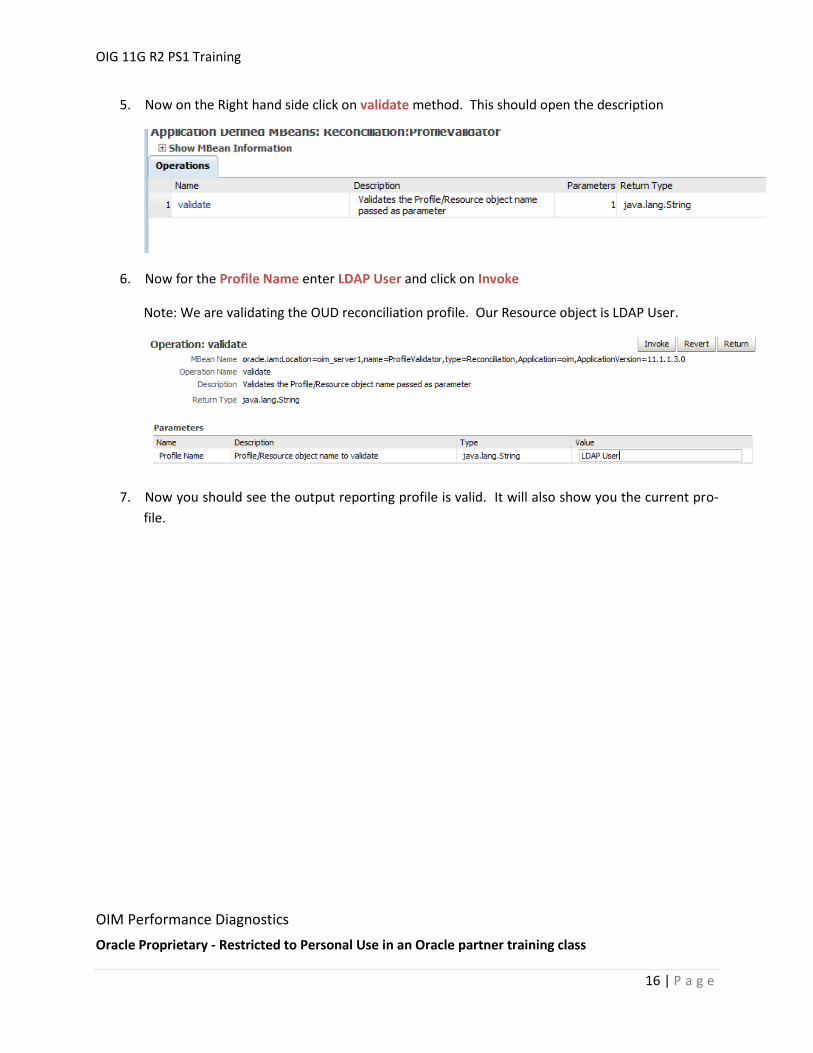
5. Now on the Right hand side click on validate method. This should open the description
6. Now for the Profile Name enter LDAP User and click on Invoke
Note: We are validating the OUD reconciliation profile. Our Resource object is LDAP User.
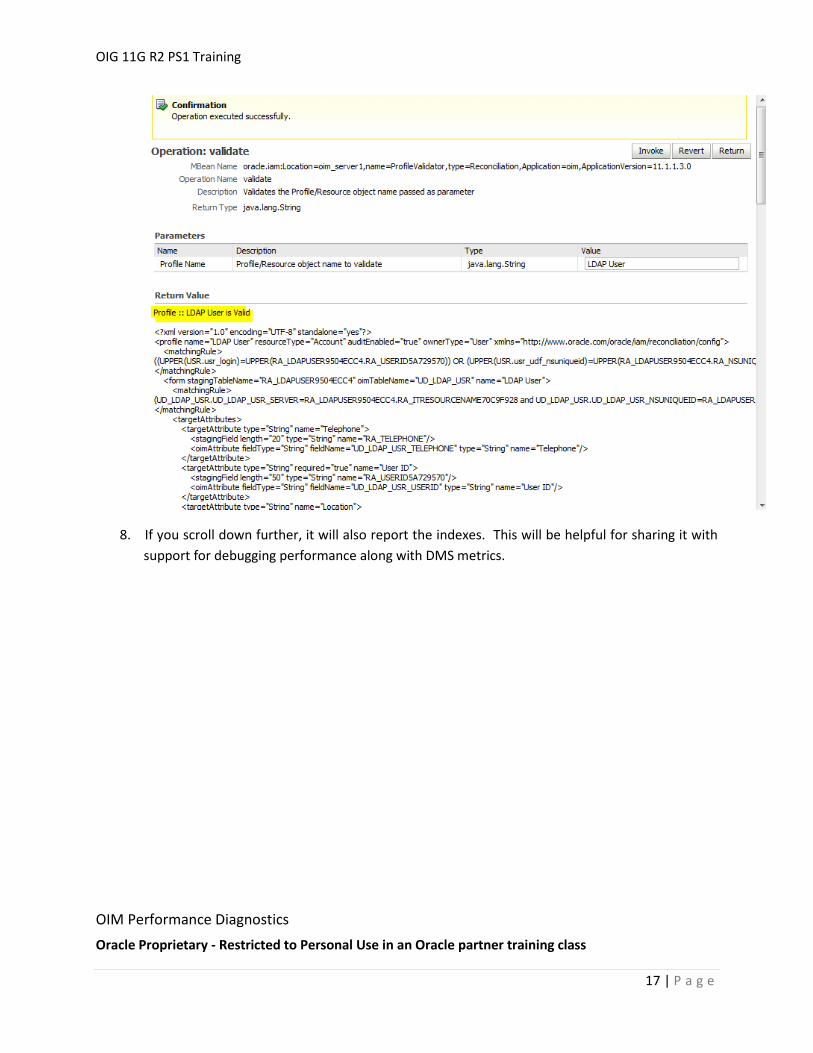
7. Now you should see the output reporting profile is valid. It will also show you the current pro-
file.
OIG 11G R2 PS1 Training
OIM Performance Diagnostics
Oracle Proprietary - Restricted to Personal Use in an Oracle partner training class
17 | P a g e
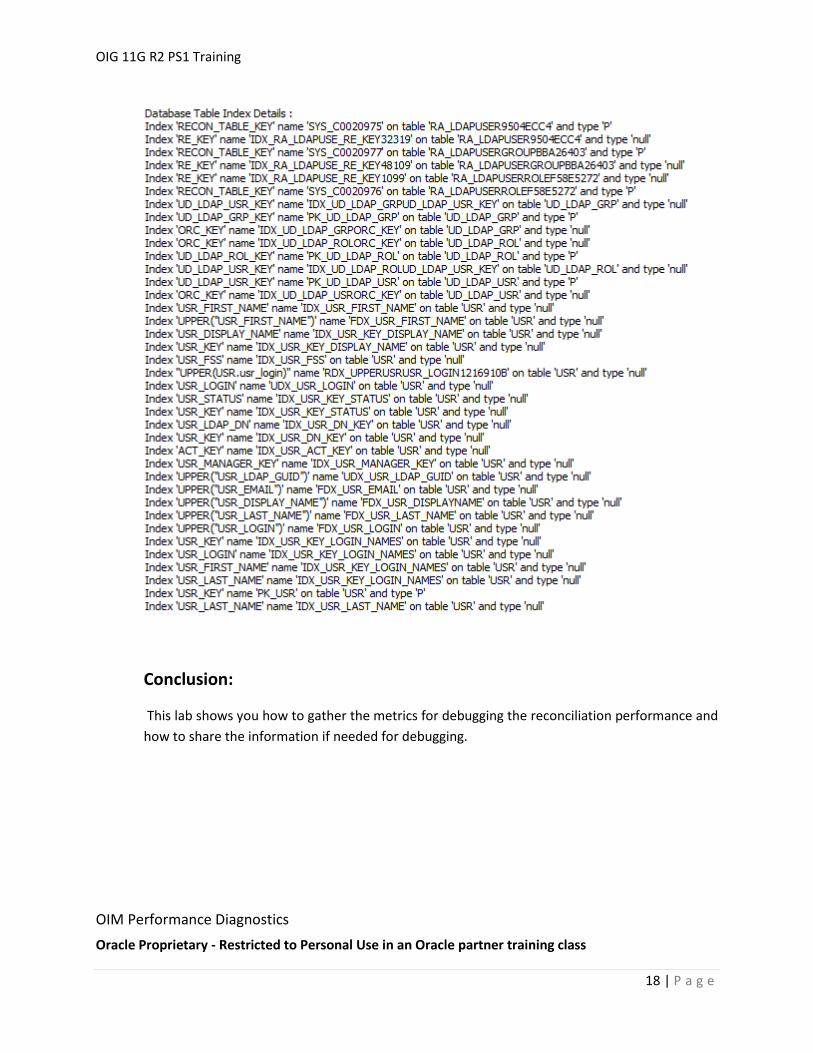
8. If you scroll down further, it will also report the indexes. This will be helpful for sharing it with
support for debugging performance along with DMS metrics.
OIG 11G R2 PS1 Training
OIM Performance Diagnostics
Oracle Proprietary - Restricted to Personal Use in an Oracle partner training class
18 | P a g e
Conclusion:
This lab shows you how to gather the metrics for debugging the reconciliation performance and
how to share the information if needed for debugging.