Embed Size (px)
Citation preview

717 14th Street, N.W., Washington, D.C. 20005 (202) 727-2540
DISTRICT OF COLUMBIA
OFFICE OF THE INSPECTOR GENERAL
OIG
OTHER POST-EMPLOYMENT BENEFITS FUND: FINANCIAL STATEMENTS AND MANAGEMENT’S DISCUSSION AND ANALYSIS (WITH REPORT OF INDEPENDENT PUBLIC ACCOUNTANTS)
FOR FISCAL YEARS ENDED SEPTEMBER 30 , 2016 AND 2015
Guiding Principles
Workforce Engagement * Stakeholders Engagement * Process-oriented * Innovation * Accountability * Professionalism * Objectivity and Independence * Communication * Collaboration
* Diversity * Measurement * Continuous Improvement
OIG Project No. 17-1-14MA Fe b r ua r y 20 17

717 14th Street, N.W., Washington, D.C. 20005 (202) 727-2540
Mission
Our mission is to independently audit, inspect, and investigate matters pertaining to the District of Columbia government in order to: • prevent and detect corruption, mismanagement, waste,
fraud, and abuse; • promote economy, efficiency, effectiveness, and
accountability; • inform stakeholders about issues relating to District
programs and operations; and • recommend and track the implementation of corrective
actions.
Vision
Our vision is to be a world class Office of the Inspector General that is customer-focused, and sets the standard for oversight excellence!
Core Values
Excellence * Integrity * Respect * Creativity * Ownership * Transparency * Empowerment * Courage * Passion
* Leadership


Mayor Bowser and Chairman Mendelson Other Post-Employment Benefits Fund Financial
Statements for FYs 2016 and 2015 (with Report of Independent Public Accountants Therein)
OIG No. 17-1-14MA February 13, 2017 Page 2 of 2
DISTRIBUTION: The Honorable Jack Evans, Chairperson, Committee on Finance and Revenue, Council of the District
of Columbia (via email) Mr. Rashad M. Young, City Administrator, Attention: Mr. Barry Kreiswirth (via email) Mr. John Falcicchio, Chief of Staff, Office of the Mayor (via email) Mr. Kevin Harris, Director, Office of Communications, (via email) Mr. Matthew Brown, Director, Mayor’s Office of Budget and Finance (via email) Ms. Nyasha Smith, Secretary to the Council, Council of the District of Columbia (via email) Mr. Jeffrey DeWitt, Chief Financial Officer, Office of the Chief Financial Officer (via email) Mr. Timothy Barry, Executive Director, Office of Integrity and Oversight, Office of the Chief Financial Officer (via email) The Honorable Kathleen Patterson, D.C. Auditor, Office of the D.C. Auditor, Attention: Candace McCrae (via email) Mr. Jed Ross, Director and Chief Risk Officer, Office of Risk Management (via email) Mr. Graylin (Gray) Smith, Partner, SB & Company, LLC (via email)
GOVERNMENT OF THE DISTRICT OF COLUMBIA OFFICE OF THE CHIEF FINANCIAL OFFICER
OFFICE OF FINANCE AND TREASURY
OTHER POST-EMPLOYMENT BENEFITS FUND
Financial Statements Together with Reports of Independent Public Accountants
For The Years Ended September 30, 2016 and 2015
SEPTEMBER 30, 2016 AND 2015
CONTENTS
REPORT OF INDEPENDENT PUBLIC ACCOUNTANTS 1
Management’s Discussion and Analysis 3
FINANCIAL STATEMENTS
Statements of Fund Net Position 8
Statements of Changes in Fund Net Position 9
Notes to Financial Statements 10
REQUIRED SUPPLEMENTARY INFORMATION
Schedule of Funding Progress 31
Schedule of Employer Contributions 32
Notes to Required Supplementary Information 33
REPORT OF INDEPENDENT PUBLIC ACCOUNTANTS ON INTERNAL CONTROL OVER FINANCIAL REPORTING AND ON COMPLIANCE AND OTHER MATTERS BASED ON AN AUDIT OF FINANCIAL STATEMENTS PERFORMED IN ACCORDANCE WITH GOVERNMENT AUDITING STANDARDS 35

1299 Pennsylvania Avenue NW • Suite 1120 • Washington • District of Columbia 20004 • P 202.803.2335 • F 202.821.1320
REPORT OF INDEPENDENT PUBLIC ACCOUNTANTS
The Mayor and the Council of the Government of the District of Columbia Inspector General of the Government of the District of Columbia
Report on the Financial Statements
We have audited the accompanying financial statements of the Government of the District of Columbia Other Post-Employment Benefits Fund (the Fund), a fiduciary fund of the Government of the District of Columbia, as of and for the years ended September 30, 2016 and 2015, and the related notes to the financial statements, which collectively comprise Fund’s basic financial statements as listed in the table of contents.
Management’s Responsibility for the Financial Statements
The Fund’s management is responsible for the preparation and fair presentation of these financial statements in accordance with accounting principles generally accepted in the United States of America; this includes the design, implementation, and maintenance of internal control relevant to the preparation and fair presentation of financial statements that are free from material misstatement, whether due to fraud or error.
Auditor’s Responsibility
Our responsibility is to express opinions on these financial statements based on our audits. We conducted our audits in accordance with auditing standards generally accepted in the United States of America and the standards applicable to financial audits contained in Government Auditing Standards, issued by the Comptroller General of the United States. Those standards require that we plan and perform the audits to obtain reasonable assurance about whether the financial statements are free from material misstatement.
An audit involves performing procedures to obtain audit evidence about the amounts and disclosures in the financial statements. The procedures selected depend on the auditor’s judgment, including the assessment of the risks of material misstatement of the financial statements, whether due to fraud or error. In making those risk assessments, the auditor considers internal control relevant to the entity’s preparation and fair presentation of the financial statements in order to design audit procedures that are appropriate in the circumstances, but not for the purpose of expressing an opinion on the effectiveness of the entity’s internal control. Accordingly, we express no such opinion. An audit also includes evaluating the appropriateness of accounting policies used and the reasonableness of significant accounting estimates made by management, as well as evaluating the overall presentation of the financial statements.
We believe that the audit evidence we have obtained is sufficient and appropriate to provide a basis for our audit opinions.
Opinion
In our opinion, the financial statements referred to above present fairly, in all material respects, the financial position of the Fund as of September 30, 2016 and 2015, and the changes in its financial position for the years then ended in accordance with accounting principles generally accepted in the United States of America.

2
Emphasis of Matter
As discussed in Note 2, the financial statements of the Fund are intended to present only the financial position of the Fund and do not purport to, and do not, present fairly the financial position of the Government of the District of Columbia as of September 30, 2016 and 2015, and the changes in its financial position for the years then ended, in conformity with accounting principles generally accepted in the United States of America. Our opinion is not modified with respect to the matter.
Other Matters
Required Supplementary Information
Accounting principles generally accepted in the United States of America require that the management’s discussion and analysis, schedule of funding progress, schedule of employer contributions and the notes to the required supplementary information be presented to supplement the basic financial statements. Such information, although not a part of the basic financial statements, is required by the Governmental Accounting Standards Board who considers it to be an essential part of financial reporting for placing the basic financial statements in an appropriate operational, economic, or historical context. We have applied certain limited procedures to the required supplementary information in accordance with auditing standards generally accepted in the United States of America, which consisted of inquiries of management about the methods of preparing the information and comparing the information for consistency with management’s responses to our inquiries, the basic financial statements, and other knowledge we obtained during our audit of the basic financial statements. We do not express an opinion or provide any assurance on the information because the limited procedures do not provide us with sufficient evidence to express an opinion or provide any assurance.
Other Reporting Required by Government Auditing Standards
In accordance with Government Auditing Standards, we have also issued our report dated December 29, 2016, on our consideration of the Fund’s internal control over financial reporting and on our tests of its compliance with certain provisions of laws, regulations, contracts, and grant agreements and other matters. The purpose of that report is to describe the scope of our testing of internal control over financial reporting and compliance and the results of that testing, and not to provide an opinion on internal control over financial reporting or on compliance. That report is an integral part of an audit performed in accordance with Government Auditing Standards in considering the Fund’s internal control over financial reporting and compliance.
Washington, D.C. December 29, 2016

GOVERNMENT OF THE DISTRICT OF COLUMBIA OTHER POST-EMPLOYMENT BENEFITS FUND
Management’s Discussion and Analysis (continued) September 30, 2016 and 2015
3
The following presents our discussion and analysis of the financial performance of the Government of the District of Columbia’s (the District) Other Post-Employment Benefits Fund (the Fund), a fiduciary fund of the Government of the District of Columbia, for the fiscal years ended September 30, 2016, 2015 and 2014. This discussion and analysis should be read in conjunction with the financial statements and note disclosures.
All employees hired after September 30, 1987, who retired under the Teacher Retirement System or Police and Fire Retirement System; or who are eligible for retirement benefits under the Social Security Act, are eligible to participate in the Fund.
Overview of the Financial Statements
The Fund is required to follow U.S. Generally Accepted Accounting Principles and, as such, the Fund’s financial statements must consist of two basic financial statements: (a) Statement of Fund Net Position and (b) Statement of Changes in Fund Net Position.
• The Statement of Fund Net Position presents the Fund’s assets, liabilities, and net position availablefor postretirement benefits.
• The Statement of Changes in Fund Net Position presents the additions to, and deductions from, theFund’s net position.
• The Notes to Financial Statements provide additional information that is essential for a full understandingof the financial statements. The notes are an integral part of the financial statements and include detailedinformation not readily evident in the basic financial statements such as accounting policies, planmembership and benefits, and summary disclosures of selected financial data.
• The Required Supplementary Schedules immediately following the notes to financial statements providesschedules illustrating the schedule of funding progress and schedule of employer contributions.
Financial Highlights
FY 2016 FY 2015 FY 2014The Fund’s Investments $1,173,912,217 $1,045,586,954 $941,971,328District’s Contributions 29,000,000 91,400,000 86,600,000

GOVERNMENT OF THE DISTRICT OF COLUMBIA OTHER POST-EMPLOYMENT BENEFITS FUND
Management’s Discussion and Analysis (continued) September 30, 2016 and 2015
4
Financial Analysis
Table 1 - Summary of Fund Net Position (In dollars)
2016 2015 Variance Variance % 2014 Variance Variance %
Cash and cash equivalents 37,032,445$ 45,658,951$ (8,626,506)$ -18.9% 124,388,169$ (78,729,218)$ -63.3%Receivables 16,890,545 16,214,607 675,938 4.2% 22,954,227 (6,739,620) -29.4%Investments, at fair value 1,173,912,217 1,045,586,954 128,325,263 12.3% 941,971,328 103,615,626 11.0%Total assets 1,227,835,207 1,107,460,512 120,374,695 10.9% 1,089,313,724 18,146,788 1.7%
Investments payable 30,393,993 30,910,398 (516,405) -1.7% 37,954,665 (7,044,267) -18.6%
1,197,441,214$ 1,076,550,114$ 120,891,100$ 11.2% 1,051,359,059$ 25,191,055$ 2.4%
Assets
Liabilities
Net Position Held in Trust for Other Post Employment Benefits
FY2016-FY2015 FY2015-FY2014
Table 2 - Summary of Changes in Fund Net Position (In dollars)
2016 2015 Variance Variance % 2014 Variance Variance %Additions
Contributions 29,430,587$ 91,810,780$ (62,380,193)$ -67.9% 86,902,855$ 4,907,925$ 5.6%Net investment income (loss) 101,796,714 (59,515,011) 161,311,725 -271.0% 71,610,170 (131,125,181) -183.1%
Total additions 131,227,301 32,295,769 98,931,532 306.3% 158,513,025 (126,217,256) -79.6%Deductions
Insurance premiums 10,043,719 6,739,591 3,304,128 49.0% 4,729,440 2,010,151 42.5%Other expenses 292,482 365,123 (72,641) -19.9% 239,739 125,384 52.3%
Total deductions 10,336,201 7,104,714 3,231,487 45.5% 4,969,179 2,135,535 43.0%Net Increase 120,891,100 25,191,055 95,700,045$ 379.9% 153,543,846 (128,352,791)$ -83.6%Beginning Net Position 1,076,550,114 1,051,359,059 897,815,213 Ending Net Position 1,197,441,214$ 1,076,550,114$ 1,051,359,059$
FY2016-FY2015 FY2015-FY2014
GOVERNMENT OF THE DISTRICT OF COLUMBIA OTHER POST-EMPLOYMENT BENEFITS FUND
Management’s Discussion and Analysis (continued) September 30, 2016 and 2015
5
Fund Contributions
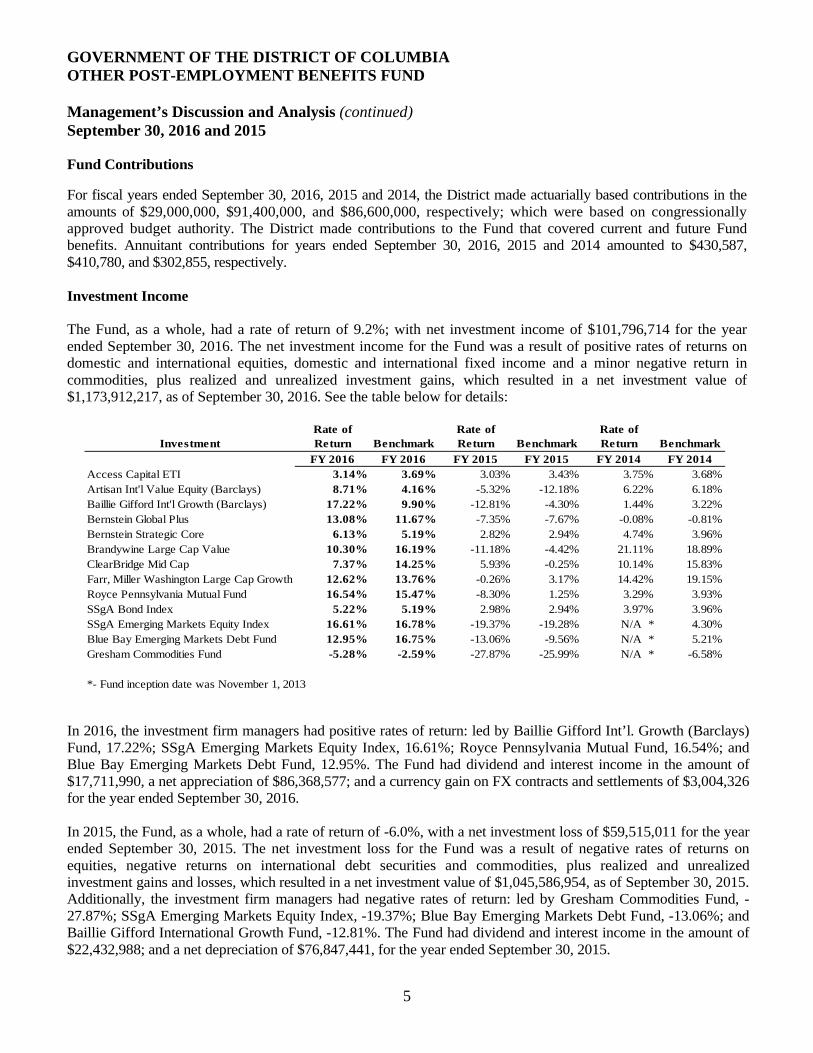
For fiscal years ended September 30, 2016, 2015 and 2014, the District made actuarially based contributions in the amounts of $29,000,000, $91,400,000, and $86,600,000, respectively; which were based on congressionally approved budget authority. The District made contributions to the Fund that covered current and future Fund benefits. Annuitant contributions for years ended September 30, 2016, 2015 and 2014 amounted to $430,587, $410,780, and $302,855, respectively.
Investment Income
The Fund, as a whole, had a rate of return of 9.2%; with net investment income of $101,796,714 for the year ended September 30, 2016. The net investment income for the Fund was a result of positive rates of returns on domestic and international equities, domestic and international fixed income and a minor negative return in commodities, plus realized and unrealized investment gains, which resulted in a net investment value of $1,173,912,217, as of September 30, 2016. See the table below for details:
InvestmentRate of Return Benchmark
Rate of Return Benchmark
Rate of Return Benchmark
FY 2016 FY 2016 FY 2015 FY 2015 FY 2014 FY 2014Access Capital ETI 3.14% 3.69% 3.03% 3.43% 3.75% 3.68%Artisan Int'l Value Equity (Barclays) 8.71% 4.16% -5.32% -12.18% 6.22% 6.18%Baillie Gifford Int'l Growth (Barclays) 17.22% 9.90% -12.81% -4.30% 1.44% 3.22%Bernstein Global Plus 13.08% 11.67% -7.35% -7.67% -0.08% -0.81%Bernstein Strategic Core 6.13% 5.19% 2.82% 2.94% 4.74% 3.96%Brandywine Large Cap Value 10.30% 16.19% -11.18% -4.42% 21.11% 18.89%ClearBridge Mid Cap 7.37% 14.25% 5.93% -0.25% 10.14% 15.83%Farr, Miller Washington Large Cap Growth 12.62% 13.76% -0.26% 3.17% 14.42% 19.15%Royce Pennsylvania Mutual Fund 16.54% 15.47% -8.30% 1.25% 3.29% 3.93%SSgA Bond Index 5.22% 5.19% 2.98% 2.94% 3.97% 3.96%SSgA Emerging Markets Equity Index 16.61% 16.78% -19.37% -19.28% N/A * 4.30%Blue Bay Emerging Markets Debt Fund 12.95% 16.75% -13.06% -9.56% N/A * 5.21%Gresham Commodities Fund -5.28% -2.59% -27.87% -25.99% N/A * -6.58%
*- Fund inception date was November 1, 2013
In 2016, the investment firm managers had positive rates of return: led by Baillie Gifford Int’l. Growth (Barclays) Fund, 17.22%; SSgA Emerging Markets Equity Index, 16.61%; Royce Pennsylvania Mutual Fund, 16.54%; and Blue Bay Emerging Markets Debt Fund, 12.95%. The Fund had dividend and interest income in the amount of $17,711,990, a net appreciation of $86,368,577; and a currency gain on FX contracts and settlements of $3,004,326 for the year ended September 30, 2016.
In 2015, the Fund, as a whole, had a rate of return of -6.0%, with a net investment loss of $59,515,011 for the year ended September 30, 2015. The net investment loss for the Fund was a result of negative rates of returns on equities, negative returns on international debt securities and commodities, plus realized and unrealized investment gains and losses, which resulted in a net investment value of $1,045,586,954, as of September 30, 2015. Additionally, the investment firm managers had negative rates of return: led by Gresham Commodities Fund, -27.87%; SSgA Emerging Markets Equity Index, -19.37%; Blue Bay Emerging Markets Debt Fund, -13.06%; and Baillie Gifford International Growth Fund, -12.81%. The Fund had dividend and interest income in the amount of $22,432,988; and a net depreciation of $76,847,441, for the year ended September 30, 2015.

GOVERNMENT OF THE DISTRICT OF COLUMBIA OTHER POST-EMPLOYMENT BENEFITS FUND
Management’s Discussion and Analysis (continued) September 30, 2016 and 2015
6
Investment Income (continued)
In 2014, the investments had a positive rate of return of 8.3%, with net investment income of $71,610,170 for the year ended September 30, 2014. The net investment gain for the Fund was a result of positive rates of return; plus realized and unrealized investments, with a net investment value of $941,971,328. Please see the above table for details.
Insurance Carrier Premiums
Insurance Carrier Premiums represent amounts paid to the Fund’s health and life insurance carriers. The premium expenses for the years ended September 30, 2016, 2015, and 2014 totaled $10,043,719, $6,739,591, and $4,729,440, respectively. The Defined Benefit Fund insurance premiums for the years ended September 30, 2016, 2015, and 2014 totaled $8,853,071, $6,182,198, and $3,712,004, respectively. All remaining insurance premiums are attributable to general employee retirees. The insurance premiums increased in fiscal year 2016, when compared to 2015 and 2014, due to rising national health care costs. The rising costs resulted in an increase in coverage cost for District employees. As of September 30, 2016, 2015, and 2014, the Fund had 1,279, 995, and 938 annuitants receiving benefits, respectively.
Summary of Actuarial Analysis
The results of the actuarial analysis are summarized below:
2015 2014 2013Actuarial valuation of assets 1,202,400,000$ 1,036,600,000$ 897,800,000$ Actuarial accrued liability 1,001,200,000 1,188,300,000 1,048,000,000 Unfunded/(overfunded) actuarial liability (201,200,000) 151,700,000 150,200,000 Funded ratio 120.10% 87.23% 85.67%
September 30,
The District executed an experience study during the 2015 and 2016 fiscal years. The study examined participation assumptions for the Fund. The number of current retirees under the Fund is quite small due to the fact that the benefit is only available to retirees who were hired by the District after September 30, 1987. Since there is not substantial participation experience currently, the participation assumption chosen for valuations prior to the 2014 valuation purposely contained a large margin when compared to current actual rates of participation. As a result of the recent experience study, the District adopted updated assumed participation rates which reflect actual experience but continue to include an element of conservatism. The District also adjusted the discount rate to reflect more conservative expectations of future investment returns. The District will continue to track actual rates of participation in the future and will continue to compile participation data so that updated analyses of participation rates can be made as part of future valuations. The District will plan to maintain a funding ratio between 90% and 120% indicating the plan is fully funded.
There were 22,821 and 22,069 active employees, based on the September 30, 2016 and 2015 actuarial reports, respectively. The 2016 actuarial report showed that, based on data as of September 30, 2014, the number of annuitants increased by 383 members, to a total of 938 annuitants. They consist of 740 firefighters, police, and teachers; and 198 general employees. In comparison to the 2015 actuarial report, using September 30, 2012 data, the number of annuitants totaled 555 members, which represents an increase of 69% in membership.

GOVERNMENT OF THE DISTRICT OF COLUMBIA OTHER POST-EMPLOYMENT BENEFITS FUND
Management’s Discussion and Analysis September 30, 2016 and 2015
7
Investment Management Fees
Investment management and custody fees for the years ended September 30, 2016, 2015 and 2014, are detailed in the table below. Investments increased to $1,173,912,217 as of September 30, 2016, from $1,045,586,954 as of September 30, 2015, which is an increase of 12.0% from last year, and an increase of 25% over the past two years.
Investment Firm (In dollars ) 2016 2015 2014Farr, Miller, Washington Large Cap Growth 902,643$ 904,138$ $ 811,633 Brandywine Large Cap Value 749,144 1,024,876 706,171 ClearBridge Mid Cap 721,199 545,241 467,797 Baillie Gifford Int'l. Growth (Barclays) 656,386 464,625 338,080 Artisan Int'l. Value Equity (Barclays) 627,734 458,151 412,823 Bernstein Global Plus 396,569 268,670 239,447 Bernstein Strategic Core 337,301 326,988 316,159 Gresham Commodities Fund - Equity 312,590 182,241 312,775 Blue Bay Emerging Markets - Debt Fund 276,830 238,116 252,084 Royce Pennsylvania Mutual Fund 242,980 478,967 592,372 Access Capital ETI 203,261 197,074 102,225 SSgA Custody Fees 151,087 134,042 133,545 SSgA Emerging Markets Equity 80,714 145,656 101,791 SSgA Russell Sm. CAP Index Fund-Bond * 33,542 - - SSgA Index Bond 27,681 35,503 48,829 Total 5,719,661$ 5,404,288$ 4,835,731$
September 30,
* Fund inception date was November 24, 2015
Contact Information
This financial report is designed to provide a general overview of the Fund’s finances. Questions concerning any information provided in this report, or requests for additional financial information, should be addressed to the Office of the Chief Financial Officer (Office of Finance and Treasury); Government of the District of Columbia; 1101 4th Street SW, 8th Floor Washington, DC, 20024.

GOVERNMENT OF THE DISTRICT OF COLUMBIA OTHER POST-EMPLOYMENT BENEFITS FUND
Statements of Fund Net Position September 30, 2016 and 2015
The accompanying notes are an integral part of these financial statements. 8
2016 2015
Cash and cash equivalents 37,032,445$ 45,658,951$
ReceivablesInvestment 14,170,160 13,890,285 Interest and dividends 2,720,385 2,324,322
Total receivables 16,890,545 16,214,607
Investments, at fair value:Equities 694,373,770 605,446,733 Debt Securities 437,859,844 396,139,142 Commodities 41,678,603 44,001,079
Total investments 1,173,912,217 1,045,586,954
Total Assets 1,227,835,207 1,107,460,512
Investments and other payables 30,393,993 30,910,398
Net Position Held in Trust for Other Post Employment Benefits 1,197,441,214$ 1,076,550,114$
ASSETS
LIABILITIES
GOVERNMENT OF THE DISTRICT OF COLUMBIA OTHER POST-EMPLOYMENT BENEFITS FUND
Statements of Changes in Fund Net Position September 30, 2016 and 2015
The accompanying notes are an integral part of these financial statements. 9
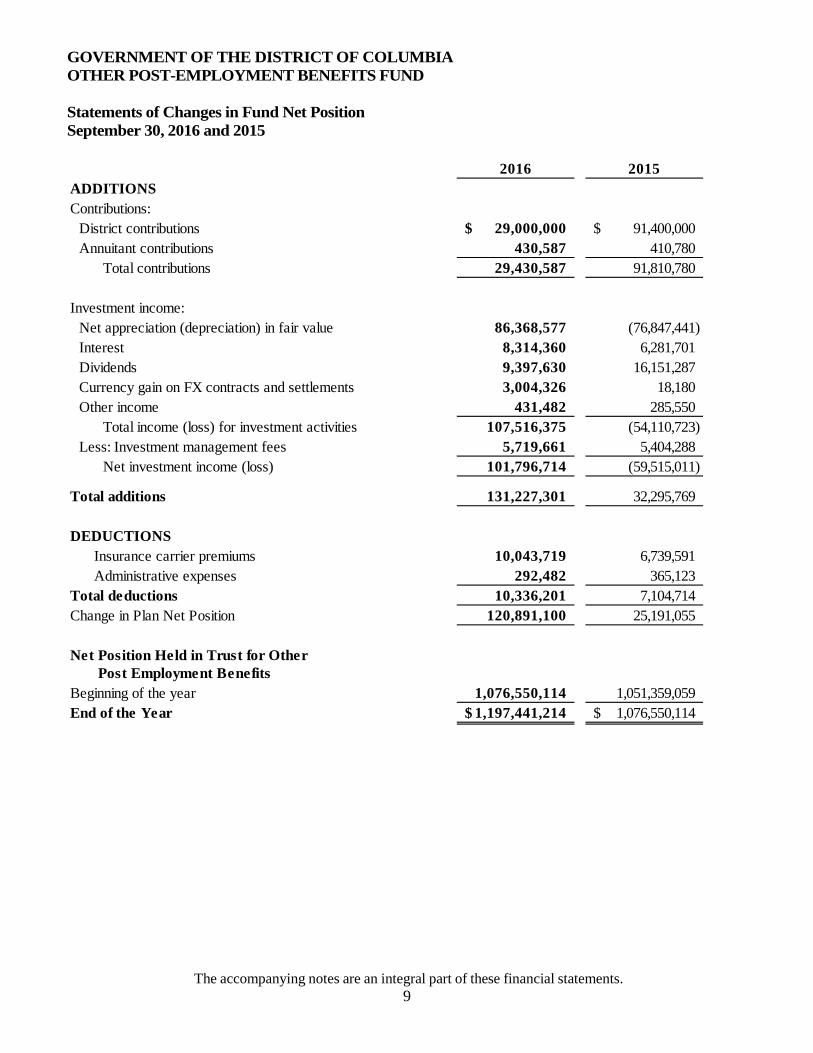
2016 2015ADDITIONSContributions:
District contributions 29,000,000$ 91,400,000$ Annuitant contributions 430,587 410,780
Total contributions 29,430,587 91,810,780
Investment income:Net appreciation (depreciation) in fair value 86,368,577 (76,847,441) Interest 8,314,360 6,281,701 Dividends 9,397,630 16,151,287 Currency gain on FX contracts and settlements 3,004,326 18,180 Other income 431,482 285,550
Total income (loss) for investment activities 107,516,375 (54,110,723) Less: Investment management fees 5,719,661 5,404,288
Net investment income (loss) 101,796,714 (59,515,011)
Total additions 131,227,301 32,295,769
DEDUCTIONSInsurance carrier premiums 10,043,719 6,739,591 Administrative expenses 292,482 365,123
Total deductions 10,336,201 7,104,714 Change in Plan Net Position 120,891,100 25,191,055
Net Position Held in Trust for Other Post Employment Benefits
Beginning of the year 1,076,550,114 1,051,359,059 End of the Year 1,197,441,214$ 1,076,550,114$

GOVERNMENT OF THE DISTRICT OF COLUMBIA OTHER POST-EMPLOYMENT BENEFITS FUND
Notes to Financial Statements September 30, 2016 and 2015
10
NOTE 1 – FUND DESCRIPTION AND CONTRIBUTIONS
The Government of the District of Columbia (the District) established the Fund on October 1, 1999, under the Annuitant’s Health and Life Insurance Employer Contribution Amendment Act of 1999 (the “Act”)(D.C. Law 13-54; D.C. Official Code § 1-621.09). The Fund was established to receive the District’s contributions for health and life insurance premiums, from which the District’s contributions would be paid. The Fund is managed and administered jointly by the District’s Office of Finance and Treasury (OFT), within the District’s Office of the Chief Financial Officer; and the District’s Office of Human Resources, pursuant to the terms of the Plan. The Fund is a fiduciary fund of the District.
Fund Description
The Fund is a single employer defined benefit Fund that provides health and life insurance benefits to retired eligible District employees. All employees hired after September 30, 1987, who retired under the Teachers’ Retirement System or Police and Fire Retirement System, or who are eligible for retirement benefits under the Social Security Act, are eligible to participate in the Fund. The Fund was established to hold and pay the District’s contributions for health and life insurance for annuitants. The purpose of the Fund (as defined in Section 1.02 of the Plan) is to manage and administer the Fund for the benefit of annuitants, as provided in the Act.
To continue insurance benefits into retirement, employees must have been continuously enrolled (or covered as a family member) under the D.C. Employees Health Benefits (DCEHB) program, or the D.C. Employees Group Life Insurance (DCEGLI) program for five years prior to retirement. If the employee was employed less than five years, the employee must have been enrolled for his/her length of employment. Coverage under Medicare is not considered in determining continuous coverage. Dependents are also covered if the employee elects family coverage.
Contributions
Cost sharing arrangements for annuitants vary depending on whether the employee was a General Employee, Teacher, Police Officer or Firefighter. For General Employees and Teachers, annuitants with at least 10 years of creditable District service but less than 30 years of creditable District service pay a percentage of their health insurance premiums and the District pays the remainder. The percentage paid by the annuitant is 75%, reduced by an additional 2.50% for each year of creditable service over 10 years up to a maximum of 20 such additional years. Thus, the District’s contribution shall not exceed 75% of the cost of the selected health benefit plan. For annuitants with 30 or more years of creditable District service, the District pays 75% of the cost of the selected health benefit plan and the annuitant pays 25% of the cost of the selected health benefit plan.
Covered family members of General Employee and Teacher annuitants with at least 10 years of creditable District service but less than 30 years of creditable District service pay a percentage of their health insurance premiums and the District pays the remainder. The percentage paid by the covered family member is 80%, reduced by an additional 1.00% for each year of creditable District service over 10 years up to a maximum of 20 such additional years. Thus, the District’s contribution shall not exceed 40% of the cost of the selected health benefit plan for covered family members of an annuitant with 30 or more years of creditable District service and the family members of an annuitant with 30 or more years of creditable District service pays up to 60% of the cost of the selected health benefit plan.
GOVERNMENT OF THE DISTRICT OF COLUMBIA OTHER POST-EMPLOYMENT BENEFITS FUND
Notes to Financial Statements September 30, 2016 and 2015
11
NOTE 1 – FUND DESCRIPTION AND CONTRIBUTIONS (continued)
Contributions (continued)
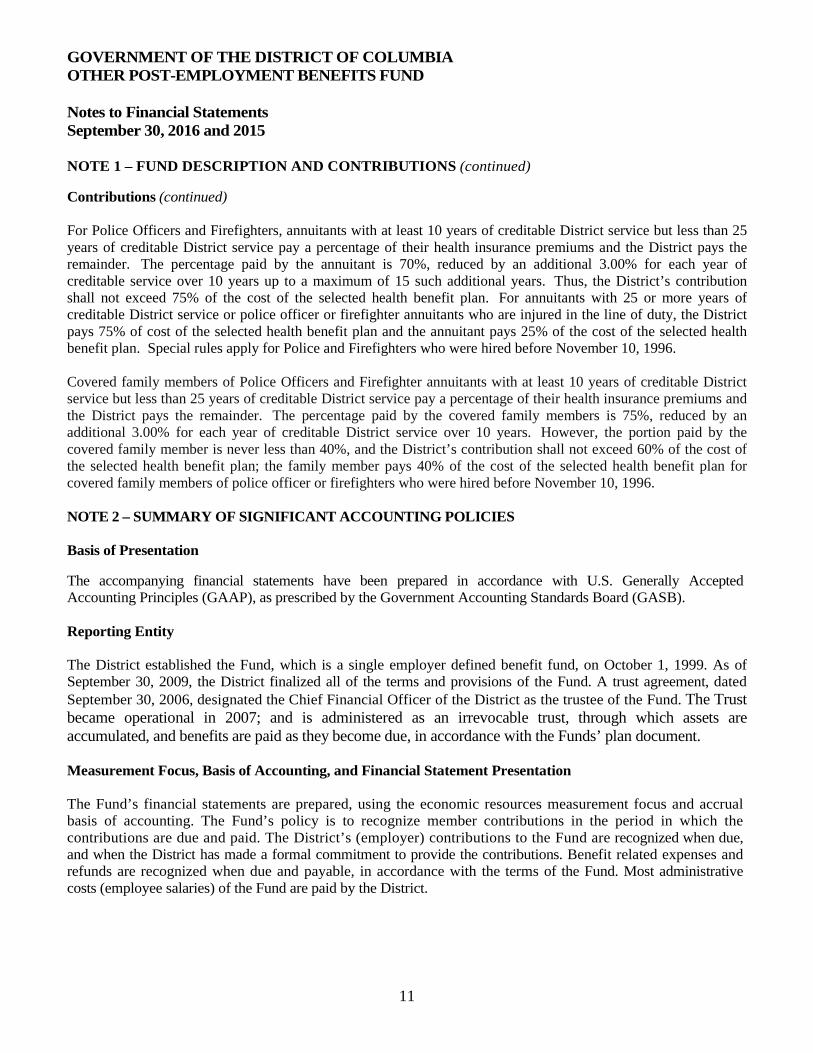
For Police Officers and Firefighters, annuitants with at least 10 years of creditable District service but less than 25 years of creditable District service pay a percentage of their health insurance premiums and the District pays the remainder. The percentage paid by the annuitant is 70%, reduced by an additional 3.00% for each year of creditable service over 10 years up to a maximum of 15 such additional years. Thus, the District’s contribution shall not exceed 75% of the cost of the selected health benefit plan. For annuitants with 25 or more years of creditable District service or police officer or firefighter annuitants who are injured in the line of duty, the District pays 75% of cost of the selected health benefit plan and the annuitant pays 25% of the cost of the selected health benefit plan. Special rules apply for Police and Firefighters who were hired before November 10, 1996.
Covered family members of Police Officers and Firefighter annuitants with at least 10 years of creditable District service but less than 25 years of creditable District service pay a percentage of their health insurance premiums and the District pays the remainder. The percentage paid by the covered family members is 75%, reduced by an additional 3.00% for each year of creditable District service over 10 years. However, the portion paid by the covered family member is never less than 40%, and the District’s contribution shall not exceed 60% of the cost of the selected health benefit plan; the family member pays 40% of the cost of the selected health benefit plan for covered family members of police officer or firefighters who were hired before November 10, 1996.
NOTE 2 – SUMMARY OF SIGNIFICANT ACCOUNTING POLICIES
Basis of Presentation
The accompanying financial statements have been prepared in accordance with U.S. Generally Accepted Accounting Principles (GAAP), as prescribed by the Government Accounting Standards Board (GASB).
Reporting Entity
The District established the Fund, which is a single employer defined benefit fund, on October 1, 1999. As of September 30, 2009, the District finalized all of the terms and provisions of the Fund. A trust agreement, dated September 30, 2006, designated the Chief Financial Officer of the District as the trustee of the Fund. The Trust became operational in 2007; and is administered as an irrevocable trust, through which assets are accumulated, and benefits are paid as they become due, in accordance with the Funds’ plan document.
Measurement Focus, Basis of Accounting, and Financial Statement Presentation
The Fund’s financial statements are prepared, using the economic resources measurement focus and accrual basis of accounting. The Fund’s policy is to recognize member contributions in the period in which the contributions are due and paid. The District’s (employer) contributions to the Fund are recognized when due, and when the District has made a formal commitment to provide the contributions. Benefit related expenses and refunds are recognized when due and payable, in accordance with the terms of the Fund. Most administrative costs (employee salaries) of the Fund are paid by the District.

GOVERNMENT OF THE DISTRICT OF COLUMBIA OTHER POST-EMPLOYMENT BENEFITS FUND
Notes to Financial Statements September 30, 2016 and 2015
12
NOTE 2 – SUMMARY OF SIGNIFICANT ACCOUNTING POLICIES (continued)
Use of Estimates
The preparation of financial statements in conformity with GAAP requires management to make estimates and assumptions that affect the reported amounts of assets, liabilities, and change therein, as of the date of the financial statements; as well as the actuarial present value of accumulated benefits during the reporting period. Actual results could differ from these estimates. Further actuarial valuations of an ongoing benefits Fund involve estimates of the value of reported amounts, and assumptions about the probability of occurrence of events far into the future.
Examples include assumptions about future employment, mortality, interest rates, inflation rates, and healthcare cost trends. Amounts determined, regarding the funded status of the Fund, and the annual required contributions of the District are subject to continual revision, as actual results are compared with past expectations; and new assumptions are made about the future.
Fair Value Measurements
The Office of Finance and Treasury (OFT) is responsible for the oversight of the investments of Fund Assets, and has established the Plan to guide the administration and management of the Fund. The duties and responsibilities of the OFT also include, but are not limited to, the financial administration and management of the Fund, the establishment of investment objectives, the determination of investment policies, the establishment of management policies, and the management and control of Fund assets. Fair value is the price that would be received to sell an asset, or paid to transfer a liability in an orderly transaction between market participants at the measurement date. Fair value is a market-based measurement, not an entity-specific measurement. For some assets and liabilities, observable market transactions or market information might be available; for others, inputs are observable for similar transactions or the inputs are unobservable. However, the objective of fair value measurement in all cases, is to determine the price at which an orderly transaction to sell assets or to transfer liability would take place between market participants at the measurement date, under current market conditions. The Trustee has delegated to each investment firm, the responsibility to determine the fair value of an investment security when a price is not available from a pricing service or broker-dealer. The investment firm’s Portfolio Management and Performance Committee (Valuation Committee) is responsible for determining whether the price provided by a pricing service or broker-dealer does not approximate fair value.
Investment Valuation and Income Recognition
Investments are reported at fair value, with realized and unrealized gains and losses included in the Statement of Changes in Fund Net Position. The Government Accounting Standards Board (GASB) issued Statement 40, Deposit and Investment Risk Disclosures, provides disclosure guidance requirements on deposits and investments of state and local governments that are exposed to investment risks related to credit risk, concentration of credit risks, interest rate risk, and foreign currency risk. As an element of interest rate risk, this Statement requires certain disclosures of investments that have fair values that are highly sensitive to changes in interest rates.
In addition, deposits that are not covered by depository insurance and are (a) uncollateralized, (b) collateralized with securities held by the pledging financial institution, or (c) collateralized with securities held by the pledging financial institution’s agent, but not in the depositor-government’s name, are part of the requirements of this Statement.

GOVERNMENT OF THE DISTRICT OF COLUMBIA OTHER POST-EMPLOYMENT BENEFITS FUND
Notes to Financial Statements September 30, 2016 and 2015
13
NOTE 2 - SUMMARY OF SIGNIFICANT ACCOUNTING POLICIES (continued)
Investment Valuation and Income Recognition (continued)
Also, investment securities that are uninsured, are not registered in the name of the government, and are held by either (a) the counterparty; or (b) the counterparty’s trust department or agent, but not in the government’s name, are also part of the requirements of this Statement. GASB Statement 40 was effective for periods beginning after June 15, 2004. See note 6 for the related deposits and investment risk disclosures.
GASB Statement 72, Fair Value Measurement and Application, provides disclosure guidance requirements on fair value measurement of investments of state and local governments that are exposed to investment risks relate d to credit risk, concentration of credit risks, interest rate risk, and foreign currency risk. GASB 72 also clarifies the definition of fair value for financial reporting, establishes a framework for measuring fair value, and requires additional disclosures about the use of fair value measurements. GASB 72 established a three-level valuation hierarchy for disclosure of fair value measurements. The valuation hierarchy is based upon the transparency of inputs to the valuation of an asset or liability as of the measurement date. The three levels are defined as follows:
Level 1 – observable market inputs that are unadjusted quoted prices for identical assets or liabilities in active markets that a government can access at the measurement date.
Level 2 – inputs, other than quoted prices included within Level 1 - that are observable for the asset or liability, either directly or indirectly (for example, quoted prices for similar assets or liabilities in active markets).
Level 3 – inputs to the valuation methodology are unobservable and significant to the fair value measurement (including the District’s own assumptions in determining the fair value of investments).
Adoption of New Accounting Standards
During the fiscal year ended September 30, 2016, the Fund adopted GASB No. 72, Fair Value Measurement and Application, which addresses accounting and financial reporting issues related to fair value measurements. See Note 6 for more information on fair value measurements. The Fund also adopted GASB No. 76, Hierarchy of Generally Accepted Accounting Principles for State and Local Governments, and GASB No. 79, Certain External Investment Pools and Pool Participants. The adoption of GASB No. 72 added material disclosures to the financial statements. There are no significant changes to the financial statements from the adoption of the remaining above GASB statements.
Future Accounting Standards
In June 2015, the GASB approved the issuance of two new statements that are designed to improve the usefulness of information about OPEB in the general purpose external financial reports of state and local governmental plans, for making decisions and assessing accountability:
• Statement No. 74, Financial Reporting for Postemployment Benefit Plans Other Than Pension Plans,addresses financial reporting by plans that administer OPEB benefits on behalf of governments.
• Statement No. 75, Accounting and Financial Reporting for Postemployment Benefits Other Than Pensions,addresses accounting and financial reporting by government employers.

GOVERNMENT OF THE DISTRICT OF COLUMBIA OTHER POST-EMPLOYMENT BENEFITS FUND Notes to Financial Statements September 30, 2016 and 2015
14
NOTE 2 - SUMMARY OF SIGNIFICANT ACCOUNTING POLICIES (continued) Future Accounting Standards (continued) The new GASB Statements include requirements for defined benefit OPEB plans that replace the requirements of Statements No. 43, Financial Reporting for Postemployment Benefit Plans Other Than Pension Plans; and No. 57, OPEB Measurements by Agent Employers and Agent Multiple-Employer Plans. They also include requirements for defined contribution OPEB plans that replace the requirements of Statement No. 25, Financial Reporting for Defined Benefit Pension Plans and Note Disclosures for Defined Contribution Plans, Statement 43; and Statement No. 50, Pension Disclosures. The provisions in GASB No. 74 are effective for financial statements for fiscal years beginning after June 15, 2016. The provisions in GASB No. 75 are effective for fiscal years beginning after June 15, 2017. Earlier application is encouraged. The Fund is studying the requirements of these Standards, and will adopt the Standards by the required implementation dates. The adoption of GASB No. 74 will add material disclosures to the financial statements. NOTE 3 – FUND DESCRIPTIONS AND CONTRIBUTION INFORMATION As of September 30, 2016 and 2015, the Fund had 1,279 and 995 annuitants receiving benefits, respectively. The 2016 participants were comprised of 982 firefighters, police, and teachers; and 297 general District employees. The 2015 participants were comprised of 765 firefighters, police, and teachers; and 230 general District employees. The premium expenses for the fiscal years ended September 30, 2016 and 2015, totaled $10,043,719 and $6,739,591, respectively. The insurance premiums attributable to police, fire, and teacher retirees for the fiscal years 2016 and 2015 totaled $8,853,071 and $6,182,198, respectively. All remaining insurance premiums are attributable to general employee retirees. The actuarial valuation for the fiscal year ended September 30, 2016, was based on the actuarial valuation performed as of September 30, 2014. The actuarial report, which was issued in March 2016, showed that there was a total of 938 retired participants. They consisted of 740 firefighters, police, and teachers; and 198 general employees. The actuarial valuation for the fiscal year ended September 30, 2015 was a roll-forward of the prior year’s valuation. The actuarial roll-forward report issued in February 2015, projected from data as of September 30, 2012, showed that there was a total of 555 retired participants. They consisted of 418 firefighters, police, and teachers; and 137 general employees. NOTE 4 – MASTER CUSTODIAN CONTRACT The Fund administrators have a Master Custodian Contract to reduce risk of loss and to improve security. Maintaining assets with the Master Custodian provides the additional advantage of tracking information provided by the investment managers, since the Master Custodian provides information on investment transactions from an independent source; as well as provide reporting capabilities for the Fund. NOTE 5 – CASH AND CASH EQUIVALENTS Custodial credit risk for cash and cash equivalents is the risk that, in the event of a financial institution failure, the Fund would not be able to recover the value of cash and cash equivalents. The Fund, through its investment firms, maintains certain cash and cash equivalent balances.

GOVERNMENT OF THE DISTRICT OF COLUMBIA OTHER POST-EMPLOYMENT BENEFITS FUND
Notes to Financial Statements September 30, 2016 and 2015
15
NOTE 5 – CASH AND CASH EQUIVALENTS (continued)
These balances are not required to be collateralized by statute or policy. The Fund maintains cash and cash equivalents in investments accounts, as detailed below, as of September 30, 2016 and 2015:
Funds by Investment Firm 2016 2015Cash account 5,696,474$ 8,174,802$ Bernstein Strategic Core 5,813,644 20,141,213 Brandywine Large Cap Value 7,732,792 4,221,623 Farr, Miller Washington Large Cap Growth 11,250,579 9,727,718 ClearBridge Mid Cap 1,741,300 2,000,751 Bernstein Global Plus 4,797,656 1,392,844 Total Cash and Cash Equivalents 37,032,445$ 45,658,951$
September 30,
NOTE 6 – INVESTMENTS
The majority of the Fund’s assets as of September 30, 2016 and 2015 were investments, which totaled $1,173,912,217 and $1,045,568,954, respectively. The assets are invested with ten different investment firms. As of September 30, 2016 and 2015, the funds were invested in equities, (57.34% and 55.48%); debt securities, (36.16% and 36.30%); and commodities, (3.44% and 4.03%), respectively. The fair values of each investment firm’s assets, as of September 30, 2016 and 2015, are as follows:
Equity Funds by Investment Firm Amount Percentage* Amount Percentage*Brandywine Large Cap Value 159,536,709$ 13.17% 147,829,500$ 13.55%Farr, Miller Washington Large Cap Growth 148,250,622 12.24% 130,188,561 11.93%ClearBridge Mid Cap 115,495,089 9.54% 107,922,838 9.89%Barclays International 124,877,416 10.31% 92,541,381 8.48%SSgA Russell Sm Cap Index Fund 64,117,391 5.29% - 0.00%SSgA Emerging Markets Equity Index 79,098,948 6.53% 67,832,670 6.22%Royce Pennsylvania Mutual Fund 2,997,595 0.25% 59,131,783 5.42%Total Equity 694,373,770$ 57.34% 605,446,733$ 55.48%
Debt securities Funds by Investment Firm Amount Percentage* Amount Percentage*Bernstein Strategic Core 153,187,850$ 12.65% 134,093,167$ 12.29%Bernstein Global Plus 148,450,350 12.26% 133,532,324 12.24%SSgA Bond Index 81,086,049 6.70% 77,065,566 7.06%Access Capital ETI 31,270,951 2.58% 30,318,810 2.78%Blue Bay Emerging Markets Debt Fund 23,864,644 1.97% 21,129,275 1.94%Total Debt Securities 437,859,844$ 36.16% 396,139,142$ 36.30%
Commodities Funds by Investment Firm Amount Percentage* Amount Percentage*Gresham Commodities Fund 41,678,603$ 3.44% 44,001,079$ 4.03%
* Includes cash and investments.
2016 2015September 30,

GOVERNMENT OF THE DISTRICT OF COLUMBIA OTHER POST-EMPLOYMENT BENEFITS FUND Notes to Financial Statements September 30, 2016 and 2015
16
NOTE 6 – INVESTMENTS (continued) GASB 72 establishes a three-level valuation hierarchy for disclosure of fair value measurements. The valuation hierarchy is based upon the transparency of inputs to the valuation of an asset or liability as of the measurement date. An asset or a liability categorization within the valuation hierarchy is based upon the lowest level of input that is significant to the fair value measurement. The summary of inputs used to determine the fair valuation of the Fund’s investments as of September 30, 2016 and 2015 is as follows. Cash equivalents: This investment category consists of highly liquid investments having a maturity of three months or less, with minimal risk of a change in value due to their frequent pricing and ease of converting to cash. As such these investments are rendered Level 1 in the fair value hierarchy. See Note 5 Cash and Cash Equivalents for a more detail description. Equity securities and mutual funds: These investments are classified as Level 1 of the fair value hierarchy, and are valued using prices quoted in active markets for those securities. The mutual funds held in equities are deemed to be actively traded, and support classification of the fair value measurement as Level 1 in the fair value hierarchy. Real Estate Investment Trust Securities investments, classified as Level 3, are valued using either a discounted cash flow or market comparable company’s technique. Debt securities, classified as Level 2 of the fair value hierarchy, are valued using market pricing and other observable market inputs for similar securities from a number of data providers, standard in the industry; or a broker quote in a non-active market. Collateralized auto loan securities, which are included in Collaterized Debt Obligations, are classified in Level 3; and are valued using consensus pricing. The mutual funds held in bonds are classified as Level 2. Commodities Fund: The investment objectives of the fund are to provide a partial price hedge with an attractive risk/return profile, as compared to other products using a commodity index or a pool of commodities. Partial or complete redemption may be made, upon five (5) days’ prior written notice, on the last business day of each calendar month or at such times and on such terms as the General Partner of the fund may, in his/her sole discretion, allow. The valuation techniques and inputs categorization within the valuation hierarchy is based upon Level 3; and uses the income approach, where the advisor considers a list of factors to determine whether there has been significant decrease in the relation to normal market activity. Investment derivative instruments: The Fund’s derivative financial instruments are valued by a third-party investment fund’s manager, based on prevailing market data derived from proprietary models, and are carried at fair value. The Fund had three types of off-balance sheet derivative financial instrument outstanding. These derivative instruments are financial contracts, whose values depend on the value of one or more underlying assets, or reference rates or financial indices, which dictate the rate of change of output with respect to the financial contracts. The financial instruments categorization within the valuation hierarchy is based upon Level 2, which is the lowest level of input that is significant to the fair value measurement. Investments measured at the NAV: This investment category consists of three (3) funds that include hedge funds and other funds/products that employ dynamic trading strategies aiming at achieving absolute returns. These alternative investment funds are organized as limited partnerships that are not traded on an exchange, and do not redeem shares on a daily basis. The funds have varying restrictions on liquidity and transferability. The fair values of the investments in this type have been determined, using the NAV per share of the investments. The funds have varying redemption restrictions such as “lock-ups” or “gates”. A lock-up period is a window of time when investors of a hedge fund or another closely held investment vehicle are not allowed to redeem or sell shares.

GOVERNMENT OF THE DISTRICT OF COLUMBIA OTHER POST-EMPLOYMENT BENEFITS FUND
Notes to Financial Statements September 30, 2016 and 2015
17
NOTE 6 – INVESTMENTS (continued)
A gate is a restriction placed on a hedge fund limiting the amount of withdrawals from the fund during a redemption period. These investments have redemption frequency that range from monthly to quarterly, and a redemption notice period that ranges from five to 30 calendar days.
As of September 30, 2016 and 2015, the Fund had the following recurring fair value measurements:
Quoted Prices in Active Markets
for Identical Assets
Significant Other Observable
Inputs
Significant Unobservable
Inputs
As of September 30, 2016 Total (Level 1) (Level 2) (Level 3)Investments by fair value level
Cash equivalents 35,590,713$ 35,590,713$ -$ -$
Equity securitiesUS equities (by Industry)
Industrials 113,526,199 113,526,199 - - Consumer Retail 86,868,839 86,868,839 - - Information Technology 62,095,087 62,095,087 - - Financial Institutions 77,405,341 77,405,341 - - HealthCare 53,112,076 53,112,076 - - Other 5,852,428 5,852,428 - -
International equitiesConsumer Retail 2,959,530 2,959,530 - - Information Technology 3,131,368 3,131,368 - - Industrials 7,965,066 7,965,066 - -
Real estate investment trust securities 10,537,975 - - 10,537,975 Mutual funds 67,114,986 67,114,986 - -
Total equity securities 490,568,895 480,030,920 - 10,537,975
Debt securitiesUS Government Issues 24,689,899 - 24,689,899 - International Government Issues 123,242,469 - 123,242,469 - Corporate Bonds 82,541,212 - 82,541,212 - Mortgage backed Securities 57,195,033 - 54,448,326 2,746,707 Credit Card/ Automotive Receivables 13,434,071 - - 13,434,071 Mutual funds 112,357,000 - 112,357,000 - US State and Local Government Bonds 364,027 - 364,027 -
Total debt securities 413,823,711 - 397,642,933 16,180,778
Commodity investmentsGresham commodities fund 41,678,603 - - 41,678,603
Total Investments by Fair Value Level 981,661,922$ 515,621,633$ 397,642,933$ 68,397,356$
Investments measured at the Net Asset Value (NAV)
SSGA Emerging Mkts Equity Index 79,098,948$ Barclay International Growth fund 124,877,416 Blue Bay Emerging Market Debt Fund 23,864,644 Total investments measured at the NAV 227,841,008 Total investments measured at fair value 1,209,502,930$
Investment derivative instrumentsInterest rate swaps (246,824)$ -$ (246,824)$ -$ Credit defaults swaps 3,135 - 3,135 - Foreign exchange forwards 28,307 - 28,307 - Total Investment derivative instruments (215,382)$ -$ (215,382)$ -$
Fair Value Measurements Using
GOVERNMENT OF THE DISTRICT OF COLUMBIA OTHER POST-EMPLOYMENT BENEFITS FUND
Notes to Financial Statements September 30, 2016 and 2015
18
NOTE 6 – INVESTMENTS (continued)
Quoted Prices in Active Markets
for Identical Assets
Significant Other Observable
Inputs
Significant Unobservable
Inputs
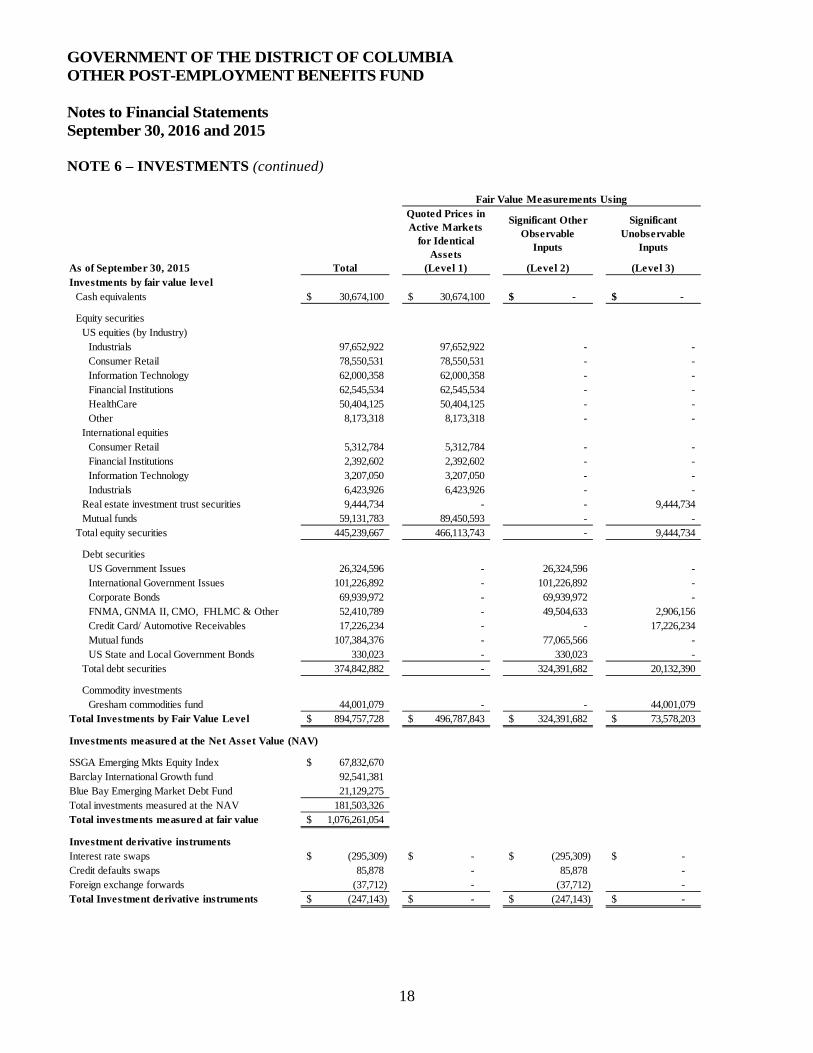
As of September 30, 2015 Total (Level 1) (Level 2) (Level 3)Investments by fair value level
Cash equivalents 30,674,100$ 30,674,100$ -$ -$
Equity securitiesUS equities (by Industry)
Industrials 97,652,922 97,652,922 - - Consumer Retail 78,550,531 78,550,531 - - Information Technology 62,000,358 62,000,358 - - Financial Institutions 62,545,534 62,545,534 - - HealthCare 50,404,125 50,404,125 - - Other 8,173,318 8,173,318 - -
International equitiesConsumer Retail 5,312,784 5,312,784 - - Financial Institutions 2,392,602 2,392,602 - - Information Technology 3,207,050 3,207,050 - - Industrials 6,423,926 6,423,926 - -
Real estate investment trust securities 9,444,734 - - 9,444,734 Mutual funds 59,131,783 89,450,593 - -
Total equity securities 445,239,667 466,113,743 - 9,444,734
Debt securitiesUS Government Issues 26,324,596 - 26,324,596 - International Government Issues 101,226,892 - 101,226,892 - Corporate Bonds 69,939,972 - 69,939,972 - FNMA, GNMA II, CMO, FHLMC & Other 52,410,789 - 49,504,633 2,906,156 Credit Card/ Automotive Receivables 17,226,234 - - 17,226,234 Mutual funds 107,384,376 - 77,065,566 - US State and Local Government Bonds 330,023 - 330,023 -
Total debt securities 374,842,882 - 324,391,682 20,132,390
Commodity investmentsGresham commodities fund 44,001,079 - - 44,001,079
Total Investments by Fair Value Level 894,757,728$ 496,787,843$ 324,391,682$ 73,578,203$
Investments measured at the Net Asset Value (NAV)
SSGA Emerging Mkts Equity Index 67,832,670$ Barclay International Growth fund 92,541,381 Blue Bay Emerging Market Debt Fund 21,129,275 Total investments measured at the NAV 181,503,326 Total investments measured at fair value 1,076,261,054$
Investment derivative instrumentsInterest rate swaps (295,309)$ -$ (295,309)$ -$ Credit defaults swaps 85,878 - 85,878 - Foreign exchange forwards (37,712) - (37,712) - Total Investment derivative instruments (247,143)$ -$ (247,143)$ -$
Fair Value Measurements Using

GOVERNMENT OF THE DISTRICT OF COLUMBIA OTHER POST-EMPLOYMENT BENEFITS FUND
Notes to Financial Statements September 30, 2016 and 2015
19
NOTE 6 – INVESTMENTS (continued)
Investments measured at NAV were as follows:
Investment 2016 2015SSgA Emerging Markets (1) 79,098,948$ 67,832,670$ None Monthly 30 daysBarclays International (2) 124,877,416 92,541,381 None Monthly 5 daysBlue Bay Emerging Markets Debt Fund (3) 23,864,644 21,129,275 None Monthly 30 daysTotal Investments Measured at NAV 227,841,008$ 181,503,326$
Unfunded Commitments
Redemption Frequency
(If Currently Eligible)
Redemption Notice Period
Fair Value as of September 30,
1) SSgA Emerging Markets Equity Fund: The Fund’s investment objective is to produce long-term capitalgrowth. The Fund seeks to achieve its investment objective by primarily investing in a diversified portfolioof equity securities and equity-related securities; which are, or for which the underlying securities are, tradedin emerging markets. Redemptions, in aggregate, by Shareholders on any Dealing Day (First Business Dayof each month) may be limited to 20% of the number of Shares within each Share Class then in issue at theend of the previous Dealing Day. In the event that aggregate requests are received for redemptionsexceeding 20% of the number of Shares within any Share Class in issue at the end of the previous DealingDay, any non-redeemed balance of Shares over the said 20% level shall be held over on a pro-rata basis untilthe next Dealing Day, where they shall be redeemed in priority to new redemption requests received inrespect of such Dealing Day. No issue or redemption of Shares will take place during any period when thecalculation of the Net Asset Value is suspended.
2) Barclays International Emerging Markets Equity, Value and Growth Funds: The Fund’s investmentobjective is to produce long-term capital growth. The Fund seeks to achieve its investment objective, byprimarily investing in a diversified portfolio of equity securities and equity-related securities; which are, orfor which the underlying securities are, traded in emerging markets. Redemptions, in aggregate, byShareholders on any Dealing Day (First Business Day of each month) may be limited to 20% of the numberof Shares within each Share Class then in issue at the end of the previous Dealing Day. In the event thataggregate requests are received for redemptions exceeding 20% of the number of Shares within any ShareClass in issue at the end of the previous Dealing Day, any non-redeemed balance of Shares over the said20% level shall be held over on a pro-rata basis until the next Dealing Day, where they shall be redeemed inpriority to new redemption requests received in respect of such Dealing Day. No issue or redemption ofShares will take place during any period when the calculation of the Net Asset Value is suspended.
3) Blue Bay Emerging Markets Debt Fund: The investment objectives of this Fund are to achieve favorableincome-oriented returns from a globally diversified portfolio of primarily developing market debt or debt-like securities, and preservation and enhancement of principal. Participating Shares may be redeemedmonthly, with five (5) days prior written notice, on the last business day of each calendar month; or at suchtimes, and on such terms as the Board of Directors of the Fund may, in their sole discretion, allow.

GOVERNMENT OF THE DISTRICT OF COLUMBIA OTHER POST-EMPLOYMENT BENEFITS FUND
Notes to Financial Statements September 30, 2016 and 2015
20
NOTE 6 – INVESTMENTS (continued)
During the year ended September 30, 2016, the Fund recognized no transfers to/from Level 1 or 2. The Fund’s policy is to recognize transfers to/from Level 1, Level 2, and Level 3 at the end of the reporting period, utilizing fair value at the beginning of the period.
Custodial Credit Risk:
The custodial credit risk for investments is the risk that, in the event of the failure of the counterparty to a transaction, a government will not be able to recover the value of investments or collateral securities that are in the possession of an outside party. The counterparty is the party that pledges collateral or repurchase agreement securities to the government; or that sells investments to, or buys them for, the government.
The Fund’s investments are uninsured and unregistered, and are held by counterparty in the Fund’s name. The Fund is also subject to certain credit, interest rate, and foreign exchange risks.
Foreign Currency Risk:
The foreign currency risk is the risk that changes in exchange rates will adversely affect the fair value of an investment in a foreign financial institution. The Fund does not have a formal policy for limiting its exposure to changes in exchange rates. The Fund’s investments as of September 30, 2016 and 2015, held in currencies other than US dollars, were as follows:
As of September 30, 2016
International SecuritiesShort Term and
CashConvertible and
Fixed Income TotalAUSTRALIAN DOLLAR (12,605)$ 88,097$ 75,492$ BRAZILIAN REAL - 4,815,641 4,815,641 CANADIAN DOLLAR 68,486 12,987,366 13,055,852 EURO CURRENCY (33,166) 50,228,538 50,195,372 JAPANESE YEN 160,189 32,768,560 32,928,749 MEXICAN PESO - 2,507,187 2,507,187 NEW ZEALAND DOLLAR 20,037 (4,673) 15,364 NORWEGIAN KRONER 23,344 80,717 104,061 POLISH ZLOTY 20,223 802,323 822,546 POUND STERLING 93,127 13,506,239 13,599,366 RUSSIAN RUBLE - 401,123 401,123 SINGAPORE DOLLAR - 334,347 334,347 SOUTH AFRICAN RAND 17,840 262,415 280,255 SWEDISH KRONA - 968,982 968,982 TURKISH LIRA - 353,615 353,615 Totals 357,475$ 120,100,477$ 120,457,952$

GOVERNMENT OF THE DISTRICT OF COLUMBIA OTHER POST-EMPLOYMENT BENEFITS FUND Notes to Financial Statements September 30, 2016 and 2015
21
NOTE 6 – INVESTMENTS (continued) As of September 30, 2015
International SecuritiesShort Term and
CashConvertible and
Fixed Income TotalAUSTRALIAN DOLLAR 5,248$ 3,928,846$ 3,934,094$ BRAZILIAN REAL 31,356 1,212,689 1,244,045 CANADIAN DOLLAR 142,218 17,382,110 17,524,328 EURO CURRENCY 299,962 47,136,677 47,436,639 JAPANESE YEN 13,879,308 27,415,774 41,295,082 NEW ZEALAND DOLLAR 86,946 - 86,946 POUND STERLING 8,668 17,369,962 17,378,630 SINGAPORE DOLLAR - 291,551 291,551 SOUTH AFRICAN RAND 14,495 262,672 277,167 SWEDISH KRONA - 1,036,858 1,036,858 Totals 14,468,201$ 116,037,139$ 130,505,340$
The Plan’s investments are uninsured and unregistered, and are held by a counterparty, in the Plan’s name. The Plan is also subject to certain credit, interest rate, and foreign exchange risks. Credit Risk is the risk that an issuer to an investment will not fulfill its obligations. The average quality of the entire bond holdings in each investment manager’s portfolio should be maintained at “A” or better. For portfolios that were not individually managed, the credit quality exceeded the index value of “BBB-”. Exchange-traded derivatives that are valued, using quoted prices, are classified within level 1 of the valuation hierarchy. The Fund has not failed to access collateral, when required. Since these derivative products have been established for some time, the Fund uses models that are widely accepted in the financial services industry. These models reflect the contractual terms of the derivatives, including the period to maturity; and market-based parameters such as interest rates, volatility, and the credit quality of the counterparty. Further, many of these models do not contain a high level of subjectivity, as the methodologies used in the models do not require significant judgment, and inputs to the model are readily observable from actively quoted contracts and credit default swaps. Such instruments are generally classified within level 2 on the valuation hierarchy. The aggregate fair value of derivatives in net asset positions, net of collateral posted by the counter party; and the effect of master netting arrangements are reflected in net unrealized gain (loss) on Foreign Currency Spot Forward Contracts, in the table above. Although the Fund executes hedging derivative instruments with various counter parties; eight contracts, comprising approximately 90 percent of the net exposure to credit risk, are based with two counterparties. As of September 30, 2016 and 2015, the average quality ratings of those counterparties were as follows: SSgA was Aa2, and Access Capital was AAA. There are no significant concentrations of net exposure to credit risk that has not been reduced by collateral and other set-offs. Interest rate risk is the risk that changes in interest rates will adversely affect the fair value of an investment. The Fund addresses interest rate risk, through a process that focuses on the review of investment managers and fund returns. The Fund also uses an independent consultant to examine how sensitive the fixed income portfolios’ underlying assets are to moves in interest rates, and to recommend any appropriate investment manager changes.

GOVERNMENT OF THE DISTRICT OF COLUMBIA OTHER POST-EMPLOYMENT BENEFITS FUND
Notes to Financial Statements September 30, 2016 and 2015
22
NOTE 6 – INVESTMENTS (continued)
The average duration was as follows, by investment firm, for the years ended September 30, 2016 and 2015:
Investment Firm 2016 2015Bernstein US Core Plus 5.00 5.25Bernstein Global XUS Plus 7.50 6.74Access Capital ETI 2.93 3.79SSgA Bond Index Fund 5.44 5.59Blue Bay Emerging Market 6.70 5.81
September 30,
Derivative Financial Instruments: In accordance with the Fund’s investment policies, the Fund regularly invests in derivative financial instruments with off-balance-sheet risk in the normal course of its investing activities, in order to enhance return on investment and manage exposure to certain risks within the fund. Derivative instruments are financial contracts, whose values depend on the value of one or more underlying assets, reference rates, or financial indices. During fiscal year 2016, the Fund invested directly in forward currency contracts.
At September 30, 2016 and September 30, 2015, the Fund had two types of off-balance-sheet derivative financial instrument outstanding: swaps and currency forwards. The Swaps represents Interest Swaps and Credit Default Swaps which are used to hedge interest rate and credit exposure risks. Currency forwards represent foreign exchange contracts, and are used to effect settlements and to protect the base currency value of portfolio assets denominated in foreign currencies, against fluctuations in the exchange rates of those currencies or to gain exposure to the change in market value of a specific currency. A forward foreign currency exchange contract is a commitment to purchase or sell a foreign currency at a future date and at a negotiated price. The credit risk of currency contracts that are exchange-traded lies with the clearinghouse of the exchange where the contracts are traded. The credit risk of currency contracts traded over the counter lies with the counterparty, and exposure usually is equal to the unrealized profit on in-the-money contracts. The market risk in foreign currency contracts is related to adverse movements in currency exchange rates.

GOVERNMENT OF THE DISTRICT OF COLUMBIA OTHER POST-EMPLOYMENT BENEFITS FUND
Notes to Financial Statements September 30, 2016 and 2015
23
NOTE 6 – INVESTMENTS (continued)
Below is the list of derivatives aggregated by investment type, as of September 30, 2016 and 2015:
As of September 30, 2016
Investment Derivatives Classification Amount Classification Amount Notional AmountCredit Default Swaps Bought Investment Revenue (79,291)$ Swaps (20,631)$ 506,000$ Credit Default Swaps Written Investment Revenue (3,451) Swaps 23,766 2,420,000 Equity Options Written Investment Revenue 21,449 Options - - Fixed Income Futures Long Investment Revenue 594,237 Futures - 30,435,291 Fixed Income Futures Short Investment Revenue (502,707) Futures - (14,635,958) FX Forwards Investment Revenue 2,656,917 Long Term Instruments 28,307 113,520,188 Pay Fixed Interest Rate Swaps Investment Revenue (232,897) Swaps (444,866) 62,063,981 Receive Fixed Interest Rate Swaps Investment Revenue 240,931 Swaps 198,042 4,419,585 Total 2,695,188$ (215,382)$
Change in Fair Value Fair Value as of September 30, 2016
As of September 30, 2015
Investment Derivatives Classification Amount Classification Amount Notional AmountCredit Default Swaps Bought Investment Revenue 71,110$ Swaps 58,660$ 506,000$ Credit Default Swaps Written Investment Revenue (16,502) Swaps 27,218 2,420,000 Fixed Income Futures Long Investment Revenue 186,314 Futures - 21,413,520 Fixed Income Futures Short Investment Revenue (465,644) Futures - (11,630,123) FX Forwards Investment Revenue (21,352) Long Term Instruments (37,712) 91,530,346 Pay Fixed Interest Rate Swaps Investment Revenue (527,323) Swaps (461,629) 33,293,695 Receive Fixed Interest Rate Swaps Investment Revenue 297,623 Swaps 166,320 8,458,383 Total (475,774) (247,143)
Change in Fair Value Fair Value as of September 30, 2015

GOVERNMENT OF THE DISTRICT OF COLUMBIA OTHER POST-EMPLOYMENT BENEFITS FUND
Notes to Financial Statements September 30, 2016 and 2015
24
NOTE 6 – INVESTMENTS (continued)
Contingencies:
All of the Fund’s derivative instruments include provisions that require the Fund to post collateral in the event its credit rating falls below “AA” as issued by Standard & Poor’s, or “Aa” as issued by Moody’s Investors Services. The collateral posted is to be in the form of U.S. Treasury funds in the amount of the fair value hedging derivative instruments in liability positions, net of the effect of applicable netting arrangements. If the Fund does not post collateral, the hedging derivative instrument may be terminated by the counterparty. As of September 30, 2016 and 2015, the aggregate fair value of all hedging derivative instruments with these collateral posting provisions was $10,493 and ($83,170), respectively. If the collateral posting requirements were triggered, the Fund would be required to post the aggregate fair value in collateral to its counterparties. The District has an “Aa” rating; therefore, no collateral has been required to be posted as of September 30, 2016 and 2015.
The net unrealized gain (loss) on foreign currency spot and forward contracts for the years ended September 30, 2016 and 2015, were as follows:
As of September 30, 2016:
Foreign Currency Contracts Purchased Cost
Unrealized Gain/(Loss)
ARGENTINE PESO 302,069$ 25,916$ AUSTRALIAN DOLLAR 3,580,932 21,309 BRAZILIAN REAL 6,757,508 (7,810) SWISS FRANC 1,852,833 18,668 CZECH KORUNA 3,462,057 40,458 DANISH KRONE 779,322 (1,413) EURO CURRENCY 15,220,094 175,424 GREAT BRITAIN POUND 2,287,625 4,130 ISRAELI SHEKEL 228,120 3,575 INDIAN RUPEE 1,117,240 4,702 JAPANESE YEN 28,421,599 (47,326) SOUTH KOREAN WON 3,266,265 33,678 MEXICAN PESO 833,139 11,464 MALAYSIAN RINGGIT 740,862 (432) NORWEGIAN KRONER 303,966 6,402 NEW ZEALAND DOLLAR 322,341 11,853 RUSSIAN RUBLE 1,327,857 33,231 SWEDISH KRONA 1,714,379 (22,362) THAI BAHT 560,326 5,085 TURKISH LIRA 449,069 (2,261) NEW TAIWAN DOLLAR 1,532,034 9,124 SOUTH AFRICAN RAND 273,522 (952) Total Contracts Purchased 322,463$

GOVERNMENT OF THE DISTRICT OF COLUMBIA OTHER POST-EMPLOYMENT BENEFITS FUND
Notes to Financial Statements September 30, 2016 and 2015
25
NOTE 6 – INVESTMENTS (continued)
As of September 30, 2016 (continued):
Foreign Currency Contracts Sold Cost
Unrealized Gain/(Loss)
AUSTRALIAN DOLLAR 72,767 565 BRAZILIAN REAL 10,629,668 (154,471) CANADIAN DOLLAR 11,370,407 268,591 EURO CURRENCY 5,731,589 (45,045) JAPANESE YEN 10,940,843 (324,660) POLISH ZLOTY 376,134 (14,338) RUSSIAN RUBLE 1,110,979 (29,290) SINGAPORE DOLLAR 3,679,172 3,076 NEW TAIWAN DOLLAR 1,523,272 (16,398)
Total Contracts Sold (311,970)
10,493$ Net unrealized gain (loss) on foreign currency spot and forward contracts

GOVERNMENT OF THE DISTRICT OF COLUMBIA OTHER POST-EMPLOYMENT BENEFITS FUND Notes to Financial Statements September 30, 2016 and 2015
26
NOTE 6 – INVESTMENTS (continued) As of September 30, 2015:
Foreign Currency Contracts Purchased Cost
Unrealized Gain/(Loss)
AUSTRALIAN DOLLAR 337,183$ (3,285)$ BRAZILIAN REAL 434,242 (989) BRAZILIAN REAL 1,390,828 4,370 BRAZILIAN REAL 956,586 (2,179) CANADIAN DOLLAR 628,434 (7,284) CANADIAN DOLLAR 11,343,256 (18,559) SWISS FRANC 1,686,707 (6,516) SWISS FRANC 151,525 (413) CZECH KORUNA 114,921 (809) DANISH KRONE 681,824 (9,646) EURO CURRENCY 1,238,627 (11,846) EURO CURRENCY 9,563,025 (127,910) EURO CURRENCY 6,108,221 13,952 EURO CURRENCY 152,040 (106) GREAT BRITAIN POUND 1,573,422 (22,755) GREAT BRITAIN POUND 5,773,192 (40,473) INDONESIAN RUPIAH 1,084,813 (43,673) INDONESIAN RUPIAH 141,989 (3,811) ISRAELI SHEKEL 218,076 (3,687) ISRAELI SHEKEL 218,076 300 JAPANESE YEN 4,810,819 11,071 JAPANESE YEN 18,364,458 49,242 SOUTH KOREAN WON 335,141 47 SOUTH KOREAN WON 2,605,774 6,592 MEXICAN PESO 772,758 2,860 MALAYSIAN RINGGIT 575,254 (19,870) MALAYSIAN RINGGIT 353,912 (14,081) MALAYSIAN RINGGIT 185,242 (9,740) NORWEGIAN KRONE 270,450 (11,263) NEW ZEALAND DOLLAR 283,556 (9,481) POLISH ZLOTY 441,524 (3,214) RUSSIAN ROUBLE 108,478 4,192 SWEDISH KRONA 1,436,874 (23,693) THAI BAHT 534,931 (5,725) TURKISH LIRA 333,460 5,938 SOUTH AFRICAN RAND 110,335 (2,194) SOUTH AFRICAN RAND 87,455 (1,133) SOUTH AFRICAN RAND 88,359 (3,163) SOUTH AFRICAN RAND 176,747 (6,495) Total Contracts Purchased (315,429)$

GOVERNMENT OF THE DISTRICT OF COLUMBIA OTHER POST-EMPLOYMENT BENEFITS FUND
Notes to Financial Statements September 30, 2016 and 2015
27
NOTE 6 – INVESTMENTS (continued)
Foreign Currency Contracts Sold Cost
Unrealized Gain/(Loss)
AUSTRALIAN DOLLAR 814,444$ (828)$ AUSTRALIAN DOLLAR 447,335 (1,060) BRAZILIAN REAL 1,390,828 3,168 BRAZILIAN REAL 1,390,828 (4,400) BRAZILIAN REAL 956,586 94,977 BRAZILIAN REAL 434,242 5,095 CANADIAN DOLLAR 147,498 979 CANADIAN DOLLAR 11,343,256 18,002 CANADIAN DOLLAR 8,600,822 (41) CANADIAN DOLLAR 3,370,868 42,359 EURO CURRENCY 546,944 7,316 EURO CURRENCY 249,588 871 EURO CURRENCY 4,651,946 17,243 EURO CURRENCY 239,072 4,588 EURO CURRENCY 1,159,344 16,287 EURO CURRENCY 152,040 100 EURO CURRENCY 182,237 4,427 GREAT BRITAIN POUND 4,518,515 32,760 GREAT BRITAIN POUND 5,036,914 69,874 INDONESIAN RUPIAH 176,946 (360) INDONESIAN RUPIAH 239,167 (2,132) INDONESIAN RUPIAH 26,576 (237) INDONESIAN RUPIAH 239 (2) INDONESIAN RUPIAH 67,441 (342) INDONESIAN RUPIAH 116,617 (560) INDONESIAN RUPIAH 117 (1) INDONESIAN RUPIAH 2,070 (10) INDONESIAN RUPIAH 522,521 (885) INDONESIAN RUPIAH 66,138 (534) ISRAELI SHEKEL 218,076 (420) JAPANESE YEN 2,087,421 1,414 JAPANESE YEN 6,846,742 (52,730) JAPANESE YEN 1,669,937 975 JAPANESE YEN 3,172,880 (102,680) JAPANESE YEN 2,454,442 2,437 JAPANESE YEN 4,644,939 (36,102) MALAYSIAN RINGGIT 429,570 31,881 MALAYSIAN RINGGIT 113,863 7,356 SWEDISH KRONA 221,067 (945) SWEDISH KRONA 1,235,769 14,415 SINGAPORE DOLLAR 2,324,496 38,165 SINGAPORE DOLLAR 278,006 763 TAIWAN DOLLAR 564,893 9,006 SOUTH AFRICAN RAND 267,646 12,070
Total Contracts Sold 232,259
(83,170)$ Net unrealized gain (loss) on foreign currency spot and forward contracts

GOVERNMENT OF THE DISTRICT OF COLUMBIA OTHER POST-EMPLOYMENT BENEFITS FUND
Notes to Financial Statements September 30, 2016 and 2015
28
NOTE 7- DISTRICT CONTRIBUTIONS
The District, historically, makes its contributions to the Fund near the completion of its fiscal year, and the contribution is distributed by the Fund to the investment managers within a month of receipt from the District. Consequently, the significant cash balances in the Fund as of September 30, 2016 and 2015, were due to the receipt of the contribution of $29,000,000 and $91,400,000, respectively. The amounts were distributed as follows for the years ended September 30, 2016 and 2015:
FUND 2016 2015Access Capital ETI -$ $ 9,000,000 Barclays International 19,000,000 - Bernstein Global Plus - 46,400,000Gresham Commodities Fund - 11,000,000SSgA Emerging Markets Equity Index - 15,000,000State Street Cash Account 10,000,000 10,000,000 Total $ 29,000,000 $ 91,400,000
September 30,
NOTE 8 – CONTINGENCIES
The Fund is party to various legal proceedings, many of which occur in the normal course of the Fund’s operations. These legal proceedings are not, in the opinion of the Office of the Attorney General of the District of Columbia, likely to have a material adverse impact on the Fund’s financial position as of September 30, 2016.
The Fund invests in various investment securities. Investment securities are exposed to various risks, such as interest rate risk, market risk, and credit risk. Due to the level of risk associated with certain investment securities, it is at least reasonably possible that changes in the value of investment securities will occur in the near term, and that such changes could materially affect the amounts reported in the accompanying statements of net position.
Fund contributions are made and the actuarial present value of accumulated plan benefits are reported based on certain assumptions pertaining to interest rates, inflation rates, and employee demographics, all of which are subject to change. Due to uncertainties inherent in the estimations and assumptions process, it is at least reasonably possible that changes in these estimates and assumptions in the near term would be material to the financial statements.
NOTE 9 – ACTUARIAL INFORMATION
Actuarial valuations of an ongoing Fund involve estimates of the value of reported amounts, and assumptions about the probability of occurrence of events far into the future. An example includes assumptions about future employment, mortality, and healthcare cost trends. Actuarially determined amounts are subject to continual revision as actual results are compared to past expectations, and new assumptions are made about the future.

GOVERNMENT OF THE DISTRICT OF COLUMBIA OTHER POST-EMPLOYMENT BENEFITS FUND
Notes to Financial Statements September 30, 2016 and 2015
29
NOTE 9 – ACTUARIAL INFORMATION (continued)
Projections of benefits for financial reporting purposes are based on the substantive Fund (the Fund as understood by the employer and the Fund members), and include the types of benefits provided at the time of each valuation and historical pattern of sharing of benefit costs between the employer and Fund members to that point. The actuarial methods and assumptions used include techniques that are designed to reduce the effects of short term volatility in actuarial accrued liabilities, and the actuarial value of assets, consistent with the long-term perspective of the calculations.
An independent actuary was retained by the District to perform an actuarial valuation of the District of Columbia Annuitants’ Health and Life Insurance Employer Contribution Plan (the “Plan”) as of September 30, 2014. The purpose of the valuation is to provide an estimate of the actuarial accrued liabilities of the Plan and the Annual Required Contribution (ARC) in accordance with the Statements of the Governmental Accounting Standards Board (GASB) numbered 43 and 45. The report was issued in March 2016.
Actuarial Cost Method Entry Age Normal Amortization Method Level Percent of Pay, Closed Remaining Amortization Period 20 years beginning with fiscal year end 2016 Asset Valuation Method Market Value Investment Rate of Return 6.50% Discount Rate 6.50% Salary Increase Rate 3.50% (plus merit scale) Medical Inflation Rate 7.2%, grading to 3.9%
Assumption utilizes the Society of Actuaries Getzen Medical Trend Model, and reaches the ultimate medical inflation rate in 2040.
Mortality The RP-2014 Healthy Employee Mortality Table with the MP-2014 Improvement Scale, fully generational, was used for General Employees and Teachers. For Police & Fire Employees, a combination of 50% of the RP-2014 Health Employee White Collar and 50% of the RP-2014 Healthy Employee Blue Collar Mortality Tables, both with the MP-2014 Improvement Scale fully generational, were used. For all disabled retirees, the RP-2014 Disabled Life Mortality Table was used.
Based on a projection of the September 30, 2014 valuation results, the September 30, 2015, estimated actuarial accrued liability (AAL) is $1,001,200,000 and the estimated actuarial value of the assets is $1,202,400,000, resulting in an estimated unfunded actuarial accrued liability (UAAL) of ($201,200,000).
Based on the September 2012 valuation results, the September 30, 2014, estimated actuarial liability was $1,188,300,000 and the actuarial value of the assets was $1,036,600,000, resulting in an estimated unfunded actuarial accrued liability (UAAL) of $151,700,000. The estimated covered payroll (annual payroll of active employees covered by the Plan) was $1,484,300,000, and the ratio of UAAL to covered payroll was 10.22%.

REQUIRED SUPPLEMENTARY INFORMATION

GOVERNMENT OF DISTRICT OF COLUMBIA OTHER POST-EMPLOYMENT BENEFITS FUND
Required Supplementary Information Schedule of Funding Progress (in millions)
31
Actuarial Valuation Date
Actuarial Value of Assets
Actuarial Accrued
Liability (AAL)Unfunded AAL
(UAAL)Funded Ratio
Covered Payroll
UAAL as a Percentage of
Covered Payroll9/30/2010 $ 424.3 $ 784.9 $ 360.6 54.06% $ 1,544.5 23.35%9/30/2011 511.5 866.6 355.1 59.02% 1,559.8 22.77%9/30/2012 693.3 919.7 226.4 75.38% 1,399.1 16.18%9/30/2013 897.8 1,048.0 150.2 85.67% 1,441.1 10.42%9/30/2014 1,036.6 1,188.3 151.7 87.23% 1,484.3 10.22%
9/30/2015 1,202.4 1,001.2 (201.2) 120.10% 1,608.0 -12.51%

GOVERNMENT OF DISTRICT OF COLUMBIA OTHER POST-EMPLOYMENT BENEFITS FUND
Required Supplementary Information Schedule of Employer Contributions (in millions)
32
Year Ended September 30,
Annual Required Contribution (ARC)
Percentage Contribution (%)
2011 $ 94.2 100.0%2012 95.5 115.0%2013 85.2 126.5%2014 86.6 100.0%2015 91.4 100.0%2016 29.0 100.0%

GOVERNMENT OF DISTRICT OF COLUMBIA OTHER POST-EMPLOYMENT BENEFITS FUND
Required Supplementary Information Notes to Required Supplementary Information
33
An independent actuary performed an actuarial analysis of the Fund’s assets and liabilities as of September 30, 2014; September 30, 2013; and September 30, 2012 to determine the future funding status of the Fund, which is outlined below. The analysis was based on census data as of September 30, 2014.
This data is presented below:
Valuation DateSeptember 30, 2015
(Projected from September, 2014 census)
September 30, 2014 (Projected from
September, 2012 census)
September 30, 2013 (Projected from
September, 2012 census)Actuarial Cost Method Entry Age Normal Entry Age Normal Entry Age NormalAmortization Method Level Percent of Pay, Closed Level Percent of Pay, Closed Level Percent of Pay, ClosedRemaining Amortization Period 20 Years 28 Years 29 YearsActuarial Assumptions:Investment Rate of Return 6.50% 7.00% 7.00%Discount Rate 6.50% 7.00% 7.00%Rate of Salary Increase 3.50% (plus merit scale) 3.75% (plus merit scale) 3.75% (plus merit scale)
Rate of Medical Inflation7.2%, grading down to 3.9% in 2040, using the SOA Getzen Medical Trend Model
8.0% (pre-Medicare) or 6.5% (post-Medicare), grading to 4.0% over 70 years
8.0% (pre-Medicare) or 6.5% (post-Medicare), grading to 4.0% over 70 years
As the Fund’s actuarial calculations are presented, based on the year for which they were prepared, the table below presents the seven most recent valuations prepared one year in arrears to the fiscal year for which they were prepared.
Analysis of the dollar amounts of actuarial valued assets, actuarial liability, and unfunded actuarial liability in isolation can be misleading. Expressing actuarial valued assets, as a percentage of the actuarial liability, provides one indication of the Fund’s funding status on a going concern basis. Analysis of this percentage over time indicates whether the Fund is becoming financially stronger or weaker. Generally, the greater the percentage of assets is to liabilities, the stronger the Fund.
Trends in the unfunded actuarial liability and annual covered payroll are both affected by inflation. Expressing the unfunded actuarial liability as a percentage of annual covered payroll, approximately, adjusts for the effects of inflation, and aids in the analysis of the Fund’s progress made in accumulating sufficient assets to pay benefits when due. Generally, the smaller the percentage of unfunded actuarial liability is to annual covered payroll, the stronger the Fund.
The Schedule of Funding Progress presents multiyear trend information about whether the actuarial value of Fund assets is increasing or decreasing over time, relative to the actuarial accrued liability for benefits. The projection of benefits for financial reporting purposes does not explicitly incorporate the potential effects of legal or contractual funding limitation on the pattern of cost sharing between the employer and Fund members in the future.
GOVERNMENT OF DISTRICT OF COLUMBIA OTHER POST-EMPLOYMENT BENEFITS FUND
Required Supplementary Information Notes to Required Supplementary Information
34
Determination of the Annual Required Contribution (ARC)
In determining the Annual Required Contribution (ARC), the rate of employer contributions to the Fund is composed of the Normal Cost, plus amortization of the Unfunded Actuarial Liability. The Normal Cost is a level percent of payroll cost which, along with the member contributions, will pay for projected benefits at retirement for the average annuitant. The Actuarial Liability is that portion of the Present Value of Projected Benefits that will not be paid by Future Employer Normal Cost or active employee contributions. The difference between this liability and the funds accumulated as of the same date is the Unfunded Actuarial Liability.
The District’s (employer) annual contribution expense is calculated based on the ARC, an amount actuarially determined in accordance with the parameters of GAAP. The ARC represents a level of funding that, if paid on an ongoing basis, is projected to cover normal costs each year, and amortize any unfunded actuarial liabilities (or funding excess) over a period not to exceed thirty years. For purpose of calculating the ARC, which the Fund has to report each year, the rate of District (employer) contributions to the Fund is composed of the Normal Cost, plus amortization of the UAAL.
1299 Pennsylvania Avenue NW • Suite 1120 • Washington • District of Columbia 20004 • P 202.803.2335 • F 202.756.1301
REPORT OF INDEPENDENT PUBLIC ACCOUNTANTS ON INTERNAL CONTROL OVER FINANCIAL REPORTING AND ON COMPLIANCE AND OTHER MATTERS BASED ON AN
AUDIT OF FINANCIAL STATEMENTS PERFORMED IN ACCORDANCE WITH GOVERNMENT AUDITING STANDARDS
The Mayor and the Council of the Government of the District of Columbia Inspector General of the Government of the District of Columbia
We have audited, in accordance with auditing standards generally accepted in the United States of America and the standards applicable to financial audits contained in Government Auditing Standards issued by the Comptroller General of the United States, the financial statements of the Government of the District of Columbia’s Other Post-Employment Benefits Fund (the Fund), fiduciary fund of the Government of the District of Columbia, as of and for the year ended September 30, 2016, and the related notes to the financial statements, which collectively comprise the Fund’s basic financial statements, and have issued our report thereon dated December 29, 2016.
Internal Control over Financial Reporting
In planning and performing our audit of the financial statements, we considered the Fund’s internal control over financial reporting (internal control) to determine the audit procedures that are appropriate in the circumstances for the purpose of expressing our opinions on the financial statements, but not for the purpose of expressing an opinion on the effectiveness of the Fund’s internal control. Accordingly, we do not express an opinion on the effectiveness of the Fund’s internal control.
A deficiency in internal control exists when the design or operation of a control does not allow management or employees in the normal course of performing their assigned functions, to prevent, or detect and correct misstatements on a timely basis. A material weakness is a deficiency, or a combination of deficiencies, in internal control, such that there is a reasonable possibility that a material misstatement of the entity’s financial statements will not be prevented, or detected and corrected on a timely basis. A significant deficiency is a deficiency, or a combination of deficiencies, in internal control that is less severe than a material weakness, yet important enough to merit attention by those charged with governance.
Our consideration of internal control over financial reporting was for the limited purpose described in the first paragraph of this section and was not designed to identify all deficiencies in internal control over financial reporting that might be material weaknesses or significant deficiencies. Given these limitations, during our audit we did not identify any deficiencies in internal control over financial reporting that we consider to be material weaknesses. However, material weaknesses may exist that have not been identified.
Compliance and Other Matters
As part of obtaining reasonable assurance about whether the Fund’s financial statements are free from material misstatement, we performed tests of its compliance with certain provisions of laws, regulations, contracts, and grant agreements, noncompliance with which could have a direct and material effect on the determination of financial statement amounts. However, providing an opinion on compliance with those provisions was not an objective of our audit and, accordingly, we do not express such an opinion. The results of our tests disclosed no instances of noncompliance or other matters that are required to be reported under Government Auditing Standards.

36
Purpose of this Report
The purpose of this report is solely to describe the scope of our testing of internal control and compliance and the results of that testing, and not to provide an opinion on the effectiveness of the entity’s internal control or on compliance. This report is an integral part of an audit performed in accordance with Government Auditing Standards in considering the entity’s internal control and compliance. Accordingly, this communication is not suitable for any other purpose.
Washington, D.C. December 29, 2016