Embed Size (px)
Citation preview

Oikos OIK-01215
Bracken, M. E. S., Hillebrand, H., Borer, E. T., Seabloom,
E. W., Cebrian, J., Cleland, E. E., Elser, J. J., Gruner, D. S.,
Harpole, W. S., Ngai, J. T. and Smith, J. E. 2014.
Signatures of nutrient limitation and co-limitation:
responses of autotroph internal nutrient concentrations to
nitrogen and phosphorus additions. – Oikos doi:
10.1111/oik.01215
Appendix 1–3
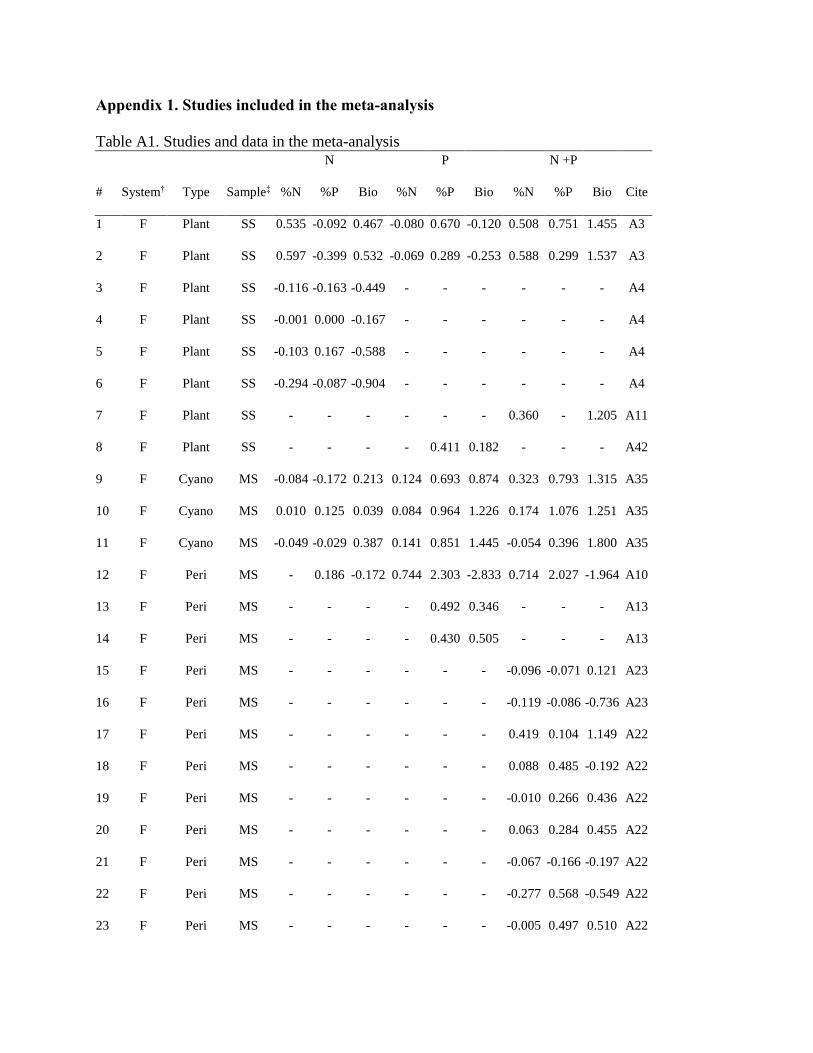
Appendix 1. Studies included in the meta-analysis Table A1. Studies and data in the meta-analysis N P N +P
# System† Type Sample‡ %N %P Bio %N %P Bio %N %P Bio Cite
1 F Plant SS 0.535 -0.092 0.467 -0.080 0.670 -0.120 0.508 0.751 1.455 A3
2 F Plant SS 0.597 -0.399 0.532 -0.069 0.289 -0.253 0.588 0.299 1.537 A3
3 F Plant SS -0.116 -0.163 -0.449 - - - - - - A4
4 F Plant SS -0.001 0.000 -0.167 - - - - - - A4
5 F Plant SS -0.103 0.167 -0.588 - - - - - - A4
6 F Plant SS -0.294 -0.087 -0.904 - - - - - - A4
7 F Plant SS - - - - - - 0.360 - 1.205 A11
8 F Plant SS - - - - 0.411 0.182 - - - A42
9 F Cyano MS -0.084 -0.172 0.213 0.124 0.693 0.874 0.323 0.793 1.315 A35
10 F Cyano MS 0.010 0.125 0.039 0.084 0.964 1.226 0.174 1.076 1.251 A35
11 F Cyano MS -0.049 -0.029 0.387 0.141 0.851 1.445 -0.054 0.396 1.800 A35
12 F Peri MS - 0.186 -0.172 0.744 2.303 -2.833 0.714 2.027 -1.964 A10
13 F Peri MS - - - - 0.492 0.346 - - - A13
14 F Peri MS - - - - 0.430 0.505 - - - A13
15 F Peri MS - - - - - - -0.096 -0.071 0.121 A23
16 F Peri MS - - - - - - -0.119 -0.086 -0.736 A23
17 F Peri MS - - - - - - 0.419 0.104 1.149 A22
18 F Peri MS - - - - - - 0.088 0.485 -0.192 A22
19 F Peri MS - - - - - - -0.010 0.266 0.436 A22
20 F Peri MS - - - - - - 0.063 0.284 0.455 A22
21 F Peri MS - - - - - - -0.067 -0.166 -0.197 A22
22 F Peri MS - - - - - - -0.277 0.568 -0.549 A22
23 F Peri MS - - - - - - -0.005 0.497 0.510 A22

24 F Peri MS - - - - - - -0.052 0.580 0.200 A22
25 F Peri MS 0.098 -0.266 1.152 0.048 1.054 0.188 -0.061 0.543 0.127 A27
26 F Peri MS - - - - - - 0.391 0.919 2.395 A26
27 F Peri MS - - - - - - -0.044 0.085 0.077 A29
28 F Peri MS 0.086 -0.435 0.248 0.344 0.211 0.444 0.523 0.432 0.561 A38
29 F Peri MS - - - - - - 0.787 0.258 0.686 A37
30 F Peri MS 0.294 0.649 0.380 0.060 1.604 -0.122 0.361 1.985 0.114 A43
31 F Phyto MS - - - - - - 0.177 0.192 0.505 A19
32 F Phyto MS - - - - - - 0.245 -0.091 0.566 A19
33 F Phyto MS - - - - - - 0.244 0.443 0.581 A19
34 F Phyto MS - - - - - - 0.132 0.344 0.838 A19
35 M Seagrass SS -0.031 -0.122 - -0.141 -0.083 - -0.106 -0.261 - A1
36 M Seagrass SS 0.060 -0.057 0.366 0.000 0.231 0.367 0.060 0.355 0.590 A1
37 M Seagrass SS 0.072 -0.288 -0.200 0.021 0.405 0.098 0.052 0.318 0.512 A1
38 M Seagrass SS 0.046 0.000 0.047 0.098 1.253 0.747 0.139 0.724 0.946 A1
39 M Seagrass SS -0.021 0.036 0.433 0.061 0.711 0.507 0.091 0.465 0.575 A1
40 M Seagrass SS 0.112 0.129 0.445 0.058 1.277 0.837 0.112 0.727 0.838 A1
41 M Macrolgae SS 0.781 -0.227 0.116 -0.140 2.646 -0.399 0.626 1.858 0.226 A28
42 M Macrolgae SS 0.778 -0.129 0.287 -0.122 2.698 -0.399 0.643 2.076 0.510 A28
43 M Macrolgae MS 0.635 - 0.084 - - - - - - A20
44 M Macrolgae MS 0.448 - -0.023 - - - - - - A20
45 M Macrolgae MS 0.438 - 0.353 - - - - - - A20
46 M Macrolgae MS 0.117 - -0.056 - - - - - - A20
47 M Macrolgae MS 0.400 - 0.268 - - - - - - A20
48 M Macrolgae MS -0.063 -0.135 -0.148 -0.063 0.192 -0.076 0.251 0.011 -0.328 A1
49 M Macrolgae MS 0.104 -0.206 0.302 -0.116 0.123 0.727 0.095 0.212 0.419 A1
50 M Macrolgae MS 0.142 -0.301 0.140 0.046 0.905 -0.753 0.101 0.738 -0.606 A1

51 M Macrolgae MS 0.198 0.353 0.112 -0.056 0.316 0.853 -0.028 0.599 0.389 A1
52 M Macrolgae MS -0.163 -0.395 -0.354 0.107 0.900 0.209 0.172 0.498 0.461 A1
53 M Macrolgae MS 0.640 - 0.133 -0.051 - -0.091 0.692 - 0.275 A44
54 M Macrolgae MS 1.053 - 0.273 0.005 - -0.096 1.202 - 0.323 A44
55 M Macrolgae MS 0.298 - 0.387 -0.058 - -0.220 0.632 - 0.237 A44
56 M Macrolgae MS 0.810 - 0.414 -0.022 - -0.220 0.896 - 0.429 A44
57 M Peri MS - - - - - - 0.001 0.280 -0.185 A8
58 M Peri MS - - - - - - 0.010 -0.073 0.345 A8
59 M Peri MS - - - - - - -0.041 -0.266 0.176 A8
60 M Peri MS - - - - - - -0.039 0.542 1.333 A22
61 M Peri MS - - - - - - 0.136 0.196 3.636 A22
62 M Peri MS - - - - - - -0.018 0.277 1.977 A22
63 M Peri MS - - - - - - -0.015 0.496 0.355 A22
64 M Peri MS - - - - - - -0.098 -0.163 1.293 A22
65 M Peri MS 0.075 0.131 1.208 0.033 0.849 0.514 0.070 -0.204 1.498 A21
66 M Peri MS 0.112 -0.009 3.326 0.126 -0.057 1.494 0.093 0.508 2.542 A21
67 M Peri MS 0.035 -0.879 2.843 -0.016 -0.068 -0.009 0.053 -0.299 1.354 A21
68 M Peri MS 0.023 -0.827 0.024 0.066 0.552 0.178 0.088 -0.653 2.267 A21
69 M Peri MS -0.134 -0.505 1.095 -0.006 0.243 0.257 -0.007 -0.128 0.051 A21
70 M Peri MS 0.040 -0.223 0.998 0.079 0.199 -0.615 -0.004 0.323 0.195 A21
71 M Peri MS - - - - - - -0.017 0.371 -0.299 A21
72 M Peri MS - - - - - - -0.021 -0.031 0.329 A21
73 M Peri MS - - - - - - 0.001 -0.286 0.898 A21
74 T Tree SS 0.038 - 0.642 0.129 - -0.579 0.050 - 1.360 A25
75 T Grass SS 0.232 -0.399 0.120 0.160 0.124 -0.051 -0.006 -0.068 0.422 A12
76 T Grass SS 0.170 0.207 1.340 0.090 0.940 0.072 -0.018 0.963 1.934 A40
77 T Grass SS 0.263 -0.700 1.023 0.039 0.656 -0.182 0.170 0.573 1.611 A40

78 T Grass SS -0.049 -0.120 -0.228 -0.185 0.588 0.883 0.000 0.428 0.937 A9
79 T Tree SS 0.223 - - - - - - - - A7
80 T Tree SS 0.296 - - - - - - - - A7
81 T Tree SS 0.091 -0.019 0.253 0.044 0.428 0.097 0.066 0.440 0.365 A48
82 T Herb SS - - - - - - -0.065 0.705 0.604 A33
83 T Bryophyte SS 0.401 - 0.015 0.328 - 1.365 0.206 - 1.749 A24
84 T Bryophte SS 0.048 - 0.806 0.038 - 4.104 0.014 - 3.341 A24
85 T Grass SS 0.136 1.696 - 0.055 0.140 - 0.165 1.649 - A36
86 T Grass SS 1.399 -0.479 0.093 1.001 0.307 0.551 1.026 0.317 0.655 A32
87 T Grass SS - - - - - - 0.002 0.637 0.858 A33
88 T Grass SS 0.202 -0.274 0.870 0.041 0.079 -0.056 0.302 -0.008 0.837 A14
89 T Grass SS 0.300 - 0.088 - - - - - - A5
90 T Tree SS 0.165 -0.034 0.455 0.044 0.065 -0.829 - - - A15
91 T Tree SS 0.180 -0.039 1.531 0.043 0.297 1.042 - - - A15
92 T Tree SS 0.264 0.051 1.043 0.070 0.706 2.982 - - - A15
93 T Tree SS -0.059 -0.391 -0.243 -0.059 -0.309 -0.134 0.067 0.084 -0.107 A16
94 T Tree SS - 0.045 0.334 - 0.399 0.189 - 0.138 0.460 A17
95 T Tree SS 0.105 - 2.472 -0.014 - 1.682 0.067 - 3.018 A34
96 T Tree SS - -0.105 2.236 - 0.824 1.882 - 0.491 3.007 A34
97 T Tree SS 0.166 -0.147 1.627 0.012 0.221 1.008 0.245 0.100 1.705 A47
98 T Tree SS 0.014 -0.061 1.758 -0.064 0.348 1.030 0.027 0.174 1.946 A47
99 T Tree SS 0.119 -0.035 0.262 - - - - - - A47
100 T Grass MS 0.479 0.072 0.525 -0.060 1.774 0.159 0.143 1.467 0.989 A41
101 T Grass MS 0.581 -0.700 0.251 0.008 0.656 1.069 0.608 0.573 1.175 A9
102 T Tree MS 0.296 - -0.813 - - - - - - A49
103 T Tree MS 0.048 -0.276 - -0.070 0.751 - 0.103 0.518 - A32
104 T Tree MS 0.130 -0.011 - -0.014 1.166 - 0.130 0.882 - A32

105 T Herb MS 0.345 -0.115 0.391 0.237 0.375 0.281 0.052 0.252 0.763 A33
106 T Grass MS 0.263 - 0.149 - 0.118 -0.194 - - 0.213 A2
107 T Grass MS 0.245 -0.096 0.486 0.047 1.299 0.091 0.225 0.469 1.017 A6
108 T Grass MS 0.096 0.047 0.356 -0.042 0.618 0.308 0.102 0.686 0.608 A6
109 T Bryophyte MS 0.768 0.751 0.000 -0.110 1.210 0.118 0.773 1.715 0.318 A18
110 T Tree MS 0.978 -0.036 0.836 -0.011 0.593 0.615 1.015 1.096 2.048 A32
111 T Herb MS - - - - - - 0.215 - 0.015 A31
112 T Tree MS - - - - - - 0.205 - 0.935 A39
113 T Bryophyte MS 0.128 -0.105 0.024 0.125 0.449 0.321 0.207 0.562 0.000 A46
114 T Bryophyte MS -0.225 -0.305 0.220 -0.230 0.051 -0.049 0.104 0.254 -0.024 A46
115 T Tree MS 0.224 - -0.438 - - - - - - A49
116 T Tree MS -0.029 0.366 -0.066 0.184 -0.181 0.285 0.246 0.244 0.599 A25
117 T Tree MS 0.134 - 0.222 - - - - - - A45
118 T Tree MS 0.055 - 0.301 - - - - - - A45
†F = Freshwater, M = Marine, T = Terrestrial ‡SS = Single Species, MS = Multiple Species
Literature Citations
A1. Armitage, A. R., Frankovich, T. A., Heck, K. L. and Fourqurean, J. W. 2005. Experimental
nutrient enrichment causes complex changes in seagrass, microalgae, and macroalgae
community structure in Florida Bay. - Estuaries and Coasts 28: 422-434.
A2. Bennett, L. T. and Adams, M. A. 2001. Response of a perennial grassland to nitrogen and
phosphorus additions in sub-tropical, semi-arid Australia. - Journal of Arid Environments 48:
289-308.
A3. Best, E. P. H., Woltman, H. and Jacobs, F. H. H. 1996. Sediment-related growth limitation
of Elodea nuttallii as indicated by a fertilization experiment. – Freshwater Biology 36: 33-44.
A4. Boedeltje, G., Smolders, A. J. P. and Roelofs, J. G. M. 2005. Combined effects of water
column nitrate enrichment, sediment type and irradiance on growth and foliar nutrient
concentrations of Potamogeton alpinus. – Freshwater Biology 50: 1537-1547.

A5. Bowman, W. D., Gartner, J. R., Holland, K. and Wiedermann, M. 2006. Nitrogen critical
loads for alpine vegetation and terrestrial ecosystem response: Are we there yet? - Ecological
Applications 16: 1183-1193.
A6. Bowman, W. D., Theodose, T. A., Schardt, J. C. and Conant, R. T. 1993. Constraints of
nutrient availability on primary production in two alpine tundra communities. - Ecology 74:
2085-2097.
A7. Britton, A. J., Helliwell, R. C., Fisher, J. M. and Gibbs, S. 2008. Interactive effects of
nitrogen deposition and fire on plant and soil chemistry in an alpine heathland. - Environmental
Pollution 156: 409-416.
A8. Castenholz, R. W. 1961. The effect of grazing on marine littoral diatom populations. -
Ecology 42: 783-794.
A9. Chiang, C., Craft, C. B., Rogers, D. W. and Richardson, C. J. 2000. Effects of 4 years of
nitrogen and phosphorus additions on Everglades plant communities. – Aquatic Botany 68: 61-
78.
A10. Craft, C. B., Vymazal, J. and Richardson, C. J. 1995. Response of Everglades plant
communities to nitrogen and phosphorus additions. - Wetlands 15: 258-271.
A11. Cronin, G. and Lodge, D. M. 2003. Effects of light and nutrient availability on the growth,
allocation, carbon/nitrogen balance, phenolic chemistry, and resistance to herbivory of two
freshwater macrophytes. - Oecologia 137: 32-41.
A12. D'Antonio, C. M. and Mack, M. C. 2006. Nutrient limitation in a fire derived, nitrogen rich
Hawaiian grassland. - Biotropica 38: 458-467.
A13. Daoust, R. J. and Childers, D. L. 2004. Ecological effects of low-level phosphorus
additions on two plant communities in a neotropical freshwater wetland ecosystem. - Oecologia
141: 672-686.
A14. Darby, F. A. and Turner, R. E. 2008. Below-and aboveground Spartina alterniflora
production in a Louisiana salt marsh. - Estuaries and Coasts 31: 223-231.
A15. Feller, I. C., McKee, K. L., Whigham, D. F. and O'Neill, J. P. 2002. Nitrogen vs.
phosphorus limitation across an ecotonal gradient in a mangrove forest. - Biogeochemistry 62:
145-175.
A16. Fox, L. R. and Morrow, P. A. 1992. Eucalypt responses to fertilization and reduced
herbivory. - Oecologia 89: 214-222.
A17. Gleeson, S. K. and Good, R. E. 2003. Root allocation and multiple nutrient limitation in the
New Jersey Pinelands. - Ecology Letters 6: 220-227.
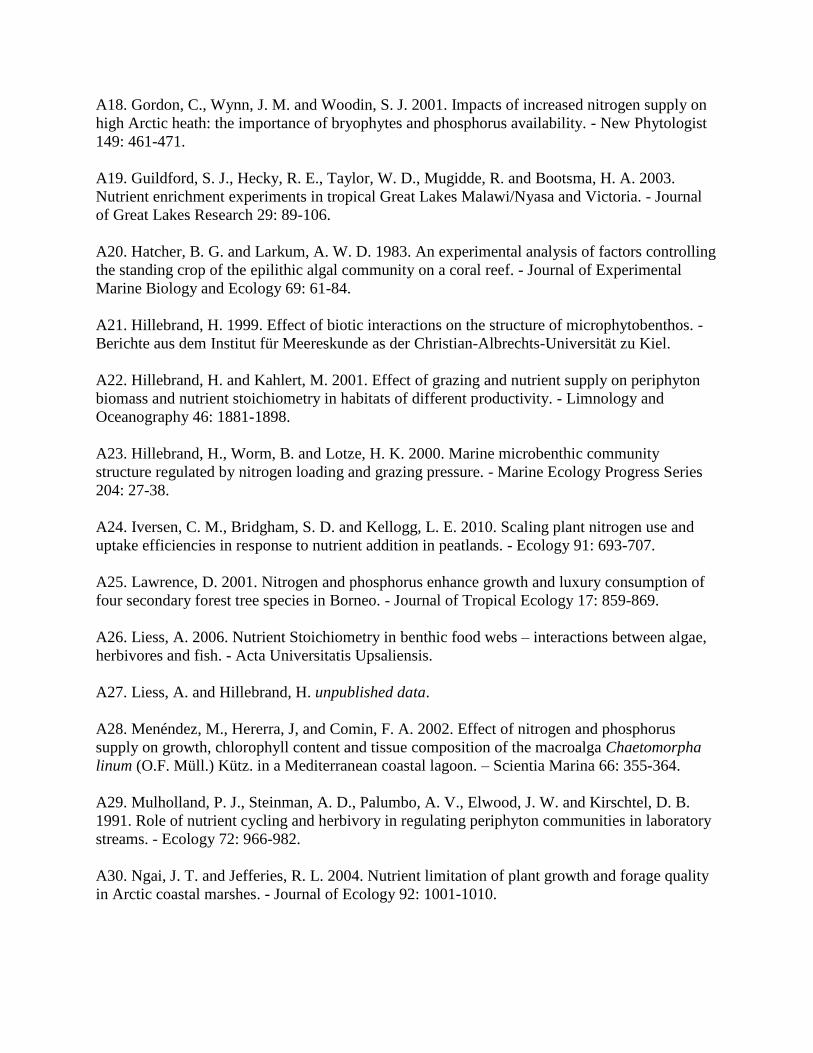
A18. Gordon, C., Wynn, J. M. and Woodin, S. J. 2001. Impacts of increased nitrogen supply on
high Arctic heath: the importance of bryophytes and phosphorus availability. - New Phytologist
149: 461-471.
A19. Guildford, S. J., Hecky, R. E., Taylor, W. D., Mugidde, R. and Bootsma, H. A. 2003.
Nutrient enrichment experiments in tropical Great Lakes Malawi/Nyasa and Victoria. - Journal
of Great Lakes Research 29: 89-106.
A20. Hatcher, B. G. and Larkum, A. W. D. 1983. An experimental analysis of factors controlling
the standing crop of the epilithic algal community on a coral reef. - Journal of Experimental
Marine Biology and Ecology 69: 61-84.
A21. Hillebrand, H. 1999. Effect of biotic interactions on the structure of microphytobenthos. -
Berichte aus dem Institut für Meereskunde as der Christian-Albrechts-Universität zu Kiel.
A22. Hillebrand, H. and Kahlert, M. 2001. Effect of grazing and nutrient supply on periphyton
biomass and nutrient stoichiometry in habitats of different productivity. - Limnology and
Oceanography 46: 1881-1898.
A23. Hillebrand, H., Worm, B. and Lotze, H. K. 2000. Marine microbenthic community
structure regulated by nitrogen loading and grazing pressure. - Marine Ecology Progress Series
204: 27-38.
A24. Iversen, C. M., Bridgham, S. D. and Kellogg, L. E. 2010. Scaling plant nitrogen use and
uptake efficiencies in response to nutrient addition in peatlands. - Ecology 91: 693-707.
A25. Lawrence, D. 2001. Nitrogen and phosphorus enhance growth and luxury consumption of
four secondary forest tree species in Borneo. - Journal of Tropical Ecology 17: 859-869.
A26. Liess, A. 2006. Nutrient Stoichiometry in benthic food webs – interactions between algae,
herbivores and fish. - Acta Universitatis Upsaliensis.
A27. Liess, A. and Hillebrand, H. unpublished data.
A28. Menéndez, M., Hererra, J, and Comin, F. A. 2002. Effect of nitrogen and phosphorus
supply on growth, chlorophyll content and tissue composition of the macroalga Chaetomorpha
linum (O.F. Müll.) Kütz. in a Mediterranean coastal lagoon. – Scientia Marina 66: 355-364.
A29. Mulholland, P. J., Steinman, A. D., Palumbo, A. V., Elwood, J. W. and Kirschtel, D. B.
1991. Role of nutrient cycling and herbivory in regulating periphyton communities in laboratory
streams. - Ecology 72: 966-982.
A30. Ngai, J. T. and Jefferies, R. L. 2004. Nutrient limitation of plant growth and forage quality
in Arctic coastal marshes. - Journal of Ecology 92: 1001-1010.

A31. Niinemets, U. and Kull, K. 2005. Co-limitation of plant primary productivity by nitrogen
and phosphorus in a species-rich wooded meadow on calcareous soils. - Acta Oecologica 28:
345-356.
A32. Ostertag, R. 2010. Foliar nitrogen and phosphorus accumulation responses after
fertilization: an example from nutrient-limited Hawaiian forests. - Plant and Soil 334: 85-98.
A33. Pietikainen, A., Kytoviita, M. M. and Vuoti, U. 2005. Mycorrhiza and seedling
establishment in a subarctic meadow: effects of fertilization and defoliation. - Journal of
Vegetation Science 16: 175-182.
A34. Raich, J. W., Russell, A. E., Crews, T. E., Farrington, H. and Vitousek, P. M. 1996. Both
nitrogen and phosphorus limit plant production on young Hawaiian lava flows. -
Biogeochemistry 32: 1-14.
A35. Rejmánková, E. 2001. Effect of experimental phosphorus enrichment on oligotrophic
tropical marshes in Belize, Central America. - Plant and Soil 236: 33-53.
A36. Rejmánková, E. and Snyder, J. M. 2008. Emergent macrophytes in phosphorus limited
marshes: Do phosphorus usage strategies change after nutrient addition? - Plant and Soil 313:
141-153.
A37. Rosemond, A. D. 1993. Interactions among irradiance, nutrients, and herbivores constrain a
stream algal community. - Oecologia 94: 585-594.
A38. Rosemond, A. D., Mulholland, P. J. and Elwood, J. W. 1993. Top-down and bottom-up
control of stream periphyton: effects of nutrients and herbivores. - Ecology 74: 1264-1280.
A39. Shaver, G. R., Bret-Harte, S. M., Jones, M. H., Johnstone, J., Gough, L., Laundre, J. and
Chapin, F. S., III. 2001. Species composition interacts with fertilizer to control long-term change
in tundra productivity. - Ecology 82: 3163-3181.
A40. Sims, L., Pastor, J., Lee, T. and Dewey, B. 2012. Nitrogen, phosphorus and light effectson
growth and allocation of biomass and nutrients in wild rice. – Oecologia 170: 65-76.
A41. Soudzilovskaia, N. A., Onipchenko, V. G., Cornelissen, J. H. C. and Aerts, R. 2005.
Biomass production, N: P ratio and nutrient limitation in a Caucasian alpine tundra plant
community. - Journal of Vegetation Science 16: 399-406.
A42. Steinman, A. D. 1994. The influence of phosphorus enrichment on lotic bryophytes. -
Freshwater Biology 31: 53-63.
A43. Stelzer, R. S. and Lamberti, G. 2001. Effects of N : P ratio and total nutrient concentrations
on stream periphyton community structure, biomass, and elemental composition. – Limnology
and Oceanography 46: 356-367.

A44. Teichberg, M., Fox, S. E., Aguila, C., Olsen, Y. S. and Valiela, I. 2008. Macroalgal
responses to experimental nutrient enrichment in shallow coastal waters: growth, internal
nutrient pools, and isotopic signatures. - Marine Ecology Progress Series 368: 117-126.
A45. Tripler, C. E., Canham, C. D., Inouye, R. S. and Schnurr, J. L. 2002. Soil nitrogen
availability, plant luxury consumption, and herbivory by white-tailed deer. - Oecologia 133: 517-
524.
A46. van der Hoek, D., van Mierlo, A. and van Groenendael, J. M. 2004. Nutrient limitation and
nutrient-driven shifts in plant species composition in a species-rich fen meadow. - Journal of
Vegetation Science 15: 389-396.
A47. Vitousek, P. M., Walker, L. R., Whiteaker, L. D. and Matson, P. A. 1993. Nutrient
limitations to plant growth during primary succession in Hawaii Volcanoes National Park. -
Biogeochemistry 23: 197-215.
A48. von Oheimb, G., Power, S. A., Falk, K., Friedrich, U., Mohamed, A., Krug, A.,
Boschatzke, N. and Härdtle, W. 2010. N: P ratio and the nature of nutrient limitation in Calluna-
dominated heathlands. - Ecosystems 13: 317-327.
A49. Vourlitis, G. L., Pasquini, S. C. and Mustard, R. 2009. Effects of dry-season N input on the
productivity and N storage of Mediterranean-type shrublands. - Ecosystems 12: 473-488.

Appendix 2. General linear models evaluating effects of nutrient treatment and ecosystem
type on internal N concentrations, internal P concentrations, and biomass
Dependent Variable: Internal [N]
Sum of
Source df Squares Mean Square F-value P-value
Model 8 1.55 0.19 2.68 0.008
Error 224 16.23 0.07
Corrected Total 232 17.78
R2 = 0.09
Source df Type III SS Mean Square F-value P-value
Nutrient added 2 0.53 0.26 3.63 0.028
System 2 0.04 0.02 0.29 0.746
System x Nutrient 4 0.42 0.10 1.44 0.223
Contrast df Contrast SS Mean Square F-value P-value
Single vs. Multiple 1 0.19 0.19 2.62 0.107
N vs. P 1 0.38 0.38 5.24 0.023
Standard
Parameter Estimate Error t-value P-value
Intercept 0.06 0.05 1.25 0.214
Nutrient (N) 0.18 0.07 2.68 0.008
Nutrient (N+P) 0.15 0.07 2.13 0.034
Nutrient (P) 0.00 . . .
System (Fresh) 0.09 0.10 0.92 0.360
System (Mar) -0.07 0.07 -0.88 0.383
System (Terr) 0.00 . . .
System x Nut (Fresh x N) -0.25 0.14 -1.84 0.067
System x Nut (Fresh x N+P) -0.11 0.12 -0.84 0.399
System x Nut (Fresh x P) 0.00 . . .
System x Nut (Mar x N) 0.08 0.10 0.79 0.430
System x Nut (Mar x N+P) 0.03 0.10 0.29 0.775
System x Nut (Mar x P) 0.00 . . .
System x Nut (Terr x N) 0.00 . . .
System x Nut (Terr x N+P) 0.00 . . .
System x Nut (Terr x P) 0.00 . . .

Dependent Variable: Internal [P]
Sum of
Source df Squares Mean Square F-value P-value
Model 8 19.71 2.46 9.10 <0.001
Error 195 52.78 0.27
Corrected Total 203 72.49
R2 = 0.27
Source df Type III SS Mean Square F-value P-value
Nutrient added 2 17.33 8.67 32.02 <0.001
System 2 0.67 0.33 1.23 0.293
System x Nutrient 4 1.64 0.41 1.51 0.200
Contrast df Contrast SS Mean Square F-value P-value
Single vs. Multiple 1 1.25 1.25 4.61 0.0330
N vs. P 1 15.97 15.97 58.99 <0.001
Standard
Parameter Estimate Error t-value P-value
Intercept 0.51 0.10 5.25 <0.001
Nutrient (N) -0.55 0.14 -4.01 <0.001
Nutrient (N+P) 0.06 0.14 0.44 0.659
Nutrient (P) 0.00 . . .
System (Fresh) 0.32 0.18 1.82 0.071
System (Mar) 0.19 0.15 1.26 0.211
System (Terr) 0.00 . . .
System x Nut (Fresh x N) -0.32 0.25 -1.29 0.197
System x Nut (Fresh x N+P) -0.40 0.23 -1.73 0.085
System x Nut (Fresh x P) 0.00 . . .
System x Nut (Mar x N) -0.34 0.22 -1.58 0.116
System x Nut (Mar x N+P) -0.45 0.21 -2.20 0.029
System x Nut (Mar x P) 0.00 . . .
System x Nut (Terr x N) 0.00 . . .
System x Nut (Terr x N+P) 0.00 . . .
System x Nut (Terr x P) 0.00 . . .

Dependent Variable: Biomass
Sum of
Source df Squares Mean Square F-value P-value
Model 8 17.41 2.18 3.03 0.003
Error 222 159.38 0.72
Corrected Total 230 176.79
R2 = 0.10
Source df Type III SS Mean Square F-value P-value
Nutrient added 2 9.71 4.85 6.76 0.001
System 2 7.86 3.93 5.47 0.005
System x Nutrient 4 1.32 0.33 0.46 0.764
Contrast df Contrast SS Mean Square F-value P-value
Single vs. Multiple 1 9.69 9.69 13.49 <0.001
N vs. P 1 0.08 0.08 0.11 0.742
Standard
Parameter Estimate Error t-value P-value
Intercept 0.60 0.15 3.89 0.0001
Nutrient (N) -0.08 0.21 -0.36 0.7182
Nutrient (N+P) 0.47 0.22 2.19 0.0299
Nutrient (P) 0.00 . . .
System (Fresh) -0.45 0.29 -1.54 0.1255
System (Mar) -0.42 0.24 -1.78 0.0758
System (Terr) 0.00 . . .
System x Nut (Fresh x N) 0.01 0.40 0.02 0.9870
System x Nut (Fresh x N+P) -0.10 0.37 -0.28 0.7774
System x Nut (Fresh x P) 0.00 . . .
System x Nut (Mar x N) 0.37 0.32 1.17 0.2444
System x Nut (Mar x N+P) 0.06 0.32 0.19 0.8457
System x Nut (Mar x P) 0.00 . . .
System x Nut (Terr x N) 0.00 . . .
System x Nut (Terr x N+P) 0.00 . . .
System x Nut (Terr x P) 0.00 . . .
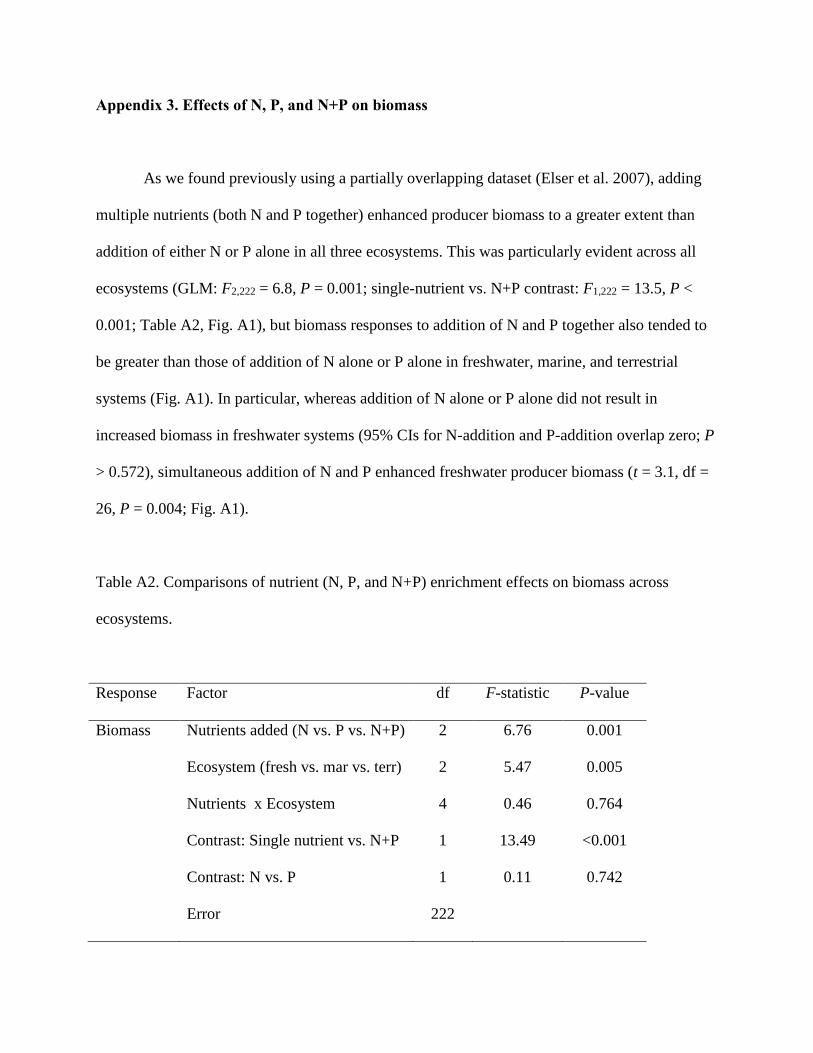
Appendix 3. Effects of N, P, and N+P on biomass
As we found previously using a partially overlapping dataset (Elser et al. 2007), adding
multiple nutrients (both N and P together) enhanced producer biomass to a greater extent than
addition of either N or P alone in all three ecosystems. This was particularly evident across all
ecosystems (GLM: F2,222 = 6.8, P = 0.001; single-nutrient vs. N+P contrast: F1,222 = 13.5, P <
0.001; Table A2, Fig. A1), but biomass responses to addition of N and P together also tended to
be greater than those of addition of N alone or P alone in freshwater, marine, and terrestrial
systems (Fig. A1). In particular, whereas addition of N alone or P alone did not result in
increased biomass in freshwater systems (95% CIs for N-addition and P-addition overlap zero; P
> 0.572), simultaneous addition of N and P enhanced freshwater producer biomass (t = 3.1, df =
26, P = 0.004; Fig. A1).
Table A2. Comparisons of nutrient (N, P, and N+P) enrichment effects on biomass across
ecosystems.
Response Factor df F-statistic P-value
Biomass Nutrients added (N vs. P vs. N+P) 2 6.76 0.001
Ecosystem (fresh vs. mar vs. terr) 2 5.47 0.005
Nutrients x Ecosystem 4 0.46 0.764
Contrast: Single nutrient vs. N+P 1 13.49 <0.001
Contrast: N vs. P 1 0.11 0.742
Error 222

Figure A1. Effects of nitrogen (N) additions, phosphorus (P) additions, and simultaneous N and
P additions on producer biomass. (A) Across freshwater, marine, and terrestrial ecosystems, we
observed greater producer biomass responses in experimental treatments where both N and P
were added than in treatments where either N or P were added alone (single- versus multiple-
nutrient contrast, P = 0.008). (B) The same general pattern held for comparisons within
freshwater, marine, and terrestrial systems, and biomass responses to nutrient (N, P, or N+P)
additions did not differ between systems (P > 0.178). Values are mean log-response ratios
(LRRs) ± 95% confidence intervals. Parenthetical numbers indicate sample sizes.
-0.90
-0.60
-0.30
0.00
0.30
0.60
0.90
1.20
1.50
Freshwater Marine Terrestrial
Bio
mas
s e
ffec
t (L
RR
)
N
P
N + P
(B) Within ecosystems
(13) (12) (27) (27) (22) (33) (36) (30) (31)
(A) Across ecosystems
0.00
0.20
0.40
0.60
0.80
1.00
1.20
N P N + P
Bio
ma
ss
eff
ec
t (L
RR
)
(76) (64) (91)