Embed Size (px)
Citation preview

Direktorat Jenderal Minyak dan Gas BumiKementerian Energi dan Sumber Daya Mineral
Directorate General of Oil And GasMinistry of Energy and Mineral Resources
Direktorat Jenderal Minyak dan Gas BumiKementerian Energi dan Sumber Daya Mineral
Directorate General of Oil And GasMinistry of Energy and Mineral Resources
Gedung MigasJl. H.R. Rasuna Said Kav. B-5, KuninganJakarta 12910, IndonesiaT. +62 21 5268910 (hunting)F. +62 21 5269114
www.migas.esdm.go.id
STATISTIKMinyak dan Gas Bumi
STATISTICSO i l a n d G a s
2016
STATISTIKMinyak dan Gas Bumi
STATISTICSO i l a n d G a s
2016
Direktorat Jenderal Minyak dan Gas BumiKementerian Energi dan Sumber Daya Mineral
Directorate General of Oil And GasMinistry of Energy and Mineral Resources
PENGARAH | SupervisorSekretaris Direktorat Jenderal Minyak dan Gas Bumi Secretary of Directorate General of Oil and Gas
PENANGGUNG JAWAB
Editor In Chief Kepala Bagian Rencana dan Laporan Head of Planning and Report Division
EDITOR | EditorKepala Sub Bagian Evaluasi dan Laporan Sub-Division Head of Evaluation and Report
TIM PENYUSUN | Writer• Sinta Agustina • Wulan Sitarahmi • Koesnobroto S. • Mochamad Imron • Anggi M. Adriawan • Edward Gorasinatra • Santi Widiasari • Rizky Amalia Wismashanti • Nurul Muhammad • Heru Windiarto • Irfan Nirvanda • Irawan Eko Prasetyanto • Winda Yunita • Benny Tambuse • Fahmi Muktafi • Wiyono • Beni Hendriyanto Supriyadi • Syahrul Pratama • Nadia Laila • Yeni Puspitasari • Ria Kiswandini • Maghfirani • Agung Nugroho • M Bharata Purnama Putra • Tio Angger Pratama • Ridho Pradana Mahaputra
PENTERJEMAH | TranslatorSularsih
Direktorat Jenderal Minyak dan Gas BumiKementerian Energi dan Sumber Daya Mineral
2
STATISTIKMinyak dan Gas Bumi
2016
Buku Statistik Minyak dan Gas Bumi Tahun 2016 merupakan salah satu instrumen penyampaian data dan informasi secara berkala mengenai perkembangan kegiatan pengusahaan minyak dan gas bumi di Indonesia. Publikasi ini memuat gambaran umum tentang kegiatan pengusahaan migas dari hulu, hilir, hingga penunjang. Beberapa data juga ditampilkan dalam bentuk peta-peta untuk memperkaya visual dan pemahaman terhadap kegiatan pengusahaan migas.
Seiring dengan meningkatnya kebutuhan konsumen data, buku statistik minyak dan gas bumi akan terus mengalami penyempurnaan baik struktur maupun muatannya. Buku ini diharapkan dapat memberikan manfaat bagi banyak pihak untuk berbagai keperluan.
Publikasi ini dapat terwujud berkat kerja sama dan partisipasi dari berbagai pihak. Dalam kesempatan ini, kami menyampaikan penghargaan dan terima kasih kepada semua pihak yang telah memberikan kontribusi secara nyata, serta memberikan masukan-masukan yang berarti sehingga buku ini dapat tersusun. Buku ini dapat dilihat dan diunduh pada website Direktorat Jenderal Minyak dan Gas Bumi melalui: http://www.statistik.migas.esdm.go.id/.
Saran dan kritik membangun untuk penerbitan selanjutnya dapat disampaikan melalui e-mail: http://mail.migas.esdm.go.id/
The Book of Oil and Gas Statistics 2016 is one of the means of delivering data and information periodically about the development of oil and natural gas business activities in Indonesia. This publication contains an overview of oil and gas business activities from upstream, downstream, to supporting sectors. Some data are also presented in the form of maps to enrich the visuals as well as understanding of oil and gas business activities.
Along with the increasing needs of data consumers, the oil and gas statistics book will continue to improve both the structure and the content. This book is expected to provide benefits for many parties and for various purposes.
This publication can be realized with regards to the cooperation and participation of various parties. On this occasion, we extend our appreciation and gratitude to all those who have made a noticeable contribution, and provide precious inputs so that this book can be arranged. This book can be viewed and downloaded from the website of the Directorate General of Oil and Gas through: http://www.statistik.migas.esdm.go.id/.
Suggestions and constructive criticism for further publication can be submitted via e-mail: http://mail.migas.esdm.go.id/
Jakarta, 2017 Direktur Jenderal Migas
EGO SYAHRIAL
KATA PENGANTAR | Introduction
3Directorate General of Oil And GasMinistry of Energy and Mineral Resources
STATISTICSO i l a n d G a s
2016
HULU
TABEL 1.1. INVESTASI HULU 2012-2016 Tables 1.1. Upstream Investment 2012-2016TABEL 1.2. CADANGAN MINYAK BUMI 2012-2016 Tables 1.2. Crude Oil Reserve 2012-2016TABEL 1.3. CADANGAN GAS BUMI 2012-2106 Tables 1.3. Natural Gas Reserve 2012-2016TABEL 1.4. PRODUKSI DAN PEMANFAATAN GAS BUMI 2016 Tables 1.4. Production and Utilization of Natural Gas 2016TABEL 1.5. PRODUKSI MINYAK MENTAH DAN KONDENSAT 2016 Tables 1.5. Production of Crude Oil and Condensate 2016TABEL 1.6. LIFTING MINYAK BUMI 2012-2016 Tables 1.6. Oil Lifting 2012-2016TABEL 1.7. LIFTING GAS BUMI 2012-2016 Tables 1.7. Gas Lifting 2012-2016TABEL 1.8. HARGA MINYAK MENTAH 2016 Tables 1.8. Crude Oil Price 2016
HILIR
TABEL 2.1. INVESTASI HILIR 2012-2016 Tables 2.1. Downstream Investment 2012-2016TABEL 2.2. PENGOLAHAN MINYAK MENTAH 2012 - 2016 Tables 2.2. Processing of Crude Oil 2012 - 2016TABEL 2.3. HASIL PENGOLAHAN MINYAK 2012-2106 Tables 2.3. Refined Products 2012-2016TABEL 2.4. PRODUKSI LPG 2012 - 2016 Tables 2.4. Production of LPG 2012- 2016TABEL 2.5. PRODUKSI LNG 2012 - 2016 Tables 2.5. Production of LNG 2012-2016TABEL 2.6. EKSPOR MINYAK MENTAH DAN KONDENSAT 2012-2016 Tables 2.6. Export of Crude Oil and Condensate 2012-2016TABEL 2.7. EKSPOR MINYAK MENTAH DAN KONDENSAT PER NEGARA TUJUAN 2016 Tables 2.7. Export of Crude Oil and Condensate by Destination Country 2016
TABEL 2.8. IMPOR MINYAK MENTAH PER NEGARA ASAL 2012-2016 Tables 2.8. Crude Oil Imports by Country 2012-2016TABEL 2.9. PENJUALAN/KONSUMSI BAHAN BAKAR MINYAK 2012-2016 Tables 2.9. Sales/Consumption of Fuels 2012- 2016TABEL 2.10. IMPOR BAHAN BAKAR MINYAK 2012-2016 Tables 2.10. Import of Fuels 2012-016TABEL 2.11. EKSPOR PRODUK KILANG 2012-2016 Tables 2.11. Exports of Refinery Products 2012-20TABEL 2.12. EKSPOR LNG PER NEGARA TUJUAN 2012-2016 Tables 2.12. Export of LNG by Destination Country 2012-2016
PENUNJANG
TABEL 3.1. STATISTIK SURAT KETERANGAN TERDAFTAR2012-2016 Tables 3.1. Statistic of Registered Certificate 2012-2016TABEL 3.2. TUMPAHAN MINYAK 2012-2016 Tables 3.2. Oil Spill 2012-2016TABEL 3.3. KECELAKAAN KERJA KEGIATAN HULU MIGAS 2012-2016 Tables 3.3. Accidents in Upstream Oil and Gas Activities 2012-2016TABEL 3.4. KECELAKAAN KERJA KEGIATAN HILIR 2012-2016 Tables 3.4. Accidents in Downstream Activities 2012-2016TABEL 3.5. STANDAR KOMPETENSI KERJA NASIONAL INDONESIA 2016 Tables 35. Indonesian National Work Competency Standard 2016TABEL 3.6. STANDAR NASIONAL INDONESIA BIDANG MIGAS 2016 Tables 3.6. Indonesian National Standard for Oil and Gas 2016
17
18
19
22
27
30
30
32
39
40
41
44
46
47
48
49
50
51
53
54
59
60
61
62
63
64
KATA PENGANTAR | IntroductionRINGKASAN DATA | Data SummaryIKHTISAR | Overview HULU | Upstream HILIR | Downstream PENUNJANG | Supporting PETA TEMATIK | Thematic MapDAFTAR ISTILAH | Glossarium and AppendicesPERKIRAAN FAKTOR KONVERSI | Approximate conversion factors
DAFTAR ISI | Table of Contents
367
113655657479
Direktorat Jenderal Minyak dan Gas BumiKementerian Energi dan Sumber Daya Mineral
4
STATISTIKMinyak dan Gas Bumi
2016
DAFTAR TABEL | List of Tables
GAMBAR 4.1. PETA CADANGAN MINYAK BUMI 2016 Image 4.1. Map of Crude Oil Reserve 2016GAMBAR 4.2. PETA CADANGAN GAS BUMI 2016 Image 4.2. Map of Natural Gas Reserves 2016GAMBAR 4.3. PETA POTENSI GAS METHANA BATUBARA & SHALE GAS Image 4.3. CBM Resources & Shale Gas PotentialGAMBAR 4.4. PETA CEKUNGAN HIDRO KARBON Image 4.4. Map of Hydrocarbons Basin
GAMBAR 4.5. PETA INFRASTRUKTUR GAS BUMI Image 4.5. Map of Gas Infrastructure GAMBAR 4.6. PETA KILANG MINYAK Image 4.6. Map of Oil Refinery GAMBAR 4.7. PETA KILANG LPG DAN LNG Image 4.7. Map of LPG and LNG Refinery
66
67
68
69
70
71
72
5Directorate General of Oil And GasMinistry of Energy and Mineral Resources
STATISTICSO i l a n d G a s
2016
HULU
GRAFIK 1.1. PENANDATANGANAN WILAYAH KERJA KONVENSIONAL 2012-2016 Charts 1.1. Signing Contract of Conventional Working Area 2012-2016GRAFIK 1.2. PENANDATANGANAN WILAYAH KERJA NON KONVENSIONAL 2012-2016 Charts 1.2. Signing Contract of non-Conventional Working Area 2012-2016GRAFIK 1.3. INVESTASI HULU 2012-2016 Charts 1.3. Upstream Investment 2012-2016GRAFIK 1.4. CADANGAN MINYAK BUMI 2012-2016 Charts 1.4. Crude Oil Reserve 2012-2016GRAFIK 1.5. CADANGAN GAS BUMI 2012-2016 Charts 1.5. Natural Gas Reserve 2012-2016GRAFIK 1.6. SURVEI SEISMIK 2D (KM) 2012-2016 Charts 1.6. 2D (km) Seismic Survey 2012-2016GRAFIK 1.7. SURVEI SEISMIK 3D (KM2) 2012-2016 Charts 1.7. 3D (km2) Seismic Survey 2012-2016GRAFIK 1.8. PEMBORAN SUMUR EKSPLORASI 2012-2016 Charts 1.8. Chart of Drilling of Exploratory Wells 2012-2016GRAFIK 1.9. PRODUKSI DAN PEMANFAATAN GAS BUMI 2012-2016 Charts 1.9. Chart of Production and Utilization of Natural Gas 2012-2016GRAFIK 1.10. PRODUKSI MINYAK MENTAH DAN KONDENSAT 2012-2016 Charts 1.10. Chart of Production of Crude Oil and Condensate 2012-2016GRAFIK 1.11. LIFTING MIGAS TAHUN 2012-2016 Charts 1.11. Oil and Gas Lifting 2012-2016GRAFIK 1.12. PERKEMBANGAN HARGA MINYAK INDONESIA & MINYAK UTAMA DUNIA Charts 1.12. Price Developments of Indonesian Crude Oil & World Major Crude Oil
HILIR
GRAFIK 2.1 INVESTASI HILIR 2012-2016 Charts 2.1. Downstream Investment 2012-2016GRAFIK 2.2 PENGOLAHAN MINYAK MENTAH 2012 - 2016 Charts 2.2. Processing of Crude Oil 2012 - 2016GRAFIK 2.3. HASIL PENGOLAHAN MINYAK 2012 - 2016 Charts 2.3. Refined Products 2012-2016
GRAFIK 2.4. PRODUKSI LPG TAHUN 2012 - 2016 Charts 2.4. Production of LPG 2012- 2016GRAFIK 2.5. PRODUKSI LNG TAHUN 2012 - 2016 Charts 2.5. Production of LNG 2012-2016GRAFIK 2.6. EKSPOR MINYAK MENTAH DAN KONDENSAT PER NEGARA TUJUAN TAHUN 2016 Charts 2.6. Export of Crude Oil and Condensate by Destination Country 2016GRAFIK 2.7. IMPOR MINYAK MENTAH 2012-2016 Charts 2.7. Crude Oil Imports 2012-2016GRAFIK 2.8. PENJUALAN/KONSUMSI BAHAN BAKAR MINYAK 2012-2016 Charts 2.8. Sales/Consumption of Fuels 2012- 2016GRAFIK 2.9. IMPOR BAHAN BAKAR MINYAK 2012-2016 Charts 2.9. Import of Fuels 2012-016GRAFIK 2.10. PENJUALAN, IMPOR DAN EKSPOR LPG 2012-2016 Charts 2.10. Sales, Import and Export of LPG 2012-2016GRAFIK 2.11. EKSPOR PRODUK KILANG 2012-2016 Charts 2.11. Indonesian Exports of Refinery Products 2012-2016GRAFIK 2.12. EKSPOR LNG PER NEGARA TUJUAN 2012-2016 Charts 2.12. Chart of Export of LNG by Destination Country 2012-2016
PENUNJANG
GRAFIK 3.1. TKDN PADA KEGIATAN USAHA HULU 2012-2016 Charts 3.1. Local Content Usage in Upstream Activities 2012-2016GRAFIK 3.2. STATISTIK SURAT KETERANGAN TERDAFTAR 2012-2016 Charts 3.2. Statistic of Registered Certificate 2012-2016GRAFIK 3.3. TUMPAHAN MINYAK 2012-2016 Charts 3.3. Oil Spill 2012-2016GRAFIK 3.4. KECELAKAAN KERJA KEGIATAN HULU 2012-2016 Charts 3.4. Chart of Statistic of Accident in Upstream Activities 2012-2016GRAFIK 3.5. KECELAKAAN KERJA KEGIATAN HILIR MIGAS 2012-2016 Charts 3.5. Chart of Statistic of Accident in Downstream Activities 2012-2016
16
16
17
18
19
20
20
21
26
29
30
32
34
39
40
43
45
46
48
49
50
51
52
53
54
58
59
60
61
62
DAFTAR GRAFIK | List of Charts
DAFTAR GAMBAR | List of Image

Ringkasan Data | Data Summary
No. Kategori | Category 2015 2016 Satuan | Unit
1 Investasi Hulu Migas | Upstream Oil and Gas Investments 15,312.68 11,352.37 Juta US$
2 Cadangan Minyak Bumi | Crude Oil Reserve 7,305.02 7,251.00 MMSTB
3 Cadangan Gas Bumi | Gas Reserve 151.33 144.06 TSCF
4 Survei Seismik 2D (km) | 2D Seismic Survey (km) 3,934.00 3,925.00 km
5 Survei Seismik 3D (km2) | 3D Seismic Survey (km2) 3,347.00 6,905.00 km2
6 Pemboran Sumur Eksplorasi | Drilling of Exploratory Wells 67 34 sumur
7 Produksi Gas Bumi | Natural Gas Production 8,077.71 7,938.44 MMSCFD
8 Pemanfaatan Gas Bumi | Utilization of Natural Gas 7,329.14 7,220.48 MMSCFD
9 Produksi Minyak dan Kondensat | Production of Crude Oil and Condensate
785,792 831,058 BOPD
10 ICP Rata-rata (Januari 2016 s/d Desember 2016) | Average of Indonesian Crude Oil Price (January 2016 until December 2016)
49.21 40.13 US$/Barel
11 Investasi Hilir Migas | Oil and Gas Downstream Investment
2,644.02 966.54 Juta US$
12 Hasil Pengolahan Minyak MentahCrude Oil Processing Results
329,535.90 340,288.87 Ribu Barel
13 Produksi LPG | Production of LPG 2,275,910 2,241,567 M.Ton
14 Produksi LNG | Production of LNG 19,071,196 20,228,742 M.Ton
15 Ekspor Minyak Mentah | Export of Crude Oil 115,017,446 125,515,791 Barel
16 Impor Minyak Mentah | Import of Crude Oil 136,665,881 148,361,447 Barel
17 Impor BBM | Import of Fuel 27,898,244 22,801,063 Kiloliter
18 Penjualan BBM | Sales of Fuel 67,509,826 66,939,112 Kiloliter
19 Ekspor LPG | Export of LPG 392 580 M.Ton
20 Impor LPG | Import of LPG 4,237,499 4,475,929 M.Ton
21 Penjualan LPG | Sales of LPG 6,376,990 6,642,633 M.Ton
22 Ekspor Produk Kilang | Exports of Refinery Products 3,459,642 12,833,425 Kiloliter
23 Ekspor LNG | Export of LNG 811,043,009 747,697,375 MMBTU
24 Data Tumpahan Minyak | Statistic of Oil Spill 875 550 Barel
25 Data Kecelakaan Hulu |Statistic of Accident in Upstream Oil and Gas Activities
273 138 Kecelakaan
26 Data Kecelakaan Hilir | Statistic of Accident in Downstream Oil and Gas Activities
3 43 Kecelakaan
Direktorat Jenderal Minyak dan Gas BumiKementerian Energi dan Sumber Daya Mineral
6
STATISTIKMinyak dan Gas Bumi
2016
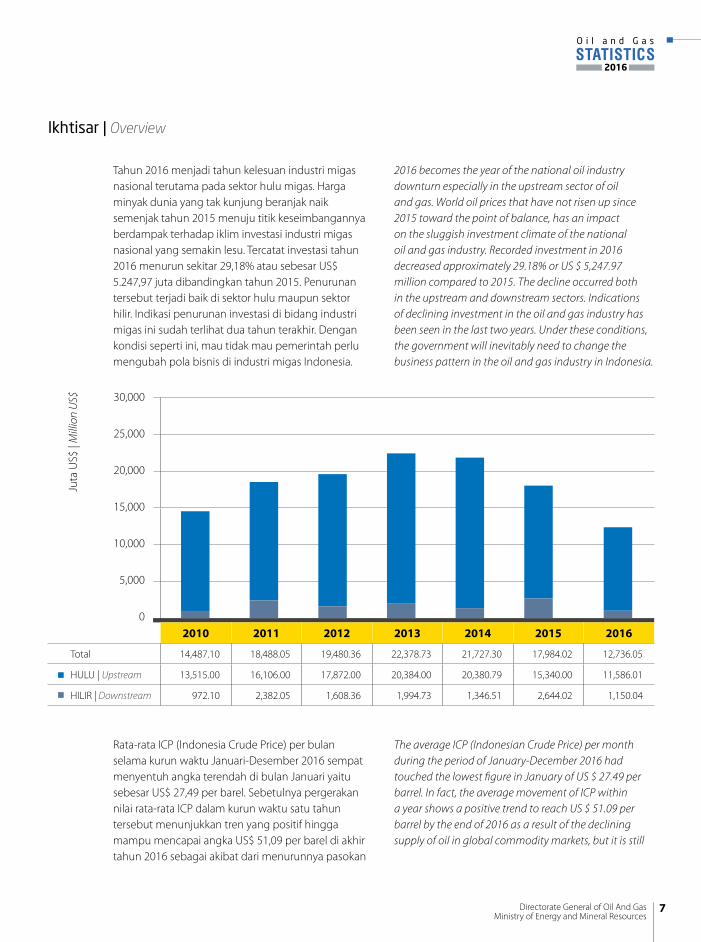
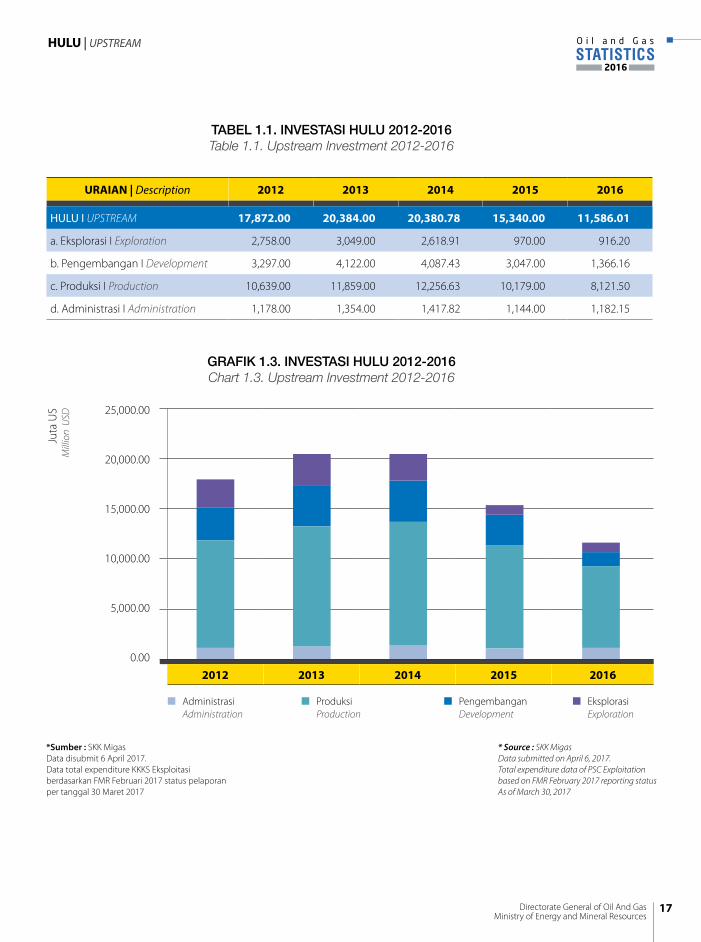
Tahun 2016 menjadi tahun kelesuan industri migas nasional terutama pada sektor hulu migas. Harga minyak dunia yang tak kunjung beranjak naik semenjak tahun 2015 menuju titik keseimbangannya berdampak terhadap iklim investasi industri migas nasional yang semakin lesu. Tercatat investasi tahun 2016 menurun sekitar 29,18% atau sebesar US$ 5.247,97 juta dibandingkan tahun 2015. Penurunan tersebut terjadi baik di sektor hulu maupun sektor hilir. Indikasi penurunan investasi di bidang industri migas ini sudah terlihat dua tahun terakhir. Dengan kondisi seperti ini, mau tidak mau pemerintah perlu mengubah pola bisnis di industri migas Indonesia.
2016 becomes the year of the national oil industry downturn especially in the upstream sector of oil and gas. World oil prices that have not risen up since 2015 toward the point of balance, has an impact on the sluggish investment climate of the national oil and gas industry. Recorded investment in 2016 decreased approximately 29.18% or US $ 5,247.97 million compared to 2015. The decline occurred both in the upstream and downstream sectors. Indications of declining investment in the oil and gas industry has been seen in the last two years. Under these conditions, the government will inevitably need to change the business pattern in the oil and gas industry in Indonesia.
Rata-rata ICP (Indonesia Crude Price) per bulan selama kurun waktu Januari-Desember 2016 sempat menyentuh angka terendah di bulan Januari yaitu sebesar US$ 27,49 per barel. Sebetulnya pergerakan nilai rata-rata ICP dalam kurun waktu satu tahun tersebut menunjukkan tren yang positif hingga mampu mencapai angka US$ 51,09 per barel di akhir tahun 2016 sebagai akibat dari menurunnya pasokan
The average ICP (Indonesian Crude Price) per month during the period of January-December 2016 had touched the lowest figure in January of US $ 27.49 per barrel. In fact, the average movement of ICP within a year shows a positive trend to reach US $ 51.09 per barrel by the end of 2016 as a result of the declining supply of oil in global commodity markets, but it is still
Ikhtisar | Overview
2010 2011 2012 2013 2014 2015 2016
Total 14,487.10 18,488.05 19,480.36 22,378.73 21,727.30 17,984.02 12,736.05
HULU | Upstream 13,515.00 16,106.00 17,872.00 20,384.00 20,380.79 15,340.00 11,586.01
HILIR | Downstream 972.10 2,382.05 1,608.36 1,994.73 1,346.51 2,644.02 1,150.04
30,000
25,000
20,000
15,000
10,000
5,000
0
Juta
US$
| M
illio
n U
S$
7Directorate General of Oil And GasMinistry of Energy and Mineral Resources
STATISTICSO i l a n d G a s
2016
minyak di pasar komoditas global, namun hal tersebut tetap tidak mampu mendongkrak iklim investasi di industri migas.
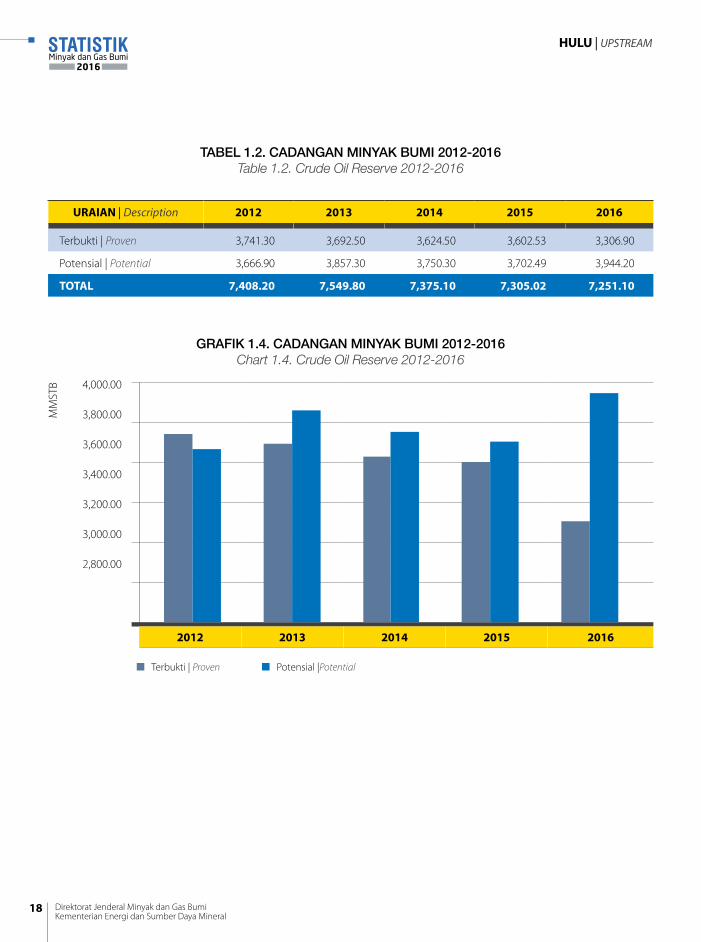
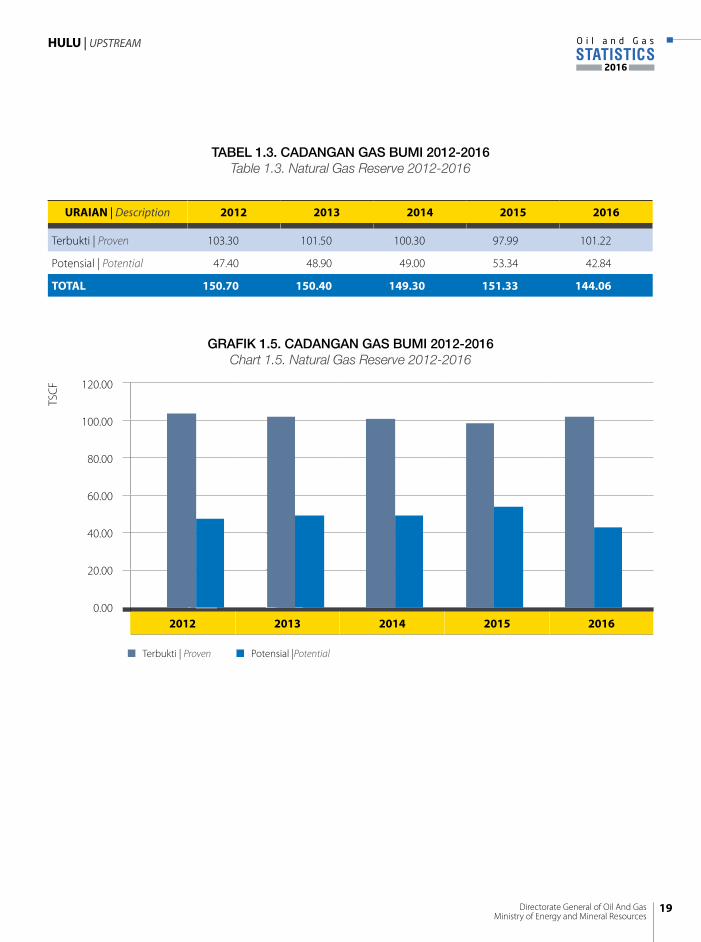
Lesunya industri migas nasional juga ditandai oleh tidak adanya penandatanganan kontrak baru wilayah kerja migas konvensional pada tahun 2016 dan hanya satu penandatanganan kontrak baru wilayah kerja migas non-konvensional. Di sisi lain, kegiatan pemboran eksplorasi hanya dilakukan di 34 titik sumur dengan penemuan sebanyak 9 sumur atau dengan kata lain hanya mencapai 26% rasio kesuksesannya. Hal tersebut berdampak kepada cadangan minyak dan gas bumi yang cenderung menurun dibandingkan tahun sebelumnya. Tercatat cadangan minyak pada tahun 2016 menurun sebesar 53,92 MMSTB dibandingkan tahun 2015, dan cadangan gas menurun sebesar 7,27 TSCF.
Sementara itu, produksi minyak dan kondensat pada tahun 2016 sebesar 831.058 barel per hari mengalami kenaikan sebesar 45.266 barel per hari (5,76%) dibandingkan tahun 2015. Salah satu penyebab kenaikan angka produksi ini adalah telah berproduksinya Lapangan Banyu Urip Blok Cepu dengan rata-rata produksi sebesar 171.106 barel per hari pada tahun 2016. Sedangkan produksi gas bumi tahun 2016 sebesar 7.398 MMSCFD mengalami penurunan sebesar 139,27 MMSCFD (-1,72%) dibandingkan produksi tahun 2015. Penurunan produksi gas pada tahun 2016 ini di antaranya disebabkan oleh tidak adanya penemuan cadangan gas bumi yang signifikan dalam beberapa tahun terakhir serta belum dikembangkannya lapangan gas yang ada sebagai akibat dari kendala pembeli gas dan seringkali penyerapan dari pembeli gas yang tidak optimal karena pengaruh kondisi perekonomian nasional dan global pada tahun 2016.
Sektor hilir migas memberikan gambaran yang berbeda, di mana pergerakan data biasanya dipengaruhi oleh tingkat konsumsi atau penjualan bahan bakar minyak (BBM) dan LPG. Secara agregat, data penjualan BBM tahun 2016 sebesar 66.939.112 Kiloliter menurun 0,84% dari tahun sebelumnya yaitu sebesar 67.509.826 Kiloliter. Namun demikian,
unable to boost Investment climate in the oil and gas industry.
The sluggishness of the national oil and gas industry is also marked by the absence of a new contract signing of the conventional oil and gas working area by 2016 and only one signing of a new contract of non-conventional oil and gas working area. On the other hand, exploration drilling activities are only conducted in 34 wells with the discovery of 9 wells or in other words only reaches 26% success ratio. This has an impact on oil and gas reserves that tend to decrease compared to the previous year. Recorded oil reserves in 2016 decreased by 53.92 MMSTB compared to 2015, and gas reserves decreased by 7.27 TSCF.
Meanwhile, oil and condensate production in 2016 was 831,058 barrels per day, an increase of 45,266 barrels per day (5.76%) compared to 2015. One of the causes of this increase is the production of Banyu Urip Field Block Cepu with average The average production of 171,106 barrels per day in 2016. While natural gas production in 2016 amounted to 7,398 MMSCFD decreased by 139.27 MMSCFD (-1.72%) compared to production in 2015. The decline in gas production in 2016 was caused by The absence of significant discovery of natural gas reserves in recent years and the lack of development of existing gas fields. These were results of gas buyer constraints and suboptimal absorption from gas buyers due to the impact of national and global economic conditions in 2016.
The downstream sector of oil and gas shows a different picture Data movement is usually influenced by the level of consumption or sales of fuel oil (BBM) and LPG. In aggregate, 2016 BBM sales data of 66,939,112 Kiloliters decreased 0.84% from the previous year at 67,509,826 Kiloliters.
Direktorat Jenderal Minyak dan Gas BumiKementerian Energi dan Sumber Daya Mineral
8
STATISTIKMinyak dan Gas Bumi
2016
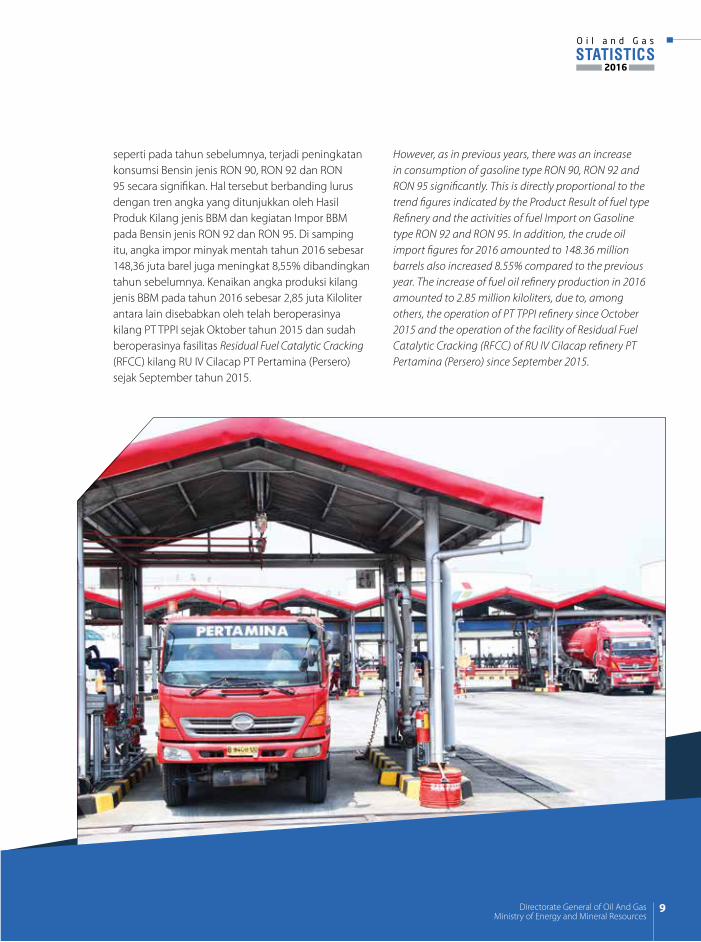
seperti pada tahun sebelumnya, terjadi peningkatan konsumsi Bensin jenis RON 90, RON 92 dan RON 95 secara signifikan. Hal tersebut berbanding lurus dengan tren angka yang ditunjukkan oleh Hasil Produk Kilang jenis BBM dan kegiatan Impor BBM pada Bensin jenis RON 92 dan RON 95. Di samping itu, angka impor minyak mentah tahun 2016 sebesar 148,36 juta barel juga meningkat 8,55% dibandingkan tahun sebelumnya. Kenaikan angka produksi kilang jenis BBM pada tahun 2016 sebesar 2,85 juta Kiloliter antara lain disebabkan oleh telah beroperasinya kilang PT TPPI sejak Oktober tahun 2015 dan sudah beroperasinya fasilitas Residual Fuel Catalytic Cracking (RFCC) kilang RU IV Cilacap PT Pertamina (Persero) sejak September tahun 2015.
However, as in previous years, there was an increase in consumption of gasoline type RON 90, RON 92 and RON 95 significantly. This is directly proportional to the trend figures indicated by the Product Result of fuel type Refinery and the activities of fuel Import on Gasoline type RON 92 and RON 95. In addition, the crude oil import figures for 2016 amounted to 148.36 million barrels also increased 8.55% compared to the previous year. The increase of fuel oil refinery production in 2016 amounted to 2.85 million kiloliters, due to, among others, the operation of PT TPPI refinery since October 2015 and the operation of the facility of Residual Fuel Catalytic Cracking (RFCC) of RU IV Cilacap refinery PT Pertamina (Persero) since September 2015.
9Directorate General of Oil And GasMinistry of Energy and Mineral Resources
STATISTICSO i l a n d G a s
2016
Sejalan dengan hal tersebut, penjualan Bensin jenis RON 90 pada tahun 2016 membukukan catatan kenaikan yang spektakuler sebesar 5.425.619 Kiloliter atau 1427,94% dari tahun sebelumnya. Kemudian penjualan Bensin jenis RON 92 pada tahun 2016 membukukan catatan kenaikan sebesar 2.027.641 Kiloliter atau 73,41% dari tahun sebelumnya. Dan, penjualan Bensin jenis RON 95 pada tahun 2016 membukukan catatan kenaikan sebesar 12.196 Kiloliter atau 4,37% dari tahun sebelumnya.
Program konversi Minyak Tanah ke LPG yang dimulai pada tahun 2009 dan masih berlangsung hingga saat ini, menunjukkan tren positif pada angka penjualan LPG nasional. Tercatat pada tahun 2016, penjualan LPG mengalami peningkatan sebesar 4,17% dari 6.376.990 Mton di tahun 2015 menjadi 6.642.633 Mton di tahun 2016. Peningkatan tersebut disertai dengan peningkatan impor LPG sebesar 5,63% pada tahun 2016. Namun demikian, produksi LPG tahun 2016 mengalami penurunan dibandingkan produksi LPG tahun 2015 sebesar 65.840 Mton. Hal ini disebabkan terdapat beberapa badan usaha pemegang izin usaha pengolahan gas bumi yang sudah tidak beroperasi dan telah habis masa berlaku izin usaha pengolahannya pada tahun 2016, antara lain PT. Medco LPG Kaji, PT. Pertamina (Persero) Pangkalan Brandan, dan PT. Maruta Bumi Prima Langkat. Selain itu terdapat beberapa badan usaha pemegang izin usaha pengolahan gas bumi yang tidak beroperasi pada tahun 2016 disebabkan jaminan pasokan gas bumi, perubahan skema, maupun perjanjian kerjasama yang belum selesai yaitu, PT. Media Karya Sentosa I dan II, PT. Yudistira Haka Perkasa dan PT. Wahana Insannugraha.
Di sisi lain, perkembangan data ekspor minyak mentah cenderung meningkat kendati harga ICP terpuruk sepanjang tahun 2016. Ekspor minyak mentah tahun 2016 mengalami peningkatan sebanyak 9,13% atau sebesar 10,50 juta barel dibandingkan tahun sebelumnya. Sementara itu ekspor LNG tahun 2016 menurun 7,81% atau sebesar 63,34 juta MMBTU dibandingkan tahun sebelumnya meskipun produksi LNG mengalami kenaikan. Hal ini disebabkan oleh kebijakan pemerintah yang terus memprioritaskan penggunaan LNG untuk domestik.
In line with that, sales of RON 90 gasoline in 2016 posted a spectacular rise in record of 5,425,619 Kiloliters or 1427.94% from a year earlier. The sales of RON 92 gasoline in 2016 posted a record increase of 2,027,641 Kiloliters or 73.41% from a year earlier. Moreover, the sales of gasoline type RON 95 in 2016 recorded an increase of 12,196 Kiloliter or 4.37% compared to the previous year.
The kerosene to LPG conversion program that started in 2009 and continues to date, shows a positive trend in national LPG sales figures. Recorded in 2016, LPG sales increased by 4.17% from 6,376,990 Mton in 2015 to 6,642,633 Mton in 2016. The increase was accompanied by an increase in LPG import by 5.63% in 2016. However, LPG production in 2016 decreased compared to 2015 LPG production of 65,840 Mton. This is due to the fact that there are some business license holders of natural gas processing business has not operated and expired its processing business license in 2016, such as PT. Medco LPG Kaji, PT. Pertamina (Persero) Pangkalan Brandan, and PT. Maruta Bumi Prima Langkat. In addition, there are several business license holders of natural gas processing business which is not operated in 2016 due to the guarantee of natural gas supply, scheme change, and unfinished cooperation agreement. These include PT. Media Karya Sentosa I and II, PT. Yudistira Haka Perkasa and PT. Wahana Insannugraha.
On the other hand, the development of crude oil export data tends to increase despite the ICP prices slumped throughout 2016. Crude oil exports in 2016 increased by 9.13% or 10.50 million barrels compared to the previous year. Meanwhile, LNG exports in 2016 decreased 7.81% or 63.34 million MMBTU compared to the previous year although LNG production increased. This is due to government policies that continue to prioritize the use of LNG for domestic market.
Direktorat Jenderal Minyak dan Gas BumiKementerian Energi dan Sumber Daya Mineral
10
STATISTIKMinyak dan Gas Bumi
2016
HULU UPSTREAM
STATISTIKMinyak dan Gas Bumi
2016
STATISTICSO i l a n d G a s
2016
Direktorat Jenderal Minyak dan Gas BumiKementerian Energi dan Sumber Daya Mineral
Directorate General of Oil And GasMinistry of Energy and Mineral Resources
1. Kegiatan usaha hulu migas di Indonesia dijalankan berdasarkan kontrak bagi hasil atau Production Sharing Contract (PSC). PSC dapat diibaratkan dengan model usaha pertanian yang banyak dipraktikkan di Indonesia. Dalam bisnis hulu migas, pemerintah sebagai “pemilik lahan/sawah”, yang memberikan izin kepada “petani” untuk mengelola lahan. Sementara itu, “petani” merupakan perusahaan migas baik nasional maupun asing yang menyediakan semua modal dan alat yang dibutuhkan selama beroperasi.
2. Kontrak migas dibedakan menjadi dua kategori yaitu kontrak konvensional dan kontrak non-konvensional. Kontrak konvensional merupakan kontrak untuk pengelolaan minyak dan gas bumi yang berasal dari lapisan batuan pasir atau batuan karbonat yang metode produksinya sudah sangat dikenali oleh perusahaan maupun pemerintah. Sedangkan kontrak non-konvensional merupakan kontrak untuk pengelolaan minyak dan gas bumi yang berasal dari lapisan batuan lempung (shale) atau lapisan batuan batu bara (coal bed) dan lapisan batuan lainnya selain pasir dan karbonat yang memiliki metode produksi yang masih dalam tahap pengembangan.
3. Cadangan didefinisikan sebagai perkiraan volume minyak bumi dan/atau gas alam yang ditemukan di dalam batuan reservoir dan secara komersial dapat diperoleh/diproduksikan. Cadangan dapat dibagi menjadi dua kategori yaitu cadangan terbukti dan cadangan potensial. Cadangan terbukti adalah jumlah volume minyak bumi dan/atau gas alam yang berdasarkan analisa data geologi dan keteknikan dapat diperoleh secara komersial dalam jangka waktu yang dapat ditentukan pada kondisi ekonomi, metode operasi dan peraturan pemerintah yang berlaku saat itu. Cadangan potensial adalah jumlah volume minyak bumi dan/atau gas alam yang diperkirakan terdapat di dalam batuan reservoir, berdasarkan data geologi eksplorasi masih harus dibuktikan dengan pengeboran dan pengujian.
1. Upstream oil and gas business activities in Indonesia are carried out under a Production Sharing Contract (PSC). PSC can be analogous to a model of agricultural business that is widely practiced in Indonesia. In the upstream oil and gas business, the government acts as a ‘land owner’, and gives permission to ‘farmers’ to manage the land. Meanwhile, ‘farmers’ are both national and foreign oil and gas companies providing all necessary capital and equipment during operation.
2. Oil and gas contracts are classified into two categories, namely conventional contract and non-conventional contract. Conventional contracts are contracts for managing oil and natural gas derived from sandstone layers or carbonate rocks whose methods of production are well recognized by companies and governments. While non-conventional contracts are contracts for the management of oil and natural gas derived from layers of rocks (shale) or layers of coal bed (rock bed) and other rock layers in addition to sand and carbonate which has a production method which is still in development stage.
3. Reserves are defined as estimates of the volume of petroleum and/or natural gas discovered in the reservoir rock and commercially available or produced. Reserves can be divided into two categories: proven reserves and potential reserves. Proven reserves are the amounts of petroleum and/or natural gas volumes based on analysis of geological and engineering data. The Data indicates that reserves can be obtained commercially within a specified period of time under certain economic conditions, operating methods and government regulations apply at that time. Potential reserves are the amounts of petroleum and/or natural gas expected in reservoir rock, based on exploration geological data still to be proven by drilling and testing.
PENJELASAN TEKNIS | Technical Notes
Direktorat Jenderal Minyak dan Gas BumiKementerian Energi dan Sumber Daya Mineral
12
STATISTIKMinyak dan Gas Bumi
2016
HULU | UPSTREAM
4. Eksplorasi adalah proses kegiatan penyelidikan lapangan untuk penggalian informasi dan pengumpulan data-data yang dilakukan dengan tujuan kepentingan penelitian dan penyediaan informasi bagi pihak-pihak yang berkepentingan.
5. Survei seismik merupakan salah satu metode yang digunakan oleh geofisik ketika melakukan eksplorasi untuk menentukan lokasi minyak dan/atau gas di bawah permukaan bumi. Survei seismik dilakukan dengan cara memancarkan gelombang seismik berupa getaran yang akan merambat melalui lapisan-lapisan di bawah permukaan bumi. Gelombang tersebut kemudian akan dipantulkan kembali oleh batuan lalu gelombang pantul tersebut akan direkam oleh alat yang bernama geophones. Gelombang seismik biasanya diciptakan dengan menggunakan bahan peledak atau proses yang disebut dengan vibroseis. Vibroseis dilakukan dengan menggunakan kendaraan yang akan memancarkan gelombang seismik. Gelombang yang diterima oleh geophones akan diolah oleh ahli geofisika untuk melihat kenampakan dari lapisan-lapisan di bawah permukaan bumi.
6. Terdapat 2 tipe survei seismik yang dilakukan di industri migas, yaitu seismik 2D dan seismik 3D. Prinsip yang digunakan dalam melakukan survei seismik 2D maupun 3D sebenarnya tidak jauh berbeda, intinya adalah mengirimkan gelombang seismik dari permukaan untuk kemudian gelombang yang dipantulkan oleh batuan akan direkam. Alat yang digunakan dalam seismik 3D lebih canggih dibandingkan seismik 2D. Informasi yang didapatkan dari seismik 3D lebih akurat dan detail sehingga kenampakan lapisan tanah bumi akan lebih terlihat dibandingkan seismik 2D.
7. Pemboran sumur eksplorasi dilakukan dengan tujuan untuk mengonfirmasi keberadaan minyak dan/atau gas di bawah permukaan. Lokasi titik pemboran sumur eksplorasi ditentukan oleh geologi dan geofisika pada tahapan eksplorasi. Pemboran sumur eksplorasi tidak seluruhnya berhasil menemukan minyak dan/atau gas. Justru dari sekian banyak pemboran sumur
4. Exploration is a process of field investigation activities to extract information and collect data conducted with the purpose of research interests and provision of information to interested parties.
5. Seismic surveys are one of the methods used by geophysics when exploring to determine the location of oil and/or gas beneath the earth’s surface. Seismic survey is done by emitting seismic waves of vibration that will propagate through the layers beneath the earth’s surface. The wave will then be reflected back by rocks then reflected waves will be recorded by a tool called geophones. Seismic waves are usually created using explosives or processes called vibroseis. Vibroseis is performed using a vehicle that will emit seismic waves. Waves received by geophones will be processed by geophysicists to see the appearance of layers beneath the earth’s surface.
6. There are two types of seismic surveys conducted in the oil and gas industry, namely 2D seismic and 3D seismic. The principle used in conducting 2D and 3D seismic surveys is actually not significantly different, the point is to transmit seismic waves from the surface and record waves reflected by the rock. The tools used in 3D seismics are more sophisticated than 2D seismic. Information obtained from 3D seismic is more accurate and detailed so that the appearance of the earth’s soil layer will be more visible than 2D seismic.
7. Exploration well drilling is conducted with the aim of confirming the presence of oil and/or gas below the surface. The location of exploration well drilling points is determined by geology and geophysics at the exploration stage. Exploration well drilling is not entirely successful in finding oil and/or gas. Among many exploration well drilling, in general only 1/3
13Directorate General of Oil And GasMinistry of Energy and Mineral Resources
STATISTICSO i l a n d G a s
2016
HULU | UPSTREAM
eksplorasi, pada umumnya hanya 1/3 yang berhasil mengonfirmasi keberadaan minyak di bawah permukaan bumi.
8. Eksploitasi adalah segala bentuk upaya atau kegiatan yang dilakukan untuk melakukan penggalian-penggalian potensi yang terdapat pada suatu objek, baik itu berupa sumber daya alam maupun yang lainnya demi kepentingan (pemenuhan kebutuhan) sekelompok / banyak orang. Produksi minyak dan/atau gas merupakan salah satu tahap kegiatan eksploitasi. Produksi yaitu kegiatan industri migas yang menghasilkan minyak dan gas bumi sehingga siap untuk diusahakan lebih lanjut. Lifting yaitu proses pengangkatan minyak dan gas bumi ke atas permukaan dengan menggunakan teknologi dan alat-alat yang telah ditentukan yang siap diserahkan di tempat penjualan.
9. Dalam tahapan produksi gas bumi, seringkali tidak sepenuhnya gas dapat dimanfaatkan, sehingga gas yang tidak termanfaatkan tersebut perlu mendapatkan perlakuan lebih lanjut seperti flare atau venting. Flared gas (gas tersuar bakar) adalah gas terproduksi yang terpaksa dibakar karena tidak dapat ditangani oleh fasilitas lapangan pengolahan yang tersedia. Venting gas adalah gas terproduksi yang terpaksa dibuang secara langsung karena tidak dapat ditangani oleh fasilitas lapangan pengolahan yang tersedia.
10. Harga minyak mentah Indonesia (Indonesian Crude Price) ditetapkan oleh pemerintah setiap bulannya. Terhitung mulai tanggal 1 Juli 2016, melalui Surat Keputusan Menteri ESDM Nomor 6171 K/12/MEM/2016, formula harga minyak mentah Indonesia adalah ICP = Dated Brent + Alpha, di mana Alpha dihitung dengan mempertimbangkan kesesuaian kualitas minyak mentah, perkembangan harga minyak mentah internasional dan ketahanan energi nasional. Perhitungan Alpha adalah 50% Delta RIM + 50% Delta PLATTS, di mana Delta RIM = Selisih antara publikasi harga minyak mentah Indonesia oleh RIM dengan Dated Brent publikasi Platts pada bulan pengapalan, dan Delta Platts = Selisih antara publikasi harga minyak mentah Indonesia oleh
that successfully confirm the existence of oil beneath the earth’s surface.
3. Exploitation is any form of effort or activity undertaken to perform excavations the potential contents in an object, it can in the form of natural resources as well as others within the interests (the need fulfillment) of a group or many people. Oil and/or gas production is one of the stages of exploitation activity. Production is oil and gas industry activity that produces oil and gas so that ready for further utilization. Lifting is the process of removal of oil and gas to the surface by using predetermined technology and tools to be delivered at the point of sale.
9. In the production stages of natural gas, most of the time the gas can not be fully utilized, so the unused gas needs to get further treatment such as flare or venting. Flared gas is a manufactured gas that has to be burned because it can not be handled by the available field facilities. Venting gas is a manufactured gas that has to be disposed of directly because it can not be handled by available field facilities.
10. Indonesia Crude Price (Indonesian Crude Price) is set by the government every month. As of July 1, 2016, through the Decree of the Minister of Energy and Mineral Resources No. 6171 K / 12 / MEM / 2016, Indonesia’s crude oil price formula is ICP = Dated Brent + Alpha, where Alpha is calculated by considering the suitability of crude oil quality, International and national energy security. Alpha calculation is 50% Delta RIM + 50% Delta PLATTS, where Delta RIM = Difference between RIM’s published price of crude oil and Dated Brent Platts publication on shipping month, and Delta Platts = Difference between Platebet Indonesia’s publication of crude oil price Dated Brent Platts publication on shipping month.
Direktorat Jenderal Minyak dan Gas BumiKementerian Energi dan Sumber Daya Mineral
14
STATISTIKMinyak dan Gas Bumi
2016
HULU | UPSTREAM
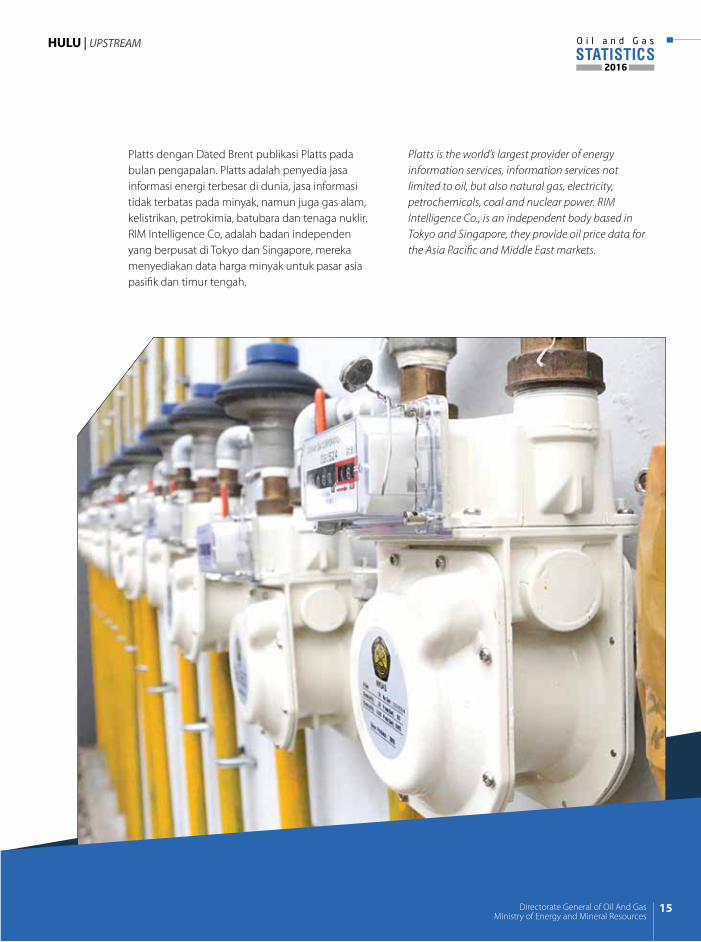
Platts dengan Dated Brent publikasi Platts pada bulan pengapalan. Platts adalah penyedia jasa informasi energi terbesar di dunia, jasa informasi tidak terbatas pada minyak, namun juga gas alam, kelistrikan, petrokimia, batubara dan tenaga nuklir. RIM Intelligence Co, adalah badan independen yang berpusat di Tokyo dan Singapore, mereka menyediakan data harga minyak untuk pasar asia pasifik dan timur tengah.
Platts is the world’s largest provider of energy information services, information services not limited to oil, but also natural gas, electricity, petrochemicals, coal and nuclear power. RIM Intelligence Co., is an independent body based in Tokyo and Singapore, they provide oil price data for the Asia Pacific and Middle East markets.
15Directorate General of Oil And GasMinistry of Energy and Mineral Resources
STATISTICSO i l a n d G a s
2016
HULU | UPSTREAM
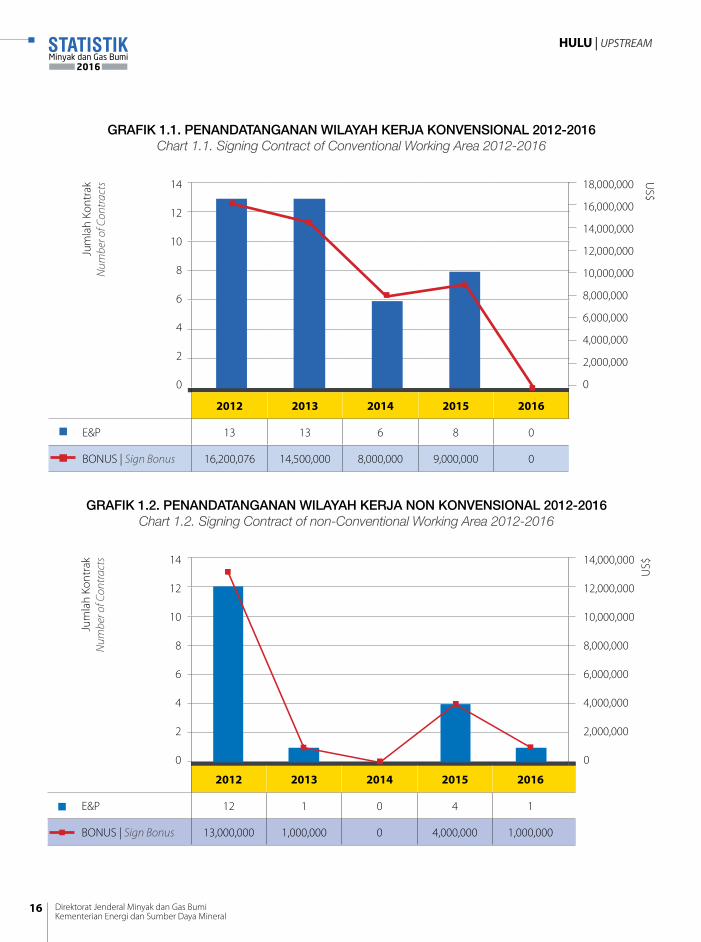
GRAFIK 1.2. PENANDATANGANAN WILAYAH KERJA NON KONVENSIONAL 2012-2016Chart 1.2. Signing Contract of non-Conventional Working Area 2012-2016
2012 2013 2014 2015 2016
E&P 12 1 0 4 1
BONUS | Sign Bonus 13,000,000 1,000,000 0 4,000,000 1,000,000
14
12
10
8
6
4
2
0
14,000,000
12,000,000
10,000,000
8,000,000
6,000,000
4,000,000
2,000,000
0
US$
Jum
lah
Kont
rak
Num
ber o
f Con
trac
ts
GRAFIK 1.1. PENANDATANGANAN WILAYAH KERJA KONVENSIONAL 2012-2016Chart 1.1. Signing Contract of Conventional Working Area 2012-2016
2012 2013 2014 2015 2016
E&P 13 13 6 8 0
BONUS | Sign Bonus 16,200,076 14,500,000 8,000,000 9,000,000 0
18,000,000
16,000,000
14,000,000
12,000,000
10,000,000
8,000,000
6,000,000
4,000,000
2,000,000
0
US$
Jum
lah
Kont
rak
Num
ber o
f Con
trac
ts 14
12
10
8
6
4
2
0
Direktorat Jenderal Minyak dan Gas BumiKementerian Energi dan Sumber Daya Mineral
16
STATISTIKMinyak dan Gas Bumi
2016
HULU | UPSTREAM
URAIAN | Description 2012 2013 2014 2015 2016
HULU I UPSTREAM 17,872.00 20,384.00 20,380.78 15,340.00 11,586.01
a. Eksplorasi I Exploration 2,758.00 3,049.00 2,618.91 970.00 916.20
b. Pengembangan I Development 3,297.00 4,122.00 4,087.43 3,047.00 1,366.16
c. Produksi I Production 10,639.00 11,859.00 12,256.63 10,179.00 8,121.50
d. Administrasi I Administration 1,178.00 1,354.00 1,417.82 1,144.00 1,182.15
TABEL 1.1. INVESTASI HULU 2012-2016Table 1.1. Upstream Investment 2012-2016
GRAFIK 1.3. INVESTASI HULU 2012-2016Chart 1.3. Upstream Investment 2012-2016
*Sumber : SKK MigasData disubmit 6 April 2017.Data total expenditure KKKS Eksploitasi berdasarkan FMR Februari 2017 status pelaporan per tanggal 30 Maret 2017
* Source : SKK MigasData submitted on April 6, 2017.Total expenditure data of PSC Exploitation based on FMR February 2017 reporting statusAs of March 30, 2017
Administrasi Administration
Pengembangan Development
Produksi Production
EksplorasiExploration
2012 2013 2014 2015 2016
25,000.00
20,000.00
15,000.00
10,000.00
5,000.00
0.00
Juta
US
Mill
ion
USD
17Directorate General of Oil And GasMinistry of Energy and Mineral Resources
STATISTICSO i l a n d G a s
2016
HULU | UPSTREAM
URAIAN | Description 2012 2013 2014 2015 2016
Terbukti | Proven 3,741.30 3,692.50 3,624.50 3,602.53 3,306.90
Potensial | Potential 3,666.90 3,857.30 3,750.30 3,702.49 3,944.20
TOTAL 7,408.20 7,549.80 7,375.10 7,305.02 7,251.10
TABEL 1.2. CADANGAN MINYAK BUMI 2012-2016Table 1.2. Crude Oil Reserve 2012-2016
2012 2013 2014 2015 2016
4,000.00
3,800.00
3,600.00
3,400.00
3,200.00
3,000.00
2,800.00
MM
STB
Terbukti | Proven Potensial |Potential
GRAFIK 1.4. CADANGAN MINYAK BUMI 2012-2016Chart 1.4. Crude Oil Reserve 2012-2016
Direktorat Jenderal Minyak dan Gas BumiKementerian Energi dan Sumber Daya Mineral
18
STATISTIKMinyak dan Gas Bumi
2016
HULU | UPSTREAM
URAIAN | Description 2012 2013 2014 2015 2016
Terbukti | Proven 103.30 101.50 100.30 97.99 101.22
Potensial | Potential 47.40 48.90 49.00 53.34 42.84
TOTAL 150.70 150.40 149.30 151.33 144.06
TABEL 1.3. CADANGAN GAS BUMI 2012-2016Table 1.3. Natural Gas Reserve 2012-2016
GRAFIK 1.5. CADANGAN GAS BUMI 2012-2016Chart 1.5. Natural Gas Reserve 2012-2016
2012 2013 2014 2015 2016
120.00
100.00
80.00
60.00
40.00
20.00
0.00
TSCF
Terbukti | Proven Potensial |Potential
19Directorate General of Oil And GasMinistry of Energy and Mineral Resources
STATISTICSO i l a n d G a s
2016
HULU | UPSTREAM
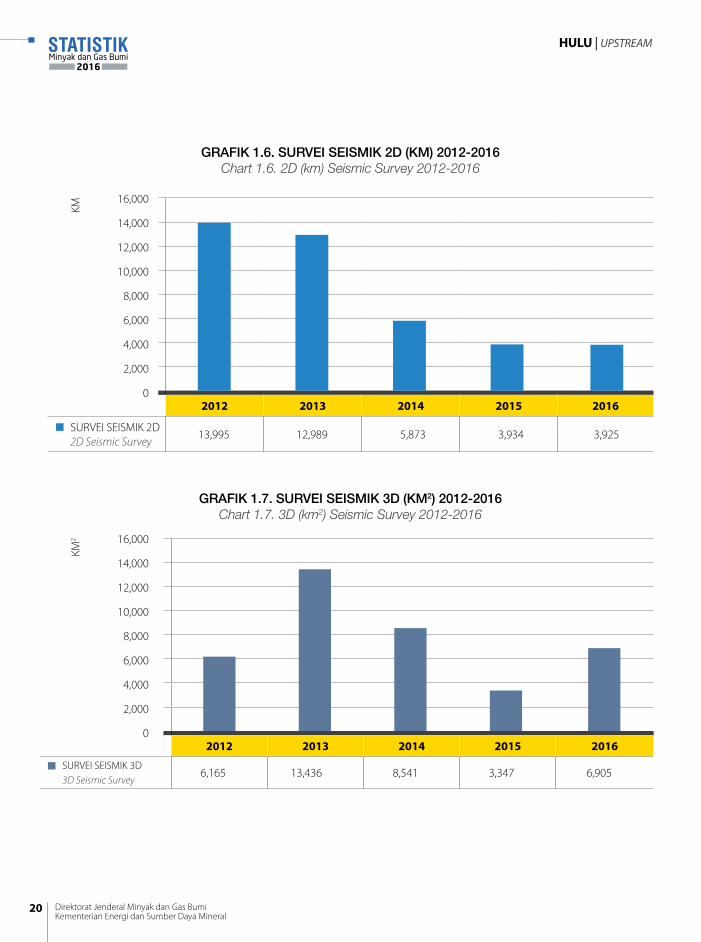
GRAFIK 1.6. SURVEI SEISMIK 2D (KM) 2012-2016Chart 1.6. 2D (km) Seismic Survey 2012-2016
2012 2013 2014 2015 2016
SURVEI SEISMIK 2D2D Seismic Survey
13,995 12,989 5,873 3,934 3,925
16,000
14,000
12,000
10,000
8,000
6,000
4,000
2,000
0
KM
GRAFIK 1.7. SURVEI SEISMIK 3D (KM2) 2012-2016Chart 1.7. 3D (km2) Seismic Survey 2012-2016
2012 2013 2014 2015 2016
SURVEI SEISMIK 3D3D Seismic Survey
6,165 13,436 8,541 3,347 6,905
16,000
14,000
12,000
10,000
8,000
6,000
4,000
2,000
0
KM2
Direktorat Jenderal Minyak dan Gas BumiKementerian Energi dan Sumber Daya Mineral
20
STATISTIKMinyak dan Gas Bumi
2016
HULU | UPSTREAM
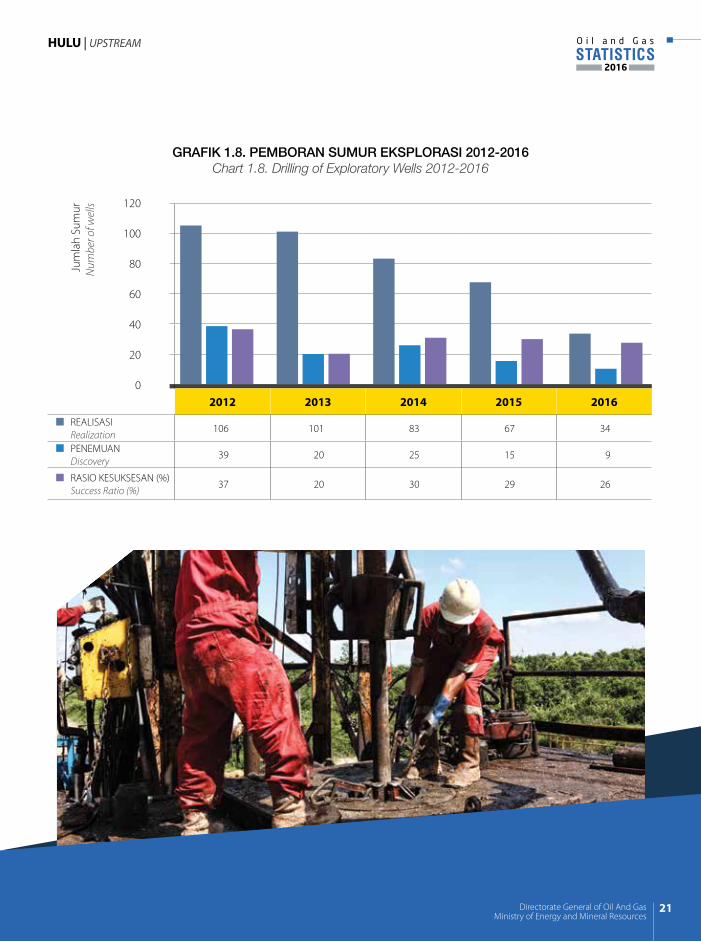
GRAFIK 1.8. PEMBORAN SUMUR EKSPLORASI 2012-2016Chart 1.8. Drilling of Exploratory Wells 2012-2016
2012 2013 2014 2015 2016
REALISASI Realization
106 101 83 67 34
PENEMUAN Discovery
39 20 25 15 9
RASIO KESUKSESAN (%) Success Ratio (%)
37 20 30 29 26
120
100
80
60
40
20
0
Jum
lah
Sum
urN
umbe
r of w
ells
21Directorate General of Oil And GasMinistry of Energy and Mineral Resources
STATISTICSO i l a n d G a s
2016
HULU | UPSTREAM
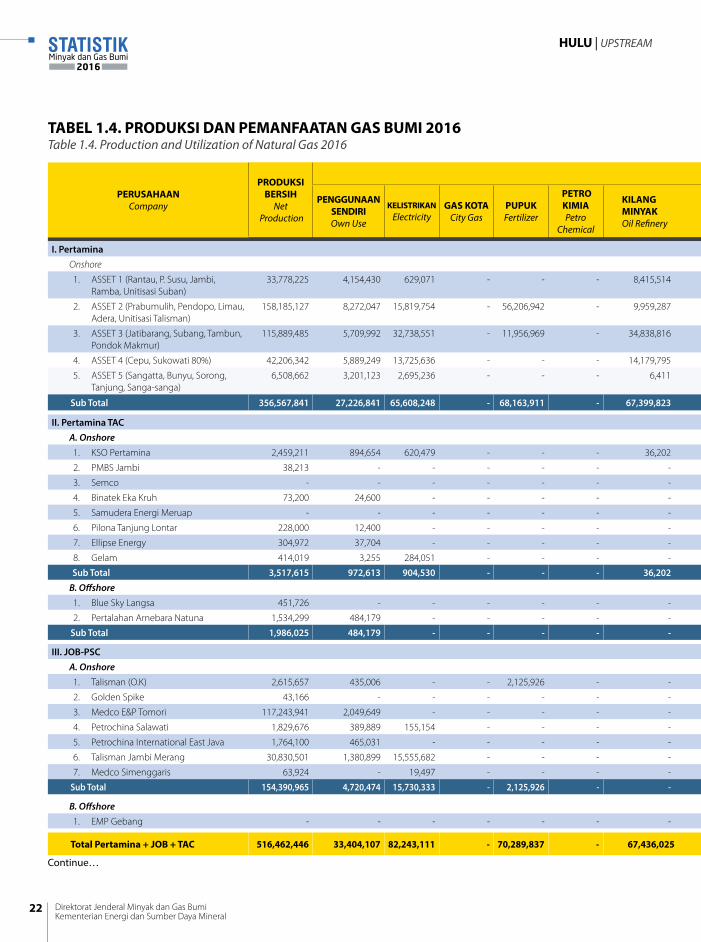
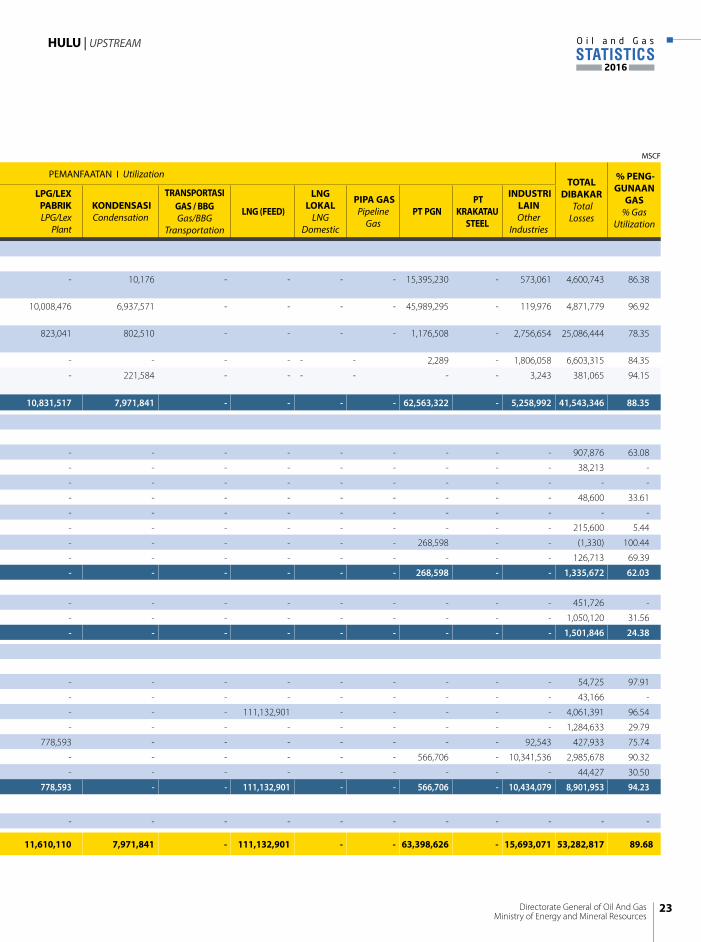
TABEL 1.4. PRODUKSI DAN PEMANFAATAN GAS BUMI 2016Table 1.4. Production and Utilization of Natural Gas 2016
MSCF
PERUSAHAANCompany
PRODUKSI BERSIH
Net Production
PEMANFAATAN I Utilization TOTAL
DIBAKAR Total Losses
% PENGGUNAAN
GAS% Gas
Utilization
PENGGUNAAN SENDIRI Own Use
KELISTRIKANElectricity
GAS KOTACity Gas
PUPUK Fertilizer
PETRO KIMIA Petro
Chemical
KILANG MINYAK Oil Refinery
LPG/LEX PABRIK LPG/Lex
Plant
KONDENSASICondensation
TRANSPORTASI GAS / BBG Gas/BBG
Transportation
LNG (FEED)
LNG LOKAL
LNG Domestic
PIPA GASPipeline
Gas PT PGN
PT KRAKATAU
STEEL
INDUSTRI LAINOther
Industries
I. PertaminaOnshore
1. ASSET 1 (Rantau, P. Susu, Jambi, Ramba, Unitisasi Suban)
33,778,225 4,154,430 629,071 - - - 8,415,514 - 10,176 - - - - 15,395,230 - 573,061 4,600,743 86.38
2. ASSET 2 (Prabumulih, Pendopo, Limau, Adera, Unitisasi Talisman)
158,185,127 8,272,047 15,819,754 - 56,206,942 - 9,959,287 10,008,476 6,937,571 - - - - 45,989,295 - 119,976 4,871,779 96.92
3. ASSET 3 (Jatibarang, Subang, Tambun, Pondok Makmur)
115,889,485 5,709,992 32,738,551 - 11,956,969 - 34,838,816 823,041 802,510 - - - - 1,176,508 - 2,756,654 25,086,444 78.35
4. ASSET 4 (Cepu, Sukowati 80%) 42,206,342 5,889,249 13,725,636 - - - 14,179,795 - - - - - - 2,289 - 1,806,058 6,603,315 84.35
5. ASSET 5 (Sangatta, Bunyu, Sorong, Tanjung, Sanga-sanga)
6,508,662 3,201,123 2,695,236 - - - 6,411 - 221,584 - - - - - - 3,243 381,065 94.15
Sub Total 356,567,841 27,226,841 65,608,248 - 68,163,911 - 67,399,823 10,831,517 7,971,841 - - - - 62,563,322 - 5,258,992 41,543,346 88.35
II. Pertamina TAC A. Onshore
1. KSO Pertamina 2,459,211 894,654 620,479 - - - 36,202 - - - - - - - - - 907,876 63.08
2. PMBS Jambi 38,213 - - - - - - - - - - - - - - - 38,213 -
3. Semco - - - - - - - - - - - - - - - - - -
4. Binatek Eka Kruh 73,200 24,600 - - - - - - - - - - - - - - 48,600 33.61
5. Samudera Energi Meruap - - - - - - - - - - - - - - - - - -
6. Pilona Tanjung Lontar 228,000 12,400 - - - - - - - - - - - - - - 215,600 5.44
7. Ellipse Energy 304,972 37,704 - - - - - - - - - - - 268,598 - - (1,330) 100.44
8. Gelam 414,019 3,255 284,051 - - - - - - - - - - - - - 126,713 69.39
Sub Total 3,517,615 972,613 904,530 - - - 36,202 - - - - - - 268,598 - - 1,335,672 62.03 B. Offshore1. Blue Sky Langsa 451,726 - - - - - - - - - - - - - - - 451,726 -
2. Pertalahan Arnebara Natuna 1,534,299 484,179 - - - - - - - - - - - - - - 1,050,120 31.56
Sub Total 1,986,025 484,179 - - - - - - - - - - - - - - 1,501,846 24.38
III. JOB-PSCA. Onshore1. Talisman (O.K) 2,615,657 435,006 - - 2,125,926 - - - - - - - - - - - 54,725 97.91
2. Golden Spike 43,166 - - - - - - - - - - - - - - - 43,166 -
3. Medco E&P Tomori 117,243,941 2,049,649 - - - - - - - - 111,132,901 - - - - - 4,061,391 96.54
4. Petrochina Salawati 1,829,676 389,889 155,154 - - - - - - - - - - - - - 1,284,633 29.79
5. Petrochina International East Java 1,764,100 465,031 - - - - - 778,593 - - - - - - - 92,543 427,933 75.74
6. Talisman Jambi Merang 30,830,501 1,380,899 15,555,682 - - - - - - - - - - 566,706 - 10,341,536 2,985,678 90.32
7. Medco Simenggaris 63,924 - 19,497 - - - - - - - - - - - - - 44,427 30.50
Sub Total 154,390,965 4,720,474 15,730,333 - 2,125,926 - - 778,593 - - 111,132,901 - - 566,706 - 10,434,079 8,901,953 94.23
B. Offshore
1. EMP Gebang - - - - - - - - - - - - - - - - - -
Total Pertamina + JOB + TAC 516,462,446 33,404,107 82,243,111 70,289,837 67,436,025 11,610,110 7,971,841 111,132,901 63,398,626 15,693,071 53,282,817 89.68
Continue…
Direktorat Jenderal Minyak dan Gas BumiKementerian Energi dan Sumber Daya Mineral
22
STATISTIKMinyak dan Gas Bumi
2016
HULU | UPSTREAM
TABEL 1.4. PRODUKSI DAN PEMANFAATAN GAS BUMI 2016Table 1.4. Production and Utilization of Natural Gas 2016
MSCF
PERUSAHAANCompany
PRODUKSI BERSIH
Net Production
PEMANFAATAN I Utilization TOTAL
DIBAKAR Total Losses
% PENGGUNAAN
GAS% Gas
Utilization
PENGGUNAAN SENDIRI Own Use
KELISTRIKANElectricity
GAS KOTACity Gas
PUPUK Fertilizer
PETRO KIMIA Petro
Chemical
KILANG MINYAK Oil Refinery
LPG/LEX PABRIK LPG/Lex
Plant
KONDENSASICondensation
TRANSPORTASI GAS / BBG Gas/BBG
Transportation
LNG (FEED)
LNG LOKAL
LNG Domestic
PIPA GASPipeline
Gas PT PGN
PT KRAKATAU
STEEL
INDUSTRI LAINOther
Industries
I. PertaminaOnshore
1. ASSET 1 (Rantau, P. Susu, Jambi, Ramba, Unitisasi Suban)
33,778,225 4,154,430 629,071 - - - 8,415,514 - 10,176 - - - - 15,395,230 - 573,061 4,600,743 86.38
2. ASSET 2 (Prabumulih, Pendopo, Limau, Adera, Unitisasi Talisman)
158,185,127 8,272,047 15,819,754 - 56,206,942 - 9,959,287 10,008,476 6,937,571 - - - - 45,989,295 - 119,976 4,871,779 96.92
3. ASSET 3 (Jatibarang, Subang, Tambun, Pondok Makmur)
115,889,485 5,709,992 32,738,551 - 11,956,969 - 34,838,816 823,041 802,510 - - - - 1,176,508 - 2,756,654 25,086,444 78.35
4. ASSET 4 (Cepu, Sukowati 80%) 42,206,342 5,889,249 13,725,636 - - - 14,179,795 - - - - - - 2,289 - 1,806,058 6,603,315 84.35
5. ASSET 5 (Sangatta, Bunyu, Sorong, Tanjung, Sanga-sanga)
6,508,662 3,201,123 2,695,236 - - - 6,411 - 221,584 - - - - - - 3,243 381,065 94.15
Sub Total 356,567,841 27,226,841 65,608,248 - 68,163,911 - 67,399,823 10,831,517 7,971,841 - - - - 62,563,322 - 5,258,992 41,543,346 88.35
II. Pertamina TAC A. Onshore
1. KSO Pertamina 2,459,211 894,654 620,479 - - - 36,202 - - - - - - - - - 907,876 63.08
2. PMBS Jambi 38,213 - - - - - - - - - - - - - - - 38,213 -
3. Semco - - - - - - - - - - - - - - - - - -
4. Binatek Eka Kruh 73,200 24,600 - - - - - - - - - - - - - - 48,600 33.61
5. Samudera Energi Meruap - - - - - - - - - - - - - - - - - -
6. Pilona Tanjung Lontar 228,000 12,400 - - - - - - - - - - - - - - 215,600 5.44
7. Ellipse Energy 304,972 37,704 - - - - - - - - - - - 268,598 - - (1,330) 100.44
8. Gelam 414,019 3,255 284,051 - - - - - - - - - - - - - 126,713 69.39
Sub Total 3,517,615 972,613 904,530 - - - 36,202 - - - - - - 268,598 - - 1,335,672 62.03 B. Offshore1. Blue Sky Langsa 451,726 - - - - - - - - - - - - - - - 451,726 -
2. Pertalahan Arnebara Natuna 1,534,299 484,179 - - - - - - - - - - - - - - 1,050,120 31.56
Sub Total 1,986,025 484,179 - - - - - - - - - - - - - - 1,501,846 24.38
III. JOB-PSCA. Onshore1. Talisman (O.K) 2,615,657 435,006 - - 2,125,926 - - - - - - - - - - - 54,725 97.91
2. Golden Spike 43,166 - - - - - - - - - - - - - - - 43,166 -
3. Medco E&P Tomori 117,243,941 2,049,649 - - - - - - - - 111,132,901 - - - - - 4,061,391 96.54
4. Petrochina Salawati 1,829,676 389,889 155,154 - - - - - - - - - - - - - 1,284,633 29.79
5. Petrochina International East Java 1,764,100 465,031 - - - - - 778,593 - - - - - - - 92,543 427,933 75.74
6. Talisman Jambi Merang 30,830,501 1,380,899 15,555,682 - - - - - - - - - - 566,706 - 10,341,536 2,985,678 90.32
7. Medco Simenggaris 63,924 - 19,497 - - - - - - - - - - - - - 44,427 30.50
Sub Total 154,390,965 4,720,474 15,730,333 - 2,125,926 - - 778,593 - - 111,132,901 - - 566,706 - 10,434,079 8,901,953 94.23
B. Offshore
1. EMP Gebang - - - - - - - - - - - - - - - - - -
Total Pertamina + JOB + TAC 516,462,446 33,404,107 82,243,111 70,289,837 67,436,025 11,610,110 7,971,841 111,132,901 63,398,626 15,693,071 53,282,817 89.68
23Directorate General of Oil And GasMinistry of Energy and Mineral Resources
STATISTICSO i l a n d G a s
2016
HULU | UPSTREAM
MSCF
PERUSAHAANCompany
PRODUKSI BERSIH
Net Production
PEMANFAATAN I Utilization TOTAL
DIBAKAR Total Losses
% PENG
GUNAAN GAS
% Gas Utilization
PENGGUNAAN SENDIRI Own Use
KELISTRIKANElectricity
GAS KOTACity Gas
PUPUK Fertilizer
PETRO KIMIA Petro
Chemical
KILANG MINYAK Oil Refinery
LPG/LEX PABRIK LPG/Lex
Plant
KONDENSASICondensation
TRANSPORTASI GAS / BBG Gas/BBG
Transportation
LNG (FEED)
LNG LOKAL
LNG Domestic
PIPA GASPipeline Gas PT PGN
PT KRAKATAU
STEEL
INDUSTRI LAINOther
Industries
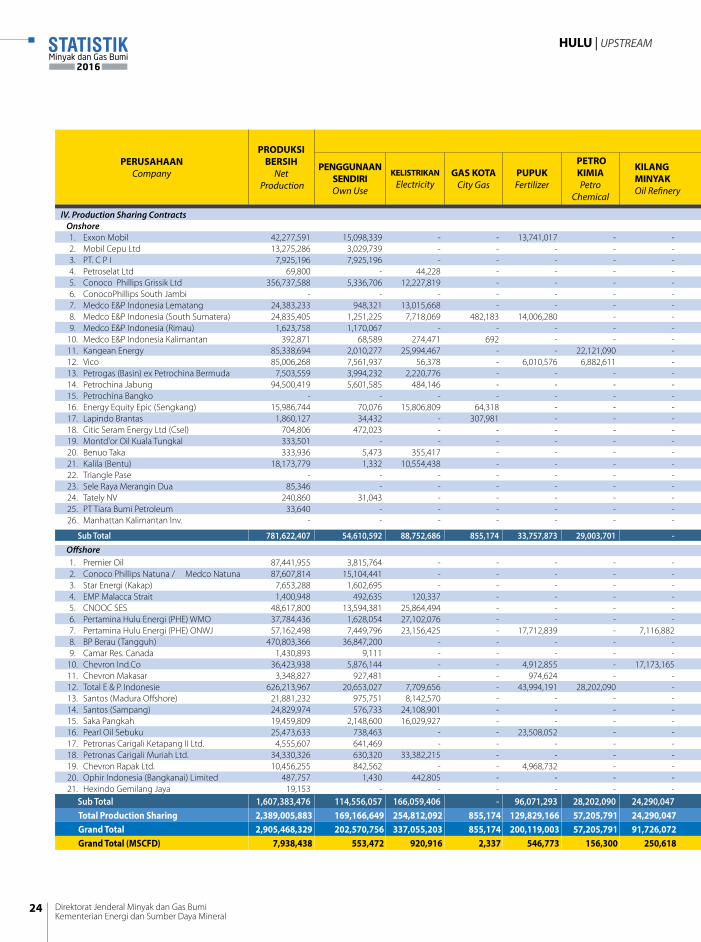
IV. Production Sharing ContractsOnshore1. Exxon Mobil 42,277,591 15,098,339 - - 13,741,017 - - - - - - - - - - 562,960 12,875,275 69.55 2. Mobil Cepu Ltd 13,275,286 3,029,739 - - - - - - - - - - - - - - 10,245,547 22.82 3. PT. C P I 7,925,196 7,925,196 - - - - - - - - - - - - - - - 100.00 4. Petroselat Ltd 69,800 - 44,228 - - - - - - - - - - - - - 25,572 63.36 5. Conoco Phillips Grissik Ltd 356,737,588 5,336,706 12,227,819 - - - - - - - - - 79,047,364 140,395,499 - 61,076,483 58,653,717 83.56 6. ConocoPhillips South Jambi - - - - - - - - - - - - - - - - - - 7. Medco E&P Indonesia Lematang 24,383,233 948,321 13,015,668 - - - - - - - - - - - - - 10,419,244 57.27 8. Medco E&P Indonesia (South Sumatera) 24,835,405 1,251,225 7,718,069 482,183 14,006,280 - - - - - - - - - - 685,780 691,868 97.21 9. Medco E&P Indonesia (Rimau) 1,623,758 1,170,067 - - - - - - - - - - - - - - 453,691 72.06
10. Medco E&P Indonesia Kalimantan 392,871 68,589 274,471 692 - - - - - - - - - 33,133 - - 15,986 95.93 11. Kangean Energy 85,338,694 2,010,277 25,994,467 - - 22,121,090 - - - - - - - - - 34,159,205 1,053,655 98.77 12. Vico 85,006,268 7,561,937 56,378 - 6,010,576 6,882,611 - - - - 60,742,454 - - - - 3,559,507 192,805 99.77 13. Petrogas (Basin) ex Petrochina Bermuda 7,503,559 3,994,232 2,220,776 - - - - 158,089 347,177 - - - - 3,504 - - 779,781 89.61 14. Petrochina Jabung 94,500,419 5,601,585 484,146 - - - - 9,043,407 3,496,024 - - - 43,249,014 - - - 32,626,243 65.48 15. Petrochina Bangko - - - - - - - - - - - - - - - - - - 16. Energy Equity Epic (Sengkang) 15,986,744 70,076 15,806,809 64,318 - - - - - - - - - - - - 45,541 99.72 17. Lapindo Brantas 1,860,127 34,432 - 307,981 - - - - - - - - - 1,103,944 - 413,770 - 100.00 18. Citic Seram Energy Ltd (Csel) 704,806 472,023 - - - - - - - - - - - - - - 232,783 66.97 19. Montd'or Oil Kuala Tungkal 333,501 - - - - - - - - - - - - - - - 333,501 - 20. Benuo Taka 333,936 5,473 355,417 - - - - - - - - - - - - - (26,954) 108.07 21. Kalila (Bentu) 18,173,779 1,332 10,554,438 - - - - - - - - - - - - 7,605,878 12,131 99.93 22. Triangle Pase - - - - - - - - - - - - - - - - - - 23. Sele Raya Merangin Dua 85,346 - - - - - - - - - - - - - - - 85,346 - 24. Tately NV 240,860 31,043 - - - - - - - - - - - - - - 209,817 12.89 25. PT Tiara Bumi Petroleum 33,640 - - - - - - - - - - - - - - - 33,640 - 26. Manhattan Kalimantan Inv. - - - - - - - - - - - - - - - - - -
Sub Total 781,622,407 54,610,592 88,752,686 855,174 33,757,873 29,003,701 - 9,201,496 3,843,201 - 60,742,454 - 122,296,378 141,536,080 - 108,063,583 128,959,189 83.50 Offshore 1. Premier Oil 87,441,955 3,815,764 - - - - - - - - - - 83,280,500 - - - 345,691 99.60 2. Conoco Phillips Natuna / Medco Natuna 87,607,814 15,104,441 - - - - - 2,875,013 - - - - 71,967,494 - - - (2,339,134) 102.67 3. Star Energi (Kakap) 7,653,288 1,602,695 - - - - - - - - - - 5,196,409 - - - 854,184 88.84 4. EMP Malacca Strait 1,400,948 492,635 120,337 - - - - - - - - - - - - 554,633 233,343 83.34 5. CNOOC SES 48,617,800 13,594,381 25,864,494 - - - - - - - - - - - - - 9,158,925 81.16 6. Pertamina Hulu Energi (PHE) WMO 37,784,436 1,628,054 27,102,076 - - - - - - - - - - 8,474,909 - 170,687 408,710 98.92 7. Pertamina Hulu Energi (PHE) ONWJ 57,162,498 7,449,796 23,156,425 - 17,712,839 - 7,116,882 - 269,076 - - - - - - 50,531 1,406,949 97.54 8. BP Berau (Tangguh) 470,803,366 36,847,200 - - - - - - 1,155,378 - 296,870,971 80,114,886 - - - - 55,814,931 88.14 9. Camar Res. Canada 1,430,893 9,111 - - - - - - - - - - - - - - 1,421,782 0.64
10. Chevron Ind.Co 36,423,938 5,876,144 - - 4,912,855 - 17,173,165 193,402 118,558 - 6,653,942 - - - - - 1,495,872 95.89 11. Chevron Makasar 3,348,827 927,481 - - 974,624 - - 8,602 14,433 - 1,173,499 - - - - - 250,188 92.53 12. Total E & P Indonesie 626,213,967 20,653,027 7,709,656 - 43,994,191 28,202,090 - - - - 432,235,993 71,214,056 - - - 15,105,197 7,099,757 98.87 13. Santos (Madura Offshore) 21,881,232 975,751 8,142,570 - - - - - - - - - - 12,727,616 - - 35,295 99.84 14. Santos (Sampang) 24,829,974 576,733 24,108,901 - - - - - - - - - - - - - 144,340 99.42 15. Saka Pangkah 19,459,809 2,148,600 16,029,927 - - - - 916,659 - - - - - - - - 364,623 98.13 16. Pearl Oil Sebuku 25,473,633 738,463 - - 23,508,052 - - - - - - - - - - - 1,227,118 95.18 17. Petronas Carigali Ketapang II Ltd. 4,555,607 641,469 - - - - - - - - - - - - - 1,797,401 2,116,737 53.54 18. Petronas Carigali Muriah Ltd. 34,330,326 630,320 33,382,215 - - - - - - - - - - - - - 317,791 99.07 19. Chevron Rapak Ltd. 10,456,255 842,562 - - 4,968,732 - - - 39,813 - 4,493,332 - - - - - 111,816 98.93 20. Ophir Indonesia (Bangkanai) Limited 487,757 1,430 442,805 - - - - - - - - - - - - - 43,522 91.08 21. Hexindo Gemilang Jaya 19,153 - - - - - - - - - - - - - - - 19,153 -
Sub Total 1,607,383,476 114,556,057 166,059,406 - 96,071,293 28,202,090 24,290,047 3,993,676 1,597,258 - 741,427,737 151,328,942 160,444,403 21,202,525 - 17,678,449 80,531,593 94.99 Total Production Sharing 2,389,005,883 169,166,649 254,812,092 855,174 129,829,166 57,205,791 24,290,047 13,195,172 5,440,459 802,170,191 151,328,942 282,740,781 162,738,605 125,742,032 209,490,782 91.23 Grand Total 2,905,468,329 202,570,756 337,055,203 855,174 200,119,003 57,205,791 91,726,072 24,805,282 13,412,300 913,303,092 151,328,942 282,740,781 226,137,231 141,435,103 262,773,599 90.96 Grand Total (MSCFD) 7,938,438 553,472 920,916 2,337 546,773 156,300 250,618 67,774 36,646 2,495,364 413,467 772,516 617,861 386,435 717,961 90.96
Direktorat Jenderal Minyak dan Gas BumiKementerian Energi dan Sumber Daya Mineral
24
STATISTIKMinyak dan Gas Bumi
2016
HULU | UPSTREAM

MSCF
PERUSAHAANCompany
PRODUKSI BERSIH
Net Production
PEMANFAATAN I Utilization TOTAL
DIBAKAR Total Losses
% PENG
GUNAAN GAS
% Gas Utilization
PENGGUNAAN SENDIRI Own Use
KELISTRIKANElectricity
GAS KOTACity Gas
PUPUK Fertilizer
PETRO KIMIA Petro
Chemical
KILANG MINYAK Oil Refinery
LPG/LEX PABRIK LPG/Lex
Plant
KONDENSASICondensation
TRANSPORTASI GAS / BBG Gas/BBG
Transportation
LNG (FEED)
LNG LOKAL
LNG Domestic
PIPA GASPipeline Gas PT PGN
PT KRAKATAU
STEEL
INDUSTRI LAINOther
Industries
IV. Production Sharing ContractsOnshore1. Exxon Mobil 42,277,591 15,098,339 - - 13,741,017 - - - - - - - - - - 562,960 12,875,275 69.55 2. Mobil Cepu Ltd 13,275,286 3,029,739 - - - - - - - - - - - - - - 10,245,547 22.82 3. PT. C P I 7,925,196 7,925,196 - - - - - - - - - - - - - - - 100.00 4. Petroselat Ltd 69,800 - 44,228 - - - - - - - - - - - - - 25,572 63.36 5. Conoco Phillips Grissik Ltd 356,737,588 5,336,706 12,227,819 - - - - - - - - - 79,047,364 140,395,499 - 61,076,483 58,653,717 83.56 6. ConocoPhillips South Jambi - - - - - - - - - - - - - - - - - - 7. Medco E&P Indonesia Lematang 24,383,233 948,321 13,015,668 - - - - - - - - - - - - - 10,419,244 57.27 8. Medco E&P Indonesia (South Sumatera) 24,835,405 1,251,225 7,718,069 482,183 14,006,280 - - - - - - - - - - 685,780 691,868 97.21 9. Medco E&P Indonesia (Rimau) 1,623,758 1,170,067 - - - - - - - - - - - - - - 453,691 72.06
10. Medco E&P Indonesia Kalimantan 392,871 68,589 274,471 692 - - - - - - - - - 33,133 - - 15,986 95.93 11. Kangean Energy 85,338,694 2,010,277 25,994,467 - - 22,121,090 - - - - - - - - - 34,159,205 1,053,655 98.77 12. Vico 85,006,268 7,561,937 56,378 - 6,010,576 6,882,611 - - - - 60,742,454 - - - - 3,559,507 192,805 99.77 13. Petrogas (Basin) ex Petrochina Bermuda 7,503,559 3,994,232 2,220,776 - - - - 158,089 347,177 - - - - 3,504 - - 779,781 89.61 14. Petrochina Jabung 94,500,419 5,601,585 484,146 - - - - 9,043,407 3,496,024 - - - 43,249,014 - - - 32,626,243 65.48 15. Petrochina Bangko - - - - - - - - - - - - - - - - - - 16. Energy Equity Epic (Sengkang) 15,986,744 70,076 15,806,809 64,318 - - - - - - - - - - - - 45,541 99.72 17. Lapindo Brantas 1,860,127 34,432 - 307,981 - - - - - - - - - 1,103,944 - 413,770 - 100.00 18. Citic Seram Energy Ltd (Csel) 704,806 472,023 - - - - - - - - - - - - - - 232,783 66.97 19. Montd'or Oil Kuala Tungkal 333,501 - - - - - - - - - - - - - - - 333,501 - 20. Benuo Taka 333,936 5,473 355,417 - - - - - - - - - - - - - (26,954) 108.07 21. Kalila (Bentu) 18,173,779 1,332 10,554,438 - - - - - - - - - - - - 7,605,878 12,131 99.93 22. Triangle Pase - - - - - - - - - - - - - - - - - - 23. Sele Raya Merangin Dua 85,346 - - - - - - - - - - - - - - - 85,346 - 24. Tately NV 240,860 31,043 - - - - - - - - - - - - - - 209,817 12.89 25. PT Tiara Bumi Petroleum 33,640 - - - - - - - - - - - - - - - 33,640 - 26. Manhattan Kalimantan Inv. - - - - - - - - - - - - - - - - - -
Sub Total 781,622,407 54,610,592 88,752,686 855,174 33,757,873 29,003,701 - 9,201,496 3,843,201 - 60,742,454 - 122,296,378 141,536,080 - 108,063,583 128,959,189 83.50 Offshore 1. Premier Oil 87,441,955 3,815,764 - - - - - - - - - - 83,280,500 - - - 345,691 99.60 2. Conoco Phillips Natuna / Medco Natuna 87,607,814 15,104,441 - - - - - 2,875,013 - - - - 71,967,494 - - - (2,339,134) 102.67 3. Star Energi (Kakap) 7,653,288 1,602,695 - - - - - - - - - - 5,196,409 - - - 854,184 88.84 4. EMP Malacca Strait 1,400,948 492,635 120,337 - - - - - - - - - - - - 554,633 233,343 83.34 5. CNOOC SES 48,617,800 13,594,381 25,864,494 - - - - - - - - - - - - - 9,158,925 81.16 6. Pertamina Hulu Energi (PHE) WMO 37,784,436 1,628,054 27,102,076 - - - - - - - - - - 8,474,909 - 170,687 408,710 98.92 7. Pertamina Hulu Energi (PHE) ONWJ 57,162,498 7,449,796 23,156,425 - 17,712,839 - 7,116,882 - 269,076 - - - - - - 50,531 1,406,949 97.54 8. BP Berau (Tangguh) 470,803,366 36,847,200 - - - - - - 1,155,378 - 296,870,971 80,114,886 - - - - 55,814,931 88.14 9. Camar Res. Canada 1,430,893 9,111 - - - - - - - - - - - - - - 1,421,782 0.64
10. Chevron Ind.Co 36,423,938 5,876,144 - - 4,912,855 - 17,173,165 193,402 118,558 - 6,653,942 - - - - - 1,495,872 95.89 11. Chevron Makasar 3,348,827 927,481 - - 974,624 - - 8,602 14,433 - 1,173,499 - - - - - 250,188 92.53 12. Total E & P Indonesie 626,213,967 20,653,027 7,709,656 - 43,994,191 28,202,090 - - - - 432,235,993 71,214,056 - - - 15,105,197 7,099,757 98.87 13. Santos (Madura Offshore) 21,881,232 975,751 8,142,570 - - - - - - - - - - 12,727,616 - - 35,295 99.84 14. Santos (Sampang) 24,829,974 576,733 24,108,901 - - - - - - - - - - - - - 144,340 99.42 15. Saka Pangkah 19,459,809 2,148,600 16,029,927 - - - - 916,659 - - - - - - - - 364,623 98.13 16. Pearl Oil Sebuku 25,473,633 738,463 - - 23,508,052 - - - - - - - - - - - 1,227,118 95.18 17. Petronas Carigali Ketapang II Ltd. 4,555,607 641,469 - - - - - - - - - - - - - 1,797,401 2,116,737 53.54 18. Petronas Carigali Muriah Ltd. 34,330,326 630,320 33,382,215 - - - - - - - - - - - - - 317,791 99.07 19. Chevron Rapak Ltd. 10,456,255 842,562 - - 4,968,732 - - - 39,813 - 4,493,332 - - - - - 111,816 98.93 20. Ophir Indonesia (Bangkanai) Limited 487,757 1,430 442,805 - - - - - - - - - - - - - 43,522 91.08 21. Hexindo Gemilang Jaya 19,153 - - - - - - - - - - - - - - - 19,153 -
Sub Total 1,607,383,476 114,556,057 166,059,406 - 96,071,293 28,202,090 24,290,047 3,993,676 1,597,258 - 741,427,737 151,328,942 160,444,403 21,202,525 - 17,678,449 80,531,593 94.99 Total Production Sharing 2,389,005,883 169,166,649 254,812,092 855,174 129,829,166 57,205,791 24,290,047 13,195,172 5,440,459 802,170,191 151,328,942 282,740,781 162,738,605 125,742,032 209,490,782 91.23 Grand Total 2,905,468,329 202,570,756 337,055,203 855,174 200,119,003 57,205,791 91,726,072 24,805,282 13,412,300 913,303,092 151,328,942 282,740,781 226,137,231 141,435,103 262,773,599 90.96 Grand Total (MSCFD) 7,938,438 553,472 920,916 2,337 546,773 156,300 250,618 67,774 36,646 2,495,364 413,467 772,516 617,861 386,435 717,961 90.96
25Directorate General of Oil And GasMinistry of Energy and Mineral Resources
STATISTICSO i l a n d G a s
2016
HULU | UPSTREAM
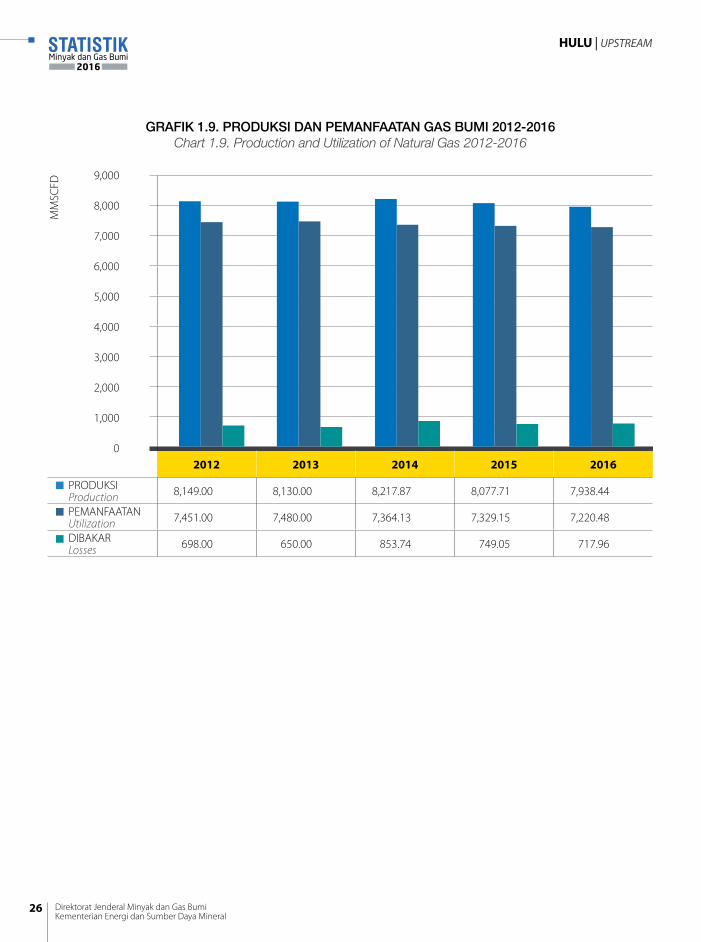
GRAFIK 1.9. PRODUKSI DAN PEMANFAATAN GAS BUMI 2012-2016Chart 1.9. Production and Utilization of Natural Gas 2012-2016
2012 2013 2014 2015 2016
PRODUKSIProduction 8,149.00 8,130.00 8,217.87 8,077.71 7,938.44
PEMANFAATANUtilization 7,451.00 7,480.00 7,364.13 7,329.15 7,220.48
DIBAKARLosses 698.00 650.00 853.74 749.05 717.96
9,000
8,000
7,000
6,000
5,000
4,000
3,000
2,000
1,000
0
MM
SCFD
Direktorat Jenderal Minyak dan Gas BumiKementerian Energi dan Sumber Daya Mineral
26
STATISTIKMinyak dan Gas Bumi
2016
HULU | UPSTREAM
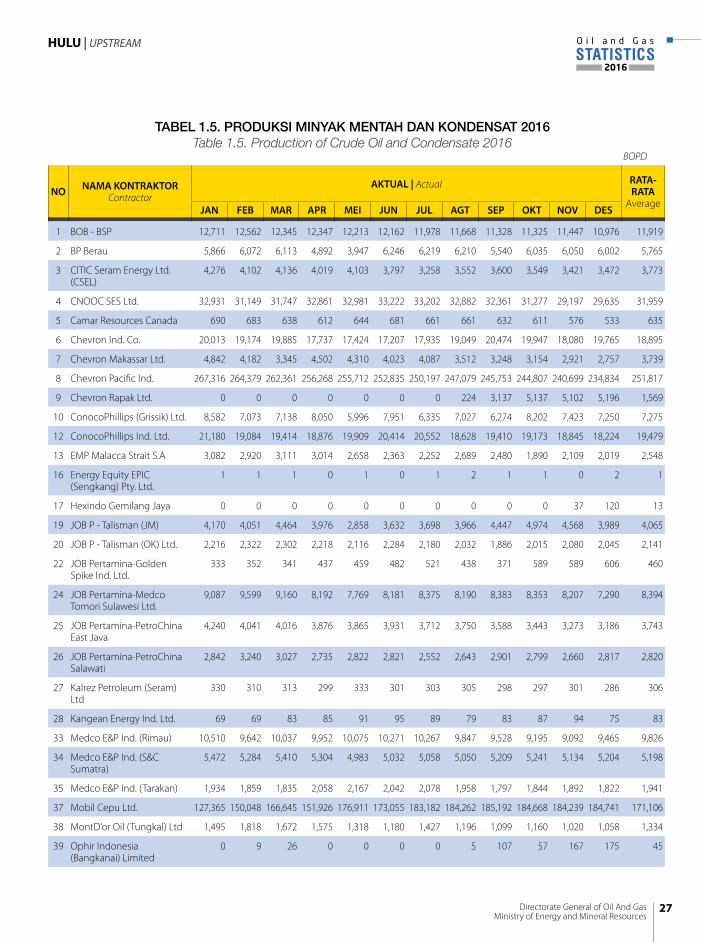
TABEL 1.5. PRODUKSI MINYAK MENTAH DAN KONDENSAT 2016Table 1.5. Production of Crude Oil and Condensate 2016
BOPD
NO NAMA KONTRAKTORContractor
AKTUAL | Actual RATA-RATA
AverageJAN FEB MAR APR MEI JUN JUL AGT SEP OKT NOV DES
1 BOB - BSP 12,711 12,562 12,345 12,347 12,213 12,162 11,978 11,668 11,328 11,325 11,447 10,976 11,919
2 BP Berau 5,866 6,072 6,113 4,892 3,947 6,246 6,219 6,210 5,540 6,035 6,050 6,002 5,765
3 CITIC Seram Energy Ltd. (CSEL)
4,276 4,102 4,136 4,019 4,103 3,797 3,258 3,552 3,600 3,549 3,421 3,472 3,773
4 CNOOC SES Ltd. 32,931 31,149 31,747 32,861 32,981 33,222 33,202 32,882 32,361 31,277 29,197 29,635 31,959
5 Camar Resources Canada 690 683 638 612 644 681 661 661 632 611 576 533 635
6 Chevron Ind. Co. 20,013 19,174 19,885 17,737 17,424 17,207 17,935 19,049 20,474 19,947 18,080 19,765 18,895
7 Chevron Makassar Ltd. 4,842 4,182 3,345 4,502 4,310 4,023 4,087 3,512 3,248 3,154 2,921 2,757 3,739
8 Chevron Pacific Ind. 267,316 264,379 262,361 256,268 255,712 252,835 250,197 247,079 245,753 244,807 240,699 234,834 251,817
9 Chevron Rapak Ltd. 0 0 0 0 0 0 0 224 3,137 5,137 5,102 5,196 1,569
10 ConocoPhillips (Grissik) Ltd. 8,582 7,073 7,138 8,050 5,996 7,951 6,335 7,027 6,274 8,202 7,423 7,250 7,275
12 ConocoPhillips Ind. Ltd. 21,180 19,084 19,414 18,876 19,909 20,414 20,552 18,628 19,410 19,173 18,845 18,224 19,479
13 EMP Malacca Strait S.A 3,082 2,920 3,111 3,014 2,658 2,363 2,252 2,689 2,480 1,890 2,109 2,019 2,548
16 Energy Equity EPIC (Sengkang) Pty. Ltd.
1 1 1 0 1 0 1 2 1 1 0 2 1
17 Hexindo Gemilang Jaya 0 0 0 0 0 0 0 0 0 0 37 120 13
19 JOB P - Talisman (JM) 4,170 4,051 4,464 3,976 2,858 3,632 3,698 3,966 4,447 4,974 4,568 3,989 4,065
20 JOB P - Talisman (OK) Ltd. 2,216 2,322 2,302 2,218 2,116 2,284 2,180 2,032 1,886 2,015 2,080 2,045 2,141
22 JOB Pertamina-Golden Spike Ind. Ltd.
333 352 341 437 459 482 521 438 371 589 589 606 460
24 JOB Pertamina-Medco Tomori Sulawesi Ltd.
9,087 9,599 9,160 8,192 7,769 8,181 8,375 8,190 8,383 8,353 8,207 7,290 8,394
25 JOB Pertamina-PetroChina East Java
4,240 4,041 4,016 3,876 3,865 3,931 3,712 3,750 3,588 3,443 3,273 3,186 3,743
26 JOB Pertamina-PetroChina Salawati
2,842 3,240 3,027 2,735 2,822 2,821 2,552 2,643 2,901 2,799 2,660 2,817 2,820
27 Kalrez Petroleum (Seram) Ltd
330 310 313 299 333 301 303 305 298 297 301 286 306
28 Kangean Energy Ind. Ltd. 69 69 83 85 91 95 89 79 83 87 94 75 83
33 Medco E&P Ind. (Rimau) 10,510 9,642 10,037 9,952 10,075 10,271 10,267 9,847 9,528 9,195 9,092 9,465 9,826
34 Medco E&P Ind. (S&C Sumatra)
5,472 5,284 5,410 5,304 4,983 5,032 5,058 5,050 5,209 5,241 5,134 5,204 5,198
35 Medco E&P Ind. (Tarakan) 1,934 1,859 1,835 2,058 2,167 2,042 2,078 1,958 1,797 1,844 1,892 1,822 1,941
37 Mobil Cepu Ltd. 127,365 150,048 166,645 151,926 176,911 173,055 183,182 184,262 185,192 184,668 184,239 184,741 171,106
38 MontD’or Oil (Tungkal) Ltd 1,495 1,818 1,672 1,575 1,318 1,180 1,427 1,196 1,099 1,160 1,020 1,058 1,334
39 Ophir Indonesia (Bangkanai) Limited
0 9 26 0 0 0 0 5 107 57 167 175 45
27Directorate General of Oil And GasMinistry of Energy and Mineral Resources
STATISTICSO i l a n d G a s
2016
HULU | UPSTREAM
BOPD
NO NAMA KONTRAKTORContractor
AKTUAL | Actual RATA-RATA
AverageJAN FEB MAR APR MEI JUN JUL AGT SEP OKT NOV DES
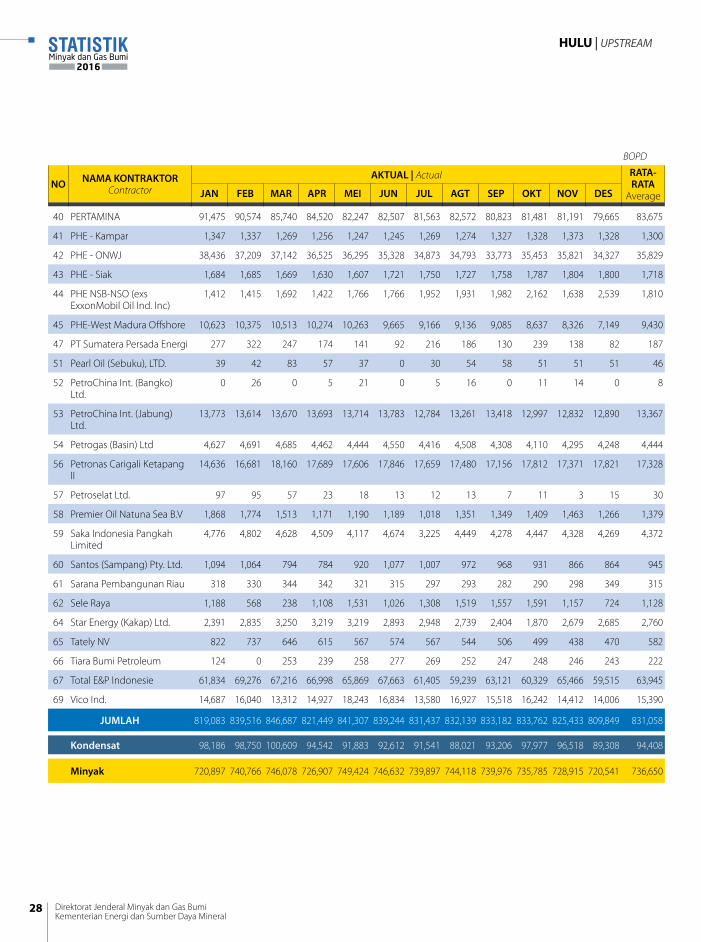
40 PERTAMINA 91,475 90,574 85,740 84,520 82,247 82,507 81,563 82,572 80,823 81,481 81,191 79,665 83,675
41 PHE - Kampar 1,347 1,337 1,269 1,256 1,247 1,245 1,269 1,274 1,327 1,328 1,373 1,328 1,300
42 PHE - ONWJ 38,436 37,209 37,142 36,525 36,295 35,328 34,873 34,793 33,773 35,453 35,821 34,327 35,829
43 PHE - Siak 1,684 1,685 1,669 1,630 1,607 1,721 1,750 1,727 1,758 1,787 1,804 1,800 1,718
44 PHE NSB-NSO (exs ExxonMobil Oil Ind. Inc)
1,412 1,415 1,692 1,422 1,766 1,766 1,952 1,931 1,982 2,162 1,638 2,539 1,810
45 PHE-West Madura Offshore 10,623 10,375 10,513 10,274 10,263 9,665 9,166 9,136 9,085 8,637 8,326 7,149 9,430
47 PT Sumatera Persada Energi 277 322 247 174 141 92 216 186 130 239 138 82 187
51 Pearl Oil (Sebuku), LTD. 39 42 83 57 37 0 30 54 58 51 51 51 46
52 PetroChina Int. (Bangko) Ltd.
0 26 0 5 21 0 5 16 0 11 14 0 8
53 PetroChina Int. (Jabung) Ltd.
13,773 13,614 13,670 13,693 13,714 13,783 12,784 13,261 13,418 12,997 12,832 12,890 13,367
54 Petrogas (Basin) Ltd 4,627 4,691 4,685 4,462 4,444 4,550 4,416 4,508 4,308 4,110 4,295 4,248 4,444
56 Petronas Carigali Ketapang II
14,636 16,681 18,160 17,689 17,606 17,846 17,659 17,480 17,156 17,812 17,371 17,821 17,328
57 Petroselat Ltd. 97 95 57 23 18 13 12 13 7 11 3 15 30
58 Premier Oil Natuna Sea B.V 1,868 1,774 1,513 1,171 1,190 1,189 1,018 1,351 1,349 1,409 1,463 1,266 1,379
59 Saka Indonesia Pangkah Limited
4,776 4,802 4,628 4,509 4,117 4,674 3,225 4,449 4,278 4,447 4,328 4,269 4,372
60 Santos (Sampang) Pty. Ltd. 1,094 1,064 794 784 920 1,077 1,007 972 968 931 866 864 945
61 Sarana Pembangunan Riau 318 330 344 342 321 315 297 293 282 290 298 349 315
62 Sele Raya 1,188 568 238 1,108 1,531 1,026 1,308 1,519 1,557 1,591 1,157 724 1,128
64 Star Energy (Kakap) Ltd. 2,391 2,835 3,250 3,219 3,219 2,893 2,948 2,739 2,404 1,870 2,679 2,685 2,760
65 Tately NV 822 737 646 615 567 574 567 544 506 499 438 470 582
66 Tiara Bumi Petroleum 124 0 253 239 258 277 269 252 247 248 246 243 222
67 Total E&P Indonesie 61,834 69,276 67,216 66,998 65,869 67,663 61,405 59,239 63,121 60,329 65,466 59,515 63,945
69 Vico Ind. 14,687 16,040 13,312 14,927 18,243 16,834 13,580 16,927 15,518 16,242 14,412 14,006 15,390
JUMLAH 819,083 839,516 846,687 821,449 841,307 839,244 831,437 832,139 833,182 833,762 825,433 809,849 831,058
Kondensat 98,186 98,750 100,609 94,542 91,883 92,612 91,541 88,021 93,206 97,977 96,518 89,308 94,408
Minyak 720,897 740,766 746,078 726,907 749,424 746,632 739,897 744,118 739,976 735,785 728,915 720,541 736,650
Direktorat Jenderal Minyak dan Gas BumiKementerian Energi dan Sumber Daya Mineral
28
STATISTIKMinyak dan Gas Bumi
2016
HULU | UPSTREAM
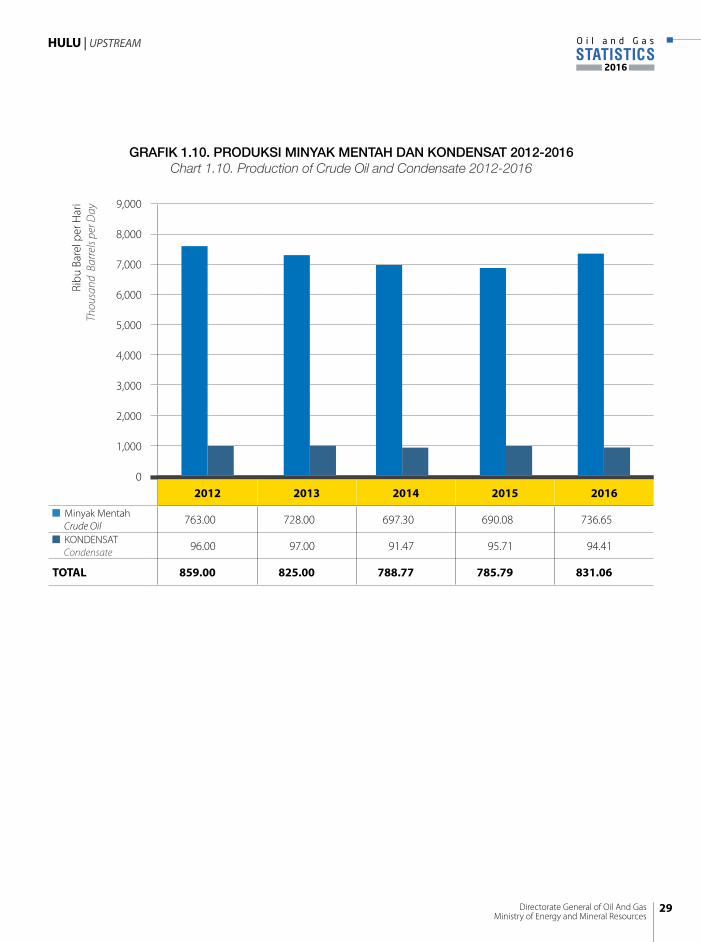
GRAFIK 1.10. PRODUKSI MINYAK MENTAH DAN KONDENSAT 2012-2016Chart 1.10. Production of Crude Oil and Condensate 2012-2016
2012 2013 2014 2015 2016
Minyak Mentah Crude Oil 763.00 728.00 697.30 690.08 736.65
KONDENSAT Condensate 96.00 97.00 91.47 95.71 94.41
TOTAL 859.00 825.00 788.77 785.79 831.06
9,000
8,000
7,000
6,000
5,000
4,000
3,000
2,000
1,000
0
Ribu
Bar
el p
er H
ari
Thou
sand
Bar
rels
per D
ay
29Directorate General of Oil And GasMinistry of Energy and Mineral Resources
STATISTICSO i l a n d G a s
2016
HULU | UPSTREAM
MBOEPD
LIFTING 2012 2013 2014 2015 2016
MINYAKOil
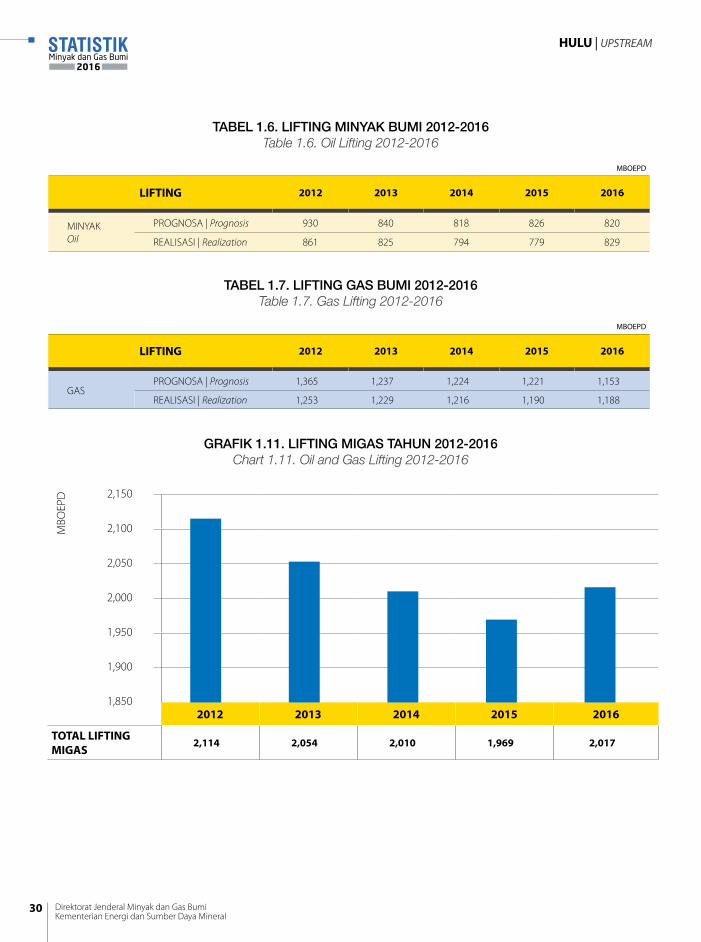
PROGNOSA | Prognosis 930 840 818 826 820
REALISASI | Realization 861 825 794 779 829
TABEL 1.6. LIFTING MINYAK BUMI 2012-2016Table 1.6. Oil Lifting 2012-2016
MBOEPD
LIFTING 2012 2013 2014 2015 2016
GASPROGNOSA | Prognosis 1,365 1,237 1,224 1,221 1,153
REALISASI | Realization 1,253 1,229 1,216 1,190 1,188
TABEL 1.7. LIFTING GAS BUMI 2012-2016Table 1.7. Gas Lifting 2012-2016
GRAFIK 1.11. LIFTING MIGAS TAHUN 2012-2016Chart 1.11. Oil and Gas Lifting 2012-2016
2012 2013 2014 2015 2016
TOTAL LIFTING MIGAS
2,114 2,054 2,010 1,969 2,017
2,150
2,100
2,050
2,000
1,950
1,900
1,850
MBO
EPD
Direktorat Jenderal Minyak dan Gas BumiKementerian Energi dan Sumber Daya Mineral
30
STATISTIKMinyak dan Gas Bumi
2016
HULU | UPSTREAM
31Directorate General of Oil And GasMinistry of Energy and Mineral Resources
STATISTICSO i l a n d G a s
2016
HULU | UPSTREAM
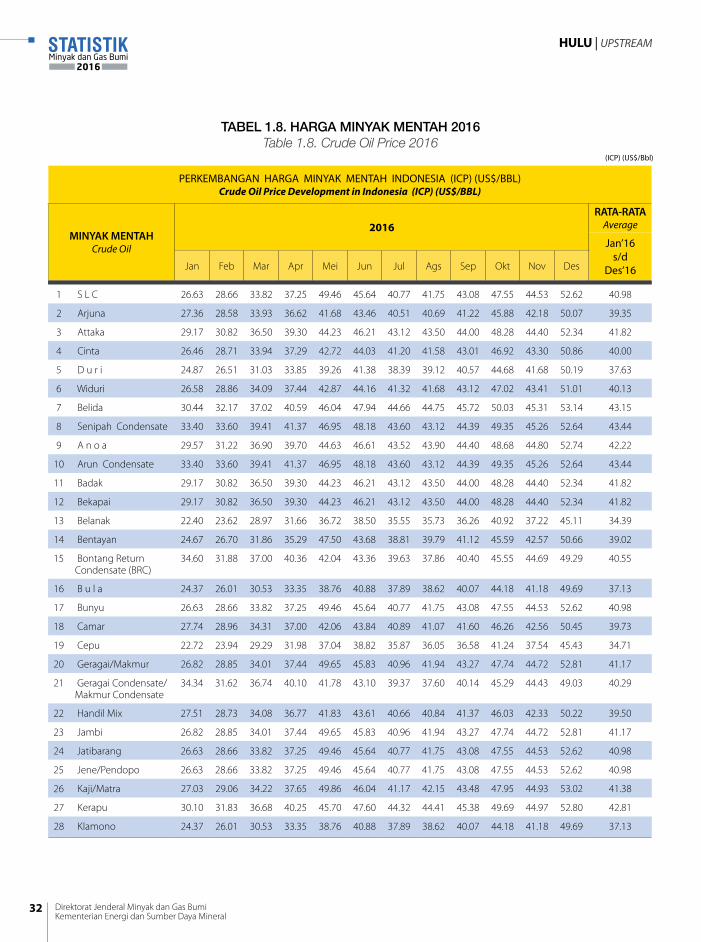
TABEL 1.8. HARGA MINYAK MENTAH 2016Table 1.8. Crude Oil Price 2016
PERKEMBANGAN HARGA MINYAK MENTAH INDONESIA (ICP) (US$/BBL)Crude Oil Price Development in Indonesia (ICP) (US$/BBL)
MINYAK MENTAHCrude Oil
2016RATA-RATA
Average
Jan’16s/d
Des’16Jan Feb Mar Apr Mei Jun Jul Ags Sep Okt Nov Des
1 S L C 26.63 28.66 33.82 37.25 49.46 45.64 40.77 41.75 43.08 47.55 44.53 52.62 40.98
2 Arjuna 27.36 28.58 33.93 36.62 41.68 43.46 40.51 40.69 41.22 45.88 42.18 50.07 39.35
3 Attaka 29.17 30.82 36.50 39.30 44.23 46.21 43.12 43.50 44.00 48.28 44.40 52.34 41.82
4 Cinta 26.46 28.71 33.94 37.29 42.72 44.03 41.20 41.58 43.01 46.92 43.30 50.86 40.00
5 D u r i 24.87 26.51 31.03 33.85 39.26 41.38 38.39 39.12 40.57 44.68 41.68 50.19 37.63
6 Widuri 26.58 28.86 34.09 37.44 42.87 44.16 41.32 41.68 43.12 47.02 43.41 51.01 40.13
7 Belida 30.44 32.17 37.02 40.59 46.04 47.94 44.66 44.75 45.72 50.03 45.31 53.14 43.15
8 Senipah Condensate 33.40 33.60 39.41 41.37 46.95 48.18 43.60 43.12 44.39 49.35 45.26 52.64 43.44
9 A n o a 29.57 31.22 36.90 39.70 44.63 46.61 43.52 43.90 44.40 48.68 44.80 52.74 42.22
10 Arun Condensate 33.40 33.60 39.41 41.37 46.95 48.18 43.60 43.12 44.39 49.35 45.26 52.64 43.44
11 Badak 29.17 30.82 36.50 39.30 44.23 46.21 43.12 43.50 44.00 48.28 44.40 52.34 41.82
12 Bekapai 29.17 30.82 36.50 39.30 44.23 46.21 43.12 43.50 44.00 48.28 44.40 52.34 41.82
13 Belanak 22.40 23.62 28.97 31.66 36.72 38.50 35.55 35.73 36.26 40.92 37.22 45.11 34.39
14 Bentayan 24.67 26.70 31.86 35.29 47.50 43.68 38.81 39.79 41.12 45.59 42.57 50.66 39.02
15 Bontang Return Condensate (BRC)
34.60 31.88 37.00 40.36 42.04 43.36 39.63 37.86 40.40 45.55 44.69 49.29 40.55
16 B u l a 24.37 26.01 30.53 33.35 38.76 40.88 37.89 38.62 40.07 44.18 41.18 49.69 37.13
17 Bunyu 26.63 28.66 33.82 37.25 49.46 45.64 40.77 41.75 43.08 47.55 44.53 52.62 40.98
18 Camar 27.74 28.96 34.31 37.00 42.06 43.84 40.89 41.07 41.60 46.26 42.56 50.45 39.73
19 Cepu 22.72 23.94 29.29 31.98 37.04 38.82 35.87 36.05 36.58 41.24 37.54 45.43 34.71
20 Geragai/Makmur 26.82 28.85 34.01 37.44 49.65 45.83 40.96 41.94 43.27 47.74 44.72 52.81 41.17
21 Geragai Condensate/Makmur Condensate
34.34 31.62 36.74 40.10 41.78 43.10 39.37 37.60 40.14 45.29 44.43 49.03 40.29
22 Handil Mix 27.51 28.73 34.08 36.77 41.83 43.61 40.66 40.84 41.37 46.03 42.33 50.22 39.50
23 Jambi 26.82 28.85 34.01 37.44 49.65 45.83 40.96 41.94 43.27 47.74 44.72 52.81 41.17
24 Jatibarang 26.63 28.66 33.82 37.25 49.46 45.64 40.77 41.75 43.08 47.55 44.53 52.62 40.98
25 Jene/Pendopo 26.63 28.66 33.82 37.25 49.46 45.64 40.77 41.75 43.08 47.55 44.53 52.62 40.98
26 Kaji/Matra 27.03 29.06 34.22 37.65 49.86 46.04 41.17 42.15 43.48 47.95 44.93 53.02 41.38
27 Kerapu 30.10 31.83 36.68 40.25 45.70 47.60 44.32 44.41 45.38 49.69 44.97 52.80 42.81
28 Klamono 24.37 26.01 30.53 33.35 38.76 40.88 37.89 38.62 40.07 44.18 41.18 49.69 37.13
(ICP) (US$/Bbl)
Direktorat Jenderal Minyak dan Gas BumiKementerian Energi dan Sumber Daya Mineral
32
STATISTIKMinyak dan Gas Bumi
2016
HULU | UPSTREAM
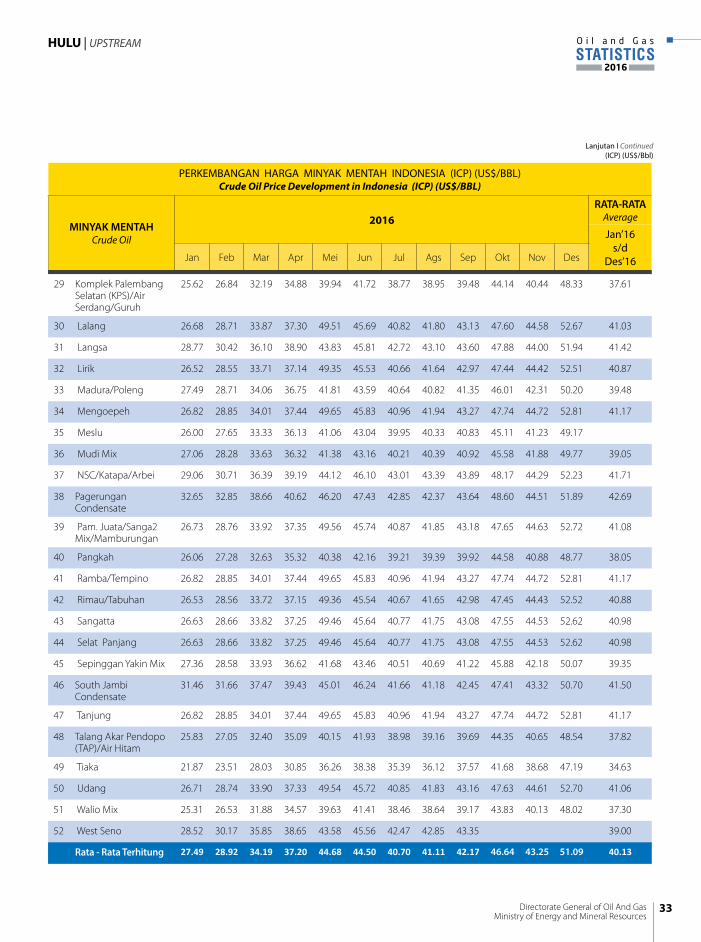
Lanjutan I Continued(ICP) (US$/Bbl)
PERKEMBANGAN HARGA MINYAK MENTAH INDONESIA (ICP) (US$/BBL)Crude Oil Price Development in Indonesia (ICP) (US$/BBL)
MINYAK MENTAHCrude Oil
2016RATA-RATA
Average
Jan’16s/d
Des’16Jan Feb Mar Apr Mei Jun Jul Ags Sep Okt Nov Des
29 Komplek Palembang Selatan (KPS)/Air Serdang/Guruh
25.62 26.84 32.19 34.88 39.94 41.72 38.77 38.95 39.48 44.14 40.44 48.33 37.61
30 Lalang 26.68 28.71 33.87 37.30 49.51 45.69 40.82 41.80 43.13 47.60 44.58 52.67 41.03
31 Langsa 28.77 30.42 36.10 38.90 43.83 45.81 42.72 43.10 43.60 47.88 44.00 51.94 41.42
32 Lirik 26.52 28.55 33.71 37.14 49.35 45.53 40.66 41.64 42.97 47.44 44.42 52.51 40.87
33 Madura/Poleng 27.49 28.71 34.06 36.75 41.81 43.59 40.64 40.82 41.35 46.01 42.31 50.20 39.48
34 Mengoepeh 26.82 28.85 34.01 37.44 49.65 45.83 40.96 41.94 43.27 47.74 44.72 52.81 41.17
35 Meslu 26.00 27.65 33.33 36.13 41.06 43.04 39.95 40.33 40.83 45.11 41.23 49.17 38.65
36 Mudi Mix 27.06 28.28 33.63 36.32 41.38 43.16 40.21 40.39 40.92 45.58 41.88 49.77 39.05
37 NSC/Katapa/Arbei 29.06 30.71 36.39 39.19 44.12 46.10 43.01 43.39 43.89 48.17 44.29 52.23 41.71
38 Pagerungan Condensate
32.65 32.85 38.66 40.62 46.20 47.43 42.85 42.37 43.64 48.60 44.51 51.89 42.69
39 Pam. Juata/Sanga2 Mix/Mamburungan
26.73 28.76 33.92 37.35 49.56 45.74 40.87 41.85 43.18 47.65 44.63 52.72 41.08
40 Pangkah 26.06 27.28 32.63 35.32 40.38 42.16 39.21 39.39 39.92 44.58 40.88 48.77 38.05
41 Ramba/Tempino 26.82 28.85 34.01 37.44 49.65 45.83 40.96 41.94 43.27 47.74 44.72 52.81 41.17
42 Rimau/Tabuhan 26.53 28.56 33.72 37.15 49.36 45.54 40.67 41.65 42.98 47.45 44.43 52.52 40.88
43 Sangatta 26.63 28.66 33.82 37.25 49.46 45.64 40.77 41.75 43.08 47.55 44.53 52.62 40.98
44 Selat Panjang 26.63 28.66 33.82 37.25 49.46 45.64 40.77 41.75 43.08 47.55 44.53 52.62 40.98
45 Sepinggan Yakin Mix 27.36 28.58 33.93 36.62 41.68 43.46 40.51 40.69 41.22 45.88 42.18 50.07 39.35
46 South Jambi Condensate
31.46 31.66 37.47 39.43 45.01 46.24 41.66 41.18 42.45 47.41 43.32 50.70 41.50
47 Tanjung 26.82 28.85 34.01 37.44 49.65 45.83 40.96 41.94 43.27 47.74 44.72 52.81 41.17
48 Talang Akar Pendopo (TAP)/Air Hitam
25.83 27.05 32.40 35.09 40.15 41.93 38.98 39.16 39.69 44.35 40.65 48.54 37.82
49 Tiaka 21.87 23.51 28.03 30.85 36.26 38.38 35.39 36.12 37.57 41.68 38.68 47.19 34.63
50 Udang 26.71 28.74 33.90 37.33 49.54 45.72 40.85 41.83 43.16 47.63 44.61 52.70 41.06
51 Walio Mix 25.31 26.53 31.88 34.57 39.63 41.41 38.46 38.64 39.17 43.83 40.13 48.02 37.30
52 West Seno 28.52 30.17 35.85 38.65 43.58 45.56 42.47 42.85 43.35 39.00
Rata - Rata Terhitung 27.49 28.92 34.19 37.20 44.68 44.50 40.70 41.11 42.17 46.64 43.25 51.09 40.13
Masih Kosong
33Directorate General of Oil And GasMinistry of Energy and Mineral Resources
STATISTICSO i l a n d G a s
2016
HULU | UPSTREAM
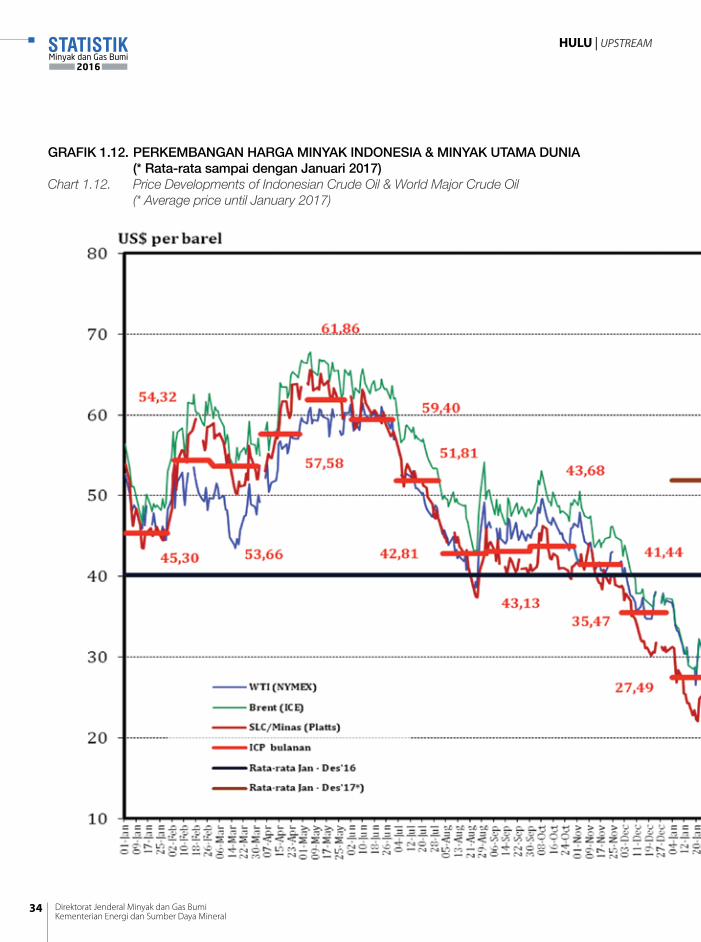
GRAFIK 1.12. PERKEMBANGAN HARGA MINYAK INDONESIA & MINYAK UTAMA DUNIA (* Rata-rata sampai dengan Januari 2017)
Chart 1.12. Price Developments of Indonesian Crude Oil & World Major Crude Oil (* Average price until January 2017)
Direktorat Jenderal Minyak dan Gas BumiKementerian Energi dan Sumber Daya Mineral
34
STATISTIKMinyak dan Gas Bumi
2016
HULU | UPSTREAM
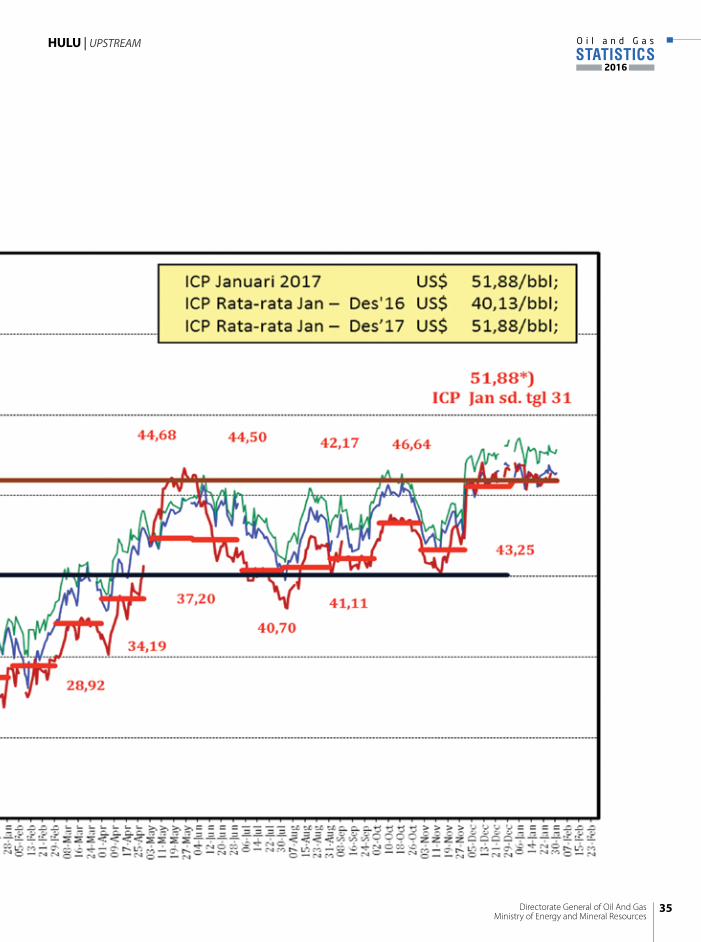
35Directorate General of Oil And GasMinistry of Energy and Mineral Resources
STATISTICSO i l a n d G a s
2016
HULU | UPSTREAM
HILIRDOWNSTREAM
STATISTIKMinyak dan Gas Bumi
2016
STATISTICSO i l a n d G a s
2016
Direktorat Jenderal Minyak dan Gas BumiKementerian Energi dan Sumber Daya Mineral
Directorate General of Oil And GasMinistry of Energy and Mineral Resources
1. Terdapat empat kategori kegiatan hilir migas, yaitu pengolahan migas, pengangkutan migas, penyimpanan migas, dan kegiatan niaga atau pemasaran.
2. Kegiatan pengolahan adalah kegiatan pada industri hilir migas yang bertujuan untuk meningkatkan kualitas dari minyak dan/atau gas alam dengan melakukan beberapa proses pengolahan seperti dengan melakukan pemurnian pada minyak mentah, yaitu dengan membuang komponen-komponen yang tidak diinginkan dari minyak dan/atau gas alam tersebut. Kegiatan pengolahan untuk minyak bumi dilakukan di kilang, yaitu tempat/instalasi industri yang terdiri dari berbagai jenis teknologi yang akan digunakan untuk mengolah minyak bumi menjadi produk yang lebih berguna dan dapat diperdagangkan. Di dalam kilang, minyak mentah akan melalui proses catalytic cracking dan distilasi fraksional. Proses cracking catalytic adalah proses untuk memecah secara katalis ikatan dari rangkaian karbon-karbon di dalam minyak bumi yang memiliki fasa gas, sedangkan distilasi fraksional adalah pemisahan fraksi-fraksi dari minyak mentah dengan cara dipanaskan pada temperatur tertentu. Hasil minyak bumi yang telah diolah dapat dikategorikan ke dalam kelompok Bahan Bakar Minyak (BBM) dan produk nonbahan bakar.
3. Kegiatan pengangkutan adalah kegiatan yang dilakukan untuk mentransportasikan minyak, gas alam, dan/atau hasil olahan dari minyak dan gas dari wilayah produksi, kilang, maupun dari tempat penyimpanan. Secara umum proses transportasi dilakukan dengan menggunakan dua metode, yaitu dengan metode transportasi seperti truk pengangkut minyak bumi dan kapal, maupun menggunakan pipa transportasi yang menghubungkan wilayah produksi atau kilang atau tempat penyimpanan ke tujuan tertentu untuk pendistribusian dari minyak, gas alam, dan/atau produk olahan dari minyak dan gas.
1. There are four categories of downstream activities of oil and gas, namely oil and gas processing, oil and gas transportation, oil and gas storage, and commercial or marketing activities.
2. Processing activities are activities on the downstream oil and gas industry which aims to improve the quality of oil and/or natural gas by performing specific processes such as purification of crude oil by removing unwanted components from oil and/or natural gas. The processing activities for petroleum is carried out in the refinery, that is a place/industrial installation consisting of various types of technology which will be used to process petroleum into more applicable and tradable products. Inside the refinery, crude oil will go through catalytic cracking process and fractional distillation process. The catalytic cracking process is the process of catalytically breaking the bond of the carbon chain in the petroleum which contain a gas phase, while fractional distillation is the separation of the petroleum fractions by heating at certain temperatures. Processed petroleum products can be categorized into Petroleum Fuel (BBM) and non-fuel products.
3. Transport activities are activities that are carried out to transport oil, natural gas, and/or processed products from oil and gas from production areas, refineries, or from storage. In general, transportation process is done by using two methods: by using transport vehicles such as petroleum transport trucks and transport vessels, and/or by using oil and gas pipelines that connects production areas or refineries or storage to a particular destination for the distribution of oil, natural gas, and/or petroleum processed products.
PENJELASAN TEKNIS | Technical Notes
37Directorate General of Oil And GasMinistry of Energy and Mineral Resources
STATISTICSO i l a n d G a s
2016
HILIR | DOWNSTREAM
4. Kegiatan penyimpanan adalah kegiatan pada hilir migas yang bertujuan untuk menerima, mengumpulkan, menyimpan, dan mengeluarkan minyak dan/atau gas bumi, BBM, Bahan Bakar Gas (BBG), dan/atau hasil pengolahan dari minyak dan/atau gas yang akan dijual. Investasi yang dapat dilakukan pada kegiatan penyimpanan adalah seperti pembangunan tanki minyak, pembuatan lokasi depot penyimpanan, dan lain sebagainya.
5. Kegiatan niaga atau pemasaran adalah kegiatan yang meliputi pembelian, penjualan, ekspor dan impor dari minyak bumi, BBM, BBG, dan/atau hasil pengolahan, termasuk gas melalui pipa.
6. Liquefied Petroleum Gas (LPG) adalah campuran dari beberapa gas hidrokarbon yang dicairkan dengan tekanan untuk memudahkan penyimpanan, pengangkutan, dan penanganannya; pada dasarnya terdiri atas propana, butana, atau campuran keduanya. LPG berubah menjadi fasa cair pada saat di dalam tanki bahan bakar LPG yang memiliki tekanan yang relatif tinggi. LPG dapat terbentuk melalui dua buah cara, yaitu LPG dapat terbentuk dengan alami, di mana terjadi pencampuran dari cadangan minyak dan gas bumi, dan berasal dari proses pengolahan dari kilang minyak dan kilang gas.
7. Liquefied Natural Gas (LNG) adalah campuran komponen metana, etana, propana, dan nitrogen yang berasal dari gas alam yang telah dicairkan pada suhu -161oC (-256oF). LNG memiliki karakteristik tidak berwarna, tidak berbau, non-korosif, dan tidak beracun.
8. Kegiatan ekspor dan impor merupakan salah satu kegiatan usaha hilir migas yang termasuk pada kategori niaga. Kegiatan niaga dapat meliputi kegiatan ekspor dan impor pada minyak mentah dan kondensat, Bahan Bakar Minyak (BBM), Liquid Petroleum Gas (LPG), produk kilang, dan Liquefied Natural Gas (LNG).
4. Storage activities are activities on the downstream of oil and gas which aims to receive, collect, store, and release oil and/or gas, fuel, gas fuel (BBG), and/or processed products from oil and/or gas to be sold or transported. Investments on storage activities includes the construction of oil tanks, building storage depots, etc.
5. Commercial or marketing activity includes the purchase, sale, export and import of petroleum, fuel, BBG, and/or processing products, including pipeline gas.
6. Liquefied Petroleum Gas (LPG) is a mixture of some liquefied hydrocarbon gas with pressure for ease of storage, transport and handling; Consists essentially of propane, butane, or a mixture of both. LPG is transformed into a liquid phase while in LPG fuel tank having relatively high pressure. LPG can be formed through two ways: naturally, where mixing of oil and gas reserves occurs, and through processing in oil and gas refineries.
7. Liquefied Natural Gas (LNG) is a mixture of methane, ethane, propane, and nitrogen components derived from liquefied natural gas at -161oC (-256 oF). LNG has characteristic of colorless, odorless, non-corrosive, and non-toxic.
8. Export and import activity is one of the downstream business activities of oil and gas which is included in the commercial category. Trade activities may include export and import activities on crude oil and condensate, Fuel, Liquid Petroleum Gas (LPG), refinery products, and Liquefied Natural Gas (LNG).
Direktorat Jenderal Minyak dan Gas BumiKementerian Energi dan Sumber Daya Mineral
38
STATISTIKMinyak dan Gas Bumi
2016
HILIR | DOWNSTREAM
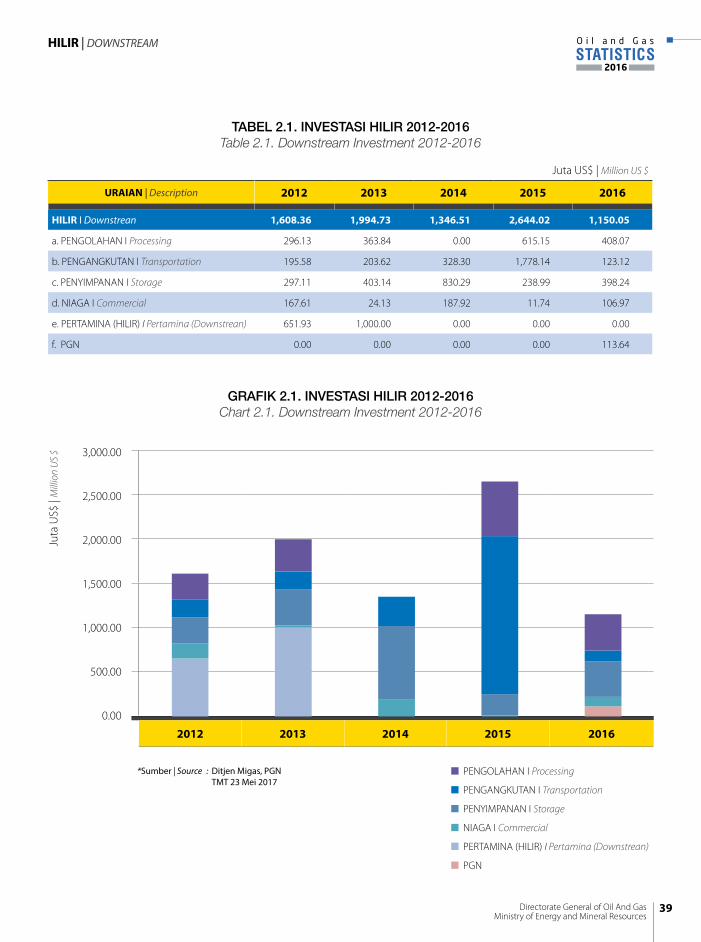
Juta US$ | Million US $
URAIAN | Description 2012 2013 2014 2015 2016
HILIR I Downstrean 1,608.36 1,994.73 1,346.51 2,644.02 1,150.05
a. PENGOLAHAN I Processing 296.13 363.84 0.00 615.15 408.07
b. PENGANGKUTAN I Transportation 195.58 203.62 328.30 1,778.14 123.12
c. PENYIMPANAN I Storage 297.11 403.14 830.29 238.99 398.24
d. NIAGA I Commercial 167.61 24.13 187.92 11.74 106.97
e. PERTAMINA (HILIR) I Pertamina (Downstrean) 651.93 1,000.00 0.00 0.00 0.00
f. PGN 0.00 0.00 0.00 0.00 113.64
TABEL 2.1. INVESTASI HILIR 2012-2016Table 2.1. Downstream Investment 2012-2016
GRAFIK 2.1. INVESTASI HILIR 2012-2016Chart 2.1. Downstream Investment 2012-2016
*Sumber | Source : Ditjen Migas, PGN TMT 23 Mei 2017
Masih Salah
..........
2012 2013 2014 2015 2016
3,000.00
2,500.00
2,000.00
1,500.00
1,000.00
500.00
0.00
Juta
US$
| M
illio
n U
S $
PENGOLAHAN I Processing
PENGANGKUTAN I Transportation
PENYIMPANAN I Storage
NIAGA I Commercial
PERTAMINA (HILIR) I Pertamina (Downstrean)
PGN
39Directorate General of Oil And GasMinistry of Energy and Mineral Resources
STATISTICSO i l a n d G a s
2016
HILIR | DOWNSTREAM
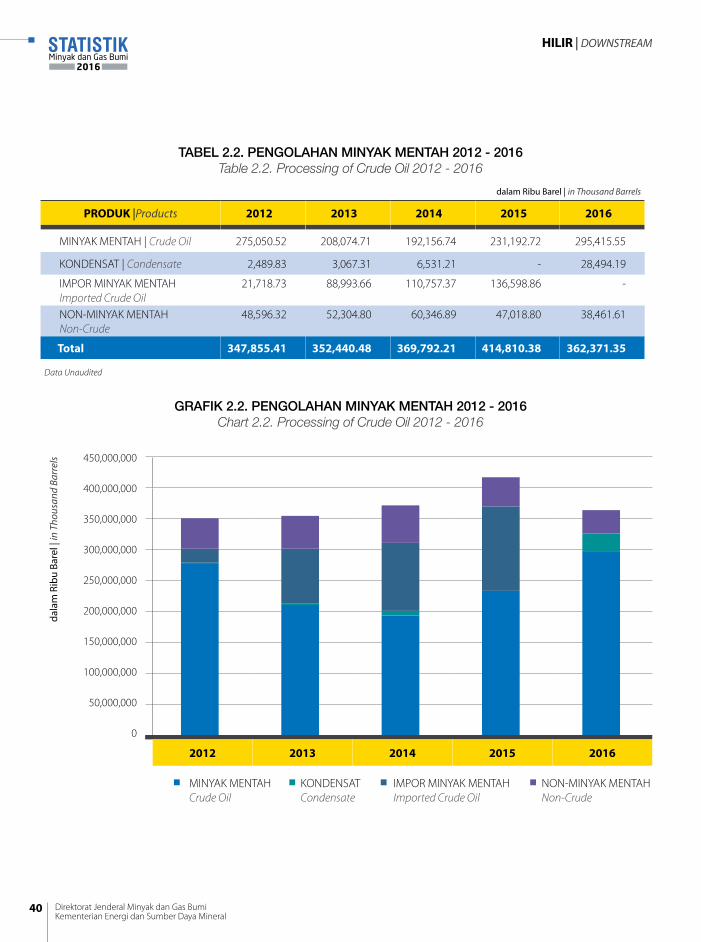
dalam Ribu Barel | in Thousand Barrels
PRODUK |Products 2012 2013 2014 2015 2016
MINYAK MENTAH | Crude Oil 275,050.52 208,074.71 192,156.74 231,192.72 295,415.55
KONDENSAT | Condensate 2,489.83 3,067.31 6,531.21 - 28,494.19
IMPOR MINYAK MENTAH Imported Crude Oil
21,718.73 88,993.66 110,757.37 136,598.86 -
NON-MINYAK MENTAHNon-Crude
48,596.32 52,304.80 60,346.89 47,018.80 38,461.61
Total 347,855.41 352,440.48 369,792.21 414,810.38 362,371.35
Data Unaudited
TABEL 2.2. PENGOLAHAN MINYAK MENTAH 2012 - 2016Table 2.2. Processing of Crude Oil 2012 - 2016
2012 2013 2014 2015 2016
450,000,000
400,000,000
350,000,000
300,000,000
250,000,000
200,000,000
150,000,000
100,000,000
50,000,000
0
dal
am R
ibu
Bare
l | in
Tho
usan
d Ba
rrel
s
MINYAK MENTAH Crude Oil
KONDENSAT Condensate
IMPOR MINYAK MENTAH Imported Crude Oil
NON-MINYAK MENTAH Non-Crude
GRAFIK 2.2. PENGOLAHAN MINYAK MENTAH 2012 - 2016Chart 2.2. Processing of Crude Oil 2012 - 2016
Direktorat Jenderal Minyak dan Gas BumiKementerian Energi dan Sumber Daya Mineral
40
STATISTIKMinyak dan Gas Bumi
2016
HILIR | DOWNSTREAM
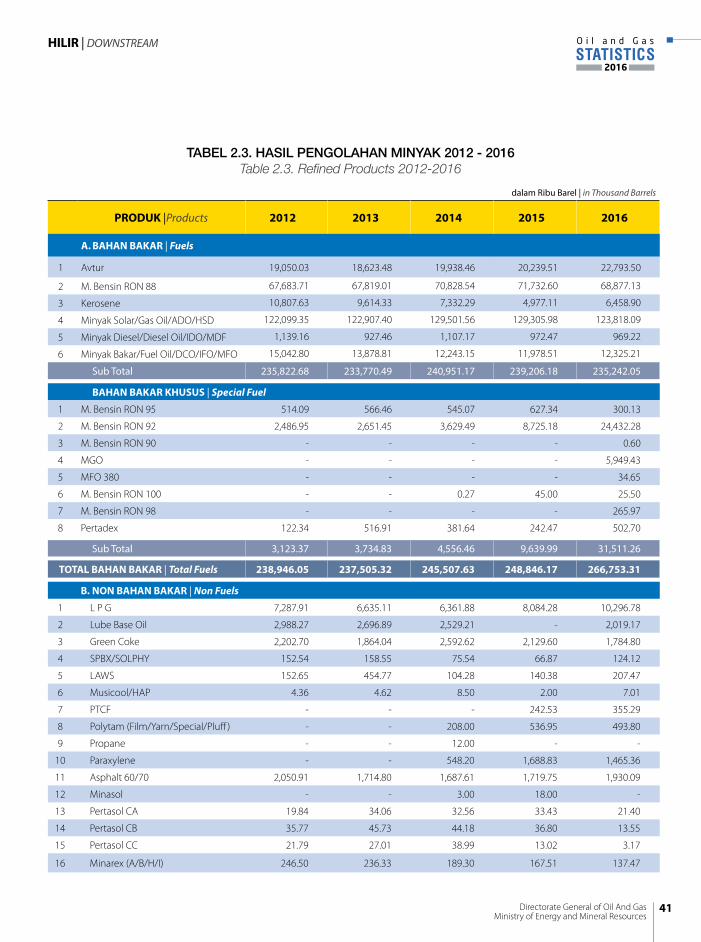
dalam Ribu Barel | in Thousand Barrels
PRODUK |Products 2012 2013 2014 2015 2016
A. BAHAN BAKAR | Fuels
1 Avtur 19,050.03 18,623.48 19,938.46 20,239.51 22,793.50
2 M. Bensin RON 88 67,683.71 67,819.01 70,828.54 71,732.60 68,877.13
3 Kerosene 10,807.63 9,614.33 7,332.29 4,977.11 6,458.90
4 Minyak Solar/Gas Oil/ADO/HSD 122,099.35 122,907.40 129,501.56 129,305.98 123,818.09
5 Minyak Diesel/Diesel Oil/IDO/MDF 1,139.16 927.46 1,107.17 972.47 969.22
6 Minyak Bakar/Fuel Oil/DCO/IFO/MFO 15,042.80 13,878.81 12,243.15 11,978.51 12,325.21
Sub Total 235,822.68 233,770.49 240,951.17 239,206.18 235,242.05
BAHAN BAKAR KHUSUS | Special Fuel
1 M. Bensin RON 95 514.09 566.46 545.07 627.34 300.13
2 M. Bensin RON 92 2,486.95 2,651.45 3,629.49 8,725.18 24,432.28
3 M. Bensin RON 90 - - - - 0.60
4 MGO - - - - 5,949.43
5 MFO 380 - - - - 34.65
6 M. Bensin RON 100 - - 0.27 45.00 25.50
7 M. Bensin RON 98 - - - - 265.97
8 Pertadex 122.34 516.91 381.64 242.47 502.70
Sub Total 3,123.37 3,734.83 4,556.46 9,639.99 31,511.26
TOTAL BAHAN BAKAR | Total Fuels 238,946.05 237,505.32 245,507.63 248,846.17 266,753.31
B. NON BAHAN BAKAR | Non Fuels
1 L P G 7,287.91 6,635.11 6,361.88 8,084.28 10,296.78
2 Lube Base Oil 2,988.27 2,696.89 2,529.21 - 2,019.17
3 Green Coke 2,202.70 1,864.04 2,592.62 2,129.60 1,784.80
4 SPBX/SOLPHY 152.54 158.55 75.54 66.87 124.12
5 LAWS 152.65 454.77 104.28 140.38 207.47
6 Musicool/HAP 4.36 4.62 8.50 2.00 7.01
7 PTCF - - - 242.53 355.29
8 Polytam (Film/Yarn/Special/Pluff ) - - 208.00 536.95 493.80
9 Propane - - 12.00 - -
10 Paraxylene - - 548.20 1,688.83 1,465.36
11 Asphalt 60/70 2,050.91 1,714.80 1,687.61 1,719.75 1,930.09
12 Minasol - - 3.00 18.00 -
13 Pertasol CA 19.84 34.06 32.56 33.43 21.40
14 Pertasol CB 35.77 45.73 44.18 36.80 13.55
15 Pertasol CC 21.79 27.01 38.99 13.02 3.17
16 Minarex (A/B/H/I) 246.50 236.33 189.30 167.51 137.47
TABEL 2.3. HASIL PENGOLAHAN MINYAK 2012 - 2016Table 2.3. Refined Products 2012-2016
41Directorate General of Oil And GasMinistry of Energy and Mineral Resources
STATISTICSO i l a n d G a s
2016
HILIR | DOWNSTREAM
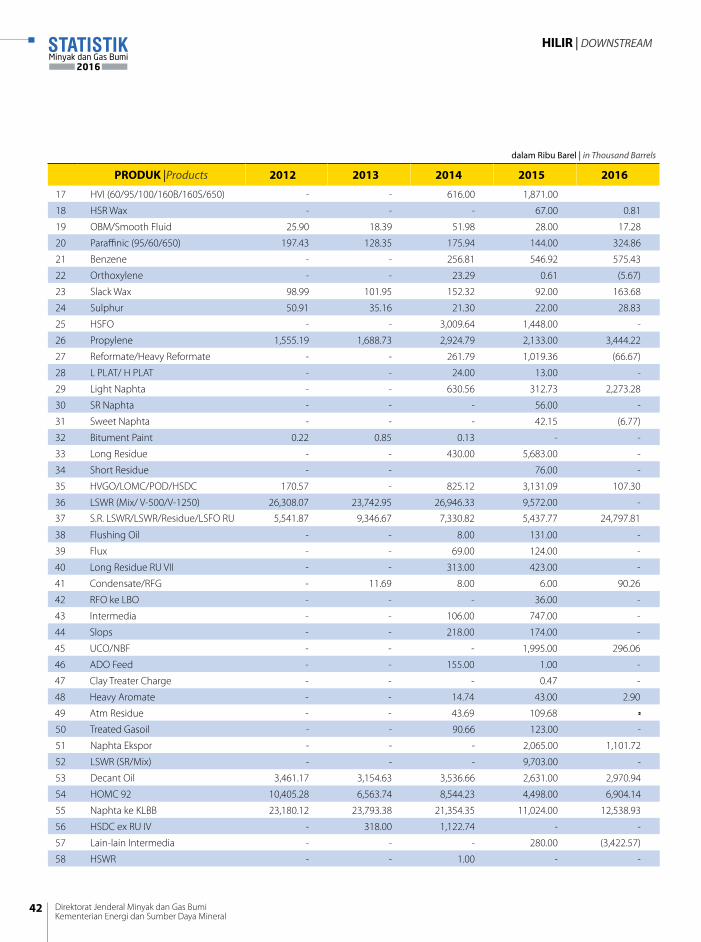
dalam Ribu Barel | in Thousand Barrels
PRODUK |Products 2012 2013 2014 2015 2016
17 HVI (60/95/100/160B/160S/650) - - 616.00 1,871.00
18 HSR Wax - - - 67.00 0.81
19 OBM/Smooth Fluid 25.90 18.39 51.98 28.00 17.28
20 Paraffinic (95/60/650) 197.43 128.35 175.94 144.00 324.86
21 Benzene - - 256.81 546.92 575.43
22 Orthoxylene - - 23.29 0.61 (5.67)
23 Slack Wax 98.99 101.95 152.32 92.00 163.68
24 Sulphur 50.91 35.16 21.30 22.00 28.83
25 HSFO - - 3,009.64 1,448.00 -
26 Propylene 1,555.19 1,688.73 2,924.79 2,133.00 3,444.22
27 Reformate/Heavy Reformate - - 261.79 1,019.36 (66.67)
28 L PLAT/ H PLAT - - 24.00 13.00 -
29 Light Naphta - - 630.56 312.73 2,273.28
30 SR Naphta - - - 56.00 -
31 Sweet Naphta - - - 42.15 (6.77)
32 Bitument Paint 0.22 0.85 0.13 - -
33 Long Residue - - 430.00 5,683.00 -
34 Short Residue - - 76.00 -
35 HVGO/LOMC/POD/HSDC 170.57 - 825.12 3,131.09 107.30
36 LSWR (Mix/ V-500/V-1250) 26,308.07 23,742.95 26,946.33 9,572.00 -
37 S.R. LSWR/LSWR/Residue/LSFO RU 5,541.87 9,346.67 7,330.82 5,437.77 24,797.81
38 Flushing Oil - - 8.00 131.00 -
39 Flux - - 69.00 124.00 -
40 Long Residue RU VII - - 313.00 423.00 -
41 Condensate/RFG - 11.69 8.00 6.00 90.26
42 RFO ke LBO - - - 36.00 -
43 Intermedia - - 106.00 747.00 -
44 Slops - - 218.00 174.00 -
45 UCO/NBF - - - 1,995.00 296.06
46 ADO Feed - - 155.00 1.00 -
47 Clay Treater Charge - - - 0.47 -
48 Heavy Aromate - - 14.74 43.00 2.90
49 Atm Residue - - 43.69 109.68 -
50 Treated Gasoil - - 90.66 123.00 -
51 Naphta Ekspor - - - 2,065.00 1,101.72
52 LSWR (SR/Mix) - - - 9,703.00 -
53 Decant Oil 3,461.17 3,154.63 3,536.66 2,631.00 2,970.94
54 HOMC 92 10,405.28 6,563.74 8,544.23 4,498.00 6,904.14
55 Naphta ke KLBB 23,180.12 23,793.38 21,354.35 11,024.00 12,538.93
56 HSDC ex RU IV - 318.00 1,122.74 - -
57 Lain-lain Intermedia - - - 280.00 (3,422.57)
58 HSWR - - 1.00 - -
Direktorat Jenderal Minyak dan Gas BumiKementerian Energi dan Sumber Daya Mineral
42
STATISTIKMinyak dan Gas Bumi
2016
HILIR | DOWNSTREAM
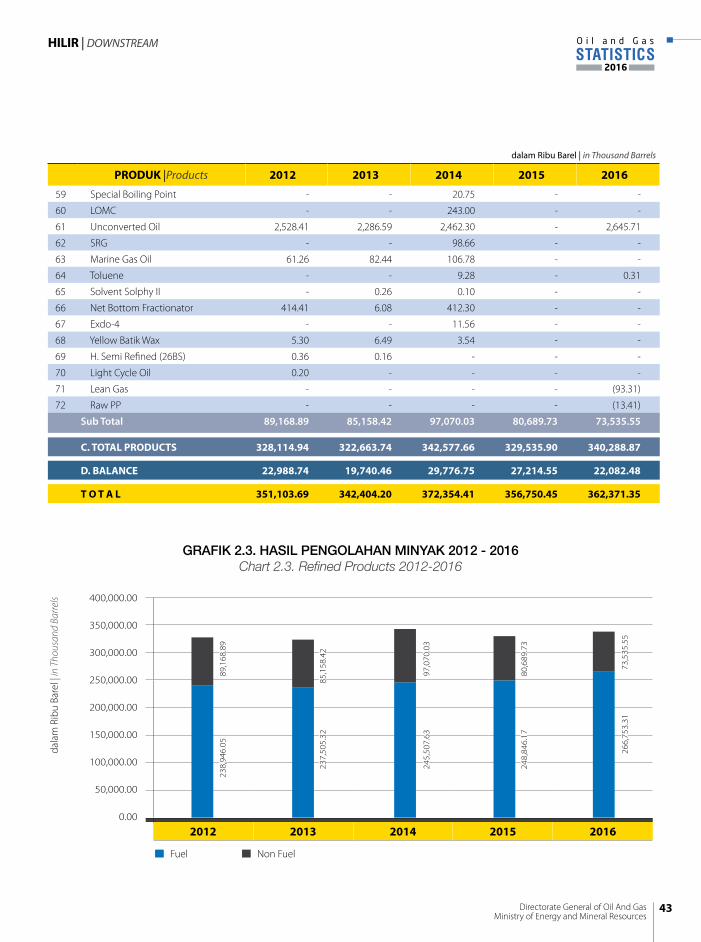
dalam Ribu Barel | in Thousand Barrels
PRODUK |Products 2012 2013 2014 2015 2016
59 Special Boiling Point - - 20.75 - -
60 LOMC - - 243.00 - -
61 Unconverted Oil 2,528.41 2,286.59 2,462.30 - 2,645.71
62 SRG - - 98.66 - -
63 Marine Gas Oil 61.26 82.44 106.78 - -
64 Toluene - - 9.28 - 0.31
65 Solvent Solphy II - 0.26 0.10 - -
66 Net Bottom Fractionator 414.41 6.08 412.30 - -
67 Exdo-4 - - 11.56 - -
68 Yellow Batik Wax 5.30 6.49 3.54 - -
69 H. Semi Refined (26BS) 0.36 0.16 - - -
70 Light Cycle Oil 0.20 - - - -
71 Lean Gas - - - - (93.31)
72 Raw PP - - - - (13.41)
Sub Total 89,168.89 85,158.42 97,070.03 80,689.73 73,535.55
C. TOTAL PRODUCTS 328,114.94 322,663.74 342,577.66 329,535.90 340,288.87
D. BALANCE 22,988.74 19,740.46 29,776.75 27,214.55 22,082.48
T O T A L 351,103.69 342,404.20 372,354.41 356,750.45 362,371.35
Fuel
2012 2013 2014 2015 2016
400,000.00
350,000.00
300,000.00
250,000.00
200,000.00
150,000.00
100,000.00
50,000.00
0.00
dal
am R
ibu
Bare
l | in
Tho
usan
d Ba
rrel
s
89,
168.
89
85,
158.
42 2
37,5
05.3
2
245
,507
.63
248
,846
.17
266,
753.
31
97,
070.
03
80,
689.
73
238
,946
.05
Non Fuel
73,5
35.5
5
GRAFIK 2.3. HASIL PENGOLAHAN MINYAK 2012 - 2016Chart 2.3. Refined Products 2012-2016
43Directorate General of Oil And GasMinistry of Energy and Mineral Resources
STATISTICSO i l a n d G a s
2016
HILIR | DOWNSTREAM
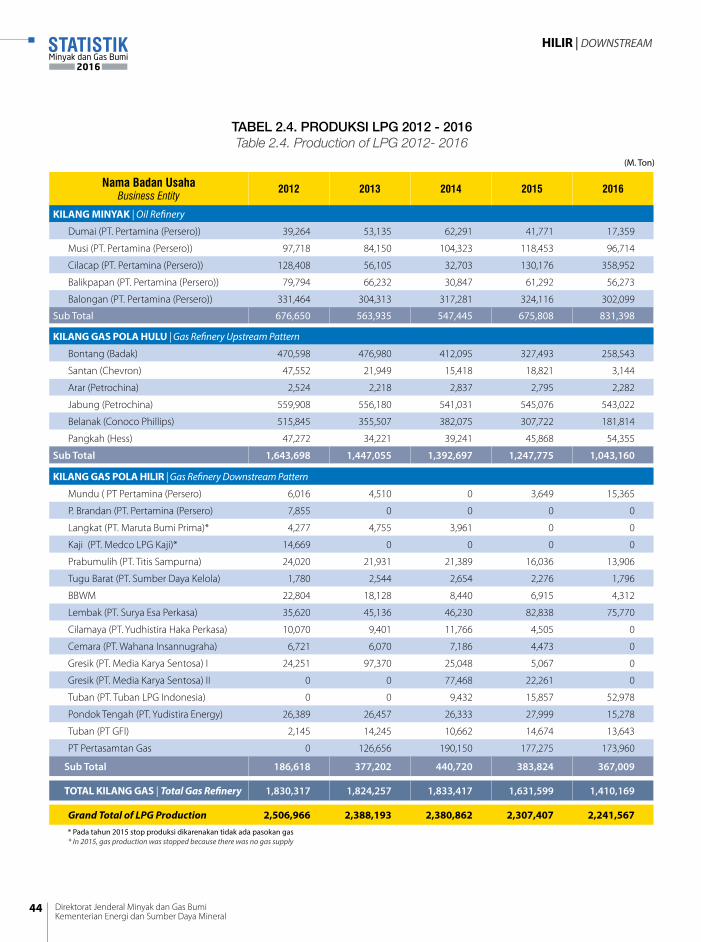
TABEL 2.4. PRODUKSI LPG 2012 - 2016Table 2.4. Production of LPG 2012- 2016
Nama Badan UsahaBusiness Entity
2012 2013 2014 2015 2016
KILANG MINYAK | Oil Refinery
Dumai (PT. Pertamina (Persero)) 39,264 53,135 62,291 41,771 17,359
Musi (PT. Pertamina (Persero)) 97,718 84,150 104,323 118,453 96,714
Cilacap (PT. Pertamina (Persero)) 128,408 56,105 32,703 130,176 358,952
Balikpapan (PT. Pertamina (Persero)) 79,794 66,232 30,847 61,292 56,273
Balongan (PT. Pertamina (Persero)) 331,464 304,313 317,281 324,116 302,099
Sub Total 676,650 563,935 547,445 675,808 831,398
KILANG GAS POLA HULU | Gas Refinery Upstream Pattern
Bontang (Badak) 470,598 476,980 412,095 327,493 258,543
Santan (Chevron) 47,552 21,949 15,418 18,821 3,144
Arar (Petrochina) 2,524 2,218 2,837 2,795 2,282
Jabung (Petrochina) 559,908 556,180 541,031 545,076 543,022
Belanak (Conoco Phillips) 515,845 355,507 382,075 307,722 181,814
Pangkah (Hess) 47,272 34,221 39,241 45,868 54,355
Sub Total 1,643,698 1,447,055 1,392,697 1,247,775 1,043,160
KILANG GAS POLA HILIR | Gas Refinery Downstream Pattern
Mundu ( PT Pertamina (Persero) 6,016 4,510 0 3,649 15,365
P. Brandan (PT. Pertamina (Persero) 7,855 0 0 0 0
Langkat (PT. Maruta Bumi Prima)* 4,277 4,755 3,961 0 0
Kaji (PT. Medco LPG Kaji)* 14,669 0 0 0 0
Prabumulih (PT. Titis Sampurna) 24,020 21,931 21,389 16,036 13,906
Tugu Barat (PT. Sumber Daya Kelola) 1,780 2,544 2,654 2,276 1,796
BBWM 22,804 18,128 8,440 6,915 4,312
Lembak (PT. Surya Esa Perkasa) 35,620 45,136 46,230 82,838 75,770
Cilamaya (PT. Yudhistira Haka Perkasa) 10,070 9,401 11,766 4,505 0
Cemara (PT. Wahana Insannugraha) 6,721 6,070 7,186 4,473 0
Gresik (PT. Media Karya Sentosa) I 24,251 97,370 25,048 5,067 0
Gresik (PT. Media Karya Sentosa) II 0 0 77,468 22,261 0
Tuban (PT. Tuban LPG Indonesia) 0 0 9,432 15,857 52,978
Pondok Tengah (PT. Yudistira Energy) 26,389 26,457 26,333 27,999 15,278
Tuban (PT GFI) 2,145 14,245 10,662 14,674 13,643
PT Pertasamtan Gas 0 126,656 190,150 177,275 173,960
Sub Total 186,618 377,202 440,720 383,824 367,009
TOTAL KILANG GAS | Total Gas Refinery 1,830,317 1,824,257 1,833,417 1,631,599 1,410,169
Grand Total of LPG Production 2,506,966 2,388,193 2,380,862 2,307,407 2,241,567
* In 2015, gas production was stopped because there was no gas supply
(M. Ton)
Direktorat Jenderal Minyak dan Gas BumiKementerian Energi dan Sumber Daya Mineral
44
STATISTIKMinyak dan Gas Bumi
2016
HILIR | DOWNSTREAM
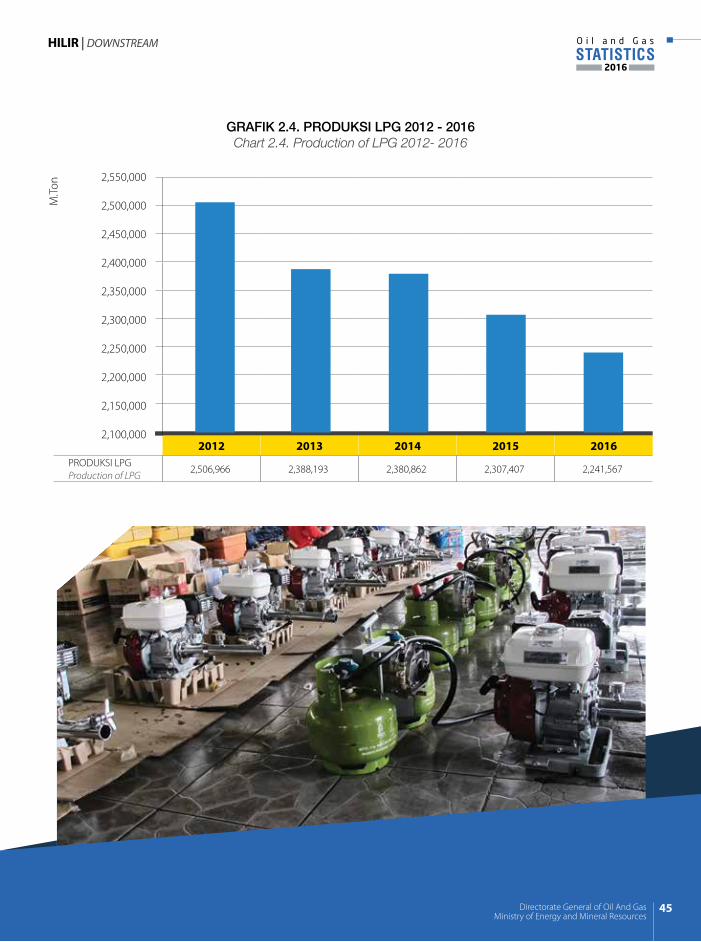
2012 2013 2014 2015 2016PRODUKSI LPGProduction of LPG
2,506,966 2,388,193 2,380,862 2,307,407 2,241,567
2,550,000
2,500,000
2,450,000
2,400,000
2,350,000
2,300,000
2,250,000
2,200,000
2,150,000
2,100,000
M.To
n
GRAFIK 2.4. PRODUKSI LPG 2012 - 2016Chart 2.4. Production of LPG 2012- 2016
45Directorate General of Oil And GasMinistry of Energy and Mineral Resources
STATISTICSO i l a n d G a s
2016
HILIR | DOWNSTREAM
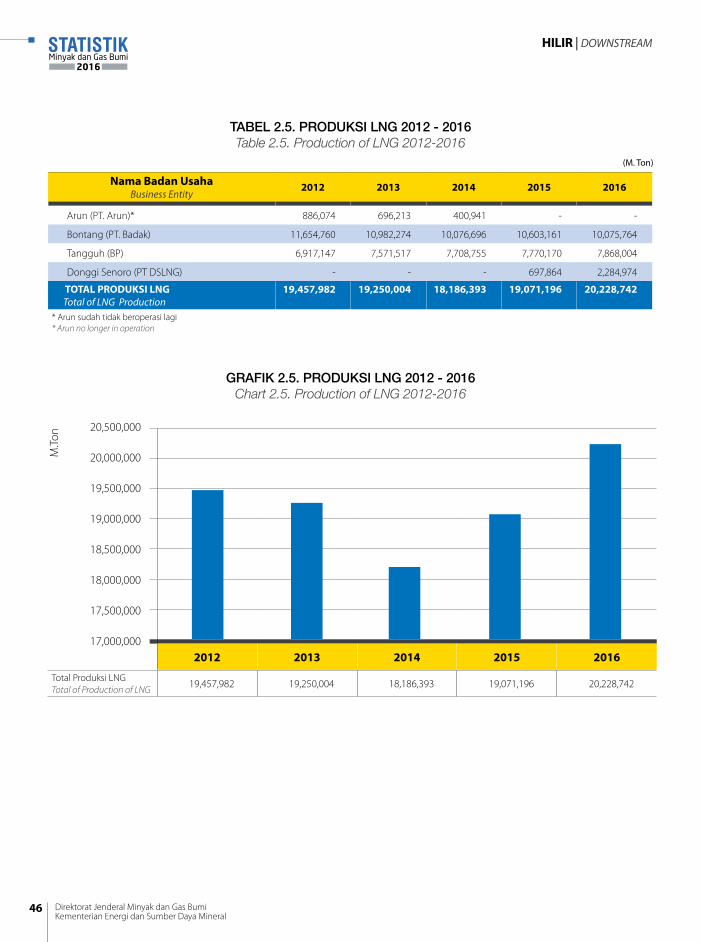
Nama Badan UsahaBusiness Entity
2012 2013 2014 2015 2016
Arun (PT. Arun)* 886,074 696,213 400,941 - -
Bontang (PT. Badak) 11,654,760 10,982,274 10,076,696 10,603,161 10,075,764
Tangguh (BP) 6,917,147 7,571,517 7,708,755 7,770,170 7,868,004
Donggi Senoro (PT DSLNG) - - - 697,864 2,284,974
TOTAL PRODUKSI LNG Total of LNG Production
19,457,982 19,250,004 18,186,393 19,071,196 20,228,742
* Arun sudah tidak beroperasi lagi * Arun no longer in operation
(M. Ton)
2012 2013 2014 2015 2016
Total Produksi LNGTotal of Production of LNG
19,457,982 19,250,004 18,186,393 19,071,196 20,228,742
20,500,000
20,000,000
19,500,000
19,000,000
18,500,000
18,000,000
17,500,000
17,000,000
M.To
n
TABEL 2.5. PRODUKSI LNG 2012 - 2016Table 2.5. Production of LNG 2012-2016
GRAFIK 2.5. PRODUKSI LNG 2012 - 2016Chart 2.5. Production of LNG 2012-2016
Direktorat Jenderal Minyak dan Gas BumiKementerian Energi dan Sumber Daya Mineral
46
STATISTIKMinyak dan Gas Bumi
2016
HILIR | DOWNSTREAM
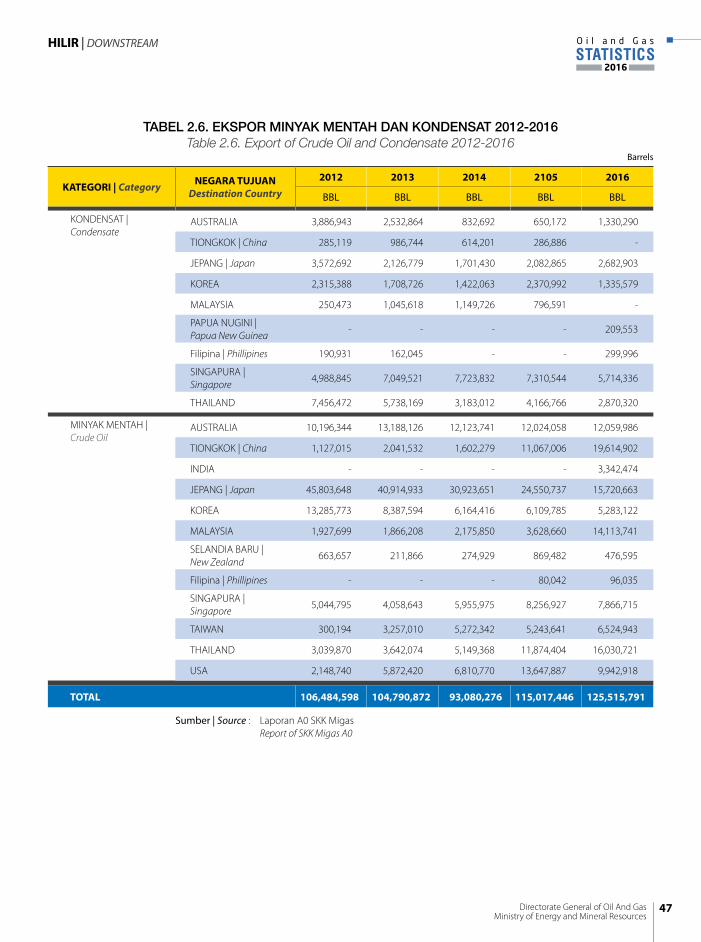
KATEGORI | Category NEGARA TUJUAN Destination Country
2012 2013 2014 2105 2016
BBL BBL BBL BBL BBL
KONDENSAT | Condensate
AUSTRALIA 3,886,943 2,532,864 832,692 650,172 1,330,290
TIONGKOK | China 285,119 986,744 614,201 286,886 -
JEPANG | Japan 3,572,692 2,126,779 1,701,430 2,082,865 2,682,903
KOREA 2,315,388 1,708,726 1,422,063 2,370,992 1,335,579
MALAYSIA 250,473 1,045,618 1,149,726 796,591 -
PAPUA NUGINI | Papua New Guinea
- - - - 209,553
Filipina | Phillipines 190,931 162,045 - - 299,996
SINGAPURA | Singapore
4,988,845 7,049,521 7,723,832 7,310,544 5,714,336
THAILAND 7,456,472 5,738,169 3,183,012 4,166,766 2,870,320
MINYAK MENTAH | Crude Oil
AUSTRALIA 10,196,344 13,188,126 12,123,741 12,024,058 12,059,986
TIONGKOK | China 1,127,015 2,041,532 1,602,279 11,067,006 19,614,902
INDIA - - - - 3,342,474
JEPANG | Japan 45,803,648 40,914,933 30,923,651 24,550,737 15,720,663
KOREA 13,285,773 8,387,594 6,164,416 6,109,785 5,283,122
MALAYSIA 1,927,699 1,866,208 2,175,850 3,628,660 14,113,741
SELANDIA BARU |New Zealand
663,657 211,866 274,929 869,482 476,595
Filipina | Phillipines - - - 80,042 96,035
SINGAPURA | Singapore
5,044,795 4,058,643 5,955,975 8,256,927 7,866,715
TAIWAN 300,194 3,257,010 5,272,342 5,243,641 6,524,943
THAILAND 3,039,870 3,642,074 5,149,368 11,874,404 16,030,721
USA 2,148,740 5,872,420 6,810,770 13,647,887 9,942,918
TOTAL 106,484,598 104,790,872 93,080,276 115,017,446 125,515,791
Barrels
TABEL 2.6. EKSPOR MINYAK MENTAH DAN KONDENSAT 2012-2016Table 2.6. Export of Crude Oil and Condensate 2012-2016
Sumber | Source : Laporan A0 SKK Migas Report of SKK Migas A0
47Directorate General of Oil And GasMinistry of Energy and Mineral Resources
STATISTICSO i l a n d G a s
2016
HILIR | DOWNSTREAM
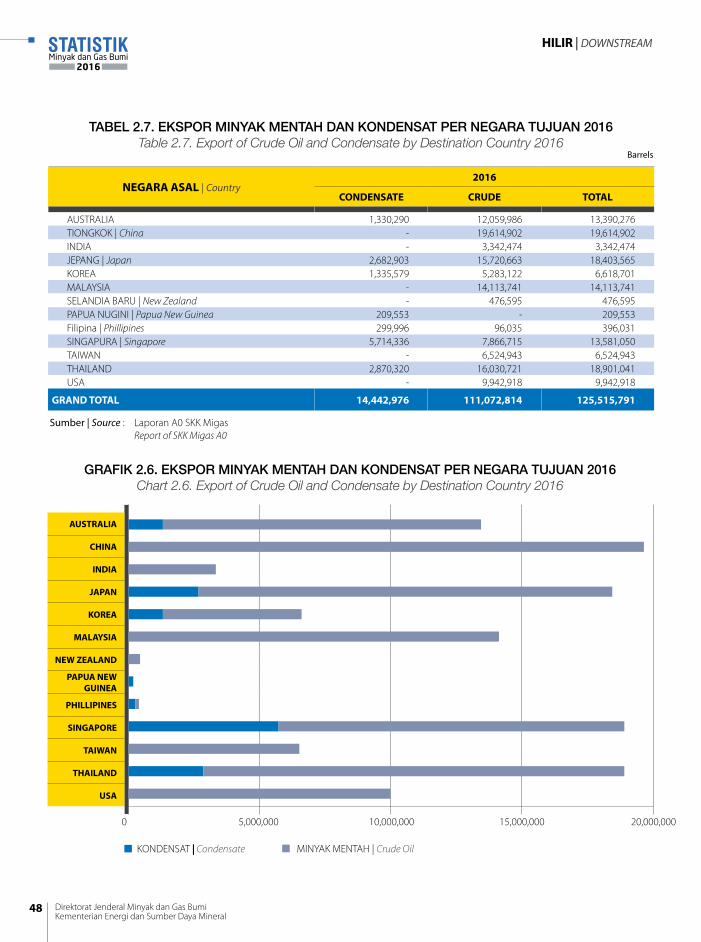
NEGARA ASAL | Country2016
CONDENSATE CRUDE TOTAL
AUSTRALIA 1,330,290 12,059,986 13,390,276 TIONGKOK | China - 19,614,902 19,614,902 INDIA - 3,342,474 3,342,474 JEPANG | Japan 2,682,903 15,720,663 18,403,565 KOREA 1,335,579 5,283,122 6,618,701 MALAYSIA - 14,113,741 14,113,741 SELANDIA BARU | New Zealand - 476,595 476,595 PAPUA NUGINI | Papua New Guinea 209,553 - 209,553 Filipina | Phillipines 299,996 96,035 396,031 SINGAPURA | Singapore 5,714,336 7,866,715 13,581,050 TAIWAN - 6,524,943 6,524,943 THAILAND 2,870,320 16,030,721 18,901,041 USA - 9,942,918 9,942,918
GRAND TOTAL 14,442,976 111,072,814 125,515,791
Barrels
TABEL 2.7. EKSPOR MINYAK MENTAH DAN KONDENSAT PER NEGARA TUJUAN 2016Table 2.7. Export of Crude Oil and Condensate by Destination Country 2016
AUSTRALIA
CHINA
INDIA
JAPAN
KOREA
MALAYSIA
NEW ZEALAND
PAPUA NEW GUINEA
PHILLIPINES
SINGAPORE
TAIWAN
THAILAND
USA
MINYAK MENTAH | Crude OilKONDENSAT | Condensate
0 5,000,000 10,000,000 15,000,000 20,000,000
GRAFIK 2.6. EKSPOR MINYAK MENTAH DAN KONDENSAT PER NEGARA TUJUAN 2016Chart 2.6. Export of Crude Oil and Condensate by Destination Country 2016
Sumber | Source : Laporan A0 SKK Migas Report of SKK Migas A0
Direktorat Jenderal Minyak dan Gas BumiKementerian Energi dan Sumber Daya Mineral
48
STATISTIKMinyak dan Gas Bumi
2016
HILIR | DOWNSTREAM
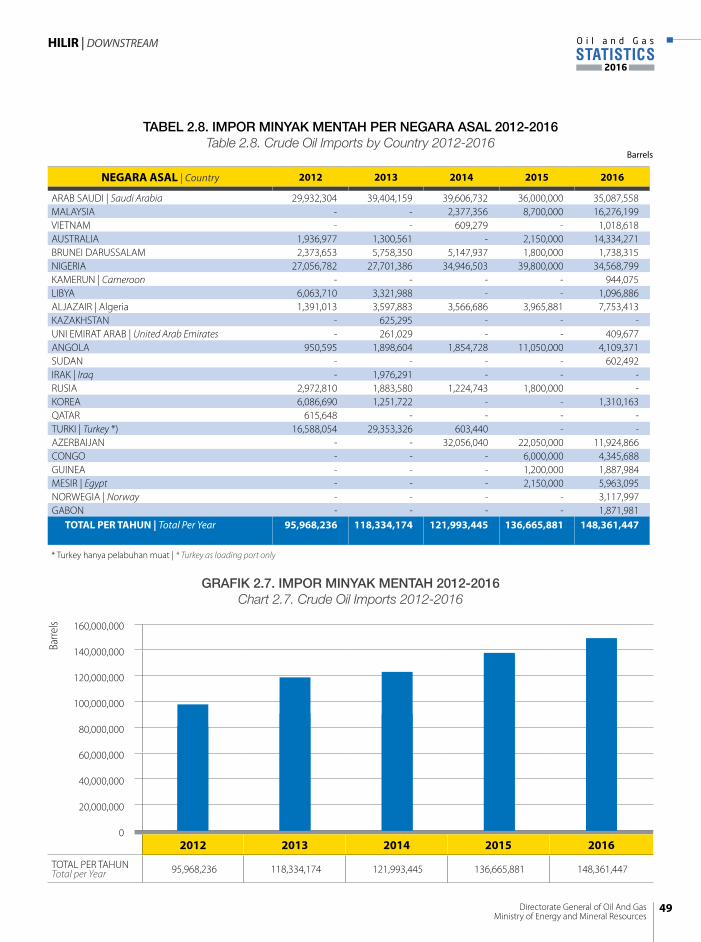
NEGARA ASAL | Country 2012 2013 2014 2015 2016
ARAB SAUDI | Saudi Arabia 29,932,304 39,404,159 39,606,732 36,000,000 35,087,558 MALAYSIA - - 2,377,356 8,700,000 16,276,199 VIETNAM - - 609,279 - 1,018,618 AUSTRALIA 1,936,977 1,300,561 - 2,150,000 14,334,271 BRUNEI DARUSSALAM 2,373,653 5,758,350 5,147,937 1,800,000 1,738,315 NIGERIA 27,056,782 27,701,386 34,946,503 39,800,000 34,568,799 KAMERUN | Cameroon - - - - 944,075 LIBYA 6,063,710 3,321,988 - - 1,096,886 ALJAZAIR | Algeria 1,391,013 3,597,883 3,566,686 3,965,881 7,753,413 KAZAKHSTAN - 625,295 - - - UNI EMIRAT ARAB | United Arab Emirates - 261,029 - - 409,677 ANGOLA 950,595 1,898,604 1,854,728 11,050,000 4,109,371 SUDAN - - - - 602,492 IRAK | Iraq - 1,976,291 - - - RUSIA 2,972,810 1,883,580 1,224,743 1,800,000 - KOREA 6,086,690 1,251,722 - - 1,310,163 QATAR 615,648 - - - - TURKI | Turkey *) 16,588,054 29,353,326 603,440 - - AZERBAIJAN - - 32,056,040 22,050,000 11,924,866 CONGO - - - 6,000,000 4,345,688 GUINEA - - - 1,200,000 1,887,984 MESIR | Egypt - - - 2,150,000 5,963,095 NORWEGIA | Norway - - - - 3,117,997 GABON - - - - 1,871,981 TOTAL PER TAHUN | Total Per Year 95,968,236 118,334,174 121,993,445 136,665,881 148,361,447
* Turkey hanya pelabuhan muat | * Turkey as loading port only
Barrels
TABEL 2.8. IMPOR MINYAK MENTAH PER NEGARA ASAL 2012-2016Table 2.8. Crude Oil Imports by Country 2012-2016
2012 2013 2014 2015 2016
TOTAL PER TAHUN Total per Year 95,968,236 118,334,174 121,993,445 136,665,881 148,361,447
160,000,000
140,000,000
120,000,000
100,000,000
80,000,000
60,000,000
40,000,000
20,000,000
0
Barre
ls
GRAFIK 2.7. IMPOR MINYAK MENTAH 2012-2016Chart 2.7. Crude Oil Imports 2012-2016
49Directorate General of Oil And GasMinistry of Energy and Mineral Resources
STATISTICSO i l a n d G a s
2016
HILIR | DOWNSTREAM
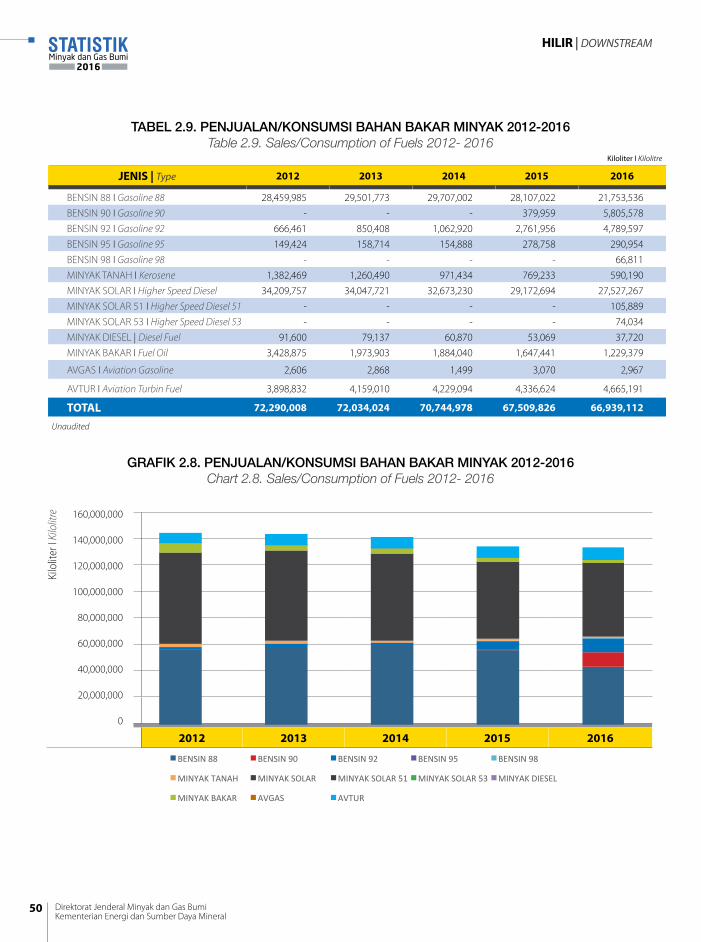
Kiloliter I Kilolitre
JENIS | Type 2012 2013 2014 2015 2016
BENSIN 88 I Gasoline 88 28,459,985 29,501,773 29,707,002 28,107,022 21,753,536 BENSIN 90 I Gasoline 90 - - - 379,959 5,805,578 BENSIN 92 I Gasoline 92 666,461 850,408 1,062,920 2,761,956 4,789,597 BENSIN 95 I Gasoline 95 149,424 158,714 154,888 278,758 290,954 BENSIN 98 I Gasoline 98 - - - - 66,811 MINYAK TANAH I Kerosene 1,382,469 1,260,490 971,434 769,233 590,190 MINYAK SOLAR I Higher Speed Diesel 34,209,757 34,047,721 32,673,230 29,172,694 27,527,267 MINYAK SOLAR 51 I Higher Speed Diesel 51 - - - - 105,889 MINYAK SOLAR 53 I Higher Speed Diesel 53 - - - - 74,034 MINYAK DIESEL | Diesel Fuel 91,600 79,137 60,870 53,069 37,720 MINYAK BAKAR I Fuel Oil 3,428,875 1,973,903 1,884,040 1,647,441 1,229,379
AVGAS I Aviation Gasoline 2,606 2,868 1,499 3,070 2,967
AVTUR I Aviation Turbin Fuel 3,898,832 4,159,010 4,229,094 4,336,624 4,665,191
TOTAL 72,290,008 72,034,024 70,744,978 67,509,826 66,939,112
TABEL 2.9. PENJUALAN/KONSUMSI BAHAN BAKAR MINYAK 2012-2016Table 2.9. Sales/Consumption of Fuels 2012- 2016
GRAFIK 2.8. PENJUALAN/KONSUMSI BAHAN BAKAR MINYAK 2012-2016Chart 2.8. Sales/Consumption of Fuels 2012- 2016
Unaudited
-‐
10,000,000
20,000,000
30,000,000
40,000,000
50,000,000
60,000,000
70,000,000
80,000,000
2012 2013 2014 2015 2016
PENJUALAN BAHAN BAKAR MINYAK INDONESIA
BENSIN 88 BENSIN 90 BENSIN 92 BENSIN 95 BENSIN 98
MINYAK TANAH MINYAK SOLAR MINYAK SOLAR 51 MINYAK SOLAR 53 MINYAK DIESEL
MINYAK BAKAR AVGAS AVTUR
2012 2013 2014 2015 2016
160,000,000
140,000,000
120,000,000
100,000,000
80,000,000
60,000,000
40,000,000
20,000,000
0
Kilo
liter
I Kilo
litre
Direktorat Jenderal Minyak dan Gas BumiKementerian Energi dan Sumber Daya Mineral
50
STATISTIKMinyak dan Gas Bumi
2016
HILIR | DOWNSTREAM
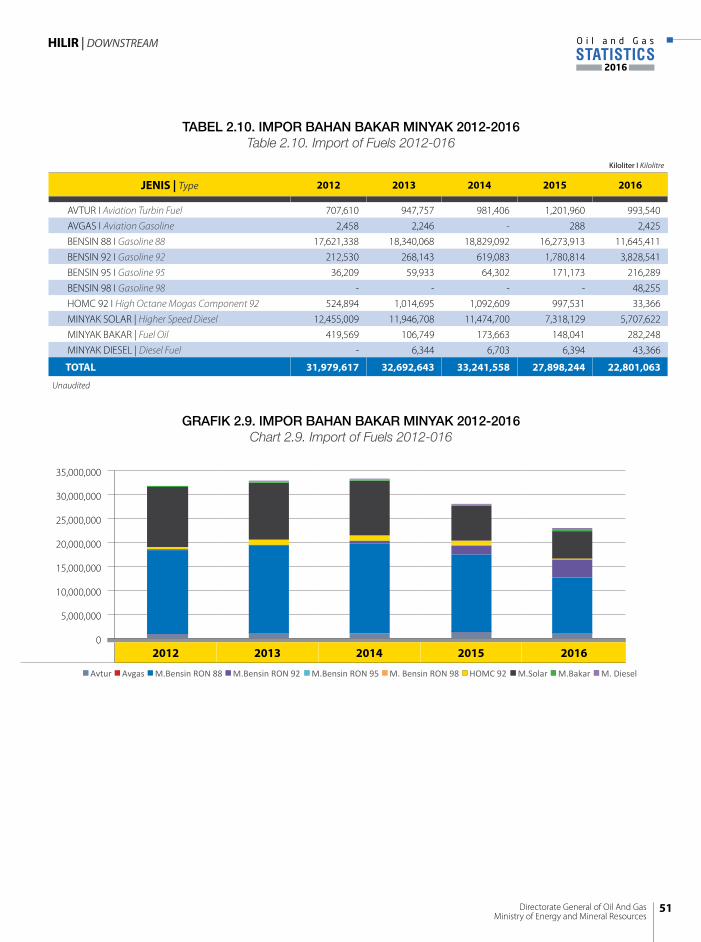
Kiloliter I Kilolitre
JENIS | Type 2012 2013 2014 2015 2016
AVTUR I Aviation Turbin Fuel 707,610 947,757 981,406 1,201,960 993,540 AVGAS I Aviation Gasoline 2,458 2,246 - 288 2,425 BENSIN 88 I Gasoline 88 17,621,338 18,340,068 18,829,092 16,273,913 11,645,411 BENSIN 92 I Gasoline 92 212,530 268,143 619,083 1,780,814 3,828,541 BENSIN 95 I Gasoline 95 36,209 59,933 64,302 171,173 216,289 BENSIN 98 I Gasoline 98 - - - - 48,255 HOMC 92 I High Octane Mogas Component 92 524,894 1,014,695 1,092,609 997,531 33,366 MINYAK SOLAR | Higher Speed Diesel 12,455,009 11,946,708 11,474,700 7,318,129 5,707,622 MINYAK BAKAR | Fuel Oil 419,569 106,749 173,663 148,041 282,248 MINYAK DIESEL | Diesel Fuel - 6,344 6,703 6,394 43,366
TOTAL 31,979,617 32,692,643 33,241,558 27,898,244 22,801,063
Unaudited
TABEL 2.10. IMPOR BAHAN BAKAR MINYAK 2012-2016Table 2.10. Import of Fuels 2012-016
-‐
5,000,000
10,000,000
15,000,000
20,000,000
25,000,000
30,000,000
35,000,000
2012 2013 2014 2015 2016
IMPOR BAHAN BAKAR MINYAK INDONESIA
Avtur Avgas M.Bensin RON 88 M.Bensin RON 92 M.Bensin RON 95 M. Bensin RON 98 HOMC 92 M.Solar M.Bakar M. Diesel
2012 2013 2014 2015 2016
35,000,000
30,000,000
25,000,000
20,000,000
15,000,000
10,000,000
5,000,000
0
GRAFIK 2.9. IMPOR BAHAN BAKAR MINYAK 2012-2016Chart 2.9. Import of Fuels 2012-016
51Directorate General of Oil And GasMinistry of Energy and Mineral Resources
STATISTICSO i l a n d G a s
2016
HILIR | DOWNSTREAM
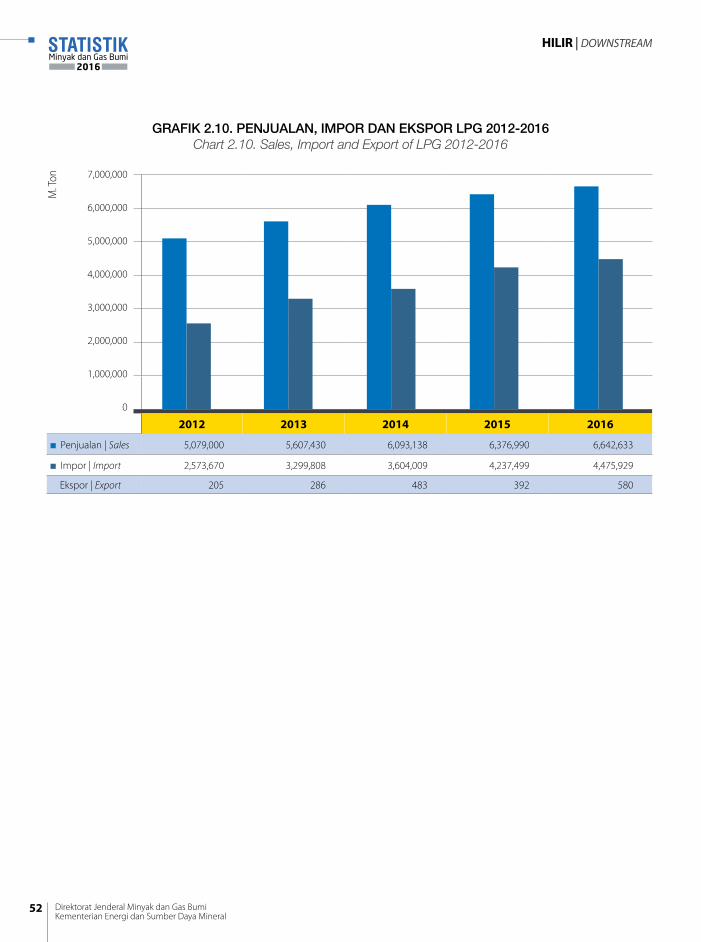
2012 2013 2014 2015 2016
Penjualan | Sales 5,079,000 5,607,430 6,093,138 6,376,990 6,642,633
Impor | Import 2,573,670 3,299,808 3,604,009 4,237,499 4,475,929
Ekspor | Export 205 286 483 392 580
7,000,000
6,000,000
5,000,000
4,000,000
3,000,000
2,000,000
1,000,000
0
M. T
on
GRAFIK 2.10. PENJUALAN, IMPOR DAN EKSPOR LPG 2012-2016Chart 2.10. Sales, Import and Export of LPG 2012-2016
Direktorat Jenderal Minyak dan Gas BumiKementerian Energi dan Sumber Daya Mineral
52
STATISTIKMinyak dan Gas Bumi
2016
HILIR | DOWNSTREAM
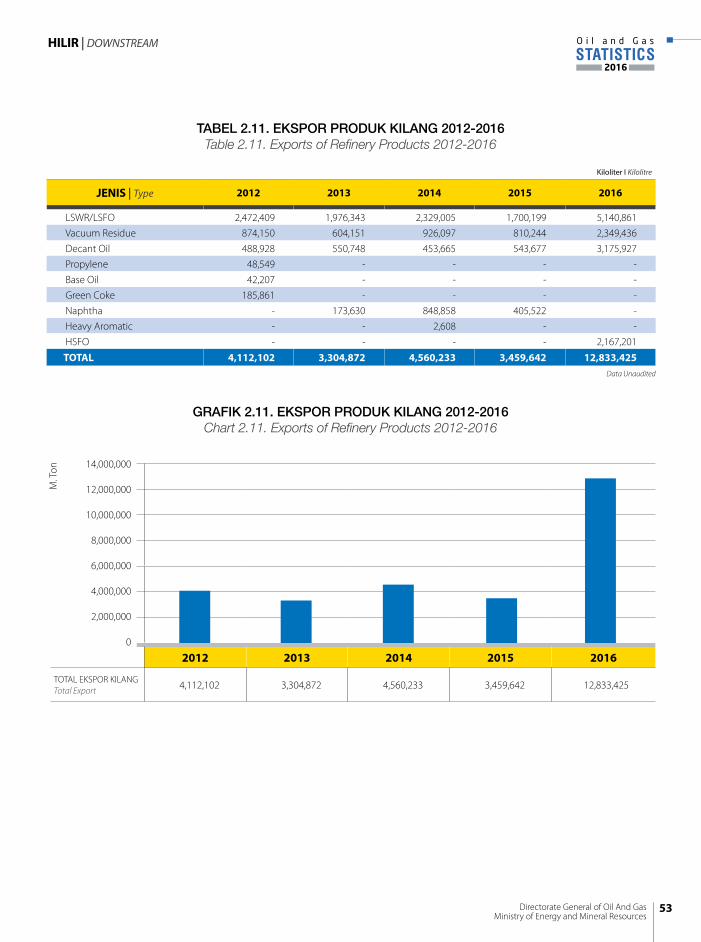
TABEL 2.11. EKSPOR PRODUK KILANG 2012-2016Table 2.11. Exports of Refinery Products 2012-2016
Kiloliter I Kilolitre
JENIS | Type 2012 2013 2014 2015 2016
LSWR/LSFO 2,472,409 1,976,343 2,329,005 1,700,199 5,140,861 Vacuum Residue 874,150 604,151 926,097 810,244 2,349,436 Decant Oil 488,928 550,748 453,665 543,677 3,175,927 Propylene 48,549 - - - - Base Oil 42,207 - - - - Green Coke 185,861 - - - - Naphtha - 173,630 848,858 405,522 - Heavy Aromatic - - 2,608 - - HSFO - - - - 2,167,201
TOTAL 4,112,102 3,304,872 4,560,233 3,459,642 12,833,425 Data Unaudited
14,000,000
12,000,000
10,000,000
8,000,000
6,000,000
4,000,000
2,000,000
0
M. T
on
2012 2013 2014 2015 2016
TOTAL EKSPOR KILANGTotal Export 4,112,102 3,304,872 4,560,233 3,459,642 12,833,425
GRAFIK 2.11. EKSPOR PRODUK KILANG 2012-2016Chart 2.11. Exports of Refinery Products 2012-2016
53Directorate General of Oil And GasMinistry of Energy and Mineral Resources
STATISTICSO i l a n d G a s
2016
HILIR | DOWNSTREAM
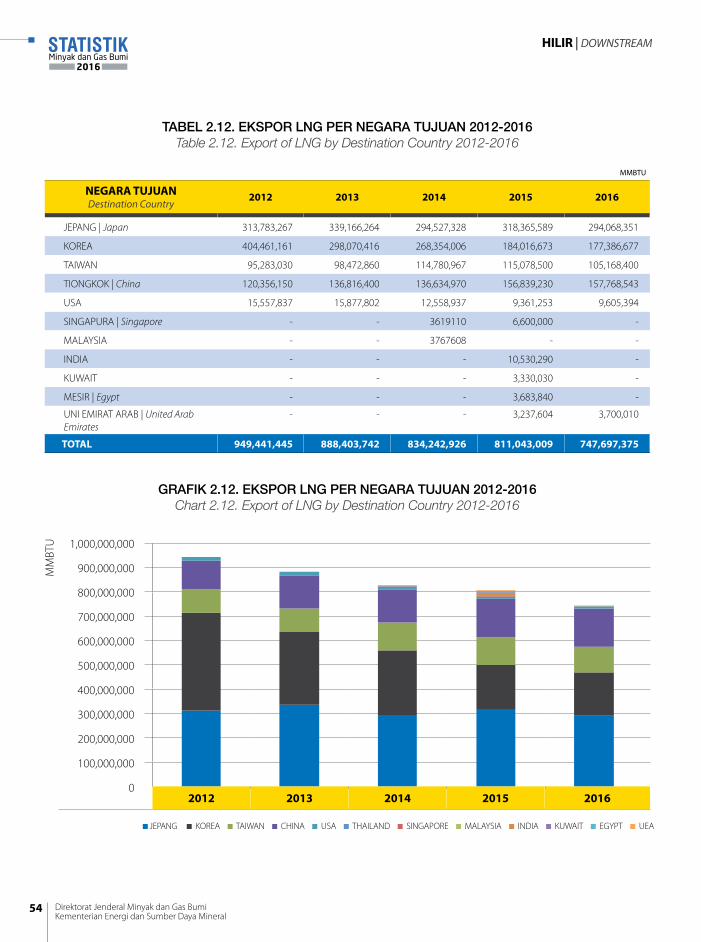
MMBTU
NEGARA TUJUANDestination Country
2012 2013 2014 2015 2016
JEPANG | Japan 313,783,267 339,166,264 294,527,328 318,365,589 294,068,351
KOREA 404,461,161 298,070,416 268,354,006 184,016,673 177,386,677
TAIWAN 95,283,030 98,472,860 114,780,967 115,078,500 105,168,400
TIONGKOK | China 120,356,150 136,816,400 136,634,970 156,839,230 157,768,543
USA 15,557,837 15,877,802 12,558,937 9,361,253 9,605,394
SINGAPURA | Singapore - - 3619110 6,600,000 -
MALAYSIA - - 3767608 - -
INDIA - - - 10,530,290 -
KUWAIT - - - 3,330,030 -
MESIR | Egypt - - - 3,683,840 -
UNI EMIRAT ARAB | United Arab Emirates
- - - 3,237,604 3,700,010
TOTAL 949,441,445 888,403,742 834,242,926 811,043,009 747,697,375
TABEL 2.12. EKSPOR LNG PER NEGARA TUJUAN 2012-2016Table 2.12. Export of LNG by Destination Country 2012-2016
GRAFIK 2.12. EKSPOR LNG PER NEGARA TUJUAN 2012-2016Chart 2.12. Export of LNG by Destination Country 2012-2016
JEPANG KOREA TAIWAN CHINA USA THAILAND SINGAPORE MALAYSIA INDIA KUWAIT EGYPT UEA
2012 2013 2014 2015 2016
1,000,000,000
900,000,000
800,000,000
700,000,000
600,000,000
500,000,000
400,000,000
300,000,000
200,000,000
100,000,000
0
MM
BTU
Direktorat Jenderal Minyak dan Gas BumiKementerian Energi dan Sumber Daya Mineral
54
STATISTIKMinyak dan Gas Bumi
2016
HILIR | DOWNSTREAM
STATISTIKMinyak dan Gas Bumi
2016
STATISTICSO i l a n d G a s
2016
Supporting
Direktorat Jenderal Minyak dan Gas BumiKementerian Energi dan Sumber Daya Mineral
Directorate General of Oil And GasMinistry of Energy and Mineral Resources
PENUNJANG
1. Penyelenggaraan usaha penunjang migas memiliki tujuan utama untuk menunjang usaha penyediaan dan pemanfaatan barang dan jasa kegiatan usaha hulu dan kegiatan usaha hilir (ESDM, 2008). Mengacu pada Permen ESDM No.27 tahun 2008, usaha penunjang migas dapat dilakukan oleh perusahaan atau perseorangan, dan dibagi ke dalam 2 kelompok utama dengan beberapa bidang di dalamnya, yaitu Usaha Jasa Penunjang Migas dan Usaha Industri Penunjang Migas.
2. Usaha Jasa Penunjang Migas, terdiri atas:− Bidang Usaha Jasa Konstruksi Migas.− Bidang Usaha Jasa Non-konstruksi Migas.
3. Usaha Industri Penunjang Migas, terdiri atas:− industri material;− industri peralatan;− industri pemanfaatan migas.
4. Untuk dapat melaksanakan kegiatan usaha penunjang migas, maka perusahaan maupun perseorangan wajib memiliki Surat Keterangan Terdaftar (SKT). Untuk memilikinya, maka perlu dilakukan pendaftaran secara tertulis kepada Direktur Jenderal Migas dengan melampirkan data perusahaan atau perseorangan, yang menunjukan bahwa perusahaan memiliki tenaga kerja termasuk tenaga teknik dalam jumlah yang cukup, memiliki peralatan kerja yang cukup, menguasai teknologi terkait, memiliki modal kerja yang cukup serta unjuk kerja performa perusahaan. Perusahaan atau perseorangan yang memenuhi kualifikasi akan mendapatkan SKT untuk jangka waktu 3 tahun.
5. Menurut Pedoman Tata Kerja (PTK) Satuan Kerja Khusus Pelaksana Kegiatan Hulu Migas (SKK Migas) No. 007, Revisi 3, Tingkat Komponen Dalam Negeri (TKDN) adalah besarnya komponen dalam negeri pada barang, jasa dan gabungan barang dan jasa, yang dinyatakan dalam persentase. Mengacu pada referensi tersebut, Komponen Dalam Negeri (KDN) dapat dikelompokan berdasarkan barang, jasa maupun gabungan keduanya.
1. The operation of oil and gas supporting business has the main objective to support the business of providing and using the goods and services of upstream business activities and downstream business activities (ESDM, 2008). Referring to the Minister of Energy and Mineral Resources No.27 year 2008, oil and gas supporting business can be done by companies or individuals, and divided into two main groups with several fields in it, namely Oil and Gas Supporting Services Business as well as Oil and Gas Industrial Supporting business.
2. Oil and Gas Supporting Services, consist of:- Line of Oil and Gas Construction Services.- Line of Oil and Gas Non-Construction Service.
3. Oil and gas industrial supporting business, consist of:- material industry;- equipment industry;- oil and gas utilization industry.
4. To be able in carrying out oil and gas supporting business activities, the company or individual must have a Certificate of Registration (SKT) by submitting written registeration to the Director General of Oil and Gas and enclosing the data of the company or individual, indicating that the company has manpower including technical personnel in sufficient quantities, having sufficient work equipment, mastering related technology, having sufficient working capital And performance performance of the company. Company or qualified individuals will get SKT for a period of 3 years.
5 According to the Working Procedures Manual (PTK) of the Upstream Oil and Gas Regulatory Working Units (SKK Migas). 007, Revision 3, Domestic Component Level (TKDN) is the amount of domestic components in the goods, services and combined goods and services, expressed as a percentage. Referring to these references, the Domestic Component (KDN) can be grouped by goods, services or combination of both.
PENJELASAN TEKNIS | Technical Notes
Direktorat Jenderal Minyak dan Gas BumiKementerian Energi dan Sumber Daya Mineral
56
STATISTIKMinyak dan Gas Bumi
2016
PENUNJANG | SUPPORTING
6. Menurut PTK SKK Migas Nomor 005 tahun 2011, tumpahan minyak adalah tumpahan minyak bumi atau hidrokarbon atau produk pengolahan minyak ke darat atau perairan, baik yang bersumber dan/atau berasal dari kegiatan usaha hulu migas dan/atau kegiatan lain.
7. SKK Migas, dalam PTK Nomor 005 tahun 2011, membuat suatu pedoman umum yang mengatur tata kerja kegiatan operasi penanggulangan tumpahan minyak di wilayah kerja kontraktor KKS Eksplorasi dan/atau Produksi, sebagai upaya kesiapsiagaan. Hal ini dilakukan sebagai respon diberlakukannya Undang-undang Nomor 32 tahun 2009, tentang Perlindungan dan Pengelolaan Lingkungan Hidup.
8. Berdasarkan Undang-undang Nomor 1 tahun 1970 tentang Keselamatan Kerja pada Sektor Pertambangan dan Peraturan Pemerintah Nomor 19 tahun 1973 tentang Pengaturan dan Pengawasan Keselamatan Kerja di Bidang Pertambangan, kecelakaan kerja pada kegiatan usaha migas dapat dibagi dalam 4 kelompok, yaitu:a. Ringan : Tidak menimbulkan kehilangan
hari kerja (dapat diatasi dengan pertolongan pertama/first aid).
b. Sedang : Kecelakaan yang menimbulkan kehilangan hari kerja (tidak mampu bekerja sementara) dan diduga tidak akan menimbulkan cacat jasmani dan atau rohani yang akan mengganggu tugas pekerjaannya.
c. Berat : Kecelakaan yang menimbulkan kehilangan hari kerja dan diduga akan menimbulkan cacat jasmani atau rohani yang akan mengganggu tugas dan pekerjaannya.
d. Meninggal/Fatal : Kecelakaan yang menimbulkan kematian segera atau dalam jangka waktu 24 jam setelah terjadinya kecelakaan.
6. According to PTK SKK Migas Number 005 of 2011, oil spills are oil or hydrocarbons or oil-processing products spills to land or water, whether sourced and/or derived from upstream oil and gas activities and/or other activities.
7. SKK Migas, in PTK No. 005 of 2011, draws up a general guidance governing the operation of oil spill response activities in the working areas of KKS Exploration and/or Production contractors, as an effort of preparedness. This is done in response to the enactment of Law No. 32 of 2009 on Environmental Protection and Management.
8. Under Law No. 1 of 1970 concerning Safety in the Mining Sector and Government Regulation No. 19 of 1973 concerning Regulation and Supervision of Occupational Safety in the Field of Mining, work accidents on oil and gas business activities can be divided into 4 groups:
a. Mild: Does not cause loss of workday (can be overcome with first aid).
b. Medium: Accidents that cause lost work days (unable to work temporarily) and allegedly will not cause physical and/or spiritual disability that will interfere with the work task.
c. Weight: Accidents that cause lost workdays and allegedly will cause physical or spiritual defects that will interfere with the task and work.
d. Death / Fatal: Accidents that cause death immediately or within 24 hours after the accident.
57Directorate General of Oil And GasMinistry of Energy and Mineral Resources
STATISTICSO i l a n d G a s
2016
PENUNJANG | SUPPORTING
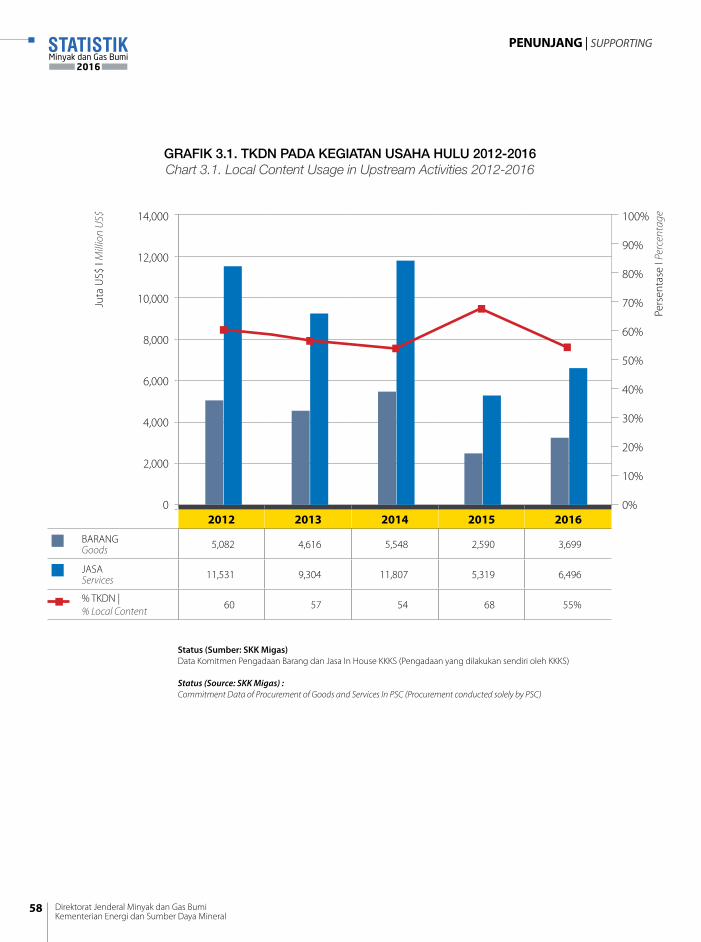
GRAFIK 3.1. TKDN PADA KEGIATAN USAHA HULU 2012-2016 Chart 3.1. Local Content Usage in Upstream Activities 2012-2016
2012 2013 2014 2015 2016
BARANGGoods 5,082 4,616 5,548 2,590 3,699
JASA Services 11,531 9,304 11,807 5,319 6,496
% TKDN | % Local Content
60 57 54 68 55%
14,000
12,000
10,000
8,000
6,000
4,000
2,000
0
Juta
US$
I M
illio
n U
S$
Status (Sumber: SKK Migas) Data Komitmen Pengadaan Barang dan Jasa In House KKKS (Pengadaan yang dilakukan sendiri oleh KKKS)
Status (Source: SKK Migas) :Commitment Data of Procurement of Goods and Services In PSC (Procurement conducted solely by PSC)
100%
90%
80%
70%
60%
50%
40%
30%
20%
10%
0%
Pers
enta
se I
Perc
enta
ge
Direktorat Jenderal Minyak dan Gas BumiKementerian Energi dan Sumber Daya Mineral
58
STATISTIKMinyak dan Gas Bumi
2016
PENUNJANG | SUPPORTING
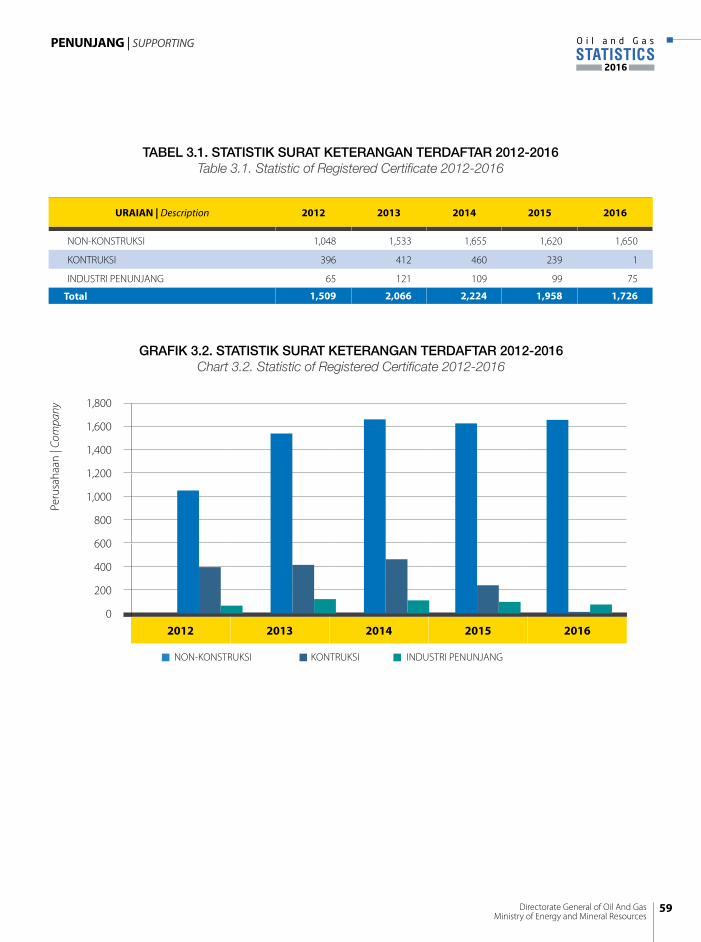
URAIAN | Description 2012 2013 2014 2015 2016
NON-KONSTRUKSI 1,048 1,533 1,655 1,620 1,650
KONTRUKSI 396 412 460 239 1
INDUSTRI PENUNJANG 65 121 109 99 75
Total 1,509 2,066 2,224 1,958 1,726
TABEL 3.1. STATISTIK SURAT KETERANGAN TERDAFTAR 2012-2016Table 3.1. Statistic of Registered Certificate 2012-2016
GRAFIK 3.2. STATISTIK SURAT KETERANGAN TERDAFTAR 2012-2016Chart 3.2. Statistic of Registered Certificate 2012-2016
2012 2013 2014 2015 2016
NON-KONSTRUKSI KONTRUKSI INDUSTRI PENUNJANG
1,800
1,600
1,400
1,200
1,000
800
600
400
200
0
Peru
saha
an |
Com
pany
59Directorate General of Oil And GasMinistry of Energy and Mineral Resources
STATISTICSO i l a n d G a s
2016
PENUNJANG | SUPPORTING

URAIAN | Description 2012 2013 2014 2015 2016
Hulu | Upstream 197.60 2,071.37 46.70 91.38 549.87
Hilir | Downstream 0.16 0.00 0.00 784.00 0.00
Total (Barrels) 197.76 2,071.37 46.70 875.38 549.87
TABEL 3.2. TUMPAHAN MINYAK 2012-2016Table 3.2. Oil Spill 2012-2016
GRAFIK 3.3. TUMPAHAN MINYAK 2012-2016Chart 3.3. Statistic of Oil Spill 2012-2016
2012 2013 2014 2015 2016
2,500.00
2,000.00
1,500.00
1,000.00
500.00
0.00
Bar
rels
Direktorat Jenderal Minyak dan Gas BumiKementerian Energi dan Sumber Daya Mineral
60
STATISTIKMinyak dan Gas Bumi
2016
PENUNJANG | SUPPORTING
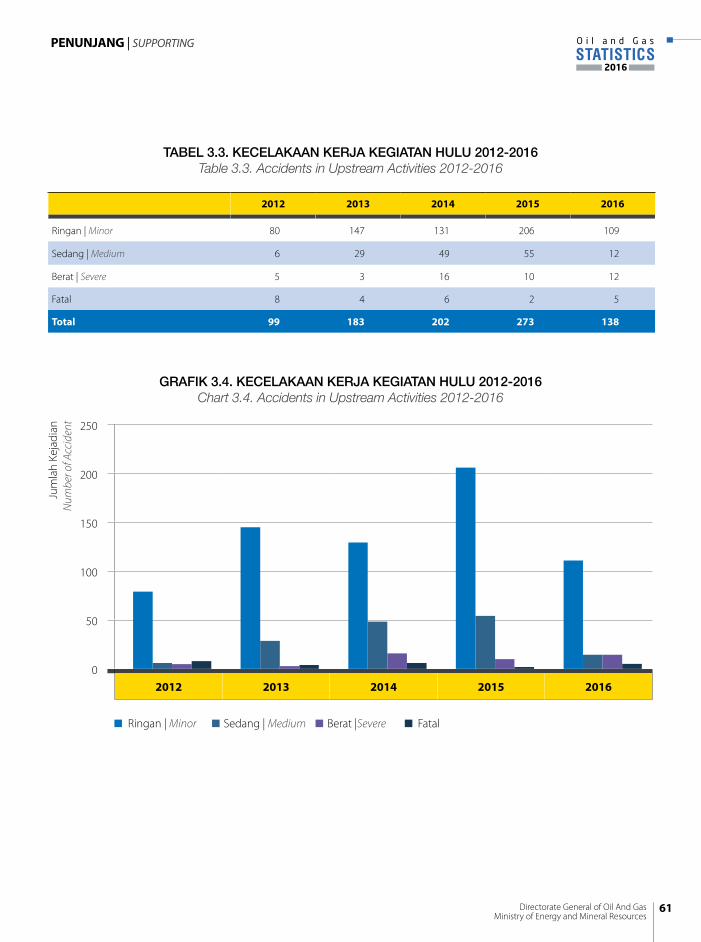
TABEL 3.3. KECELAKAAN KERJA KEGIATAN HULU 2012-2016Table 3.3. Accidents in Upstream Activities 2012-2016
2012 2013 2014 2015 2016
Ringan | Minor 80 147 131 206 109
Sedang | Medium 6 29 49 55 12
Berat | Severe 5 3 16 10 12
Fatal 8 4 6 2 5
Total 99 183 202 273 138
2012 2013 2014 2015 2016
250
200
150
100
50
0
Jum
lah
Keja
dian
Num
ber o
f Acc
iden
t
Ringan | Minor Sedang | Medium Berat |Severe Fatal
GRAFIK 3.4. KECELAKAAN KERJA KEGIATAN HULU 2012-2016Chart 3.4. Accidents in Upstream Activities 2012-2016
61Directorate General of Oil And GasMinistry of Energy and Mineral Resources
STATISTICSO i l a n d G a s
2016
PENUNJANG | SUPPORTING
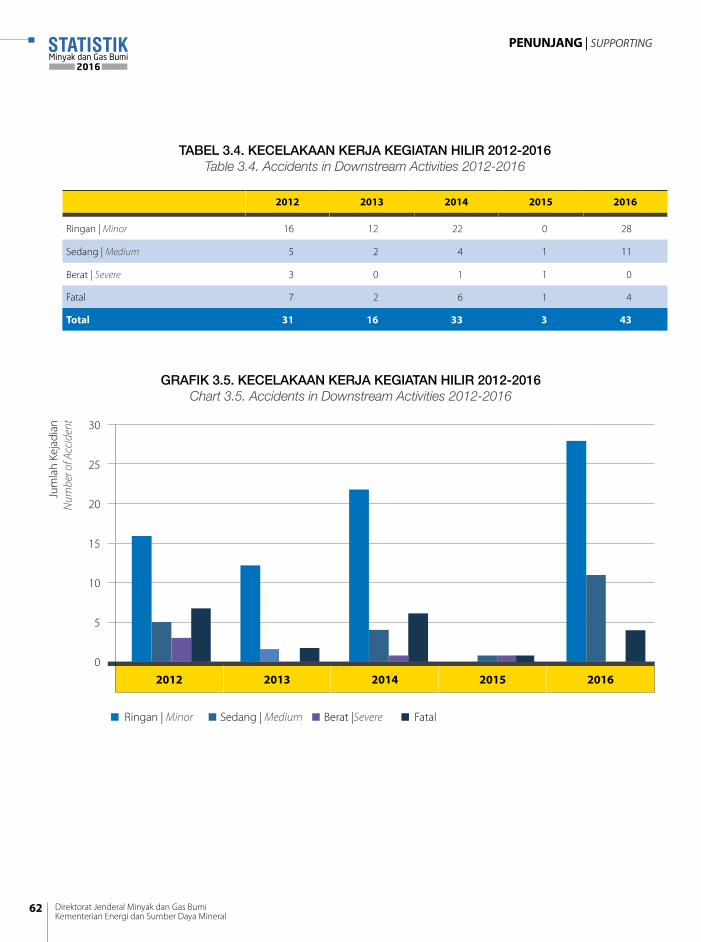
TABEL 3.4. KECELAKAAN KERJA KEGIATAN HILIR 2012-2016Table 3.4. Accidents in Downstream Activities 2012-2016
2012 2013 2014 2015 2016
Ringan | Minor 16 12 22 0 28
Sedang | Medium 5 2 4 1 11
Berat | Severe 3 0 1 1 0
Fatal 7 2 6 1 4
Total 31 16 33 3 43
2012 2013 2014 2015 2016
30
25
20
15
10
5
0
Jum
lah
Keja
dian
Num
ber o
f Acc
iden
t
Ringan | Minor Sedang | Medium Berat |Severe Fatal
GRAFIK 3.5. KECELAKAAN KERJA KEGIATAN HILIR 2012-2016Chart 3.5. Accidents in Downstream Activities 2012-2016
Direktorat Jenderal Minyak dan Gas BumiKementerian Energi dan Sumber Daya Mineral
62
STATISTIKMinyak dan Gas Bumi
2016
PENUNJANG | SUPPORTING
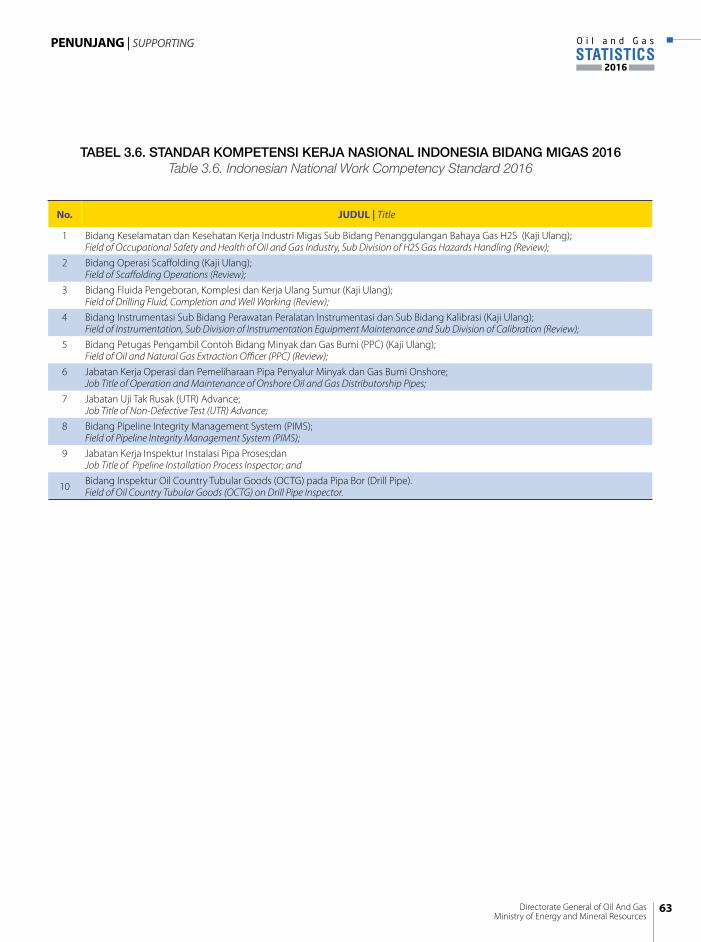
No. JUDUL | Title
1 Bidang Keselamatan dan Kesehatan Kerja Industri Migas Sub Bidang Penanggulangan Bahaya Gas H2S (Kaji Ulang);Field of Occupational Safety and Health of Oil and Gas Industry, Sub Division of H2S Gas Hazards Handling (Review);
2 Bidang Operasi Scaffolding (Kaji Ulang);Field of Scaffolding Operations (Review);
3 Bidang Fluida Pengeboran, Komplesi dan Kerja Ulang Sumur (Kaji Ulang);Field of Drilling Fluid, Completion and Well Working (Review);
4 Bidang Instrumentasi Sub Bidang Perawatan Peralatan Instrumentasi dan Sub Bidang Kalibrasi (Kaji Ulang);Field of Instrumentation, Sub Division of Instrumentation Equipment Maintenance and Sub Division of Calibration (Review);
5 Bidang Petugas Pengambil Contoh Bidang Minyak dan Gas Bumi (PPC) (Kaji Ulang); Field of Oil and Natural Gas Extraction Officer (PPC) (Review);
6 Jabatan Kerja Operasi dan Pemeliharaan Pipa Penyalur Minyak dan Gas Bumi Onshore; Job Title of Operation and Maintenance of Onshore Oil and Gas Distributorship Pipes;
7 Jabatan Uji Tak Rusak (UTR) Advance; Job Title of Non-Defective Test (UTR) Advance;
8 Bidang Pipeline Integrity Management System (PIMS); Field of Pipeline Integrity Management System (PIMS);
9 Jabatan Kerja Inspektur Instalasi Pipa Proses;dan Job Title of Pipeline Installation Process Inspector; and
10 Bidang Inspektur Oil Country Tubular Goods (OCTG) pada Pipa Bor (Drill Pipe). Field of Oil Country Tubular Goods (OCTG) on Drill Pipe Inspector.
TABEL 3.6. STANDAR KOMPETENSI KERJA NASIONAL INDONESIA BIDANG MIGAS 2016Table 3.6. Indonesian National Work Competency Standard 2016
Translate belum
63Directorate General of Oil And GasMinistry of Energy and Mineral Resources
STATISTICSO i l a n d G a s
2016
PENUNJANG | SUPPORTING
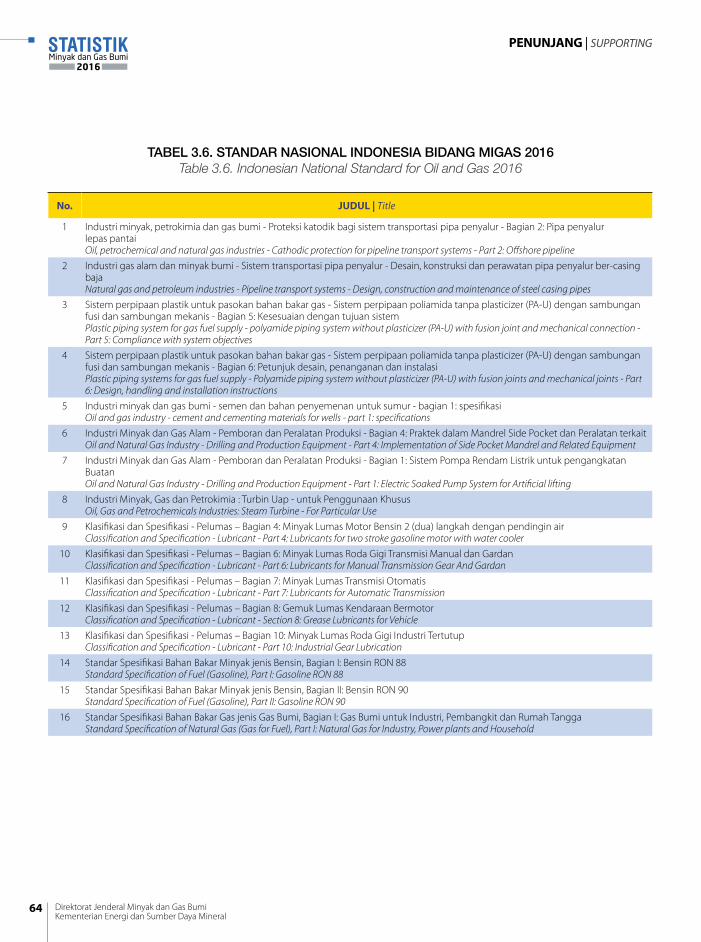
No. JUDUL | Title
1 Industri minyak, petrokimia dan gas bumi - Proteksi katodik bagi sistem transportasi pipa penyalur - Bagian 2: Pipa penyalur lepas pantai Oil, petrochemical and natural gas industries - Cathodic protection for pipeline transport systems - Part 2: Offshore pipeline
2 Industri gas alam dan minyak bumi - Sistem transportasi pipa penyalur - Desain, konstruksi dan perawatan pipa penyalur ber-casing baja Natural gas and petroleum industries - Pipeline transport systems - Design, construction and maintenance of steel casing pipes
3 Sistem perpipaan plastik untuk pasokan bahan bakar gas - Sistem perpipaan poliamida tanpa plasticizer (PA-U) dengan sambungan fusi dan sambungan mekanis - Bagian 5: Kesesuaian dengan tujuan sistem Plastic piping system for gas fuel supply - polyamide piping system without plasticizer (PA-U) with fusion joint and mechanical connection - Part 5: Compliance with system objectives
4 Sistem perpipaan plastik untuk pasokan bahan bakar gas - Sistem perpipaan poliamida tanpa plasticizer (PA-U) dengan sambungan fusi dan sambungan mekanis - Bagian 6: Petunjuk desain, penanganan dan instalasi Plastic piping systems for gas fuel supply - Polyamide piping system without plasticizer (PA-U) with fusion joints and mechanical joints - Part 6: Design, handling and installation instructions
5 Industri minyak dan gas bumi - semen dan bahan penyemenan untuk sumur - bagian 1: spesifikasi Oil and gas industry - cement and cementing materials for wells - part 1: specifications
6 Industri Minyak dan Gas Alam - Pemboran dan Peralatan Produksi - Bagian 4: Praktek dalam Mandrel Side Pocket dan Peralatan terkait Oil and Natural Gas Industry - Drilling and Production Equipment - Part 4: Implementation of Side Pocket Mandrel and Related Equipment
7 Industri Minyak dan Gas Alam - Pemboran dan Peralatan Produksi - Bagian 1: Sistem Pompa Rendam Listrik untuk pengangkatan Buatan Oil and Natural Gas Industry - Drilling and Production Equipment - Part 1: Electric Soaked Pump System for Artificial lifting
8 Industri Minyak, Gas dan Petrokimia : Turbin Uap - untuk Penggunaan Khusus Oil, Gas and Petrochemicals Industries: Steam Turbine - For Particular Use
9 Klasifikasi dan Spesifikasi - Pelumas – Bagian 4: Minyak Lumas Motor Bensin 2 (dua) langkah dengan pendingin air Classification and Specification - Lubricant - Part 4: Lubricants for two stroke gasoline motor with water cooler
10 Klasifikasi dan Spesifikasi - Pelumas – Bagian 6: Minyak Lumas Roda Gigi Transmisi Manual dan Gardan Classification and Specification - Lubricant - Part 6: Lubricants for Manual Transmission Gear And Gardan
11 Klasifikasi dan Spesifikasi - Pelumas – Bagian 7: Minyak Lumas Transmisi Otomatis Classification and Specification - Lubricant - Part 7: Lubricants for Automatic Transmission
12 Klasifikasi dan Spesifikasi - Pelumas – Bagian 8: Gemuk Lumas Kendaraan Bermotor Classification and Specification - Lubricant - Section 8: Grease Lubricants for Vehicle
13 Klasifikasi dan Spesifikasi - Pelumas – Bagian 10: Minyak Lumas Roda Gigi Industri Tertutup Classification and Specification - Lubricant - Part 10: Industrial Gear Lubrication
14 Standar Spesifikasi Bahan Bakar Minyak jenis Bensin, Bagian I: Bensin RON 88 Standard Specification of Fuel (Gasoline), Part I: Gasoline RON 88
15 Standar Spesifikasi Bahan Bakar Minyak jenis Bensin, Bagian II: Bensin RON 90 Standard Specification of Fuel (Gasoline), Part II: Gasoline RON 90
16 Standar Spesifikasi Bahan Bakar Gas jenis Gas Bumi, Bagian I: Gas Bumi untuk Industri, Pembangkit dan Rumah Tangga Standard Specification of Natural Gas (Gas for Fuel), Part I: Natural Gas for Industry, Power plants and Household
TABEL 3.6. STANDAR NASIONAL INDONESIA BIDANG MIGAS 2016Table 3.6. Indonesian National Standard for Oil and Gas 2016
Translate belum
Direktorat Jenderal Minyak dan Gas BumiKementerian Energi dan Sumber Daya Mineral
64
STATISTIKMinyak dan Gas Bumi
2016
PENUNJANG | SUPPORTING
STATISTIKMinyak dan Gas Bumi
2016
STATISTICSO i l a n d G a s
2016
PETA TEMATIKTHEMATIC MAP
Direktorat Jenderal Minyak dan Gas BumiKementerian Energi dan Sumber Daya Mineral
Directorate General of Oil And GasMinistry of Energy and Mineral Resources
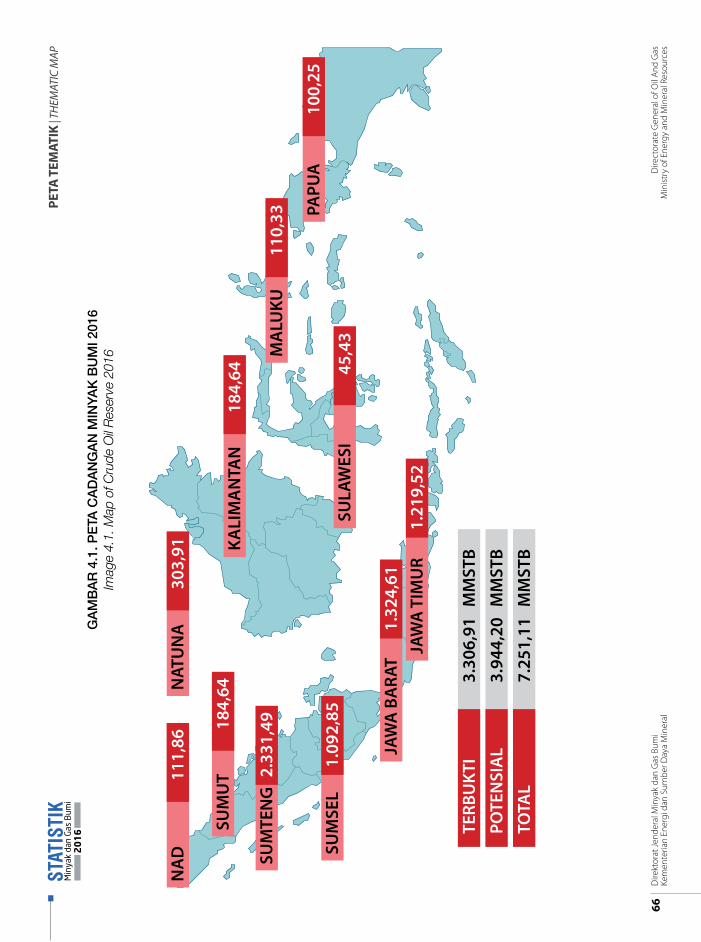
GA
MB
AR
4.1
. PE
TA C
AD
AN
GA
N M
INYA
K B
UM
I 201
6Im
age
4.1.
Map
of C
rude
Oil
Res
erve
201
6
Reko
men
dasi
Baha
n Ki
mia
Akr
ab L
ingk
unga
n
Pena
nggu
lang
anPe
ncem
aran
Pros
es P
rodu
ksi
1O
SD 4Ba
han
Kim
ia u
ntuk
Hyd
rote
st
Koor
dina
siKe
rja
SPBE
/SPP
BEBL
HSu
raba
ya
Dire
ktor
at Je
nder
alM
inya
k da
n G
as B
umi
Pert
amin
a
UKL
/UPL
K3LL
Sosi
alis
asi
Pera
tura
n
Mon
itori
ngA
ir &
Gas
NA
D11
1,86
SUM
UT
184,
64
SUM
TEN
G2.
331,
49
SUM
SEL
1.09
2,85
NAT
UN
A30
3,91 KA
LIM
AN
TAN
184,
64
SULA
WES
I45
,43
JAW
A B
ARA
T1.
324,
61JA
WA
TIM
UR
1.21
9,52
MA
LUKU
110,
33 PAPU
A10
0,25
TERB
UKT
I3.
306,
91M
MST
B
POTE
NSI
AL
3.94
4,20
MM
STB
TOTA
L7.
251,
11M
MST
B
Gam
bar C
adan
gan
Min
yak
Bum
i (St
atus
1.1
.201
6)
Dire
ktor
at Je
nder
al M
inya
k da
n G
as B
umi
Kem
ente
rian
Ener
gi d
an S
umbe
r Day
a M
iner
al66
Dire
ctor
ate
Gen
eral
of O
il An
d G
asM
inist
ry o
f Ene
rgy
and
Min
eral
Res
ourc
es
STAT
ISTI
KM
iny
ak d
an G
as B
um
i2016
PETA
TEM
ATIK
| TH
EMAT
IC M
AP
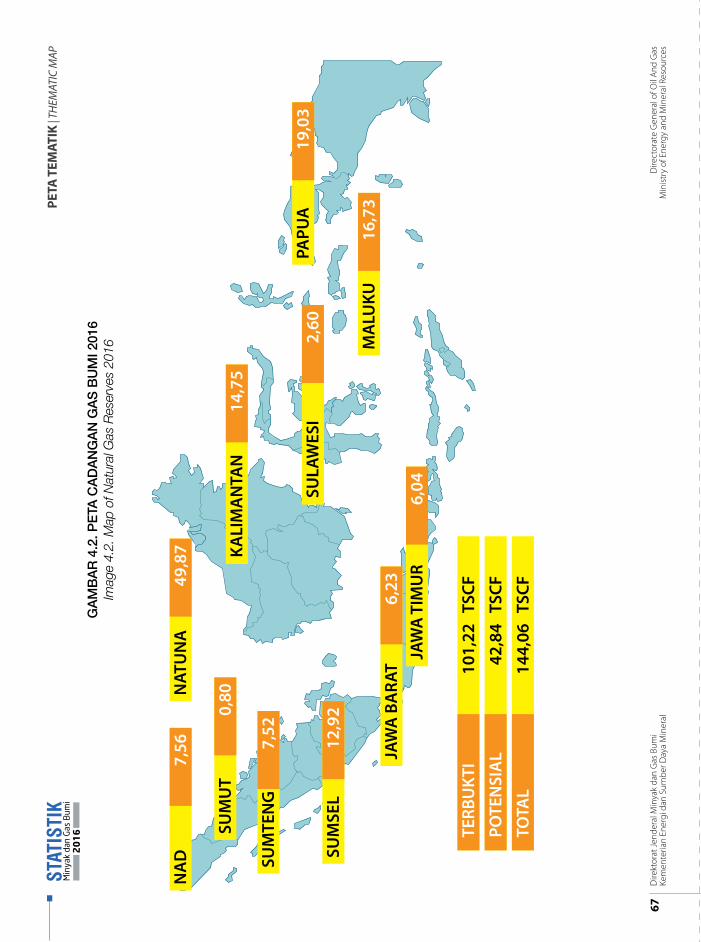
GA
MB
AR
4.2
. PE
TA C
AD
AN
GA
N G
AS
BU
MI 2
016
Imag
e 4.
2. M
ap o
f Nat
ural
Gas
Res
erve
s 20
16
NA
D7,
56
SUM
UT
0,80
SUM
TEN
G7,
52
SUM
SEL
12,9
2
NAT
UN
A49
,87 KA
LIM
AN
TAN
14,7
5
SULA
WES
I2,
60
JAW
A B
ARA
T6,
23JA
WA
TIM
UR
6,04
MA
LUKU
16,7
3
PAPU
A19
,03
TERB
UKT
I10
1,22
TSCF
POTE
NSI
AL
42,8
4TS
CF
TOTA
L14
4,06
TSCF
Gam
bar C
adan
gan
Gas
Bum
i (St
atus
1.1
.201
6)
Perm
ohon
anPe
man
faat
an G
aske
MES
DM
Perm
ohon
an K
KKS
ke S
KK M
igas
SKK
Mig
asm
engi
rim
sur
atke
MES
DM
Eval
uasi
ole
h D
itjen
Mig
as b
ersa
ma
SKK
Mig
as
Setu
ju/ T
idak
Pers
etuj
uan
Alo
kasi
oleh
MES
DM
Prio
rita
s:1.
Tra
nspo
rtas
i & R
T2.
Lift
ing
Mig
as3.
Pup
uk4.
Indu
stri
Ber
basi
s G
as B
umi
5. L
istr
ik6.
Indu
stri
Beb
ahan
Bak
ar G
as
Kele
ngka
pan
doku
men
eva
luas
iol
eh p
emoh
on
Gam
bar T
ata
Cara
Pen
gaju
an A
loka
si G
as B
umi (
sesu
ai d
enga
n Pe
rmen
06/
2016
)
bers
ama
SKK
Mig
as
Tida
k
Ya
Dire
ktor
at Je
nder
al M
inya
k da
n G
as B
umi
Kem
ente
rian
Ener
gi d
an S
umbe
r Day
a M
iner
al67
Dire
ctor
ate
Gen
eral
of O
il An
d G
asM
inist
ry o
f Ene
rgy
and
Min
eral
Res
ourc
es
STAT
ISTI
KM
iny
ak d
an G
as B
um
i2016
PETA
TEM
ATIK
| TH
EMAT
IC M
AP
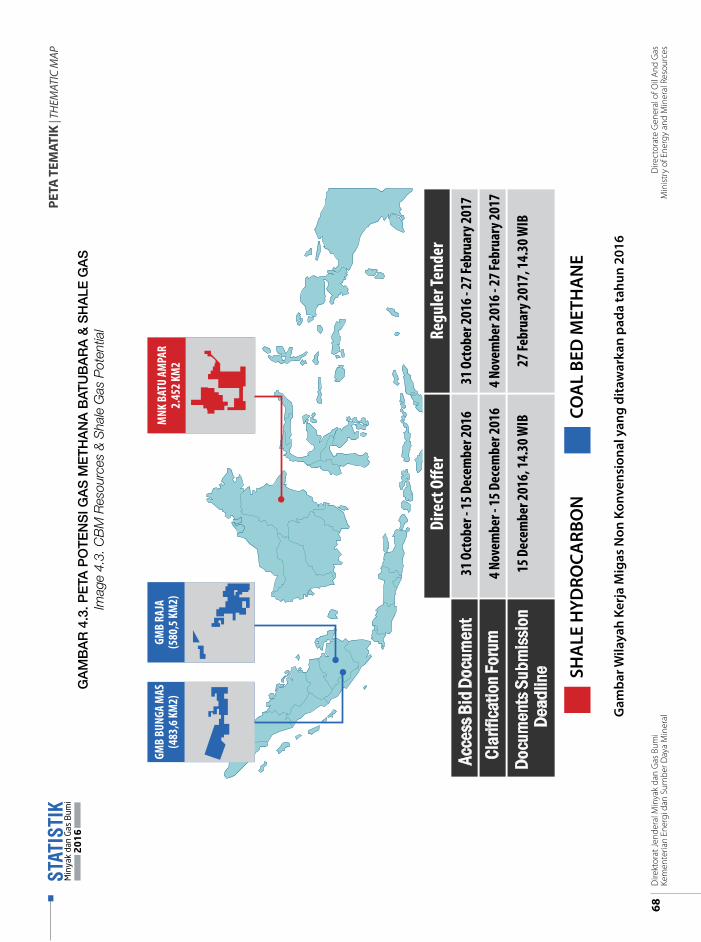
GA
MB
AR
4.3
. PE
TA P
OTE
NS
I GA
S M
ETH
AN
A B
ATU
BA
RA
& S
HA
LE G
AS
Imag
e 4.
3. C
BM
Res
ourc
es &
Sha
le G
as P
oten
tial
Gam
bar W
ilaya
h Ke
rja
Mig
as N
on K
onve
nsio
nal y
ang
dita
war
kan
pada
tahu
n 20
16
SHA
LE H
YDRO
CARB
ON
COA
L BE
D M
ETH
AN
E
Dire
ct O
�er
31 O
ctob
er - 1
5 Dec
embe
r 201
6
4 Nov
embe
r - 15
Dec
embe
r 201
6
15 D
ecem
ber 2
016,
14.3
0 WIB
Regu
ler T
ende
r
31 O
ctob
er 20
16 - 2
7 Feb
ruar
y 201
7
4 Nov
embe
r 201
6 - 27
Febr
uary
2017
27 Fe
brua
ry 20
17, 1
4.30
WIB
Acce
ss B
id D
ocum
ent
Clar
ifica
tion F
orum
Dead
line
Docu
men
ts S
ubm
issio
n
GMB
RAJA
(580
,5 K
M2)
GMB
BUNG
A M
AS(4
83,6
KM
2)M
NK B
ATU
AMPA
R2.
452 K
M2
BELU
M(B
ELU
M N
GER
TI IS
I DAT
AN
YA)
Dire
ktor
at Je
nder
al M
inya
k da
n G
as B
umi
Kem
ente
rian
Ener
gi d
an S
umbe
r Day
a M
iner
al68
Dire
ctor
ate
Gen
eral
of O
il An
d G
asM
inist
ry o
f Ene
rgy
and
Min
eral
Res
ourc
es
STAT
ISTI
KM
iny
ak d
an G
as B
um
i2016
PETA
TEM
ATIK
| TH
EMAT
IC M
AP
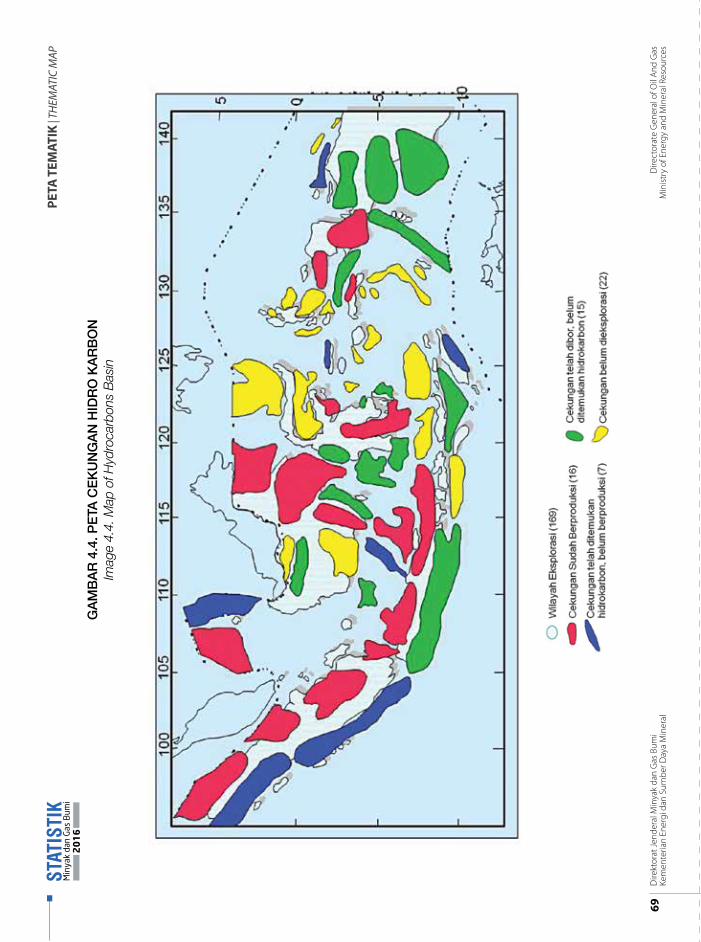
GA
MB
AR
4.4
. PE
TA C
EK
UN
GA
N H
IDR
O K
AR
BO
NIm
age
4.4.
Map
of H
ydro
carb
ons
Bas
in
Dire
ktor
at Je
nder
al M
inya
k da
n G
as B
umi
Kem
ente
rian
Ener
gi d
an S
umbe
r Day
a M
iner
al69
Dire
ctor
ate
Gen
eral
of O
il An
d G
asM
inist
ry o
f Ene
rgy
and
Min
eral
Res
ourc
es
STAT
ISTI
KM
iny
ak d
an G
as B
um
i2016
PETA
TEM
ATIK
| TH
EMAT
IC M
AP
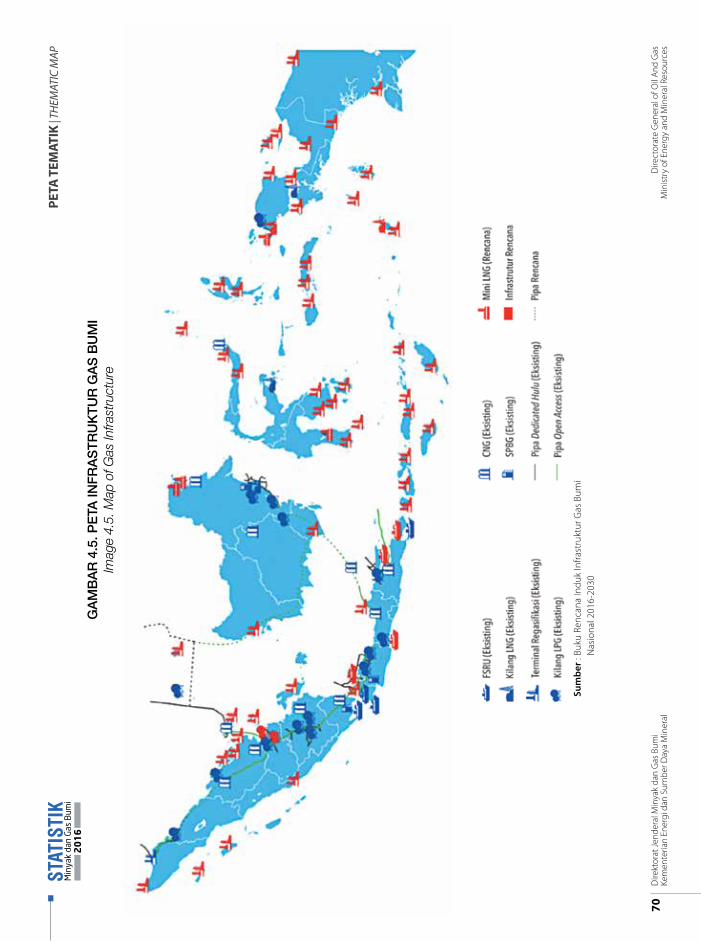
Sum
ber :
Buk
u Re
ncan
a In
duk
Infra
stru
ktur
Gas
Bum
i
Nas
iona
l 201
6-20
30
GA
MB
AR
4.5
. PE
TA IN
FRA
STR
UK
TUR
GA
S B
UM
IIm
age
4.5.
Map
of G
as In
frast
ruct
ure
Dire
ktor
at Je
nder
al M
inya
k da
n G
as B
umi
Kem
ente
rian
Ener
gi d
an S
umbe
r Day
a M
iner
al70
Dire
ctor
ate
Gen
eral
of O
il An
d G
asM
inist
ry o
f Ene
rgy
and
Min
eral
Res
ourc
es
STAT
ISTI
KM
iny
ak d
an G
as B
um
i2016
PETA
TEM
ATIK
| TH
EMAT
IC M
AP
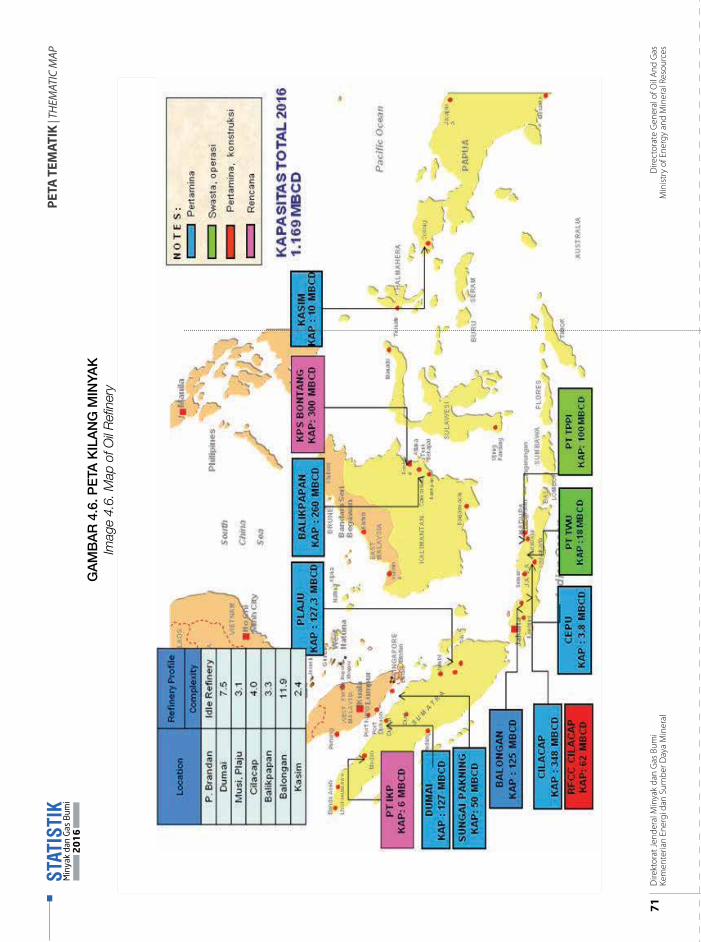
GA
MB
AR
4.6
. PE
TA K
ILA
NG
MIN
YAK
Imag
e 4.
6. M
ap o
f Oil
Refi
nery
Dire
ktor
at Je
nder
al M
inya
k da
n G
as B
umi
Kem
ente
rian
Ener
gi d
an S
umbe
r Day
a M
iner
al71
Dire
ctor
ate
Gen
eral
of O
il An
d G
asM
inist
ry o
f Ene
rgy
and
Min
eral
Res
ourc
es
STAT
ISTI
KM
iny
ak d
an G
as B
um
i2016
PETA
TEM
ATIK
| TH
EMAT
IC M
AP
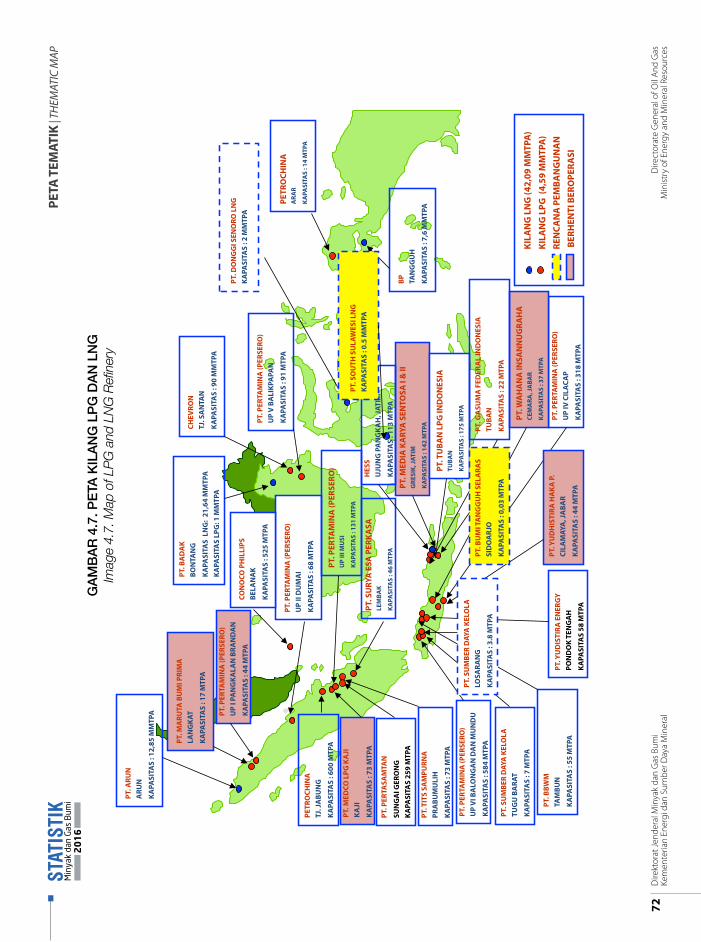
GA
MB
AR
4.7
. PE
TA K
ILA
NG
LP
G D
AN
LN
G
Imag
e 4.
7. M
ap o
f LP
G a
nd L
NG
Refi
nery
Dire
ktor
at Je
nder
al M
inya
k da
n G
as B
umi
Kem
ente
rian
Ener
gi d
an S
umbe
r Day
a M
iner
al72
Dire
ctor
ate
Gen
eral
of O
il An
d G
asM
inist
ry o
f Ene
rgy
and
Min
eral
Res
ourc
es
STAT
ISTI
KM
iny
ak d
an G
as B
um
i2016
PETA
TEM
ATIK
| TH
EMAT
IC M
AP
73Directorate General of Oil And GasMinistry of Energy and Mineral Resources
STATISTICSO i l a n d G a s
2016
PETA TEMATIK | THEMATIC MAP
STATISTIKMinyak dan Gas Bumi
2016
STATISTICSO i l a n d G a s
2016
Direktorat Jenderal Minyak dan Gas BumiKementerian Energi dan Sumber Daya Mineral
Directorate General of Oil And GasMinistry of Energy and Mineral Resources
DAFTAR ISTILAH DAN LAMPIRANGlossarium and Appendices
Minyak Bumi (Crude Oil):Campuran berbagai hidrokarbon yang terdapat dalam fase cair dalam reservoir di bawah permukaan tanah dan yang tetap cair pada tekanan atmosfer setelah melalui fasilitas pemisah di atas permukaanThe compounds of hydrocarbon in liquid phase in underground reservoir and will keep in the form of liquid in atmosphere pressure after passing through the separator facility above the ground
Kondensat (Condensate):1. Hidrokarbon yang pada tekanan dan suhu reservoir berupa
gas tetapi menjadi cair sewaktu diproduksikan Hydrocarbon in the form of gas under the reservoir pressure and
temperature which turns into liquid in production phase2. Produk cair yang keluar dari pengembunan The liquid product from the condensation3. Campuran hidrokarbon ringan yang dihasilkan sebagai
produk cair pada unit daur ulang gas dengan cara ekspansi dan pendinginan
The compound of light hydrocarbon as liquid product in gas recycle through expansion and cooling
Gas Bumi (Natural Gas):1. Semua jenis hidrokarbon berupa gas yang dihasilkan dari
sumur; mencakup gas tambang basah, gas kering, gas pipa selubung, gas residu setelah ekstraksi hidrokarbon cair dan gas basah, dan gas nonhidrokarbon yang tercampur di dalamnya secara alamiah.
All hydrocarbons in the form of gas produced in reservoir; including wet mining gas, dry gas, sheath gas, residual gas after the extraction of liquid hydrocarbon and wet gas, and non-hydrocarbon gas mixed naturally
2. Campuran gas dan uap hidrokarbon yang terjadi secara alamiah yang komponen terpentingnya ialah metana, etana, propana, butana, pentana dan heksana.
Mix of hydrocarbon gas and steam naturally in which its main components are methane, ethane, propane, butane, pentane and hexane.
Barel (Barrel):Satuan ukur volume cairan yang biasa dipakai dalam perminyakan; satu barel kira-kira 159 literThe measurement of liquid volume in petroleum; one barrel is equivalent to 159 liter
Setara Barel Minyak (Barrel Oil Equivalent):Satuan energi yang besarnya sama dengan kandungan energi dalam satu barel minyak bumi (biasanya diperhitungkan 6.0-6.3 juta BTU/barel)The energy measurement equivalent to energy in one barrel of oil (approximately 6.0 to 6.3 million BTU/barrel)
Barel Minyak per Hari (Barrel Oil per Day):Jumlah barel minyak per hari yang diproduksi oleh sumur, lapangan, atau perusahaan minyakThe volume of barrel oil per day produced in well, field or oil company
Kaki Kubik (Cubic Feet):Satuan pengukuran volume gas yang dirumuskan dalam satuan area terhadap panjangThe measurement of gas volume in area to length unit
British thermal unit:Satuan panas yang besarnya 1/180 dari panas yang diperlukan untuk menaikkan suhu satu pon (0,4536 kg) air dari 32 derajat Fahrenheit (0 derajat Celcius) menjadi 212 derajat Fahrenheit (100 derajat Celcius) pada ketinggian permukaan laut;biasanya dianggap sama dengan jumlah panas yang diperlukan untuk menaikkan suhu satu pon air dari 630F (17,20C) menjadi 640F (17,80C)Unit of heat of 1/180 from the heat needed to increase the temperature of 1 pound of water (0.4536 kg) from 32 degree Fahrenheit (0 degree Celsius) into 212 degree Fahrenheit (100 degree Celsius) in sea level height; usually it is the same with the heat needed to increase the temperature of 1 pound of water from 63 degree Fahrenheit (17.2 degree Celsius) into 64 degree Fahrenheit (17.8 degree Celsius)
MMBTU (Million Metric British Thermal Unit):Satuan panas yang dinyatakan dalam juta BTU (British Termal Unit, yaitu panas yang dibutuhkan untuk menaikkan suhu satu pon air satu derajat Fahrenheit)The heat in million BTU (British Termal Unit: the heat needed to increase the temperature of one pound of water into one degree of Fahrenheit
Gas Metana Batubara (Coal Bed Methane):Gas bumi (hidrokarbon) yang komponen utama methan terjadi secara alami dalam proses pembentukan batubara dan terperangkap di dalam endapan batubaraHydrocarbon in which the main component of methane formed naturally in coal formulation process and trapped in coal sediment
Serpih (Shale):Batuan sedimen lempung, memiliki ciri bidang perlapisan yang mudah dibelah karena orientasi partikel mineral lempung yang sejajar dengan bidang perlapisan;tidak membentuk massa yang plastis jika basahClay sediment with the characteristic of easy to be parted since clay mineral particle is parallel with layer; it does not form elastic mass in wet condition
Kilang Minyak (Refinery Oil):Instalasi industri untuk mengolah minyak bumi menjadi produk yang lebih berguna dan dapat diperdagangkanThe industry installation to process oil into products to be marketed
Gas Kilang (Refinery Gas):Berbagai jenis gas yang dihasilkan dari penyulingan dan berbahai proses pengilangan; umumnya terdiri atas hidrokarbon C1 sampai dengan C4Gas from distillation and refining process; generally consisted of hydrocarbon C
1 to C
4
75Directorate General of Oil And GasMinistry of Energy and Mineral Resources
STATISTICSO i l a n d G a s
2016
LPG/Elpiji (Liquefied Petroleum Gas):Gas hidrokarbon yang dicairkan dengan tekanan untuk memudahkan penyimpanan, pengangkutan, dan penanganannya; pada dasarnya terdiri atas propana, butana, atau campuran keduanyaPressured liquefied hydrocarbon gas to ease the storage, transportation, and management; consisted of propane, butane or mix of both
LNG (Liquefied Natural Gas):Gas yang terutama terdiri atas metana yang dicairkan pada suhu sangat rendah (-1600 C) dan dipertahankan dalam keadaan cair untuk mempermudah transportasi dan penimbunanGas from liquefied methane in very low temperature (-160o C) and kept in liquid to ease the transportation and storage.
Eksplorasi (exploration):Penyelidikan dan penjajakan daerah yang diperkirakan mengandung mineral berharga dengan jalan survei geologi, survei geofisik, atau pengeboran dengan tujuan menemukan deposit dan mengetahui luas wilayahnyaThe study and exploration on area predicted to have mineral resources through geological survey, geophysics survey, or drilling to discover deposit or to find out the area
Eksploitasi (Exploitation):Pengusahaan sumber migas dengan tujuan menghasilkan manfaat ekonomisThe exploitation of oil and gas resources to discover the economic benefit
Kontraktor Kontrak Kerja Sama / KKKS (Contractor of Production Sharing Contract):Badan usaha atau bentuk usaha tetap yang diberikan kewenangan dalam melaksanakan kegiatan eksplorasi dan eksploitasi pada suatu wilayah kerja migas berdasarkan kontrak kerja sama dengan pemerintahBusiness entity or permanent business establishment with the authority to conduct exploration and exploitation in oil and gas working area based on cooperation contract with the government
Wilayah Kerja (Working Area):Daerah tertentu dalam wilayah hukum pertambangan Indonesia untuk pelaksanaan eksplorasi dan eksploitasi sumber daya alam, termasuk kegiatan hulu migasArea located in Indonesia mining legal territory for natural resources exploration and exploitation, including the oil and gas upstream activity
Cadangan (Reserve):Jumlah minyak atau gas yang ditemukan di dalam batuan reservoirThe quantity of oil and gas in reservoir
Metode Seismik (Seismic Method):Metode eksplorasi untuk memperkirakan bentuk, jenis, dan ketebalan lapisan-lapisan batuan bawah permukaan dengan cara mempelajari penjalaran gelombang getarThe exploration method to predict the form, type and thickness of underground rock layers by studying the vibration wave spread
Pengeboran (Drilling):Kegiatan pembuatan lubang sumur dengan alat bor untuk mencari, mengeluarkan, atau memasukkan fluida formasiThe activity of making well holes with drilling tool to discover, extract or inject fluid formation
Avgas (Aviation Gasoline):Bensin khusus untuk motor torak pesawat terbang yang nilai oktana dan stabilitasnya tinggi, titik bekunya rendah, serta trayek sulingnya lebih datarSpecial gasoline for airplane piston engine with high octane and stability, low freezing point, and flatter distillation route
Avtur (Aviation Turbine Fuel):Bahan bakar untuk pesawat terbang turbin gas;jenis kerosin yang trayek didihnya berkisar antara 1500C-2500CFuel for airplane with gas turbine; type of kerosene with boiling route point between 150oC to 250oC
Bensin (Gasoline):Hasil pengilangan minyak yang mempunyai trayek didih 300C-2200C yang cocok untuk digunakan sebagai bahan bakar motor berbusi (motor bensin)Oil refining with boiling point of 30oC to 220oC that is suitable for plugged engine fuel (gasoline engine)
RON (Research Octane Number):Angka yang ditentukan dengan mesin penguji CFR F1 pada kecepatan 600 putaran per menit;pedoman mutu antiketuk bensin pada kondisi kecepatan rendah atau beban ringanThe number derived from CFR F1 with the speed of 600 spins per minute; quality standard of anti-knock engine in the condition with low speed or light load
Minyak Tanah (Kerosene):Minyak yang lebih berat dari fraksi bensin dan mempunyai berat jenis antara 0,79 dan 0,83 pada 60 derajat Fahrenheit;dipakai untuk lampu atau komporHeavy oil with higher fraction compared to gasoline with the density between 0.79 and 0.83 in 60o Fahrenheit; used for lamp or stove
Minyak Solar (Higher Speed Diesel/Automotive Diesel Oil):Jenis bahan bakar minyak untuk mesin diesel putaran tinggiOil fuel for diesel engine with high spin
Direktorat Jenderal Minyak dan Gas BumiKementerian Energi dan Sumber Daya Mineral
76
STATISTIKMinyak dan Gas Bumi
2016
Minyak Diesel (Diesel Fuel/Industrial Diesel Oil/Marine Diesel Fuel):Minyak yang digunakan sebagai bahan bakar mesin diesel dan jenis mesin industri (mesin kapal) yang mempunyai kecepatan putar rendah atau sedangOil for diesel engine fuel and industrial engine (ship engine) with low or medium spin
Minyak Bakar (Fuel Oil/Intermediate Fuel Oil/Marine Fuel Oil):Sulingan berat, residu atau campuran keduanya yang dipergunakan sebagai bahan bakar untuk menghasilkan panas atau tenagaHeavy distillation, residual, or mix of both used as fuel to produce heat or power
Minyak Bakar Berat (Heavy Fuel Oil/Residual Fuel Oil):Residu kental atau minyak bumi tercampung yang digunakan sebagai bahan bakarViscous residue or mixed oil as fuel
Lube Base Oil:Senyawa hidrokarbon yang dihasilkan dari proses distilasi vakum residu panjang; digunakan sebagai bahan baku minyak pelumas berbagai jenis permesinan baik berat maupun ringanHydrocarbon compounds from distillation process of long residue vacuum; used as raw material of lubricants for heavy and medium weight engine
Aspal (Asphalt):Campuran antara bitumen dan zat mineral lembam yang terjadi secara alamiah atau buatan; di Indonesia dikenal aspal Buton, yakni aspal alam yang digali dan diproduksi di pulau Buton, Sulawesi TenggaraA mix of bitumen and mineral substance naturally or artificially; in Indonesia, it is commonly known as Buton asphalt, natural asphalt produced in Buton Island, South East Sulawesi
Parafin (Paraffin):Hidrokarbon jenuh dengan rantai terbukaSaturated hydrocarbon with open chain
Nafta (Naptha):Sulingan minyak bumi ringan dengan titik didih akhir yang tidak melebihi 2200CDistilled light oil with the boiling point less than 220oC
LSWR (Low Sulphur Waxy Residue):Residu berlilin dengan kadar belerang rendah yang diperoleh dari penyulingan atmosferik minyak bumi, misalnya residu minyak Minas dari SumateraWaxed residue with low sulphur derived from oil atmospheric distillation, for example Minas oil residue from Sumatera
LSFO (Low Sulphur Fuel Oil):Minyak bakar berat dengan tingkat kandungan sulfur kurang dari 1%Heavy burning oil with the content of sulphur less than 1%
HSFO (Heavy Sulphur Fuel Oil):Minyak bakar berat dengan tingkat kandungan sulfur 1% atau lebihHeavy burning oil with the content of sulphur of 1% or more
Kokas Hijau (Green Coke):produk karbonisasi padat primer yang diperoleh dari pendidihan tingkat tinggi fraksi hidrokarbon pada suhu di bawah 900KProduct of primary solid carbonization from high boiling of hydrocarbon fraction in the temperature below 900K
Pelarut (Solvent):zat, biasanya berbentuk cairan yang mampu menyerap atau melarutkan zat cair, gas, atau benda padat, dan membentuk campuran homogenSubstance, usually in the form of liquid that is able to absorb or dissolve liquid, gas, or solid substance and to form homogeneous mix
SPBx (Special Boiling Point-X):Pelarut memiliki komposisi senyawa hidrocarbon Aliphatic, Naphtenic, dan sedikit senyawa AromaticSolvent with hydrocarbon compounds Aliphatic
Laws (Low Aromatic White Spirit):Pelarut yang terbentuk dari senyawa hidrokarbon, antara lain adalah parrafin, cycloparafin/naftenik, dan aromaticSolvent from hydrocarbon compounds, such as parrafin, cycloparafin/naftenik, and aromatic
Smooth Fluid 05:Fraksi dari minyak hidrokarbon yang digunakan sebagai komponen utama Oil Based Mud yang memiliki karakteristik yang baik dan juga ramah lingkungan.Fraction from hydrocarbon as the main component of Oil Based Mud with good characteristic and environmentally friendly
Lumpur Dasar-Minyak (Oil Base Mud):Lumpur pengeboran dengan padatan lempung yang teraduk di dalam minyak yang dicampur dengan satu sampai dengan 5% air;digunakan dalam pengeboran formasi tertentu yang mungkin sukar atau mahal apabila dibor dengan menggunakan lumpur berdasar airDrilling mud with clay solid mixed in oil with 1% to 5 % water component; used in particular formation drilling that is difficult or expensive to be drilled with watered mud
HAP (Hydrocarbon Aerosol Propellants):Propellant ramah lingkungan, dengan bahan dasar dari hidrokarbon murni yang berfungsi sebagai pendorong produk aerosol dari dalam kemasan sehingga produk dapat keluar dalam bentuk kabut. HAP merupakan hasil blending hidrokarbon fraksi ringan yang diformulasikan menjadi produk propellant dengan spesifikasi disesuaikan kebutuhan di industri pengguna
77Directorate General of Oil And GasMinistry of Energy and Mineral Resources
STATISTICSO i l a n d G a s
2016
An environmentally friendly propellant with the basic component of pure hydrocarbon functioned as the booster of aerosol product from inside the package so that the product can be released in the form of fog. HAP is the result of light fraction hydrocarbon blending that is formulated into propellant product with the specification adjusted to the industry demand
Pertasol:Fraksi nafta ringan yang terbentuk dari senyawa aliphatic (paraffin dan cycloparaffin / naphtanic) dan kandungan aromatic hydrocarbon yang rendahLight naphtha fraction from aliphatic compounds (paraffin and cycloparaffin/naphtanic) and low hydrocarbon aromatic compound
HOMC (High Octane Mogas Component):Senyawa hidrokarbon yang mempunyai angka oktana tinggi. Umumnya dari jenis hidrokarbon aromatik dan olefin;digunakan sebagai bahan campuran untuk mendapatkan kinerja bahan bakar bensin yang baikHydrocarbon compound with high octane. It is generally from aromatic and olefin hydrocarbon; used as mixture to obtain good gasoline fuel performance
Propilena (Propylene):Senyawa hidrokarbon yang berbentuk gas pada suhu dan tekanan normal;untuk mempermudah penyimpanan dan handling-nya, diberikan tekanan tertentu untuk mengubahnya ke dalam bentuk cair; digunakan sebagai bahan baku pembuatan polipropilena.Hydrocarbon compound formed from gas in normal temperature and pressure; used to ease the storage and handling; it is given with particular pressure to change it into liquid; used as raw material of polypropylene
Sulfur (Sulphur):Elemen kimia non-metal yang memiliki dua bentuk kristal, yaitu alpha sulphur rombic dan beta sulphur monoclinic. Kedua elemen tersebut memiliki warna kuning, tidak dapat larut dalam air, agak larut dalam alkohol dan ether, larut dalam karbon disulfide, karbon tetraklorida dan benzeneNon-metal chemical element with two crystal form namely alpha sulphur rombic and beta sulphur monoclinic. Both elements are yellow, insoluble in water, soluble in alcohol and ether, soluble in carbon disulfide, tetrachloride carbon and benzene
Minarex:Jenis minyak proses yang digunakan sebagai bahan baku pembuatan industri ban, industri barang jadi karet (tali kipas, suku cadang kendaraan), maupun industri tinta cetak dan sebagai plasticizer / extender pada industri kompon PVC.Processed oil used as raw material of tire industry, rubber industry (fan belt, vehicle spare part), print out ink industry and plasticizer/extender in PVC industry
Musicool:Refrigerant hidrokarbon yang ramah lingkungan; dapat digunakan pada semua jenis Mesin Pendingin, kecuali pada
mesin jenis SentrifugalEnvironmentally friendly hydrocarbon refrigerant used in all type of cooling engine, except centrifugal engine
Marine Gas Oil:Minyak bakar yang dirancang untuk digunakandi semua jenis mesin dieselringan; memiliki kandungan sulfur maksimum10mg/kg.Burning oil designed in all light diesel engines with maximum sulphur of 10 mg/kg
Unconverted oil:Bahan baku pembuatan pelumas sintetik kualitas tinggiRaw material of high quality synthetic lubricants
Minyak Dekantasi (Decanted Oil):Aliran dasar menara distilasi dari unit perenfkahan katalitik alir setelah dipisahkan dari katalisMain stream of distillation tower from flow catalytic cracking after separated from catalyst
Lilin (wax):Hidrokarbon padat yang mempunyai titik cair rendah dan tidak mudah larut; terdapat dalam minyak bumi, terutama yang bersifat parafinik dan dapat dikeluarkan dari minyak dengan proses ekstraksi larutanSolid hydrocarbon with low melting point and difficult to dissolve; found in oil with paraffinic and able to be released from oil with liquid extraction process
Lilin Lunak (Slack Wax):Lilin yang masih banyak mengandung minyak; diperoleh dengan cara penyaringan bertekanan dari distilat parafinik yang banyak mengandung lilinWax with oil component; derived from pressured filtration of paraffinic distillate with wax
Bitumen:1 Bagian bahan organik dalam batuan sedimen yang dapat
larut dalam pelarut organik Organic substance with sediment rocks that is soluble in organic
solvent2 Bahan organik padat atau setengah padat yang berwarna
hitam atau coklat tua yang diperoleh sebagai residu dari distilasi vakum minyak bumi; meleleh jika dipanasi dan dapat larut dalam pelarut organik
Solid or medium-solid organic substance in black or dark brown color derived as residue from oil vacuum distillation; melting if heated and soluble in organic solvent
Solvent Solphy II:pelarut hidrokarbon yang merupakan salah satu bahan/produk yang bersifat ramah lingkungan dan menjadi alternatif pengganti Bahan Perusak Ozon (BPO)Hydrocarbon solvent as one of environmentally friendly products and can be an alternative of BPO
Direktorat Jenderal Minyak dan Gas BumiKementerian Energi dan Sumber Daya Mineral
78
STATISTIKMinyak dan Gas Bumi
2016

Perkiraan faktor konversiApproximate conversion factors
Minyak Mentah | Crude oil*
*Based on worldwide average gravity.
From To
tonnes (metric) kilolitres barrels US
gallonstonnes
per year
Multiply by
Tonnes (metric)KilolitresBarrelsUS gallonsBarrels per day
10.85810.1364
0.00325–
1.1651
0.1590.0038
–
I7.336.2898
10.0238
–
307.86264.17
421–
––––
49.8
Produk | Products
From To convert
barrelsto tonnes
tonnesto barrels
kilolitresto tonnes
tonnesto kilolitres
Multiply by
Liquefied petroleum gas (LPG)GasolineKeroseneGas oil/dieselResidual fuel oilProduct basket
0.0860.1180.1280.1330.1490.125
11.68.57.87.56.78.0
0.5420.7400.8060.8390.9390.786
1.8441.3511.2401.1921.0651.272
Gas Alam (NG) Gas Alam Cair (LNG) | Natural Gas (NG) and Liquefied Natural Gas (LNG)
From To
billion cubicmetres NG
billion cubicfeet NG
million tonnesoil equivalent
million tonnesLNG
trillion Britishthermal units
million barrelsoil equivalent
Multiply by
1 billion cubic metres NG
1 billion cubic feet NG
1 million tonnes oil equivalent
1 million tonnes LNG
1 trillion British thermal units
1 million barrels oil equivalent
1
0.028
1.11
1.36
0.028
0.15
35.3
1
39.2
48.0
0.99
5.35
0.90
0.025
1
1.22
0.025
0.14
0.74
0.021
0.82
1
0.021
0.11
35.7
1.01
39.7
48.6
1
5.41
6.60
0.19
7.33
8.97
0.18
1
Units
1 metric tonne = 2204.62lb = 1.1023 short tons1 kilolitre = 6.2898 barrels = 1 cubic metre1 kilocalorie (kcal) = 4.187kJ = 3.968Btu1 kilojoule (kJ) = 0.239kcal = 0.948Btu1 British thermal = 0.252kcal unit (Btu) = 1.055kJ1 kilowatt-hour (kWh) = 860kcal = 3600kJ = 3412Btu
Calorific equivalents
One tonne of oil equivalent equals approximately:
Heat units 10 million kilocalories 42 gigajoules 40 million British thermal unitsSolid fuels 1.5 tonnes of hard coal 3 tonnes of ligniteGaseous fuels See Natural gas and liquefied natural gas tableElectricity 12 megawatt-hours
One million tonnes of oil or oil equivalent producesabout 4400 gigawatt-hours (= 4.4 terawatt-hours)of electricity in a modern power station.
1 barrel of ethanol = 0.57 barrel of oil1 barrel of biodiesel = 0.88 barrel of oil
79Directorate General of Oil And GasMinistry of Energy and Mineral Resources
STATISTICSO i l a n d G a s
2016