Embed Size (px)
Citation preview
ICE (LS) Gasoil Markets Forum
Oil futures forward curves:
economics explained
www.pjk-international.com
www.enfx.net
Oil futures forward curves
• ir. Patrick Kulsen, MSc. B.
Mail: [email protected]
Tel: +31-(0)76-7676 325
• Managing Director @ PJK International B.V.
• PJK International:
‘Market research company specialized in NWE oil markets’
– ARA / Rhine barge freight rates
– ARA oil product stocks
– Market analysis reports
– Consultancy & Quant research
– Freight Control App
Contents
1. Forward curves in focus
2. Economics of forward curves
3. Relevance of ARA gasoil stocks for ICE gasoil forward curve
4. ICE gasoil & Brent forward curves: analysis of recent
developments
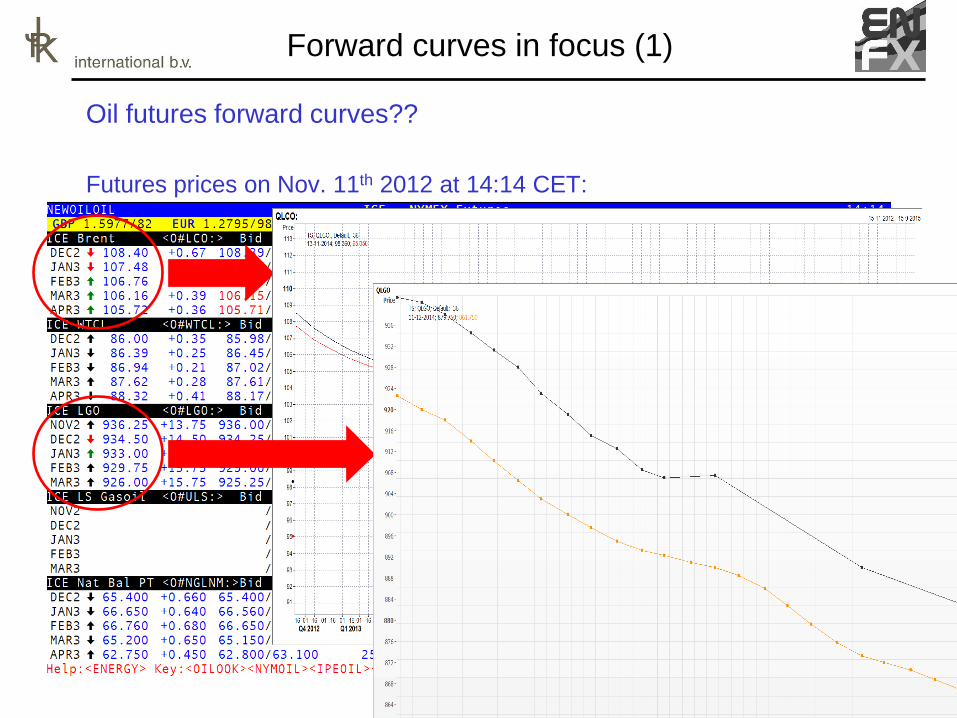
Forward curves in focus (1)
Oil futures forward curves??
Futures prices on Nov. 11th 2012 at 14:14 CET:
Forward curves in focus (2)
What do we know about forward curves….
….. and why is this important?
• Relevance for various market players
• Stylized facts of oil forward curves
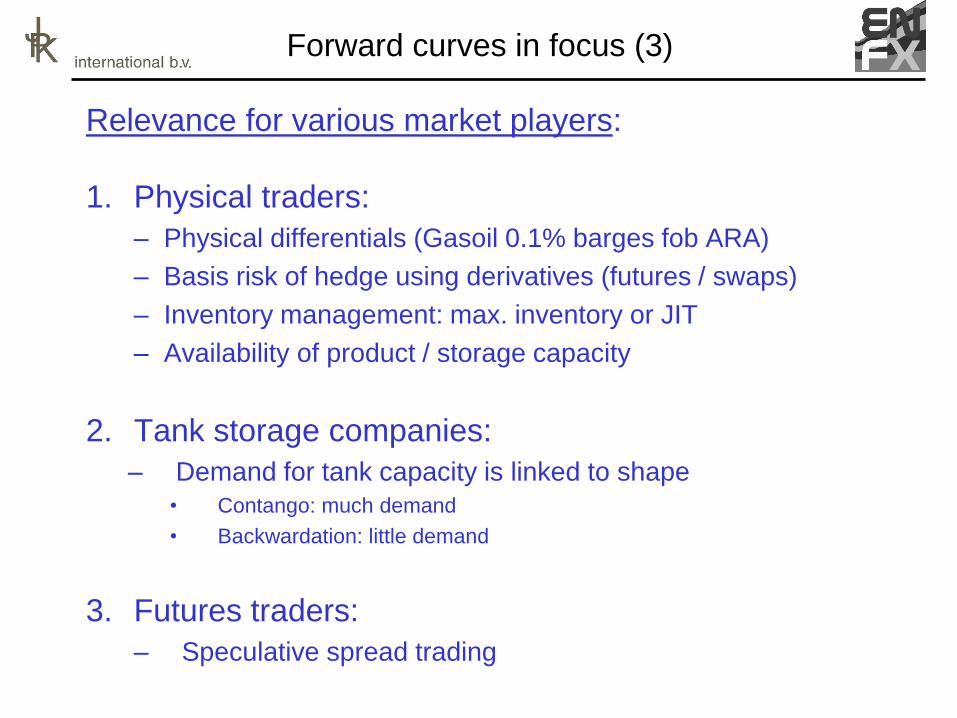
Forward curves in focus (3)
Relevance for various market players:
1. Physical traders:
– Physical differentials (Gasoil 0.1% barges fob ARA)
– Basis risk of hedge using derivatives (futures / swaps)
– Inventory management: max. inventory or JIT
– Availability of product / storage capacity
2. Tank storage companies:
– Demand for tank capacity is linked to shape
• Contango: much demand
• Backwardation: little demand
3. Futures traders:
– Speculative spread trading
Forward curves in focus (4)
Stylized facts of oil forward curves:
Most important:
1. Shape of curve:
– Upwards sloping (contango) or
– Downwards sloping (backwardation)
2. Shape is persistent and fairly independent of daily
swings in futures prices
3. Crude and oil products forward curves are linked
Forward curves in focus (5)
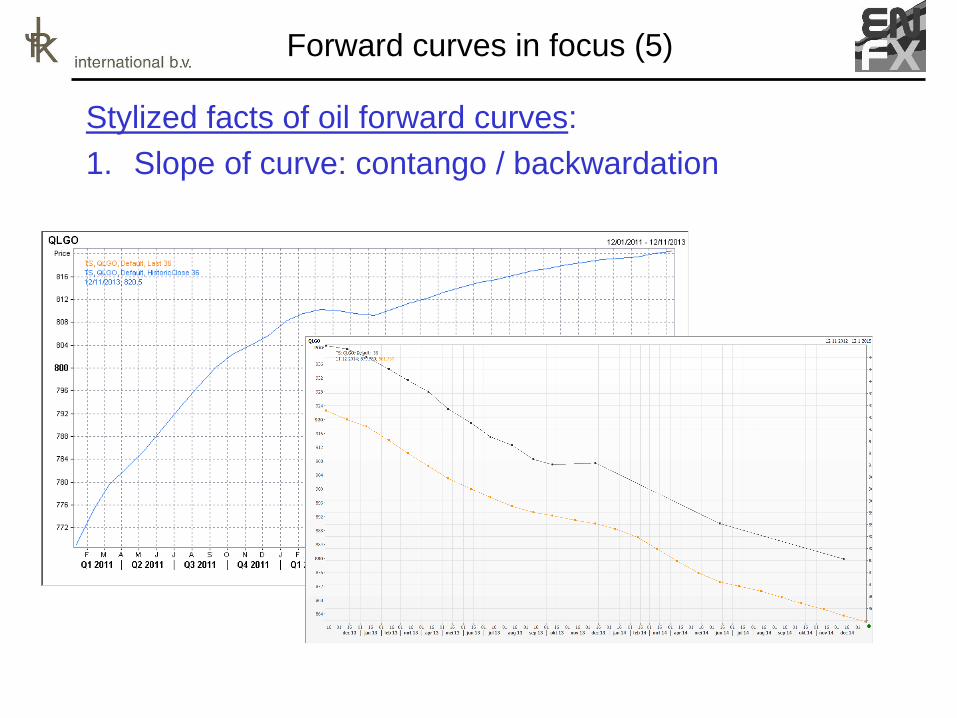
Stylized facts of oil forward curves:
1. Slope of curve: contango / backwardation
Forward curves in focus (6)
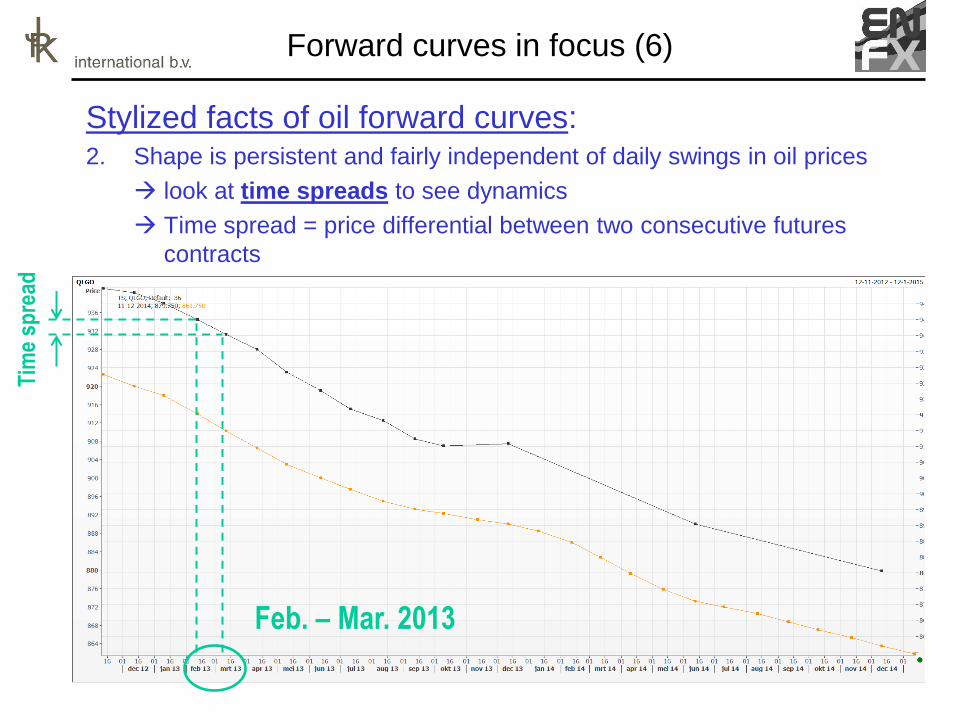
Stylized facts of oil forward curves: 2. Shape is persistent and fairly independent of daily swings in oil prices
look at time spreads to see dynamics
Time spread = price differential between two consecutive futures
contracts
Tim
e sp
read
Feb. – Mar. 2013
Forward curves in focus (7)
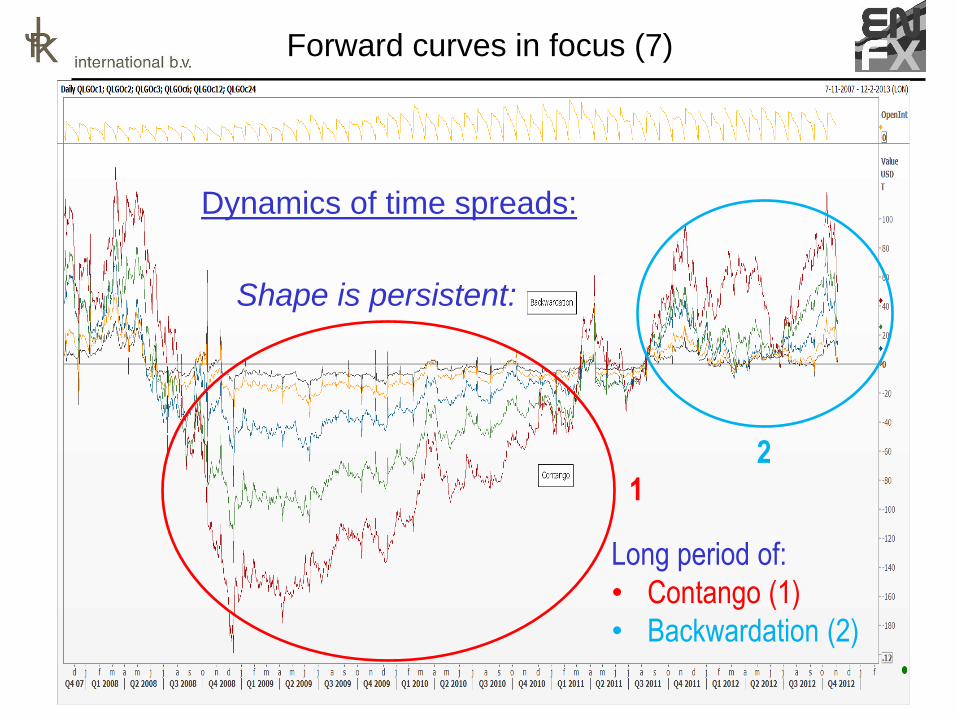
Dynamics of time spreads:
Shape is persistent:
Long period of:
• Contango (1)
• Backwardation (2)
1 2
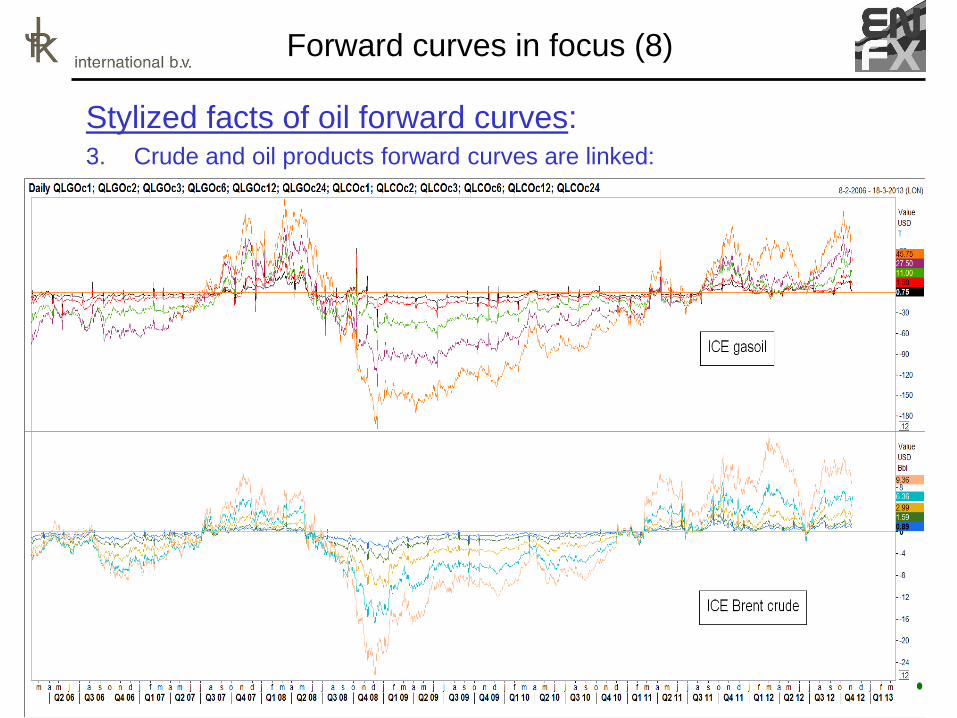
Forward curves in focus (8)
Stylized facts of oil forward curves: 3. Crude and oil products forward curves are linked:
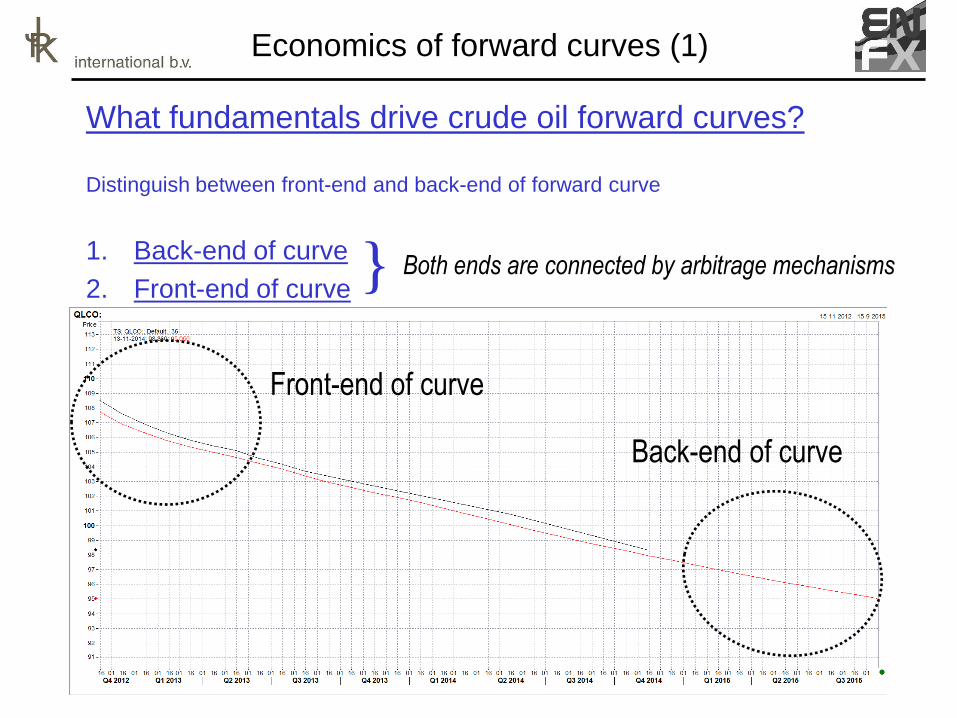
Economics of forward curves (1)
What fundamentals drive crude oil forward curves?
Distinguish between front-end and back-end of forward curve
1. Back-end of curve
2. Front-end of curve
Front-end of curve
Back-end of curve
} Both ends are connected by arbitrage mechanisms
Economics of forward curves (2)
What fundamentals drive crude oil forward curves?
1. Back-end of curve long term fundamentals
Supply side of crude market
Price to justify investments/divestments in exploration and
development of oil wells
Demand side of crude market
Price to justify investment/divestment programs for
• developing alternative fuels
• increasing fuel efficiency
• Etc..
Price = expected marginal ‘exploration, development and
production’ costs to balance market in the “long run”
Economics of forward curves (3)
What fundamentals drive crude oil forward curves?
2. Front-end of curve short term fundamentals
– Current and expected supply and demand
– Current and expected inventory levels
If supply > demand: price drops to stimulate players to
increase inventories to balance market
If demand > supply: price rises to stimulate players to free up
inventories and/or lower or postpone consumption to an extent
that the market is balanced
Economics of forward curves (4)
Arbitrage mechanisms connect front and back end of curve
Storage arbitrage play
Prevents time spreads from becoming too large
Links futures prices along the curve
Economics of forward curves (5)
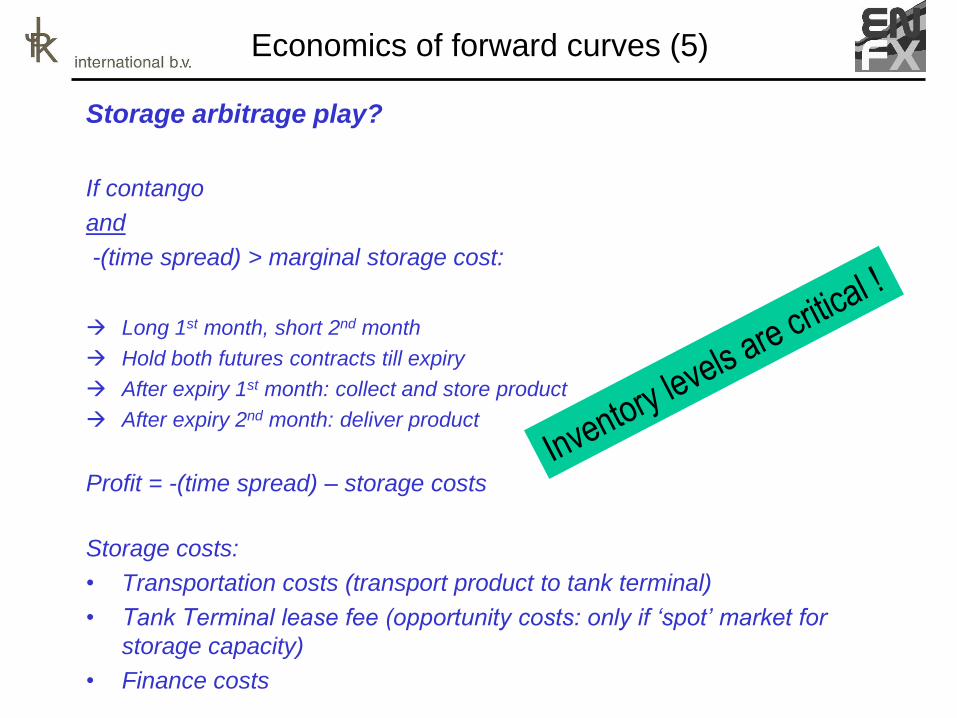
Storage arbitrage play?
If contango
and
-(time spread) > marginal storage cost:
Long 1st month, short 2nd month
Hold both futures contracts till expiry
After expiry 1st month: collect and store product
After expiry 2nd month: deliver product
Profit = -(time spread) – storage costs
Storage costs:
• Transportation costs (transport product to tank terminal)
• Tank Terminal lease fee (opportunity costs: only if ‘spot’ market for
storage capacity)
• Finance costs
Economics of forward curves (6)
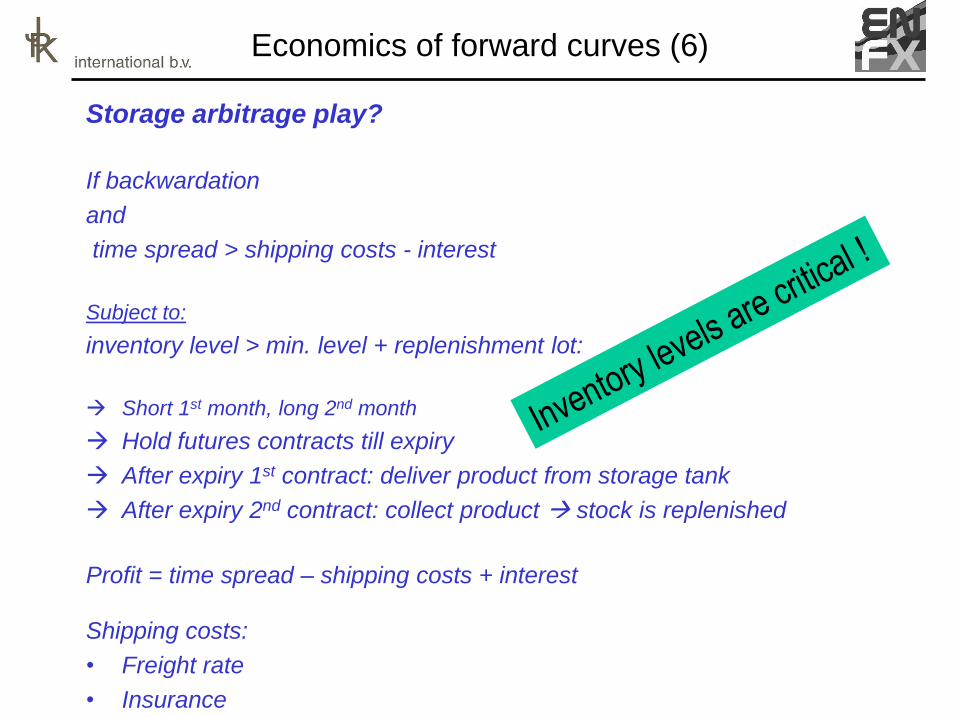
Storage arbitrage play?
If backwardation
and
time spread > shipping costs - interest
Subject to:
inventory level > min. level + replenishment lot:
Short 1st month, long 2nd month
Hold futures contracts till expiry
After expiry 1st contract: deliver product from storage tank
After expiry 2nd contract: collect product stock is replenished
Profit = time spread – shipping costs + interest
Shipping costs:
• Freight rate
• Insurance
Economics of forward curves (7)
Link crude oil & oil products forward curves?
Crude oil is feedstock for refineries to produce oil products
Most important input cost!
Difference between oil product price and crude price:
“Crack spread”
Proportional to refiner’s gross profit margin
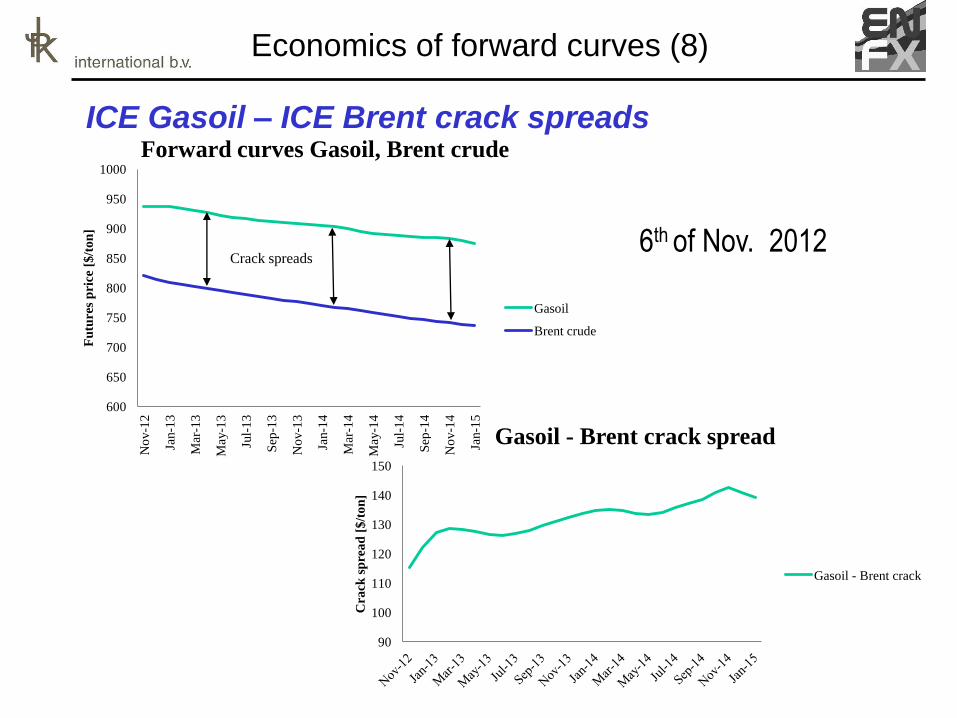
Economics of forward curves (8)
ICE Gasoil – ICE Brent crack spreads
600
650
700
750
800
850
900
950
1000
No
v-1
2
Jan-1
3
Mar
-13
May
-13
Jul-
13
Sep
-13
No
v-1
3
Jan-1
4
Mar
-14
May
-14
Jul-
14
Sep
-14
No
v-1
4
Jan-1
5
Fu
ture
s p
rice
[$
/to
n]
Forward curves Gasoil, Brent crude
Gasoil
Brent crude
Crack spreads
90
100
110
120
130
140
150
Cra
ck s
pre
ad
[$
/to
n]
Gasoil - Brent crack spread
Gasoil - Brent crack
6th of Nov. 2012
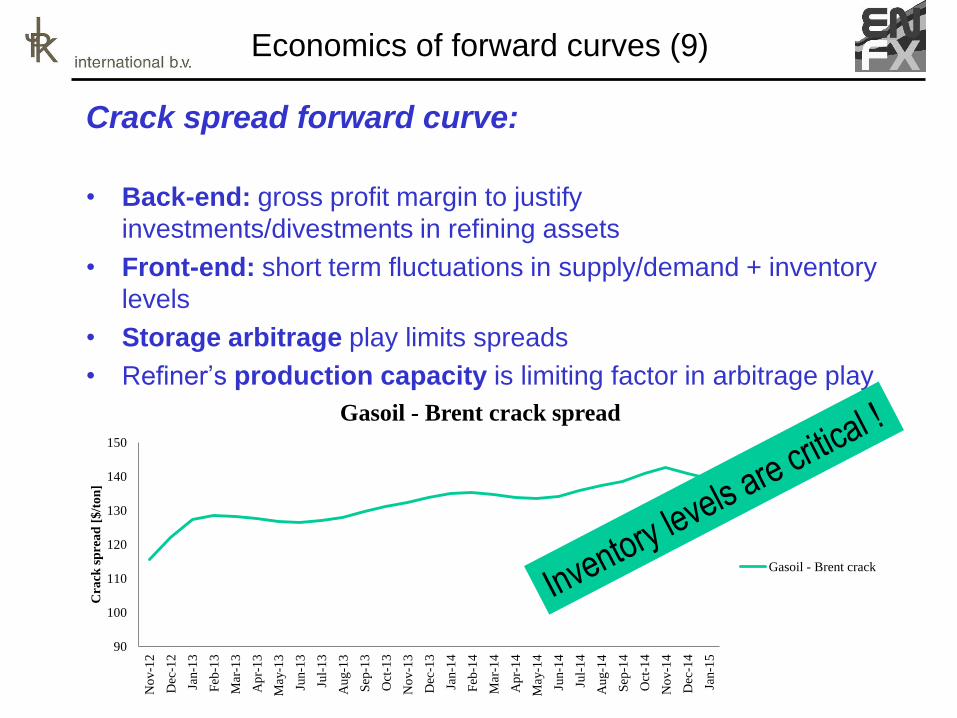
Economics of forward curves (9)
Crack spread forward curve:
• Back-end: gross profit margin to justify
investments/divestments in refining assets
• Front-end: short term fluctuations in supply/demand + inventory
levels
• Storage arbitrage play limits spreads
• Refiner’s production capacity is limiting factor in arbitrage play
90
100
110
120
130
140
150
No
v-1
2
Dec
-12
Jan-1
3
Feb
-13
Mar
-13
Ap
r-1
3
May
-13
Jun-1
3
Jul-
13
Aug-1
3
Sep
-13
Oct
-13
No
v-1
3
Dec
-13
Jan-1
4
Feb
-14
Mar
-14
Ap
r-1
4
May
-14
Jun-1
4
Jul-
14
Aug-1
4
Sep
-14
Oct
-14
No
v-1
4
Dec
-14
Jan-1
5
Cra
ck s
pre
ad
[$
/to
n]
Gasoil - Brent crack spread
Gasoil - Brent crack
Relevance of ARA oil product stocks (1)
ICE gasoil futures are traded all over the world….
…so why should ARA stocks be important?
Several reasons:
1. NWE main importer of middle distillates
2. ARA main trading hub in NWE
3. ARA physical delivery point of ICE gasoil contract
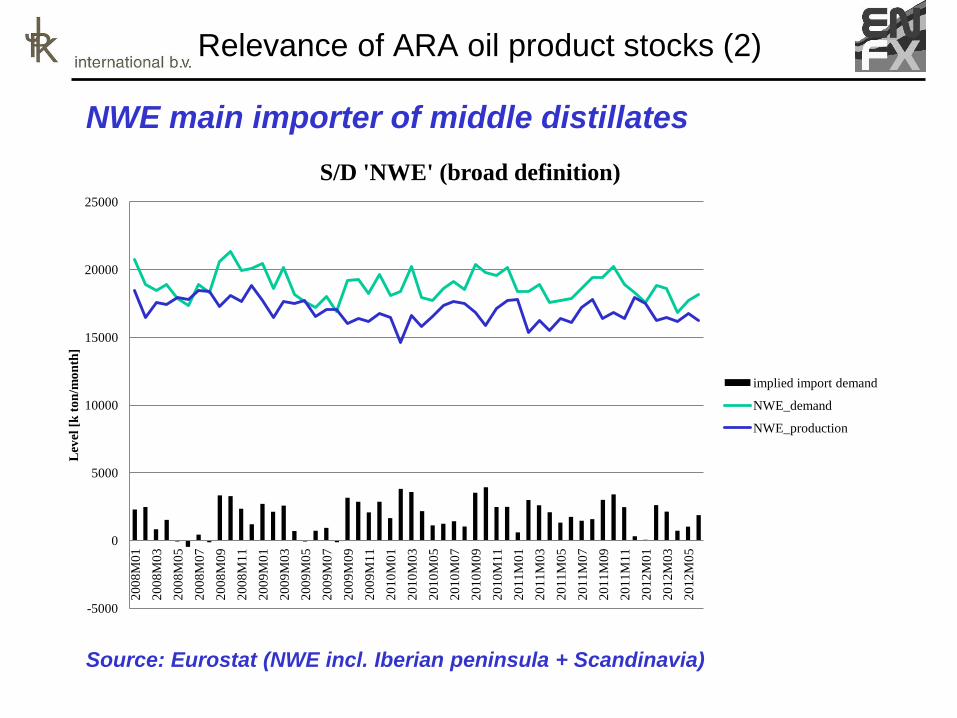
Relevance of ARA oil product stocks (2)
NWE main importer of middle distillates
Source: Eurostat (NWE incl. Iberian peninsula + Scandinavia)
-5000
0
5000
10000
15000
20000
25000
20
08
M0
1
20
08
M0
3
20
08
M0
5
20
08
M0
7
20
08
M0
9
20
08
M1
1
20
09
M0
1
20
09
M0
3
20
09
M0
5
20
09
M0
7
20
09
M0
9
20
09
M1
1
20
10
M0
1
20
10
M0
3
20
10
M0
5
20
10
M0
7
20
10
M0
9
20
10
M1
1
20
11
M0
1
20
11
M0
3
20
11
M0
5
20
11
M0
7
20
11
M0
9
20
11
M1
1
20
12
M0
1
20
12
M0
3
20
12
M0
5
Lev
el [
k t
on
/mo
nth
]
S/D 'NWE' (broad definition)
implied import demand
NWE_demand
NWE_production
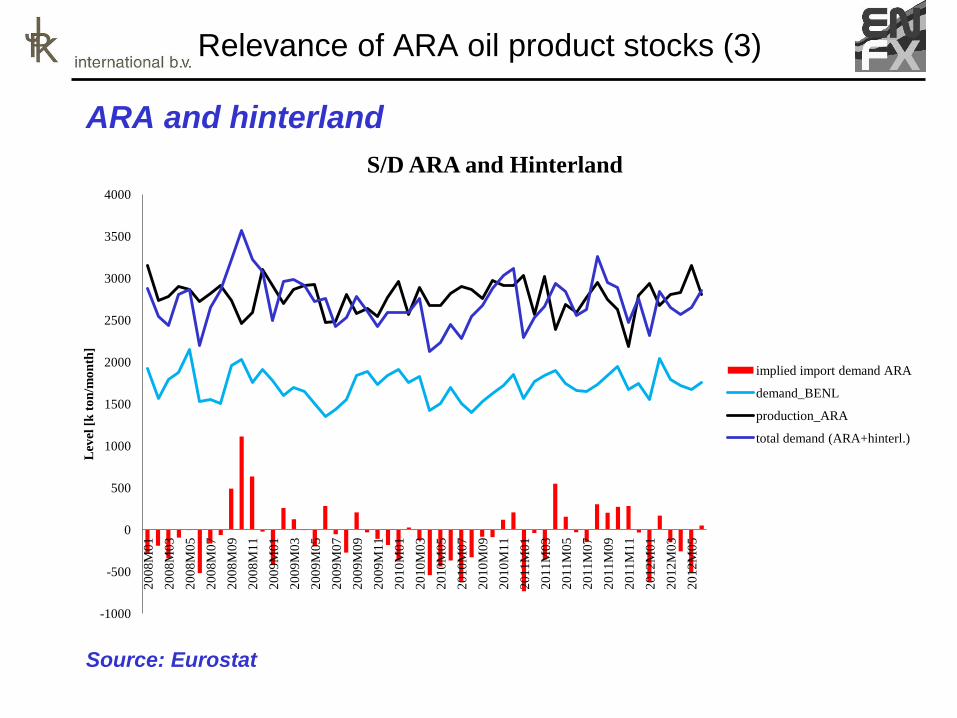
Relevance of ARA oil product stocks (3)
ARA and hinterland
Source: Eurostat
-1000
-500
0
500
1000
1500
2000
2500
3000
3500
4000
20
08
M0
1
20
08
M0
3
20
08
M0
5
20
08
M0
7
20
08
M0
9
20
08
M1
1
20
09
M0
1
20
09
M0
3
20
09
M0
5
20
09
M0
7
20
09
M0
9
20
09
M1
1
20
10
M0
1
20
10
M0
3
20
10
M0
5
20
10
M0
7
20
10
M0
9
20
10
M1
1
20
11
M0
1
20
11
M0
3
20
11
M0
5
20
11
M0
7
20
11
M0
9
20
11
M1
1
20
12
M0
1
20
12
M0
3
20
12
M0
5
Lev
el [
k t
on
/mo
nth
]
S/D ARA and Hinterland
implied import demand ARA
demand_BENL
production_ARA
total demand (ARA+hinterl.)
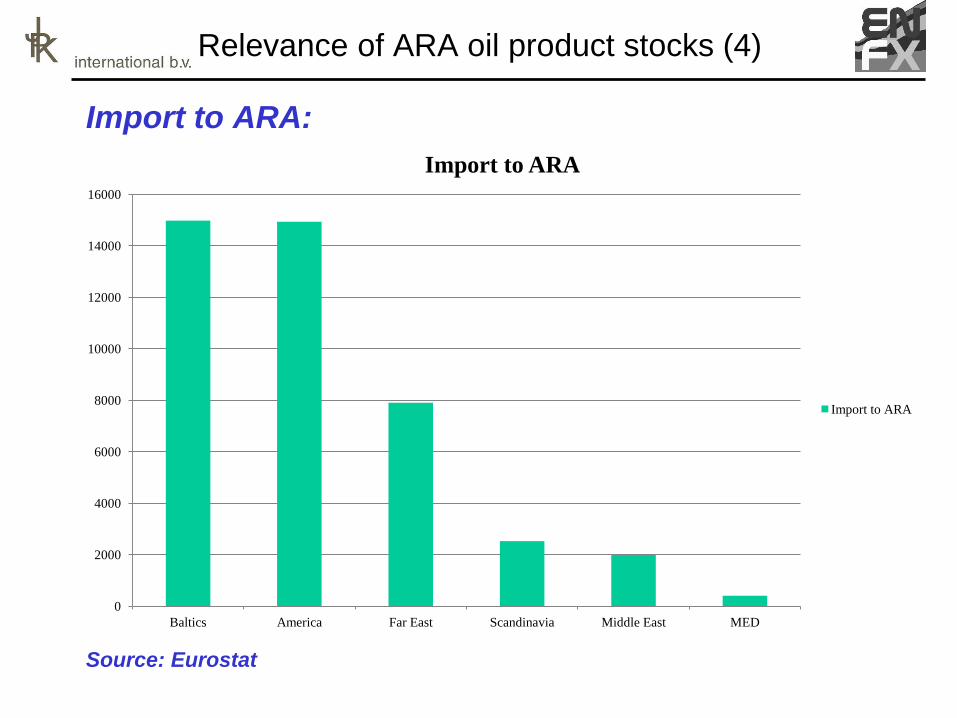
Relevance of ARA oil product stocks (4)
Import to ARA:
Source: Eurostat
0
2000
4000
6000
8000
10000
12000
14000
16000
Baltics America Far East Scandinavia Middle East MED
Import to ARA
Import to ARA
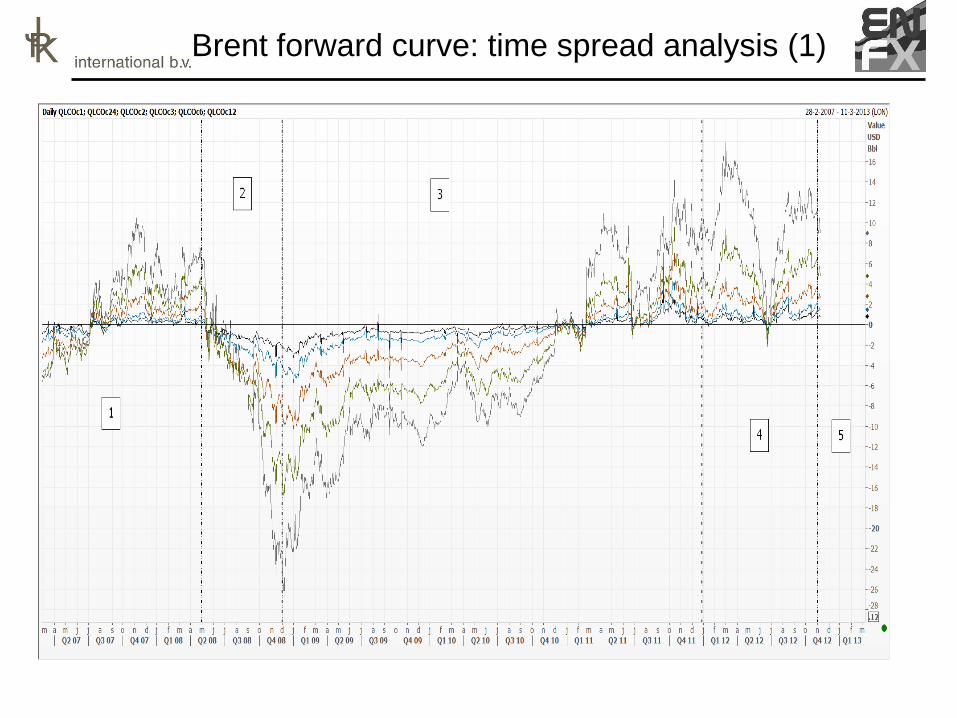
Brent forward curve: time spread analysis (1)
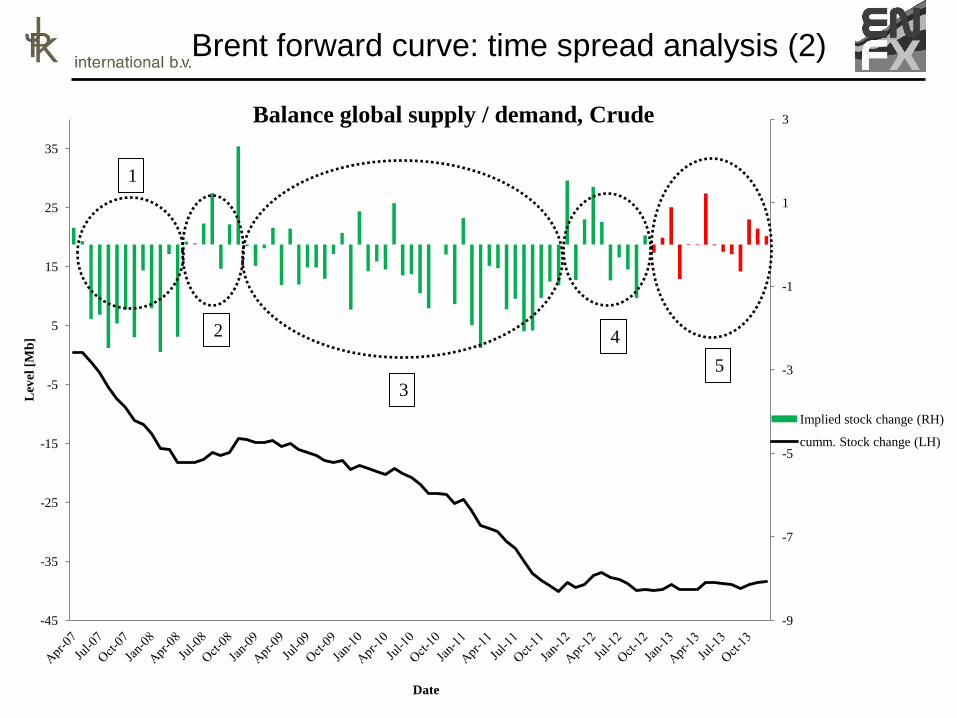
Brent forward curve: time spread analysis (2)
-9
-7
-5
-3
-1
1
3
-45
-35
-25
-15
-5
5
15
25
35
Lev
el
[Mb
]
Date
Balance global supply / demand, Crude
Implied stock change (RH)
cumm. Stock change (LH)
1
2
3
4
5
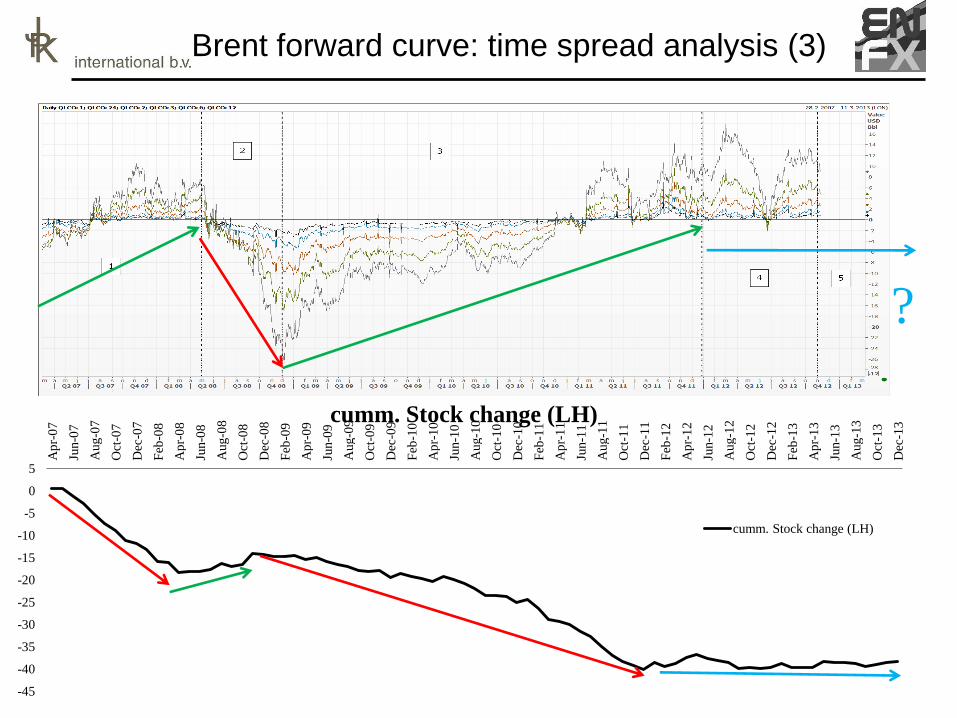
Brent forward curve: time spread analysis (3)
-45
-40
-35
-30
-25
-20
-15
-10
-5
0
5
Ap
r-0
7
Jun-0
7
Aug-0
7
Oct
-07
Dec
-07
Feb
-08
Ap
r-0
8
Jun-0
8
Aug-0
8
Oct
-08
Dec
-08
Feb
-09
Ap
r-0
9
Jun-0
9
Aug-0
9
Oct
-09
Dec
-09
Feb
-10
Ap
r-1
0
Jun-1
0
Aug-1
0
Oct
-10
Dec
-10
Feb
-11
Ap
r-1
1
Jun-1
1
Aug-1
1
Oct
-11
Dec
-11
Feb
-12
Ap
r-1
2
Jun-1
2
Aug-1
2
Oct
-12
Dec
-12
Feb
-13
Ap
r-1
3
Jun-1
3
Aug-1
3
Oct
-13
Dec
-13
cumm. Stock change (LH)
cumm. Stock change (LH)
?
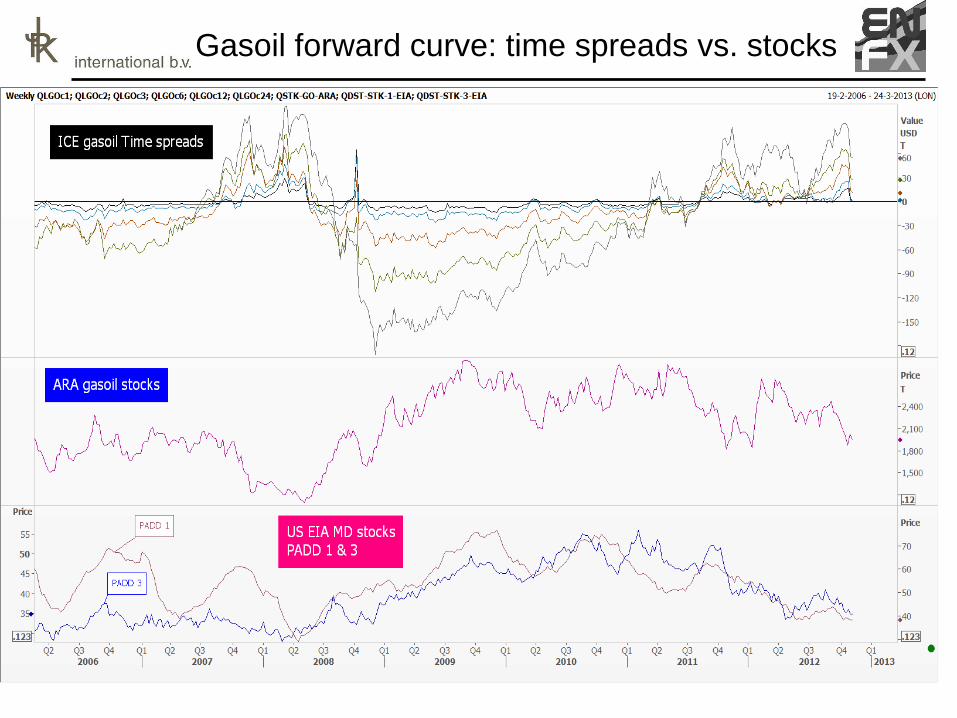
Gasoil forward curve: time spreads vs. stocks
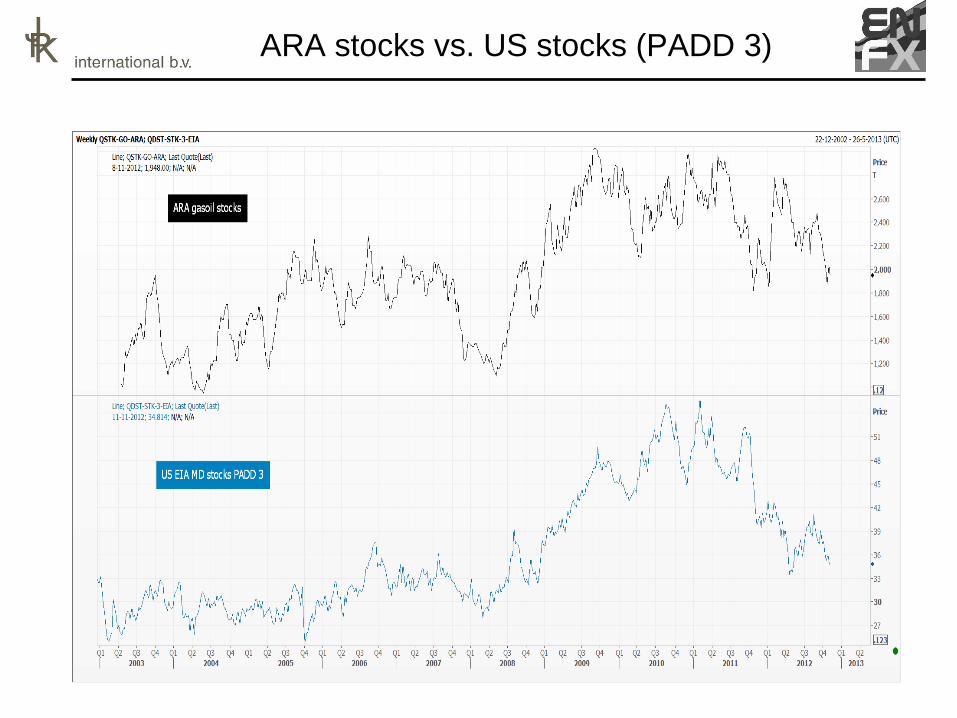
ARA stocks vs. US stocks (PADD 3)
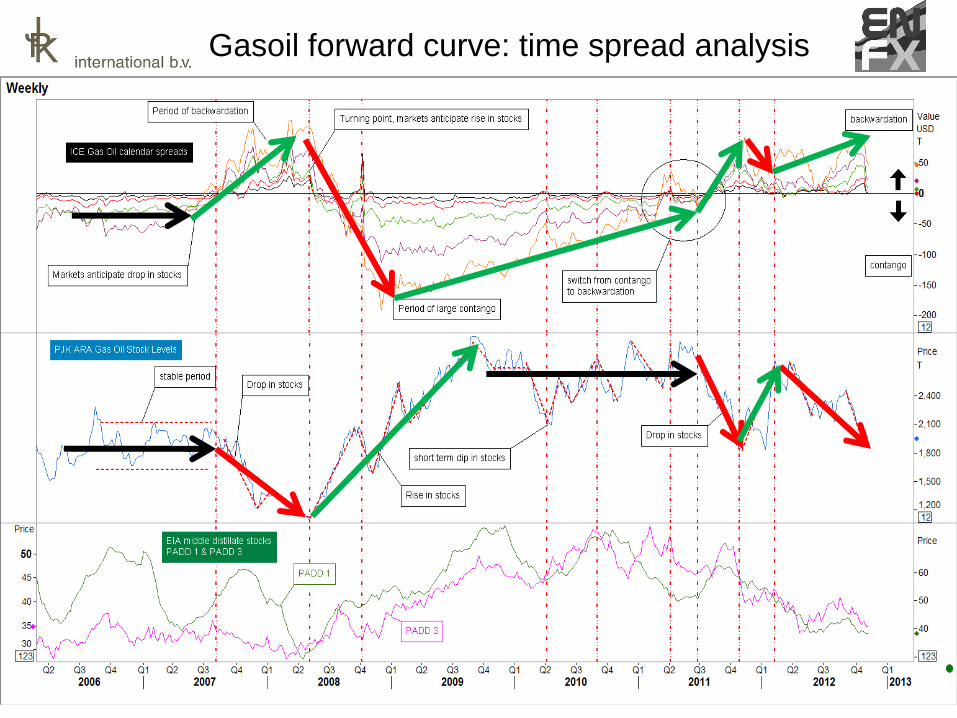
Gasoil forward curve: time spread analysis
More information:
Visit PJK website
For outlook on oil forward curves see:
www.pjk-international.com/scenarios
For more theory on forward curves see:
www.pjk-international.com/downloads

?? – Questions - ??
?
Outlook for forward curves
Crude oil market: main themes
Downside risks:
• Global economic slowdown
• Demand destruction due to high oil prices
• Political risks: Eurozone crisis & Fiscal Cliff
• Further surge in US tight oil production
Upside risks:
• Unrest Middle-East
• Militant clashes in Libya
• North-Sea production outages
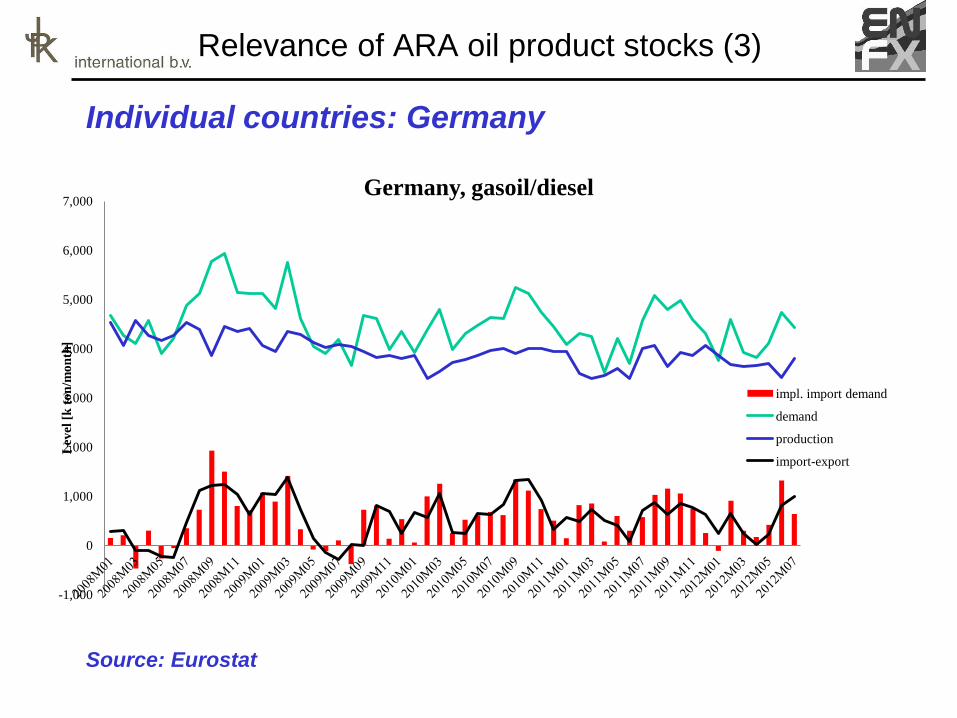
Relevance of ARA oil product stocks (3)
Individual countries: Germany
Source: Eurostat
-1,000
0
1,000
2,000
3,000
4,000
5,000
6,000
7,000
Lev
el [
k t
on
/mo
nth
]
Germany, gasoil/diesel
impl. import demand
demand
production
import-export
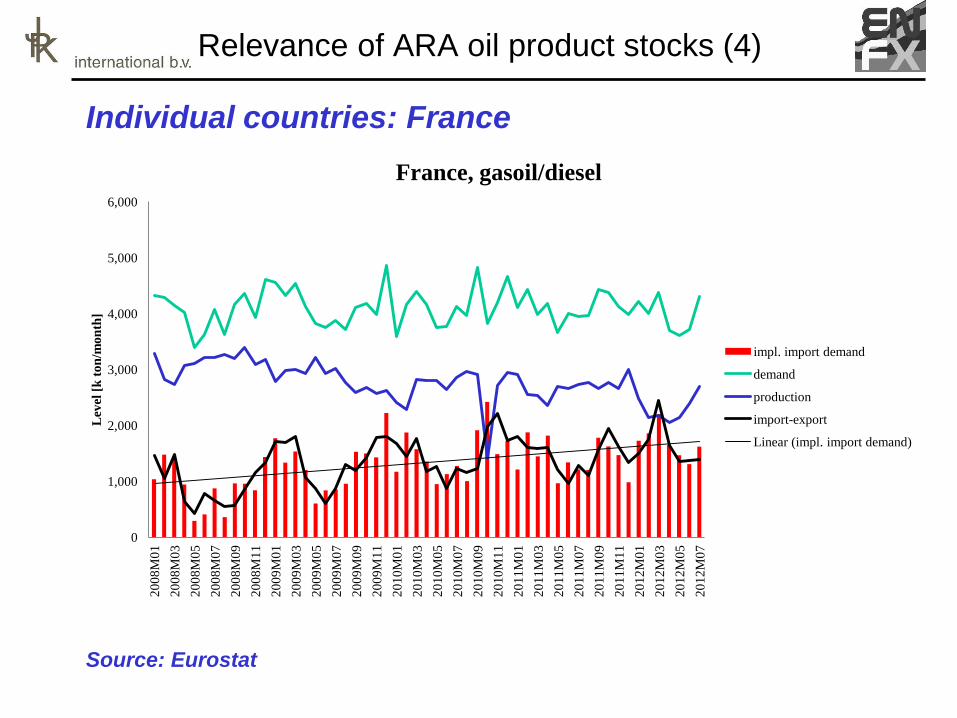
Relevance of ARA oil product stocks (4)
Individual countries: France
Source: Eurostat
0
1,000
2,000
3,000
4,000
5,000
6,000
20
08
M0
1
20
08
M0
3
20
08
M0
5
20
08
M0
7
20
08
M0
9
20
08
M1
1
20
09
M0
1
20
09
M0
3
20
09
M0
5
20
09
M0
7
20
09
M0
9
20
09
M1
1
20
10
M0
1
20
10
M0
3
20
10
M0
5
20
10
M0
7
20
10
M0
9
20
10
M1
1
20
11
M0
1
20
11
M0
3
20
11
M0
5
20
11
M0
7
20
11
M0
9
20
11
M1
1
20
12
M0
1
20
12
M0
3
20
12
M0
5
20
12
M0
7
Lev
el [
k t
on
/mo
nth
]
France, gasoil/diesel
impl. import demand
demand
production
import-export
Linear (impl. import demand)
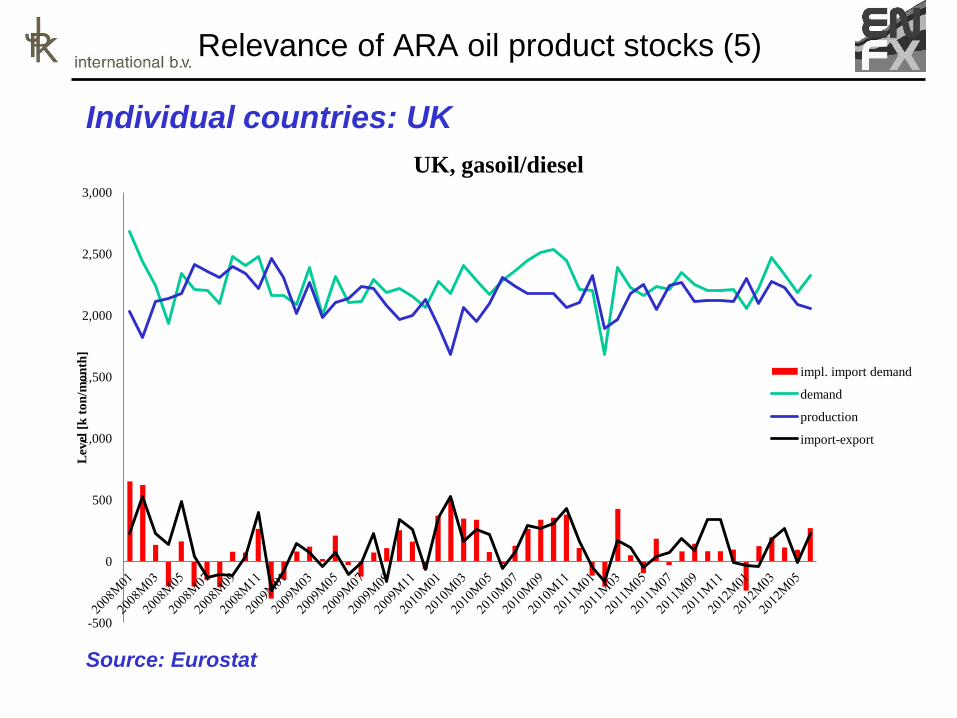
Relevance of ARA oil product stocks (5)
Individual countries: UK
Source: Eurostat
-500
0
500
1,000
1,500
2,000
2,500
3,000
Lev
el [
k t
on
/mo
nth
]
UK, gasoil/diesel
impl. import demand
demand
production
import-export
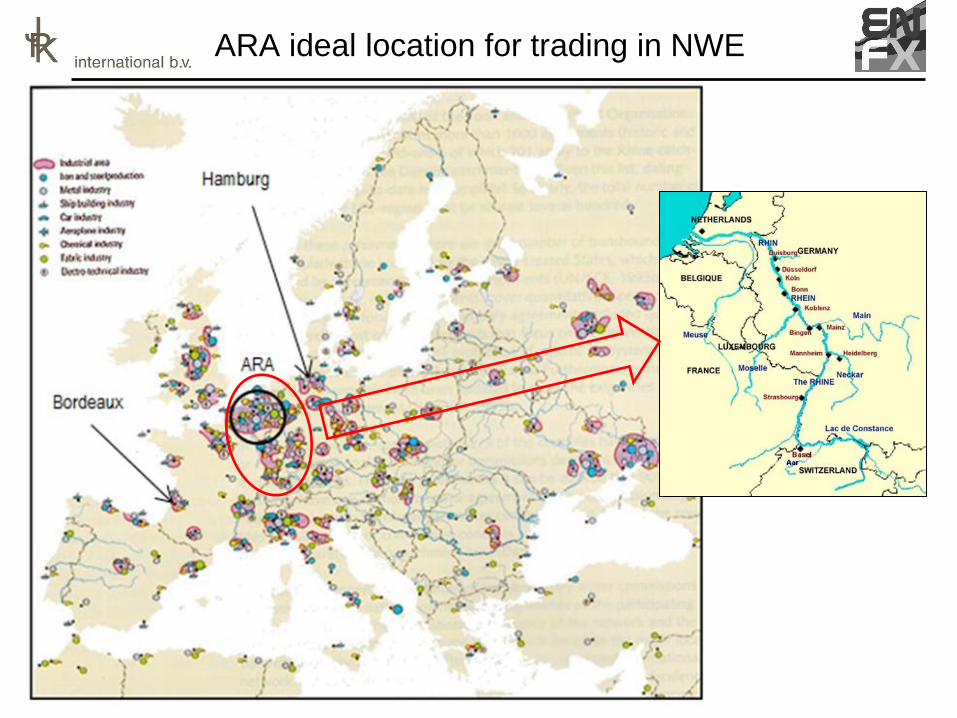
ARA ideal location for trading in NWE
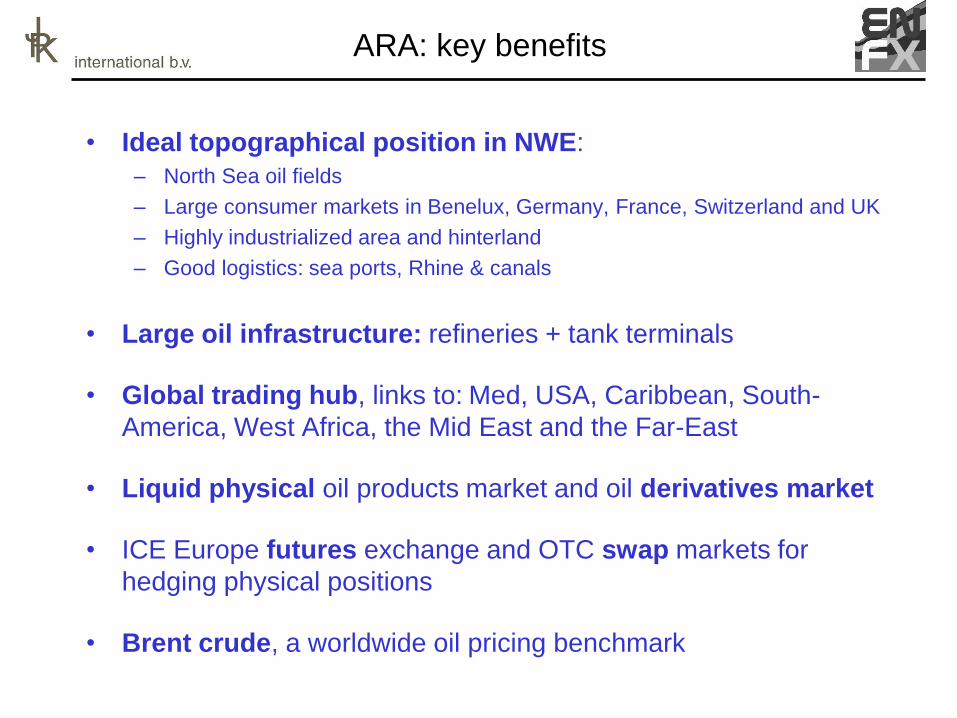
ARA: key benefits
• Ideal topographical position in NWE:
– North Sea oil fields
– Large consumer markets in Benelux, Germany, France, Switzerland and UK
– Highly industrialized area and hinterland
– Good logistics: sea ports, Rhine & canals
• Large oil infrastructure: refineries + tank terminals
• Global trading hub, links to: Med, USA, Caribbean, South-
America, West Africa, the Mid East and the Far-East
• Liquid physical oil products market and oil derivatives market
• ICE Europe futures exchange and OTC swap markets for
hedging physical positions
• Brent crude, a worldwide oil pricing benchmark
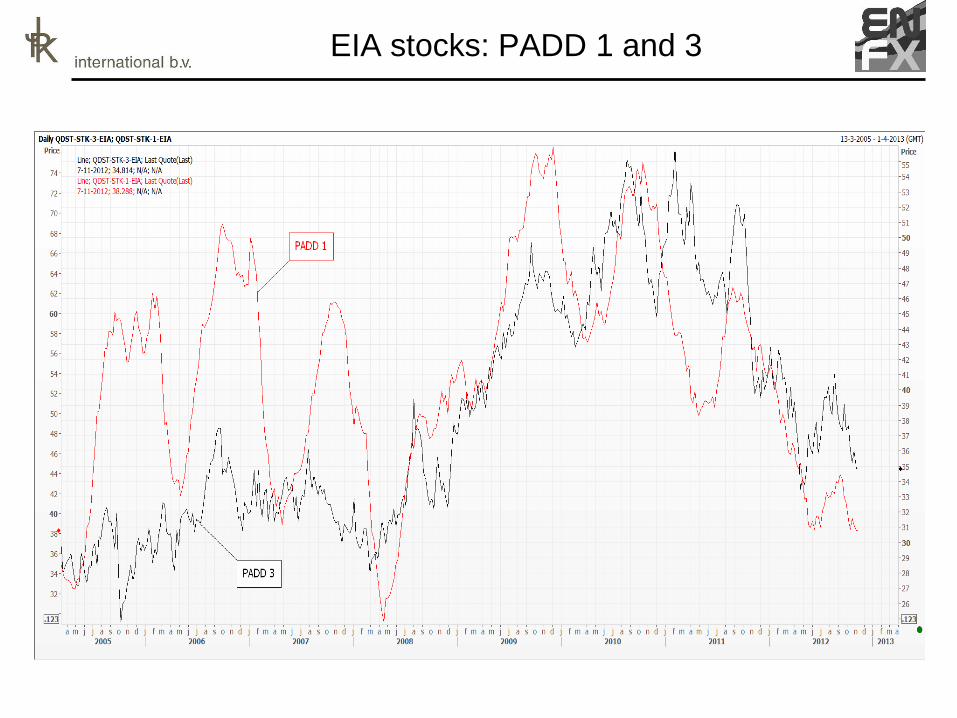
EIA stocks: PADD 1 and 3