Embed Size (px)
Citation preview
PUBLIC
December 2014
Report Series
Oil Market Outlook Executive SummaryS
Office of the Chief Economist Economics Department Samba Financial Group P.O. Box 833, Riyadh 11241 Saudi Arabia [email protected] +4420-7659-8200 (London) This and other publications can be Downloaded from www.samba.com
Concerns over supply disruptions faded during 2014 as Iraqi supply remained largely unaffected by the advance of ISIS, and Libyan production recovered. Added to surging US shale oil production this has resulted in a large supply overhang as demand growth faltered in the face of weaker than expected global growth. Having hit a $114/b peak in June on heightened geopolitical risks, prices have since slumped to around $70/b for Brent, although the average for the year came in at $100/b.
Despite the slump in prices and large supply overhang, OPEC has not cut production. It has kept its 30mb/d output target and will meet again in June 2015. This target is substantially above the projected call on OPEC crude and will keep prices under pressure. The big question is whether, and to what extent, the resulting lower oil prices will slow growth in US shale oil, helping to firm market balances and allow for higher prices in the future.
US shale oil has consistently surprised on the upside, adding 1mb/d in 2014, with a similar amount widely projected for 2015. However, this was before prices slumped, and prospects will depend on how companies react to the new financial realities. Technological advances have seen breakeven prices fall sharply. It is now widely thought that new investment will stall at $70/b, but that existing operations will continue to expand output. The outlook is highly uncertain, and any slowdown in production growth is likely to be mainly felt in 2016.
Even with a potential slowdown in US shale growth, total non-OPEC supply growth looks likely to exceed demand growth. From just 650,000b/d in 2014, this is projected to rise to 1.2mb/d in 2015 and 1.3mb/d in 2016, assuming the global economy revives to grow by 3.6 and 3.8 percent respectively. This may be hard to achieve despite the strength in the US economy, although the net effect of lower oil prices will be positive.
Average oil prices are now expected to hold in a $70-90/b range over the next 3-5 years. At which end of this range they trade will depend on many interlocking factors which are hard to predict. We assume that fiscal pressures on weaker members will lead to some limited but coordinated burden sharing cuts from OPEC later next year. Combined with slowing shale oil growth, and sustained supply disruptions, this could support Brent at $80/b in 2015 and $85/b in 2016. However, downside risks loom large and many alternative scenarios are plausible that could see prices hold at $70-75/b through 2016.
Oil Market Outlook Executive Summary
December 2014
PUBLIC
2
Recent Developments
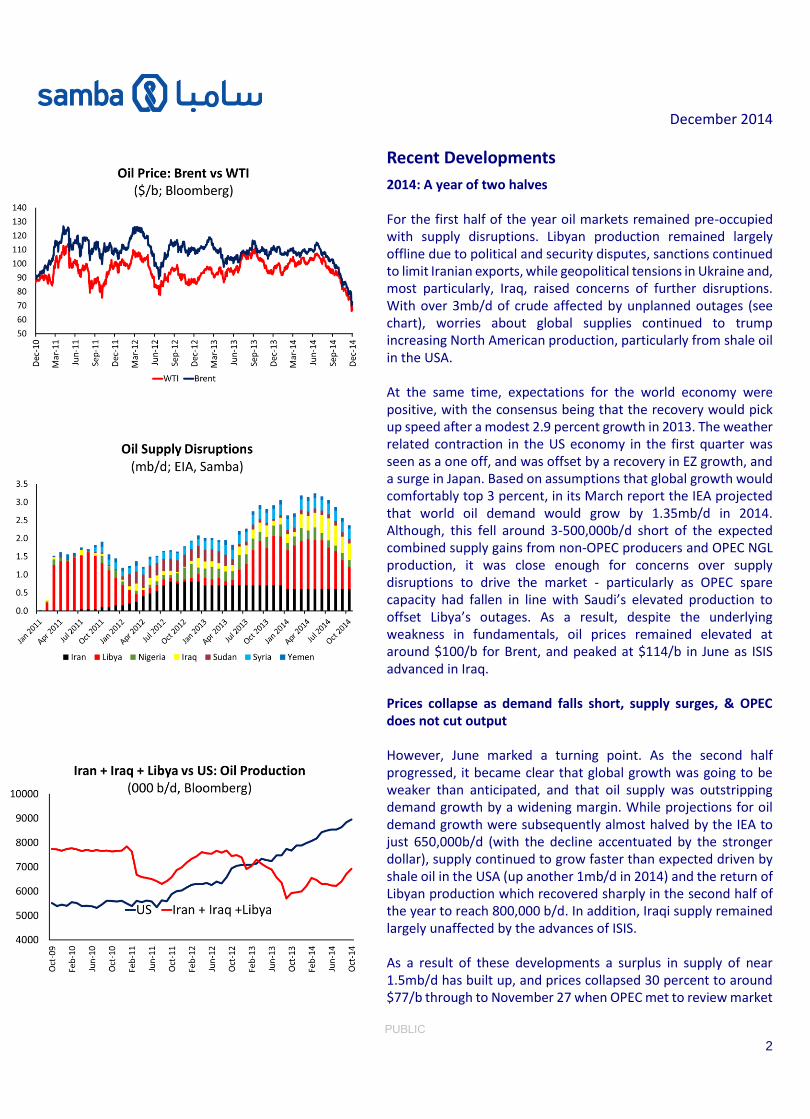
2014: A year of two halves For the first half of the year oil markets remained pre-occupied with supply disruptions. Libyan production remained largely offline due to political and security disputes, sanctions continued to limit Iranian exports, while geopolitical tensions in Ukraine and, most particularly, Iraq, raised concerns of further disruptions. With over 3mb/d of crude affected by unplanned outages (see chart), worries about global supplies continued to trump increasing North American production, particularly from shale oil in the USA. At the same time, expectations for the world economy were positive, with the consensus being that the recovery would pick up speed after a modest 2.9 percent growth in 2013. The weather related contraction in the US economy in the first quarter was seen as a one off, and was offset by a recovery in EZ growth, and a surge in Japan. Based on assumptions that global growth would comfortably top 3 percent, in its March report the IEA projected that world oil demand would grow by 1.35mb/d in 2014. Although, this fell around 3-500,000b/d short of the expected combined supply gains from non-OPEC producers and OPEC NGL production, it was close enough for concerns over supply disruptions to drive the market - particularly as OPEC spare capacity had fallen in line with Saudi’s elevated production to offset Libya’s outages. As a result, despite the underlying weakness in fundamentals, oil prices remained elevated at around $100/b for Brent, and peaked at $114/b in June as ISIS advanced in Iraq. Prices collapse as demand falls short, supply surges, & OPEC does not cut output However, June marked a turning point. As the second half progressed, it became clear that global growth was going to be weaker than anticipated, and that oil supply was outstripping demand growth by a widening margin. While projections for oil demand growth were subsequently almost halved by the IEA to just 650,000b/d (with the decline accentuated by the stronger dollar), supply continued to grow faster than expected driven by shale oil in the USA (up another 1mb/d in 2014) and the return of Libyan production which recovered sharply in the second half of the year to reach 800,000 b/d. In addition, Iraqi supply remained largely unaffected by the advances of ISIS. As a result of these developments a surplus in supply of near 1.5mb/d has built up, and prices collapsed 30 percent to around $77/b through to November 27 when OPEC met to review market
December 2014
PUBLIC
3
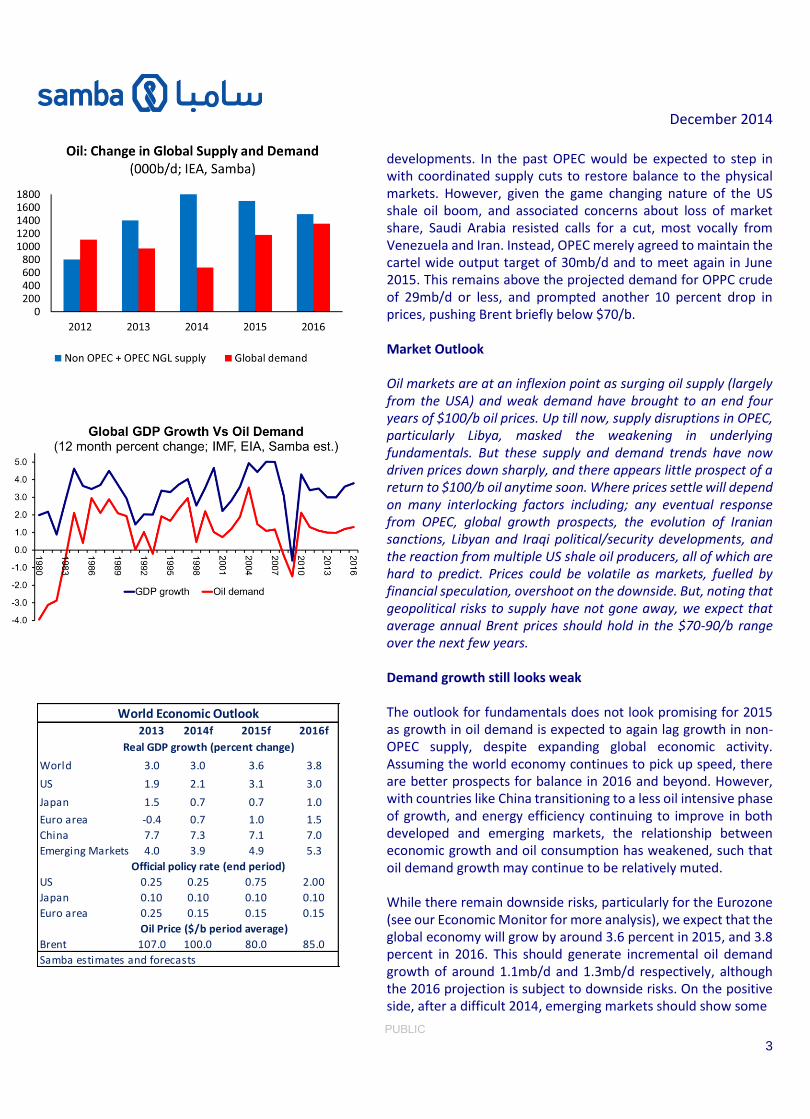
developments. In the past OPEC would be expected to step in with coordinated supply cuts to restore balance to the physical markets. However, given the game changing nature of the US shale oil boom, and associated concerns about loss of market share, Saudi Arabia resisted calls for a cut, most vocally from Venezuela and Iran. Instead, OPEC merely agreed to maintain the cartel wide output target of 30mb/d and to meet again in June 2015. This remains above the projected demand for OPPC crude of 29mb/d or less, and prompted another 10 percent drop in prices, pushing Brent briefly below $70/b. Market Outlook Oil markets are at an inflexion point as surging oil supply (largely from the USA) and weak demand have brought to an end four years of $100/b oil prices. Up till now, supply disruptions in OPEC, particularly Libya, masked the weakening in underlying fundamentals. But these supply and demand trends have now driven prices down sharply, and there appears little prospect of a return to $100/b oil anytime soon. Where prices settle will depend on many interlocking factors including; any eventual response from OPEC, global growth prospects, the evolution of Iranian sanctions, Libyan and Iraqi political/security developments, and the reaction from multiple US shale oil producers, all of which are hard to predict. Prices could be volatile as markets, fuelled by financial speculation, overshoot on the downside. But, noting that geopolitical risks to supply have not gone away, we expect that average annual Brent prices should hold in the $70-90/b range over the next few years. Demand growth still looks weak The outlook for fundamentals does not look promising for 2015 as growth in oil demand is expected to again lag growth in non-OPEC supply, despite expanding global economic activity. Assuming the world economy continues to pick up speed, there are better prospects for balance in 2016 and beyond. However, with countries like China transitioning to a less oil intensive phase of growth, and energy efficiency continuing to improve in both developed and emerging markets, the relationship between economic growth and oil consumption has weakened, such that oil demand growth may continue to be relatively muted. While there remain downside risks, particularly for the Eurozone (see our Economic Monitor for more analysis), we expect that the global economy will grow by around 3.6 percent in 2015, and 3.8 percent in 2016. This should generate incremental oil demand growth of around 1.1mb/d and 1.3mb/d respectively, although the 2016 projection is subject to downside risks. On the positive side, after a difficult 2014, emerging markets should show some
2013 2014f 2015f 2016f
World 3.0 3.0 3.6 3.8
US 1.9 2.1 3.1 3.0
Japan 1.5 0.7 0.7 1.0
Euro area -0.4 0.7 1.0 1.5
China 7.7 7.3 7.1 7.0
Emerging Markets 4.0 3.9 4.9 5.3
US 0.25 0.25 0.75 2.00
Japan 0.10 0.10 0.10 0.10
Euro area 0.25 0.15 0.15 0.15
Brent 107.0 100.0 80.0 85.0
Samba estimates and forecasts
Real GDP growth (percent change)
World Economic Outlook
Official policy rate (end period)
Oil Price ($/b period average)
December 2014
PUBLIC
4
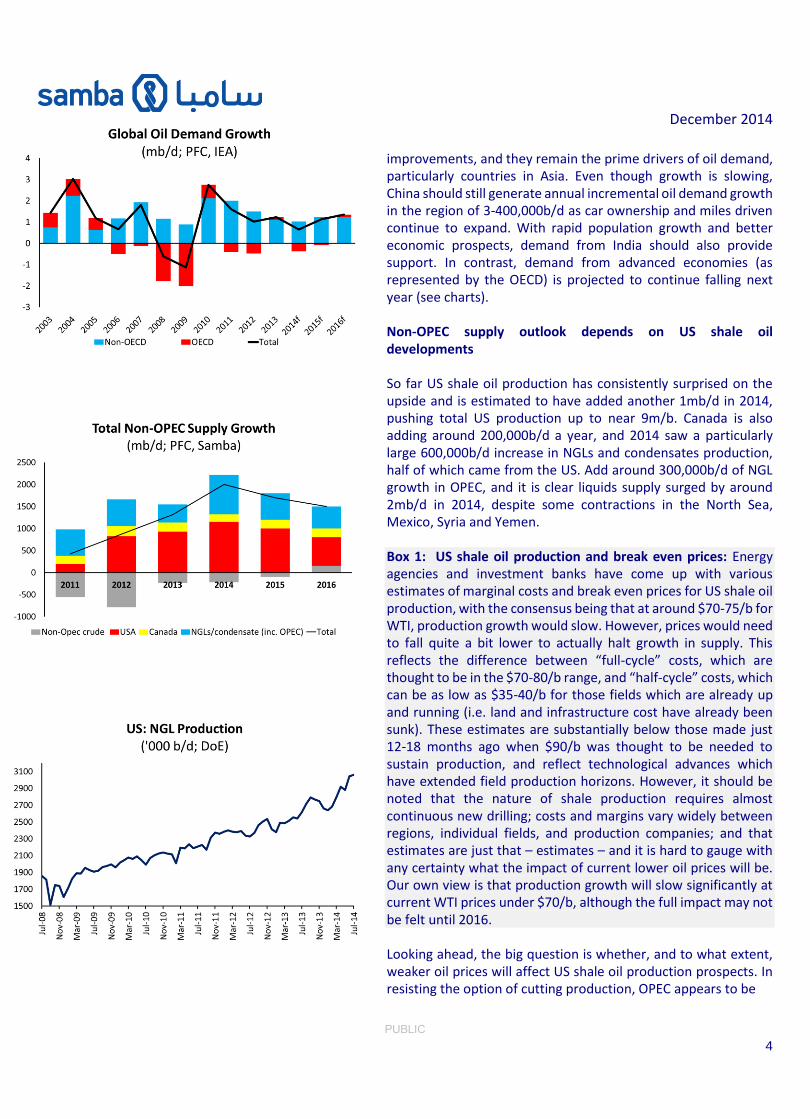
improvements, and they remain the prime drivers of oil demand, particularly countries in Asia. Even though growth is slowing, China should still generate annual incremental oil demand growth in the region of 3-400,000b/d as car ownership and miles driven continue to expand. With rapid population growth and better economic prospects, demand from India should also provide support. In contrast, demand from advanced economies (as represented by the OECD) is projected to continue falling next year (see charts). Non-OPEC supply outlook depends on US shale oil developments So far US shale oil production has consistently surprised on the upside and is estimated to have added another 1mb/d in 2014, pushing total US production up to near 9m/b. Canada is also adding around 200,000b/d a year, and 2014 saw a particularly large 600,000b/d increase in NGLs and condensates production, half of which came from the US. Add around 300,000b/d of NGL growth in OPEC, and it is clear liquids supply surged by around 2mb/d in 2014, despite some contractions in the North Sea, Mexico, Syria and Yemen. Box 1: US shale oil production and break even prices: Energy agencies and investment banks have come up with various estimates of marginal costs and break even prices for US shale oil production, with the consensus being that at around $70-75/b for WTI, production growth would slow. However, prices would need to fall quite a bit lower to actually halt growth in supply. This reflects the difference between “full-cycle” costs, which are thought to be in the $70-80/b range, and “half-cycle” costs, which can be as low as $35-40/b for those fields which are already up and running (i.e. land and infrastructure cost have already been sunk). These estimates are substantially below those made just 12-18 months ago when $90/b was thought to be needed to sustain production, and reflect technological advances which have extended field production horizons. However, it should be noted that the nature of shale production requires almost continuous new drilling; costs and margins vary widely between regions, individual fields, and production companies; and that estimates are just that – estimates – and it is hard to gauge with any certainty what the impact of current lower oil prices will be. Our own view is that production growth will slow significantly at current WTI prices under $70/b, although the full impact may not be felt until 2016. Looking ahead, the big question is whether, and to what extent, weaker oil prices will affect US shale oil production prospects. In resisting the option of cutting production, OPEC appears to be
December 2014
PUBLIC
5
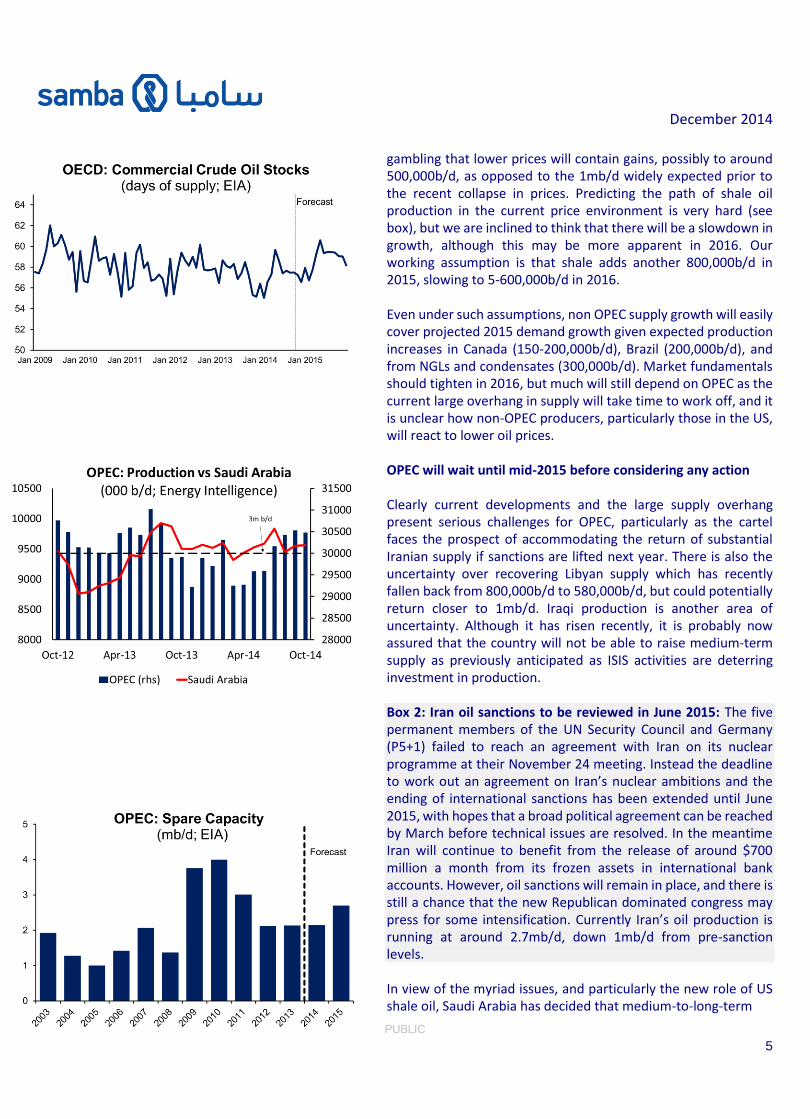
gambling that lower prices will contain gains, possibly to around 500,000b/d, as opposed to the 1mb/d widely expected prior to the recent collapse in prices. Predicting the path of shale oil production in the current price environment is very hard (see box), but we are inclined to think that there will be a slowdown in growth, although this may be more apparent in 2016. Our working assumption is that shale adds another 800,000b/d in 2015, slowing to 5-600,000b/d in 2016. Even under such assumptions, non OPEC supply growth will easily cover projected 2015 demand growth given expected production increases in Canada (150-200,000b/d), Brazil (200,000b/d), and from NGLs and condensates (300,000b/d). Market fundamentals should tighten in 2016, but much will still depend on OPEC as the current large overhang in supply will take time to work off, and it is unclear how non-OPEC producers, particularly those in the US, will react to lower oil prices. OPEC will wait until mid-2015 before considering any action Clearly current developments and the large supply overhang present serious challenges for OPEC, particularly as the cartel faces the prospect of accommodating the return of substantial Iranian supply if sanctions are lifted next year. There is also the uncertainty over recovering Libyan supply which has recently fallen back from 800,000b/d to 580,000b/d, but could potentially return closer to 1mb/d. Iraqi production is another area of uncertainty. Although it has risen recently, it is probably now assured that the country will not be able to raise medium-term supply as previously anticipated as ISIS activities are deterring investment in production. Box 2: Iran oil sanctions to be reviewed in June 2015: The five permanent members of the UN Security Council and Germany (P5+1) failed to reach an agreement with Iran on its nuclear programme at their November 24 meeting. Instead the deadline to work out an agreement on Iran’s nuclear ambitions and the ending of international sanctions has been extended until June 2015, with hopes that a broad political agreement can be reached by March before technical issues are resolved. In the meantime Iran will continue to benefit from the release of around $700 million a month from its frozen assets in international bank accounts. However, oil sanctions will remain in place, and there is still a chance that the new Republican dominated congress may press for some intensification. Currently Iran’s oil production is running at around 2.7mb/d, down 1mb/d from pre-sanction levels. In view of the myriad issues, and particularly the new role of US shale oil, Saudi Arabia has decided that medium-to-long-term
December 2014
PUBLIC
6
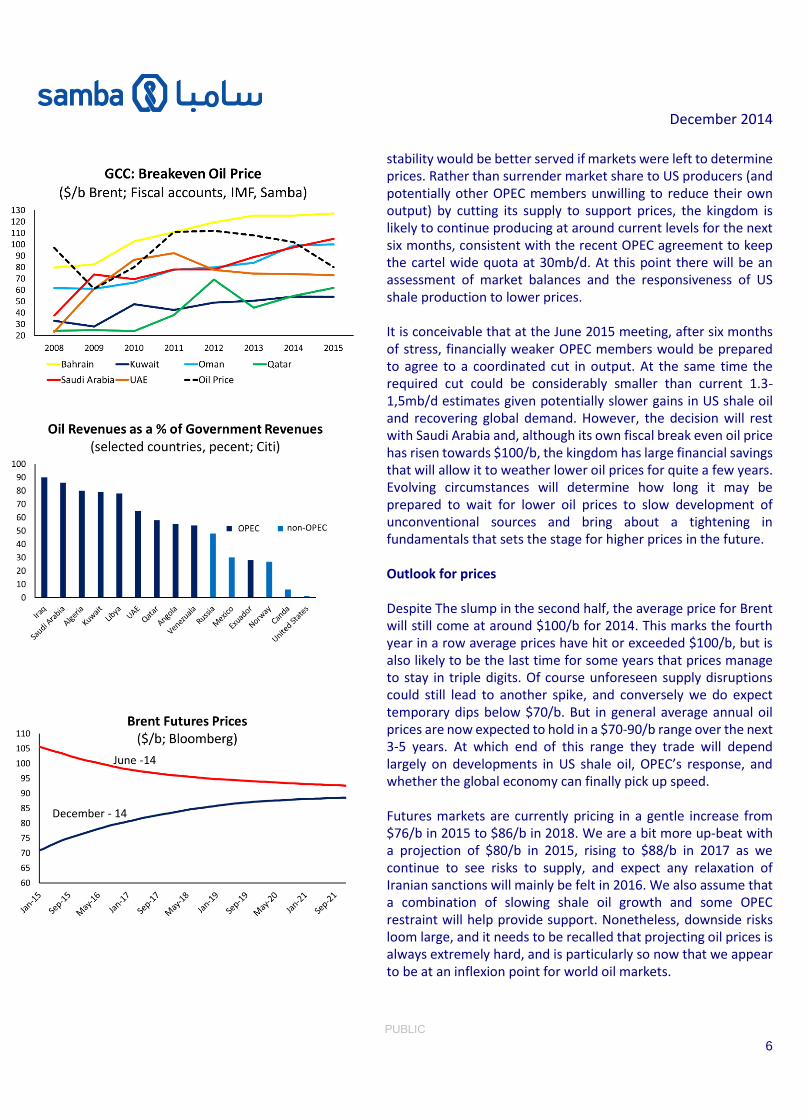
stability would be better served if markets were left to determine prices. Rather than surrender market share to US producers (and potentially other OPEC members unwilling to reduce their own output) by cutting its supply to support prices, the kingdom is likely to continue producing at around current levels for the next six months, consistent with the recent OPEC agreement to keep the cartel wide quota at 30mb/d. At this point there will be an assessment of market balances and the responsiveness of US shale production to lower prices. It is conceivable that at the June 2015 meeting, after six months of stress, financially weaker OPEC members would be prepared to agree to a coordinated cut in output. At the same time the required cut could be considerably smaller than current 1.3-1,5mb/d estimates given potentially slower gains in US shale oil and recovering global demand. However, the decision will rest with Saudi Arabia and, although its own fiscal break even oil price has risen towards $100/b, the kingdom has large financial savings that will allow it to weather lower oil prices for quite a few years. Evolving circumstances will determine how long it may be prepared to wait for lower oil prices to slow development of unconventional sources and bring about a tightening in fundamentals that sets the stage for higher prices in the future. Outlook for prices Despite The slump in the second half, the average price for Brent will still come at around $100/b for 2014. This marks the fourth year in a row average prices have hit or exceeded $100/b, but is also likely to be the last time for some years that prices manage to stay in triple digits. Of course unforeseen supply disruptions could still lead to another spike, and conversely we do expect temporary dips below $70/b. But in general average annual oil prices are now expected to hold in a $70-90/b range over the next 3-5 years. At which end of this range they trade will depend largely on developments in US shale oil, OPEC’s response, and whether the global economy can finally pick up speed. Futures markets are currently pricing in a gentle increase from $76/b in 2015 to $86/b in 2018. We are a bit more up-beat with a projection of $80/b in 2015, rising to $88/b in 2017 as we continue to see risks to supply, and expect any relaxation of Iranian sanctions will mainly be felt in 2016. We also assume that a combination of slowing shale oil growth and some OPEC restraint will help provide support. Nonetheless, downside risks loom large, and it needs to be recalled that projecting oil prices is always extremely hard, and is particularly so now that we appear to be at an inflexion point for world oil markets.
December 2014
PUBLIC
7
James Reeve Deputy Chief Economist [email protected] Andrew Gilmour Deputy Chief Economist [email protected] Thomas Simmons Economist [email protected]
Disclaimer This publication is based on information generally available to the public from sources believed to be reliable and up to date at the time of publication. However, SAMBA is unable to accept any liability whatsoever for the accuracy or completeness of its contents or for the consequences of any reliance which may be place upon the information it contains. Additionally, the information and opinions contained herein: 1. Are not intended to be a complete or comprehensive study or to
provide advice and should not be treated as a substitute for specific advice and due diligence concerning individual situations;
2. Are not intended to constitute any solicitation to buy or sell any instrument or engage in any trading strategy; and/or
3. Are not intended to constitute a guarantee of future performance. Accordingly, no representation or warranty is made or implied, in fact or in law, including but not limited to the implied warranties of merchantability and fitness for a particular purpose notwithstanding the form (e.g., contract, negligence or otherwise), in which any legal or equitable action may be brought against SAMBA. Samba Financial Group P.O. Box 833, Riyadh 11421 Saudi Arabia