Embed Size (px)
Citation preview

1
Oil & Natural Gas Technology
DOE Award No.: DE-FC26-01NT41248
Final Report
Field Exploration of Methane Seep Near Atqasuk
Submitted by: Institute of Northern Engineering University of Alaska Fairbanks
P.O. Box 755910 Fairbanks, AK 99775-5910
Prepared for: United States Department of Energy
National Energy Technology Laboratory
January 2009
Office of Fossil Energy

i
Final Report
Field Exploration of Methane Seep Near Atqasuk Reporting Period Start Date: April 1, 2008
Reporting Period End Date: December 31, 2008 Principal Author(s): Katey Walter, Dennis Witmer, Gwen Holdmann
Date Report Issued: January 2009 DOE Award Number: DE-FC26-01NT41248, FY05 Task
Name and Address of Submitting Organization: Institute of Northern Engineering
University of Alaska Fairbanks P.O. Box 755910
Fairbanks, AK 99775-5910
Natural gas flare at Qalluuraq Lake seep near Atqasuk, Alaska, April 2008.

ii
DISCLAIMER
This report was prepared as an account of work sponsored by an agency of the United States
Government. Neither the United States Government nor any agency thereof, nor any of their
employees, makes any warranty, express or implied, or assumes any legal liability or
responsibility for the accuracy, completeness, or usefulness of any information, apparatus,
product, or process disclosed, or represents that its use would not infringe privately owned
rights. Reference herein to any specific commercial product, process, or service by trade
name, trademark, manufacturer, or otherwise does not necessarily constitute or imply its
endorsement, recommendation, or favoring by the United States Government or any agency
thereof. The views and opinions of authors expressed herein do not necessarily state or
reflect those of the United States Government or any agency thereof.

iii
ABSTRACT
Methane (CH4) in natural gas is a major energy source in the U.S., and is used
extensively on Alaska’s North Slope, including the oilfields in Prudhoe Bay, the community
of Barrow, and the National Petroleum Reserve, Alaska (NPRA). Smaller villages, however,
are dependent on imported diesel fuel for both power and heating, resulting in some of the
highest energy costs in the U.S. and crippling local economies. Numerous CH4 gas seeps
have been observed on wetlands near Atqasuk, Alaska (in the NPRA), and initial
measurements have indicated flow rates of 3,000–5,000 ft3 day-1 (60–100 kg CH4 day-1). Gas
samples collected in 1996 indicated biogenic origin, although more recent sampling indicated
a mixture of biogenic and thermogenic gas. In this study, we (1) quantified the amount of
CH4 generated by several seeps and evaluated their potential use as an unconventional gas
source for the village of Atqasuk; (2) collected gas and analyzed its composition from
multiple seeps several miles apart to see if the source is the same, or if gas is being generated
locally from isolated biogenic sources; and (3) assessed the potential magnitude of natural
CH4 gas seeps for future use in climate change modeling.

iv
TABLE OF CONTENTS
DISCLAIMER .................................................................................................................... ii ABSTRACT....................................................................................................................... iii TABLE OF CONTENTS................................................................................................... iv LIST OF FIGURES .............................................................................................................v LIST OF TABLES............................................................................................................ vii ACKNOWLEDGMENT.................................................................................................. viii INTRODUCTION ...............................................................................................................1 EXECUTIVE SUMMARY .................................................................................................4 EXPERIMENTAL...............................................................................................................6
Objectives and Scope of Study ........................................................................................6 Study Area .......................................................................................................................7 Time Line and Summary of Work...................................................................................8
RESULTS AND DISCUSSION........................................................................................10 Task 1. Locate, identify, and map natural gas seeps within 40 km of the village of Atqasuk ..........................................................................................................................10 Task 2. Estimate methane production rates from active seeps near Atqasuk ................14 Task 3. Geochemical interpretation as inference of gas origin and quality...................18 Task 4. Core lake to investigate possibility of establishing a long-term record of seep emission consistency .............................................................................................28 Task 5. Engineering assessment and demonstration of the development of seep methane for energy use in rural Alaska .........................................................................31 Task 6. Education and outreach.....................................................................................33
CONCLUSIONS................................................................................................................35 REFERENCES ..................................................................................................................37 LIST OF ACRONYMS AND ABBREVIATIONS ..........................................................42 APPENDIX A....................................................................................................................43

v
LIST OF FIGURES
Figure 1. Regional map of northern Alaska showing location of Atqasuk, a rural village surrounded by unconventional natural gas seeps. ....................................................8
Figure 2. Locations of the validated CH............................................................................10
Figure 4. Flight path for 1-hour aerial survey for CH........................................................11
Figure 3. Convection associated with hotspots of methane bubbling maintains open holes in early winter lake ice, which are visible in aerial photographs as dark spots contrasted against white snow- and ice-covered lakes. .......................................................1
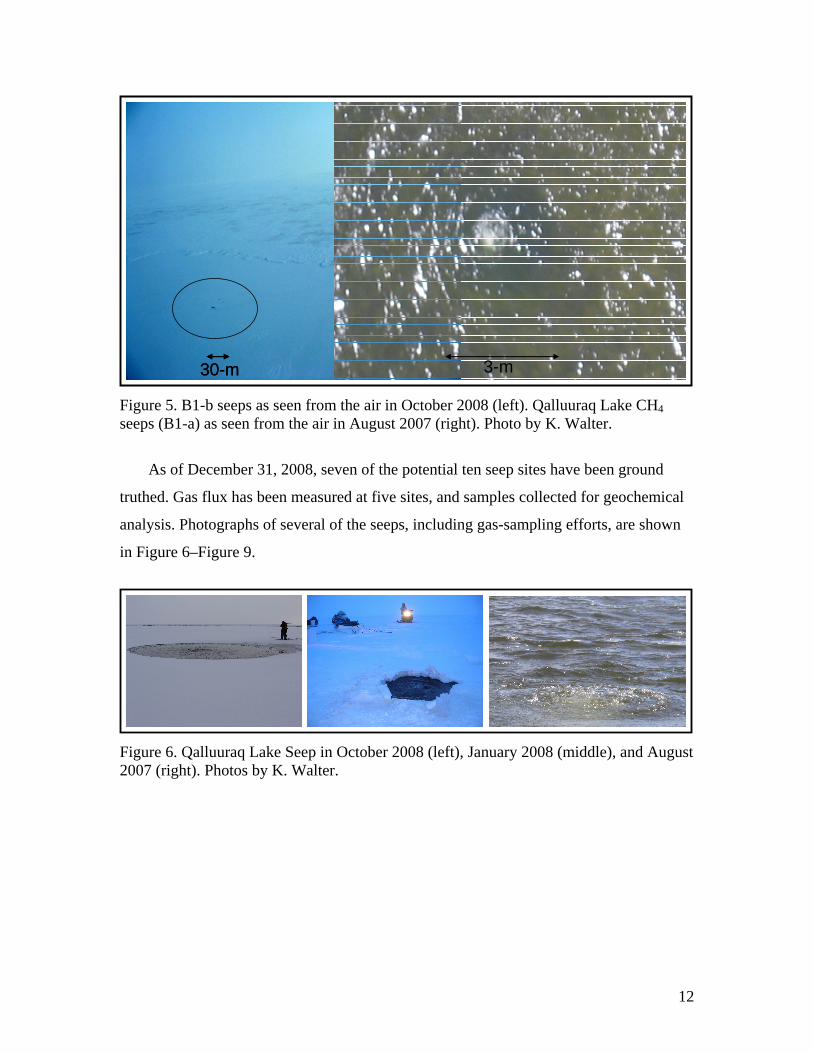
Figure 5. B1-b seeps as seen from the air in October 2008 (left). Qalluuraq Lake CH.....12
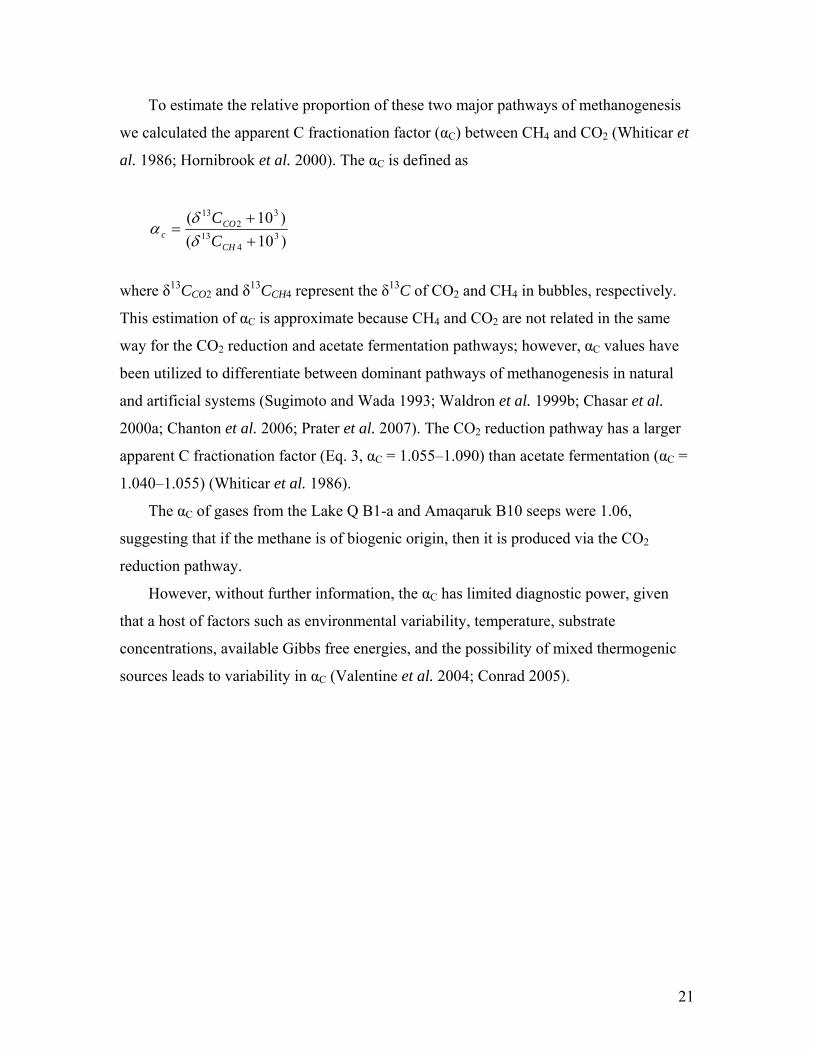
Figure 6. Qalluuraq Lake Seep in October 2008 (left), January 2008 (middle), and August 2007 (right)............................................................................................................12
Figure 7. Thermal infrared photograph of Walter collecting gas from ice-sealed Lake Q seep in January 2008. White indicates the hottest temperature, emitted through thin ice cover over the seep. Photo by P. Anthony. ..................................................................13
Figure 8. At individual seep sites, Walter and Whiteman measure water depth (left), count the number of seeps visible in open holes (other seeps are present but not visible beneath the snow) (middle), and collect gas using underwater bubble traps for laboratory analysis of gas constituents and geochemistry (right). .....................................13
Figure 9. Amaqaruk Meade River seeps (B10). ................................................................14
Figure 10. Gas flow of ~3,000 ft........................................................................................14
Figure 11. CH4 seeps reported in the Atqasuk area shown as red stars (a)........................16
Figure 13. Stable isotope δ13CCH4 and δDCH4 of methane in seep gases from Atqasuk (inside black box, colored circles) and other thermokarst lakes in Alaska and Siberia (outside box, dark green circles); based on Whiticar et al. 1986.......................................22
Figure 14. Molecular (Bernard Ratio) and stable carbon isotope characterization of natural gases, after Whiticar 1996. The concentrations of hydrocarbons and δ13CCH4 value of methane from the Lake Q B1-a and Amaqaruk seep suggest that the gas has become slightly enriched in δ13C since 1996, with a potential increase in higher molecular-weight hydrocarbon concentrations..................................................................23
Figure 15. Researchers investigated cutbanks in the Meade River. ..................................24

vi
Figure 16. After Schwamborn et al. (2000). Chirp and seismic data (1.5 to 11.5 kHz) collected in a thermokarst lake in Siberia reveal a 95-m thick thaw bulb (talik) beneath a shallow lake (left). A schematic (right, not shown to scale) showing potential CH4 sources contributing to total emissions from lakes near Atqasuk: microbial CH4 produced in thaw bulb sediments, coalbed CH4, thermogenic CH4 from deep conventional hydrocarbons, and possibly dissociating CH4 hydrates; courtesy of C. Ruppel. .......................................................................................................25
Figure 17. In April 2008, engineers Schmid and Johnson drilled through lake ice at regular intervals away from the seep to measure the lake bottom depth and probe for frozen vs. thawed sediments. .............................................................................................27
Figure 18. Photo showing ice dome at seep center. ...........................................................28
Figure 19. The concept of using the remains of chironomids (aquatic insects) preserved in dated cores of lake sediments to track the long-term duration and consistency of methane emissions from a lake. .................................................................29
Figure 20. A hotspot of biological activity at the seep site revealed living midge larvae (chironomids) whose radiocarbon age is 1,700 years! Stable isotopes of chironomids also confirmed that methane is making its way into the food web of these organisms. Researchers pick living chironomids from seep sediments (left). An example of a chironomid is shown (right). ........................................................................31
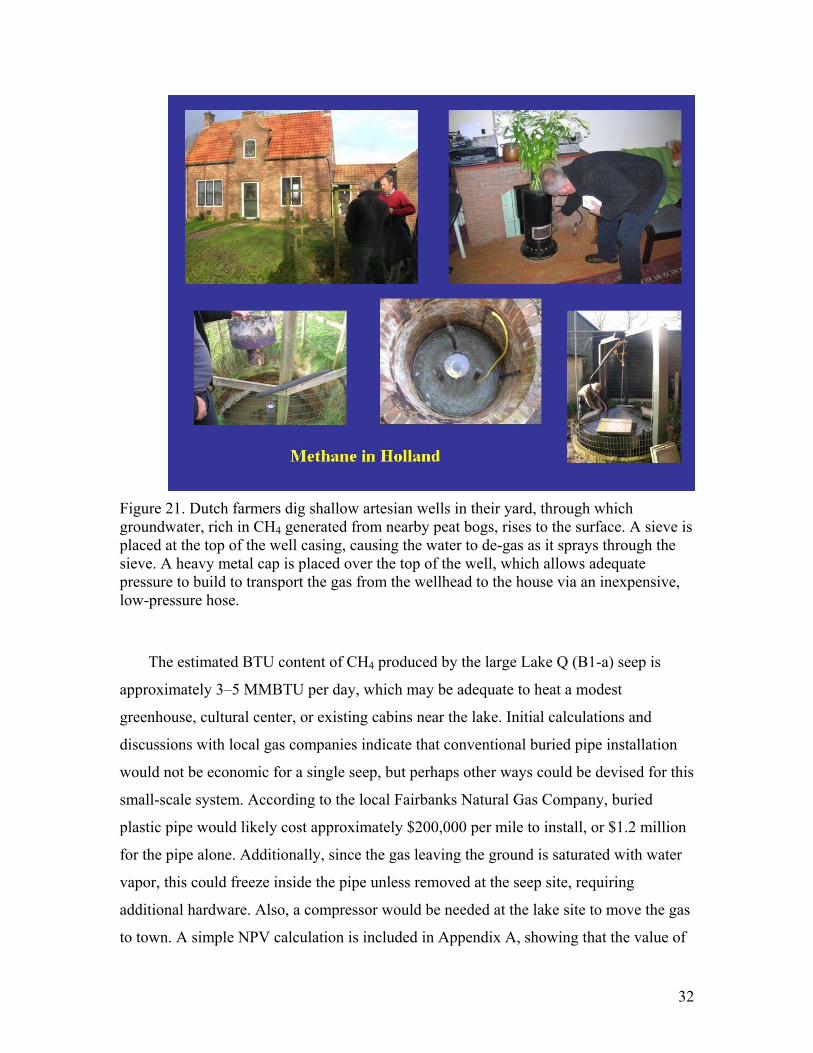
Figure 21. Dutch farmers dig shallow artesian wells in their yard, through which groundwater, rich in CH4 generated from nearby peat bogs, rises to the surface. A sieve is placed at the top of the well casing, causing the water to de-gas as it sprays through the sieve. A heavy metal cap is placed over the top of the well, which allows adequate pressure to build to transport the gas from the wellhead to the house via an inexpensive, low-pressure hose. ........................................................................................32
Figure 22. January 2008 Atqasuk community meeting to discuss the methane seep project (left). April 2008 local residents and UAF student at the Lake Q seep during the gas flare. .......................................................................................................................34
Figure 23. Melissa Smith (UAF undergraduate student) demonstrating a lake sediment grab sampler for collecting lake bottom organisms from methane seep sites (left); Katey Walter (UAF faculty) introducing a methane bubble trap for capturing and collecting gas in lakes (middle); Tom Johnson (UAF staff) showing digital images to kindergarteners at Meade River School. ...........................................................34

vii
LIST OF TABLES
Table 1. Objectives, methods, and products for unconventional CH4 seep research at Atqasuk. ...............................................................................................................................6
Table 2. Number of seeps and estimated flux from observed seep fields near Atqasuk during 2008. .......................................................................................................................17
Table 3. Mixing ratios of CH4, CO2, N2, O2, and CH4, C2–C5 hydrocarbons in gas seeps...................................................................................................................................19
Table 4. Isotope values of methane (δDCH4 and δ13CCH4) and δ13CCO2 in Atqasuk gas seeps...................................................................................................................................20
Table 5. Physical and chemical properties of lake and river water at seep and non-seep sites near Atqasuk. .....................................................................................................25

viii
ACKNOWLEDGMENT
The authors are thankful to the U.S. Department of Energy (USDOE) Arctic Energy
Office for their financial assistance in support of the presented work.

1
INTRODUCTION
Methane (CH4) in natural gas, a major energy source in the U.S., is used extensively
on Alaska’s North Slope, including the oilfields in Prudhoe Bay and the Barrow
community. Smaller remote villages such as Atqasuk (population 300, ~550 miles NE of
Fairbanks), however, depend on expensive imported diesel fuel for both power and
heating, which makes the existence of natural gas seeps near their communities of
significant interest as a potential energy source for local residents.
Huge reservoirs of CH4 exist in the subsurface in Alaska (tens of trillions of cubic
feet; Houseknecht and Bird 2006), contained both within and below permafrost.
Subsurface CH4 is found in association with thick peat, coal seams, gas hydrate
formations, and petroleum deposits. In some areas, CH4 seeps to the surface through
permafrost. Macroseeps emerge as strong, discrete ebullition plumes through lakes,
rivers, and in some cases, dry ground with and without oily sheens (Chapman et al. 1964;
Burruss 1999; Decker and Wartes 2008). In contrast, microseeps may extend laterally
kilometers from the source (Etiope 2004; Etiope et al. 2007). Recent analysis of
atmospheric CH4 indicates a much larger component of geologic CH4 in the global
atmospheric CH4 budget than was previously estimated (Lassey et al. 2007). Globally,
terrestrial seeps may contribute as much as 50–70 million tons of CH4, a potent
greenhouse gas, per year (Etiope et al. 2007), or up to 10% of global sources, with a
substantial proportion of these seeps located in the Arctic. There are critical gaps in our
knowledge of CH4 seeps in the Arctic and their potential for use as an energy source in
remote villages, in particular:
1) The number of CH4 seeps, their proximity to villages, and potential to serve
villages for energy has never been thoroughly identified and mapped. Specific seeps have
been recognized and described on the North Slope of Alaska from as early as 1923
(Burruss pers. comm.); however, the precise number of macroseeps, their proximity to
communities, and the quantity and quality of gas potentially available to villages have not
been well identified. Interest is increasing along with the rising cost of diesel fuel,
currently ~$6/gallon, widely used for heating and power generation in rural Alaska.
Several seeps have been reported within a 25 km radius of the village of Atqasuk, in the

2
heart of the NPRA, but gas flow rates from these seeps have not previously been
measured.
2) Spatial and temporal variability of production dynamics of natural gas seeps
need to be characterized. Thorough flux measurements from arctic terrestrial seeps have
never been made, although spot sampling and observations suggest that large (up to 108-
fold) differences in efflux can occur (von Fischer et al. 2007; Decker and Wartes 2008;
K. Hinkel pers. obsv.; K. Walter unpublished data). The flux of CH4 from discrete seeps
needs to be measured and gas geochemical analysis used to inform climate modeling
about the magnitude of CH4 emissions from the seep-ridden landscape, and about the
lateral extent of deep-sourced CH4 seepage (macro- and microseeps) at the surface, for
use in determining potential future drilling locations (i.e., beneath town).
3) The consistency of gas seepage is unknown, and efforts such as analysis of
methane biomarkers in sediment cores may help to reconstruct the history, strength, and
duration of CH4 seepage over time scales of decades to millennia.
4) Technologies for capture and beneficial use of the CH4 from natural seeps
should be explored including (a) efficient, cost-effective means of transporting CH4 to
Atqasuk from distal seeps and/or (b) shallow drilling beneath Atqasuk if a significant
reservoir is identified there, allowing potentially economical production of high-quality
gas from a well; and (c) collection and utilization of seep CH4. A semi-permanent CH4
collection and transport demonstration system should be designed and constructed to
assess technical challenges associated with future use of seep CH4 as an energy source.
An engineering assessment should be conducted based on synthesis of new data about the
quantity, location, quality, and production dynamics of seeps to determine the feasibility
and cost-effectiveness of environmentally responsible development of CH4 seeps as an
alternative energy resource for Atqasuk.
Addressing these issues requires interdisciplinary science and engineering research
to better characterize arctic CH4 seeps and to assess opportunities for developing this
potentially significant resource. In this study we used a combination of local knowledge,
field measurements, aerial surveys, and laboratory analysis to locate and identify seeps
within a 40 km radius of Atqasuk in order to provide background knowledge for future

3
work on the above-listed knowledge gaps and to provide an initial assessment of the
potential for future development of the gas as an energy source.
An overview of the project objectives, methods, and products appears in Table 1 of
the Experimental section.

4
EXECUTIVE SUMMARY
The objectives of this study were to locate and identify natural gas seeps near the remote Alaskan village of Atqasuk and to evaluate the potential for environmentally responsible development of unconventional natural gas from seeps for local space heating and power generation. Research priorities included identifying and evaluating the quantity, quality, and location of natural seeps, as well as determining potential capture and transport mechanisms necessary for future resource development.
Methane (CH4) in natural gas is a major energy source in the U.S., and is used extensively on Alaska’s North Slope, including the oilfields in Prudhoe Bay, the community of Barrow, and the National Petroleum Reserve, Alaska (NPRA). Smaller villages, however, are dependent on imported diesel fuel for both power and heating, resulting in some of the highest energy costs in the U.S. and crippling local economies. Numerous CH4 gas seeps have been observed on wetlands near Atqasuk, Alaska (in the NPRA), and initial measurements indicated flow rates of 3,000–5,000 ft3 day-1. Gas samples collected in 1996 indicated biogenic origin, although more recent sampling in this study indicated a mixture of biogenic and thermogenic gas. In this study, we (1) located seven seep fields and estimated the amount of CH4 generated by them; (2) collected gas and analyzed its composition from multiple seeps several miles apart to see if the source is the same, or if gas is being generated locally from isolated biogenic sources, and identified the likely source of CH4 (coal seams); (3) cored Qalluuraq Lake (Lake Q) to determine its basal age and potential for paleostudies using chironomid biomarkers; (4) evaluated the potential use of seep methane as an unconventional gas source for the village of Atqasuk; and (5) assessed the magnitude of natural CH4 gas seeps for future use in climate change modeling.
We accomplished and learned the following: (1) Using a combination of local knowledge, aerial photography, and ground-based surveys, located ~10 large seep sites (7 were ground truthed) in the Atqasuk region; (2) Determined that the seeps have a mixed biogenic-thermogenic signature and likely have a coal seam origin; (3) Measured spatial/temporal variability of seep CH4 fluxes using gas traps and flowmeters; (4) Determined the calibrated 11,500 ± 180 calendar years age of Lake Q, the thermokarst lake near Atqasuk with a very large seep, by radiocarbon dating the basal organic material in a sediment core; (5) Found that Atqasuk CH4 seeps are biological hotspots, with evidence that CH4 is fueling modern productivity based on depleted δ13C values and 1,700 radiocarbon-year age of living chironomids (midges), suggesting that these organisms can be used as an indicator of long-time records of gas generation and emission in these lakes; (6) Designed and built a capture system for flux measurements of large and small seeps, and flared the gas; and (7) Conducted an engineering and economic assessment for environmentally responsible development of unconventional CH4 from seeps as an alternative energy source for the remote Alaskan village of Atqasuk. Our recommendation is that transporting gas from the seep sites to town is not cost-effective, but given the widespread distribution of seeps, there is the potential for shallow drilling of coal seams beneath the town.

5
Potential benefits of the project include reduction in the consumption of diesel fuel in Atqasuk both for power generation and home heating (approximately 500,000 gallons per year, current value of $1.5–$3 million per year), and better understanding of gas resources in the NPRA area, with potential larger markets. On the climate-change side, quantifying natural seeps to atmospheric CH4 sources may change our understanding of the global balance between human and natural sources. Recent work revealed that seeps may contribute as much as 50–70 million tones of atmospheric CH4 per year, or ~10% of global sources. Additionally, capture and use of CH4 from seeps mitigates global climate change in two ways: Combusting CH4, a potent greenhouse gas (CH4 is 25 times stronger than CO2 on a per molecule basis), converts it to the weaker greenhouse gases, CO2 and H2O; and use of local CH4 reduces energy consumption associated with diesel usage and shipping to remote villages.

6
EXPERIMENTAL
Objectives and Scope of Study
The overall objective of this effort was to assess the capacity for environmentally
responsible development of unconventional natural gas from observed seeps near the
remote Alaskan village of Atqasuk. Our objectives included quantifying the number,
quality, origin, and location of seeps, designing capture mechanisms necessary for flow
measurements, and assessing the potential future development of the gas as an energy
source.
Questions we aimed to answer were these:
• What is the source of the large Qalluuraq Lake seep?
• What is the best way to look for other large seeps? How many seeps are there?
What is their origin? What is their net production of methane?
• Is there enough gas from the Qalluuraq Lake seep and others to provide energy
economically for the village of Atqasuk?
• Should gas be captured at the surface and transported above ground to town?
• Is drilling for shallow gas a good idea? Could wells be drilled in the village of
Atqasuk, where it could be used, or is the lake with the largest seep, Qalluuraq
Lake, the best drilling site?
Table 1. Objectives, methods, and products for unconventional CH4 seep research at Atqasuk.
Objectives Methods Products Review of traditional knowledge of Atqasuk residents to locate seeps
Town hall meeting and map of potential seep locations marked.
Acquisition and analysis of low altitude aerial photographs and thermal infrared images to locate CH4 seeps as open hole “hotspots” in early winter lake ice.
Map and aerial photographs showing seep locations.
Locate, identify, and map natural gas seeps within 40 km of the village of Atqasuk (Task 1)
Field validation of seep identification by visiting seep sites located by above methods to measure fluxes, sample gas, measure limnology, and assess potential to service Atqasuk.
Database of flux and geochemistry for individual seeps and limnology of seep sites.

7
Estimate methane production rates from active seeps near Atqasuk (Task 2)
Short-term (minutes-hours) measurement of flux from small (<1 m) seeps in lakes and rivers using underwater/under-ice bubble traps and other flowmeter technology.
Data for fluxes from at least 5 individual seeps, seasonal measurements from the large seep.
Provide geochemical interpretation to infer gas origin and quality (Task 3)
Geochemistry: Measurement of mixing ratios, stable isotopes (D/H, 13C/12C) and 14C-age of CH4, C2–C5 hydrocarbons and CO2 in field samples collected from seeps.
Inference of seep gas origin as thermogenic vs. biogenic, young vs. old.
Core lake to investigate possibility of establishing a long-term record of seep emission consistency (Task 4)
Extract sediment cores from thermokarst lakes to determine basal age of lake and to analyze chironomid biomarkers in seep sediments cores to assess their potential use as a record of the long-term (10–103 yr) dynamics of CH4 seepage from active seeps.
Basal age of thermokarst lake; isotopic signature of chironomid biomarkers; other evidence of origin and dynamics of methane seepage.
Design and install a pilot CH4 collection system to collect and measure flux from 4 large seeps
Data on flow rate from large seep.
Demonstrate use of CH4 by flaring the gas. Photographs and video of methane flare.
Engineering assessment and demonstration of the development of seep methane for energy use in rural Alaska (Task 5)
Conduct a feasibility study including an economic analysis and engineering feasibility for providing unconventional CH4 gas to Atqasuk residents.
Initial economic feasibility report as part of Final Report.
Education and outreach (Task 6)
Share research objectives, concepts, and project ideas with the K–12 public school and residents in the remote village, Atqasuk.
Four classroom visits at the Meade River Elementary School; field trip to seep site with 5 Atqasuk residents; 2 open town hall meetings in Atqasuk.
Briefings/reports Synthesize and publish results. Final Report; peer review publication.
Study Area
At elevations of only 15–25 m above sea level, the immediate Atqasuk area is
characterized by low-lying tundra, wetlands, lakes, and the Meade River drainage, with
few bedrock and coal outcrops.

8
Figure 1. Regional map of northern Alaska showing location of Atqasuk, a rural village surrounded by unconventional natural gas seeps.
Time Line and Summary of Work
September 1996: Qalluuraq Lake (Lake Q) Seep (B1-a) was sampled by ConocoPhillips.
August 2007: PI Katey Walter sampled gas from Lake Q seep for geochemical analysis.
January 2008: Walter and field assistants, Peter Anthony and Doug Whiteman (Atqasuk
resident) measured gas flow from seep, equivalent to 3,000 ft day-1 under
conditions of poor visibility, -46°C, possible insufficient seal over the seep on
ice. They discovered an abundance of midge larvae (chironomids) associated
with the seep. The seep was photographed with digital and thermal infrared
cameras. Researchers conducted a town hall meeting with Atqasuk residents,
and 3 residents accompanied them to the field.
April 2008: PIs Walter and Witmer returned with several field assistants to the Lake Q
seep under fair conditions (-7°C) and measured gas flow through seep during 3
days, ~5,000 cubic feet per day. Researchers collected gas and lake sediments
for radiocarbon dating and geochemical analyses. The chironomid community
was sampled as a potential means for determining how long the seep has been
active. The team attempted to measure thaw bulb thickness (at least 5.9 m), and
measured the bathymetry and hydrology of an ice-free cavern associated with
the Lake Q seep. A second seep (Amaqaruk, B10), located in the Meade River,
was identified, measured (~12 cubic feet per day), and gas sampled for

9
geochemical analysis. Limnological parameters were measured at both seep
sites. Researchers conducted a town hall meeting with Atqasuk residents, and 5
residents accompanied them to the field. Researchers visited 4 classrooms at the
Meade River Elementary School with demonstration and instruction related to
the CH4 study.
October 2008: PI Walter conducted one hour of aerial surveys with field assistants Matt
Nolan and Doug Whiteman over the Atqasuk area. They identified 10 potential
seep sites from the air. Seven of the 10 sites have been ground truthed as actual
CH4 seeps. By November 2008, flow measurements were conducted and gases
collected for geochemical analysis at 5 seep sites (B1-a, B1-b, B7, B9, B10).

10
RESULTS AND DISCUSSION
Task 1. Locate, identify, and map natural gas seeps within 40 km of the village of Atqasuk
Meetings with local residents suggested that 3 additional seeps could be found near
Lake Q and the village of Atqasuk. GPS coordinates were recorded, and the suspected
seep sites were marked on a map (Fig. 2). Subsequent efforts to locate these seeps in
April–May 2008, even with local guides, produced only 1 additional seep (Amaqaruk
Seep on the Meade River). Our effort and that of Atqasuk residents to locate additional
seeps using snow machines took 6 full days (20+ person days).
Amaqarukseep
Meade River
Figure 2. Locations of the validated CH4 seep, Qalluuraq (Lake Q), and 3 additional suspected sites (white triangles) based on local knowledge of Atqasuk residents. The Amaqaruk Seep on the Meade River was located and measured in April 2008. Field-validated sites are indicated by red stars.
Quantifying CH4 emissions from arctic lakes is difficult due to the inaccessibility of
the terrain, but a new technique has recently been developed that maps the locations of
active seeps by surveying early winter lake ice (Walter et al. 2006, 2008a). As water
freezes in lakes, CH4 bubbles are trapped in ice. The convection associated with strongly
bubbling seeps (hotspots) prevents freezing, leaving open holes in lake ice (Fig. 3) that
are easily identified in early winter aerial and remote sensing imagery as dark holes that
contrast against white, snow-covered ice. Aerial photography has been used to quantify

11
CH4 seeps in lakes over hundreds of kilometers of Siberian tundra (Walter et al. 2006),
and it has potential for locating natural gas seeps on the North Slope. PI Walter attempted
this new method for locating CH4 seeps near Atqasuk in October 2008 by flying aerial
surveys and searching for open holes in lake ice. Ten potential seep sites were identified
during 1 hour of aerial surveying (Fig. 4). Survey time was limited by Frontier Airline’s
commercial flight schedule. Examples of seeps seen from air in winter and summer are
shown in Figure 5.
Figure 4. Flight path for 1-hour aerial survey for CH4 seeps in October 2008. Observed potential seeps were photographed, and GPS coordinates were recorded. Approximate locations are marked as B1–B10 on the map.
Figure 3. Convection associated with hotspots of methane bubbling maintains open holes in early winter lake ice, which are visible in aerial photographs as dark spots contrasted against white snow- and ice-covered lakes. Photo taken at a thermokarst lake in Siberia by K. Walter.
Methane bubbling hotspots
12
3-m30-m30-m
Figure 5. B1-b seeps as seen from the air in October 2008 (left). Qalluuraq Lake CH4 seeps (B1-a) as seen from the air in August 2007 (right). Photo by K. Walter.
As of December 31, 2008, seven of the potential ten seep sites have been ground
truthed. Gas flux has been measured at five sites, and samples collected for geochemical
analysis. Photographs of several of the seeps, including gas-sampling efforts, are shown
in Figure 6–Figure 9.
Figure 6. Qalluuraq Lake Seep in October 2008 (left), January 2008 (middle), and August 2007 (right). Photos by K. Walter.

13
Figure 7. Thermal infrared photograph of Walter collecting gas from ice-sealed Lake Q seep in January 2008. White indicates the hottest temperature, emitted through thin ice cover over the seep. Photo by P. Anthony.
Figure 8. At individual seep sites, Walter and Whiteman measure water depth (left), count the number of seeps visible in open holes (other seeps are present but not visible beneath the snow) (middle), and collect gas using underwater bubble traps for laboratory analysis of gas constituents and geochemistry (right). Photos by D. Whiteman and K. Walter.

14
Figure 9. Amaqaruk Meade River seeps (B10). Researchers found this naturally occurring, large, ice-free hole due to convection of gas seepage through 3.2-m deep water (left). Such open holes on lakes and rivers are a hazard to snow machine travelers who may not see the open water until it is too late. Poles and flags were placed adjacent to each of the seeps as an indicator of the seep location to warn snow machine travelers, thanks to the foresight of D. Whiteman. Walter measured gas flow (~12 ft3 day-1) with submerged bubble trap from 3 individual seeps (right). Photos by K. Walter and T. Johnson.
Task 2. Estimate methane production rates from active seeps near Atqasuk
We estimated the methane flux from active seeps near Atqasuk during several times
of the year using underwater bubble traps (Figs. 8, 9) and gas flowmeters (Fig. 10).
Figure 10. Gas flow of ~3,000 ft3 day-1 from seeps was measured in January 2008 (left) and of ~5,000 ft3 day-1 in April 2008 (middle) using ice-cover to seal the seep and direct flow through a 1″ ID pipe for direct flux measurement using an anemometer. Anemometer measurements were calibrated by flowmeter tests and visual reconstruction in a water tank in the laboratory (left). Photos by P. Anthony and K. Walter.

15
In January 2008, PI Walter led a small team of researchers (Walter, Anthony,
Whiteman) to measure the flow rate of methane from the Lake Q seep (B1-a) near
Atqasuk. These measurements were made under adverse conditions (-46°C, little
daylight, in January), but the measurements seem to consistently indicate that the flow
rate was approximately 3,000 cubic feet per day, and that the gas is methane. This flow
rate is considerably higher than found on typical lakes where methane is produced from
decaying vegetation on the bottom of the lake at a rate of less than 1 ft3 day-1 per seep
(Walter et al. 2006). We calibrated the anemometer measurements using flowmeter tests
and visual reconstruction in a water tank in the laboratory. Error was calibrated at 0.2%,
better than nominal instrument precision.
In April 2008, a larger team (Walter, Witmer, Schmid, Johnson, Wooller, and Smith)
returned to Atqasuk for a second expedition. The team worked at the Lake Q seep site
(B1-1), ~6 miles out of town for 3 days, and at a site ~20 miles from town (Amaqaruk)
on the Meade River for 1 day. The team collected samples of gas from seeps, measured
seep flow rates, collected cores of sediments from the lake bottom, and measured ice
thickness and other lake features associated with the methane gas seeps.

16
10-kmN
Atqasuk
Qalluuraq seep
Mead River70° 28.380N 157° 24.678W Meade River
Figure 11. CH4 seeps reported in the Atqasuk area shown as red stars (a). The Qalluuraq Lake seep is of interest as an energy source given preliminary measurements of high flow rates and CH4 concentration.
In October 2008, PI Walter returned to Atqasuk to conduct aerial and ground
surveys, accompanied by M. Nolan and D. Whiteman. Within the 1 hour of flying
available using a small aircraft, 8 additional new potential seep sites were located,
making a total of 10 for the small area surveyed (Fig. 11). Walter obtained GPS
coordinates accurate to ~±250 m from the low-flying aircraft, while Nolan shot aerial
photos from the back of the aircraft. Investigators traveling by snow machine ground
truthed seep sites during the subsequent 1.5 days. They visited 3 of the 8 new seep sites
and confirmed that each had significant bubbling columns, and they obtained accurate
(±1–5 m) GPS coordinates for the seeps. They measured flow rate from 1 seep and

17
collected gas for geochemical analysis. Poor weather prevented further ground truthing
during that trip. In November, Whiteman visited 3 additional seep sites and conducted
measurements identical to those that Walter and he had conducted in October: that is,
counted the number of bubbling columns, acquired accurate GPS coordinates,
photographed the seep, and collected gas using gas bubble traps. Single seep sites
contained as many as 68 individual bubbling columns, ranging in magnitude of flux
(Table 2). Seven of the 10 seep sites have now been ground truthed. It is likely that there
are numerous other methane seeps in this region. We expect that further flying time for
aerial surveys would yield location and identification of more seep sites.
Table 2. Number of seeps and estimated flux from observed seep fields near Atqasuk during 2008. Seep field site Water Body Type Observed number of seep Gas seepage Methane production Max water depth
(L day-1) (kg CH4 yr-1) (m)
B1-a Lake (Lake Q, main seep) one large seep, +101 to102 of small seeps 141,600 36,900 2.2B1-b Lake at least 28 seeps 3,700 954 ~2B2 Lake at least 58 seepsB5 Lake at least 54 seepsB6 Lake nothing verifiableB7 Lake at least 64 seeps 14,000 3,625 1.3B8 Meade River lead nothing verifiableB8x Meade River nothing verifiable, probably sand barB9 Lake at least 3 seeps 560 129 1.5B10 Amaqaruk Meade River 3 seeps 540 125 3.2Possibility wetlands NW of Atqasuk nothing verifiable, local knowledge source *Seepage rates are minimum estimates because we observed innumerable seeps beneath the snow and ice that we were unable to feasibly count under the harsh field conditions.
2
2.4
2.8
3.2
3.6
13:42 13:42 13:43 13:44 13:45 13:45 13:46 13:47 13:48 13:482
2.4
2.8
3.2
3.6
4
13:10 13:11 13:12 13:12 13:13 13:14 13:14 13:15 13:16 13:17
m/s
ec
Gas flow (m/s)
Time (hr:min) Figure 12. Flow data for the Lake Q B1-a seep on April 22, 2008.
Flow measured from the large Lake Q seep was considerably higher in April 2008
(3.0 ± 0.0 m/s, n=288, approximately 5,000 ft3/day) compared to the January 2008 flow
measurements (2.0 ± 0.1 m/s, approximately 3,000 ft3/day). The difference could be real,

18
but the January 2008 measurements were conducted under extremely harsh conditions
(-46°C and darkness), and therefore may not be as reliable as those conducted under
warmer, brighter spring conditions. The stability of the short-term flow measurements in
April suggests that over the course of several hours-days, flow velocity was consistently
~3 m/s. We recommend long-term flow monitoring of the seep to determine potential
seasonal and interannual variability.
We measured seepage rates from multiple seeps in each of the seep fields and
counted the number of seeps visible in the open-ice holes in October 2008. The number
of seeps was multiplied by the measured seepage rates, and assuming consistent year-
round seepage rates, we estimated annual emissions from the seep fields near Atqasuk
(Table 1). Scaling emissions from measured seeps to the potential 10 seepage fields
identified in October 2008, the total emissions from the seeps would be 6,200 ft3 d-1
(175,500 L d-1). This flow is considerably higher (>10,000 times) than that found in
typical lakes where CH4 is produced from decaying lake-bottom vegetation at less than 1
ft3 day-1 (Walter et al. 2006, 2008), and greater than the sum of 5 terrestrial natural
petroleum seeps measured in the Ojai Valley, California (1,942 ft3 day-1; Duffy et al.
2007). The source of this Lake Q CH4 seep is thus of considerable interest.
Task 3. Geochemical interpretation as inference of gas origin and quality
Distinguishing the source and origin of CH4 from seeps is complicated by the
numerous source and production pathways that can contribute to seep gas. The most
widely employed approach for discriminating gas sources is based on the stable isotopic
composition (δ13C and δD) of CH4 and the relative abundance of low molecular-weight
hydrocarbons (Figs. 13 and 14; Schoell 1983, 1984; Faber 1987; Whiticar 1999). In
general, “microbial” CH4 is 13C-depleted and contains a lower relative concentration of
higher hydrocarbons (expressed as the Bernard ratio, C1/[C2+C3]) than “thermogenic”
CH4. Microbial CH4 synthesized by the carbonate reduction pathway tends to be more
depleted with respect to 13C and D than CH4 from acetate fermentation. For thermogenic
sources, further differentiation as either coal-bed CH4 or natural-gas CH4 is possible
because humic organic matter (the source of coal-bed CH4) is generally more

19
13C-enriched than sapropelic organic matter (the source of conventional natural gas)
(Whiticar 1996).
In mixed systems, differentiating gas sources using this approach is difficult. For
example, in microbial systems where carbonate reduction dominates, the δ13C signature
of the CH4 is controlled by the δ13C signature of the CO2 (Whiticar 1999). Therefore,
accurate classification also requires analyzing the δ13C of the CO2 (Walter et al. 2008b;
Pohlman et al. in prep). Further source distinction is possible using radiocarbon dating of
terrestrial seep CH4, because a large percentage of the microbial gas is derived from
relatively young (e.g., <50 ka) organic matter (Walter et al. 2006, 2008b).
We measured mixing ratios of CH4, CO2, N2, and O2, and CH4, C2–C5 hydrocarbons
as well as stable isotopes (D/H, 13C/12C) and 14C-age of CH4 in field samples collected
from seeps near Atqasuk.
Table 3. Mixing ratios of CH4, CO2, N2, O2, and CH4, C2–C5 hydrocarbons in gas seeps.
Field Date Analyzer Site CH4 CO2 N2 O2 ethane C3+ Bernard Ratio(%) (%) (%) (%) (%) (%) C1/(C2+C3)
Sep. 1996 ConocoPhillips Lake Q (B1-a) 93.1 0.3 4.4 2.1 0.0052 0.001 15,016Apr. 23, 2008 UC Santa Barbara, D. Valentine Lake Q (B1-a) 97.7 1.2 1.0 0.1 0.01 - 0.05* 0.005 1,915 - 8,880Apr. 23, 2008 UAF, K. Walter Lake Q (B1-a) 99.4 1.3 1.4 0.3 0.00020Apr. 24, 2008 UAF, K. Walter Lake Q (B1-a) 98.5 1.3 2.6 0.6 0.00020Apr. 23, 2008 UC Santa Barbara, D. Valentine Amaqaruk (B10) 85.9 ± 0.37 0.6 ± 0 12.1 ± 0.4 1.4 ± 0 0.01 - 0.05* 0.005 1,690 - 7,820Apr. 23, 2008 UAF, K. Walter Amaqaruk (B10) 88.4 0.4 10.8 2.6 0.00020Oct. 10, 2008 UAF, K. Walter B1-b 97.1 0.2 5.3 1.9 *poor separation of ethane from large methane peak on gas chromatograph
The largest methane seep, Lake Q B1-a, in the study area had a methane
concentration of 97.7–99.4% in 2007–2008 (Table 2). This is 6% higher than what
ConocoPhillips measured 12 years earlier. In 2008, the smaller seep near Lake Q B1-a
(B1-b) had a similar methane concentration (98.5%), whereas the more distant Amaqaruk
(B10) seep on the Meade River had a lower methane concentration (85.5–88.4%). We
attribute the difference to water depth and gas diffusion. Bubbles emitted through the
Lake Q seep rise through ~2 m of water, whereas bubbles from the river seep rise through
3.2 m of water (Table 2). As bubbles rise from the sediments through the water column,
air diffuses into the bubbles throughout the deeper water column at the river site, while
CO2 and CH4 diffuse out along a concentration gradient.

20
Note that we observed a strong H2S odor at the seep sites; however, H2S was not
detected on the gas chromatograph. It was likely present, but subsequently oxidized in the
sample bottles in the presence of a small amount of O2 prior to analysis in the lab.
Table 4. Isotope values of methane (δDCH4 and δ13CCH4) and δ13CCO2 in Atqasuk gas seeps.
Analyzer Site Field Date δ13CCH4 δ13CCO2 δDCH4
(‰) (‰) (‰)ConocoPhillips Lake Q (B1-a) Sep. 1996 -59.15 -248.6Florida State, L. Brosius Lake Q (B1-a) July 25, 2007 -59.18 -27.71 -237.1 ± 0Florida State, L. Brosius Lake Q (B1-a) Aug. 8, 2007 -58.58 -24.82 -235.9 ± 0.7Florida State, J. Chanton Lake Q (B1-a) Aug. 12 2007 -56.9 ± 0.9 -39.5 ± 0.5 -231.5 ± 1.3Florida State, J. Chanton Lake Q (B1-a) Aug. 12 2007 -53.5 ± 0.5 -39.3 ± 0.2Florida State, J. Chanton Lake Q (B1-a) Jan. 16, 2008 -57.24 -32.22 -228.85Florida State, J. Chanton Lake Q (B1-a) Jan. 16, 2008 -57.22 -32.69 -229.91Florida State, J. Chanton Lake Q (B1-a) Jan. 16, 2008 -57.35 -32.12 -230.26Florida State, J. Chanton Lake Q (B1-a) Jan. 16, 2008 -57.34 -32.58 -229.11Florida State, J. Chanton Lake Q (B1-a) Apr. 22, 2008 -57.45 -33.98 -228.13Florida State, J. Chanton Lake Q (B1-a) Apr. 22, 2008 -57.39 -33.57 -228.53Florida State, J. Chanton Lake Q (B1-a) Apr. 22, 2008 -57.27 -33.65 -227.39Florida State, J. Chanton Amaqaruk (B10) Apr. 23, 2008 -56.68 -26.16 -236.77Florida State, J. Chanton Amaqaruk (B10) Apr. 23, 2008 -56.77 -26.23 -236.50Florida State, J. Chanton Amaqaruk (B10) Apr. 23, 2008 -56.73 -26.94 -236.24
Methane production pathway
Methanogenesis is an ancient process that relies on relatively simple substrates—for
example, carbon monoxide, carbon dioxide, acetate, formate, methylamine, methanol,
and dimethylsufide—that are produced by other metabolic processes (Conrad 1989). The
two main pathways of bacterial methane production in anaerobic sediments are CO2
reduction and acetate fermentation:
2CH2O + 2H2O → 2CO2 + 4H2 (fermentation/syntrophic oxidation) (1)
CO2 + 4H2 → CH4 + 2H2O (CO2 reduction) (2)
CH3COOH → CH4 + CO2 (acetate fermentation) (3)
21
To estimate the relative proportion of these two major pathways of methanogenesis
we calculated the apparent C fractionation factor (αC) between CH4 and CO2 (Whiticar et
al. 1986; Hornibrook et al. 2000). The αC is defined as
)10()10(
34
13
32
13
++
=CH
COc C
Cδδ
α
where δ13CCO2 and δ13CCH4 represent the δ13C of CO2 and CH4 in bubbles, respectively.
This estimation of αC is approximate because CH4 and CO2 are not related in the same
way for the CO2 reduction and acetate fermentation pathways; however, αC values have
been utilized to differentiate between dominant pathways of methanogenesis in natural
and artificial systems (Sugimoto and Wada 1993; Waldron et al. 1999b; Chasar et al.
2000a; Chanton et al. 2006; Prater et al. 2007). The CO2 reduction pathway has a larger
apparent C fractionation factor (Eq. 3, αC = 1.055–1.090) than acetate fermentation (αC =
1.040–1.055) (Whiticar et al. 1986).
The αC of gases from the Lake Q B1-a and Amaqaruk B10 seeps were 1.06,
suggesting that if the methane is of biogenic origin, then it is produced via the CO2
reduction pathway.
However, without further information, the αC has limited diagnostic power, given
that a host of factors such as environmental variability, temperature, substrate
concentrations, available Gibbs free energies, and the possibility of mixed thermogenic
sources leads to variability in αC (Valentine et al. 2004; Conrad 2005).

22
-120
-100
-80
-60
-40
-20
0-50-150-250-350-450
Other Alaskan and Siberian thermokarst lakes
Lake Q (B1-a), ConocoPhillips Sep. 1996
Lake Q (B1-a), July/Aug. 2007
Lake Q (B1-a), Jan. 2008
Lake Q (B1-a), Apr. 2008
Amaqaruk (B10), Apr. 2008
-70
-65
-60
-55
-50-260 -250 -240 -230 -220
δ13CCH4(‰)
δDCH4 (‰)
δDCH4 (‰)
δ13CCH4(‰)
Figure 13. Stable isotope δ13CCH4 and δDCH4 of methane in seep gases from Atqasuk (inside black box, colored circles) and other thermokarst lakes in Alaska and Siberia (outside box, dark green circles); based on Whiticar et al. 1986.
Stable isotope (δ13CCH4 and δDCH4) data of methane from seeps near Atqasuk showed
a mixed biogenic-thermogenic signature (Fig. 13). Samples collected from the large Lake
Q (B1-a) site by ConocoPhillips in 1996 had a relatively larger contribution from
biogenic methane, while samples collected in 2007 and 2008 had a progressively more
thermogenically-enriched signature. One possibility is that there is a seasonal pattern to
the isotopic composition, perhaps as a function of temperature-dependent biological
processes; however, seasonal data from multiple years would be required to confirm this.
In contrast, the majority of methane seeps in Alaska and Siberia measured by PI Walter
outside the Atqasuk study region were of biogenic origin, providing a contrast to the
more thermogenically anomalous Atqasuk seeps.
Preliminary radiocarbon data suggest that CH4 from the Atqasuk seeps is
radiocarbon dead while, in comparison, seeps from other thermokarst lakes in Alaska and
Siberia had 14CCH4 ages ranging from modern to 43,000 years (Walter et al. 2006, 2008).
Analytical errors in the Florida State Laboratory in August 2008 require re-running
samples from this study for more precise error information. These analyses are underway.
We expect to present publishable data by March 2009 for a peer-reviewed publication.

23
b) Lake Q (B1-a), ConocoPhillips Sep. 1996Lake Q (B1-a), Apr. 2008Amaqaruk (B10), Apr. 2008
Figure 14. Molecular (Bernard Ratio) and stable carbon isotope characterization of natural gases, after Whiticar 1996. The concentrations of hydrocarbons and δ13CCH4 value of methane from the Lake Q B1-a and Amaqaruk seep suggest that the gas has become slightly enriched in δ13C since 1996, with a potential increase in higher molecular-weight hydrocarbon concentrations.
Geologic context and origin of methane
Several geologic scenarios could explain the vigorous gas seepage near Atqasuk.
Interpretation of existing data is complicated by the fact that samples of the gas collected
~11 years apart yielded strikingly different carbon (δ13C) and hydrogen (δD) isotopic
signatures upon analysis. Their Bernard Ratios were also different. The first sample,
collected in September 1996, is interpreted as largely biogenic (microbial) in origin,
whereas the 2007 samples are interpreted as a mix of thermogenic and biogenic CH4.
From these several samples, it is unknown whether this difference reflects a long-term
trend, seasonal variations, or some other underlying cause. Coal seams are abundant in
the part of the Nanushuk Formation underlying the study area (Roberts et al. 2006), and
constitute an additional potential source of unconventional biogenic CH4. Coalbed
methane is under development as a rural energy source for the nearby North Slope village
of Wainwright (U.S. Department of the Interior Alaska Rural Energy Project, A. Clark
and R. Fisk). Data on vitrinite reflectances from this area should indicate whether coal

24
seams in the vicinity (or within the greater hydrocarbon migration fetch area) are
sufficiently thermally mature to have sourced thermogenic gas (Kaba 2004; Strapoc et al.
2006).
Figure 15. Researchers investigated cutbanks in the Meade River. They found pieces of coal near both the Lake Q (B1-a) and Amaqaruk (B10) seeps.
Whatever its ultimate source, the gas might be escaping from a subsurface
accumulation of finite areal extent and thickness. One possibility is that there is a shallow
conventional sandstone reservoir with a structural or stratigraphic trap, whose top seal
has been breached by erosion. Alternatively, free gas in a shallow sandstone reservoir
might have been trapped and sealed by once-impermeable permafrost that has
subsequently been intersected and compromised by the thaw bulb beneath the lake (Fig.
16). To date, geophysical techniques have rarely been used to describe the 3D
characteristics of thermokarst lakes. Either ground-penetrating radar (GPR) or high-
resolution seismic data should be capable of resolving such a free-gas interface, provided
it occurs within the imaging range. Additional possibilities that should be evaluated
include unconventional reservoir situations, such as ongoing desorption from a shallow
coalbed CH4 accumulation or dissociation of a shallow gas hydrate accumulation
(Praveen et al. 2008). Finally, the seep could simply represent the surface intersection of
an active gas migration path, by way of either a permeable carrier bed (stratal migration)
or a fault or fracture network (cross-stratal migration). Such a conduit may or may not be
s to

25
connected to a leaking gas reservoir located at depth, well beyond the reach of erosion,
permafrost thaw effects, or other near-surface processes.
a b
Figure 16. After Schwamborn et al. (2000). Chirp and seismic data (1.5 to 11.5 kHz) collected in a thermokarst lake in Siberia reveal a 95-m thick thaw bulb (talik) beneath a shallow lake (left). A schematic (right, not shown to scale) showing potential CH4 sources contributing to total emissions from lakes near Atqasuk: microbial CH4 produced in thaw bulb sediments, coalbed CH4, thermogenic CH4 from deep conventional hydrocarbons, and possibly dissociating CH4 hydrates; courtesy of C. Ruppel.
Limnology
Limnological data were collected from the seep sites using a Hydrolab instrument
(Table 5).
Table 5. Physical and chemical properties of lake and river water at seep and non-seep sites near Atqasuk. Date Site Depth temp pH DO DO SpC redox salinity
(m) (°C) (mg/L) (%) (ms/cm)2008-Apr-21 Lake-Q (B1-a) 0.5 -0.3 7.22 1.11-0.99 8.6-7.9 0.22-0.24 228 0.112008-Apr-21 Lake-Q (B1-a) 1.7 -0.3 6.94 1.15 11.3 0.16-.22 235 0.082008-Apr-21 Lake-Q 200m coring site 1.5 0.06 7.01 1.45 11.8 0.15 2.79 0.072008-Apr-23 Amaqaruk (B10) 3.2 0.78
26
Water temperatures at the seep and non-seep (Lake Q 200 m coring) sites were near
the freezing point of water. The river and lakes were still covered with ice in April,
except where active seeps maintained open holes in lake ice. In some places, the open
holes were hidden by thick overburden of soft snow and, as such, are a hazard to snow
machine travelers.
Other parameters were surprisingly similar between the seep and non-seep site. The
pH was slightly more acidic at the bottom of the seep than at the top of the water column.
The oxygen content in both sites was low.
Thaw bulb determination
We inserted a galvanized steel pipe to probe the thickness of the thaw bulb at the
Lake Q (B1-a) site. At 5.9 m into the sediments, our probe hit an impenetrable layer,
which most likely was permafrost. Geophysical measurements would be useful in further
determining the thaw bulb dimensions of this lake as well as the subsurface sedimentary
and tectonic features.
Bucket-hollow test
One interesting observation made during ice-hole drilling to allow coring of lake bed
sediment was that each time a new hole was made, the water level in the existing holes
did not immediately rise to a level that would be expected for floating ice. Only after
some time did the water approach near the surface. Also, it was noted that the further
from the central flow area one drilled, the thicker the ice was, with ice forming to the
bottom about 10 m from the center of the seep.
One of the core access holes was expanded to allow passage of a 5-gal plastic
bucket, and water was deliberately removed until the water level dropped approximately
16 in. About 225 gal of water had been removed to reach this point. A camera was
inserted in the access hole, and several photographs were taken, until it was recognized
that the gas in the cavity was likely a combustible mixture in a somewhat confined area,
creating a possible safety issue if a spark were generated. This examination revealed that
the top of the cavity was dome shaped.

27
After approximately 75 min, the water level rose to just below the surface of the ice,
indicating that water was infiltrating from the unfrozen layer of lake sediments.
Figure 17. In April 2008, engineers Schmid and Johnson drilled through lake ice at regular intervals away from the seep to measure the lake bottom depth and probe for frozen vs. thawed sediments.

28
Figure 18. Photo showing ice dome at seep center.
Task 4. Core lake to investigate possibility of establishing a long-term record of seep emission consistency
The sustainability of harnessing CH4 from seeps as a source of energy depends to
some extent on the duration of CH4 emissions from seeps. Several related questions arise
including the following: Do tundra seeps emit CH4 over time scales of decades or
millennia? Do tundra seeps turn on and off? If so, over what time scales? By looking at
the stable carbon isotope (δ13C) composition of the remains of chironomids (small
aquatic insects) preserved in radiocarbon-dated sediment cores from the seep sites, it is
possible to determine the time scales and periodicity of CH4 emissions from the active
seeps near Atqasuk (Fig. 19). Chironomids, which are ubiquitous and numerous in lakes,
carry a CH4 signature because they feed on CH4-oxidizing bacteria. δ13C analysis of
modern chironomids and their chitin-rich head capsules, which are well-preserved in lake
sediment cores, have shown that these samples serve as an excellent chemical biomarker
of whether CH4-derived C formed part of their diets (e.g., Grey 2006; Kankaala et al.
2006; Eller et al. 2007; Deines et al. 2007a,b; Wooller et al. 2007). This is because CH4

29
has a negative δ13C signature: δ13C = -57‰ at the Lake Q seep, and as negative as -80‰
at other lake bubbling sites (Walter et al. 2008) relative to plant-derived organic matter in
Alaska (e.g., δ13C ~-27‰; Wooller et al. 2007c). Instances where the δ13C of the
chironomids is lower than the total organic carbon (TOC) and less than -35‰, will be
taken to indicate that CH4-derived carbon composed the diet of past chironomids and that
CH4 was being emitted at the lake sites.
Methane production
ModernTi
me
Past
C14 age
δ13C
C14 age
δ13C
δ13C
δ13C
C14 age
δ13C
δ13C
Radiocarbon analysesof plant remains incore to establish a
timeline
Stable carbonisotope analyses ofchironomid remains
as biomarker ofmethane
δ13CMethane signature
Theduration ofthe most
recentperiod ofmethane
emissions
A periodof past
methaneemissions
Noevidence
of methaneemissions
Figure 19. The concept of using the remains of chironomids (aquatic insects) preserved in dated cores of lake sediments to track the long-term duration and consistency of methane emissions from a lake.
In April 2008, we obtained a lake sediment core 200 m away from the seep site to
avoid disturbance of anomalous sediment deposition associated with strong seepage. We
dated the age of the lake (i.e., its date of formation) using radiocarbon dating (accelerator
mass spectrometry [AMS]) of plant and algal remains preserved in the bottom of the
core. Plant fossils were removed from samples of the sediment taken from the bottom and
top of the core and analyzed for stable isotopes and/or radiocarbon age. Chironomids
living at the seep site were collected in January and April 2008 (Fig. 20), and also were

30
radiocarbon dated using AMS dating. Calibrated dates are presented here in calendar
years before present (cal yrs BP), using standard published protocols (Stuiver et al.
1998). We did not date the remains of aquatic insects preserved in the core, because if
CH4-derived carbon formed part of the organism’s past diet, the organism will have
retained the old age of this prior CH4. Previous results from sediment taken at sites north
of the Brooks Range in Alaska (Oswald et al. 2003; Eisner 1991; Eisner and Peterson
1998; Eisner and Colinvaux 1992; Hinkel et al. 2003) indicate that simply acquiring a 1m
core from our study sites is likely to yield a temporal record >1,000 years, considerably
longer than the modern climate data recorded for arctic Alaska. We were pleased to learn
that the age of Lake Q, or its date of formation, is 11,500 ± 180 cal yrs BP. This age and
the observed stratigraphy seem consistent with other sites in the region (Eisner 1991).
Our data suggest that carbon energy derived from seep methane is being transferred
to modern organisms living in the seep environment. Stable C isotope values of modern
benthic invertebrates (live chironomid larvae) from the large Lake Q (B1-a) seep, which
is known to be emitting methane with a δ13C value of -57‰), were as low as -45 per mil.
This level is considerably lower than the δ13C of the total organic carbon content of the
sediment (-30‰) and is in keeping with values that have been taken to indicate
consumption of biomass derived from methane oxidation in other lake systems (i.e., Grey
et al. 2005). Radiocarbon analysis of these live chironomid larvae from the same seep
also produced a 14C “age” of 1,760 years, which supports the role of “old” methane in the
diet of these modern benthic invertebrates. A 14C “age” of 1,300 years has also been
recorded for a diving duck that feeds on chironomids in lakes of northern Alaska (Schell
1998, pers. comm.). The old age of the lake core and the isotopic results of modern
chironomids living at the seep site suggest that there is the potential for preservation of a
great (long) temporal record of environmental change and CH4 emissions from Lake Q.

31
Figure 20. A hotspot of biological activity at the seep site revealed living midge larvae (chironomids) whose radiocarbon age is 1,700 years! Stable isotopes of chironomids also confirmed that methane is making its way into the food web of these organisms. Researchers pick living chironomids from seep sediments (left). An example of a chironomid is shown (right). Photos by K. Walter.
Task 5. Engineering assessment and demonstration of the development of seep methane for energy use in rural Alaska
Natural gas is a common fuel in many areas of the U.S., and is currently used for
both space heating and electrical power generation. Developing CH4 from local seeps
could be of tremendous benefit to rural residents, replacing extremely expensive diesel
fuel (now close to $6 per gal for residential customers in Atqasuk) with locally available
fuel. Some existing examples of tapping CH4 from local sources for small-scale
applications provide models for the Atqasuk project. In the Netherlands, CH4 has been
extracted from groundwater for more than a century and is used for cooking and space
heating (Stuurman 2001). This has reduced or eliminated the need for purchasing fuel oil
for a number of Dutch farmers. The systems are simple and low-tech, allowing the
farmers to maintain their own systems and use the gas very near the well (Fig. 21). The
well owner is also the gas consumer, and is thus responsible for all hardware installation
and safety.
32
Figure 21. Dutch farmers dig shallow artesian wells in their yard, through which groundwater, rich in CH4 generated from nearby peat bogs, rises to the surface. A sieve is placed at the top of the well casing, causing the water to de-gas as it sprays through the sieve. A heavy metal cap is placed over the top of the well, which allows adequate pressure to build to transport the gas from the wellhead to the house via an inexpensive, low-pressure hose.
The estimated BTU content of CH4 produced by the large Lake Q (B1-a) seep is
approximately 3–5 MMBTU per day, which may be adequate to heat a modest
greenhouse, cultural center, or existing cabins near the lake. Initial calculations and
discussions with local gas companies indicate that conventional buried pipe installation
would not be economic for a single seep, but perhaps other ways could be devised for this
small-scale system. According to the local Fairbanks Natural Gas Company, buried
plastic pipe would likely cost approximately $200,000 per mile to install, or $1.2 million
for the pipe alone. Additionally, since the gas leaving the ground is saturated with water
vapor, this could freeze inside the pipe unless removed at the seep site, requiring
additional hardware. Also, a compressor would be needed at the lake site to move the gas
to town. A simple NPV calculation is included in Appendix A, showing that the value of

33
the gas is approximately $157,000, considerably less than the cost of moving the gas to
the village. The relatively small quantity of CH4 available (the single seep of 5,000 ft3
day-1) represents only about 5% of the energy consumed by the electrical generators in
the village.
An alternative to tapping the resource at the seep sites may be to drill a test hole
adjacent to or within the Atqasuk community itself. It is known that the general area is
gas-prone (it is inside the boundaries of the NPRA) and that shallow coal seams exist (the
village is located at the site of the Mead River coal mine, a shallow mine used to supply
coal to Barrow for whaling ships). Thus it seems likely that the seep may be associated
with deeper gas. If this seep can be shown to be related to either coal deposits or a deeper
gas source, drilling for gas in or near the village may be feasible. Providing a usable gas
utility in the village would require significant additional input for permitting, site
selection, exploratory drilling, production well drilling, well completion, and establishing
a distribution system.
Further work should more clearly identify the engineering challenges that must be
overcome before the Atqasuk community can economically utilize the resource. In
addition, optimal resource use should be assessed in terms of technical challenges and
economic feasibility based on our work.
Task 6. Education and outreach
Outreach in the village consisted of a town hall meeting in January 2008 (Fig. 22),
and then 2 town hall meetings in April (on the first evening of the field trip) that lasted
for 2 hours. Thirty-five village residents, representing more than 10% of the village
population, including mayor Jimmy Nayukok, turned out for the meeting. At the April
meeting, we discussed results from Walter’s January 2008 field work as well as the
present trip’s research project objectives, and received important feedback including
traditional knowledge and questions and interest from the residents. Between 1–5 local
residents accompanied our team to the field for each trip.

34
Figure 22. January 2008 Atqasuk community meeting to discuss the methane seep project (left). April 2008 local residents and UAF student at the Lake Q seep during the gas flare.
In April 2008, we visited the Meade River School of Atqasuk (Fig. 23). Our project
team members divided into three groups in separate classrooms and gave demonstrations
about our research project. They showed students the methane bubble traps that we use to
capture gas, an example of lake sediment cores, aquatic insects and fish from the lakes,
videos of the bubbling seeps, and thermal infrared photography for imaging the seeps.
Roughly 30 students from junior high and high school grades visited our stations and
engaged in the demonstrations. We stayed for lunch with the teachers and students, and
continued to demonstrate science materials in the hallways with interested parents and
teachers for 2 hours after lunch. It was an enjoyable experience for all.
Figure 23. Melissa Smith (UAF undergraduate student) demonstrating a lake sediment grab sampler for collecting lake bottom organisms from methane seep sites (left); Katey Walter (UAF faculty) introducing a methane bubble trap for capturing and collecting gas in lakes (middle); Tom Johnson (UAF staff) showing digital images to kindergarteners at Meade River School.

35
CONCLUSIONS
(1) Flow from the large Lake Q seep was ~5,000 ft3 day-1, measured in April 2008,
exceeding the approximation from January 2008, when measurements were conducted in
extreme cold temperatures (-46°C) and darkness. Seep rates from the Atqasuk seeps are
huge in comparison with typical biogenic seeps from other artic thermokarst lakes. Seven
seeps have been measured in the Atqasuk area with an estimated net emission of >6,200
ft3 day-1. Gas is >98.5% methane.
(2) At of the conclusion of this project, all seeps that have been visited by these
investigators are SE of Atqasuk within 30 km of the community. Researchers were
thrilled to find so many new methane seeps (up to 10) within the brief 1-hour period of
aerial surveys and following a day of ground searching during the preceding year. Local
knowledge, based on the experience of igniting methane seeps, suggests that more seeps
have been identified NW of Atqasuk. This shows the abundance of methane in the region
and suggests a high probability for this resource to occur beneath the town of Atqasuk as
well.
(3) The Atqasuk region is known for its coal strata. Coal particles were found near
two of the seeps. Isotopic values suggest a mixed biogenic-thermogenic source of
methane. It is likely that methane seeps have a coalbed origin.
(5) Methane seeps near Atqasuk are a hotspot for biological activity. Stable isotope
and radiocarbon ages of living chironomids (midges), lake sediment organic matter, and
seep methane suggest that seep methane is an energy source for the modern organisms.
Age determination of the thermokarst lake, Lake Q, where the large seep (B1-a) occurs,
of 11,500 ± 180 cal yrs BP suggests that sediments in this lake may be studied for a long
record of the consistency and availability of methane from the seep.
(6) The large Lake Q (B1-a) seep could provide enough energy to fuel 5–6 homes or
a large community building; however, it is not likely that this seep would provide
significant energy for Atqasuk because it is too far away to justify the cost of the pipe.
Although the economic value of seep is not likely to justify any infrastructure in town, it

36
could be used more locally near the seep site. The abundance of seeps near Atqasuk and
their high methane content indicate likely drilling success in coal seams near town.
Drilling below town might be the best way of supplying the community with natural gas
energy.
Impacts and Benefits
The potential impact and benefits of developing methane from seeps near Atqasuk
include reducing Atqasuk’s consumption of diesel for power generation and home
heating (~500,000 gal/yr, current value of $1.5–$3 million/yr); and understanding gas
resources better, in particular unconventional gas in the NPRA area, with potential larger
markets. Also, in terms of climate change, quantifying natural seep contribution to
atmospheric CH4 improves understanding of the global balance between human and
natural sources. Use of CH4 as energy will mitigate climate change, because burning CH4
converts it to CO2 and H2O, considerably weaker greenhouse gases (IPCC 2007),
minimizing the destructive effect of CH4 in the atmosphere.
Publication
We are targeting publication of results of this study in the Journal of Geophysical
Research (JGR), Biogeosiences, with a submission goal of March 2009.

37
REFERENCES
Burruss, R. C. 1999. Evidence for petroleum occurrence and timing of migration: Petroleum fluid inclusions, dead oil, stains and seeps. In Oil and Gas Resource Potential in the 1002 Area, Arctic National Wildlife Refuge, Alaska, by ANWR Assessment Team, U.S. Geological Survey Open File Report 98-34, 29 pp.
Chanton, J. P., D. Fields, and M. E. Hines (2006), Controls on the hydrogen isotopic composition of biogenic methane from high latitude terrestrial wetlands. Journal of Geophysical Research—Biogeosciences, 111, G04004, doi:10.1029/2005JG000134.
Chapman, R.M., Detterman, R.L., and Mangus, M.D. 1964. Geology of the Killik-Etivluk Rivers region, Alaska, U.S. Geological Survey Profesional Paper 303-F, P.325-407, 8 sheets.
Chasar, L. S., J. P. Chanton, P. H. Glaser and D. I. Siegel (2000a), Methane concentration and stable isotope distribution as evidence of rhizospheric processes: comparison of a fen and bog in the Glacial Lake Agassiz peatland complex. Annals of Botany, 86, 655-663.
Chasar, L. S., J. P. Chanton, P. H. Glaser, D. I. Siegel, and J. S. Rivers (2000b), Radiocarbon and stable carbon isotopic evidence for transport and transformation of DOC, DIC and CH4 in a northern Minnesota peatland. Global Biogeochem. Cycles, 14, 1095-1105.
Conrad, R. (1989), Control of methane production in terrestrial ecosystems in Exchange of Trace Gases Between Terrestrial Ecosystems and the Atmosphere, edited by M. O. Andreae and D. S. Schimel, pp. 39-58, John Wiley, New York.
Conrad, R. (2005), Quantification of methanogenic pathways using stable carbon isotopic signatures: a review and a proposal, Organic Geochemistry, 36, 739-752.
Decker, P.L. and Wartes, M.A., 2008. Geochemistry of the Aupuk gas seep along the Colveville River- Evidence for a thermogenic origin. PIR-2008-1E p, 47-54.
Deines, P., Bodelier, P., and Eller, G. (2007a). Methane-derived carbon flows through methane-oxidizing bacteria to higher trophic levels in aquatic systems. Environ Microbiol 9, 1126-1134.
Deines, P., Grey, J., Richnow, H., and Eller, G. (2007b). Linking larval chironomids to methane: seasonal variation of the microbial methane cycle and chironomid delta C-13. In "Aquat Microb Ecol." pp. 273-282.
Duffy, M. F. S. Kinnaman, D. L. Valentine, e A. Keller, and J. F. Clark. 2007. Gaseous emission rates from natural petroleum seeps in the Upper Ojai Valley, California. Environmental Geosciences, v. 14, no. 4 (December 2007), pp. 197–207.

38
Eisner, W. R. (1991). Palynological analysis of a peat core from Imnavait Creek, the North Slope, Alaska. In "Arctic." pp. 279-282.
Eisner, W. R., and Colinvaux, P. A. (1992). Late Quaternary pollen records from Oil Lake and Feniak Lake, Alaska, USA. In "Arctic Alpine Res." pp. 56-63.
Eisner, W. R., and Peterson, K. M. (1998). High-resolution pollen analysis of tundra polygons from the North Slope of Alaska. In "J Geophys Res-Atmos." pp. 28929-28937.
Eller, G., Deines, P., and Krueger, M. (2007). Possible sources of methane-derived carbon for chironomid larvae. In "Aquat Microb Ecol." pp. 283-293.
Etiope, G. 2004, New Directions: GEM—Geologic Emissions of Methane, the missing source in the atmospheric methane budget. Atmospheric Environment 38, 3099-3100.
Etiope, G., C. Baciu, A. Caracausi, F. Italiano, and C. Cosma (2004a), Gas flux to the atmosphere from mud volcanoes in eastern Romania, Terra Nova, 16, 179– 184.
Etiope, G., A. Feyzullaiev, C. Baciu, and A. V. Milkov (2004b), Methane emission from mud volcanoes in eastern Azerbaijan, Geology, 32(6), 465– 468.
Etiope, G., G. Martinelli, A. Caracausi, and F. Italiano (2007), Methane seeps and mud volcanoes in Italy: Gas origin, fractionation and emission to the atmosphere, Geophys. Res. Lett., 34, L14303, doi:10.1029/2007GL030341
Faber E. (1987) Zur isotopengeochemie gasformiger kohlenwasserstoffe.Erdoel. Erdgas. Kohle 103: 210-218.
Grey 2006
Grey, J., and Deines, P. (2005). Differential assimilation of methanotrophic and chemoautotrophic bacteria by lake chironomid larvae. In "Aquat Microb Ecol." pp. 61-66.
Hinkel, K. M., Eisner, W.R. , Bockheim, J. G., Nelson, F. E., Peterson, K. M., and Dai, X. Y. (2003). Spatial extent, age, and carbon stocks in drained thaw lake basins on the Barrow Peninsula, Alaska. In "Arct Antarct Alp Res." pp. 291-300.
Hornibrook et al. 2000
Houseknecht, D. W. and K. J. Bird. 2006. Oil and gas resources of the Arctic Alaska petroleum province: U.S. Geological survey Professional Paper 1732-A, 11p.
IPCC 2007.

39
Kaba, C. M. 2004. Reconstructing long term sediment flux from the Brooks Range, Alaska using shelf edge clinoforms. Masters Thesis. University of Pennsulvania, 37pp.
Kankaala, P., Taipale, S., Grey, J., Sonninen, E., Arvola, L., and Jones, R. (2006). Experimental delta C-13 evidence for a contribution of methane to pelagic food webs in lakes. In "Limnol Oceanogr." pp. 2821-2827.
Lassey, K. R., D. C. Lowe, and A. M. Smith, 2007, The atmospheric cycling of radiomethane and the “fossil fraction” of the methane source. Atmos. Chem. Phys., 7, 2141–2149.
Oswald, W. W., Brubaker, L. B., Hu, F. S., and Kling, G. W. (2003). Holocene pollen records from the central Arctic Foothills, northern Alaska: testing the role of substrate in the response of tundra to climate change. In "J Ecol." pp. 1034-1048.
Pohlman, J. W., Canuel, E. A., Chapman, N. R., Spence, G. D., Whiticar, M. J., and Coffin, R. B. (2005). The origin of thermogenic gas hydrates on the northern Cascadia Margin as inferred from isotopic (C-13/C-12 and D/H) and molecular composition of hydrate and vent gas. In "Org Geochem." pp. 703-716.
Prater, J. L., J. P. Chanton, G. J. Whiting (2007). Variation in methane production pathways associated with permafrost decomposition in collapse scar bogs of Alberta, Canada. Global Biogeochemical Cycles 21, doi:10.1029/2006GB002866.
Praveen, S. S. Patill Shirish, A. Dandekar, T. Walsh, M. Panda, P. Stokes. Characterization & Quantification of Methane Hydrate Resource Potential Associated with Barrow Gas Fields in Northern Alaska, USA. Abstract and Poster for presentation in St. Petersburg Russia, May 2008.
Roberts, S., E. Barker, K. J. Bird, R. R. Charpentier, T. Cook, D. W. Houseknecht, T. R. Klett, R. M. Pollastro, and C. J. Schenk (North Slope Coalbed Methane Assessment Team). 2006. Assessment of coalbed gas resources in Cretaceous and Tertiary rocks on the North Slope, Alaska, 2006
Schoell, M. 1983. Genetic characterization of natural gases: American Association of Petroleum Geologists Bulletin, v. 67, p. 2225-2238.
Schoell, M. 1984. Stable isotopes in petroleum research. In: Advances in Petroleum Geochemistry, Vol. 1. Academic Press, London.
Schwamborn, G., Andreev, A. A., Rachold, V., Hubberten, H.-W., Grigoriev, M. N., Tumskoy, V., Pavlova, E. Y., and Dorozkhina, M. V. (2000). Evolution of Lake Nikolay, Arga Island, Western Lena Delta, during Late Pleistocene and Holocene time. Polarforschung 70, 69-82.

40
Strapoc, D. A. Schimmerlmann, M. Mastalerz. 2006. Carbon isotopic fractionation of CH4 and CO2 during canister desorption of coal. Organic Geochemistry 37: 152-164.
Stuiver, M., and Polach, H. A. (1977). Discussion: Reporting of C-14 Data. Radiocarbon 19, 355-363.
Stuiver, M., Reimer, P. J., Bard, E., Beck, J. W., Burr, G. S., Hughen, K. A., Kromer, B., McCormac, G., Van der Plicht, J., and Spurk, M. (1998). INTCAL98 radiocarbon age calibration, 24,000-0 cal BP. Radiocarbon 40, 1041-1083.
Stuurman, R. Geo Gebruikt- Brongaswinning optraditionele wijze, 2001.Tno-Nitg Infromantie, September, pp. 26-27.
Sugimoto, A., and E. Wada (1993), Carbon isotopic composition of bacterial methane in a soil incubation experiment: Contributions of acetate and CO2/H2, Geochim. Cosmochim. Acta 59, 1329-1337.
von Fischer, J.C., G. Ames, R. Rhew, and W.C. Oechel (2007), Methane emission rates from the Arctic coastal tundra at Barrow: temporal and spatial variability and response to an experimental carbon addition, EOS Trans. AGU, Fall Meet. Suppl., Abstract B51C-0609.
Valentine, D. L., A. Chidthaisong, A. Rice, W. S. Reeburgh, and S. Tyler (2004), Carbon and hydrogen isotope fractionation by moderately thermophylic methanogens. Geochim. et Cosmochim. Acta 68, 1571-1590.
Waldron S., J. M. Lansdown, E. M. Scott, A. E. Fallick, and A. J. Hall (1999a), The global influence of H isotopic composition of water on that of bacteriogenic methane from shallow freshwater environments. Geochim. Cosmochim. Acta 63, 2237-2245.
Waldron, S., I. A. Hall, and A. E. Fallick (1999b), Enigmatic stable isotope dynamics of deep peat methane, Global Biogeochem. Cycles, 13, 93-100.
Walter, K. M., Zimov, S. A., Chanton, J. P., Verbyla, D., & F. S. Chapin III. 2006, Methane Bubbling from Siberian Thaw Lakes as a Positive Feedback to Climate Warming, Nature 443, 71-75.
Walter, K. M., Duguay, C., Jeffries, M., Engram, M., and Chapin III, F. S. 2008a. Journal of the American Water Research Association, April 2008, Potential use of synthetic aperture radar (SAR) for estimating methane ebullition from arctic lakes.
Walter, K. M., J. Chanton, T. Schuur, S.A. Zimov, F.S. Chapin III (2008b), Journal Geophysical Research- Biogeosciences, Methane Production and Bubble Emissions from Arctic Lakes: Implications from 14C and Stable Isotope Compositions.
Whiticar, M. J. (1996). Stable isotope geochemistry of coals, humic kerogens and related natural gases. In "Int J Coal Geol." pp. 191-215.

41
Whiticar, M. J. (1999). Carbon and hydrogen isotope systematics of bacterial formation and oxidation of methane. In "Chem Geol." pp. 291-314.
Whiticar et al. 1986
Wooller, M. J., Francis, D., Fogel, M. L., Miller, G. H., Walker, I. R., and Wolfe, A. P. (2004). Quantitative paleotemperature estimates from delta O-18 of chironomid head capsules preserved in arctic lake sediments. In "J Paleolimnol." pp. 267-274.
Wooller, M., Morgan, R., Fowell, S., Behling, H., and Fogel, M. (2007a). A multiproxy peat record of holocene mangrove palaeoecology from Twin Cays, Belize. In "Holocene." pp. 1129-1139.
Wooller, M., Wang, Y., and Axford, Y. (2007b). A multiple stable isotope record of Late Quaternary limnological changes and chironomid paleoecology from northeastern Iceland. J Paleolimnol, 15.
Wooller, M., Zazula, G. D., Edwards, M., Froese, D. G., Boone, R. D., Parker, C., and Bennett, B. (2007c). Stable carbon isotope compositions of Eastern Beringian grasses and sedges: Investigating their potential as paleoenvironmental indicators. In "Arct Antarct Alp Res." pp. 318-331.

42
LIST OF ACRONYMS AND ABBREVIATIONS
AMS Accelerator mass spectrometry
ANS Alaskan North Slope
BTU British thermal unit
C Carbon
C1-C5 hydrocarbons Alkanes and alkenes consisting of 1-5 C atoms 13C Stable C isotope, also expressed as 13C/12C or δ 13C 14C Radioactive C isotope, also expressed as δ14C
CH4 Methane
CO2 Carbon dioxide
D Deuterium, stable isotope of Hydrogen, also expressed as D/H or
δD
GPS Global positioning system
H Hydrogen
H2S Hydrogen sulfide
INE Institute of Northern Engineering
N Nitrogen
NPRA National Petroleum Reserve- Alaska
O Oxygen
UAF University of Alaska, Fairbanks
WERC Water and Environmental Research Center (UAF)

43
APPENDIX A
Appendix A Calculation of economic value of methane for Atqasuk from Lake Q Calculation of economic value of methane for Atqasuk 3000 cubic feet per day methane (estimated)
992 BTU per cubic foot for pure methane (estimated) (higher heating value
2976000 BTU per day 2.976 MMBtu per day 1086.24 MMBtu per year from methane source
239593 Gallons diesel fuel used for power generation in Atqasuk (2006 PCE report)
136000 BTU per gallon, higher heating value
32584.648 MMBtu diesel fuel used per year
3.33% Fraction of total diesel need in Atqasuk $3.23 Cost of diesel fuel in Atqasuk (2006 PCE report) $25,798.20 Total value of diesel fuel displaced by methane source Calculation of flow rates 3000 cubic feet / day (estimated) 20 gallon garbage bag 0.13367 cubic feet per gallon 2.6734 Cubic feet per bag 2.083333333 Calculated rate of flow in cubic feet per minute 1.283232 Minutes needed to fill garbage bag 76.99392 Seconds to fill garbage bag Total carbon flow 3000 cubic feet per day methane (estimated) 28.31 liters per cubic ft 22.4 liters per mole 3791.517857 moles per day 16 grams per mole 60.66428571 Kg methane per day 0.75 Carbon weight in Methane 45.49821429 Kg carbon per day 16606.84821 Kg carbon per year Water in gas calculations 3000 cubic feet per day methane (estimated) 3305 cubic feet per pound of water at 32 F 0.907715582 Pounds per day water vapor
200 number of days below freezing
181.54 pounds of water that can freeze in lines

44
Energy use per household 3068257 Total kW-hrs sold in Atqasuk 0.8 Fraction to households
2454605.6 Total kW-hrs sold to households
57 Households in Atqasuk 43063.25614 Annual household electrical consumption 3588.604678 Monthly household electrical consumption Converstion of velocity measured to flow rate 0.78 Square inches pipe diameter 2 meter / sec measured flow rate 39 Inches per meter 78 inches 60.84 Cubic inches per second 1728 Cubic inches per ft3 3650.4 Cubic inches per minute 2.1125 Cubic Feet per minute 1440 Minutes per day 3042 Cubic feet per day
Diesel plant calculations
$3.23 Cost of diesel fuel per gallon 95 Number of Kw-hrs per household per day 58 Number of households in the village
$1,000 Cost of diesel plant, per installed kW 6.00% Cost of capital in percent
5 Years expected lifetime of diesel plant 20.00% O&M cost, % of investement per year
3 Peak factor, above average electrical usage 14.17 kW-hrs per gallon
2.00% Diesel price annual increase 1.00% Load increase
2011150 Total kW-hr generated per year 229.5833333 Average load on generator
688.75 Total generator size $688,750 Cost of diesel generator (installed)
$163,506.77 Cost of diesel generator capital per year $32,701.35 Estimated O&M

45
141930 Total gallons of diesel fuel $458,434.33 Cost of diesel fuel per year $654,642.46 Total cost of diesel plant per year
$0.33 Cost of electricity for existing diesel plant Diesel plus Lake Q gas
$3.23 Cost of diesel fuel per gallon 95 Number of Kw-hrs per household per day 58 Number of households in the village
$1,000 Cost of diesel plant, per installed kW 6.00% Cost of capital in percent
5 Years expected lifetime of diesel plant 20.00% O&M cost, % of investement per year
3 Peak factor, above average electrical usage 14.60824742 kW-hrs per gallon (This is how you add renewables)
$157,746 Capital of renewable
6.00% Cost of Capital, in percent 20 Years expected lifetime
$13,753.03 Annual capital cost 8.00% O&M, % of capital cost
$14,853.27 Total annual cost of renewable system
2011150 Total kW-hr generated per year 229.5833333 Average load on generator
688.75 Total generator size
$688,750 Cost of diesel generator (installed) $163,506.77 Cost of diesel generator capital per year
$32,701.35 Estimated O&M 137672.2301 Total gallons of diesel fuel $444,681.30 Cost of diesel fuel per year $655,742.70 Total cost of diesel plant per year
$0.33 Cost of electricity

National Energy Technology Laboratory 626 Cochrans Mill Road P.O. Box 10940 Pittsburgh, PA 15236-0940 3610 Collins Ferry Road P.O. Box 880 Morgantown, WV 26507-0880 One West Third Street, Suite 1400 Tulsa, OK 74103-3519 1450 Queen Avenue SW Albany, OR 97321-2198 539 Duckering Bldg./UAF Campus P.O. Box 750172 Fairbanks, AK 99775-0172 Visit the NETL website at: www.netl.doe.gov Customer Service: 1-800-553-7681