Embed Size (px)
Citation preview

O X F O R D INSTlTUTE
E N E R G Y STUDIES
- FOR -
Who Makes the Oil Price?
An Analysis of Oil Price Movements I978 - 1982
Steve Roberts
Oxford Institute for Energy Studies
WPM 4
1984

The contents o f t h i s p a p e r are f o r t h e purposes of s t u d y and discussion and do n o t represent the v i e w s of t h e Oxford I n s t i t u t e for Energy S t u d i e s or any of i ts members.
Copyright 0 1984 Oxford I n s t i t u t e for Energy Studies
ISBN 0 948061 03 0

CONTENTS
I n t r o d u c t i o n
I Some T h e o r e t i c a l Cons ide ra t ions
I1 The Second Oil Price Explosion
111 The P r i c e U n i f i c a t i o n of 1981
IV The Slack Market of 1982
V Conclusions
Annex 1
Annex 2
Page
1
4
8
29
37
46
5 1
53

FIGURES
Page
F i g . 1 S p o t P r i c e s of Se lec t ed Crudes and Products ,
A p r i l 1978 - March 1979
2 Early 1979 Q f f i C i a l P r i ce Increases
3 Spot Crude and Product P r i c e s , 1979-1982
4 Egypt and Ecuador's O f f i c i a l Crude P r i c e s ,
1979-1 982
5 Ear ly 1981 O f f i c i a l Price Cuts
6 1982 O f f i c i a l P r i c e Changes
TABLES
10
1 4
17
23
31
41
T a b l e 1 Official P r i c e I n d i c e s for OPEC Producers ,
December 1978 - December 1980 2 0
2 O f f i c i a l Price Indices for non-OPEC Producers,
December 1978 - December 1980 21
3 O f f i c i a l P r i c e D i f f e r e n t i a l s : September 1978,
December 1981 and November 1982 3 4
1
Who Makes The Oil Pr ice? 1978-82
A s tudy of o i l developments du r ing '1978-82 may provide some
impor tan t i n s i g h t s i n t o the o p e r a t i o n of the p r i c i n g mechanism for
petroleum i n i n t e r n a t i o n a l t r ade . F i r s t of a l l , t h i s period enables us
t o s tudy the behaviour of oil producers i n both a r i s i n g and a f a l l i n g
market. I n 1979/80 excess demand pushed prices u p more than t h ree fo ld .
Two years l a te r the p o s i t i o n changed t o one of unprecedented excess
supply, with OPEC producing a t less than 55 per c e n t of capac i ty . As w e
s h a l l see the evidence sugges ts marked asymmetries i n behaviour
according to market cond i t ions .
Secondly, 1978-82 is a period during which s e v e r a l non4PEC
c o u n t r i e s emerged as s i g n i f i c a n t exporters and began to p l a y a major
r o l e i n the w o r l d market. W e would sugges t t h a t too o f t e n non-OPEC
producers have been given l i t t l e o r no a t t e n t i o n , be ing regarded merely
as pass ive agents i n a market i n which the p r i c i n g d e c i s i o n i s s a i d t o
be beyond t h e i r c o n t r o l . The evidence of the post-1978 pe r iod p a i n t s a
very d i f f e r e n t p i c t u r e .
Thirdly, a n d f o r the very reasons mentioned above, the pe r iod
1978-82 p rov ides a good t e s t i n g ground f o r t h e i s s u e of price
l eade r sh ip . Who l ed t h e o i l price rise of 1979-80? How w e r e prices
determined i n 1981 -82 when excess s u p p l i e s should normally have induced
a rap id price c o l l a p s e ? As we o u t l i n e i n Sec t ion I, a number of
c h a r a c t e r i z a t i o n s of the o i l p r i c i n g system c a n be developed, most of
which p o s t u l a t e some form of l e a d e r s h i p - e i t h e r by OPEC o r a subse t of
OPEC member c o u n t r i e s a c t i n g as a ' ca r te l ' , o r by a s i g n i f i c a n t
producer (Saudi Arabia) provid ing a f r e e b u f f e r s t o c k to an informal
commodity s t a b i l i z a t i o n scheme.
T h e o r i s t s have found it a t t rac t ive t o apply to the o i l market
a n equ i l ib r ium concept due to von S tacke lbe rg l I which d i s t i n g u i s h e s a
dominant producer (OPEC or Saudi Arabia) and a compe t i t i ve f r i n g e . The
former makes t h e price, t a k i n g i n t o account the e f f e c t of h i s a c t i o n s
1 H. von Stacke lberg , The Theory of the Market Economyl Oxford Univers i ty P r e s s , 1952.

2
on t h e supply dec i s ions of f r i n g e producers . The l a t t e r have no
in f luence on the market and j u s t t ake the price as given by t h e
dominant group.
Equi l ibr ium concepts may provide u s e f u l norms. B u t the o i l
market has ev iden t ly been i n a s ta te of d i s e q u i l i b r i u m i n the period
cons idered here . A no t ion , f i r s t developed by Kenneth Arrow2, and n o t
prev ious ly app l i ed to the o i l market, may be r e l e v a n t . The idea is that
i n d i sequ i l ib r ium every producer f a c e s a downwards s lop ing demand curve
and thus has some d i s c r e t i o n over h i s price. If everybody i s a price
maker h a t is then the r o l e of the leader?
O i l experts w i th in t h e i n d u s t r y have tended to look a t the
problem d i f f e r e n t l y . Their i n t e r e s t focuses on the r o l e played by Saudi
Arabia as the l inchpin of the p r i c i n g system, and on the i n t e r a c t i o n
between this country and o t h e r O P E producers. A convent ional wisdom
has developed i n the i n d u s t r y ; i t de f ines Saudi Arabia as the 'swing
s u p p l i e r I which s t a b i l i z e s prices by absorbing f l u c t u a t i o n s i n t h e
demand for OPEC o i l . Of course the 'swing s u p p l i e r ' cannot i n c r e a s e h i s
product ion beyond i n s t a l l e d c a p a c i t y ; and he is u n l i k e l y to remain
i n d i f f e r e n t i f ou tput d e c l i n e s below a c e r t a i n limit. On t h i s view
Saudi Arabia's a b i l i t y to s t a b i l i z e prices, though s i g n i f i c a n t , is
neve r the l e s s cons t ra ined .
We s h a l l see that the evidence supports the Arrow not ion as
w e l l as t h e idea of c o n s t r a i n e d Saudi l eade r sh ip . Again, whether this
corresponds to any view of price l eade r sh ip as def ined by the standard
economic l i t e r a t u r e i s ques t ionab le . W e a t tempt i n the concluding part
of the paper (Sec t ion V) t o sugges t d i f f e r e n t theoretical
c h a r a c t e r i z a t i o n s of the oil pricing mechanism accord ing t o
demand/supply condi t ions p r e v a i l i n g i n the market. But t h e r e is a
l i m i t to t h e e x t e n t to which the behaviour of the o i l producers can be
expla ined i n s t r i c t l y economic terms. P o l i t i c s are a f a c t o r of major
importance, and economists f o r g e t t h i s a t t h e i r peril.
Kenneth T. Arrow, ' T o w a r d s a Theory of P r i ce Adjustment ' , i n M. Abramowi t z (ed . ) , The A l l o c a t i o n of Economic Resources, Stanford Univers i ty Press , 1959.

3
This paper i s s t r u c t u r e d around three d i s t i n c t sub-periods:
( i ) The pe r iod of r i s i n g prices from September 1978 t o December
1980;
(ii 1 The price u n i f i c a t i o n of 1981 ;
Iiii) The slack market of 1982.
I n each w e seek f i r s t ta describe t h e output and price changes which
occurred, h i g h l i g h t i n g the d i f f e r e n t i a l s i z e and t iming of changes i n
official prices by each producer , and comparing these i n t u r n w i t h
movements i n spot crude and product prices. W e seek throughout to draw
o u t the imp l i ca t ions of our f i n d i n g s for the oil p r i c i n g system, and
t h e s e are brought toge ther i n the concluding s e c t i o n .
4
I
Some T h e o r e t i c a l Cons idera t ions
As suggested above, this paper seeks not merely to p r e s e n t a
h i s t o r i c a l survey of the movements i n crude o i l prices s i n c e 1978, b u t
also to examine t h e e x t e n t t o which the f a c t s lend suppor t t o s o m e
widely he ld views on the ope ra t ion of the world petroleum market and i n
p a r t i c u l a r of t h e p r i c i n g system. It may be u s e f u l a t t h e outset t o
o u t l i n e some poss ib l e t h e o r e t i c a l c h a r a c t e r i z a t i o n s of the p r i c i n g
mechanism i n the o i l market. We s h a l l cons ide r s p e c i f i c a l l y t h r e e such
approaches: f i r s t that which views the market as comprising a dominant,
price-making cartel and a compet i t ive , p r i ce - t ak ing f r i n g e ; secondly
t h a t which concent ra tes on more s t anda rd p r i ce - l eade r sh ip models ; and
t h i r d l y that which views a l l p rduce r s , l a r g e and small, as
price-makers when the market is i n d i sequ i l ib r ium.
i. C a r t e l and Fr inge
Much r e c e n t work on t h e p r i c i n g mechanism i n the world petroleum market
has focused on the not ion of the ex i s t ence of a dominant producer group
OK cartel which f i x e s p r i c e s to clear the market, c u r r e n t l y and Over
all f u t u r e per iods , t a k i n g i n t o account the op t ima l supply responses of
a number of small, pr ice- tak ing producers . See , f o r example t h e work
of Sa lan t3 , Ulph4, and Dasgupta and H e a l 5 . Thus, Stephen S a l a n t has
developed a computerized Nashqourno t model of the world o i l market
which e x p l i c i t l y uses a p r i c e - f i x i n g producer and a compet i t ive
f r i n g e . The l a t t e r seeks to maximize i t s p r o f i t s a t the price l e v e l
d i c t a t e d t o it by the dominant s u p p l i e r . Such work has come to the f o r e
Stephen W. Sa lan t , Imperfec t Competit ion i n the World O i l Market, Lexington Books, 1982.
A - Ulph and G . F ~ l i e , 'Exhaus t ib le Resources and Cartels: A n I n t e r - temporal Hash-Cmrnot Model', Canadian Journa l of Economics, 1980.
P. Dasgupta and G. H e a l , Economic Theory and Exhaus t ib le Resources , ' Cambridge Handbook, Cambridge Univers i ty P r e s s , 1979.
5
i n the mid-1970s wi th t h e emergence of a number of l a r g e producers
o u t s i d e OPEC. The b a s i c no t ion and hence the explana t ion of the price
mechanism is very s t r a igh t fo rward . As suggested by Newbery6, this can
be construed as an equi l ibr ium concept or, fo l lowing Pindyck7 defended
as a f i r s t approximation to the o i l market. W e s h a l l seek i n this paper
t o examine the e x t e n t of the approximation - a n e x e r c i s e which
s u r p r i s i n g l y has not y e t been done.
ii . P r i c e Leadership
Close ly r e l a t e d to the c a r t e l / f r i n g e c h a r a c t e r i z a t i o n of t h e world
petroleum market, one may attempt to f i t the p r i c i n g system to the
textbook d e s c r i p t i o n s of price l eade r sh ip . The l i t e r a t u r e on o l igopo ly
g ives us , among o t h e r s , the fo l lowing two models. 'Dominant f i rm '
l e a d e r s h i p is perhaps the most f a m i l i a r . It envisages a l a r g e [ u s u a l l y
low c o s t ) producer which sets the i n d u s t r y price, t ak ing i n t o account
t h e r e a c t i o n of t h e smaller producers to t h a t price, so as to maximize
i t s p r o f i t s . Such a l e a d e r would ensure t h a t a l l o t h e r producers fo l low
h i s price dec i s ions by t h rea t en ing to use aggres s ive p r i c i n g and
product ion policies to d r i v e t h e m out of the market i f they do not
conf om.
The price leader i s n o t necessa r i ly the producer which changes
i t s price f i r s t ; i n the real world, any of the small producers may
a l ter its price ch rono log ica l ly before the others - perhaps d r iven by
short- term revenue requirements . A t r u e price-leader, i n t h i s model,
n o t only i n i t i a t e s the price change bu t is a b l e t o en fo rce it i n the
long run and have a d i r e c t i n f luence on t h e d e c i s i o n s of o t h e r
producers .
The second m o d e l of price l e a d e r s h i p (due to Markham8) is
'Barometric Leade r sh ip ' , i n which a l l firms agree [ fo rma l ly or
D.M.G. Mewbery, ' O i l P r i c e s , Cartels and the Problem of Dynamic Incons is t e ncy ' , The Economic Journa l , 97, September 1 9 8 1 . R.S. Pindyck, ' G a i n s to Producers from C a r t e l i z a t i o n of Exhaus t ib le
Resources ' , R e v i e w of Economics and S t a t i s t i c s , 60, 1978.
J.W. Markham, 'The Nature and Sign i f i cance of P r i c e Leadersh ip ' , American Economic Review, 41, 1951.

6
i n fo rma l ly ) t o follow the price changes of a f i rm which they cons ider
t o have a good knowledge of the p r e v a i l i n g market condi t ions , and which
has a good r epu ta t ion f o r f o r e c a s t i n g f u t u r e market developments. This
f i r m thus becomes the barometer of t h e indus t ry , and to quote S t i g l e r
' I . . . commands adherence of r i v a l s to his price only because, and t o the
e x t e n t t h a t , h i s price r e f l e c t s market cond i t ions with t o l e r a b l e
promptness .I1'
barometr ic l eade r sh ip which may be important . F i r s t of a l l , t h e l e a d e r
may change from t i m e t o t i m e - though only i f and when the r e p u t a t i o n
of a f i r m improves s u f f i c i e n t l y to win the confidence of the rest of
t h e i n d u s t r y . Changes are t h e r e f o r e u n l i k e l y to occur very
f r e q u e n t l y . Secondly, it i s recognized that whilst upward price
movements w i l l almost i n v a r i a b l y be l ed ch rono log ica l ly by the
barometr ic leader, price c u t s may be i n i t i a t e d by o t h e r f i rms i n the
form of u n o f f i c i a l d i scounts e tc , with the barometr ic f i rm u l t i m a t e l y
reducing o f f i c i a l prices i n l i n e .
The l i t e r a t u r e outlines two f u r t h e r f e a t u r e s of
The recent l i t e r a t u r e on petroleum economics o f t e n s i n g l e s o u t
Saudi Arabia as the price Leader w i t h i n OPEC. This r o l e has been
c h a r a c t e r i z e d i n many d i f f e r e n t ways. A p u r e l y 'economic' view,
(which, paradoxica l ly , i s o f t e n propounded i n the US for t r a n s p a r e n t
p o l i t i c a l reasons] is t h a t Saudi Arabia seeks to maximize its economic
i n t e r e s t s i n the long run by pursuing a moderate p r i c i n g p o l i c y . The
argument is t h a t Saudi Arabia has huge hydrocarbon reserves and a very
long t i m e hor izon for economic development. I ts main o b j e c t i v e i s to
p r o t e c t a sha re of the world energy market f o r its own oil by e r e c t i n g
moderate p r i c i n g barriers a g a i n s t e n t r y by s u b s t i t u t e f u e l s .
As Saudi Arabia i s unique i n i t s a b i l i t y to vary the rate of
e x t r a c t i o n with r e l a t i v e ease over a wide range, i t has the power t o
e x e r c i z e l eade r sh ip w i t h i n the counc i l s of OPEC. This p o w e r i s used t o
hold t h e agreed price l i n e when excess s u p p l i e s exert downward
p r e s s u r e s and t o dampen price rises when excess demand l e a d s t o pr ice
explos ion . I n one s i t u a t i o n Saudi Arabia defends a price which is
o f t e n c l o s e to i t s own p re fe rences even i f fo rma l ly def ined by OPEC.
I n the o t h e r s i t u a t i o n it seeks t o p r o t e c t t h e long-term o b j e c t i v e
mentioned above.
G.J. Stigler, 'The Kinky Demand Curve and Rig id P r i c e s ' , Jou rna l of P o l i t i c a l Economy, October 1947.

7
iii. Arrow's Model of Disequi l ibr ium P r i c i n g
Kenneth Arrow f i r s t developed the n o t i o n t h a t , i n any market i n
d i sequ i l ib r ium i n which there are a number of sel lers , each one f aces a
s lop ing demand curve . Indeed Arrow argued t h a t i n such a s i t u a t i o n ,
and even i n the case of p e r f e c t compet i t ion , each s m a l l producer would
price ' I . . . i n accordance with the prof i t -maximising tac t ics of a
monopolist . .'I * S a l a n t - t y p m o d e l which t akes price as given, i n d i s e q u i l i b r i u m t h e
Arrow approach sees every producer as a pr ice maker. Each producer
thus has t h e i n c e n t i v e to change its price u n i l a t e r a l l y . When t h e
d i sequ i l ib r ium i s one of excess supply, t h e demand curve f ac ing each
producer is less than p e r f e c t l y e l a s t i c and hence he can lower h i s
price and i n c r e a s e sales and revenues. When the re is excess demand i n
t h e market, t h e producer w i l l f a c e a demand curve which is s h i f t i n g t o
the r i g h t . He can thus e f f e c t i v e l y s e l l a t h i s supply price and
o p e r a t e a long his supply curve, r a i s i n g price u n t i l t h e excess demand
is e l imina ted .
Hence, un l ike the compet i t ive f r i n g e of t h e
Such an approach has not, as y e t , been app l i ed d i r e c t l y to the
o i l market, a l though it is our b e l i e f t h a t it may help to shed some
l i g h t on the p r i c i n g behaviour of producers f o r a t least some of the
post-1978 period. To d iscover the re levance of a l l three models to the
oil market, w e must t u r n t o examine the h i s t o r y of t h e 1978-1982
period.
l o K.T. A r r o w , o p . c i t . , p.46.

8
I1
The Second O i l P r i c e Explosion
We have chosen September 1978 as the s t a r t i n g p i n t f o r
a n a l y s i s as i t marks the end of a period of r e l a t i v e price s t a b i l i t y
(of some two years s i n c e the 4 th quarter of 1976) . W e s h a l l assume that
t h i s period of r e l a t i v e s t a b i l i t y i n prices and i n market sha res i n a
margina l ly s l a c k market produced, by September 1978, a s t r u c t u r e of
price d i f f e r e n t i a l s which w a s broadly i n equ i l ib r ium. This m e a n s that
t h e supply price of each crude i n the world market more-or-less
r e f l e c t e d t h e buyer ' s va lua t ion of the d i f f e r e n c e s i n t h e i r q u a l i t y ,
such t h a t he would be i n d i f f e r e n t between any two crudes of the same
price. (This assumption is explored i n more d e t a i l i n Annex 2 . )
We need f i r s t to o u t l i n e the main changes i n crude oil o u t p u t
over the whole per iod of September 1978 t o December 1980, as it is only
a g a i n s t such a backdrop t h a t price movements can be understood f u l l y .
Throughout the f i r s t t h r e e q u a r t e r s of 1978, world ou tpu t w a s
f a i r l y s t e a d y i n the 60 mbd range, of which OPEC accounted f o r 2 8 to 30
mbd. September s a w the usua l i n c r e a s e i n ou tput as Western i n v e n t o r i e s
were r ep len i shed before the win te r . The customary p a t t e r n over the
previous few years had been f o r ou tput to con t inue to rise over the
las t quarter - perhaps to a December peak some 2.5 mbd (World) o r 1 . 5
mbd ( O P E ) h ighe r than September. This p a t t e r n w a s d i s r u p t e d i n 1978 by
the anti-Shah s t r i k e s i n the I r a n i a n oil f i e l d s , which pushed I r a n i a n
output down from a peak of 6 mbd i n September t o 3.5 mbd i n November
and 2.4 mbd i n December. Despite a compensating i n c r e a s e i n Saudi
Arabian o u t p u t of 2 mbd over t h e th ree months, t o t a l OPEC product ion i n
December was some 4.7% lower than i t s September l e v e l .I
World output w a s s o m e 1 .1 % lower. 1977 had s e e n rises over these months of 4.2% (OPEC) and 3.8% (World).

9
The I r a n i a n p o s i t i o n worsened a t the s ta r t of 1979; ou tpu t
f e l l t o 500-700 thousand b/d i n January and February and expor t s w e r e
suspended. They were n o t resumed until e a r l y March, soon a f t e r
Ayatol lah Khomeini’s r e t u r n , when product ion picked up t o 2.3 mbd
(March) and 3.6 mbd ( A p r i l ) . It remained i n the 3 t o 4 mbd range f o r
t h e rest of 1979. T o t a l OPEC output followed very much this p a t t e r n ,
w i th low po in t s of around 28.5 mbd i n January and February, p ick ing up
t h e r e a f t e r t o 30 to 31 mbd f o r the rest of t h e year .
What, then, of t h e price movements which these output changes
invoked?
I n many ways, the most r evea l ing f e a t u r e s of the 1978-80 pr ice
i n c r e a s e s can be drawn from t h e i n i t i a l movements before t h e O P E
meet ings of December 1978 i n Abu Dhabi and March 1979 i n Geneva. W e
s h a l l cons ider s e p a r a t e l y , t he re fo re , t h r e e sub-periods: September 1978
t o December 1978; December 1978 t o March 1979; and the bulk of the
pe r iod from March 1979 t o December 1980.
(a) The Spot Price Movements t o December 1978
The f i r s t price i n c r e a s e s came i n the s p o t product market. Spot prices
of a number of l i g h t products were t h e f irst to show any marked
i n c r e a s e , beginning as e a r l y as August 1978. Naphtha, and Premium and
Regular Gasoline prices rose by 8-10% from J u l y to August on the
Rotterdam market a n d such inc reases w e r e mir rored i n the o t h e r main
world spot product markets . These e a r l y movements i n l i g h t products
sugges t some t i g h t e n i n g of the market be fo re t h e I r an ian supply
problems. They came three months before any s u b s t a n t i a l i n c r e a s e i n the
price of the l a r g e s t t r a d e d product - h igh su lphur (3.5%) f u e l oil - which began i n November 1978. The f i r s t i n c r e a s e s i n s p o t c rude prices
came between these two phases of product price rises, beginning i n
October 1978 a f t e r a prolonged per iod i n the $ 1 2 t o $14 range
(depending on the q u a l i t y of the crude) . As with spot product prices,
November 1978 wi tnessed a p a r t i c u l a r l y s h a r p spot crude price inc rease ,
as t h e e f f e c t s of t h e f i r s t product ion c u t s by I r a n began to be f e l t .
Supp l i e s to the s p o t market f e l l as most oil companies withdrew,
keeping t h e i r oil f o r c o n t r a c t customers. This, coupled with the

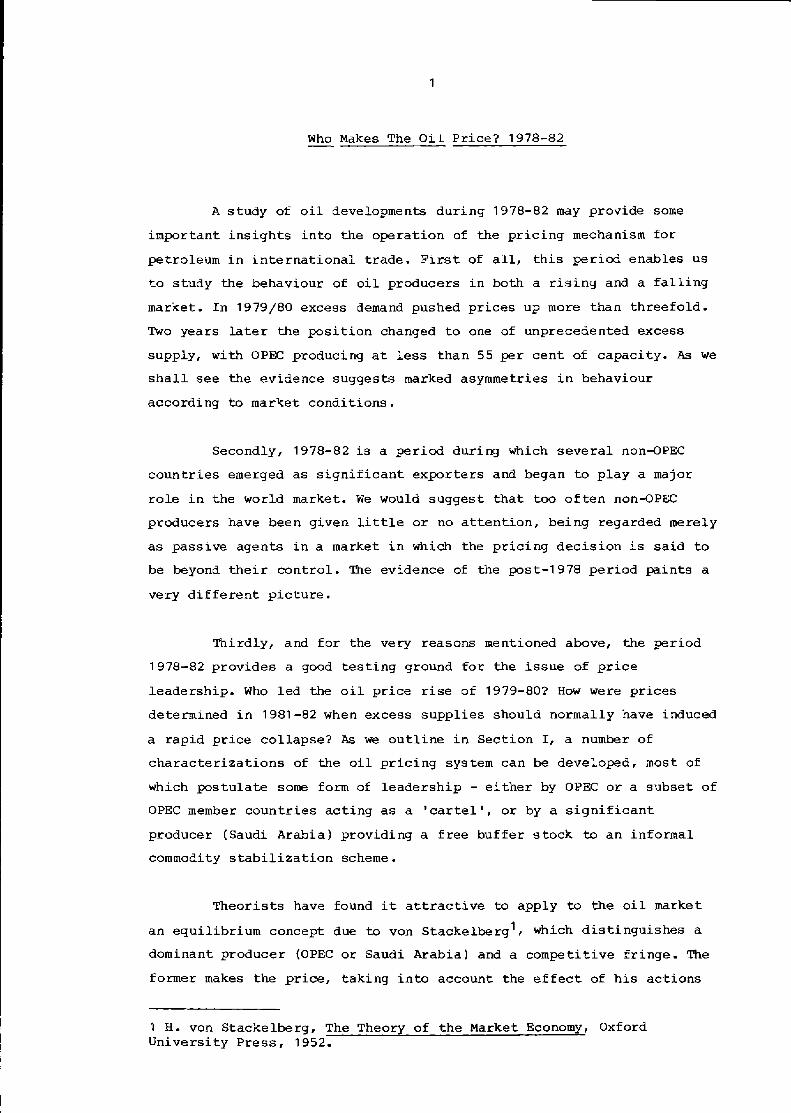
Figure 1
I: $ I b
38
36
34
32
30
28
26
24
22
20
18
I6
14
SPOT P R I C E S O F SELECTED C R U D E S AND PRODUCTS
- April 1978 to March 1979 -
F I'
I \ I ' ', Premium Gasoline
I / I
I I
I I
I I
I I
I 1
I I
I I
\ \
I I
/ North Sea Crude / '(Ekofisk 441
/ I ,+--'
/ /
/ /
/ /
f
I / {-Arabfan Light Crude
. .
12 - 10 -
A I M J n ' J I ' A u ' S ' O h 1 D J ' F I M '
1978 1979
Heauv Fuel Oil 3.596s
Official Marker Price

11
i nc reas ing
s i t u a t i o n ,
unease i n t h e oil market a s a whole over t h e I r a n i a n
pushed a l l spot p r i c e s up markedly i n mid-Novemeber 1978.
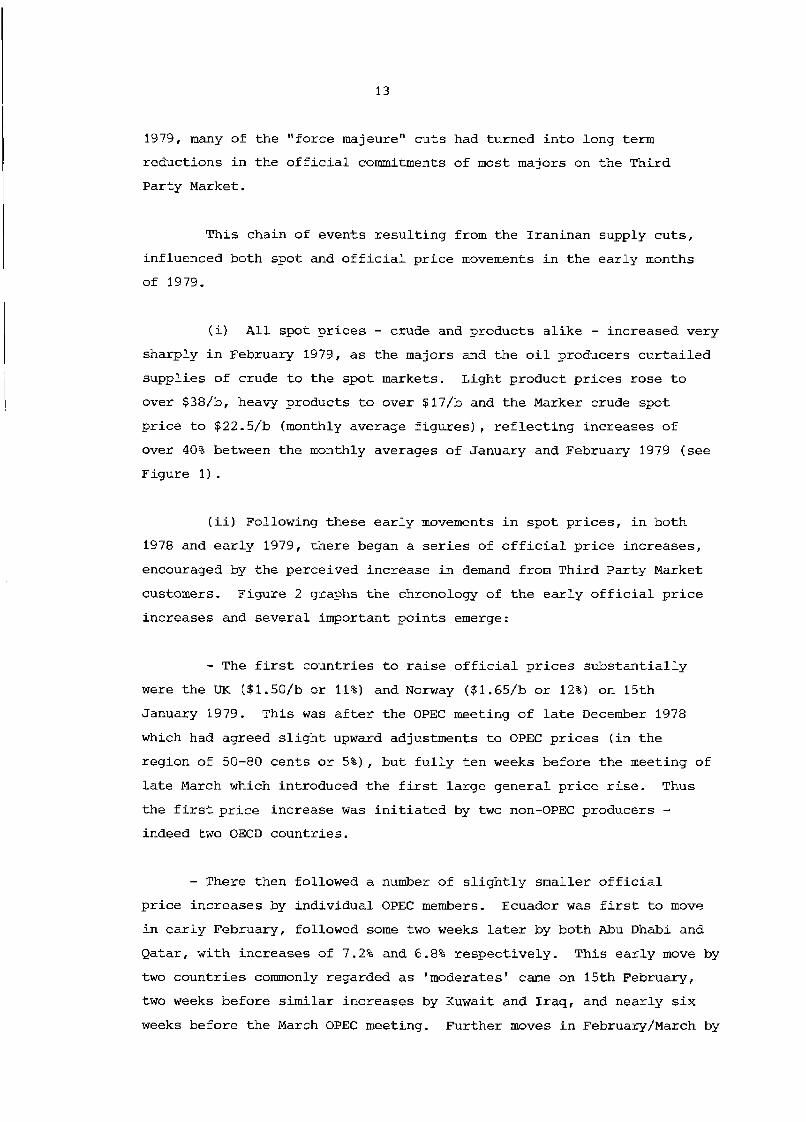
F igure 1 graphs t h e i n i t i a l movements i n two s p o t crude p r i c e s
a long with t h e two product p r i c e s d i s c u s s e d , - a n d h i g h l i g h t s t h e very
sharp and s u b s t a n t i a l na tu re of t h e i n c r e a s e s .
These s p o t p r i c e rises provide u s w i t h a backdrop a g a i n s t which
t o a s s e s s t h e very f i r s t o f f i c i a l p r i c e i n c r e a s e s , which were announced
by OPEC a t t h e end of December 1978 a t i ts Abu Dhabi meeting. By
December, spot l i g h t product p r i c e s had r i s e n by some 40%, s p o t crude
p r i c e s by 18% and spo t heavy product p r i c e s by some 9%. The o f f i c i a l
crude p r i c e s agreed a t t h e OPEC meeting e f f e c t e d i n c r e a s e s of between
2% and 6%, wi th t h e major i ty of c rudes , inc luding t h e Marker, r i s i n g by
5% (i .e. some 60-70 cen t s /b ) I T h i s w a s very much less than requi red t o
match t h e s p o t p r i c e i n c r e a s e s , and indeed it i s n o t c l e a r t h e e x t e n t
t o which t h e movements on t h e s p o t market a f f e c t e d t h e OPEC dec i s ion .
All j u s t i € i c a t i o n s of t h e p r i c e rise a t t h e t i m e were made i n terms of
t h e e f f e c t of i n f l a t i o n on r e a l p r i c e s and t h e impact of d o l l a r
exchange r a t e movements on OPEC revenue, and it was even repor ted t h a t
Saudi O i l Min i s t e r Y a m m i was "no t happy" w i t h t h e outcome. To quote
Petroleum I n t e l l i g e n c e Weekly 12
by t h e I r a n i a n supply s h o r t f a l l , made it d i f f i c u l t t o hold o u t €or a
smal le r r i s e . " Some evidence, t hen , of t h e movements i n spo t p r i c e s
a f f e c t i n g t h e o f f i c i a l p r i c e d e c i s i o n , b u t l i t t l e evidence of OPEC
achiev ing , o r even at tempting an o f f i c i a l p r i c e r i s e of anything l i k e
t h e s i z e needed t o match spot price movements.
I 1 .... market f o r c e s , appa ren t ly headed
l2 Petroleum I n t e l l i g e n c e Weekly , December 25 , 1978 , p- 2.

1 2
(b) December 1978 t o March 1979
This period between the OPEC meetings of Abu Dhabi and Geneva witnessed
very dramatic rises i n both s p o t and o f f i c i a l prices, and is also a
pe r iod which r evea l s some i n t e r e s t i n g f a c t o r s r e l e v a n t to t h e
p r i ce - l eade r sh ip ques t ion . In o rde r to understand the price movements
over those four months it is worth reviewing, b r i e f l y , the sequence of
e f f e c t s which the I r a n i a n product ion cuts had on t h e world market.
As w e have seen, October 1978 to March 1979 s a w some
s u b s t a n t i a l c u t s i n output by I r an , which had a f f e c t e d t o t a l world and
OPEC ou tpu t . The I r a n i a n loss amounted t o some 5 mbd, compensated i n
part by a 2 mbd i nc rease by Saudi Arabia. Whilst a n e t p roduct ion c u t
of 3 mbd is s u b s t a n t i a l , it i s a t f i r s t s i g h t s u r p r i s i n g that a 5% f a l l
i n world ou tpu t could cause, u l t ima te ly , a t h r e e f o l d price inc rease . To
understand this we must examine e x a c t l y how the I r a n i a n c u t s a f f e c t e d
the o i l market.
The fall i n I r a n i a n product ion had a p a r t i c u l a r l y l a r g e e f f e c t
on BP (an es t imated loss of 1.4 mbd), Exxon (loss of 400,000 bd) , and
Socal (loss of 300,000 bd) , a l l of whom had to d e c l a r e "force majeure"
c u t s on a number of t h e i r c o n t r a c t customers. BP, the most heavily
a f f e c t e d , began t h e c u t s as e a r l y as t h e second week of January 1979
wi th a huge 35% reduct ion . This w a s increased t o 45% (1.4 mbd) i n mid-
February, a t which t i m e t h e r e w e r e a spate of o t h e r force-majeure
o f f i c i a l supply c u t s announced - Exxon's 10% (400,000 bd) being the
second l a r g e s t . This t i g h t e n i n g of s u p p l i e s t o a few major companies
caused a f u r t h e r shr inkage of supply t o the spot market, and a s h a r p
reduct ion i n t h e f l o w of crude t o t h e Third Party Market, of which BP
and Exxon had been the ch ief suppl iers . The 'Third P a r t y Market ' w a s
the means by which major o i l co rpora t ions f ed crude o i l t o t hose
companies which d id n o t deal d i r e c t l y w i t h an OPEC o r a non-OPEC
producer. Japan was by f a r the largest such country, and indeed i t w a s
Japan who was m o s t h i t by BP and EXxon's c u t s .
The Japanese n a t u r a l l y responded to this new s i t u a t i o n by
t u rn ing d i r e c t l y to the producing na t ions , which, i n t u r n , prompted
producers both to i n c r e a s e t h e i r prices i n the l i g h t of the perceived
inc reased demand for t h e i r crude and f u r t h e r to restrict supp l i e s t o
t h e majors, thus accen tua t ing t h e problem. Indeed by the middle of
13
1979, many of t h e " fo rce majeure" c u t s had turned i n t o long term
reduc t ions i n t h e o f f i c i a l commitments of most majors on t h e Th i rd
Pa r ty Market.
T h i s cha in of even t s r e s u l t i n g from t h e I r an inan supply c u t s ,
in f luenced both spot and o f f i c i a l p r i c e movements i n t h e e a r l y months
of 1979.
(i) All spo t p r i c e s - crude and products a l i k e - i nc reased very
sha rp ly i n February 1979, as t h e majors and t h e o i l producers c u r t a i l e d
s u p p l i e s of crude t o t h e s p o t markets. Light product p r i c e s r o s e t o
over $38/b, heavy products t o over $17/b and t h e Marker crude spot
p r i c e to $22.5/b (monthly average f i g u r e s ) , r e f l e c t i n g i n c r e a s e s of
over 40% between t h e monthly averages of January and February 1979 ( s e e
Figure 1) .
(ii) Following t h e s e e a r l y movements i n s p o t p r i c e s , i n both
1978 and e a r l y 1979, t h e r e began a s e r i e s of o f f i c i a l p r i c e i n c r e a s e s ,
encouraged by t h e perce ived inc rease i n demand from Thi rd Pa r ty Market
customers. F igu re 2 graphs t h e chronology of t h e e a r l y o f f i c i a l p r i c e
i n c r e a s e s and s e v e r a l important p o i n t s emerge:
- The first c o u n t r i e s t o r a i s e o f f i c i a l p r i c e s s u b s t a n t i a l l y
were t h e UK ($1,50/b o r 11%) and Norway ($1.65/b or 12%) on 15th
January 1979. This was a f t e r t h e OPEC meeting of l a t e December 1978
which had agreed s l i g h t upward adjustments t o OPEC p r i c e s ( i n t h e
reg ion of 50-80 c e n t s o r 5 % ) , b u t f u l l y t e n weeks before t h e meeting of
l a t e March which introduced t h e f i r s t l a r g e g e n e r a l p r i c e rise. Thus
t h e f i r s t p r i c e inc rease was i n i t i a t e d by two non-OPEC producers - indeed two OECD c o u n t r i e s .
- There then followed a number of s l i g h t l y sma l l e r o f f i c i a l
p r i c e i n c r e a s e s by i n d i v i d u a l OPEC members. Ecuador was f i r s t t o movs
in e a r l y February, followed s o m e t w o weeks l a t e r by both Abu Dhabi and
Qatar, with i n c r e a s e s of 7 .2% and 6.8% r e s p e c t i v e l y . Th i s e a r l y move by
two c o u n t r i e s commonly regarded a s 'moderates ' came on 15th February,
two weeks be fo re s i m i l a r i n c r e a s e s by Kuwait and I r a q , and nea r ly s i x
weeks be fo re t h e March OPEC meeting. Further moves i n February/March by

I C .-
I
al 01 Q
m > m
L
ae v)
ae m hl
ae m
e
F

15
Libya (a long w i t h Shar jah and Dubai) l 3 add t o t h e list of u n i l a t e r a l
a c t i o n s which toge the r b e l i e any d e s c r i p t i o n of OPEC as a u n i f i e d
p r i c i n g c a r t e l over t h i s p e r i o d .
- Much the l a r g e s t i n c r e a s e s i n t h e f i r s t t h r e e months of 1979
came f r o m t w o non-OPEC produce r s , S y r i a ($3.11/b i n c r e a s e s on 2 1 s t
February, g iv ing a cumulat ive i n c r e a s e t o t h a t d a t e of over 31%) and
Egypt ($3.05/b inc rease on 25th March); and from t h e s m a l l e s t OPEC
producer, Ecuador ($4.60/b on 1 s t March). N o . s ign here of t h e l a r g e
producers d i c t a t i n g p r i c i n g p o l i c y t o t h e s m a l l p roducers .
- Whilst t h e ma jo r i ty of t h e non-OPEC producers lagged t h e OPEC
' l e a d e r s ' (Qatar, UAE, Iraq, Kuwait, Ecuador) i n t h e i r f i r s t l a r g e
p r i c e i n c r e a s e , they had a l l ( w i t h t h e except ion of USSR, China and
Mexico) in t roduced a s u b s t a n t i a l p r i c e rise (i.e. of $1.50 o r m o r e )
before t h e March OPEC meeting. They a l l , t h e r e f o r e , preceded a c t i o n by
t h e ma jo r i ty of OPEC.
OPEC members e n t e r e d t h e i r March 1979 Geneva conference w i t h
widely d i f f e r i n g v i eus on p r i c e s , and a r e c o n c i l i a t i o n of those views
w a s t o prove impossible. Saudi Arabia's a t t empt s t o urge moderation
were l a r g e l y ignored, and it u l t i m a t e l y agreed t o a Marker crude p r i c e
i n c r e a s e of j u s t over $ l / b t o $14.456/b. Other members, however, were
l e f t to add whatever premia or surcharges they wished t o t h i s 'minimum'
marker p r i c e - t h e r e s u l t be ing a wide range of price i n c r e a s e s from
Saud i ' s $ l / b t o up t o $3.75/b by t h e Afr ican producers (Alger ia , Libya
and N i g e r i a ) . Even Gulf producers such as Abu Dhabi, Qatar, I r a n and
K u w a i t set t h e surcharge a t $1.80/b. The f i r s t OPEC conference a t which
l a r g e p r i c e r i s e s were in t roduced , t h e r e f o r e , w a s one of d i s u n i t y of
a i m s and outcomes. Its e f f e c t w a s simply t o keep pace w i t h t h e l a r g e
i n c r e a s e s i n spot and non-OPEC o f f i c i a l p r i c e s which had a l r eady
occured.
F i n a l l y , note t h a t a l l t h e s e p r i c e i n c r e a s e s s t i l l l e f t
o f f i c i a l p r i c e s s u b s t a n t i a l l y below s p o t c rude p r i c e s - by an average
of about $6/b a t t h e end of March 1979.
l 3 Sharjah and D u b a i a r e both members of OPEC through t h e i r membership of t h e United Arab Emirates, a l though they do not act i n unison w i t h Abu Dhabi, t h e ch ie f o i l -p roduce r and OPEC member i n t h e UAE.

16
( c ) March 1979 t o December 1980
The bulk of 1979 and 1980 w a s a confused pe r iod of rap id , a d g e n e r a l l y
uncoordinated, price increases, from which it is d i f f i c u l t t o d i s c e r n
any clear p a t t e r n o r any evidence of p r i ce - l eade r sh ip on t h e part of a
s i n g l e group of producers . !The main developments were as fol lows:
Spot c rude prices (see Figure 3 ) increased very r a p i d l y i n 1979,
p a r t i c u l a r l y i n April-June (Arabian Light spot price increased from
$28/b t o $ 3 S / b ) and i n September-November (from $35 to a peak of $41 1.
This was both a much f a s t e r and g r e a t e r abso lu t e increase than was
disp layed i n any o f f i c i a l c o n t r a c t price i n 1979. A t the peak of
November 1979, t h e Arabian L igh t s p o t price was f u l l y $23/b above i t s
o f f i c i a l price. The f a c t o r s behind these two s p u r t s are a g a i n both of
i n t e r e s t and importance. As noted above, March 1979 s a w the resumption
of I r a n i a n expor t s , and by April s p o t prices began to weaken. Saudi
Arabia t h e r e f o r e decided t h a t it w a s aga in s a f e t o r e t u r n t o i t s
t r a d i t i o n a l ou tput of 8.5 mbd, which it had raised t o 9.5 mbd to
counter t h e I r a n i a n c u t s . The e f f e c t of this c u t , exaggerated f u r t h e r
by Niger ian c u t s of up t o 100,OO bd t o BP who i n a d v e r t e n t l y broke
N i g e r i a ' s boycot t of South Afr i ca i n May 1979, w a s to send crude-hungry
majors h e a v i l y i n t o the s p o t market, d r i v i n g prices up towards $35/b by
mid-May .
It is d i f f i c u l t t o know the motives behind t h e Saudi cut. Some,
no tab ly Adelman14 have i n t e r p r e t e d i t as a d e l i b e r a t e attempt t o push
prices s t i l l h igher , wh i l s t o t h e r s 1 5 have seen it as a non-aggressive
response to the r e t u r n of I r a n i a n exports t o t h e world market. As we
s h a l l see, Saudi attempts to hold down the price throughout the rest of
1979 and 1980 would appear a t odds wi th Adelman's i n t e r p r e t a t i o n .
Indeed, t h e 1 mbd c u t corresponded to an i n c r e a s e i n I r a n i a n ou tpu t of
some 3 mbd by A p r i l , l e av ing t o t a l OPEC ou tpu t 2 mbd h ighe r than i n
March. With spot prices weakening by March, it is perhaps not
unreasonable €or Saudi Arabia t o have f e l t j u s t i f i e d i n r e t u r n i n g to
l 4 Morris Adelman, 'OPEC as a Cartel I , i n James M. Griffin and David J. Teece (eds .) , OPEC Behaviour and World O i l Prices, George Allen Ei
Unwin, 1982, pp. 47-49.
l 5 I a n Seymour, OPEC - Ins t rument of Change, Macmillan P res s , 1980, pp. 183-184.

0 cv

18
i t s lower ou tpu t l e v e l t o make way f o r I r a n ' s resumption of expor t s .
Whatever the motives of the Saudi c u t , and despite the aggrega te
i n c r e a s e i n OPEC ou tpu t , the e f f e c t w a s aga in t o cause unease i n the
world market and a f u r t h e r dramatic s p u r t i n t h e crude s p o t price.
The second spot price spurt of November 1979 is, a t f i r s t
s i g h t , something of a paradox, with seemingly adequate output t o meet
c u r r e n t demand. There was, however, s u b s t a n t i a l s tockbui ld ing i n t h e
l as t t w o quarters of 1979 as t h e majors sought both to r e p l e n i s h
deple ted s t o c k s and t o guard a g a i n s t p o s s i b l e f u t u r e p o l i t i c a l problems
in I r a n . T b quote Seymourt6, "Fear rather than shor t age was , t h e r e f o r e ,
t h e dominant f o r c e behind the buoyant market i n t h e second half of
1 9 79 . " Following the peak a t the end of 1979, spot crude prices
proceeded to f a l l du r ing the f i r s t e i g h t months of 1980 (Arabian L igh t
f e l l from $41/b to $32/b by August 1980) before t h e o n s e t of the
I r an / I r aq War pushed them to a second peak (Arabian Light $41/b a g a i n )
in November 1980. This second peak w a s above the l e v e l
achieved by any official prices i n 1980, bu t s e v e r a l producers had
increased their o f f i c i a l prices s u f f i c i e n t l y by mid-1 980 t o have
regained p a r i t y with s p o t crude prices before t h e second s p o t price
jump-
Some understanding of t h e output movements behind t h e s p o t
price s p u r t of l a te 1980 would aga in be u s e f u l . I r a n i a n product ion,
having recovered to 4 rnbd i n September 1979, f e l l s t e a d i l y over the
next year to just over 1.1 mbd i n September 1980 a t the outbreak of the
I r a n / I r a q War. &spi te t h i s , t h e year had seen no major aggrega te
supply s h o r t a g e s - indeed t h e r e was t h e usua l p a t t e r n of inventory
run-down i n the f i r s t quarter of 1980 (less than usua l i f anyth ing) and
s u b s t a n t i a l build-up i n the third q u a r t e r . This r e f l e c t e d s h a r p l y
f a l l i n g demand worldwide, as w e l l as compensating i n c r e a s e s i n ou tpu t
by Saudi Arabia (back a t around 10 mbd) and non4PEC product ion some
1.5 mbd above 1978 l e v e l s . Iraq's output was s t e a d y a t around 3 . 4 t o
3.5 mbd. The w a r saw the combined output of I r a n and Iraq f a l l from 4.5
mbd to under 1 mbd i n October and November 1980. Saudi Arabia
l 6 I . Seymour, op . c i t . , p.189.
19
immediately sought t o s o f t e n the impact of t h i s cutback by inc reas ing
ou tpu t t o over 10.5 mbd bu t t o t a l OPEC output s t i l l f e l l by some 2 mbd.
Whils t t h i s c u t fo rced spot crude p r i c e s back up t o $41/b, it
d i d no t have t h e same effect as t h e s i m i l a r c u t i n 1978/9, which was
followed by a t h r e e f o l d r i s e i n s p o t p r i c e s i n j u s t e leven months.
reasons f o r t h i s a r e wel l documented by Badger and Belgrave17 and need
n o t concern us unduly here . W e would perh:aps p l a c e less emphasis than
do Badger and Belgrave on the speedy and a p p r o p r i a t e a c t i o n by the IEA
and Saudi Arabia , and p o i n t m o r e t o t h e fundamental ly d i f f e r e n t market
cond i t ions i n which t h e two product ion c u t s occurred. I n September 1980
t h e i n d u s t r y knew t h a t world o i l consumption had been on a d e c l i n i n g
t r e n d f o r almost two y e a r s - a pe rcep t ion which, n a t u r a l l y , nobody had
i n 1979. Moreover inventory l e v e l s were very h igh , p rov id ing a secu re
cushion t o bo th companies and governments.
The
O f f i c i a l P r i c e s . A s suggested above, t h e pe r iod s a w a gene ra l melee of
o f f i c i a l p r i c e i n c r e a s e s , wi th producers leapf rogging ove r each o t h e r s '
p r i c e rises. OPEC members, wi thout except ion, r e g u l a r l y inc reased
p r i c e s o u t s i d e OPEC meetings, and indeed a c t e d i n no d i f f e r e n t manner
t o t h e non-OPEC producers (wi th t h e s o l e except ion of Saudi Arabia, as
d i scussed below). A t t h e extreme, Ecuador appeared t o abandon any
concept of a f i x e d o f f i c i a l p r i c e f o r i t s crude, and v a r i e d its pkiee
wi th 'market c o n d i t i o n s ' a lmost on a cargo-by-cargo b a s i s . N o s i n g l e
count ry took a c o n s i s t e n t ' l e a d ' i n t h e pe r iod - i n terms of
c o n s i s t e n t l y i n c r e a s i n g p r i c e s e a r l i e r t han and/or by a g r e a t e r margin
than t h e r e s t . Tables 1 and 2 show a v a r i e t y of c o u n t r i e s t o have
inc reased p r i c e s more r a p i d l y than t h e r e s t a t one t ime or another .
Seve ra l c o u n t r i e s d i d emerge towards t h e t o p of the p r i c e league - notably I r a n , Libya and Ecuador w i t h i n OPEC, and Egypt and S y r i a
o u t s i d e OPEC - b u t t h e r e i s no c l e a r evidence of producers fo l lowing
any one c o u n t r y ' s p r i c e movements c l o s e l y throughout t h e pe r iod .
17Daniel Badger and Robert Belgrave, O i l Supply and P r i c e : Right i n 1980, B r i t i s h I n s t i t u t e ' s J o i n t Energy Programme, Energy Paper No. 2 , 1982.
What Went

20
0 0
U 7
? n - > 0 9
0
* m
? T
I 2
N W OD r
- cn N m
m N

21
X Q1 a d H

22
The manner i n which o f f i c i a l prices followed spot crude prices
v a r i e d f o m country t o country. A t one extreme, Ecuador (wi th in OPEC)
and Egypt (non-OPEC 1 followed s p o t movements quite c l o s e l y - p a r t i c u l a r l y i n the rap id rise of t h e f i r s t half of 1979 ( s e e Figure
4 ) . A t the o t h e r extreme, Saudi Arabia lagged behind a l l o t h e r
official price rises throughout the period and i ts o f f i c i a l prices bore
l i t t l e o r no r e l a t i o n s h i p to movements i n the s p o t price throughout
1979 and 1980.
The very v o l a t i l e p r i c i n g of Ecuador and Egypt, among o t h e r s ,
and t h e i r rapid response t o s p o t price movements are
i n t e r e s t i n g f e a t u r e s of t h e 1979/80 price explosion. One may ask whether
t h e i r p o l i c i e s provided some kind of leadersh ip? W e would sugges t no t .
Ecuador and Egypt most c e r t a i n l y were not dominant producers , ab l e t o
d i c t a t e p r i c i n g p o l i c y to the rest of t h e wor ld ' s p roducers . Nor indeed
were they always able t o s u s t a i n price changes i n the f a c e of a
r e l u c t a n c e by o t h e r s to fol low. (This was p a r t i c u l a r l y so f o r Ecuador,
whose p r i c i n g w a s e s p e c i a l l y v o l a t i l e . 1 Equally, they w e r e n o t t h e
wel l - respected producers of the 'barometr ic l eade r sh ip ' model,
i n s p i r i n g the confidence of o t h e r s i n t h e i r judgements and f o r e c a s t s . Such was the c loseness of t h e i r p r i c i n g t o the spot price t h a t they
gave o t h e r producers no more informat ion than they werealready
r ece iv ing from the spot market. The p r i c i n g a c t i v i t y of such s m a l l
coun t r i e s is perhaps more simply expla ined by t h e i r r e l a t i v e lack of
commitment to long-term supply c o n t r a c t s , al lowing t h e m e f f e c t i v e l y t o
t r ade on the spot.
Whilst t h e a c t i o n of Ecuador and Egypt does n o t g ive evidence
of p r i c e - l e a d e r s h i p on t h e i r part , however, i t is impor t an t i n c a s t i n g
doubt on the notion of the re having been any l e a d e r over the per iod .
J u s t as ECuador, Egypt and t h e l i k e w e r e no t ' l e a d e r s ' , nor were they
fo l lowers of some more dominant producer .
The r o l e of Saudi Arabia, much t h e l a r g e s t producer i n OPEC, is
worthy of p a r t i c u l a r a t t e n t i o n . As the i n d i c e s of l k b l e s 1 and 2 show,
Saudi Arabian prices lagged w e l l behind those of a l l o t h e r O P E and
non-OPEC producers , such that by the end of April 1981 t h e Saudi Marker
price of $26/b w a s up t o $9 below those of comparable l i g h t crudes. It
appears t o have been a price fo l lower throughout the two years of price
i n c r e a s e s , with much smaller price rises than o t h e r s up to A p r i l 1980.

0 m a! C W
Y
.- L
0
I d c1 Q c a! - m N
------!:

24
The h i s t o r y book shows Saudi Arabia to have been a voice of
moderation throughout much of 1979 and 1980. As w e have seen, it w a s
uneasy about the March 1979 i n c r e a s e s when it only raised the marker
price by $ l /b ! This w a s t h e beginning of two years of ' m u l t i - t i e r e d '
p r i c i n g wi th in OPEC, with the Saudis keeping Arabian L igh t price
inc reases to a minimum, and much of the rest of OPEC o p e r a t i n g to a
much h igher de f a c t o 'marker ' p r ice .18
Indeed the Saudi motivat ion throughout the per iod appears
tohave been to p reven t wide divergence of prices wi th in OPEC - i t s
price inc reases , when they came, a t t empt ing always to r e e s t a b l i s h
p a r i t y r a t h e r t han push t h e whole system f u r t h e r up. The chronology of
December 1979/January 1980 i l l u s t r a t e s this p o i n t :
14 December 1979 - Saudi Arabia (along with the UAE, @ t a r and
Venezuela) i n c r e a s e s i t s marker price by $6/b, i n o rde r t o close the
$5.5/b gap which has appeared between i t and I r a n i a n l i g h t , and t o
attempt to "c l ip t h e wings of the price hawks"19.
16 D e c e m b e r 1979 - I r an r e -e s t ab l i shes the d i f f e r e n t i a l w i t h a $5/b
i n c r e a s e .
3 January 1980 - I r a n f u r t h e r i n c r e a s e s t h e d i f f e r e n t i a l by $2/b.
28 January 1980 - Saudi Arabia aga in tries to c l o s e the gap wi th its
own $2/b inc rease .
1 February 1980 - I r a n aga in r e -e s t ab l i shes the d i f f e r e n t i a l with a
f u r t h e r $2/b i n c r e a s e .
l 8 As e a r l y a s the June 1979 Geneva meeting this p a t t e r n became clear - with t h e Saudi marker price a t $18/b, b u t with the rest of t h e Gulf working to an e f f e c t i v e marker of $20/b, and I r a n employing i t s own $ 2 2 marker. P r i ces w e r e no t to regroup around the o f f i c i a l marker u n t i l October 1981, d e s p i t e f r equen t attempts by the Saudis to achieve such u n i t y .
D r . H u m b e r t o Calderon-Berti , Venezuelan O i l Min i s t e r .
I
25
Saudi Arabia's attempts to r e u n i f y OPEC prices throughout the
p e r i d served only to allow f u r t h e r i n c r e a s e s by the res t of OPEC.
There would appear t o be no evidence of convent ional p r i ce - l eade r sh ip
by t he dominant producer i n the t w o yea r s of r i s i n g prices.
None-the-less, a number of OPEC members d i d s t i c k c l o s e l y t o
t h e p r i c i n g p a t t e r n of Saudi Arabia. Indonesia and Venezuela increased
o f f i c i a l prices only s l i g h t l y f a s t e r i n 7979 and then remained i n step,
as d id the UAE, Iraq, Qatar and K u w a i t a f t e r t h e i r i n i t i a l l a r g e
i n c r e a s e s i n e a r l y 1979. D i f f e r e n t i a l s had n o t been restored i n any of
t h e s e cases by the end of 1980, however. The motives of t h i s group of
r e l a t ive 'moderates' are f a r from clear. They w e r e r e l u c t a n t to make
f u l l use of the headroom i n prices created by the s p o t market and the
more aggres ive producers a n l y e t t h e i r p e r i o d i c l a rge price i n c r e a s e s ,
no tab ly in early 1979, do n o t sugges t any over - r id ing l o y a l t y to the
O P I E p r i ce - f ix ing machinery. There is, indeed, much evidence t h a t these
c o u n t r i e s i n p a r t i c u l a r added l a r g e u n o f f i c i a l premia on top of
o f f i c i a l prices for long-term c o n t r a c t s with companies who were
d e s p e r a t e f o r o i l . This e f f e c t i v e l y inc reased prices to n e a r e r t h e s p o t
price without a f f e c t i n g the " o f f i c i a l " price.
The e f f e c t of producers ' widely d i f f e r i n g p r i c i n g p o l i c i e s w a s
t o widen price d i f f e r e n t i a l s s u b s t a n t i a l l y (both with in and o u t s i d e
O P E ) . Table 1 p r e s e n t s simple Standard Deviat ions f o r t h e index
numbers a t each date shown, They show a very clear and marked widening
of d i f f e r e n t i a l s w i t h i n OPEC t o a peak i n A p r i l 1980. The remainder of
1980 s a w some l i m i t e d narrowing of d i f f e r e n t i a l s , but the two year
pe r iod of r i s i n g prices s t i l l ended wi th very s u b s t a n t i a l d ivergences
of o f f i c i a l prices from the d i f f e r e n t i a l s t r u c t u r e of September 1978.
( d ) T h e o r e t i c a l Impl i ca t ions of t h e 1979/80 P r i c e R i s e s
What impl i ca t ions , then , does the evidence of the 1979-80 pr ice
i n c r e a s e s have f o r t h e t h e o r e t i c a l c h a r a c t e r i z a t i o n of the world o i l
i n d u s t r y i n a t i g h t market? F i r s t of all, we would s u g g e s t that there
is l i t t l e or no evidence of OPEC act ing as a u n i f i e d cartel. W e have
described t w o yea r s of widespread u n i l a t e r a l price s e t t i n g by OPEC
members, with the ma jo r i ty of p r i c i n g d e c i s i o n s being taken o u t s i d e
o f f i c i a l OPEC meet ings . The pe r iod was also one i n which there w a s no

26
agreement on product ion wi th in the Organisa t ion . W e would sugges t that
a group of producers who i n d i v i d u a l l y decide on both t h e i r ou tpu t and
prices do not c o n s t i t u t e a c a r t e l i n any economically meaningful s e n s e .
Secondly, we do n o t be l i eve t h a t t h e evidence of the
tightdemand/supply cond i t ions of 1979/80 lends suppor t to the n o t i o n
that the o i l market comprises a dominant producer group which sets
prices and a competitive f r i n g e of pr i ce - t ake r s . As we have seen, t h e r e
h a s been no group of producers which has c o n s i s t e n t l y dictated prices
to t h e rest of the i n d u s t r y , o r indeed one which has c o n s i s t e n t l y
adopted t h e prices s e t by the o t h e r s . P r i c e changes have been i n i t i a t e d
by almost every producer a t some ,point over the t w o yea r s - the smaller
producers o f t e n r e a c t i n g more s w i f t l y to spot price movements. There
has c e r t a i n l y been no l a r g e producer which has enforced i t s price
changes - as i n the "dominant-firm price l eade r sh ip" model. me one
count ry which could conceivably do so, Saudi Arabia, has lagged behind
a l l o t h e r price movements throughout, and i t s attempts to se t OPEC
prices were unsuccesful . Q u a l l y , t h e r e has been no s i n g l e
"wel l - respec ted" producer which has acted a s d "barometer" to the
i d u s t r y . The ch rono log ica l leader changed too f r equen t ly f o r any
c redence t o be placed on such a not ion, and e q u a l l y , e a r l y price moves
w e r e no t always followed by the rest of t h e indus t ry .
It has been suggested t h a t , w h i l s t the dominant price se t t e r
m a y n o t d i c t a t e a l l price movements, it does dec ide broadly the l e v e l
a round which prices w i l l f l u c t u a t e . Hence, the dominant p r d u c e r sets
its price a t , say, $30/b and al lows the rest of t h e i n d u s t r y to compete
a round t h a t l e v e l . Again, we would sugges t t h a t t h i s does n o t
c o n s i s t e n t l y f i t the f a c t s i n a t i g h t market. There i s no evidence of
any country/group of c o u n t r i e s determining the l e v e l to which the price
was t o rise over the two years .
The p a t t e r n of price movements i n 1979/80 does n o t t h e r e f o r e
conform to the no t ion of a p r i ce - t ak ing f r i n g e i n t h e o i l market.
R a t h e r , the p r i c i n g a c t i v i t y of the per iod sugges t s t h a t even the
s m a l l e s t producer i n t h e market had a n i n c e n t i v e to change prices - i .e. every producer i n the market, i n t i m e s of excess demand, appears
to f a c e a s lop inq demand curve and not t h e h o r i z o n t a l demand curve
P o s t u l a t e d i n models w i th a p r i ce - t ak ing f r i n g e . Every producer, i n
this case, is a price-maker. In a s i t u a t i o n of excess demand, t o q u o t e

27
Arrow: 'I... any i n d i v i d u a l en t r ep reneur knows t h a t he can raise the
price, even i f h i s competi tors do not raise t h e i r s , because they cannot
s a t i s f y any more of the demand than they do a l r e a d y . The ent repreneur
is faced with a s lop ing demand curve and r a i s e s h i s price i n accordance
with the profit-maximizing tactics of a monopolist . . .'I and indeed
'I.. .it is equa l ly to the p r o f i t of a l l o t h e r en t r ep reneur s t o raise
t h e i r prices also. . . I ' 2o
I n fact, i n such a s i t u a t i o n of excess demand, each producer
f i n d s the demand curve to be s h i f t i n g to the r i g h t , such t h a t he can
e f f e c t i v e l y opera te a long h i s own supply curve . Such an explana t ion
would appear t o f i t c l o s e l y t h e pricing behaviour i n the o i l market of
1979/80. Small producers , both wi th in and o u t s i d e OPEC, had d r a t i o n a l
economic i n c e n t i v e to raise t h e i r prices.
But producers d i d not always (and some never d i d ) raise t h e i r
prices as h igh as demand might have allowed. A v a r i e t y of i n h i b i t i o n s
were probably a t work - f e a r of l o s i n g customers ' goodwil l should
circumstances change, poli t ical cau t ion , etc. It a l s o seems t h a t Saudi
Arabia exe rc i sed an in f luence on p r i c i n g behaviour .
The r o l e of Saudi Arabia dur ing this period is d i f f i c u l t t o
de f ine i n terms of usua l l e a d e r s h i p m o d e l s . As mentioned ear l ier ,
attempts by Saudi Arabia to s e t the price a t i t s p r e f e r r e d l e v e l w e r e
n o t s u c c e s s f u l . I n this sense , it w a s n o t a convent iona l price
l eade r . Its c o n t r i b u t i o n w a s rather d i f f e r e n t . Saudi A r a b i a ' s
behaviour helped OPEC r e t a i n an i d e n t i t y and sense of purpose. By
holding i t s prices down, w e l l below market levels and i n def iance of
a l l market i n d i c a t o r s , i t defended the not ion that the r e fe rence price
of o i l should remain an adminis te red price. By so doing it helped
p r e v e n t OPEC from abd ica t ing i t s func t ions e n t i r e l y to the market.
During this per iod , OPEC member c o u n t r i e s found themselves
moving between two poles : t h e s p o t market a t one extreme and Saudi
Arabia a t the o t h e r . Their i n d i v i d u a l p r i c i n g behaviours r e f l e c t the
r e l a t i v e a t t r a c t i o n of t hese two poles , a t d i f f e r e n t po in t s i n t i m e , t o
each member country. A s we have s e e n , Ecuador moved towards one pole
20 K.T. A r r o w , o p - c i t . , p.46.

28
and allowed i t s prices to fo l low the market, i n i ts ups and i n i t s
i n e v i t a b l e downs. Others, though s t r o n g l y tempted t o fol low such a n
extreme course , found themselves more or less r e s t r a i n e d by a
commitment to price admin i s t r a t ion . They were not prepared to give up
OPEC ( t h e i n s t i t u t i o n a l form of this commitment) e n t i r e l y . Saudi
A r a b i a ' s p r i c i n g behaviour was a cons t an t reminder of the need t o
admin i s t e r prices. It also provided a n anchorage to prices, a n
anchorage which d id not s t o p them from r i s i n g bu t c e r t a i n l y increased
t h e drag.
I n short Saudi Arabia did n o t lead OPEC a long a price path of
its choice . Every o i l producer w a s a t t i m e s a 'price maker' h l a
Arrow. Without Saudi Arabia each would have taken full advantage of
the slope i n i ts demand curve. I n the end, however, with the market
reaching equi l ibr ium every producer would have become a price t a k e r - not of a price set by a dominant s u p p l i e r , b u t of a price determined by
t h e i n t e r s e c t i o n of t o t a l demand and t h e aggrega te supply curve .
Y e t , because of Saudi Arabia 's p r i c i n g po l i cy , the outcome was
d i f f e r e n t . Most O P E producers followed a d i f f e r e n t price pa th to t h a t
traced by the market. The two paths went up i n the same d i r e c t i o n , but
they r a r e l y coincided. Curiously they i n t e r s e c t e d a t a p o i n t where
market prices were beginning to f a l l (having reached a peak which
o f f i c i a l prices never a t t a i n e d 1, while official prices w e r e con t inu ing
t o rise. The impor tan t p o i n t i s t h a t a d i s t i n c t i o n was preserved
between OPEC's and the marke t ' s price behaviour when very powerful
f o r c e s were a t tempt ing to a b o l i s h t h i s d i s t i n c t i o n .

29
The P r i c e U n i f i c a t i o n of 1981
(a) 1981 Output
Again, a review of the output changes over 1981 i s an impor tan t
prerequis i te to understanding the price movements Over the year . As we
noted earlier, Saudi Arabia increased its product ion to around 10.5 mbd
i n October 1980 i n response to t h e I r a n / I r a q war, It maintained t h i s
h ighe r ou tpu t c e i l i n g ( t r a d i t i o n a l l y f ixed a t 8.5 mbd) u n t i l the end of
August 1981 - a p o l i c y which had very important i m p l i c a t i o n s f o r the
whole of the o i l market i n the f i r s t t h r e e q u a r t e r s of t h e year . By t h e
end of 1980, Saudi Arabian prices w e r e s o m e $8/b below the rest of OPEC
and t h e d e c i s i o n to r e t a i n such a h i g h "al lowable output" i m p o s e d very
marked c u t s i n sales on many o t h e r OPEC producers . Despite the f a c t
t h a t I r a n and Iraq's combined ou tpu t only recovered to some 2.4 mbd,
the market s lackened s u f f i c i e n t l y f o r Libya and K u w a i t t o l o s e 1 mbd;
Niger ia some 1.3 mbd; Venezuela 0.5 mbd; and Qatar, Algeria and the UAE
some 200,000 bd i n the e i g h t months to August 1981 . As we s h a l l see,
t h e p re s su re which such l o s s e s of o u t p u t pu t on price d i f f e r e n t i a l s
w i t h i n OPEC w e r e to prove s u f f i c i e n t t o p u l l most prices down to the
Saudi l e v e l . More f l e x i b l e p r i c i n g i n the f i r s t h a l f of 1981 enabled
m o s t non-OPEC producers to maintain their output i n the f a c e of Saudi
A r a b i a ' s ' f l o o d i n g ' of the market.
( b ) 1981 Spot P r i c e s
This emergence of an excess supply of o i l was r e f l e c t e d most
immediately i n the s p o t markets. Having peaked i n November 1980 ( a t
$41/b for Arabian L igh t ) , spot crude prices f e l l by some $8 t o $10 by
mid-1981 t o the then p r e v a i l i n g o f f i c i a l marker price of $32/b. Spot
product prices a l s o began to d e c l i n e i n December 1980 ( t h i s t i m e
i nc lud ing 3.5% S f u e l o i l ) and s t a b i l i s e d by June/July a t prices not
incompatible with t h e $32 Marker. The d e c l i n e i n product prices i n the
f i r s t h a l f of 1981 was less than i n spot crude prices, they having
achieved a r a t h e r lower peak i n 1980. A l l of t h i s , coupled
wi th the drop i n sales ou t l ined above, provided producers wi th a clear
s i g n a l of the s lackening of t h e market - a s l ackness which cont inued

30
throughout 1981, w i t h only a weak recovery i n spot prices i n the w i n t e r
quarter. Spot price movements over 1981 are graphed on Figure 3.
(c) O f f i c i a l P r i c e s
Unlike t h e spot price d e c l i n e i n the f i r s t ha l f of 1980, this t i m e
o f f i c i a l prices followed the s p o t p r i c e down. F igure 5 i l l u s t r a t e s the
price cuts which took place before the OPEC meeting of l a te October
1981. Seve ra l i n t e r e s t i n g f e a t u r e s emerge:
Almost wi thout except ion , non-OPEC producers c u t their prices
s u b s t a n t i a l l y between A p r i l and August 1981 - befo re any moves by the
v a s t ma jo r i ty of OPEC. As we suggested above, these c u t s were i n
response to t h e aggress ive Saudi Arabian p o l i c y of selling 10.5 mbd a t
i t s r e l a t i v e l y l o w price of $32/b. The non-OPEC producers ' cu t s i n
prices brought them a l l back to around the Saudi l e v e l ( t h e r e s u l t a n t
d i f f e r e n t i a l s are examined i n Id) below), enab l ing them to compete and
pushing s t i l l more of t h e burden of output ad jus tment onto t h e
high-priced OPEC producers . Whilst s t i l l lagging spot price movements
by around s i x months, t h e o f f i c i a l price chronology shown i n F i g . 5
aga in sugges t s a g r e a t e r f l e x i b i l i t y and s e n s i t i v i t y t o spot price
changes on t h e part of non-OPEC producers than OPEC c o u n t r i e s .
The f i r s t t h ree q u a r t e r s of 1981 s a w a prolonged series of
disagreements w i t h i n OPEC. As noted earlier, 1979/80 had seen t h e
emergence of a two-t iered p r i c i n g system, with t h e o f f i c i a l Marker a t
$32/b and a de f a c t o Marker price of $36/b, around which much of OPEC
w a s c l u s t e r e d . The Saudi p o l i c y of main ta in ing a very h igh ou tpu t
d e s p i t e the weakening demand, and thereby i n f l i c t i n g very l a r g e c u t s in
sales on the rest of OPEC, w a s pursued with t h e s o l e a i m of p u l l i n g t h e
rest of OPEC back down to around i t s o f f i c i a l Marker price. It w a s a
clear attempt by Saudi Arabia t o reassert its p o s i t i o n i n the
Organ i sa t ion and indeed i n the whole world o i l market.

B y A p r i l
1 5 A p r i l
-10% I
1 M a y
7 M a y
14 M a y
18 M a y
1 J u n e
1 0 J u n e
1 5 June
1 July
10 July
17 Julv
1 Aug
26 Aug
1 om
29 Oct
EARLY 1981 OFFICIAL PRICE CUTS Figure 5
I - Price arts by all oil producers before the OPECrneeting of October 1981 -
- l 7 % I
E c u a d o r
-6% -1
C h i n a
M a layr ia
B r u n e i U S A E g y p t
Mexim USA
Malaysia
USSR U.K. Brunei
Mexico Libya Syria
Malaysia
China Egypt
Mexico Syria
Nigeria
USSR
OPEC
-:.$ - 3 %
- 1 0 % I - 3 % l
-2% -8%,
- l l % c - ? l % r 1
- 3 % J
-7%
-5% ’ 4%,
- 8 % ’
-3% - -7%
32
The OPEC meeting i n late May 1981 brought the c o n f l i c t w i t h i n
OPEC i n t o t h e open. Saudi Arabian attempts t o p u l l the rest of the
members' prices down from t h e i r $36/b "marker" were r e s i s t e d and indeed
the o t h e r twelve agreed p r d u c t i o n c u t s (of some 1 .25 mbd) i n an
attempt to defend t h e i r h ighe r r e fe rence price. Much of the summer was
then spent t r y i n g to urge product ion c u t s on Saudi Arabia, as spot
prices and output continued t o tumble. A f u r t h e r meeting of OPEC i n
mid-August 1981 again f a i l e d to agree on a r e u n i f i e d price s t r u c t u r e , a n d by this t i m e , as we have seen , a lmost every non-OPEC producer had
c u t p r i c e s to t h e Saudi Arabian l e v e l , e x e r t i n g s t i l l more pressure on
t h e bulk of OPEC.
The f a i l u r e of the August OPEC meeting was s w i f t l y followed by
one of the few u n i l a t e r a l price c u t s by an OPEC m e m b e r i n 1981 - Niger ia c u t t i n g from $40/b t o $36/b a t the end of tha t month. As Fig. 5
shows, the only previous cuts had been by Ecuador who cont inued to be a
l a w unto i t s e l f , and a small ($1.10/b) cut by Libya i n July.
The b a t t l e by Saudi Arabia t o re-impose i t s e l f as the ' l e a d e r '
w i th in OPEC, and to r e - e s t a b l i s h Arabian Light as " t h e " OPEC marker
crude, w a s thus a long a n d d i f f i c u l t one. It w a s a ba t t l e which i t
f i n a l l y won i n l a te October 1981, when, a t the meeting i n Geneva, a new
s i n g l e Marker price of $34/b was f i n a l l y agreed upon. A l l OPEC prices
thus f e l l s h a r p l y t o new l e v e l s around the $34/b Marker, while Saudi
A r a b i a a lone increased prices by $2/b t o complete the r e u n i f i c a t i o n .
(Fur the r s l i g h t adjustments to prices were made a t t h e D e c e m b e r OPEC
meeting.) It would thus appear t h a t Saudi Arabia had r idden the s t o r m
of the prev ious few years , and had once aga in a s s e r t e d i t s e l f a s t h e
l e a d e r of OPEC. That it had done this i n a s l acken ing market is of
s i g n i f i c a n c e - a p o i n t which we pursue f u r t h e r i n ( e ) below.
b
( d l How Good Was the R e u n i f i c a t i o n of P r i c e s ?
As we poin ted out i n Sec t ion I1 above, the price movements of 1979/80
had t h e e f f e c t of d rama t i ca l ly widening price d i f f e r e n t i a l s between
crudes of d i f f e r e n t q u a l i t y and f r m d i f f e r e n t c o u n t r i e s . The price
changes of 1981 need to be viewed i n a very d i f f e r e n t l i g h t - their
effect , wi thout except ion, be ing to b r i n g prices back t oge the r aga in .
I t is of i n t e r e s t to know how c l o s e l y this was achieved . As we
suggested earlier, t h e d i f f e r e n t i a l s of September 1978 had evolved over

33
two years of r e l a t i v e l y weak prices, and are t h e r e f o r e a good benchmark
a g a i n s t which to assess the price real ignment of 1981. (See also Annex
2.) Table 3 compares the d i f f e r e n t i a l s t r u c t u r e a t the end of 1981 wi th
tha t of 1978, on both a percentage and abso lu te b a s i s .
For most crudes, t h e percentage d i f f e r e n t i a l over Arabian L i g h t
a t t h e end of 1981 d i f f e r e d only margina l ly from that which had
p r e v a i l e d i n 1978. Hence one g e t s an impression of a remarkably c l o s e
r e t u r n to the d i f f e r e n t i a l s t r u c t u r e of 1978, fo l lowing the r e l a t i v e
chaos of 1979/80. This w a s brought about by what, on t h e s u r f a c e ,
appeared t o be a f a i r l y a r b i t r a r y al ignment w i t h i n OPEC, and a n
unplanned and uncoordinated series of price cuts o u t s i d e OPEC. Three
impor t an t q u a l i f i c a t i o n s must be made t o t h i s p i c t u r e , however. F i r s t
of a l l , as we noted earlier, a c o r r e c t d i f f e r e n t i a l is one wich makes
t h e buyer i n d i f f e r e n t between two crudes . It should t h e r e f o r e r e f l e c t
d i f f e r e n c e s i n t r a n s p o r t c o s t s , r e f i n i n g c o s t s , product prices, etc.,
and need not n e c e s s a r i l y be a set percentage of the crude pr ice , If a l l
c o s t s , product y i e l d s and prices remained cons t an t w h i l s t crude prices
rose, then the equi l ibr ium d i f f e r e n t i a l would remain c o n s t a n t i n
a b s o l u t e terms, and f a l l as a percentage of the crude price. An
assessment of t h e 1981 r e u n i f i c a t i o n based pu re ly on pe rcen tage
d i f f e r e n t i a l s may n o t t e l l t h e whole s t o r y , t h e r e f o r e .
Secondly, it is important to no te that, on a percentage b a s i s ,
wh i l e the d i f f e r e n c e s wi th the September 1978 p o s i t i o n s are small, t hey
are almost all i n t h e same d i r e c t i o n . There is a s l i g h t tendency to
undercut Arabian L i g h t which, g iven the previous r e luc t ance of m o s t
producers t o lower t h e i r prices, may appear r a t h e r s u r p r i s i n g . This i s ,
however, the p e r f e c t l y r a t i o n a l behaviour of any producer i n a s l a c k
market. The incen t ive is to price j u s t below the major producer and
t ake a l a r g e r s h a r e of the market. Tnis r e v e r s a l of p o l i c y by most
producers - which, as we s h a l l see, cont inued i n t o 1982 - sugges t s that
t h e earlier r e f u s a l to lower prices had l i t t l e to do with s h o r t run
p r o f i t maximization, and much m o r e to do with the pol i t ical d e s i r e t o
defend an independent marker price. Once the h ighe r marker had been
des t royed , most producers re turned to revenue maximizing behaviour i n
the s lackening market .

34
Table 3 : -Official. P r i c e Differentials aga ins t Saudi Arab ian Light 34 crude
DOLLARS
1 I I 1
I I I 30.9.781 31.12.81 I
I r a n Iraq Abu Dhabi Qatar Kuwait Gabon Libya Algeria Nigeria Shar j ah Dubai Venezuela Ecuador Indonesia
UK Norway USSR Mexico Oman Syria Egypt China Malaysia Brunei
+0.106 -0.124 +O .556 +O .296 -0.434
+O .974 +I .396 +1.416 +O. 586 -0.064 +O .836 -0 . 339 +O. 846
+l. 296 +I. 496 +O .456 +O. 396 +O. 356
+0.106 +O .496 +1 .596 +1 .446
0
-1.069
+0.20 -0.54 +1.50 +1 .30 -1 -70 0
j2.50 +3.00 M.52 +1 .56
+O .58 -1.40 + I .oo
-0.14
+2.50 +3.25 +1 .35 +I .oo +1 .06 -2.50
+o .90 +3.90 +2.10
0
30.1 1.82
-2.80 -0.54 +O .56 to. 30 -1.70 0
+1 .15 +1 .50 +1 .52 +0.59 -0.14 +O . 58 -2.10 +0.53
-0.50 +0.25 -1 .SO -1.50 +O .06 -4.00 -2.25 +O. 50 +3.30 +1.10
I PERCENTAGE
I 30.9.78
+O. 83 -0.98 +4.38 +2.33 -3.42
tl
0
+10.99 +11 .I5 +4.61 -0.50 +6.58 -2.67
+ 7 . m
+6 66
+10.20 +11 .78 +3.59 +3.12 +2.80 -8 41 +O. 83 +3.90
+12.56 + I 1.38 II
31 .12.81
+O .59 -1.59 +4.41 +3.82 -5.00
+7.35 +8.82 +1.53 +4.59 -0.41 + I .71 -4.12 +2.94
0
+7.35 +9.56 +3 97 +2.94 +3.12 -7.35 0
+2 . 65 +11.47
+6.18
I 30.11.82
-8.24 -1.59 +1 .65 +0.88 -5 . 00 +3.38 +4.41 +4*47 +1 .74 -0.41 +1 .71 -6.18 +1 .56
-1.47 +O. 74 -5.29 -4 -41 +O. 18
-1 1.76 -6.62 +1.47 +9.71 +3.24
0
I
35
Third ly , and perhaps most impor tan t ly , for t h e nex t year o r so t h e r e were a number of except ions to t h e gene ra l ly accurate r e t u r n t o
t h e 1978 d i f f e r e n t i a l s t r u c t u r e . Outside OPEC, Brunei, the UK and
Norway were e f f e c t i v e l y undercut t ing the OPEC marker and, more
s i g n i f i c a n t l y , there were a number of problems w i t h i n OPEC. Nigeria and
to some e x t e n t Indonesia , Algeria and Venezuela ended 1981 w i t h more
favourable d i f f e r e n t i a l s a g a i n s t Arabian Light than they had had i n
1978, and, as we s h a l l see below, these d i f f e r e n t i a l s w e r e t o cause
problems wi th in OPEC throughout 1982.
It is worth not ing , f i n a l l y , that the Arabian L i g h t spot price
f o r December 1981 was $34.26/b - only 26 c e n t s above t h e o f f i c i a l
marker price. 1981 t h u s ended w i t h spot and c o n t r a c t prices i n
remarkable harmony - with one or two important excep t ions .
( e l Leadership i n t h e Reun i f i ca t ion of 1981
The ques t ion arises, whether Arrow's c h a r a c t e r i z a t i o n of a market i n
d i sequ i l ib r ium, i n which a l l producers faced s lop ing demand curves and
hence were price-makers, he ld €or t h e o i l market i n t i m e s of excess
supply a s well as it appears to i n t i m e s of excess demand. 1981 can
perhaps be termed a 'h inge ' year between t h e t i g h t market of 1979/80
and t h e s l a c k market of 1982. It w a s a year of i n i t i a l l y marginal but
ever i nc reas ing excess supply. W e would sugges t t h a t a l though the re i s
evidence (as always i n d i sequ i l ib r ium cond i t ions 1 of Arrow-type
behaviour, the most s i g n i f i c a n t f e a t u r e of o i l developments i n 1981 i s
Saudi Arabia seeking s u c c e s s f u l l y to r e - e s t a b l i s h i t s e l f as the
l i n c h p i n of t h e world o i l market.
The Saudi t ac t ics w e r e c lear - to a l low buyers to l i f t as much
o i l as p o s s i b l e a t i t s low price i n o r d e r t o b r ing the whole of the
rest of t h e system to its l e v e l . It w a s , of course, a ided by t h e
g e n e r a l weakening of the market i n 1981 which meant tha t i t w a s seeking
to p u l l the system i n the same d i r e c t i o n as the market. Equally, t h e
Saudis w e r e no t d i c t a t e d to by the market . They maintained prices w e l l
above any compet i t ive l e v e l , whilst achiev ing a s t r e n g t h e n i n g of t h e i r
own p o s i t i o n i n the system. In this respect, the Saudi A r a b i a n p o l i c i e s
of 1981 f i t w e l l i n t o a pure 'dominant producer ' l e a d e r s h i p model. By
v i r t u e of its p o s i t i o n as the l a r g e s t s u p p l i e r , it w a s able t o en fo rce
its chosen price regime on the rest of the system. The f i n a l agreement

36
on t h e $34/b marker pr ice w a s something of d p o l i t i c a l compromise by
Saudi Arabia, its desire being as always to hold OPEC toge the r . It had,
however, made it clear from e a r l y 1981 that it would be happy t o see
t h e r e u n i f i c a t i o n a t $34/b and hence u l t ima te ly achieved its aim. It is
significant that it could do so when market cond i t ions supported its
policies, unl ike du r ing t h e previous t w o years when its attempts to
resist market p r e s s u r e s w e r e no t very s u c c e s s f u l .
The policies of Saudi Arabia were t h u s r e l a t i v e l y s t r a i g h t -
forward du r ing 1981. What, then, of the r o l e of t h e rest of the
producers i n t h a t yea r? !Ihe non-OPEC producers cont inued t o act i n a
revenue maximizing manner, given the p o l i c i e s of o t h e r agents. Having
followed the market to i t s peak i n November 1980, they sought to keep
prices h igh f o r the f i r s t q u a r t e r of 1981 and so enjoy the enhanced
revenue. When by t h e second quarter, the e f f e c t s of the Saudi p o l i c y
began to be f e l t on t h e i r ou tput l e v e l s , they q u i c k l y fol lowed the spot
price down to l e v e l s close t o Saudi Arabia's prices, and thus were able
t o main ta in t h e i r ou tpu t a t the expense of t h e rest of OPEC. The
non-OPEC producers w e r e thus dictated t o by Saudi Arabian product ion
p o l i c i e s and the s lackening market, and w e r e quick to respond.
The behaviour of t h e bulk of OPEC i s much more d i f f i c u l t t o
e x p l a i n . As we have seen , their a t t empt t o defend t h e i r h ighe r 'marker'
price cost them d e a r l y i n terms of l o s t ou tpu t and revenue, and y e t
t hey r e s i s t e d the p r e s s u r e s to c u t prices f o r f u l l y t e n months. This
c l e a r l y does not t ie i n with their 1979/80 policies except i n so f a r as
t hey wished t o see high prices. Nor, indeed - as w e examine i n Sec t ion
I V below - does it t i e i n with t h e i r behaviour i n 1982, when aga in they
appeared t o seek to maximize t h e i r s h o r t term revenue. One can only
conclude t h a t t h e i r motives were p o l i t i c a l . That they r e s i s t e d so
long, and a t such a h i g h c o s t , i n d i c a t e s t h e s t r e n g t h of these
non-economic f a c t o r s . That they u l t i m a t e l y had to concede
demonstrates the very s i g n i f i c a n t power of the dominant producers i n
t i m e s of marginal ly s l a c k markets.

37
I V
The S lack Market of 1982
(a) 1982 Output Cuts
The p r i c i n g a c t i v i t y of 1982 cannot be understood wi thout f i r s t recognis ing the very s u b s t a n t i a l excess supply which developed i n the
o i l market. The s i t u a t i o n of i n c r e a s i n g s lackness i n the market i n 1981
tu rned , i n 1982, to one of major g l u t - presen t ing producers wi th very
major problems which, i n IIEITIY ways, w e r e of a t o t a l l y d i f f e r e n t kind t o
those of the first h a l f of 1981. The change was not merely one of
degree .
A t i t s p e a k i n 1979, world oil product ion w a s ove r 65.7 mbd.
This f e l l to a l o w p o i n t of j u s t over 53 mbd i n A p r i l 1982 and l a t e s t
estimates, f o r October 1982, w e r e j u s t 56 mbd - f u l l y 15% lower than
t h e 1979 peak. OPEC product ion had f a l l e n by a much l a r g e r percentage - 39%, from 31.8 mbd i n Ju ly 1979 t o 19.3 mbd i n November 1982. Again, i t
hit a l o w p o i n t i n April 1982 of 16.7 mbd - j u s t 53% of OPEC' s
capac i ty .21 In r a t h e r stark c o n t r a s t , non-OPEC output i n October 1982
stood a t 38 mbd ( inc lud ing C e n t r a l l y Planned Economies 1, having grown
s t e a d i l y throughout the e igh teen months s i n c e mid-1 981. Whilst OPEX: w a s
ope ra t ing a t on ly ha l f capac i ty , non-OPEC producers w e r e a t record
l e v e l s of ou tpu t , d e s p i t e the very s u b s t a n t i a l downturn i n t o t a l world
demand.
(b ) 1982 Spo t Prices
This s l ackness w a s r e f l e c t e d i n the spot market, where prices showed a
f a i r l y cons i s t e n t downward t r end fo l lowing the modest recovery i n t h e
w i n t e r of 1981 /82 (see Figure 3 I . Low p o i n t s (of around $28/b f o r
Arabian L i g h t ) were ' reached i n Piarch and aga in i n November 1982. Indeed
spot crude prices remained markedly below o f f i c i a l c o n t r a c t prices
throughout t h e year . Spot prices of expensive products aga in matched
21 Petroleum I n t e l l i g e n c e Weekly, May 3rd, 1982, p.1 I , es t ima ted t o t a l OPEC c a p a c i t y a t 31,185 thousand b/d.

38
t h e s p o t crude p a t t e r n very c l o s e l y , w i t h low p o i n t s i n m r c h and
November. The main product , 3.5% S f u e l o i l , w a s r a t h e r more s t a b l e ,
f l u c t u a t i n g between $24/b and $25.5/b throughout the yea r , except f o r a
l o w p o i n t i n August of $23.3/b.
( c 1 O f f i c i a l Price Undercut t ing
Such a s i t u a t i o n of excess capac i ty and low spot prices places downward
p r e s s u r e on official prices which may man i fe s t i t s e l f i n two ways.
F i r s t l y , t h e r e is an i n c e n t i v e f o r a gene ra l , agreed, reduct ion i n a l l
official prices i n an attempt to s t i m u l a t e worldwide demand and allow a
r e t u r n nearer to capac i ty product ion for a l l producers ( t h e eff icacy
of such a policy c l e a r l y depends on t h e price e l a s t i c i t y of demand €or
o i l , t h e t i m e l ags involved, e tc ) . Secondly, t he re is i n c e n t i v e f o r a n
i n d i v i d u a l producer to attempt to undercut h i s compet i tors ' o f f i c i a l
prices, the reward be ing a l a r g e r sha re of the market and hence t h e
p o t e n t i a l f o r maintaining h i s product ion d e s p i t e t h e c o n t r a c t i o n of
worldwide product ion . He e f f e c t i v e l y can pass on the product ion cuts t o
h i s compet i tors .
F i r s t of a l l , it should be e s t a b l i s h e d t h a t the p r e s s u r e for a
g e n e r a l reduct ion i n a l l official prices was resisted throughout 1982,
and for t h i s a t t e n t i o n must aga in focus on Saudi Arabia. Having
succeeded, f i n a l l y , i n drawing down a l l of the rest of the wor ld ' s
p roducers to a $34 r e fe rence price by la te 1981, Saudi Arabia chose t o
defend t h e newly agreed marker price i n 1982 despite the s h a r p l y
c o n t r a c t i n g demand. Possible exp lana t ions of the Saudi a c t i o n are
many. F i r s t of a l l , it may be a simple consequence of its long-term
desire to smooth ou t f l u c t u a t i o n s , both upward and downward, i n the
price of oil. Saudi Arabia may have f e l t t h a t the long-term benef i t s ,
both economic and p o l i t i c a l , of such a p o l i c y outweigh the short- term
costs of a l o s s i n ou tpu t . Such an exp lana t ion would of course a l s o t i e
i n wi th the Saudi p r i c i n g behaviour of the preceding three y e a r s .
To quote D r Abdulhady Hassan Taher, Governor of Petromin and
Saudi Minis te r of State i n November 1982 : "Saudi Arabia remains
committed to i ts long-term goals of t r y i n g to maintain a reasonable
equ i l ib r ium i n t h e i n t e r n a t i o n a l o i l market for the mutual b e n e f i t of
both producers and consumers and f o r t h e common good of the world

39
economy as a whole. m22 Moreover, as D r Taher went on to argue, the
Saudis s a w t h e downturn i n Wes te rn economic a c t i v i t y as a s h o r t run
problem, recovery b r ing ing about a renewed t i g h t e n i n g of t h e market:
".... we be l i eve that t h e o i l market w i l l r e t u r n to a better ba lance i n
about s i x months from now (Nov 1982) ." Long-term s t a b i l i t y i n o i l
prices was c l e a r l y cons idered to be worth any c o s t i n t e r m s of l o s t
shor t - run revenue.
It is worth no t ing t h a t i t is u n l i k e l y t h a t Saudi Arabia's
attempts to hold prices h igh i n 1982 w i l l have won t h e m many f r i e n d s i n
t h e W e s t - indeed s t a t emen t s coming out of t h e USA i n t h e e a r l y months
of 1983 suggested tha t the West would have p re fe r r ed p r i c e s t o f a l l ,
a l b e i t i n a reasonably c o n t r o l l e d manner.
Some may e q u a l l y argue t h a t Saudi Arabia did not even view it
a s i n t h e i r short- term in t e re s t s t o l o w e r prices. There m s a r a t i o n a l
economic i n c e n t i v e t o lower prices only if Saudi Arabia f e l t t h a t i t
faced a p o s i t i v e marginal revenue over some f u t u r e per iod of t i m e .
Marginal revenue is given by:
where p is price, d is t h e coun t ry ' s market s h a r e , and z t h e e l a s t i c i t y
of world demand for oi l .
T w factors may sugges t t h a t Saudi Arabia f e l t i t s e l f t o be
f a c i n g a negat ive marginal revenue i n 1982. F i r s t l y , it holds a l a r g e
s h a r e of t h e market (40% of OPE€ and 20% of k e e World output i n
January 19821, i.e. i t s Id' i s l a rge . Secondly, Saudi Arabia may w e l l
have perceived t h a t it faced a very i n e l a s t i c demand curve ( i .e. a ve ry
low z ) , expec t ing any c u t i n i t s prices to be followed ve ry qu ick ly by
other producers , and so r e s u l t i n g in l i t t l e or no i n c r e a s e i n Saudi
sales. Chamberlin23 developed the notion of an o l i g o p o l i s t i c f i rm
22 D r . Abdulhady Ifassan Taher , The I n t e r n a t i o n a l O i l Market: Anarchy or
Order?, a paper to t h e Oxford Energy Pol icy C l u b , November 27, 1982.
23 E.H. Chamberlin, The Theory of Monopolis t ic Competit ion, ch . 3, Harvard Un ive r s i ty P r e s s , 1 93 3.

40
f a c i n g two demand curves - one assuming no r e a c t i o n by r i v a l s to a
price change ( " sub jec t ive" demand curve) and one assuming h i s r i v a l s do
react ( "ob jec t ive" demand c u r v e ) . Rapid r e a c t i o n to a Saudi price c u t
by o t h e r producers would imply t h a t Saudi Arabia would slide down the more i n e l a s t i c ' o b j e c t i v e ' demand curve and n o t a long i t s own
' s u b j e c t i v e ' curve.
If o t h e r producers set prices a l w a y s t o undercut s l i g h t l y t h e
Saudi marker, a s many d i d i n 1982, price c u t s by Saudi Arabia which are
fol lowed by everyone else may not have any impact on Saudi sales u n t i l
a l l o t h e r producers are producing to c a p a c i t y . The Saudi d e c i s i o n to
hold prices i n 1982 could then be related to a pe rcep t ion of nega t ive marginal revenue, as l i t t l e output growth would have been gained from a
price c u t . (If t h i s were true, it would suggest a revenue maximizing
behaviour by Saudi Arabia which w a s c l e a r l y absen t dur ing 1979/80.)
There would thus appear to be p o l i t i c a l , and s h o r t and long run
economic reasons why Saudi Arabia may have resisted the p r e s s u r e to c u t
i t s prices i n 1982.
By r e s i s t i n g t h e p re s su re to c u t its o f f i c i a l prices i n 1982,
Saudi Arabia e f f e c t i v e l y decided t h e l e v e l a t which the "p r i c ing game"
w a s to be played. As w e mentioned earlier, a s l a c k market i nvo lves
tempta t ions f o r i n d i v i d u a l producers t o undercut the formal price
s t ruc ture . 1982 d i d see s e v e r a l such moves. But compet i t ion took place
just below t h e $34 r e f e r e n c e l e v e l f i xed by Saudi Arabia. Competit ion
may have occurred i n t h e same way a t a lower price level had Saudi
A r a b i a u n i l a t e r a l l y cut the Marker price.
The price reduc t ions of 1982 w e r e very d i f f e r e n t i n n a t u r e to
those o f 1981, which w e r e aimed a t a r e u n i f i c a t i o n of c o n t r a c t prices,
achieved i n October of that yea r . I n 1982 t h e name of t h e game was
competi t ion, and one r e s u l t of u n i l a t e r a l price c u t s w a s t o d i s t u r b the
u n i f i e d d i f f e r e n t i a l price s t r u c t u r e .
F igure 6 graphs the chronology of the o f f i c i a l price
changes i n 1982. It is perhaps b e s t to cons ide r the a c t i o n s of OPEC and
non-OPEC producers s e p a r a t e l y .

29 ocr 1 Nov
Range 4 t . 3 +3%
-3% r
-3% 1 -196-
OPEC
U.K.. F l o n v a ~ k x i m
pun#, oman
I +4%
- +1 +5%
USSR Egypt
1 Dec
7 Dec OPEC
20 Dec Oman
14 Jan Syria
USA
I ran
7 F- 9 Fen U.K. Norway 19 Fe4 Ewdt i. 12. 21 Feb
China E w P i . USA U.K. USSR Mexim
M Mar OPEC
USA USSR
1 Aor
I J u n e
25 June
1 J u l y
1 *U9
1 sepr
1 ccl
I No“
Emador USSR
USSR Ecuador USA
Indonesia
-3%
-17% -12%r-;.-i
Figure 6
1982 OFFICIAL PRICE CHANGES
t3% -g-r +7 x
1 Oec
-3% _1

42
Non-OPEC producers followed t h e 1981 r e u n i f i c a i o n wi th a series
of r educ t ions i n o f f i c i a l prices i n the first q u a r t e r of 1982
which undercut OPEC o f f i c i a l prices, by s u b s t a n t i a l amounts i n many
cases. For example, t h e U K price-cut i n e a r l y March p u t its F o r t i e s
crude $3.5/b below comparable Niger ian Bonny; Mexico's pr ice-cu t i n
March p u t i ts Isthmus c rude $2.5/b below Arabian Light ; t h e S o v i e t
Union's huge 17% c u t i n e a r l y March pu t i ts Export Blend fully $5/b
below the Saudi Marker and successive cuts by Egypt pu t its Suez Blend
$3/b b e l o w by mid-March.
Non-OPEC price changes s i n c e the OPEC meet ing of l a te March
1982 have been r e l a t i v e l y f e w , wi th most c o u n t r i e s s t i c k i n g throughout
the y e a r to prices j u s t under the OPEC prices which they secured i n the
first t h r e e months. There have, indeed, been a number of non-OPEC price
i n c r e a s e s i n the l a s t three q u a r t e r s of 1982 - notably from the UK,
USSR, USA and JZgypt, a l l of whom have brought o f f i c i a l prices back up
towards those of OPEC. Such moves would sugges t that their earlier
unde rcu t t ing had been excess ive i n terms of t h a t requi red to main ta in
ou tpu t , and/or t h e i r earlier cu t s had been made i n a n t i c i p a t i o n of
l a r g e r c u t s from OPEC a t t h e i r March meeting than a c t u a l l y occurred.
Table 3 presen t s t h e o f f i c i a l price d i f f e r e n t i a l s of
non4PEC c rudes a g a i n s t Arabian L i g h t a t the end of November 1982 and
r e v e a l s a clear widening of d i f f e r e n t i a l s . Without except ion , non-OPEC
producers were p r i c i n g w e l l below what w a s requi red t o r e s t o r e the
d i f f e r e n t i a l s t r u c t u r e of 1978. I n o rde r to achieve the same percen tage
d i f f e r e n t i a l s as 1978, non-OPEC prices would have needed t o be
inc reased by, for example, $3.97 ( U K ) ; $3.75 (Norway); $3.02 (USSR);
$2.56 (Mexico); $2.53 (Egypt) ; $2.77 (Brune i ) . The e f f e c t of this
unde rcu t t ing by non4PEC members w a s t o allow them to maintain t h e i r
ou tpu t despite the fall i n worldwide demand i n 1982. Hence, w h i l s t OPEC
as a whole w a s ope ra t ing a t only 58% of its c a p a c i t y , non4PEC o u t p u t
had inc reased s t e a d i l y over the yea r , and by September had reached its

43
h i g h e s t e v e r t o t a l of over 2 0 m i l l i o n ba r re l s /day . This w a s 6% h ighe r
than September 1981; OPEC output for t h e same month w a s 1 1 % lower than
t h e previous yea r .
OPEC producers made r e l a t i v e l y fewer changes t o o f f i c i a l
pr ices in 1982, as Figure 6 shows. The full OPEC meeting i n
March r e s i s t e d p r e s s u r e t o c u t the Marker crude price (and hence a l l
O P E prices) and s e t t l e d i n s t e a d for some f u r t h e r re-adjustments of
d i f f e r e n t i a l s . mese, i n f a c t , had the e f f e c t of t ak ing the s t r u c t u r e
somewhat away from t h e 'correct ' 1978 s t r u c t u r e - with the sole
excep t ion of Nige r i a , whose $ l / b i n c r e a s e r e s t o r e d p a r t of the
d i f f e r e n t i a l with Arabian Light though s t i l l l eav ing d l a r g e problem.
I n t o t a l , four OPEC c o u n t r i e s c u t their prices a t the meeting (Abu
Dhabi, Qatar, Libya and Alger ia ) , and i n each case the e f f e c t was t o
undercut the Saudi marker r a t h e r more than had been the case a t the end
of 1981.
Y e t t h e p o l i c i e s of OPEC and non4PEC producers i n t h e s l a c k
market of 1982 caused problems and p laced s e r i o u s s t r a i n s on the
p r i c i n g system w i t h i n OPEC. The main problems w e r e :
1 . D i f f e r e n t i a l s between d i f f e r e n t u u a l i t v c rudes . This r e f e r s i n
p a r t i c u l a r t o t h e d i f f e r e n t i a l between Middle Eas te rn L i g h t crudes
( e s p e c i a l l y Arabian L i g h t ) and Afr ican Light crudes of h i g h e r
q u a l i t y . As we have seen, whilst a l l of the Afr ican producers were
p r i c i n g above Arabian Light, t h e i r percentage d i f f e r e n t i a l s were
s u b s t a n t i a l l y lower than they had been i n 1978 and indeed l a r g e
i n c r e a s e s i n Afr ican crudes would have been r equ i r ed t o r e s t o r e these
d i f f e r e n t i a l s : $7 .46 (Libya) ; $2.24 ( A l g e r i a ) and $2.27 (Nigeria 1 . Saudi Arabia i n p a r t i c u l a r demanded t h a t t hese d i f f e r e n t i a l s be
r e s t o r e d , to reduce the p res su re on Saudi sales. However, whilst the
o f f i c i a l $35.52 charged for Nigerian Bonny, f o r example, w a s $2.27/b
less than requi red t o r e s t o r e 1978 d i f f e r e n t i a l s , i t w a s s t i l l $2.02/b
more expensive than comparable UK F o r t i e s crude. With such compet i t ion
from non4PEC sources, t h e Afr ican OPEC members were u n l i k e l y t o agree
to any increase i n t h e i r prices.
44
Other c o u n t r i e s who reduced t h e i r d i f f e r e n t i a l s a g a i n s t lower
q u a l i t y Saudi Light were Venezuela and Indones ia - t h e l a t t e r ' s move
having come a t t h e end of November 1982. The ex ten t of the narrowing
was r a t h e r less than i n Niger ia and Algeria's cases.
2 . O f f i c i a l price d i f f e r e n c e s for s i m i l a r c rudes . In th ree s e p a r a t e
moves in February 1982, I r a n u n i l a t e r a l l y c u t a t o t a l of $4/b from the
o f f i c i a l price of its crudesl thus seve re ly unde rcu t t ing a l l of t h e
rest of OPEC. As Table 3 shows, I r a n i a n L igh t w a s some 8% cheaper a t
the end of 1982 than Arabian Light , despite a $l/b i n c r e a s e by I r a n i n
l a t e June, In February, the I r a n i a n cu t s d id n o t cause the uproar that
they might have done as I r a n i a n output w a s a mere 500,000 b/d. When
ou tpu t recovered t o 2.3 m i l l i o n b/d, the unde rcu t t ing of t h e OPEC price
s t r u c t u r e began to cause i n c r e a s i n g alarm. Its e f f e c t , as witnessed by
the r ap id rise i n I r a n i a n ou tpu t , like t h e squeezed d i f f e r e n t i a l s
d i scussed above, w a s t o place the major i ty of t h e burden of ad jus tment
t o the s l a c k market on those c o u n t r i e s who were holding t h e o f f i c i a l
O P E price l i n e .
3. U n o f f i c i a l discount ing. I n a d d i t i o n to the two forms of r educ t ions
i n o f f i c i a l prices desc r ibed above, 1982 a l s o s a w t h e emergence of
d i scoun t ing . Through a v a r i e t y of techniques - o f f e r s of "improved
terns" to e q u i t y ho lde r s , which spread t o non-equity buyers i n the form
of s t r a i g h t d i scoun t s , p rocess ing d e a l s e tc . - producers so ld c o n t r a c t
crude w e l l below o f f i c i a l prices. b b t s u r p r i s i n g l y , price d i scoun t ing
enabled some c o u n t r i e s to increase s u b s t a n t i a l l y the volume of t h e i r
sales.
(d) T h e o r e t i c a l C h a r a c t e r i z a t i o n s of the 1982 O i l Market
We s a w i n Sec t ion X I t h a t most of the wor ld ' s o i l producers , wi th the
except ion of Saudi Arabia, ac t ed as price makers i n the d i s e q u i l i b r i u m
market of 1979/80. In this, we argued, t hey conformed t o Arrow's
no t ion , t h a t i n d i s e q u i l i b r i u m a l l producers f a c e a sloping demand
curve. Tb h a t e x t e n t , then, d i d t h i s hold f o r the 1982 oil market - aga in i n d i sequ i l ib r ium, b u t this t i m e one of s u b s t a n t i a l excess
supply?

45
First of all, it is clear from the evidence above that the bulk
of the world's producers, OPEC and non-OPEC alike, did not act as a
passive price-taking fringe. They did not simply accept the price
determined by either OPEC or Saudi Arabia. Rather, they acted to
maximize their revenue by cutting prices individually in attempts to
capture a larger share of the declining market. To use Chamberlin's
terminology, they operated on their own downward sloping 'subjective'
demand curves, whose elasticities were sufficiently large to give, at
least in the short run, a perception of positive marginal revenues. In
this, they acted as rational "Arrowian" sellers in a disequilibrium
market, mirroring their behaviour in the tight market of 1979/80, but
this time operating on negatively sloping demand curves.
There is, however, a very important difference between the
experience in 1979/80 and that of 1982. As we have seen, in 1979/80 the
influence of Saudi Arabia, the dominant supplier, on the so called
'fringe' oil producers was rather weak. This was not mirrored in the
experience of 1982. The unilateral price setting of the 'fringe'
producers was a l l done within sight of the marker price. Saudi Arabia
effectively chose the level at which the pricing game was to be played,
and to that extent retained a form of price-leadership. It was clear
throughout the year that any movement down by the Saudis would be
followed very quickly by all other producers.
This If leadership" by Saudi Arabia was achieved at substantial
cost to itself in terms of lost output and hence revenue - costs which resulted from its unwillingness to prevent the competitive price
undercutting by the rest of the world's producers. Being the lowest
cost producer with the largest reserves gives Saudi Arabia the potential
ultimate sanction, of being able to drive out any producer which
undercuts its prices in a slack market. As we have seen, the nature
and meaning of leadership is entirely different in a tight market.

46
Conclusions
L e t us review b r i e f l y the main f e a t u r e s of t h e post-I978
h i s t o r y of o i l price movements which emerge from our s t u d y .
- September 1978 t o March 1979. The f i r s t price rises came i n the spot
markets i n t h e t h i r d quarter of 1978, a l l of which had shown
s u b s t a n t i a l i n c r e a s e s by t h e end of 1978. There is l i t t l e t o sugges t
t h a t t h e small i n c r e a s e s introduced by OPEC at their D e c e m b e r 1978
meeting were i n d i rec t response t o these spo t price movements. I n f a c t
t h e f i r s t c o u n t r i e s to respond t o spot price rises were non-OPEC
producers , beginning with t h e UK. They w e r e followed by some of
the smaller OPEC m e m b e r s i n February 1979. OPEC as a whole d id n o t
in t roduce comparably l a r g e inceases u n t i l t h e i r meeting i n March 1979.
- 1979/1980 w a s a confused pe r iod of pr ice- leapf rogging . Again, s p o t
prices w e r e the l ead ing edge, wi th a rnglge of c o n t r a c t price rises
fol lowing. Seve ra l of t h e smaller producers a t tempted to s t a y close t o
t h e spot price, whilst o t h e r , o f t e n larger producers lagged f u r t h e r
behind. Saudi Arabia kept its p r i c e s below a l l o t h e r s throughout t he
pe r iod - consequent ly price d i f f e r e n t i a l s a g a i n s t Arabian Light widened
enormously.
- 1981. In t h a t year prices - spot, OPM3 and non-OPEC , o f f i c i a l -
f i n a l l y tended to regroup around the re fe rence set by the Piarker
crude. This w a s brought about by a combination of two f a c t o r s : the
s l acken ing of w o r l d demand f o r OPEC o i l , and the s t r o n g export
advantage enjoyed by Saudi Arabia i n t h i s depressed market thanks t o
i t s low price p o l i c y . Non-OPEC producers ad jus t ed t o the s i t u a t i o n by
c u t t i n g t h e i r prices f a i r l y s w i f t l y ; b u t most OPEC m e m b e r s he ld o u t
through the f i r s t three quarters of 1981 a g a i n s t the Saudi attempts to
reun i fy the o i l price s t r u c t u r e . The i n e v i t a b l e r e s u l t w a s s u b s t a n t i a l
l o s s e s of sales which u l t i m a t e l y encouraged everybody to agree a price
real ignment around a new Marker price of $34/b a t t h e OPEC meeting of
October ? 981 .

47
- 1982. Demand cont inued t o d e c l i n e , b u t OPEC remained t h e o r e t i c a l l y
committed to t h e $34/b marker price despite d e c l i n i n g s p o t crude and
product prices. A l l major non-OPEC producers set c o n t r a c t prices b e l o w
the Marker, and consequent ly managed to produce a t near-capaci ty
throughout the yea r . I n mid-1982 s e v e r a l OPEC producers began to
undercut t h e Marker price - e i t h e r openly o r through a v a r i e t y of
d i sgu i sed means.
I n t i g h t markets Saudi Arabia w a s n o t ab le t o exercise
e f f e c t i v e l eade r sh ip : i t could n o t l ead o t h e r c o u n t r i e s a long t h e price
path of its choice . It had however some in f luence on behaviour,
p rovid ing an oppos i t e pole t o the spot market. The behaviour of
i n d i v i d u a l OPEC producers was shaped by t w o f a c t o r s - a n almost
i rresist ible l ead from a nervous market and a long-standing h a b i t of
c a r e f u l and r ig id price admin i s t r a t ion . Nobody - except Saudi Arabia - fol lowed the OPEC price-deterr@nation system; nobody - s a v e Ecuador - followed b l i n d l y t h e price movements of spot markets.
The s t o r y was not a s t o l d by t h e 'dominant producer/
compet i t ive f r i n g e ' models. A l a r g e producer set a pr ice but could n o t
i m p o s e it on its peers. Very small producers took the s p o t market
pr ice and gave up a l l pretence a t a d m i n i s t r a t i o n . A l l o t h e r s made
prices la Arrow. I n s h o r t , we observe t h a t producers have some
d i s c r e t i o n over the i r own prices when excess demand o b t a i n s , and this
d i s c r e t i o n can be exe rc i sed d e s p i t e the r e s t r a i n i n g a c t i o n s of t h e
dominant suppl ier . But the producers ' freedom i s not w i thou t bounds.
They c a n make t h e i r own prices w i t h i n a given range. As they move
towards the upper end of the range they become t a k e r s of the
competi t ive equ i l ib r ium price (as exempl i f ied by the spot market ) . And
those who remain c l o s e t o the dominant s u p p l i e r are indeed t a k e r s of an
adminis te red pr ice . The s t r o n g e r t h e in f luence of market forces, t h e
more r e s t r i c t e d is t h e price d i s c r e t i o n enjoyed by producers . Hence,
Mabro's view t h a t the sma l l OPEC m e m b e r s , in the t i g h t market
cond i t ions of 1979, w e r e ' apparent price makers'. "They appear as
price makers because they keep on posting h ighe r and h i g h e r prices (1
a m r e f e r r i n g , to g ive one example, to what w a s wi tnessed throughout
19791, but t h e i r pos t ings follow ( u s u a l l y with t i m e l a g s and a t a

48
d i s t a n c e ) , and never lead price de termina t ion on the market."24
thus possible to go one s tep beyond Arrow's c h a r a c t e r i z a t i o n , and
recognize t h a t i n this c o n t e x t price making is u l t i m a t e l y a success ion
of imperfec t responses to market s i g n a l s . I t is price taking of
s o r t s . When equi l ibr ium is reached small producers have no o t h e r
choice bu t t o take unambiguously the r u l i n g price.
I t i s
I n very s l a c k markets, the s m a l l producers of the 'compet i t ive/
p r i ce - t ak ing f r i n g e ' a l s o en joy d i s c r e t i o n . They are always tempted to
undercut t h e r e fe rence price set by the dominant s u p p l i e r i n o rde r to
maximize short- term revenues. Again, they are price makers of sorts,
and the Arrow c h a r a c t e r i z a t i o n becomes r e l e v a n t . But the in f luence of
the dominant producer is now very s t r o n g . The ' compet i t ive /pr ice-
c u t t i n g T 2 5 seller u s u a l l y quotes i ts own prices j u s t below the l e v e l
set by t h e l e a d e r . In this sense t h e small producer is a price t a k e r
of s o r t s , s i n c e the price he makes is c l o s e l y related to d given
ref e rence .
P r i c e l eade r sh ip o b t a i n s when the market i s a l i t t l e slack.
Saudi Arabia was able to e x e r c i z e price l e a d e r s h i p of a convent ional
type i n 1981 when producers just began to g a i n confidence i n a
turn-round i n market cond i t ions . They agreed t o price realignment
around the marker as they f i n a l l y perceived t h a t the market had ceased
t o be t i g h t . I n the very short per iod dur ing which the market i s j u s t
a l i t t l e s l a c k , no producer can b e n e f i t from r a i s i n g h i s price above
t h e l e v e l def ined by the market, and no producer feels a s t rong urge t o
24 Robert Mabro, i n M . W . Khouja (ed.) , The Chal lenge of Energy, Longman, 1981, p.40.
'The D i l e m m a between Shor t and Long-Term Oil P r i c e s ' ,
25 Note t h e t w o d i f f e r e n t meanings of the term ' compe t i t i ve ' . sense , compet i t ive r e f e r s to a market s t r u c t u r e i n which agents are too small o r t o o numerous t o be able to in f luence prices. Y e t i n common usage, compet i t ive r e f e r s to the aggress ive behaviour of those who seek t o s c o r e bet ter r e s u l t s than others. To compete i n a market may involve d i r e c t a c t i o n on prices, such as unde rcu t t ing , i n o rde r t o i n c r e a s e sales a t the expense of somebody else. I n some contexts , compet i t ion means t h a t economic agents are price t a k e r s , and i n o t h e r con tex t s it means j u s t t h e oppos i t e !
In one

49
undercut the r e fe rence p r i c e . An equ i l ib r ium of s o r t s is then
a t t a i n e d . lhis is n o t the convent iona l compet i t ive equ i l ib r ium s i n c e
t h e r e fe rence is determined by an a d m i n i s t r a t i v e d e c i s i o n and need n o t
relate to the r e l e v a n t c o s t concept. As i n t h e textbook m o d e l of the
o i l market, a dominant group of producers s e t s a p r i c e which the fringe
producers t ake . But t h e r e is a d i f f e r e n c e . The p r i c e set by the
dominant group may w e l l c l e a r the market from time to t ime; bu t it is
d o u b t f u l whether p r i c e s s e t i n t h i s way could ever clear markets i n
s u c c e s s i v e pe r iods Over the long run.

50

Annex 1
The d i scuss ion i n t h i s paper is based on o f f i c i a l price data
f o r the main world c rudes , drawn c h i e f l y from Petroleum I n t e l l i g e n c e
Weekly over t h e period s i n c e September 1978. For convenience,
a n a l y s i s of the behaviour of i n d i v i d u a l c o u n t r i e s is founded on the
movements i n t h e price of a 'key' crude f o r each count ry i .e. tha t
crude of which the count ry produces most. These are l is ted i n the
table below. W e have ensured t h a t a l l "premia" and "surcharges" which
are sometimes app l i ed to a coun t ry ' s price are included i n the
a n a l y s i s and indeed tha t they are inc luded i n the database. F i n a l l y ,
i n order to help i d e n t i f y any price-leadership, the data used in the
paper p resen t s a l l price changes on t h e date a t which the d e c i s i o n
w a s made and not n e c e s s a r i l y on the date at which the price change
became e f f e c t i v e . U s e of r e t ro -ac t ive price changes has been common,
p a r t i c u l a r l y within OPEC, and can g ive the impression that prices are
changed i n unison when i n f a c t s e v e r a l weeks may separate the
d e c i s i o n s of i n d i v i d u a l producers.
S p o t price data i s taken l a r g e l y from OPEC B u l l e t i n s and is
expressed i n t h e form of monthly averages throughout the paper u n l e s s
o therwise s t a t e d . As a l l spo t crude prices have moved toge ther it is
n o t unreasonable to talk in terms of "the" spot crude price. Spot
product price movements have been r a t h e r less uniform.
F i n a l l y , a l l data on c rude oil output used here is drawn f r o m
the r e g u l a r tables of World Oil Product ion in Petroleum Economist.
They are expressed i n barrels-per-day throughout .

52
'ReDresentat ive ' crudes chosen for each count rv
OPEC : Saudi Arabia
Iran
Iraq
Abu Dhabi
Qatar
Kuwait
Gabon
Libya
Algeria
Niger ia
Venezuela
Ecuador
Indonesia
Shar jah
Dubai
Non-OPEC : UK
Norway
USSR
USA
Mexico
Oman
Syria
EWPt
China
Malaysia
Brunei
Angola
Cameroon
Light 34
Ligh t 34
Basrah L igh t 35
Murban 3 9
Marine 36
Kuwait 31
Mandji 30
Es S i d e r 37
Saharan 44
Bonny 37
T i a Juana 31
Orien te 30
Sumatran Light 34
Mubarak 38
Fateh 32
F o r t i e s 36.5
Ekofisk Blend 44
Export Blend (Mediterranean 1 33
Louisiana Light Sweet 37.5
Isthmus 33
Oman 36
Suwaidiyah 24
Suez Blend 34
Daquing 33
Tapis Blend 43.5
S e r i a 36
Cabinda 31.7
Kole 33.5

Annex 2
September 1978 as t h e base d a t e
As noted i n S e c t i o n 11, w e have chosen September 1978 as the
base d a t e €or the a n a l y s i s of official crude o i l price movements. Ln
s o doing , we s e e k to i d e n t i f y a t i m e a t which w e can view the
s t r u c t u r e of p r i ce d i f f e r e n t i a l s as being broadly i n equi Librium.
This we d e f i n e as t h a t s t r u c t u r e of p r i c e s which more-or-less
r e f l e c t e d the buyers ’ v a l u a t i o n of the d i f f e r e n t q u a l i t y c rudes , so
a s t o make him i n d i f f e r e n t between any t w o . M e a ccep t , of cour se ,
t h a t i n the r e a l wor ld w e are un l ike ly to f i n d the oil market i n
perfect equi l ibr ium i n t h i s s ense ; w e m u s t seek r a t h e r to f i n d a time
a t which the price s t r u c t u r e appears to be “less imperfect“ than a t
others .
The choice of d a t e w a s in f luenced by t w o f a c t o r s :
1 . P r i c e S t a b i l i t y .
September 1978 marked t h e end of a prolonged per iod of r e l a t i v e
s t a b i l i t y i n c o n t r a c t p r i c e s . Table A, below, shows the last date
prior t o September 1978 a t which OPEC members changed their o f f i c i a l
prices.

54
T a b l e A
OPEC M e m b e r
Iraq I r a n Qatar Ve n e z ue 1 a Indonesia Gabon
Saudi Arabia Abu Dhabi
D a t e of L a s t P r i c e Change
before Sevtember 1978
December 1976
J u l y 1977
Kuwait January 1978
Alger ia Libya Niger ia
A p r i l 1978
Only Kuwait and t h e t h r e e Afr ican producers a l t e r e d t h e i r
prices i n the f i f t e e n months p r i o r t o September 1978 - and then by
o n l y very s m a l l amounts, as they sought to adjust t h e i r d i f f e r e n t i a l s
w i th the res t of OPEC.
Tables B and C compare the pe r iod from January 1977 t o
September 1978 w i t h p r i o r and subsequent pe r iods of similar l eng th .
Together they show c l e a r l y both t h e r e l a t i v e infrequency and s m a l l
s i z e of price changes i n t h e months approaching September 1978. Both
tables p r e s e n t a p i c t u r e of s u b s t a n t i a l d i sequ i l ib r ium i n the 1973-74
oil market, followed by four years of i n c r e a s i n g s t a b i l i t y , ending i n
l a te 1978 with t h e s t a r t of t h e 1979/80 price explos ion .
Outside OPEC, official price changes were r a t h e r more
f r e q u e n t , bu t aga in w e r e no t of any s i g n i f i c a n t s i z e over t h e two
y e a r s from the end of 1976. North Sea prices, f o r example, d r i f t e d
down by around 40 c e n t s (2.8%) from January 1977 to A p r i l 1978, and
then recovered around half of this f a l l over the next two quarters.
Such movements w e r e f a i r l y t y p i c a l of non-OPM: prices over t h e pe r iod
- g r e a t e r frequency of change t h a n o f f i c i a l OPEC prices, b u t still a
pe r iod of relative s t a b i l i t y .

55
ISaudi Arabia ' Iran
Table B: N u m b e r of O f f i c i a l Price Changes in key crude of main OPE€ producers
7/73-3/75 4/75-12/76 1 /77-9/78 1 O/78-6/8O
8 2 1 7 11 8 2 0 I 1 \
2 2 3
8 ! A h Dhabi \ 'Qatar 8 Libya 7 Algeria 7 6 Nigeria 8 4 Venezuela 7 4 Indonesia 5 2
Mean 7.45 2.91
Table C: Percentage Changes i n O f f i c i a l Prices of key crude of main OPEC producers
8 8
11 9
1 0 3 3 3 9 0 8 0 10
1.09 9.36
Saudi Arabia Iran Iraq Kuwait Abu Dhabi Qatar Libya Algeria Nigeria Venezuela Indonesia
7/73-3/75 4/75-12/76 6/77-9/78 I 0/78-6/ao
288 16 5 120 298 20 0 176 293 20 0 130 30 1 19 -1 1 4 0 31 2 1 0 6 138 297 20 0 140 243 25 -0.5 167 22 6 19 -1 171 f 91 32 -1 160 254 1 20 0 139 238 8 0 132

56
2. S t a b l e Outwut Shares
Arabia
Stable price d i f f e r e n t i a l s would n o t i n themselves sugges t
equi l ibr ium i n the o i l market, i f a t t h e same t i m e t he re w e r e wide
f l u c t u a t i o n s i n t h e s h a r e s of the t o t a l market going t o each
producer . Table D shows t h e sha res of e i g h t major OPEC producers i n
t o t a l O P E product ion over the year t o September 1978.
Dhabi -uela
Table D:
Sep O c t Nov D e c Jan
Shares i n t o t a l OPEC output, Sep.1977 t o Sep.1978
1 I I I 1 1 I 1 1 1 I
19.2 18.2 19.4 19.6 19.3
1977 7.3 5.2 6.5 6.5 7.6 6.1 5.5 6.9 6.4 7.6 7.4 5.0 6.6 6.1 6.6 8.2 5.0 6.0 5*7 6.1
I 6.2 5.0 1 6.5 \ 5.9 6.5
, 7.3 5.0 6.5 5.2 7.2 I 6.7 4.6 6.4 5.7 7.5 ! 6-3 5.2 6.7 6.0 7.8 ! 6.6 4.9 6.8 6.4 8.0
! 6.0 5.2 6.3 5.4 5.5
I 6.6 4.9 6.8 6.5 7.8 ~ 7.9 4.9 6.9 6.9 7.3
8.1 4.5 6.6 6.6 7.1 I
1978
Mar A p r May Jun J u 1 Aug Sep
1 I r an1 I r aq1 Saudi1 Kuwait! Abu 1 Libya1 N i g e r i a ( Venezl
19.4 19-1 19.9 19.7 19.9 19.5 19.0
7.9 8.1 7.9 7,6 7.6 8.7 8.6 8-5 8.4 8.2 8.2 8.8 9.0
27.7 28.2 28.3 29.4 28.1 29.0 26.5 27.1 25.3 25.5 25.2 23.9 26.2
Var ia t ions i n a coun t ry ' s ou tpu t may be caused by a number of
f a c t o r s o t h e r t han price d i f f e r e n t i a l s with competing producers ( f o r
example, phys i ca l p roduct ion problems, s easona l f a c t o r s , changes i n
demand p a t t e r n s f o r d i f f e r e n t c rudes , e t c . 1. With t h i s impor tan t
cavea t , t h e evidence from Table D does suqges t a high degree of
s t a b i l i t y i n ou tpu t s h a r e s among OPEC producers over t h e pe r iod .
It i s aga in u s e f u l t o compare t h i s s t a b i l i t y with o t h e r
p e r i o d s . Table E shows Standard Devia t ions of sha res i n total OPEC
product ion - a s a measure of t h e i r v a r i a b i l i t y - € o r OPEC producers
over t h r e e sub-periods from 1975 t o 1980. It does not confirm very
c l e a r l y t h e no t ion of i nc reas ing ly s table shares up t o September
1978; but i t does c e r t a i n l y r evea l the d i sequ i l ib r ium i n the
post-September 1978 market, h igh l igh ted by t h e very s u b s t a n t i a l
i n c r e a s e i n the S .D.s of t h e major OPEC c o u n t r i e s .

57
Comparing 1975-76 wi th 1977-Sep.1978, he f i n d t h a t t h e S . D . s
tend to be lower i n our r e f e r e n c e per iod for most c o u n t r i e s except
Saudi a r a b i a . I n o t h e r cases where t h e S . D . s appear t o bs higher i n
the second per iod , the d i f f e r e n c e s a r e not very s i g n i f i c a n t .
Table E:
Standard Devia t ions of Country Shares i n T o t a l OPEC Output
I 1974-75 1975-76 1977-Sep.78 Oct.78-1980
Saudi Arabia I r a n Iraq Kuwait Abu Dhabi Qatar Libya Alger ia Niger ia Ve nezue 1 a Indonesia
1.67 1.05 1 . 2 6 0.89 0.94 0.32 1.36 0.27 0.63 0.90 0.31
1.74 1.07 1.07 1.06 0.84 0.30 1.15 0.27 0.50 1.02 0.29
2.09 1 .14 0.59 0.88 0.30 0.19 0.28 0.36 0.60 0.66 0.27
4.08 4.04 3.00 1 .23 0.28 0.18 0.33 0.35 0.60 0.61 0.53
Our a n a l y s i s i s t h a t most producers enjoyed much g r e a t e r
s t a b i l i t y i n t h e i r monthly ou tpu t sha res i n 1977-78 than i n the
preceding and subsequent p e r i o d s , p a r t l y because t h e price s t r u c t u r e
was c l o s e r to equi l ibr ium and p a r t l y because Saudi Arabia absorbed
more r e a d i l y OPEC random output f l u c t u a t i o n . September 1978 would appear to sepa ra t e a f a i r l y prolonged
pe r iod of s t a b l e p r i c e s and ou tpu t s h a r e s from one of marked
d i s e q u i l i b r i u m i n both . As such it provides us wi th an appropr i a t e
s t a r t i n g p i n t and base da te for our a n a l y s i s .

OXFORD INSTITUTE FOR ENERGY STUDIES 57 WOODSTOCK ROAD, OXFORD OX2 6FA ENGLAND
TELEPHONE (01865) 311377 FAX (01865) 310527
E-mail: [email protected] http: Ilwww. oxfo rde ne rg y. o rg