Embed Size (px)
Citation preview

1
Oil Shock Vulnerabilities & Impacts:
South Africa Case Study
Prepared for
United Kingdom Department for International Development
by
Dr Jeremy Wakeford
School of Public Leadership, Stellenbosch University
30 June 2013
2
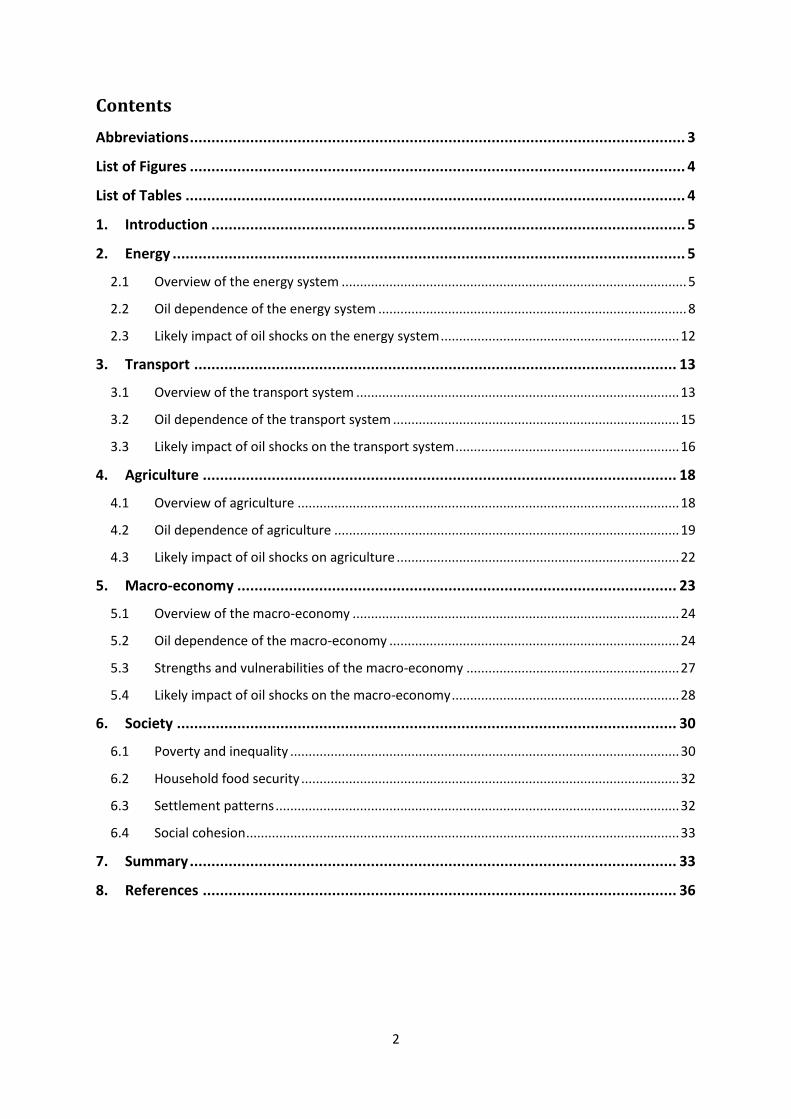
Contents
Abbreviations ................................................................................................................... 3
List of Figures ................................................................................................................... 4
List of Tables .................................................................................................................... 4
1. Introduction .............................................................................................................. 5
2. Energy ....................................................................................................................... 5
2.1 Overview of the energy system .............................................................................................. 5
2.2 Oil dependence of the energy system .................................................................................... 8
2.3 Likely impact of oil shocks on the energy system ................................................................. 12
3. Transport ................................................................................................................ 13
3.1 Overview of the transport system ........................................................................................ 13
3.2 Oil dependence of the transport system .............................................................................. 15
3.3 Likely impact of oil shocks on the transport system ............................................................. 16
4. Agriculture .............................................................................................................. 18
4.1 Overview of agriculture ........................................................................................................ 18
4.2 Oil dependence of agriculture .............................................................................................. 19
4.3 Likely impact of oil shocks on agriculture ............................................................................. 22
5. Macro-economy ...................................................................................................... 23
5.1 Overview of the macro-economy ......................................................................................... 24
5.2 Oil dependence of the macro-economy ............................................................................... 24
5.3 Strengths and vulnerabilities of the macro-economy .......................................................... 27
5.4 Likely impact of oil shocks on the macro-economy .............................................................. 28
6. Society .................................................................................................................... 30
6.1 Poverty and inequality .......................................................................................................... 30
6.2 Household food security ....................................................................................................... 32
6.3 Settlement patterns .............................................................................................................. 32
6.4 Social cohesion ...................................................................................................................... 33
7. Summary ................................................................................................................. 33
8. References .............................................................................................................. 36

3
Abbreviations
ASPO-SA Association for the Study of Peak Oil South Africa CTL Coal-to-liquids DAFF Department of Agriculture, Forestry and Fishing DME Department of Minerals and Energy DoT Department of Transport EIA Energy Information Administration FAO Food and Agriculture Organisation GDP Gross domestic product GTL Gas-to-liquids GVA Gross value added IEA International Energy Agency IMF International Monetary Fund LPG Liquefied petroleum gas NDA National Department of Agriculture OCGT Open cycle gas turbine ORTIA O.R. Tambo International Airport RE Renewable energy SAPIA South African Petroleum Industry Association SARCC South African Rail Commuter Corporation SARB South African Reserve Bank StatsSA Statistics South Africa
4
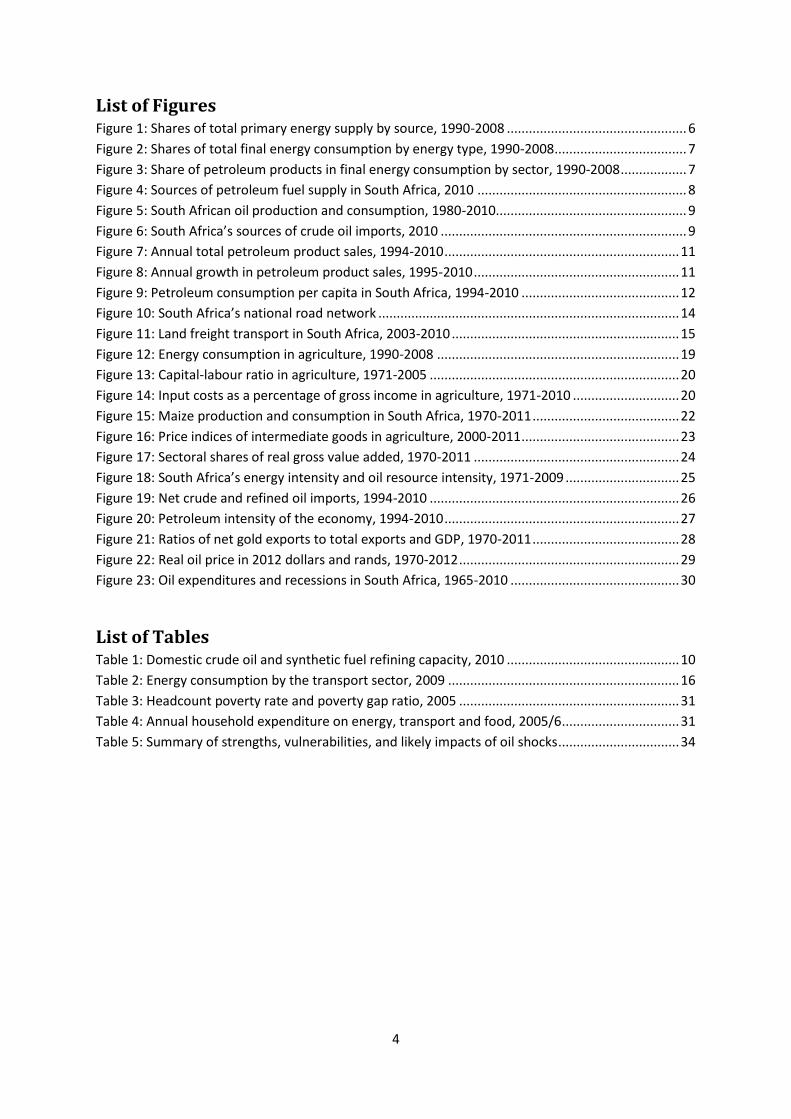
List of Figures Figure 1: Shares of total primary energy supply by source, 1990-2008 ................................................. 6
Figure 2: Shares of total final energy consumption by energy type, 1990-2008 .................................... 7
Figure 3: Share of petroleum products in final energy consumption by sector, 1990-2008 .................. 7
Figure 4: Sources of petroleum fuel supply in South Africa, 2010 ......................................................... 8
Figure 5: South African oil production and consumption, 1980-2010.................................................... 9
Figure 6: South Africa’s sources of crude oil imports, 2010 ................................................................... 9
Figure 7: Annual total petroleum product sales, 1994-2010 ................................................................ 11
Figure 8: Annual growth in petroleum product sales, 1995-2010 ........................................................ 11
Figure 9: Petroleum consumption per capita in South Africa, 1994-2010 ........................................... 12
Figure 10: South Africa’s national road network .................................................................................. 14
Figure 11: Land freight transport in South Africa, 2003-2010 .............................................................. 15
Figure 12: Energy consumption in agriculture, 1990-2008 .................................................................. 19
Figure 13: Capital-labour ratio in agriculture, 1971-2005 .................................................................... 20
Figure 14: Input costs as a percentage of gross income in agriculture, 1971-2010 ............................. 20
Figure 15: Maize production and consumption in South Africa, 1970-2011 ........................................ 22
Figure 16: Price indices of intermediate goods in agriculture, 2000-2011 ........................................... 23
Figure 17: Sectoral shares of real gross value added, 1970-2011 ........................................................ 24
Figure 18: South Africa’s energy intensity and oil resource intensity, 1971-2009 ............................... 25
Figure 19: Net crude and refined oil imports, 1994-2010 .................................................................... 26
Figure 20: Petroleum intensity of the economy, 1994-2010 ................................................................ 27
Figure 21: Ratios of net gold exports to total exports and GDP, 1970-2011 ........................................ 28
Figure 22: Real oil price in 2012 dollars and rands, 1970-2012 ............................................................ 29
Figure 23: Oil expenditures and recessions in South Africa, 1965-2010 .............................................. 30
List of Tables Table 1: Domestic crude oil and synthetic fuel refining capacity, 2010 ............................................... 10
Table 2: Energy consumption by the transport sector, 2009 ............................................................... 16
Table 3: Headcount poverty rate and poverty gap ratio, 2005 ............................................................ 31
Table 4: Annual household expenditure on energy, transport and food, 2005/6 ................................ 31
Table 5: Summary of strengths, vulnerabilities, and likely impacts of oil shocks ................................. 34
5
1. Introduction
This report presents a South African country case study of oil dependencies and vulnerabilities to oil
price and supply shocks, and forms part of a broader study commissioned by the United Kingdom
Department for International Development titled “Oil Shock Mitigation Strategies for Developing
Countries”.1 South Africa had a Gross Domestic Product (GDP) per capita of $10 983 in 2011 (IMF,
2012), which places it in the upper-middle income country category of the World Bank. The total
population was estimated at 50.6 million in mid-2011 (StatsSA, 2012). South Africa has the largest
and most developed economy in sub-Saharan Africa, and yet nearly half of the population is
classified as poor. The country relies on imports for approximately two-thirds of its petroleum fuel
supply.
The case study is organised according to five subsystems of the socio-economic system, namely:
energy; transport; agriculture; macro-economy; and society. Sections 2 to 5 each include a brief
overview of the subsystem, an analysis of its oil dependency, and a discussion of the likely impacts of
oil shocks under business-as-usual policy environments. Section 6 analyses important characteristics
of contemporary South African society that increase its social vulnerabilities to oil shocks. The
concluding section provides a summary of key strengths, vulnerabilities and likely impacts of oil
shocks in each of the five subsystems.
2. Energy
This section presents an overview of the energy system and the role of oil products in South Africa. It
begins with a summary of primary sources of energy supply, energy carriers and final consumption
(demand) by major sectors, i.e. the national energy balance. The focus is then narrowed to the
supply and demand for oil and petroleum products. Oil supply is discussed in terms of sources
(imports and domestic production), refining and stockpiles. Demand for petroleum products is
analysed according to product type, geographical region and economic sector. The final subsection
briefly considers the likely impacts of oil shocks on the energy system.
2.1 Overview of the energy system
The role of oil in South Africa’s energy system needs to be placed in the context of overall energy
supply and demand balances, i.e. alongside other sources of primary energy and within the final
energy consumption mix.
Primary energy supply
Figure 1 displays the evolution of South Africa’s primary energy supply mix between 1990 and 2008.
None of the relative shares has changed appreciably. Throughout the period, coal has dominated
with between 72% and 77% of primary energy. Oil’s share rose marginally to 13% in 2007 and 2008
from a low of 8% in 1993 and 1998. The shares of gas, nuclear, hydro and renewables (solar, wind,
1 This case study material draws heavily from Wakeford (2012).

6
etc.) have never exceeded 3%, while combustible renewables and waste have provided between
10% and 12% of primary energy.
Figure 1: Shares of total primary energy supply by source, 1990-2008
Source: IEA (2012)
Final energy consumption
Primary energy sources (e.g. oil) are converted into energy carriers (e.g. petroleum fuels), which are
then consumed by end users. Coal, petroleum products, combustible materials and electricity have
all contributed significant shares of final energy, while use of gas has grown somewhat but remains
relatively small (see Figure 2 below). Over the period, the direct use of coal has shrunk from over
30% to 21%, having made way for more efficient energy carriers such as electricity, petroleum and
gas. By 2008, petroleum accounted for over 30% of final energy consumption.
0%
10%
20%
30%
40%
50%
60%
70%
80%
90%
100%
1990 1992 1994 1996 1998 2000 2002 2004 2006 2008
Total Primary Energy Supply
Combustibles &waste
Solar, wind, etc.
Hydro
Nuclear
Gas
Oil
Coal
7
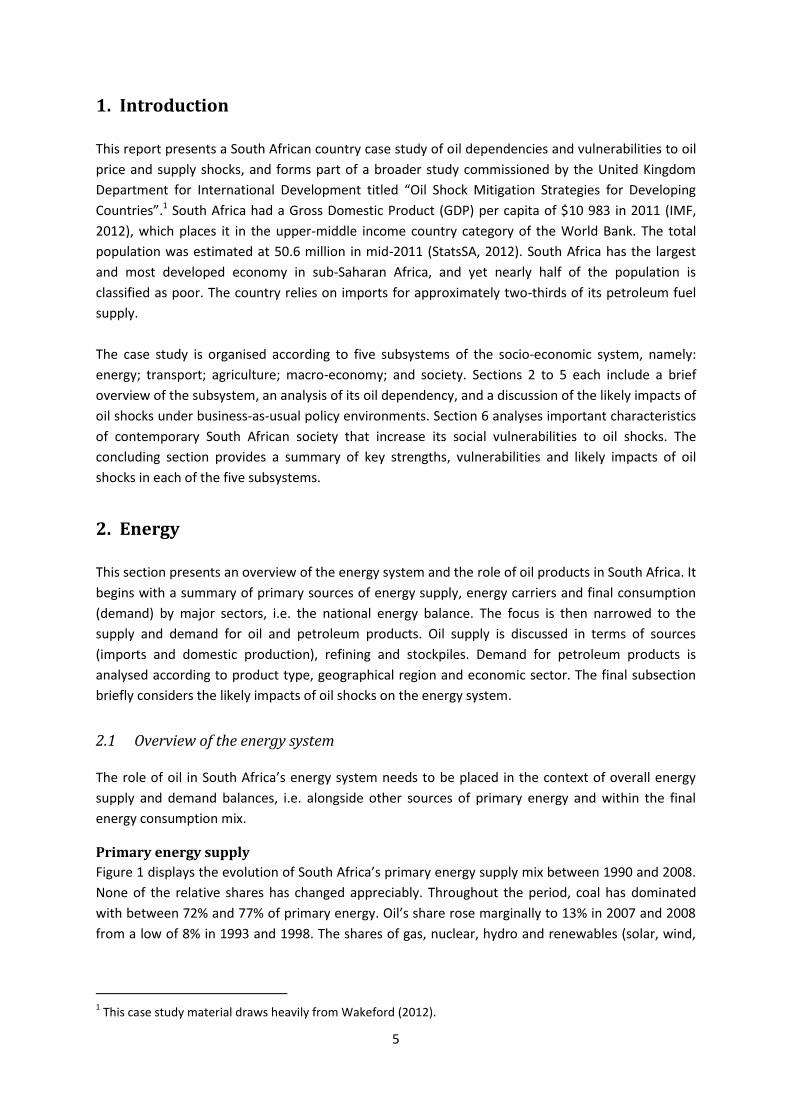
Figure 2: Shares of total final energy consumption by energy type, 1990-2008
Source: IEA (2012)
The shares of petroleum products in final energy consumption by sector and for the economy as a
whole between 1990 and 2008 are displayed in Figure 3. In almost all sectors, the share of total final
energy consumption accounted for by petroleum products has been fairly stable, and for the country
as a whole has ranged between 29% and 32%. The underlying data for the services sector are clearly
anomalous.
Figure 3: Share of petroleum products in final energy consumption by sector, 1990-2008
Source: Author’s calculations based on IEA (2012)
0%
10%
20%
30%
40%
50%
60%
70%
80%
90%
100%
19
90
19
91
19
92
19
93
19
94
19
95
19
96
19
97
19
98
19
99
20
00
20
01
20
02
20
03
20
04
20
05
20
06
20
07
20
08
Final Energy Consumption by Energy Type
Electricity
Combustibles & waste
Solar, tide, wind, etc.
Gas
Petroleum
Coal
0%
10%
20%
30%
40%
50%
60%
70%
80%
90%
100%
Sectoral Petroleum Dependency
Industry
Transport
Residential
Services
Agriculture
Total
8
2.2 Oil dependence of the energy system
Supply of oil
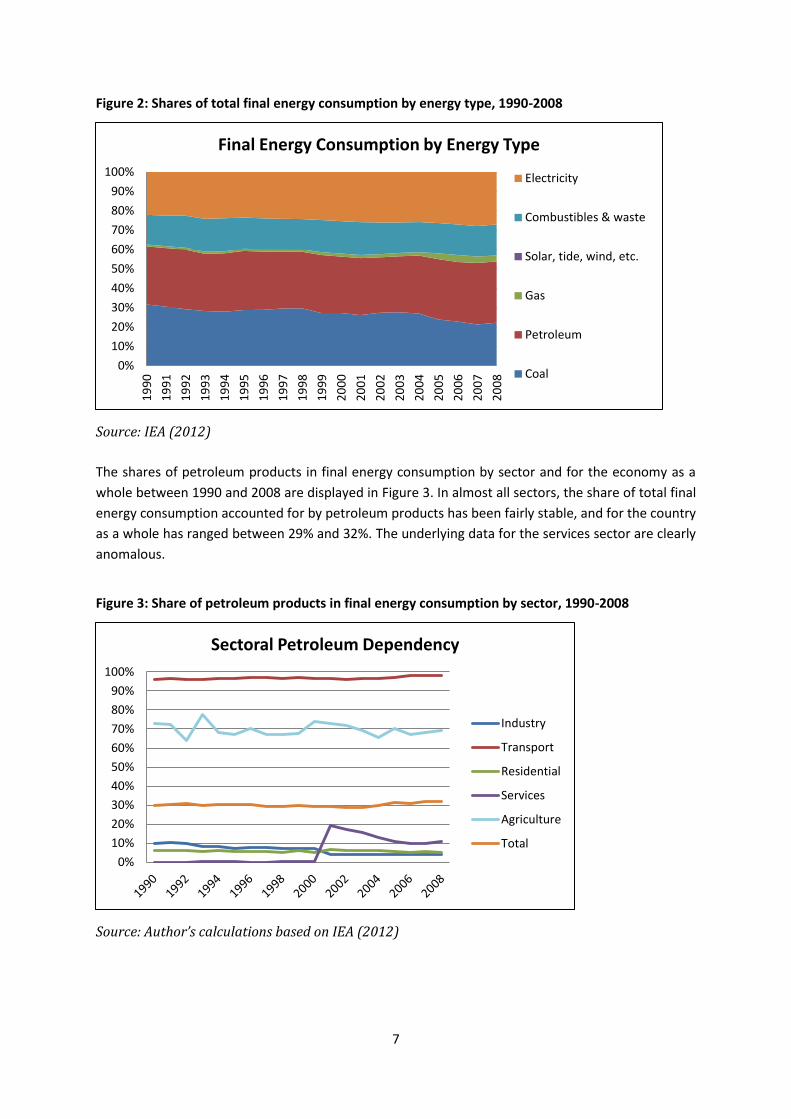
The sources of petroleum fuels are shown in Figure 4 below. Imported crude oil and refined products
contributed approximately 66% or approximately 370 000 barrels per day (bpd) of South Africa’s
annual consumption of petroleum products in 2010 (EIA, 2011). The remaining 180 000 bdp was
derived from Sasol’s coal-to-liquids (CTL) synthetic fuels (30%) and state oil company PetroSA’s
production of gas-to-liquid (GTL) synthetic fuels plus a very small amount of domestic crude oil (4%).
South Africa’s crude oil reserves stood at a meagre 15 million barrels as of January 2011 (EIA, 2011),
and were likely to be depleted within a few years in the absence of significant new oil field
discoveries.
Figure 4: Sources of petroleum fuel supply in South Africa, 2010
Source: Author’s calculations based on Sasol (2010), PetroSA (2010) and BP (2011)
Figure 5 displays South Africa’s total annual production, consumption and imports of oil (crude oil
plus refined petroleum products). Domestic production has remained relatively constant at around
200,000 barrels per day (bpd) since 1993, while consumption has followed a rising trend albeit with
some cyclical downturns. Oil imports have been on a gradually rising trend since 1993.
PetroSA 4%
Sasol 30%
Imports 66%

9
Figure 5: South African oil production and consumption, 1980-2010
Source: EIA (2012)
In 2010, South Africa relied on mostly OPEC nations for its oil imports, notably Iran (29%), Saudi
Arabia (23%), Nigeria (19%) and Angola (18%) (see Figure 6) (EIA, 2011). Reliance on Iranian crude oil
imports was curtailed to an extent in 2012 under pressure from the sanctions placed on the Iranian
oil industry by the United States and the European Union.
Figure 6: South Africa’s sources of crude oil imports, 2010
Source: EIA (2011)
South Africa has the second largest oil refining capacity in Africa, after Egypt. Refineries are owned
and operated by several large international oil companies (BP, Shell, Chevron and Engen) as well as
-400
-300
-200
-100
0
100
200
300
400
500
600
Tho
usa
nd
bb
l/d
ay
Production Consumption Imports
Saudi Arabia 24%
Iran 29%
Nigeria 19%
Angola 18%
Other 10%
Sources of SA's Crude Oil Imports 2010

10
by local firms Sasol and PetroSA. Total refining capacity in 2010 amounted to 703,000 barrels per
day, of which 72% was comprised of crude oil refining with the balance of 28% being synthetic fuel
refining capacity (see Table 1). For many years South Africa has exported refined petroleum products
to other countries in Southern Africa. From 2006 demand for refined fuels in the region (including
South Africa) outstripped domestic refining capacity so that increasing amounts of refined fuels had
to be imported. Petroleum fuels are distributed from the refineries to approximately 200 depots,
4 600 retail service stations and directly to about 100 000 consumers, most of whom are farmers
(SAPIA, 2011).
Table 1: Domestic crude oil and synthetic fuel refining capacity, 2010
Refinery Barrels/day Location Company
Natref 108,000 Sasolburg Sasol/Total
Sapref 180,000 Durban BP/Shell
Enref 120,000 Durban Engen
Chevref 100,000 Cape Town Chevron
Total crude oil refining 508,000
Secunda 150,000 Secunda Sasol
Mossgas 45,000 Mossel Bay PetroSA
Total synthetic fuel refining 195,000
TOTAL 703,000
Source: SAPIA (2011)
South Africa maintains a strategic petroleum reserve at Saldanha Bay in the Western Cape. The
facility has a maximum capacity of 45 million barrels, which translates into about 140 days’ worth of
crude oil imports (DME, 2007). Information on the actual volume of oil in storage is not publicly
available. In December 2005 South African oil refineries underwent modifications in order to comply
with cleaner fuel regulations, and shortages of refined product developed in certain areas, which
brought about economic losses and inconveniences. In view of this, the DME (2007) recommended
that the oil industry be required to maintain 28 days’ worth of commercial petroleum product
stocks.
Demand for oil
This subsection presents historical data describing the consumption of petroleum products in total,
disaggregated by product type and sector, and on a per capita basis. Total annual sales of petroleum
products grew largely in line with the economy (real GDP) in the period 1994 to 2010 (see Figure 7).
Petrol and diesel together make up more than 80% of petroleum product sales. Liquefied petroleum
gas (LPG) sales in the figures below relate mainly to household use for cooking and heating. The
relative shares partly reflect demand and partly the proportions of a barrel of oil that can be refined
into the various petroleum products.
11
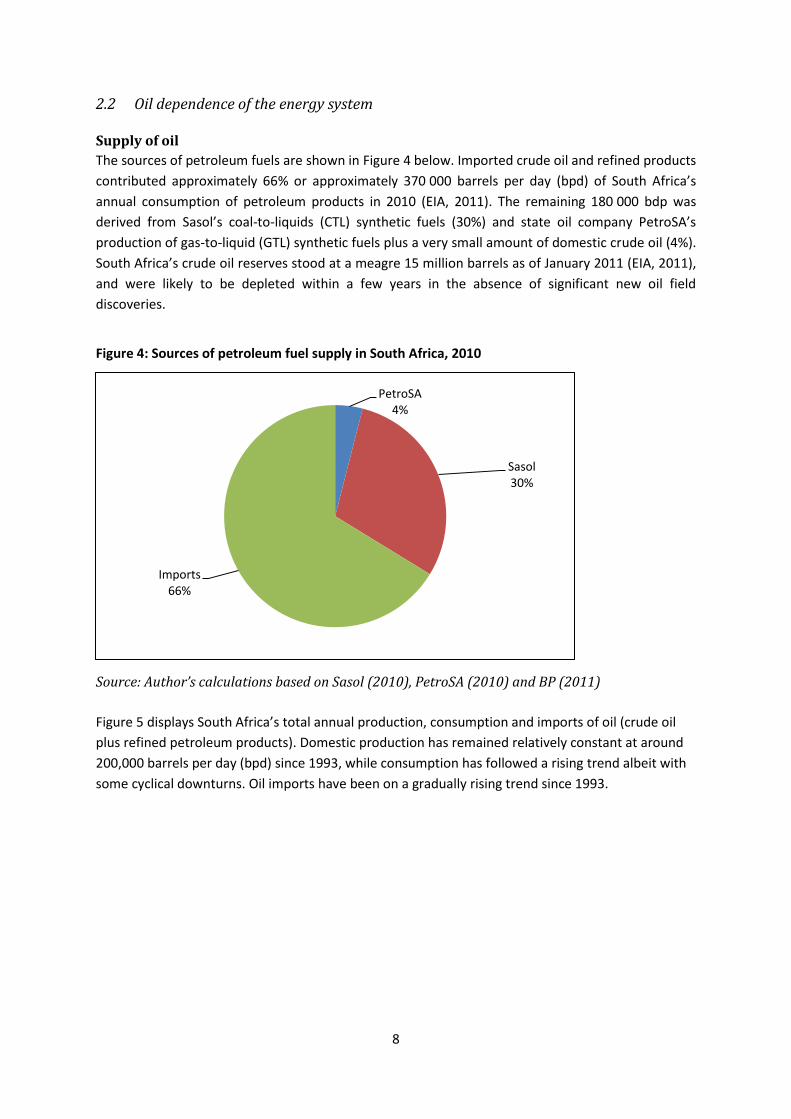
Figure 7: Annual total petroleum product sales, 1994-2010
Source: SAPIA (2011) and SARB (2012)
The average growth rate for sales of all liquid petroleum fuels was 2.8% for the period 1995 to 2007
(see Figure 8). In that period the average annual growth rate for diesel was 5.1%, and for petrol,
1.4%. However, these growth rates fell steeply during 2008 as a result of sharply rising fuel prices
(crude oil traded at $100 per barrel on average for the year) as well as tighter economic conditions
(i.e. rising costs of living and higher interest rates). The recession in 2009 significantly dampened
demand for diesel (consumption fell by 6.6%), although petrol demand grew by 2.2%.
Figure 8: Annual growth in petroleum product sales, 1995-2010
Source: Own calculations based on SAPIA (2011)
0
500 000
1 000 000
1 500 000
2 000 000
0
5 000
10 000
15 000
20 000
25 000
30 000
R m
illio
ns,
20
05
pri
ces
Mill
ion
Lit
res
Petroleum Product Sales & GDP
Petrol Diesel Jet Fuel Paraffin
LPG Fuel Oil Bitumen Real GDP
-6
-4
-2
0
2
4
6
8
10
12
14
19
95
19
96
19
97
19
98
19
99
20
00
20
01
20
02
20
03
20
04
20
05
20
06
20
07
20
08
20
09
20
10
An
nu
al %
ch
ange
SA Petroleum Product Sales: Growth Rate
Petrol Diesel All Products

12
Figure 9 shows the per capita consumption of petroleum products for the period 1994 to 2010.
There has been a very slightly increasing trend over the period, with a high point reached in 2007.
Figure 9: Petroleum consumption per capita in South Africa, 1994-2010
Source: Own calculations based on SAPIA (2011) and StatsSA (2012)
2.3 Likely impact of oil shocks on the energy system
Rising oil prices will gradually dampen demand and result in less petroleum energy being consumed
in the country, especially in the longer term. The prices of other energy sources, especially those
that are to some extent or other substitutable for oil – such as coal and gas – are likely to rise along
with the oil price. These price rises will in turn put upward pressure on the price of electricity, since
coal is the feedstock for about 90% of national power generation. Furthermore, because
approximately one third of the coal feeding Eskom’s coal-fired power stations is transported by
truck, the costs of this feedstock will rise as diesel prices rise. Higher prices of refined diesel fuel will
also raise Eskom’s costs of running open cycle gas turbines (OCGTs), which are used to meet peak
electricity demand. The costs of buying or manufacturing, transporting and installing alternative
energy infrastructure, including wind turbines and solar panels, will also increase to some extent as a
result of rising fuel costs. The rising cost of alternative energy sources illustrates their dependence
on an economic infrastructure that is itself dependent on oil. Thus there will be added upward
pressure on electricity prices, in addition to the pressure imposed by funding requirements for
Eskom’s new build programme. However, the rising cost of fossil fuel energy will make renewable
energy (RE) sources relatively more competitive and is likely to stimulate investment in this sector.
Increased production of RE technologies could deliver economies of scale and learning, and hence
reduce their prices, setting off a positive feedback loop. Thus over the longer term, one can expect a
process of (partial) substitution of renewable energy for oil and coal. If economic conditions are
deteriorating (as discussed in Section 5 below), however, the expansion of RE might not be rapid
enough to offset declining consumption of fossil fuels, resulting in diminishing total energy
consumption.
0
100
200
300
400
500
600
19
94
19
95
19
96
19
97
19
98
19
99
20
00
20
01
20
02
20
03
20
04
20
05
20
06
20
07
20
08
20
09
20
10
Litr
es/
pe
rso
n
Petroleum Consumption Per Capita
Petrol Diesel All petroleum products
13
Acute physical shortages of oil products, which could arise from time to time owing to global supply
interruptions, could have more serious consequences than gradually rising (or volatile) energy costs.
Most immediately, Eskom’s demand for diesel fuel to run its open cycle gas turbines will have to
compete with transport, agriculture and other demand sectors for scarce diesel supplies. Perhaps
most significantly, a sudden interruption of liquid fuel supplies could disrupt the flow of coal to
power stations and thereby seriously compromise Eskom’s ability to maintain sufficient power
generation to keep the national electricity grid stable. Although not caused by liquid fuel shortages,
a similar situation arose in early 2008 when problems in the procurement and transportation of coal
resulted in insufficient stockpiles at some power stations, contributing to the electricity crisis which
involved blackouts and load shedding. Power outages would in turn hamper the refining of
petroleum fuels and their distribution through pipelines and at retail outlets, thus setting in motion a
self-reinforcing feedback loop with very adverse consequences.
3. Transport
Effective transport systems are essential for the conduct of local, regional and international
commerce and trade, and mobility is an important determinant of human welfare. This section
begins with an overview of South Africa’s transport system. It then details the oil dependence of the
transport system, before identifying key strengths and vulnerabilities in relation to oil price and
supply shocks and likely impacts of such shocks.
3.1 Overview of the transport system2
The transport system is characterised by infrastructure, passenger travel and freight movement.
Each of these facets is considered in turn, according to various transport modes, namely road, rail,
air and sea.
Transport infrastructure
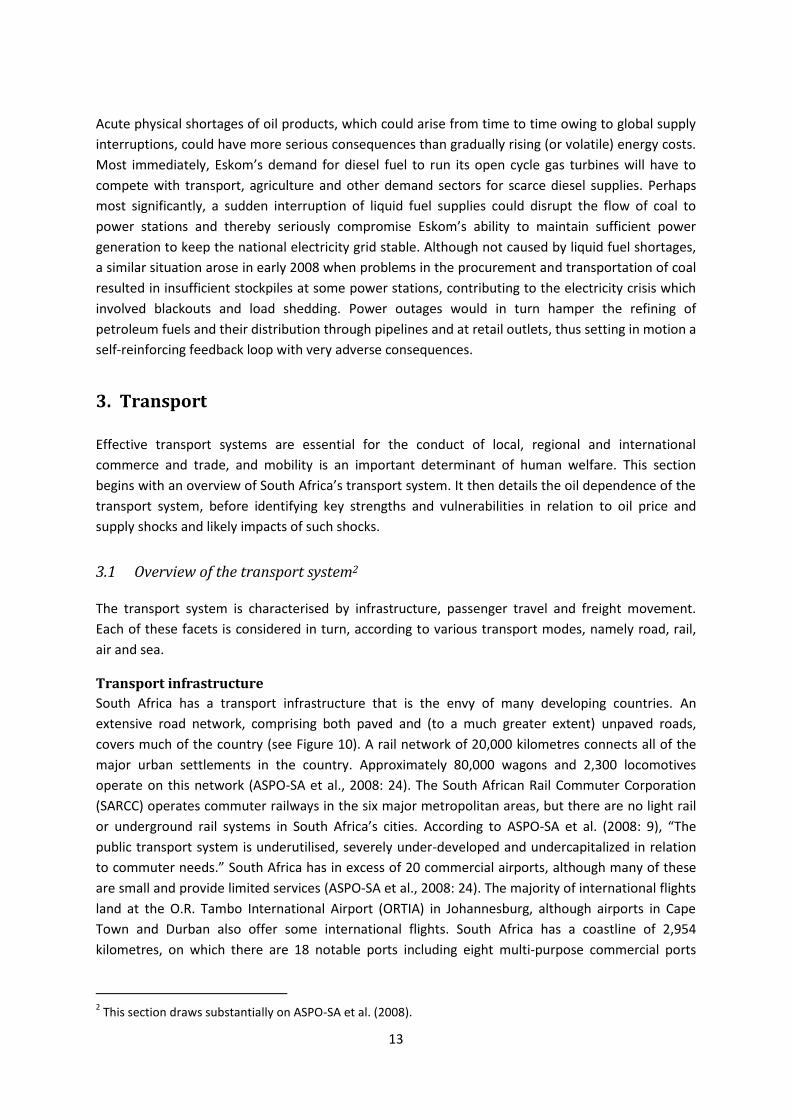
South Africa has a transport infrastructure that is the envy of many developing countries. An
extensive road network, comprising both paved and (to a much greater extent) unpaved roads,
covers much of the country (see Figure 10). A rail network of 20,000 kilometres connects all of the
major urban settlements in the country. Approximately 80,000 wagons and 2,300 locomotives
operate on this network (ASPO-SA et al., 2008: 24). The South African Rail Commuter Corporation
(SARCC) operates commuter railways in the six major metropolitan areas, but there are no light rail
or underground rail systems in South Africa’s cities. According to ASPO-SA et al. (2008: 9), “The
public transport system is underutilised, severely under-developed and undercapitalized in relation
to commuter needs.” South Africa has in excess of 20 commercial airports, although many of these
are small and provide limited services (ASPO-SA et al., 2008: 24). The majority of international flights
land at the O.R. Tambo International Airport (ORTIA) in Johannesburg, although airports in Cape
Town and Durban also offer some international flights. South Africa has a coastline of 2,954
kilometres, on which there are 18 notable ports including eight multi-purpose commercial ports
2 This section draws substantially on ASPO-SA et al. (2008).
14
(ASPO-SA et al., 2008: 29). These ports are connected to the rail and road networks and serve as
entry and exit points for internationally traded goods.
Figure 10: South Africa’s national road network
Source: DoT (2008)
Passenger travel
Despite the country’s extensive transport infrastructure, nearly one half of South African citizens
relied for their mobility on non-motorised transport in 2003 (DoT, 2005). The remaining half of the
population makes use primarily of road-based motorised transport, including private motor vehicles
and minibus taxis. According to the most recent data, the National Household Travel Survey, South
Africa had some 10 million commuters in 2003 (DoT, 2005). At this time the country’s commuters
were overwhelmingly dependent on road transport, including minibus taxis (22% of commuters),
cars (15%), buses (6%) and other taxis (3.7%). Just 2.3% of commuters reported use of trains. Since
that survey was conducted, car ownership and the number of registered minibus taxis have
increased significantly, but use of passenger trains has been static as capacity was not expanded.
Passengers in general have a low regard for public bus and rail transport systems as a result of
perceptions of long distances between dwellings, stations and bus stops (ASPO-SA et al., 2008: 9). In
recent years, Bus Rapid Transit systems have begun being developed in Johannesburg and Cape
Town, with similar systems planned for at least three other major cities. The reliance on motorised
transport is substantially higher in metropolitan and urban areas compared to rural areas for almost
all transport modes. Water-based passenger transport (along the coast) is negligible. As of 31
December 2011, there were approximately 8.8 million self-propelled registered vehicles on South
15
Africa’s roads, including 5.8 million motor cars (representing approximately 120 cars per thousand
people in a population of 49 million), 340 000 motor cycles, 284 000 minibus taxis, 49 000 buses,
over 2 million light trucks and 333 000 heavy trucks (eNatis, 2012).
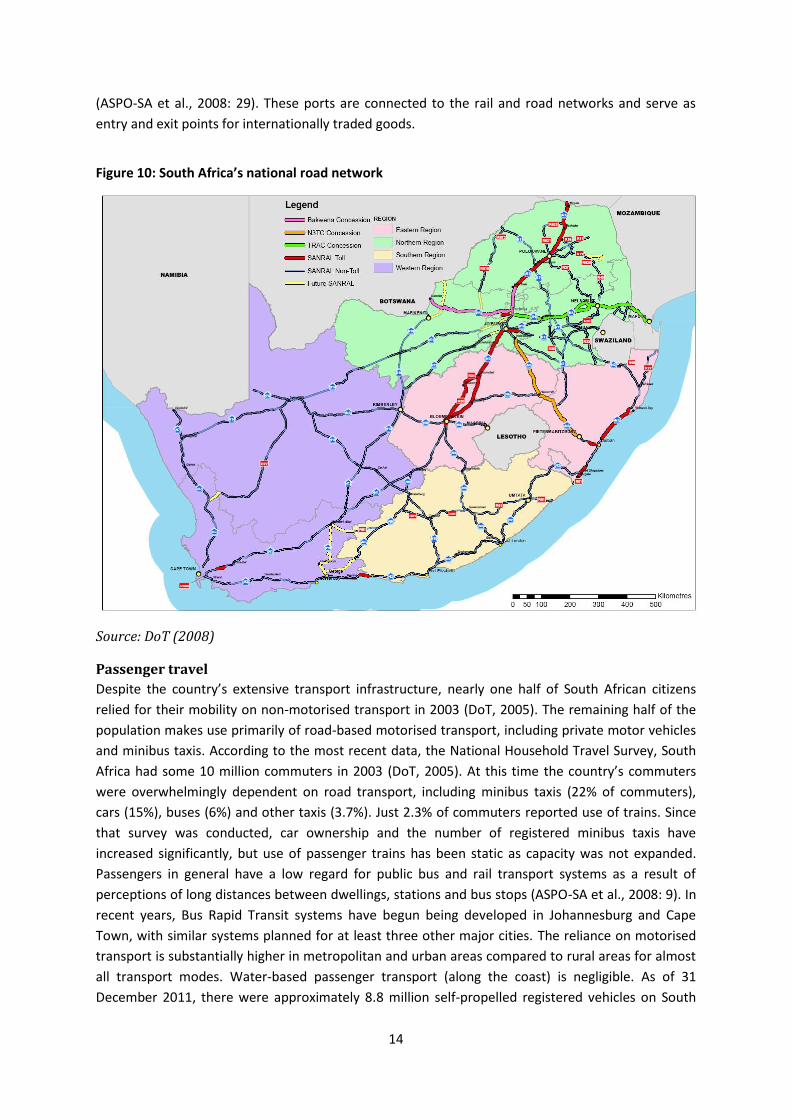
Freight movement
Freight transport is also heavily road-based (see Figure 11). In 2010, road freight accounted for 70%
of ton-kilometres and rail for the remaining 30% (CSIR, 2012: 30). Mining products, such as coal and
iron ore, account for almost half of all freight tonnage, manufacturing for another 45% and
agricultural products for just 6% (GCIS, 2007: 578). Since the mid-1990s, rail freight volumes on
corridors have declined while road freight volumes have grown steadily, apart from a dip in the
recession year of 2009. Logistics costs in 2010 amounted to 12.7% of GDP, approximately half of
which were transport costs (CSIR, 2012: 30). Relatively small volumes of freight are transported by
air. South Africa lacks any significant navigable rivers and hence makes very limited use of water-
borne freight transport.
Figure 11: Land freight transport in South Africa, 2003-2010
Source: CSIR (2012)
3.2 Oil dependence of the transport system
The transport sector utilised 83% of all petroleum energy, 2% of all electricity, and 25% of total final
energy consumed in South Africa in 2009 (based on IEA, 2012). Within the transport sector itself,
98% of the energy consumed is derived from petroleum products, and only 2% from electricity
(these shares have hardly changed since 1990). Clearly, the transport sector is overwhelmingly
dependent on liquid petroleum fuels, i.e. petrol, diesel and jet fuel. Table 2 shows the consumption
of energy disaggregated by energy carrier and by transport mode. Road transport dominates energy
consumption with 79% of petroleum fuels and 78% of all energy. Aviation (including international
and domestic air transport) accounted for 9.3% of petroleum consumption within the transport
sector in 2009, while 11.4% was consumed for internal navigation. Rail used predominantly
0
50
100
150
200
250
300
350
400
450
2003 2004 2005 2006 2007 2008 2009 2010
Bill
ion
to
nn
e-k
ms
Freight Transport in South Africa
Road Rail

16
electricity (79% of electricity consumed by the transport sector) plus a small amount of diesel and
coal, but less than 2% of total energy consumed by transport.
Table 2: Energy consumption by the transport sector, 2009
Transport Sector Coal Petroleum Electricity Total
TJ % TJ % TJ % TJ %
International aviation - - 36 118 4.0 - - 36 118 3.9
Domestic aviation - - 47 559 5.3 230 1.7 47 789 5.2
Road - - 711 364 79.1 86 0.7 711 450 77.8
Rail 2035 100.0 1 788 0.2 10442 79.3 14 265 1.6
Pipelines - - - - 355 2.7 355 0.0
Internal navigation - - 102 857 11.4 195 1.5 103 052 11.3
Non-specified - - - - 1856 14.1 1 856 0.2
Total 2 035 100 899 684 100 13 165 100 914 885 100
Source: DoE (2012)
3.3 Likely impact of oil shocks on the transport system
The major vulnerabilities to oil shocks inherent in South Africa’s transport system include
infrastructural, modal (passenger and freight), and geographical dimensions.
Transport infrastructure in South Africa, although extensive relative to many other developing
countries, suffers from several problems. A major weakness of the road network is the deficit in road
maintenance in many areas, with an estimated backlog of R75 billion in April 2010 (Davenport,
2010). Some four fifths of the country’s roads were older than the 20-year lifespan for which they
were designed (Davenport, 2010). According to the CSIR (2010: 5), “The percentage of bad and very
bad roads in the secondary road network of South Africa increased from 8% in 1998 to 20% in 2008.”
Road maintenance costs are vulnerable to oil price shocks, since the bitumen used for surfacing
paved roads is derived from crude oil. Although the rail network has significant spare capacity for
moving freight, it has been neglected in terms of maintenance and upgrading (ASPO-SA, 2008: 50-
51). Much of the nation’s rolling stock is very old and needs to be replaced (Situma, 2007; Mahlalela,
2010). The well-developed port infrastructure could serve the economy well if more freight is shifted
from road to sea. However, since manufacturing production is concentrated in Gauteng, there is
limited scope for such modal transfer, especially considering the lack of inter-modal facilities (ASPO-
SA, 2008). Many of the country’s airports were upgraded or expanded in preparation for the FIFA
Soccer World Cup in 2010, but this expenditure will be of doubtful use for the future when air travel
is likely to be severely constrained internationally and domestically by rising fuel costs. Public
transport in several major cities also received a significant boost as part of the preparations for the
Soccer World Cup, when construction began on Bus Rapid Transit (BRT) systems in Johannesburg
and Cape Town. However, provision of infrastructure to facilitate non-motorised transport in cities,
such as walk-ways and bicycle paths, is sorely lacking.
The mobility of the more than half of South Africa’s population that relies on motorised transport is
highly vulnerable to oil price shocks, given the overwhelming reliance on liquid petroleum-fuelled

17
vehicles. Poorer transport users tend to spend a much higher proportion of their incomes on
transport and therefore are more vulnerable to rising fuel and transport costs than their wealthier
counterparts. Public transport users will face increasing fares and if these become unaffordable,
commuters may have to walk or even be unable to travel to their places of work. Motorists will
respond to higher fuel prices with a range of behavioural adaptations, starting with reduced
discretionary driving and later shifting to public transport, which may become over-subscribed.
While air travel will be particularly vulnerable to rising fuel prices (since fuel accounts for a relatively
high proportion of total costs), business travellers can adapt to some extent by telecommuting.
Many of those travelling by air for other purposes (e.g. tourism) are likely to have to shift mode
and/or reduce their travel distances.
The heavy reliance of freight on road transport presents a major challenge to the economy, both in
terms of future fuel supply constraints and the impact of rising costs. Lane (2009) catalogues a range
of vulnerabilities that characterise freight transport in South Africa, including inadequate
technology, equipment and facilities; outdated infrastructure; lack of inter-modal facilities; capacity
bottlenecks; monopoly ownership of certain infrastructure; skills shortages; and a lack of
information. Given the overwhelming dependence of freight movement on road transport, rising
fuel prices would have a significant impact on the trend in freight and logistics costs. The CSIR (2010:
16) estimated that a tripling in the fuel price would raise logistics costs by 53% under conditions
pertaining in 2008. Consequently, transport costs as a share of GDP would rise from 7.4% to 12.8%
(CSIR, 2010: 17). Some industries and retailers might absorb a portion of the added freight costs
internally, but in general higher freight costs will be passed along the value chain to final consumers
in the form of higher retail prices for goods. Businesses with a high degree of reliance on freight
movement (i.e. where transport costs are a significant proportion of the final costs of goods) will find
that rising fuel costs steadily erode their profit margins. For international trade, rising fuel costs will
act like a tariff barrier, favouring local trade over long-distance trade (see Rubin, 2009). Being highly
energy intensive, air freight is much more sensitive to fuel prices than other modes of freight
transport. In the long term, costs of air freight may become prohibitively high, resulting in the
collapse of markets for all but the highest-value goods.
Vulnerabilities can also be identified on a geographical basis. Most obviously, there are substantial
distances between major metropolitan areas and towns. The bulk of liquid fuels are consumed in
metropolitan areas, due to the high concentration of vehicles found here and the phenomenon of
urban sprawl. Areas in the hinterland that have no rail access are also highly vulnerable, with a
danger that both people and assets could become stranded. Many parts of the country are
accessible only by roads (ASPO-SA et al., 2008: 56). Both industry and population are concentrated in
the interior of the country, far from ports (and at a much higher altitude), which means that two
long-distance corridors (Gauteng-Durban and Gauteng-Cape Town) carry large freight volumes
(Lane, 2009). Finally, South Africa is far from most of its trading partner countries, which makes
international trade especially vulnerable to rising transport costs.
Short term, sudden shortages of fuel could have a drastic impact on transport. For example, a
sudden interruption of jet fuel supplies could have serious implications as the Department of
Minerals and Energy (DME, 2007: 21) warned that “indications are that there is not enough space in
South African airports to park all airplanes that are, at any one time, heading for or in South Africa.”

18
For road passengers (whether using private or public vehicles), localised fuel shortages could result
in disabling immobility. Shortages are likely to result in extensive queuing and possibly even conflict
at filling stations, while hoarding responses are also possible. In the case of freight, fuel shortages
would result in disruptions to logistics chains. The longer the production chains involved, the greater
the potential for disabling disruptions. Just-in-time delivery systems are particularly at risk of
logistics failures (Rubin, 2009), with the result that shortages of various commodities could arise at
the retail level.
4. Agriculture
Agriculture, which is classified as one of the primary economic sectors, is a quantitatively small but
qualitatively very important sector of the economy. It represents the base layer of the economy in
that the population and labour force must have food in order to carry out economic activities.
Economic and social stability depend on a healthy, functioning system of agricultural production and
food distribution. Section 4.1 provides a brief overview of the agricultural system in South Africa,
while Section 4.2 describes its dependence on oil and explores the issue of national food security.
Section 4.3 summarises the anticipated impacts of oil shocks.
4.1 Overview of agriculture
South Africa has a total land area of 127 million hectares, of which just over 100 million hectares
(82%) is classified as farmland (DAFF, 2012). The vast majority of this farmland (84 million hectares
or 69% of the total land area) is suitable for grazing only. Approximately 16.7 million hectares (14%)
of the country’s land area receives sufficient rainfall to be potentially arable, although only about a
fifth of this land is of high quality (GCIS, 2009: 47). Water scarcity is a limiting factor for agriculture,
and only about 1.35 million hectares (1.5% of agricultural land and less than 10% of arable land) is
under irrigation (DAFF, 2012). South Africa’s agricultural economy is made up of two parts: an
industrialised commercial sector, and a largely rural subsistence or smallholder sector (GCIS, 2009:
47). Commercial farmers account for at least 95% of total marketed agricultural produce (Food and
Agriculture Organisation (FAO), 2005: 2). The commercial agriculture sector produces a wide range
of commodities, including livestock products (meat and dairy products), field crops (grains such as
maize, wheat and sorghum; sugar; oil seeds; and cotton) and horticultural produce (fruits and
vegetables). Maize occupies half of all the land under crops (FAO, 2005: 13), is the most important
food crop by volume of output, and is the staple food for the majority of South Africans. Subsistence
farming occurs predominantly in the rural, former ‘homeland’ areas of South Africa (Pauw, 2007:
196) and contributes less than 5% of total agricultural output (FAO, 2005: 2). Subsistence farming
involves a small share of the South African population relative to other sub-Saharan African
countries, where it remains a major contributor to livelihoods (Baiphethi & Jacobs, 2009: 462).
Nevertheless, there are approximately four million South Africans involved in subsistence farming,
mostly to secure an “extra source of food” (Aliber & Hart, 2009: 439).

19
4.2 Oil dependence of agriculture
The agriculture, forestry and fishing sector accounted for 3% of total final energy consumption in
2008, which was commensurate with its 2.9% contribution to gross domestic product. As seen in
Figure 12, the relative contributions of coal, petroleum and electricity to total energy consumption
in agriculture have not changed substantially over the past two decades, although the already small
share of coal has diminished further. In 2008, approximately two thirds (69%) of the energy used by
the agricultural sector was in the form of liquid petroleum fuels, while electricity contributed 30%
and coal just 1%. Energy and oil intensity varies according to the type of farming practiced, namely
industrialised commercial or subsistence farming. Organic farming has grown fairly rapidly in recent
years, but this has been from a very small base and the sector comprises a miniscule proportion of
commercial farms in South Africa (Niemeyer & Lombard, 2003: 1).
Figure 12: Energy consumption in agriculture, 1990-2008
Source: IEA (2012)
The industrialised, commercial agricultural system in South Africa is highly dependent on fossil fuel
energy at every stage of the value chain, from primary production on farms, to processing in
factories, to wholesale and retail distribution. At the production stage, this energy intensity results
primarily from the extensive use of liquid petroleum fuels – especially diesel – to power farm
vehicles and machinery such as tractors, planters and harvesters. Electricity is also consumed to
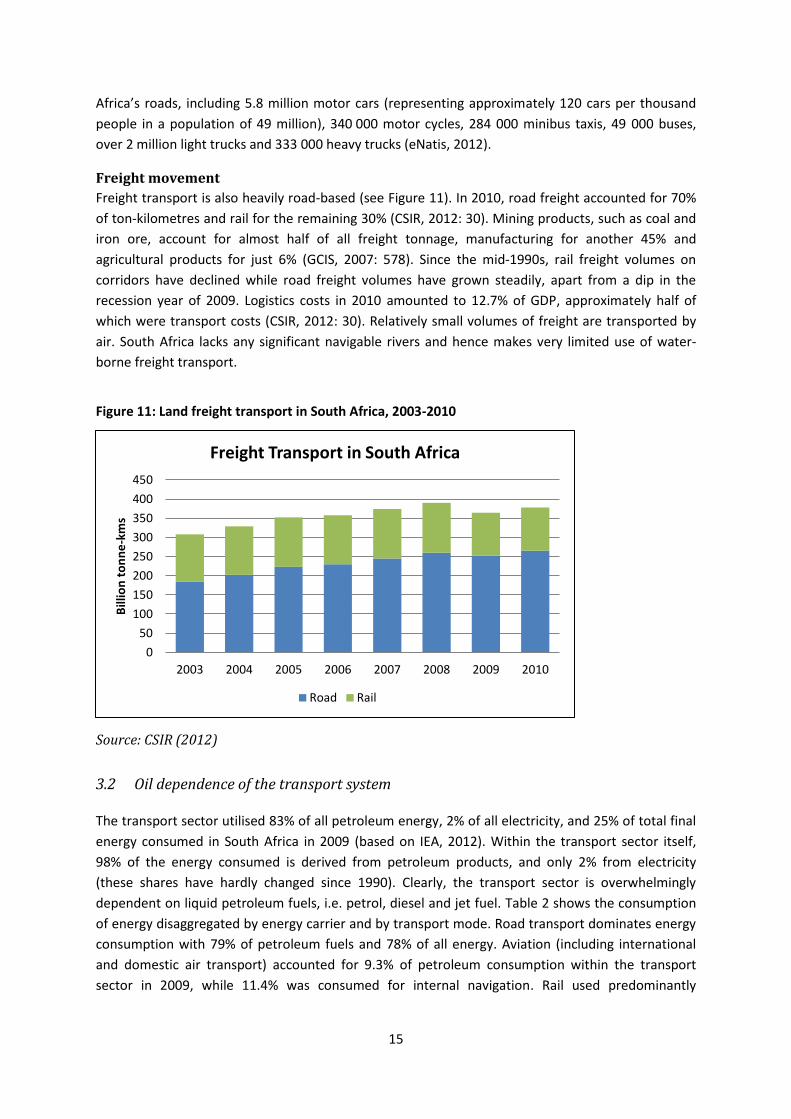
power irrigation systems and other machinery, including refrigerators. The relative capital intensity
(as measured by the capital/labour ratio) of commercial agriculture has increased considerably over
the past several decades as farmers have progressively replaced human labour with machinery (see
Figure 13; Institute for Natural Resources, 2008: 67).
0%
20%
40%
60%
80%
100%
19
90
19
91
19
92
19
93
19
94
19
95
19
96
19
97
19
98
19
99
20
00
20
01
20
02
20
03
20
04
20
05
20
06
20
07
20
08
Energy Consumption in Agriculture
Coal Petroleum Electricity
20
Figure 13: Capital-labour ratio in agriculture, 1971-2005
Source: Author’s calculations based on DAFF (2012) and SARB (2012)
Note: The employment series from DAFF (2012) had several missing values, which were replaced with
linearly interpolated figures.
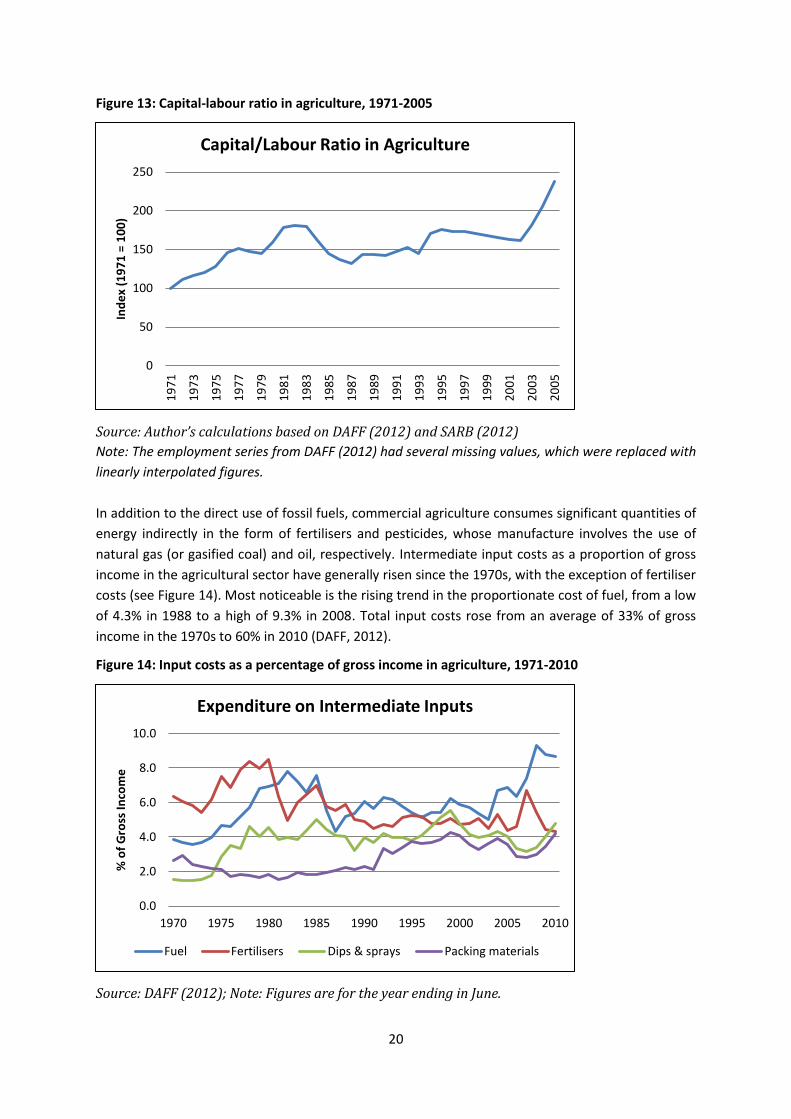
In addition to the direct use of fossil fuels, commercial agriculture consumes significant quantities of
energy indirectly in the form of fertilisers and pesticides, whose manufacture involves the use of
natural gas (or gasified coal) and oil, respectively. Intermediate input costs as a proportion of gross
income in the agricultural sector have generally risen since the 1970s, with the exception of fertiliser
costs (see Figure 14). Most noticeable is the rising trend in the proportionate cost of fuel, from a low
of 4.3% in 1988 to a high of 9.3% in 2008. Total input costs rose from an average of 33% of gross
income in the 1970s to 60% in 2010 (DAFF, 2012).
Figure 14: Input costs as a percentage of gross income in agriculture, 1971-2010
Source: DAFF (2012); Note: Figures are for the year ending in June.
0
50
100
150
200
2501
97
1
19
73
19
75
19
77
19
79
19
81
19
83
19
85
19
87
19
89
19
91
19
93
19
95
19
97
19
99
20
01
20
03
20
05
Ind
ex
(19
71
= 1
00
)
Capital/Labour Ratio in Agriculture
0.0
2.0
4.0
6.0
8.0
10.0
1970 1975 1980 1985 1990 1995 2000 2005 2010
% o
f G
ross
Inco
me
Expenditure on Intermediate Inputs
Fuel Fertilisers Dips & sprays Packing materials

21
Traditional subsistence farming is generally much less dependent on oil than commercial farming,
for several reasons. First, subsistence production is small-scale and labour intensive rather than
large-scale and capital intensive (mechanised), and therefore uses little or no petroleum fuel
directly. Second, traditional farming has at least until recently been mostly organic, i.e. farmers do
not use chemical fertilisers and pesticides derived from fossil fuels (Modi, 2003: 676). Nevertheless,
some subsistence farmers may rely to an extent on purchases of fertilisers, seeds and other inputs
whose prices may be affected by oil prices. Third, most smallholder produce is consumed locally
rather than being transported to distant markets.
National food security
The dependence of agriculture on oil has significant implications for national food security.
According to the Food and Agricultural Organisation (FAO, 1996, in Hendriks & Msaki, 2009: 184),
“Food security exists when all people, at all times, have physical and economic access to sufficient,
safe and nutritious food to meet their dietary needs and food preferences for an active and healthy
life.” Food security can be analysed on different scales of aggregation. The remainder of this
subsection considers food security at the national level, while household level food security is
discussed in Section 6.2. At the national level, food security has two determinants: (1) the capacity of
the country to be self-sufficient in food production; and (2) the ability of the country to afford food
imports where necessary or desirable.
South Africa has the capacity to be self-sufficient (i.e., domestic production exceeds consumption) in
most agricultural products (GCIS, 2009). On average, South Africa produces sufficient quantities of
the main staple crop, maize, to meet domestic human and commercial consumption (see Figure 15).
Historical exceptions to this have largely been the result of droughts. However, South Africa does
rely on imports for some significant agricultural products. Major agricultural net imports include rice,
wheat, poultry and vegetable oils (NDA, 2009c: 10). Approximately one third to one half of the
country’s wheat requirement is imported, although this is partly because imports are cheaper than
domestic production on marginal lands and there is no import tariff protection. All of the rice
consumed domestically is imported, but rice is generally consumed by the wealthy minority and
does not represent a broad staple food. Agricultural imports, mostly of processed foods, grew more
rapidly than exports in the early 2000s so that by 2008 South Africa had become a net food importer
in value terms for the first time (NDA, 2009b: 8).

22
Figure 15: Maize production and consumption in South Africa, 1970-2011
Source: DAFF (2012)
Note: Commercial consumption refers to maize used as animal feed.
Continued national food self-sufficiency clearly depends on access to affordable, quality inputs (such
as fertilisers, pesticides, and machinery) for agricultural production. South Africa became a net
importer of fertilisers in the 2000s (FAO, 2005: 19). Domestic fertiliser prices are influenced heavily
by prevailing international prices, the rand-dollar exchange rate and freight costs (FAO, 2005: 28)
and are therefore susceptible to rising oil prices both directly (through higher transport costs) and
indirectly (through the impact of oil prices on the exchange rate and international prices). Fertilisers
are mostly delivered to farms by road and rarely by rail (FAO, 2005: 30), further entrenching
dependence on oil. The majority of farming equipment, such as tractors and harvesters, is imported
and therefore farmers face the risk of rising international prices and/or a depreciating exchange
rate.
The second important determinant of national food security is South Africa’s capacity to import food
products. This depends on international food prices as well as the strength of the domestic
economy, in particular the balance of payments and the level of the exchange rate (see Section 5
below). These aspects of the macro-economy are likely to come under pressure from any future oil
price shocks.
4.3 Likely impact of oil shocks on agriculture
Rising fuel prices will raise direct input costs for fuel and chemical products that use oil (and oil
substitutes) in their manufacture, including pesticides, fertilisers and packing materials (see Figure
16). In addition, rising transport costs will add to the prices of chemical inputs, and raise the costs of
transporting produce to food processors, wholesalers and markets. If production costs rise faster
than sales prices, then agricultural output will decline. Given the highly concentrated nature of the
food processing and retail sectors in South Africa (Mather, 2005), individual farmers are not able to
pass on all cost increases to consumers, which exposes farmers to possible bankruptcy if costs rise
0
2000
4000
6000
8000
10000
12000
14000
16000
1970 1975 1980 1985 1990 1995 2000 2005 2010
'00
0 t
on
s
Maize production and consumption
Consumption Production

23
too much. For exporters, higher world commodity prices could offset higher input costs, although
higher transport costs might dampen foreign demand. Profitability would depend greatly on
exchange rate movements. The short-term volatility in oil prices will create a great deal of
uncertainty for farmers, who will face difficult choices about whether to plant crops, and which
crops to plant. Persistent higher oil prices and shortages of oil might encourage farmers to revert to
more labour-intensive and organic methods of production that rely less on petroleum based fuels
and pesticides.
Figure 16: Price indices of intermediate goods in agriculture, 2000-2011
Source: DAFF (2012)
Any physical shortage of liquid fuels arising in rural areas would compromise the production of
agricultural commodities. Since key farming operations, such as planting and harvesting, are highly
time-dependent, fuel shortages at such critical times could be devastating to output. Fuel shortages
would also curtail the distribution of farming products to processing facilities and markets in towns
and cities. The likelihood of fuel shortages emerging in rural areas is greater than that in urban areas
due to the location of South Africa’s oil refineries in or near to just four major urban centres (Cape
Town, Durban, Mossel Bay, and Sasolburg and Secunda near Johannesburg).
5. Macro-economy
This section begins with a brief overview of the structure of South Africa’s macro-economy. It then
details the economy’s energy intensity and oil dependency. The third subsection lists the main
macroeconomic strengths and vulnerabilities to oil shocks. The fourth subsection discusses the likely
macroeconomic impacts of oil price shocks in South Africa, drawing on historical experience.
0
50
100
150
200
250
300
2000 2001 2002 2003 2004 2005 2006 2007 2008 2009 2010 2011
20
05
= 1
00
Price Indices of Agricultural Inputs
Fuel Fertiliser Dips & sprays Packing materials
24
5.1 Overview of the macro-economy
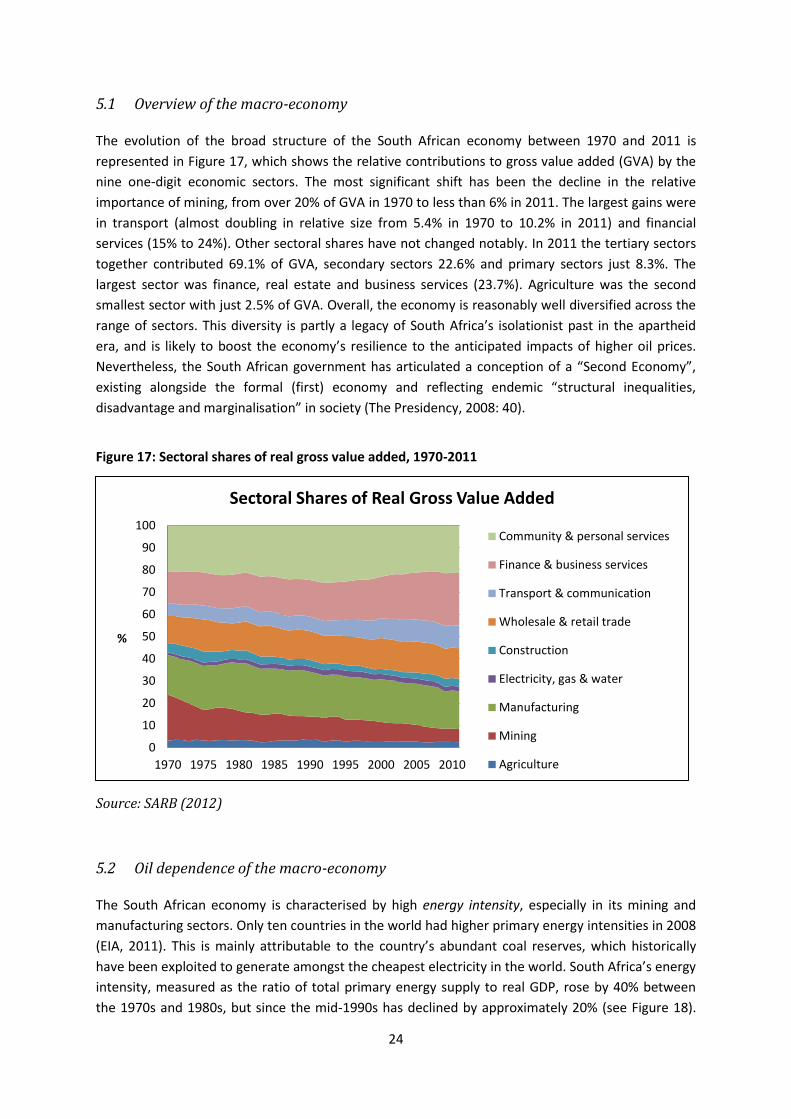
The evolution of the broad structure of the South African economy between 1970 and 2011 is
represented in Figure 17, which shows the relative contributions to gross value added (GVA) by the
nine one-digit economic sectors. The most significant shift has been the decline in the relative
importance of mining, from over 20% of GVA in 1970 to less than 6% in 2011. The largest gains were
in transport (almost doubling in relative size from 5.4% in 1970 to 10.2% in 2011) and financial
services (15% to 24%). Other sectoral shares have not changed notably. In 2011 the tertiary sectors
together contributed 69.1% of GVA, secondary sectors 22.6% and primary sectors just 8.3%. The
largest sector was finance, real estate and business services (23.7%). Agriculture was the second
smallest sector with just 2.5% of GVA. Overall, the economy is reasonably well diversified across the
range of sectors. This diversity is partly a legacy of South Africa’s isolationist past in the apartheid
era, and is likely to boost the economy’s resilience to the anticipated impacts of higher oil prices.
Nevertheless, the South African government has articulated a conception of a “Second Economy”,
existing alongside the formal (first) economy and reflecting endemic “structural inequalities,
disadvantage and marginalisation” in society (The Presidency, 2008: 40).
Figure 17: Sectoral shares of real gross value added, 1970-2011
Source: SARB (2012)
5.2 Oil dependence of the macro-economy
The South African economy is characterised by high energy intensity, especially in its mining and
manufacturing sectors. Only ten countries in the world had higher primary energy intensities in 2008
(EIA, 2011). This is mainly attributable to the country’s abundant coal reserves, which historically
have been exploited to generate amongst the cheapest electricity in the world. South Africa’s energy
intensity, measured as the ratio of total primary energy supply to real GDP, rose by 40% between
the 1970s and 1980s, but since the mid-1990s has declined by approximately 20% (see Figure 18).
0
10
20
30
40
50
60
70
80
90
100
1970 1975 1980 1985 1990 1995 2000 2005 2010
%
Sectoral Shares of Real Gross Value Added
Community & personal services
Finance & business services
Transport & communication
Wholesale & retail trade
Construction
Electricity, gas & water
Manufacturing
Mining
Agriculture
25
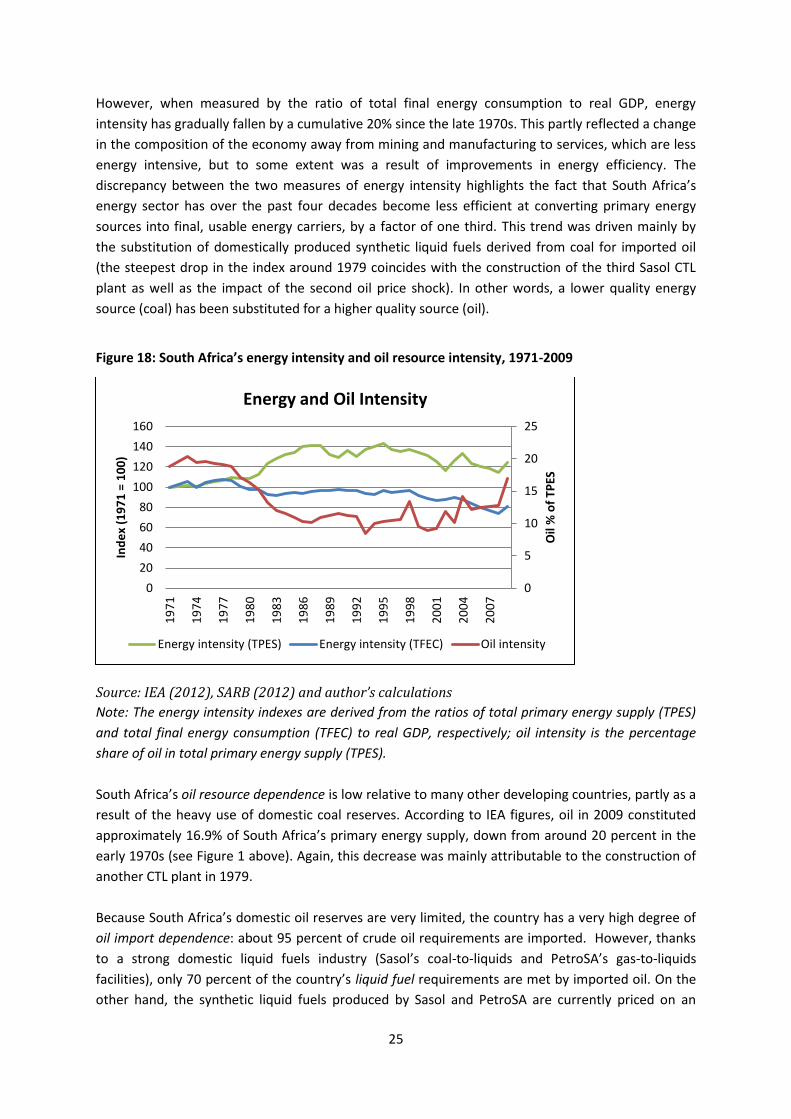
However, when measured by the ratio of total final energy consumption to real GDP, energy
intensity has gradually fallen by a cumulative 20% since the late 1970s. This partly reflected a change
in the composition of the economy away from mining and manufacturing to services, which are less
energy intensive, but to some extent was a result of improvements in energy efficiency. The
discrepancy between the two measures of energy intensity highlights the fact that South Africa’s
energy sector has over the past four decades become less efficient at converting primary energy
sources into final, usable energy carriers, by a factor of one third. This trend was driven mainly by
the substitution of domestically produced synthetic liquid fuels derived from coal for imported oil
(the steepest drop in the index around 1979 coincides with the construction of the third Sasol CTL
plant as well as the impact of the second oil price shock). In other words, a lower quality energy
source (coal) has been substituted for a higher quality source (oil).
Figure 18: South Africa’s energy intensity and oil resource intensity, 1971-2009
Source: IEA (2012), SARB (2012) and author’s calculations
Note: The energy intensity indexes are derived from the ratios of total primary energy supply (TPES)
and total final energy consumption (TFEC) to real GDP, respectively; oil intensity is the percentage
share of oil in total primary energy supply (TPES).
South Africa’s oil resource dependence is low relative to many other developing countries, partly as a
result of the heavy use of domestic coal reserves. According to IEA figures, oil in 2009 constituted
approximately 16.9% of South Africa’s primary energy supply, down from around 20 percent in the
early 1970s (see Figure 1 above). Again, this decrease was mainly attributable to the construction of
another CTL plant in 1979.
Because South Africa’s domestic oil reserves are very limited, the country has a very high degree of
oil import dependence: about 95 percent of crude oil requirements are imported. However, thanks
to a strong domestic liquid fuels industry (Sasol’s coal-to-liquids and PetroSA’s gas-to-liquids
facilities), only 70 percent of the country’s liquid fuel requirements are met by imported oil. On the
other hand, the synthetic liquid fuels produced by Sasol and PetroSA are currently priced on an
0
5
10
15
20
25
0
20
40
60
80
100
120
140
160
19
71
19
74
19
77
19
80
19
83
19
86
19
89
19
92
19
95
19
98
20
01
20
04
20
07
Oil
% o
f TP
ES
Ind
ex
(19
71
= 1
00
)
Energy and Oil Intensity
Energy intensity (TPES) Energy intensity (TFEC) Oil intensity

26
import parity basis. If this does not change, then consumers are just as vulnerable to oil price shocks,
even though synfuels provide a partial buffer for oil supply shocks.
The nominal value of South Africa’s crude and refined oil imports rose fairly rapidly between 2004
and 2008 (see Figure 19), thanks to a combination of rising consumption (driven by economic growth
and an expanding population) as well as a steadily rising oil price.3 In 2008 the country spent nearly
R138 billion, or 6% of GDP, on oil imports, which represented the single largest import item on the
balance of payments. In 2009, as a result of the recession and lower oil price, oil imports fell to R95
billion (4% of GDP). In comparison, net coal exports in 2009 amounted to R33 billion (1.4% of GDP).
Figure 19: Net crude and refined oil imports, 1994-2010
Source: DTI (2010) and SARB (2012)
A final measure of the oil dependence of the South African macro-economy is provided by the ratio
of petroleum product consumption to real GDP. Figure 20 shows that this measure of petroleum
dependency increased slightly from 1994 (by 4.5%) to reach a peak in 1998, after which it declined
nearly monotonically by an average of 2% per annum and a cumulative 20 percentage points by
2009. This is an illustration of relative resource decoupling (Fischer-Kowalski & Swilling, 2011):4
although absolute consumption of petroleum products rose between 1998 and 2009, consumption
relative to real GDP fell considerably. This relative decoupling can partly be explained by the growth
in the financial services sector (which has very low petroleum intensity). Nevertheless, this
decoupling achievement bodes well for the potential to reduce future petroleum consumption while
attenuating negative impacts on economic activity.
3 Unfortunately, oil import data for earlier years are unobtainable as they were classified information under
the Apartheid regime; therefore comparisons with the 1970s oil price shocks are not possible. 4 Fischer-Kowalski and Swilling (2011: 4) define resource decoupling as “reducing the rate of use of (primary)
resources per unit of economic activity.”
0
1
2
3
4
5
6
7
0
20 000
40 000
60 000
80 000
100 000
120 000
140 000
160 000
19
94
19
95
19
96
19
97
19
98
19
99
20
00
20
01
20
02
20
03
20
04
20
05
20
06
20
07
20
08
20
09
20
10
% o
f G
DP
R m
illio
n
Net Oil Imports
R million % of GDP

27
Figure 20: Petroleum intensity of the economy, 1994-2010
Source: Author’s calculations based on SAPIA (2011) and SARB (2012)
5.3 Strengths and vulnerabilities of the macro-economy
The major strengths and vulnerabilities of the South African macro-economy in the face of
international oil price shocks, as of 2012, are as follows:
The large current account deficit, which reached 7.2% of GDP in 2008 when oil prices spiked and
stood at 3.3% in 2011, represents a significant risk in terms of potential currency volatility,
speculative attacks and exchange rate depreciation.
The financial account of the balance of payments has relied heavily on short-term portfolio
inflows and is highly vulnerable to sudden capital flight, which therefore poses a significant
currency risk.
There has been a long-term decline in output of gold from South African mines since the early
1980s, mainly as a result of depletion of ores, such that by 2008 gold exports accounted for just
9% of total exports and 2.5% of GDP (see Figure 21 below). Thus while gold and other mineral
exports can still be expected to provide some level of shock absorption for future oil price hikes,
as they did in the past, this potential is substantially reduced relative to the 1970s.
While the National Treasury had achieved a fiscal surplus in 2006 and 2007, the fiscal deficit rose
to 5% of GDP in 2009 as a consequence of the Global Financial Crisis and ensuing recession in SA,
and remained above 4% in 2010 and 2011. Consequently, the ratio of public debt to GDP rose
from an historical low of 27% in 2008 to 38.6% in 2011; although this was still considerably
below the peak of 50% in 1995 (SARB, 2012). The large fiscal deficit and debt leave little fiscal
space for responding to future shocks.
Total foreign debt was a moderate 27.3% of GDP in 2011 (SARB, 2012), which equalled the
average for the period 1985 to 2010 and was comparatively low by international standards.
0
20
40
60
80
100
1201
99
4
19
95
19
96
19
97
19
98
19
99
20
00
20
01
20
02
20
03
20
04
20
05
20
06
20
07
20
08
20
09
20
10
Ind
ex
(19
94
= 1
00
)
Petroleum Intensity of Economy

28
The ratio of household debt to disposable income peaked at 80.3% in 2008 before declining to
75.9% in 2011 (SARB, 2012). This exposes consumers to fall-out from oil price shocks such as
higher costs of living, higher interests rates and falling real incomes.
The headline consumer inflation rate stood at 4.9% in mid-2012, comfortably inside the South
African Reserve Bank’s inflation target range of 3 to 6%, and therefore did not represent a major
threat in the short term (StatsSA, 2012). The Reserve Bank reduced its benchmark repurchase
rate to a historical low of 5% in June 2012; there is still some monetary policy space for
responding to deflationary shocks.
A major vulnerability is the unemployment rate, whose official figure stood at 24.9% in the
second quarter of 2012 (StatsSA, 2012). The so-called broad rate of unemployment, which
includes discouraged worker seekers (i.e. those who wanted to work but did not actively search
for jobs in the week preceding the survey), was well over 30%.
Figure 21: Ratios of net gold exports to total exports and GDP, 1970-2011
Source: SARB (2012) and author’s calculations.
5.4 Likely impact of oil shocks on the macro-economy
The direct impacts of oil price shocks occur via higher fuel prices and have reverberations on several
important macroeconomic variables. South Africa is a price taker on the international oil market.
Domestically, the downstream liquid fuels industry is subject to extensive government regulation.
Prices of petroleum fuels (petrol, diesel, paraffin and LPG) are administered by the State, which
imposes various levies and taxes and determines retail and wholesale margins, over-and-above a
‘basic fuel price’. The basic fuel price is determined by an import parity pricing formula which
depends on the international spot price of refined oil (SAPIA, 2011). Sasol and PetroSA’s synthetic
liquid fuels (converted from coal and gas, respectively) are accorded the same status in the domestic
market as fuels that are refined from imported crude oil. The basic fuel price is influenced by two
primary factors: the dollar price of crude oil traded on international markets; and the rand/dollar
0
2
4
6
8
10
12
14
16
18
0
10
20
30
40
50
1970 1975 1980 1985 1990 1995 2000 2005 2010
% o
f G
DP
% o
f Ex
po
rts
Gold Exports
Gold exports/total exports Gold exports/GDP

29
exchange rate. Volatility in both of these variables has historically had a significant impact on the
rand denominated price of oil (see Figure 22). Notably, the oil price shocks of 1973 and 1979 were
somewhat muted in rand terms, thanks to the relative strength of the rand then (which was
supported by a high gold price). The rand oil price in 2008 was almost double that of 1979 in real
(inflation-adjusted) terms.
Figure 22: Real oil price in 2012 dollars and rands, 1970-2012
Source: IMF (2012) and own calculations
Wakeford (2012) undertook a comprehensive review of historical experience and various empirical
estimates of the impact of oil price shocks on South Africa, and found the results to be broadly
consistent. In general, crude oil price shocks resulted in: a depreciation of the exchange rate; a boost
for some export commodities, such as coal and uranium, at least initially; higher rates of producer
and consumer price inflation; lower (or negative) growth in real GDP; falling employment and real
wages; and greater poverty and inequality. The sectors most adversely affected include agriculture,
light manufacturing and private services, while the sectors benefitting most in relative terms were
domestic synfuels, electricity, and coal and gold mining. The oil price shocks of the 1970s and 2008
can arguably be identified as at least major contributing factors to the ensuing recessions (see Figure
23), mainly via their impact on global demand for South Africa’s export commodities. The economic
impact of world oil price shocks appeared to occur with a time lag of around 2-3 years in the 1970s
but about one year in 2007/08. It is notable that in the latter period (1) gold provided a much
smaller buffer and (2) South Africa’s economy was much more integrated into the global economy,
which could have shortened the impact time lag. It seems that South Africa’s vulnerability to global
oil shocks has increased over time as a result of the country’s re-integration to the world economy.
0
20
40
60
80
100
120
140
160
0
200
400
600
800
1000
1200
1400
19
70
19
72
19
75
19
77
19
80
19
82
19
85
19
87
19
90
19
92
19
95
19
97
20
00
20
02
20
05
20
07
20
10
Do
llar/
bar
rel
Ran
d/b
arre
l
Real Oil Price
Real oil price (2012 R) Real oil price (2012 US $)

30
Figure 23: Oil expenditures and recessions in South Africa, 1965-2010
Source: Wakeford (2012)
In the medium term future, it can be expected that South Africa will suffer similar types of negative
consequences from oil price and supply shocks as it did in 2008-2009. Given that both the global and
South African economies are in a much weaker state in 2012 than they were immediately prior to
the 2008 oil shock, future oil shocks might have even more severe socioeconomic effects.
6. Society
This section provides an overview of several important features of contemporary South African
society that are relevant to understanding potential social vulnerabilities to oil price and supply
shocks. Section 6.1 presents data on the extent of poverty and inequality. Section 6.2 discusses food
security at the household level. Section 6.3 highlights some relevant features of human settlement
patterns. Finally, Section 6.4 discusses the issue of social cohesion and several factors that may
undermine it.
6.1 Poverty and inequality
Poverty renders people more vulnerable to economic shocks, including rising transport and food
costs. Furthermore, a society characterised by a high degree of inequality can be expected to
experience greater social stresses and tensions in times of economic adversity. South Africa has no
official income poverty line. However, The Presidency’s (2008) report Towards a Fifteen Year Review
sets two benchmark poverty lines, at R322 per month and R174 per month (both in 2000 rands). The
poverty headcount rate is the proportion of individuals living in households with an income less than
the poverty line. In 2005, 48% of households earned less than R322 per month; 93% of these people
were African. As shown in Table 3, poverty rates varied greatly by population group; at the upper
poverty line, the poverty rate was highest for Africans (56%) and lowest for whites (0.4%). The
poverty gap is defined as the gap between the average income of poor people and the poverty line.
Poverty rates were higher amongst women and those living in rural areas.
0
1
0
1
2
3
4
5
6
7
8
19
65
19
68
19
71
19
74
19
77
19
80
19
83
19
86
19
89
19
92
19
95
19
98
20
01
20
04
20
07
20
10
% o
f G
DP
Oil Expenditure and Recessions
Recession Oil expenditure/GDP
31
Table 3: Headcount poverty rate and poverty gap ratio, 2005
Headcount rate Poverty gap ratio
Poverty line R322/month R174/month R322/month R174/month
African 56.3% 27.2% 24.4% 8.6%
Coloured 34.2% 12.3% 13.0% 3.9%
Indian/Asian 8.4% 1.6% 2.2% 1.1%
White 0.4% 0.1% 0.1% 0.0%
Total 48% 22.7% 20.6% 7.2%
Source: The Presidency (2008)
Social grants, in the form of the Child Support Grant, the Old-Age Grant and the Disability Grant,
reached 15.6 million recipients as of March 2012 and helped considerably to reduce the poverty rate
from earlier years (The Presidency, 2008: 468; Engineering News, 2012). Despite the extensive social
grants programme, household income and expenditure are highly unequally distributed in South
Africa. The country’s Gini coefficient, a measure of income inequality, stood at 0.679 in 2008 (The
Presidency, 2009).5 This was amongst the highest national rates of inequality in the world.
Table 4: Annual household expenditure on energy, transport and food, 2005/6
Income Energy Transport Food Total
Group R % R % R % R
Decile 1 606 5.3 910 8.0 3,735 32.8 11,381
Decile 2 809 5.8 1,143 8.1 4,638 33.2 13,982
Decile 3 924 5.5 1,315 7.8 5,190 30.9 16,784
Decile 4 1,012 4.9 1,770 8.7 6,108 29.7 20,547
Decile 5 1,062 4.7 2,121 9.3 6,600 28.9 22,819
Decile 6 1,082 3.8 2,778 9.8 7,392 26.1 28,374
Decile 7 1,185 3.3 4,029 11.3 7,904 22.2 35,654
Decile 8 1,544 2.8 5,567 10.1 9,225 16.8 55,055
Decile 9 2,311 2.1 10,349 9.6 11,990 11.1 108,024
Decile 10 3,179 1.3 17,384 7.0 18,267 7.3 248,823
Total 1,371 2.4 4,737 8.4 8,105 14.4 56,152
Rural 1,167 4.6 2,276 8.9 6,334 24.8 25,576
Urban 1,481 2.0 6,055 8.3 9,054 12.5 72,529
Source: StatsSA (2008)
Notes:
Energy includes electricity, gas, liquid and solid fuels used in homes.
Transport includes operation costs including fuel (5.0% of the CPI basket) plus transport
services (3.4% of the CPI basket).
Food includes foodstuffs plus non-alcoholic beverages.
5 The Gini coefficient ranges between 0 (complete equality) and 1 (complete inequality).
32
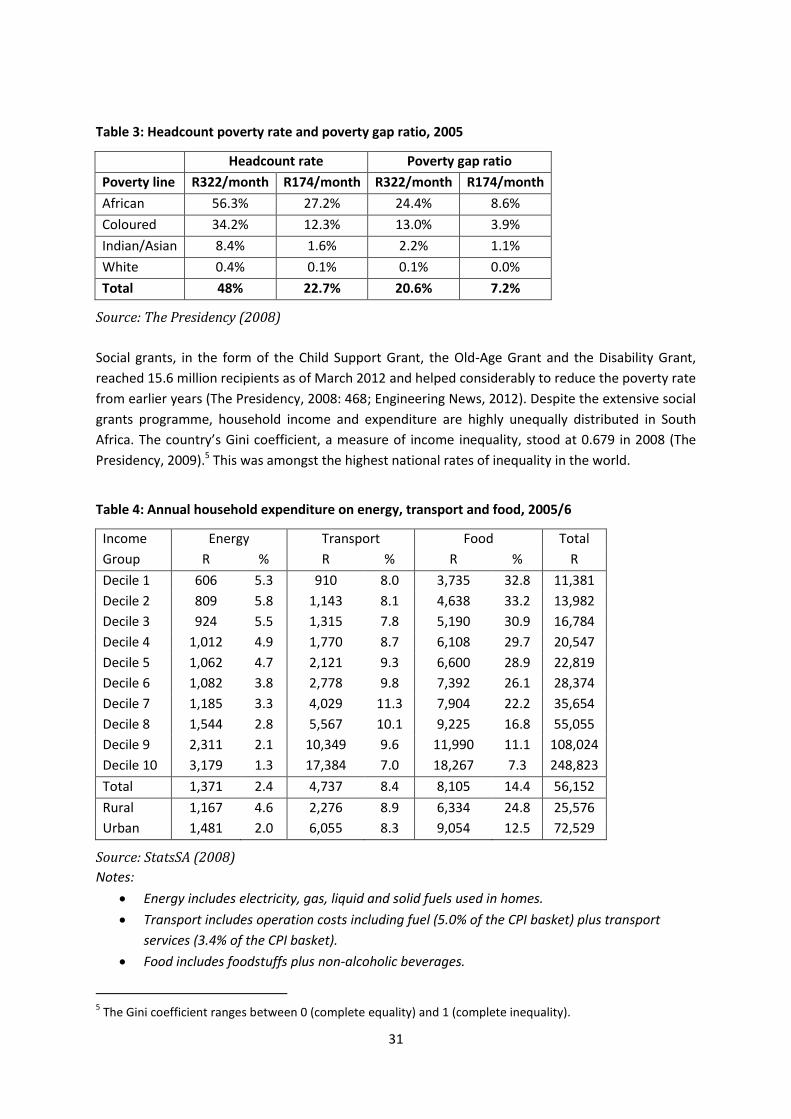
Poorer households are in general more vulnerable to increases in energy, transport and food prices.
Table 4 shows annual expenditures on household energy, transport and food in rands and as a
percentage of total expenditure (exclusive of taxes) for the 10 income deciles in 2005/6. Food is the
largest expenditure item for poorer households, although energy and transport costs are also
significant.
6.2 Household food security
Food security is a vital condition for human well-being and social stability. National food security
(e.g. self-sufficiency in the majority of agricultural commodities, including the main staple, maize) is
no guarantee of food security for individual citizens of the country (Leroy et al, 2001: 6). According
to Maxwell (1996, cited by Hendriks, 2005: 103), there were at least 250 definitions of food security
as of 1996, including “food supply, access, adequacy, utilisation, safety and, in some cases, cultural
acceptability of food for all people at all times.” These various dimension of food security at the
household level may perhaps be distilled to two basic dimensions: the physical availability and the
economic affordability of nutritious foodstuffs. The incidence of food insecurity in South Africa is not
known with any degree of certainty owing to a lack of nationally representative surveys of food
security (Hendriks, 2005: 109). Nevertheless, the available evidence indicates that in the region of
59% to 73% of households experience food insecurity, approximately 16% have an inadequate
energy intake, about 30% experience hunger, and approximately 22% of the population could be
stunted and 3.7% afflicted by wasting (Hendriks, 2005: 115). While the determinants of food
insecurity are numerous and complex, two basic drivers can be identified, reflecting the principal
dimensions referred to above. These are: (1) inadequate income (i.e. poverty) in relation to the cost
of food products; and (2) a lack of access to land, water and other productive inputs required for
own food production. Somewhat ironically, however, hunger and malnutrition in South Africa are
more common in agricultural areas, especially amongst smallholder farmers, agricultural workers
and the landless (Hendriks & Msaki, 2009: 185). This is essentially because the incidence of poverty
is higher in rural areas (Pauw, 2007).
Oil price shocks carry two major threats to household food security. The first is rising food prices,
since food prices are linked to oil prices through input and transport costs. The second threat is of
falling employment levels and incomes as a result of the negative macroeconomic consequences of
oil shocks. These factors act together to reduce the food purchasing power of households (see
Hendriks, 2005: 116).
6.3 Settlement patterns
Human settlement patterns play an important role in South African society’s dependence on liquid
fuel based transport and therefore in its vulnerability to oil supply disruptions and price shocks. The
two predominant features of the country’s settlement patterns are inequality and inefficiency, and
the two aspects are closely linked for historical reasons. Inefficiency in the spatial configuration of
settlements relates largely to the phenomenon of urban sprawl, which occurs in virtually all cities
and metropolitan areas around the country. Approximately 60% of South Africans live in urban areas
(RSA, 2011: 21). Two forms of urban sprawl characterise South Africa’s cities. First, as a result of
apartheid-based urban settlement patterns characterised by remotely located townships, many

33
lower-income citizens tend to reside in informal or formal settlements that are located on urban
peripheries. This pattern was perpetuated by an on-going process of urbanisation, which accelerated
after the democratic transition. The key problem is that these settlements are located far from social
and economic opportunities (The Presidency, 2008: 99). The large distances impose high travel costs,
which are particularly burdensome for residents who are generally poor to begin with. Second, the
majority of more affluent citizens reside in sprawling suburbs that are highly dependent on private
motor vehicles. Both groups generally need to travel substantial distances to access economic and
social opportunities and are therefore vulnerable to rising fuel and transport costs and fuel
shortages. Nevertheless, rural areas are in some ways more dependent on motorised travel than
urban areas, as distances to towns may be larger than distances typically travelled within cities, and
there are less extensive or even non-existent public transport services. In both urban and rural areas,
the persistent inequality in spatial development patterns also contributes to vulnerabilities in social
cohesion, which is discussed in the following section.
6.4 Social cohesion
The ability of a society to withstand social and economic shocks depends inter alia on the degree of
social cohesion. Social cohesion in South Africa is affected by numerous factors including the ethnic
composition of the society, the political dispensation, inequality and poverty, migration and
immigration, and rates of crime and violence. South Africa has enjoyed a stable democracy since
1994 with free and fair elections held every five years since then. The African National Congress has
maintained power throughout this period with a strong majority in the National Assembly. There has
been no widespread, serious political violence in the democratic era. Nevertheless, social tensions
persist after more than eighteen years of democracy, reflecting in part the legacy of a conflict-ridden
Apartheid past and also the persistence of income inequality and poverty (The Presidency, 2008: 29).
Domestic economic and social stresses have been further compounded in recent years by an
increased rate of immigration from other African countries (The Presidency, 2008: 99). Immigration
has been driven both by push factors (such as political, social and economic upheavals in their home
countries) as well as pull factors (e.g. the relative size and strength of South Africa’s economy in the
context of Southern Africa). This immigration placed extra strain on already over-stretched social
services and aggravated social tensions, as evidenced by the so-called ‘xenophobic’ violence that
erupted in many parts of the country in May 2008 (Sharp, 2008). More generally, South African
society is characterised by unacceptably high rates of crime, especially violent crimes such as
murder, rape, assault and robbery (The Presidency, 2009: 59). The causes of crime are complex and
multifarious, and include the high rate of unemployment, especially among young males, as well as
the related high incidence of inequality and poverty.
7. Summary
South Africa’s strengths and vulnerabilities vis-à-vis oil shocks in each of the five socioeconomic
subsystems are summarised in Table 5. These subsystems are not isolated from one another, but are
connected by many linkages and feedbacks, which in many ways intensify the dependencies on oil
and magnify the vulnerabilities to oil shocks.

34
Table 5: Summary of strengths, vulnerabilities, and likely impacts of oil shocks
Subsystem Strengths Vulnerabilities Impacts
Energy relatively low oil dependence (17% of primary energy)
domestic synthetic fuels production (34% of liquid fuels)
electricity minimally dependent on imported oil
large coal & uranium reserves
abundant solar resources
substantial wind resources
high oil import dependency (66% of petroleum fuels)
risk of dependence on Iran & Saudi Arabia for 50% of crude oil imports
import parity pricing for locally produced synthetic fuels
fuel distribution bottlenecks
insufficient strategic stocks
road dependence of coal deliveries
possible interruptions to supply of crude oil and refined fuel imports
possible disruptions to supply of coal to power stations
higher cost of fuel for open cycle gas turbines
Transport extensive road network
rail network connects major urban centres
several major ports to facilitate cheaper transport and trade (for coastal settlements)
potential for greater bicycle use
development of integrated rapid transit systems in metropolitan areas
extremely high dependence on petroleum fuels (98%)
very high reliance on roads for freight and passenger transport
inadequate public transport
large distances between major cities
large distances from trading partner countries
poor maintenance of road and rail networks
aged rail rolling stock
lack of domestic locomotive manufacturing capacity
violent elements in taxi industry
rising costs of passenger & freight transport
constrained mobility of passengers
rising costs of road maintenance
possible interruptions to freight logistics
Agriculture self-sufficient in most commodities, including main staple maize (most years)
some subsistence agriculture
some underutilised land available
high petroleum dependence (67% of energy)
highly oil-intensive farming
key input prices linked to oil
small percentage (13%) of land area is arable
generally poor soil quality
low rainfall & recurring droughts
rising input costs (diesel, fertilizers, pesticides, packaging materials)
disruptions to farming activities
possible rise in commercial farm bankruptcies
higher transport costs curb agricultural exports
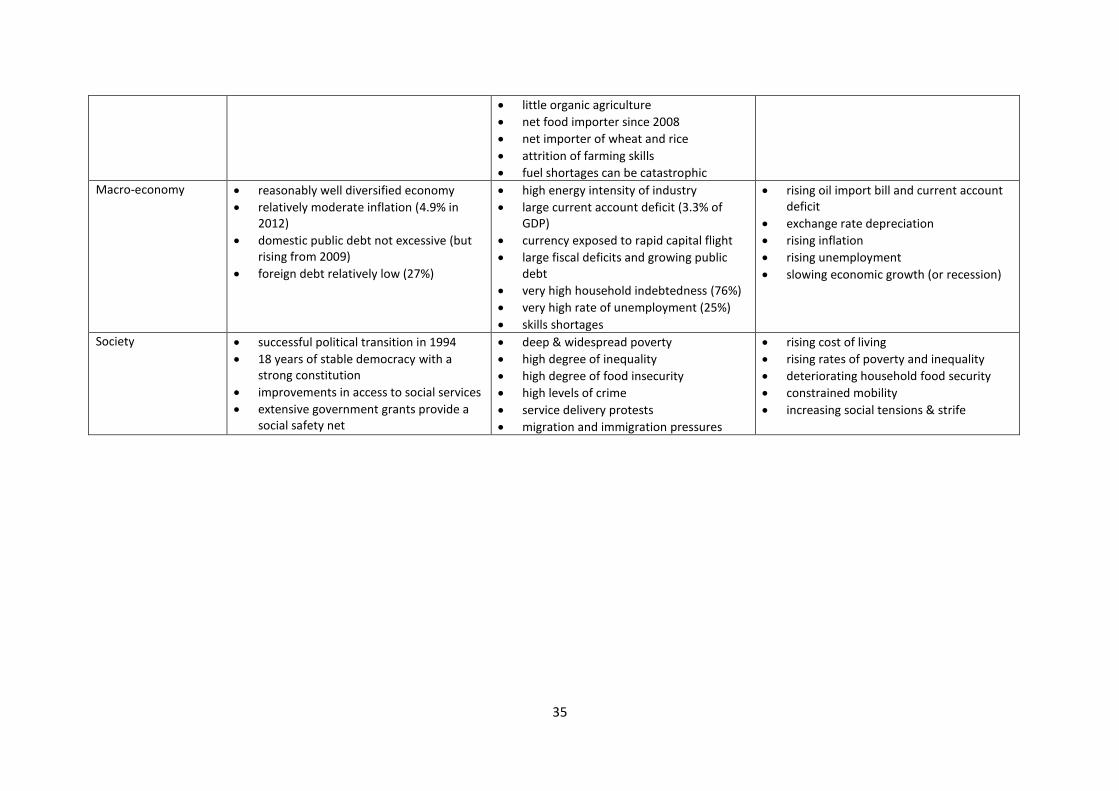
35
little organic agriculture
net food importer since 2008
net importer of wheat and rice
attrition of farming skills
fuel shortages can be catastrophic
Macro-economy reasonably well diversified economy
relatively moderate inflation (4.9% in 2012)
domestic public debt not excessive (but rising from 2009)
foreign debt relatively low (27%)
high energy intensity of industry
large current account deficit (3.3% of GDP)
currency exposed to rapid capital flight
large fiscal deficits and growing public debt
very high household indebtedness (76%)
very high rate of unemployment (25%)
skills shortages
rising oil import bill and current account deficit
exchange rate depreciation
rising inflation
rising unemployment
slowing economic growth (or recession)
Society successful political transition in 1994
18 years of stable democracy with a strong constitution
improvements in access to social services
extensive government grants provide a social safety net
deep & widespread poverty
high degree of inequality
high degree of food insecurity
high levels of crime
service delivery protests
migration and immigration pressures
rising cost of living
rising rates of poverty and inequality
deteriorating household food security
constrained mobility
increasing social tensions & strife
36
8. References
Aliber, M. & Hart, T.G. 2009. Should Subsistence Agriculture be Supported as a Strategy to Address
Rural Food Insecurity? Agrekon, 48(4), 434-458.
ASPO-SA, Vanderschuren, M. & Lane, T.E. 2008. Energy and Transport Status Quo. Research report
submitted to the National Department of Transport. Cape Town: Association for the Study of
Peak Oil - South Africa.
Baiphethi, M.N. & Jacobs, P.T. 2009. The Contribution of Subsistence Farming to Food Security in
South Africa. Agrekon, 48(4), 459-482.
BP. 2011. Statistical Review of World Energy 2011. London: BP plc.
CSIR. 2010. 6Th Annual State of Logistics Survey for South Africa 2009. Pretoria: Council for Scientific
and Industrial Research.
CSIR. 2012. 8th Annual State of Logistics Survey for South Africa 2011. Pretoria: Council for Scientific
and Industrial Research.
DAFF (Department of Agriculture, Forestry & Fishing). 2012. Abstract of Agricultural Statistics.
Pretoria: DAFF.
Davenport, J. 2010. New fund considered to tackle R75bn road maintenance backlog. Engineering
News. [Online]. Available: http://www.engineeringnews.co.za/article/new-fund-considered-to-
tackle-r75bn-road-maintenance-backlog-2010-04-13
DME. 2007. Energy Security Master Plan - Liquid Fuels. Pretoria: Department of Minerals and Energy.
DoE. 2012. Energy Balances for South Africa. Pretoria: Department of Energy. [Online]. Available:
http://www.energy.gov.za/files/media/media_energy_balances.html
DoT. 2005. Key Results of the National Household Travel Survey 2003. Pretoria: Department of
Transport.
DoT. 2008. National Transport Master Plan 2005 - 2050. Volume 1, Status Quo. Pretoria: Department
of Transport.
EIA. 2011. South Africa Country Analysis Brief. Washington, D.C.: US Energy Information
Administration.
EIA. 2012. International Energy Statistics. US Energy Information Administration. [Online]. Available:
http://www.eia.doe.gov/emeu/international/contents.html
37
eNatis. 2012. Live Vehicle Population. National Traffic Information Service. [Online]. Available:
http://www.enatis.com
Engineering News, 2012. SA says debt rising, welfare spend sustainable. 21/08/2012. [Online].
Available: http://www.engineeringnews.co.za/article/sa-says-rising-debt-welfare-spend-
sustainable-2012-08-21
FAO. 2005. Fertilizer use by Crop in South Africa. Rome: Food and Agriculture Organisation.
Fischer-Kowalski, M. & Swilling, M. 2011. Decoupling Natural Resource use and Environmental
Impacts from Economic Growth. Paris: United Nations Environment Programme.
GCIS. 2009. South Africa Yearbook 2008/09. Pretoria: Government Communication and Information
System.
Hendriks, S.L. 2005. The Challenges Facing Empirical Estimation of Household Food (in)Security in
South Africa. Development Southern Africa, 22(1), 103-123.
Hendriks, S.L. & Msaki, M.M. 2009. The Impact of Smallholder Commercialisation of Organic Crops
on Food Consumption Patterns, Dietary Diversity and Consumption Elasticities. Agrekon, 48(2),
184-199.
IEA. 2012. Statistics and Balances. International Energy Agency. [Online]. Available:
http://www.iea.org/stats/index.asp
IMF. 2012. International Financial Statistics. Washington, D.C.: International Monetary Fund.
Institute of Natural Resources. 2008. Study to Develop a Value Chain Strategy for Sustainable
Development and Growth of Organic Agriculture. Investigational Report No. IR285. Scottsville:
Institute of Natural Resources.
Lane, T.E. 2009. Assessing Sustainability and Energy Efficiency Improvement Measures in Freight
Transportation. Proceedings of the 28Th Southern African Transport Conference (SATC 2009). 6-
9 July.
Leroy, J.L.J.P., van Rooyen, J., D’Haese, L. & de Winter, A. 2001. A Quantitative Determination of the
Food Security Status of Rural Farming Households in the Northern Province of South Africa.
Development Southern Africa, 18(1), 5-17.
Mahlalela, G. 2010. Statement by Transport Director-General Mr. George Mahlalela at the Media
Briefing on South Africa’s Rail Investment Programme. Pretoria. Department of Transport.
Mather, C. 2005. The Growth Challenges of Small and Medium Enterprises (SMEs) in South Africa's
Food Processing Complex. Development Southern Africa, 22(5), 607-622.

38
Modi, A.T. 2003. What do subsistence farmers know about indigenous crops and organic farming?
Preliminary experience in KwaZulu-Natal. Development Southern Africa, 20(5), 675-684.
NDA. 2009a. Abstract of Agricultural Statistics 2009. Pretoria: National Department of Agriculture.
NDA. 2009b. Trends in the Agricultural Sector 2008. Pretoria: National Department of Agriculture.
NDA. 2009c. Economic Review of the South African Agriculture 2008. Pretoria: National Department
of Agriculture.
Niemeyer, K. & Lombard, J. 2003. Identifying Problems and Potential of the Conversion to Organic
Farming in South Africa. Unpublished paper. Paper Presented at the 41st Annual Conference of
the Agricultural Economic Association of South Africa (AEASA). Pretoria.
Pauw, K.W. 2007. Agriculture and Poverty: Farming for Food Or Farming for Money? Agrekon, 46(2),
195-218.
PetroSA. 2010. Annual Report 2010. Cape Town: PetroSA.
RSA. 2011. National Climate Change Response White Paper. Pretoria: Government of the Republic of
South Africa.
Rubin, J. 2009. Why Your World is about to Get a Whole Lot Smaller: Oil and the End of Globalisation.
New York: Random House.
SAPIA. 2011. Annual Report 2011. Johannesburg: South African Petroleum Industry Association.
[Online]. Available: http://www.sapia.co.za
SARB. 2012. Quarterly Bulletin. June. Pretoria: South African Reserve Bank.
Sasol. 2010. Sasol Facts 2010. Johannesburg: Sasol Limited.
Sharp, J. 2008. ‘Fortress SA’: Xenophobic Violence in South Africa. Anthropology Today, 24(4), 1-3.
Situma, L.N. 2007. Expectations of the National Transport Master Plan. Proceedings of the 26Th
Southern African Transport Conference. Pretoria. July 2007.
StatsSA. 2008. Income and Expenditure Survey 2005/2006. Pretoria. Statistics South Africa.
StatsSA (Statistics South Africa). 2012. StatsOnline. [Online]. Available: http://www.statssa.gov.za
The Presidency. 2008. Towards a Fifteen Year Review. Pretoria: Republic of South Africa.
The Presidency. 2009. Development Indicators 2009. Pretoria: Republic of South Africa.
Wakeford, J.J. 2012. Implications of global oil depletion for South Africa: vulnerabilities, impacts and
transition to sustainability. PhD Dissertation, Stellenbosch University, South Africa.