Embed Size (px)
Citation preview
Oil Spill Detection by SAR and Lidar system
Chaofang ZHAOOcean Remote Sensing InstituteOcean Remote Sensing Institute
Ocean University of China
11 November 2013
2013‐11‐11 1
OutlineOutline
• Introduction
• Oil spill detection by visible/infrared sensorsOil spill detection by visible/infrared sensors
• Oil spill detection by Synthetic Aperture Radar
• Oil spill detection by Lidar
• RemarksRemarks
2013‐11‐11 2
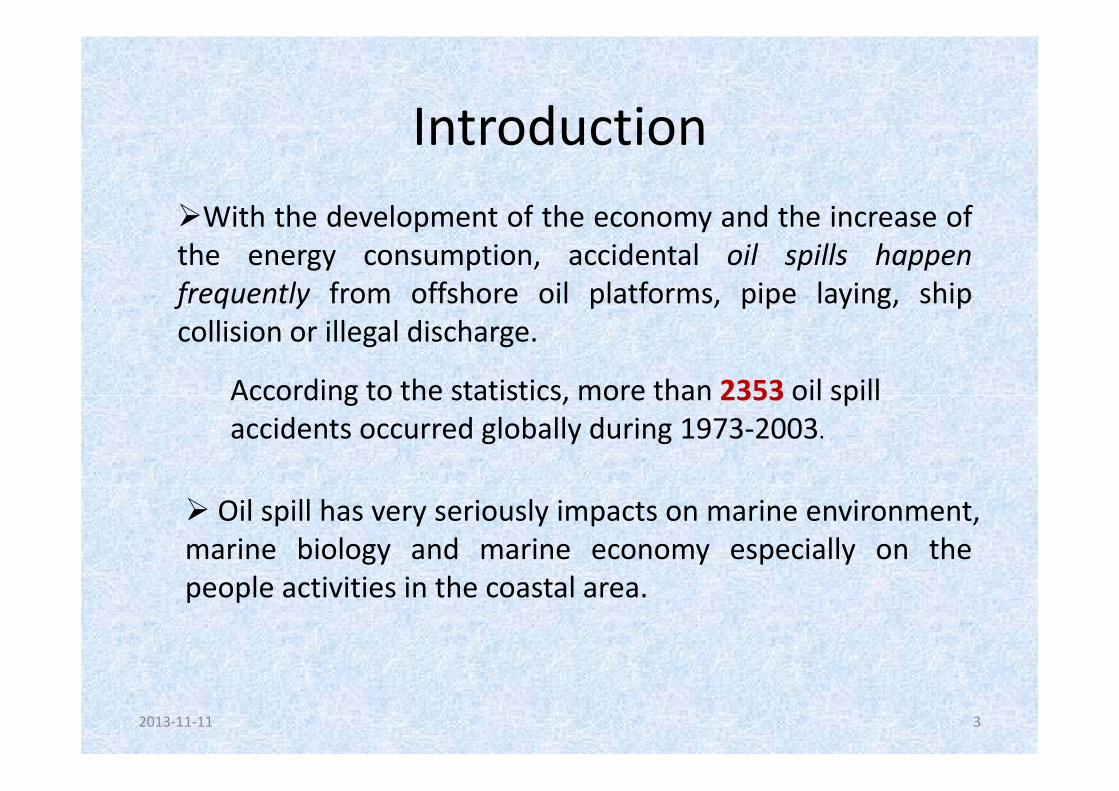
IntroductionIntroductionWith the development of the economy and the increase ofWith the development of the economy and the increase of
the energy consumption, accidental oil spills happenfrequently from offshore oil platforms, pipe laying, shipf q y p , p p y g, pcollision or illegal discharge.
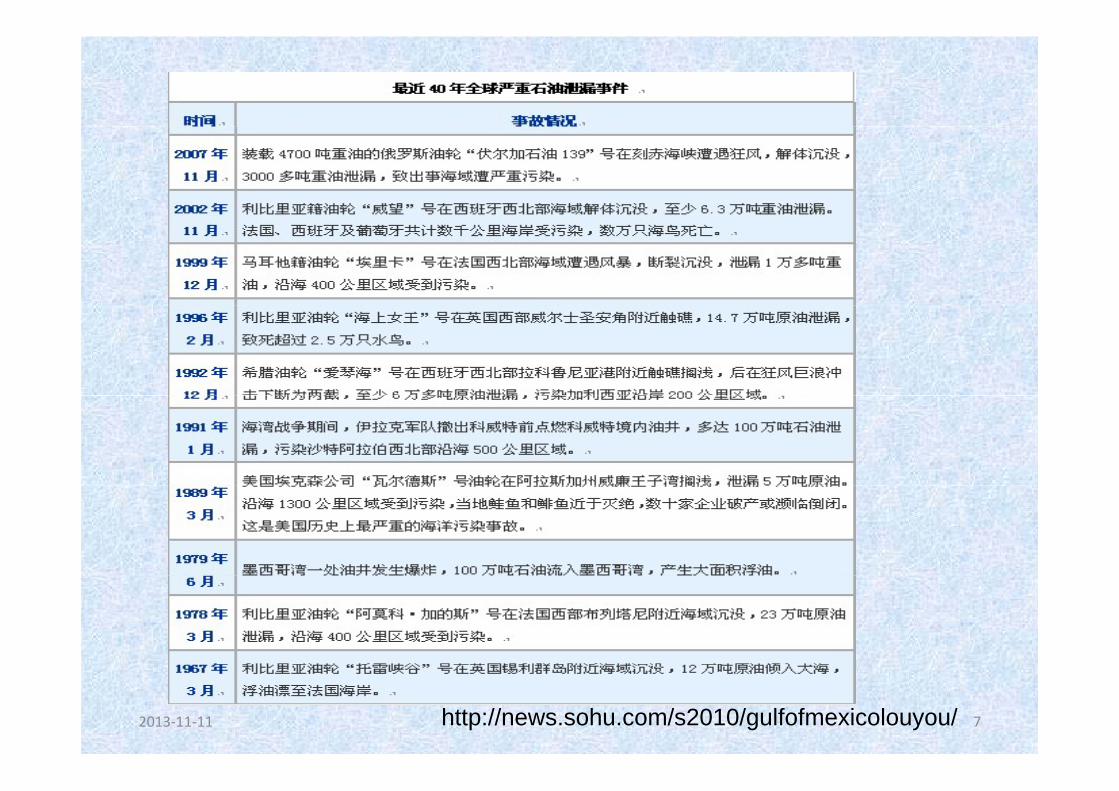
According to the statistics more than 2353 oil spillAccording to the statistics, more than 2353 oil spill accidents occurred globally during 1973‐2003.
Oil spill has very seriously impacts on marine environment,marine biology and marine economy especially on thepeople activities in the coastal area.
2013‐11‐11 3
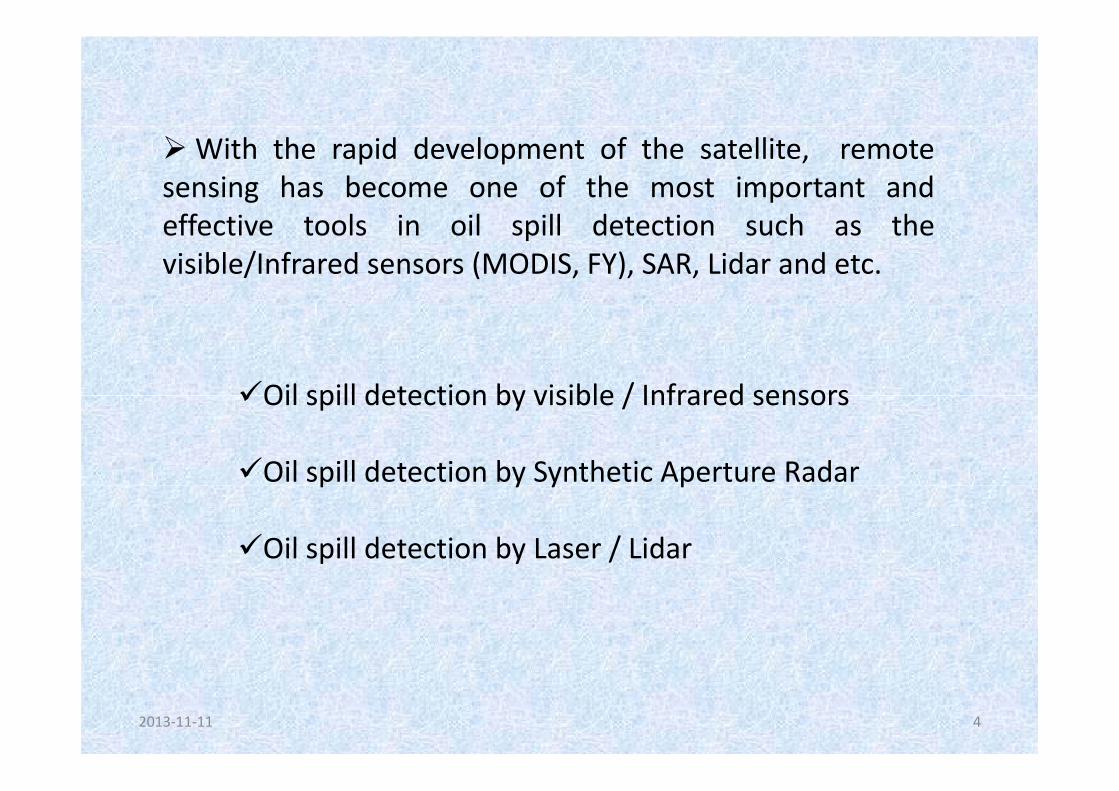
With the rapid development of the satellite, remotesensing has become one of the most important andff i l i il ill d i h heffective tools in oil spill detection such as thevisible/Infrared sensors (MODIS, FY), SAR, Lidar and etc.
Oil spill detection by visible / Infrared sensorsOil spill detection by visible / Infrared sensors
Oil spill detection by Synthetic Aperture Radarp y y p
Oil spill detection by Laser / Lidar
2013‐11‐11 4
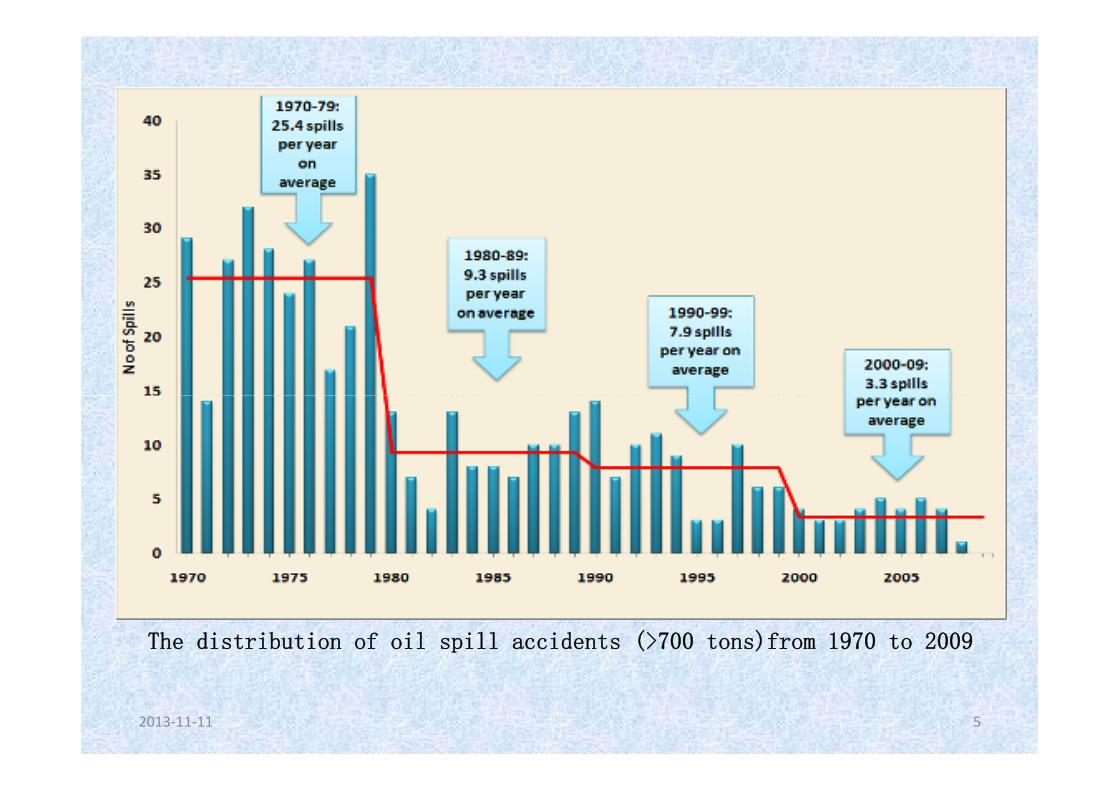
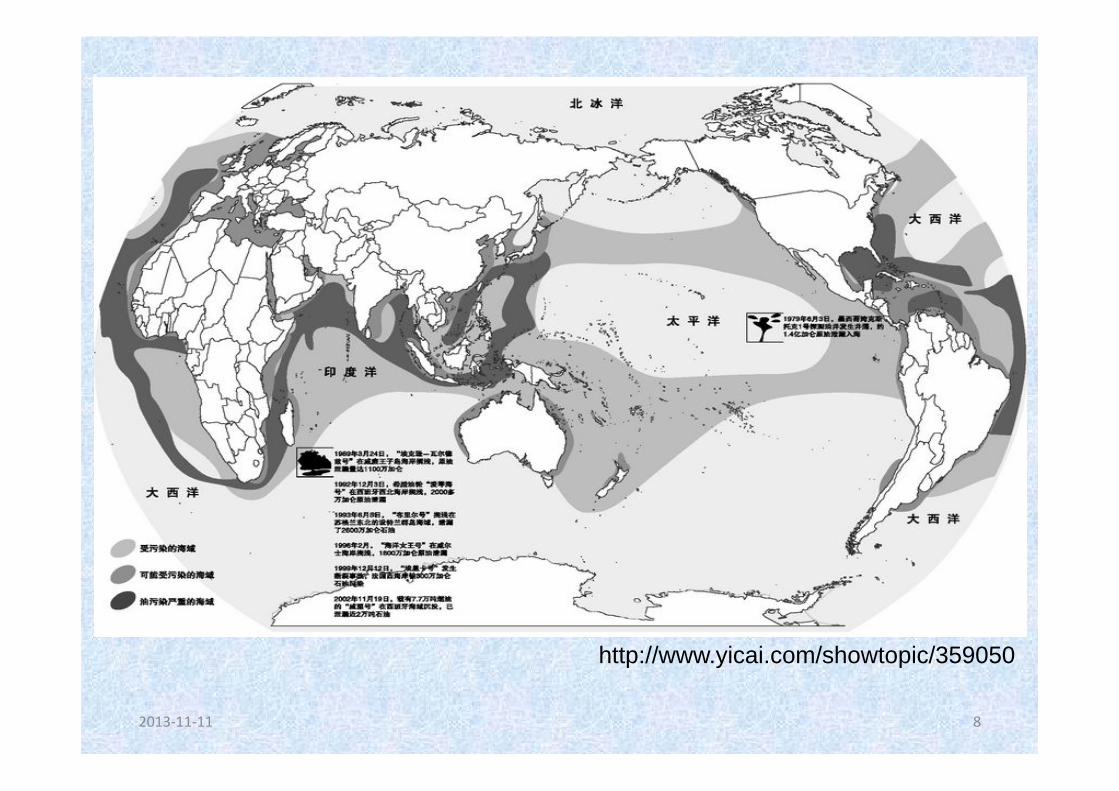
The distribution of oil spill accidents (>700 tons)from 1970 to 2009
2013‐11‐11 5
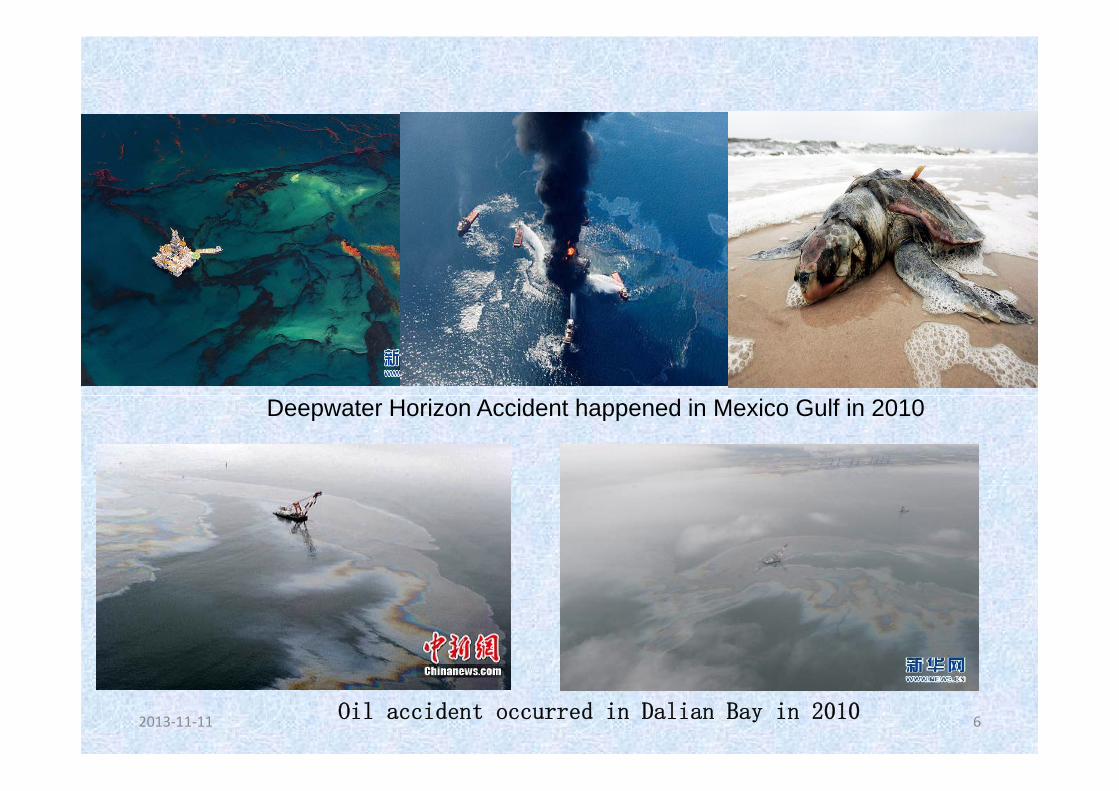
Deepwater Horizon Accident happened in Mexico Gulf in 2010
2013‐11‐11 6Oil accident occurred in Dalian Bay in 2010
2013‐11‐11 7http://news.sohu.com/s2010/gulfofmexicolouyou/
http://www.yicai.com/showtopic/359050
2013‐11‐11 8
p y p
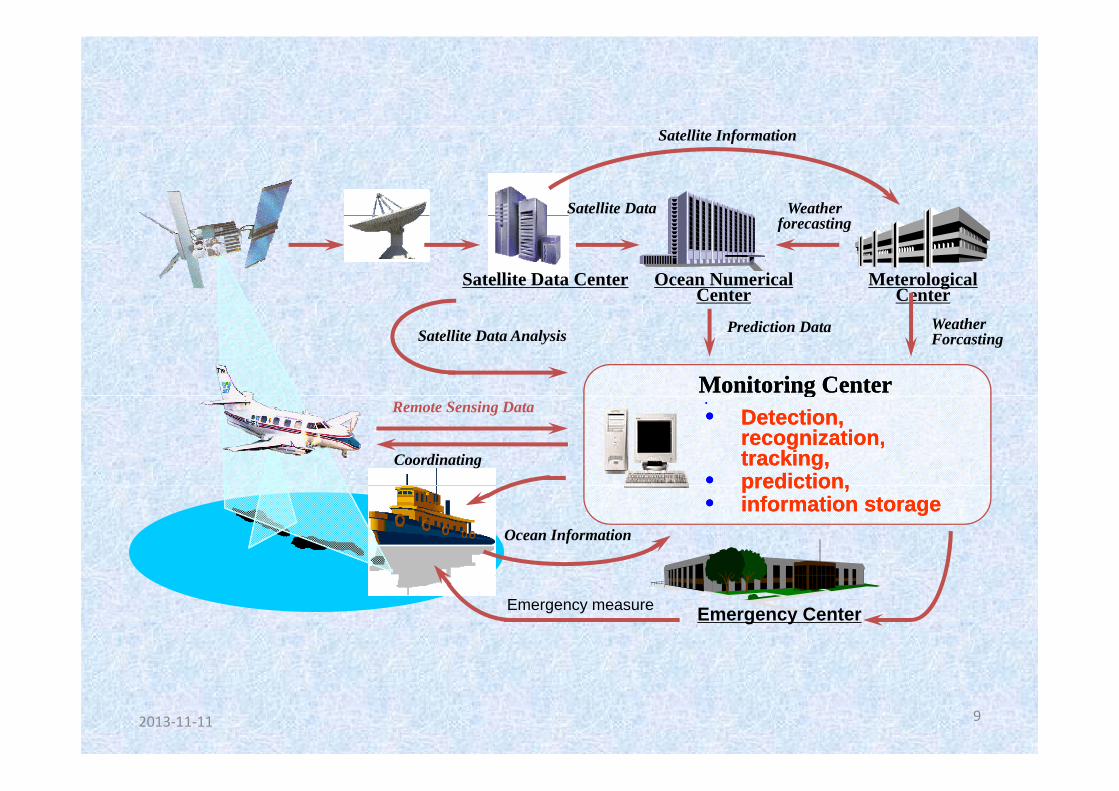
Weather
Satellite Information
Satellite Data
MeterologicalCenter
Ocean Numerical Center
Satellite Data Center
forecasting
Monitoring CenterMonitoring Center
Weather Forcasting
Prediction DataSatellite Data Analysis
••
•• Detection, Detection, recognizationrecognization, , tracking, tracking,
•• prediction,prediction,
ggRemote Sensing Data
Coordinatingprediction, prediction,
•• information storageinformation storageOcean Information
Emergency CenterEmergency measure
2013‐11‐11 9
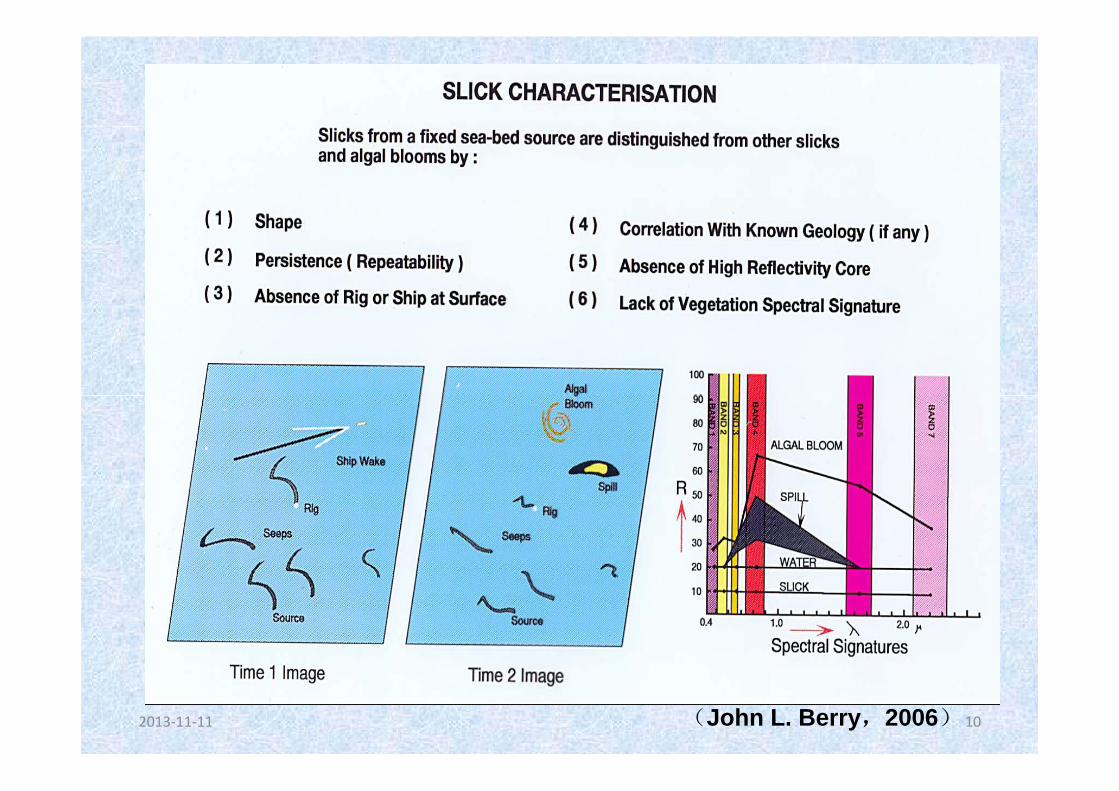
2013‐11‐11 10(John L. Berry,2006)
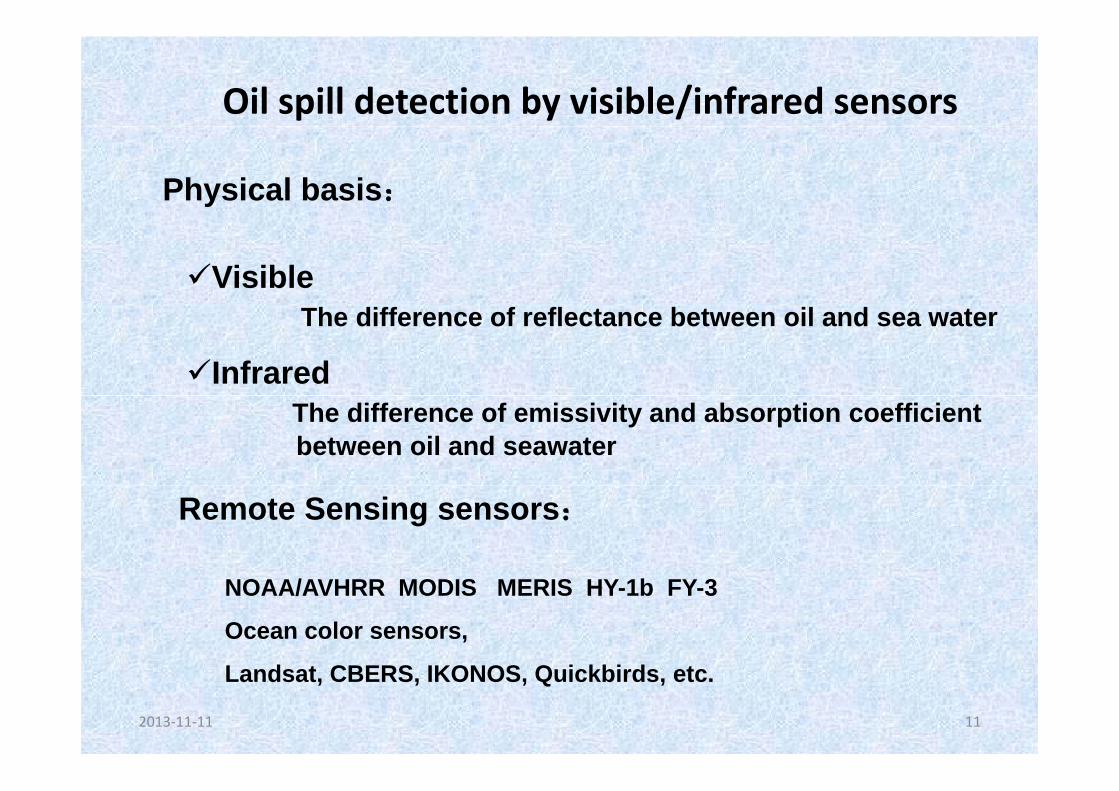
Oil spill detection by visible/infrared sensors
Physical basis:
Visible The difference of reflectance between oil and sea water
InfraredThe difference of emissivity and absorption coefficient between oil and seawater
Remote Sensing sensors:
NOAA/AVHRR MODIS MERIS HY-1b FY-3
Ocean color sensors,
L d CBERS IKONOS Q i kbi d
2013‐11‐11 11
Landsat, CBERS, IKONOS, Quickbirds, etc.
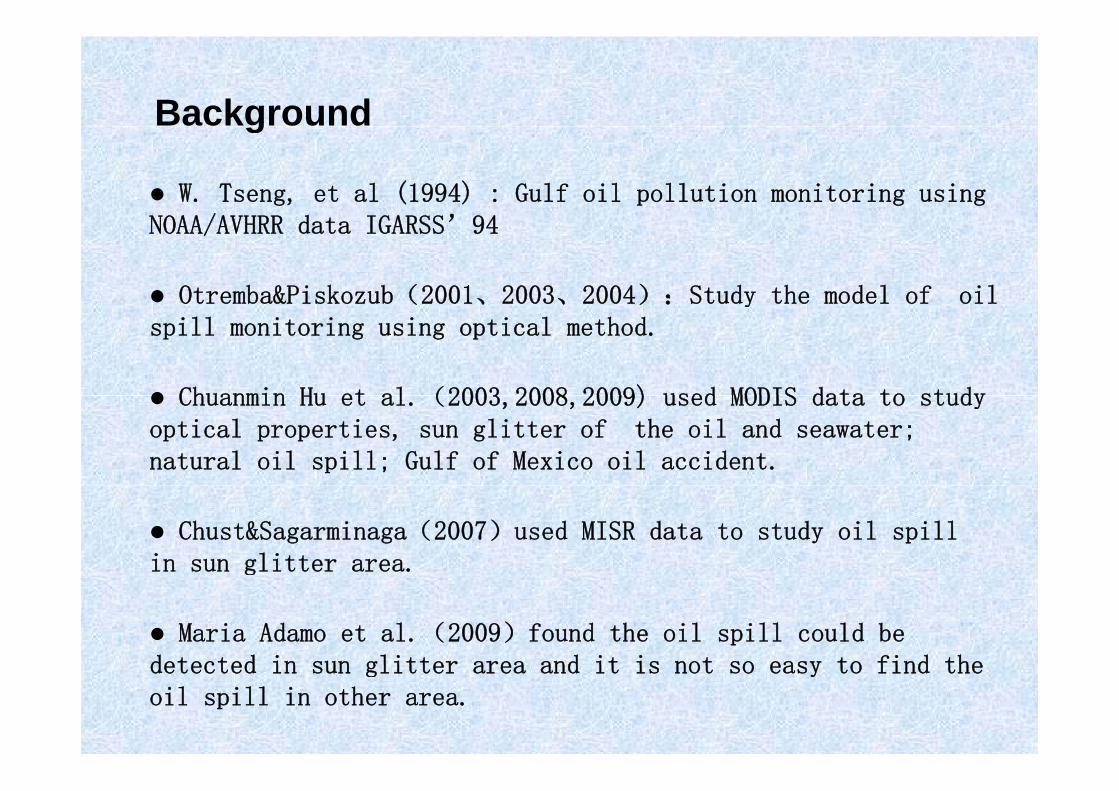
Backgroundg
W. Tseng, et al (1994) : Gulf oil pollution monitoring usingNOAA/AVHRR d IGARSS’94
Otremba&Piskozub(2001、2003、2004):Study the model of oil
NOAA/AVHRR data IGARSS’94
Chuanmin Hu et al (2003 2008 2009) used MODIS data to study
yspill monitoring using optical method.
Chuanmin Hu et al.(2003,2008,2009) used MODIS data to study optical properties, sun glitter of the oil and seawater; natural oil spill; Gulf of Mexico oil accident.
Chust&Sagarminaga(2007)used MISR data to study oil spill in sun glitter area.g
Maria Adamo et al.(2009)found the oil spill could be detected in sun glitter area and it is not so easy to find thedetected in sun glitter area and it is not so easy to find the oil spill in other area.
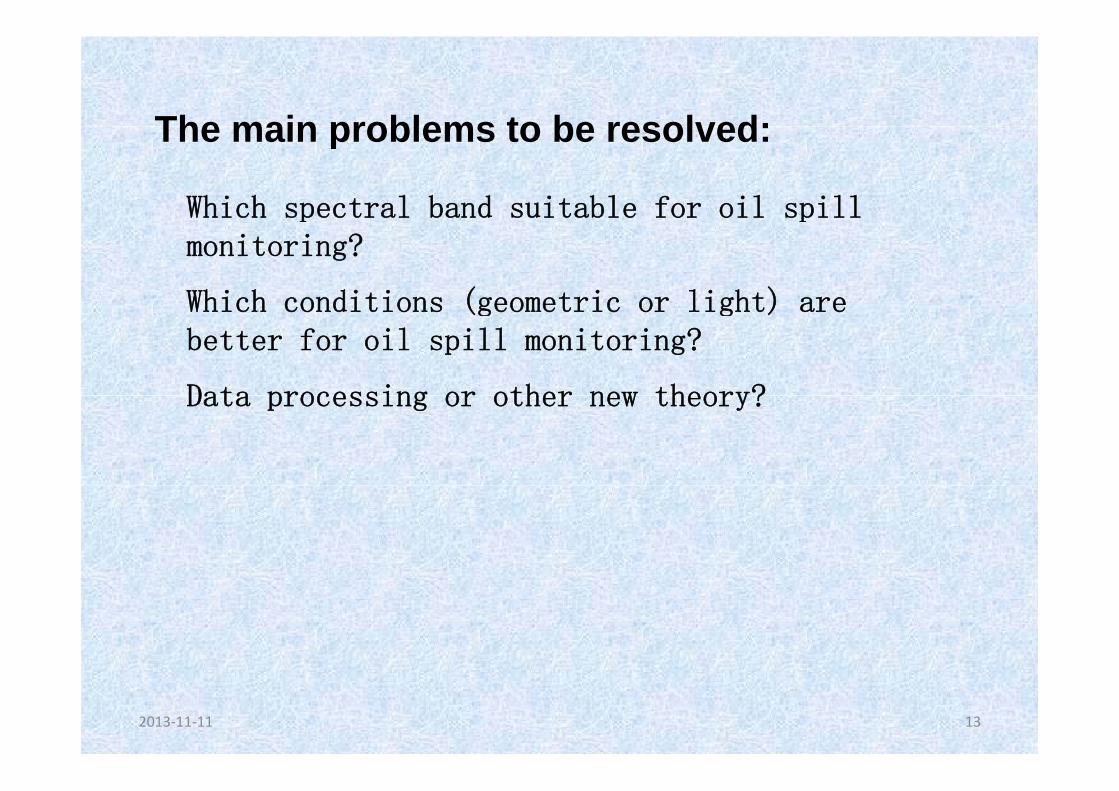
The main problems to be resolved:
Which spectral band suitable for oil spill
The main problems to be resolved:
Which spectral band suitable for oil spill monitoring?
Which conditions (geometric or light) areWhich conditions (geometric or light) are better for oil spill monitoring?
Data processing or other new theory?Data processing or other new theory?
2013‐11‐11 13
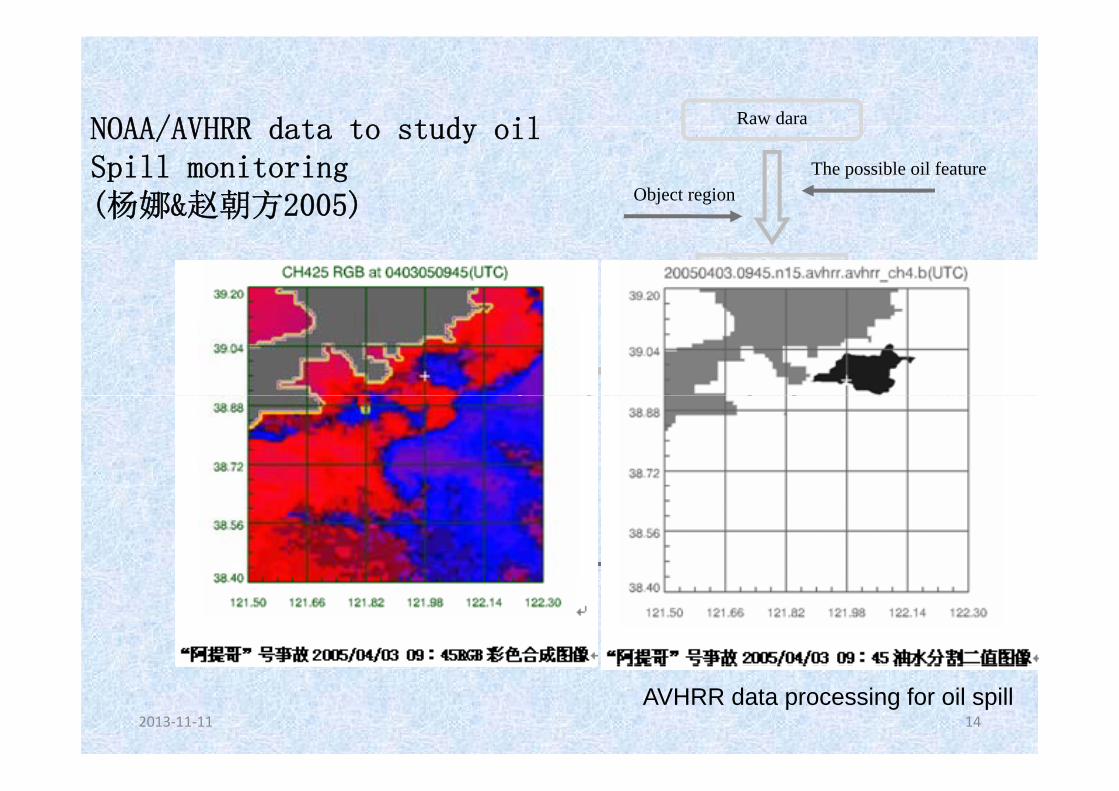
NOAA/AVHRR data to study oil Raw daraNOAA/AVHRR data to study oil Spill monitoring(杨娜&赵朝方2005)
The possible oil featureObject region(杨娜 赵朝方 )
Oil spill image
t t hstretch Image processingChannel cal.
Ratio,Difference RGB
BW iOil/water classified
BW image
Reflectance, grey, amount relation
Area, amount
2013‐11‐11 14AVHRR data processing for oil spill
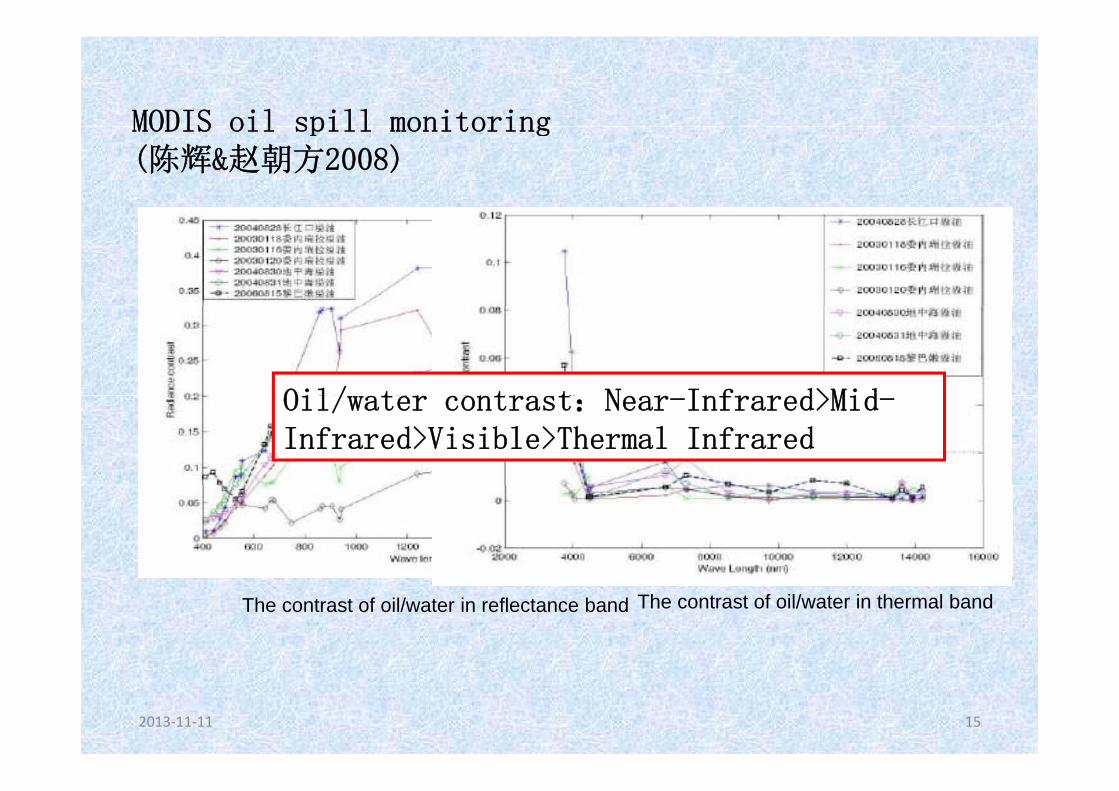
MODIS oil spill monitoringMODIS oil spill monitoring(陈辉&赵朝方2008)
Oil/ t t t N I f d>MidOil/water contrast:Near-Infrared>Mid-Infrared>Visible>Thermal Infrared
The contrast of oil/water in reflectance band The contrast of oil/water in thermal band
2013‐11‐11 15
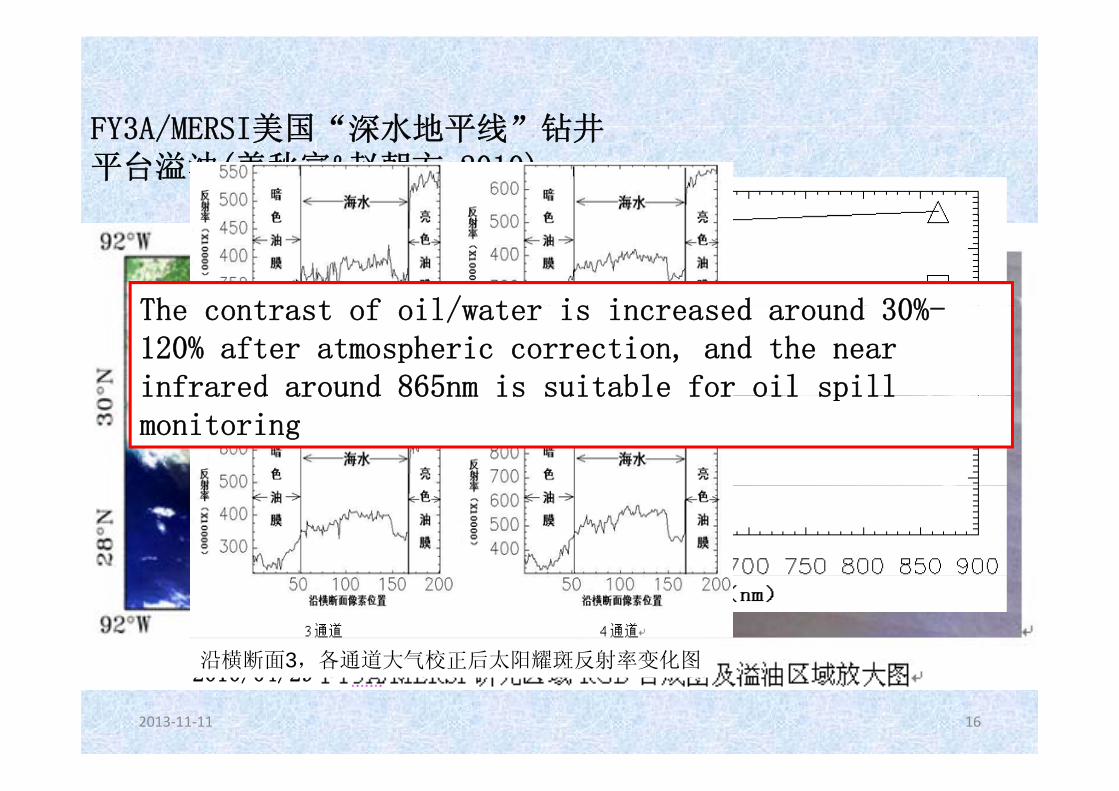
FY3A/MERSI美国“深水地平线”钻井FY3A/MERSI美国 深水地平线 钻井平台溢油(姜秋富&赵朝方 2010)
The contrast of oil/water is increased around 30%The contrast of oil/water is increased around 30%-120% after atmospheric correction, and the near infrared around 865nm is suitable for oil spillinfrared around 865nm is suitable for oil spill monitoring
2010/04/29沿横断面3,各通道大气校正后太阳耀斑反射率变化图
2013‐11‐11 16
2010/04/29沿横断面3,各通道大气校正后太阳耀斑反射率变化图
2013‐11‐11 17
星载红外数据应用于大型事故溢油 杨娜 赵朝方 地理空间信息
The related published papers:
星载红外数据应用于大型事故溢油,杨娜,赵朝方,地理空间信息,2006
Oil spill detection by MODIS images using fuzzy cluster and texture feature extraction, IEEE Oceans 07, Aberdeen, UK, June 18 ‐ 21, 2007(EI) by Lijian Shi, X. Zhang, G. Seielstad, M‐X He, C. Zhaog, , ,
MODIS多光谱信息在海上溢油检测中的应用,陈辉,赵朝方,海洋湖沼通报通报,2009
姜秋富,赵朝方,2011,基于风云三号MERSI数据的溢油检测方法研究,姜秋富,赵朝方,2011,基于风云三号MERSI数据的溢油检测方法研究,海洋湖沼通报,4,pp16‐24。
2013‐11‐11 18
Th i t d bl
The mechanism of oil spill monitoring in
The existed problems:
The mechanism of oil spill monitoring in visible and infrared spectral band.
(geometric, light, sea states)g , g ,
Oil spill monitoring using multi-sensors(MODIS FY3A/MERSI HJ 1A/1B t )(MODIS、FY3A/MERSI、HJ-1A/1B etc)
The possibilities to retrieve the thickness of oil spill using optical sensor, the theoretical model?
2013‐11‐11 19
2013‐11‐11 20
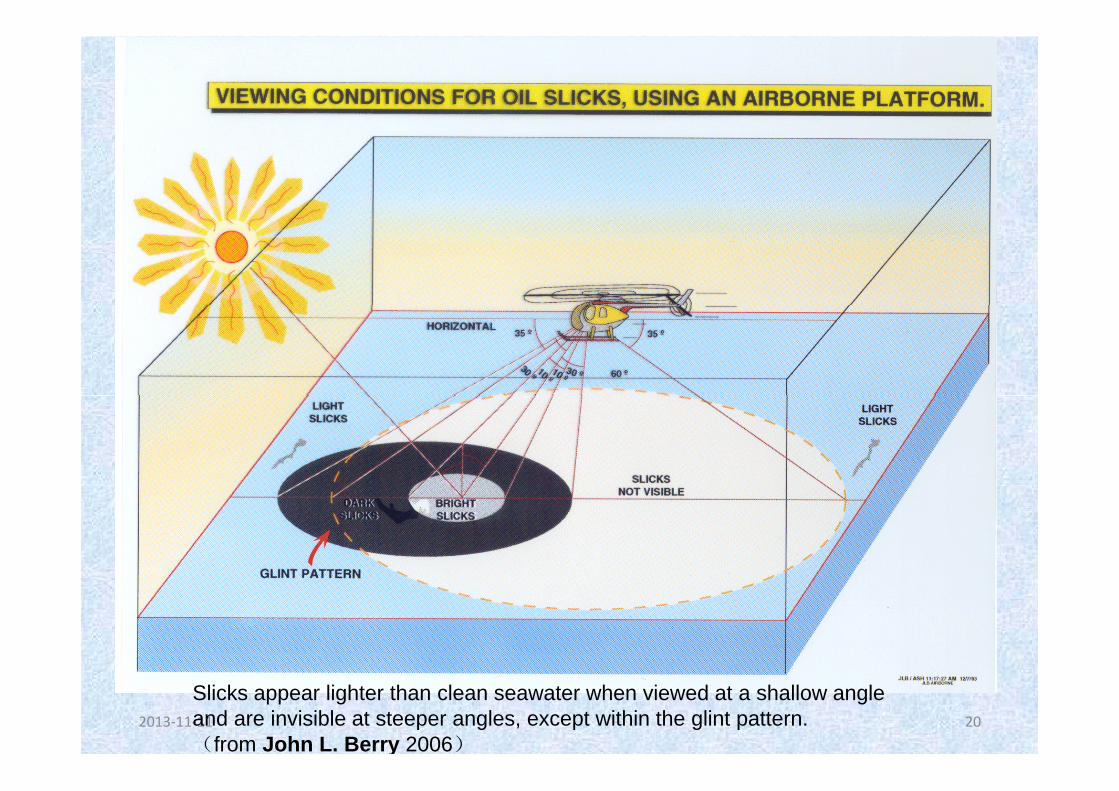
Slicks appear lighter than clean seawater when viewed at a shallow angle and are invisible at steeper angles, except within the glint pattern.(from John L. Berry 2006)
Oil spill detection by SAROil spill detection by SAR
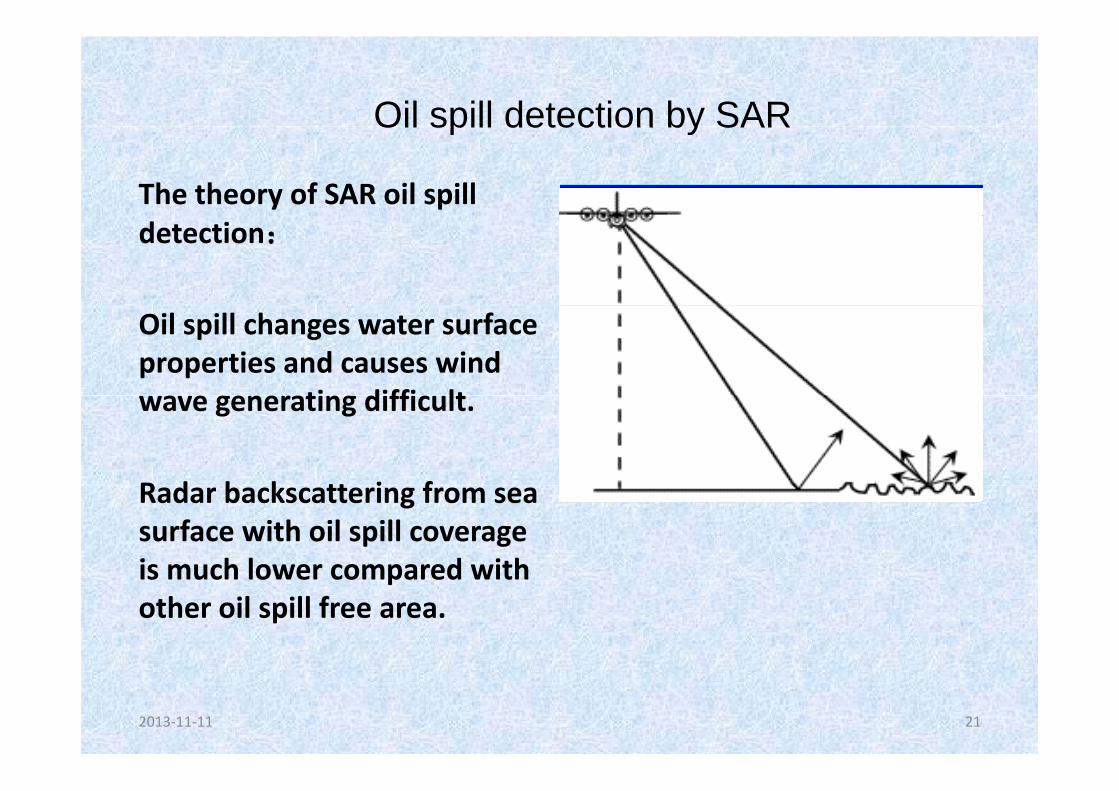
The theory of SAR oil spill detection:
Oil spill changes water surface properties and causes wind a e generating diffic ltwave generating difficult.
R d b k tt i fRadar backscattering from sea surface with oil spill coverage is much lower compared withis much lower compared with other oil spill free area.
2013‐11‐11 21
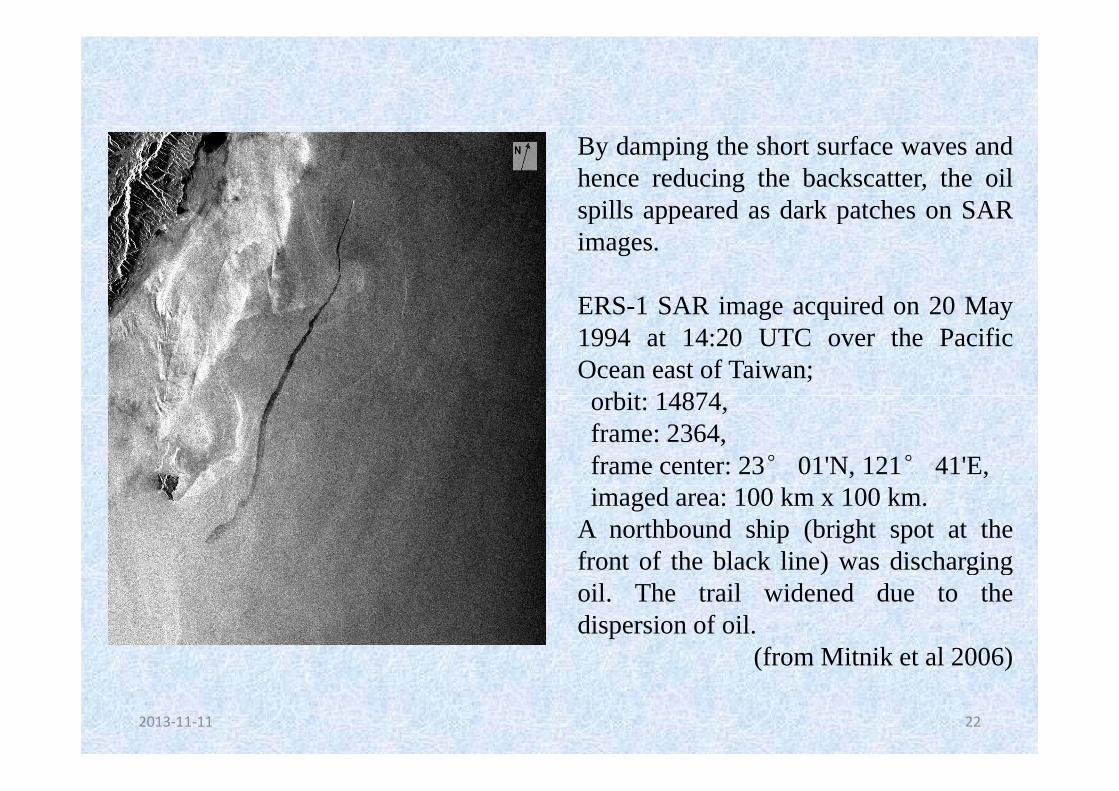
By damping the short surface waves andhence reducing the backscatter, the oilspills appeared as dark patches on SARspills appeared as dark patches on SARimages.
ERS 1 SAR image acquired on 20 MayERS-1 SAR image acquired on 20 May1994 at 14:20 UTC over the PacificOcean east of Taiwan;
bit 14874orbit: 14874,frame: 2364,frame center: 23° 01'N, 121° 41'E,imaged area: 100 km x 100 km.
A northbound ship (bright spot at thefront of the black line) was discharging) g goil. The trail widened due to thedispersion of oil.
(from Mitnik et al 2006)
2013‐11‐11 22
(from Mitnik et al 2006)
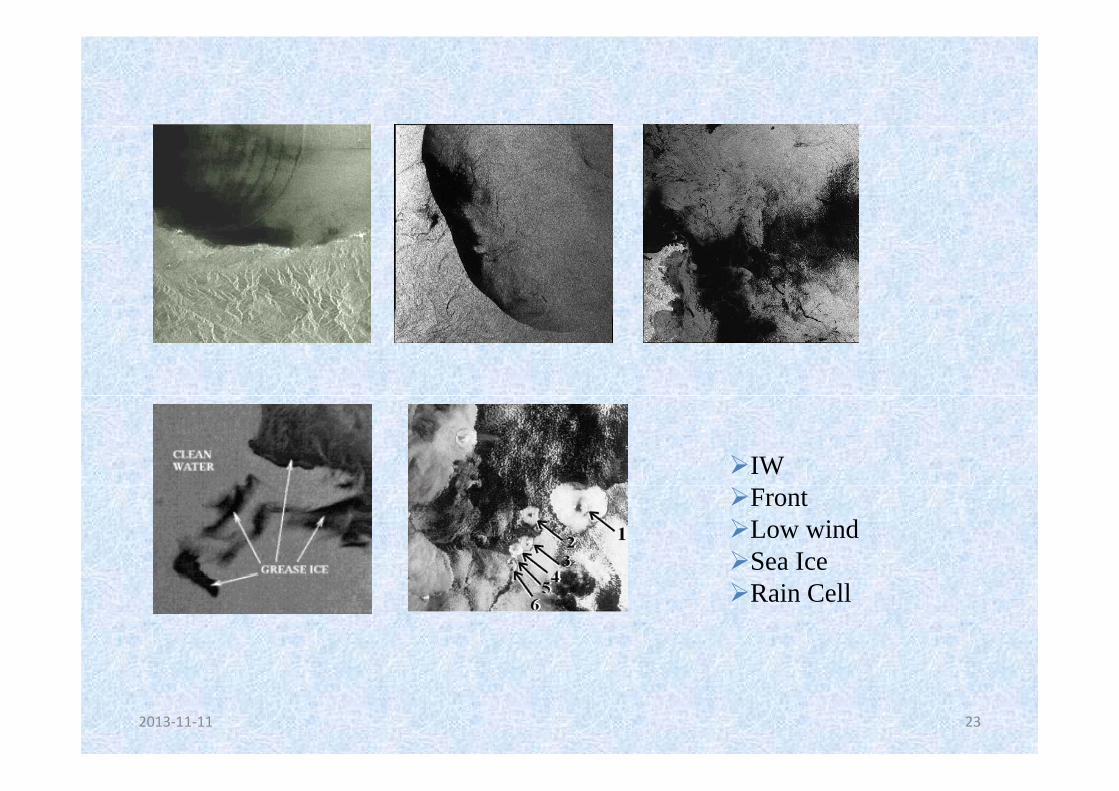
IWFrontLow windSea IceRain Cell
2013‐11‐11 23
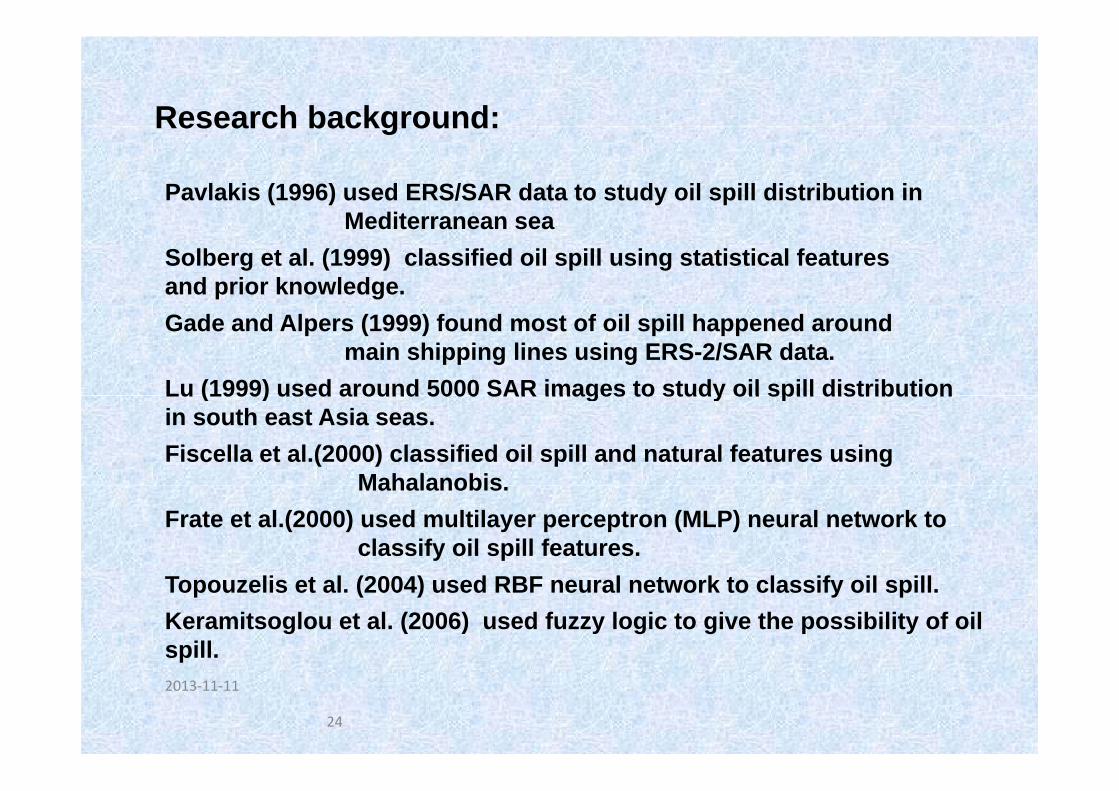
Research background:Research background:
Pavlakis (1996) used ERS/SAR data to study oil spill distribution in M dit
Solberg et al. (1999) classified oil spill using statistical features and prior knowledge.
Mediterranean sea
Gade and Alpers (1999) found most of oil spill happened around main shipping lines using ERS-2/SAR data.
Lu (1999) used around 5000 SAR images to study oil spill distribution
Fiscella et al.(2000) classified oil spill and natural features using Mahalanobis
Lu (1999) used around 5000 SAR images to study oil spill distribution in south east Asia seas.
Mahalanobis.Frate et al.(2000) used multilayer perceptron (MLP) neural network to
classify oil spill features.Topouzelis et al. (2004) used RBF neural network to classify oil spill.Keramitsoglou et al. (2006) used fuzzy logic to give the possibility of oilspill. 2013‐11‐11
24
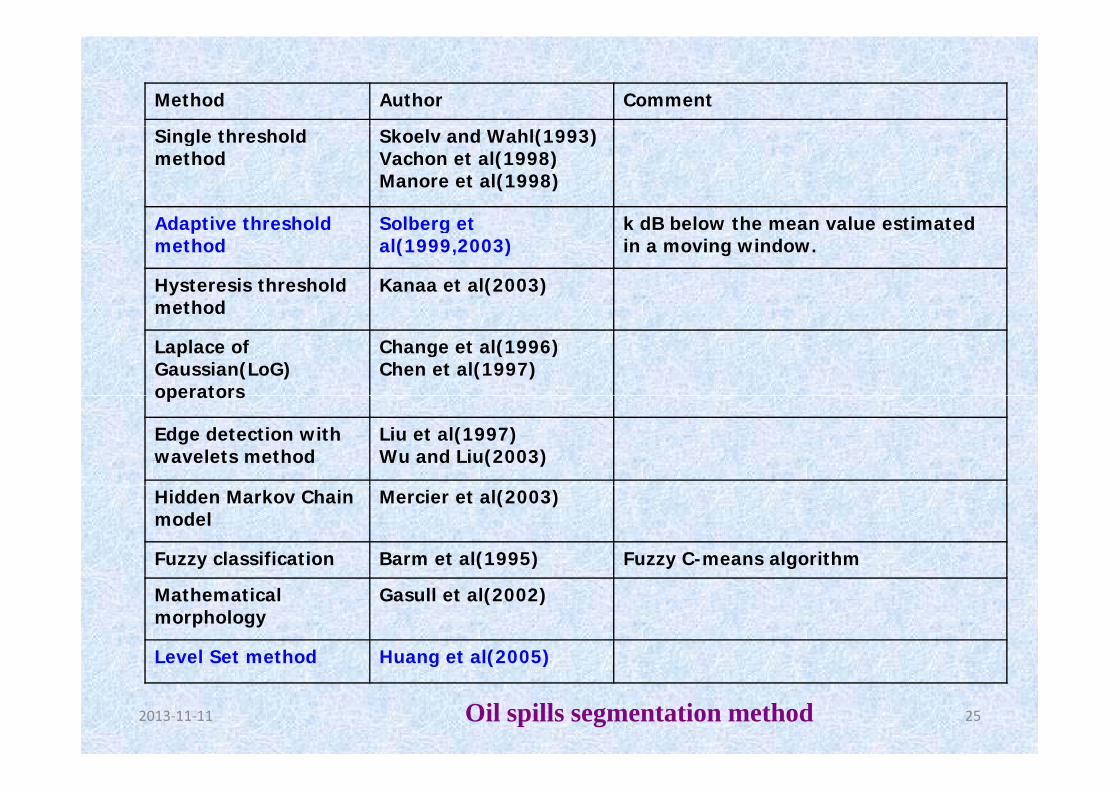
Method Author Comment
Single threshold method
Skoelv and Wahl(1993)Vachon et al(1998)Manore et al(1998)
d i h h ld lb k d b l h l i dAdaptive threshold method
Solberg et al(1999,2003)
k dB below the mean value estimated in a moving window.
Hysteresis threshold method
Kanaa et al(2003)method
Laplace of Gaussian(LoG) operators
Change et al(1996)Chen et al(1997)
operators
Edge detection with wavelets method
Liu et al(1997)Wu and Liu(2003)
Hidden Markov Chain model
Mercier et al(2003)
Fuzzy classification Barm et al(1995) Fuzzy C-means algorithm
Mathematical morphology
Gasull et al(2002)
Level Set method Huang et al(2005)
2013‐11‐11 25
g ( )
Oil spills segmentation method
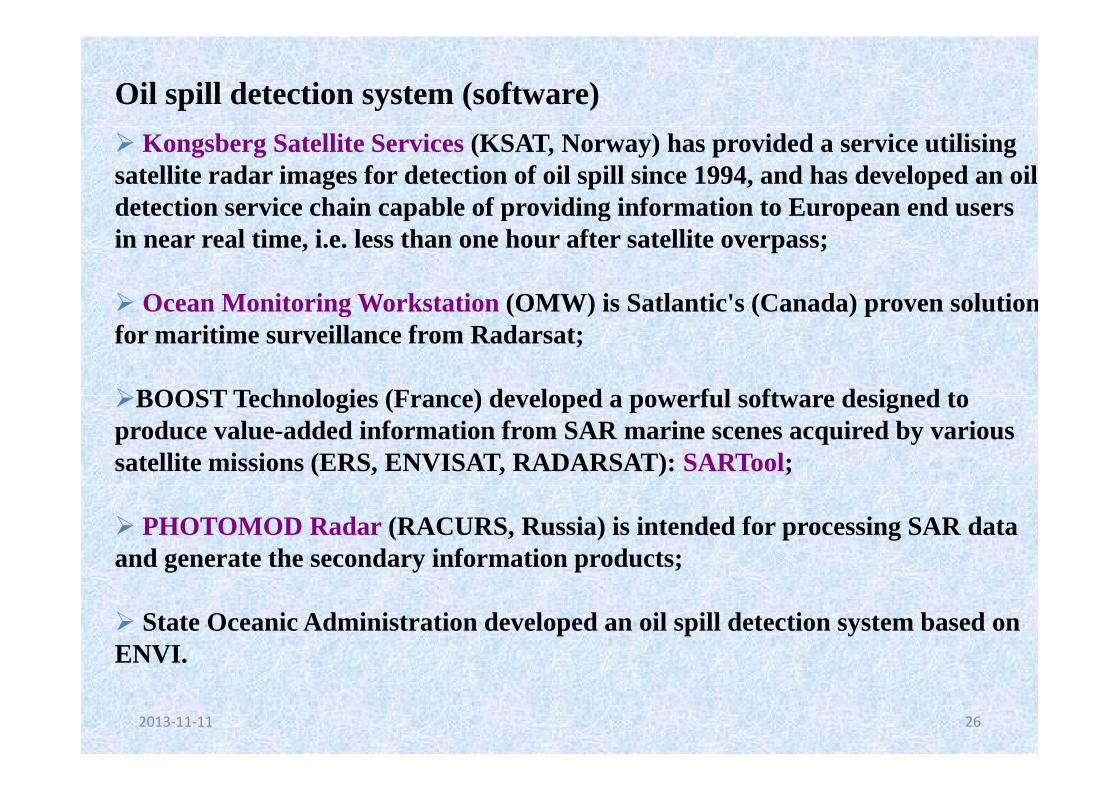
Oil spill detection system (software)Kongsberg Satellite Services (KSAT, Norway) has provided a service utilising
satellite radar images for detection of oil spill since 1994, and has developed an oil detection service chain capable of providing information to European end users p p g pin near real time, i.e. less than one hour after satellite overpass;
Ocean Monitoring Workstation (OMW) is Satlantic's (Canada) proven solutionOcean Monitoring Workstation (OMW) is Satlantic s (Canada) proven solutionfor maritime surveillance from Radarsat;
BOOST Technologies (France) developed a powerful software designed toBOOST Technologies (France) developed a powerful software designed to produce value-added information from SAR marine scenes acquired by various satellite missions (ERS, ENVISAT, RADARSAT): SARTool;
PHOTOMOD Radar (RACURS, Russia) is intended for processing SAR data and generate the secondary information products;
State Oceanic Administration developed an oil spill detection system based on ENVI.
2013‐11‐11 26
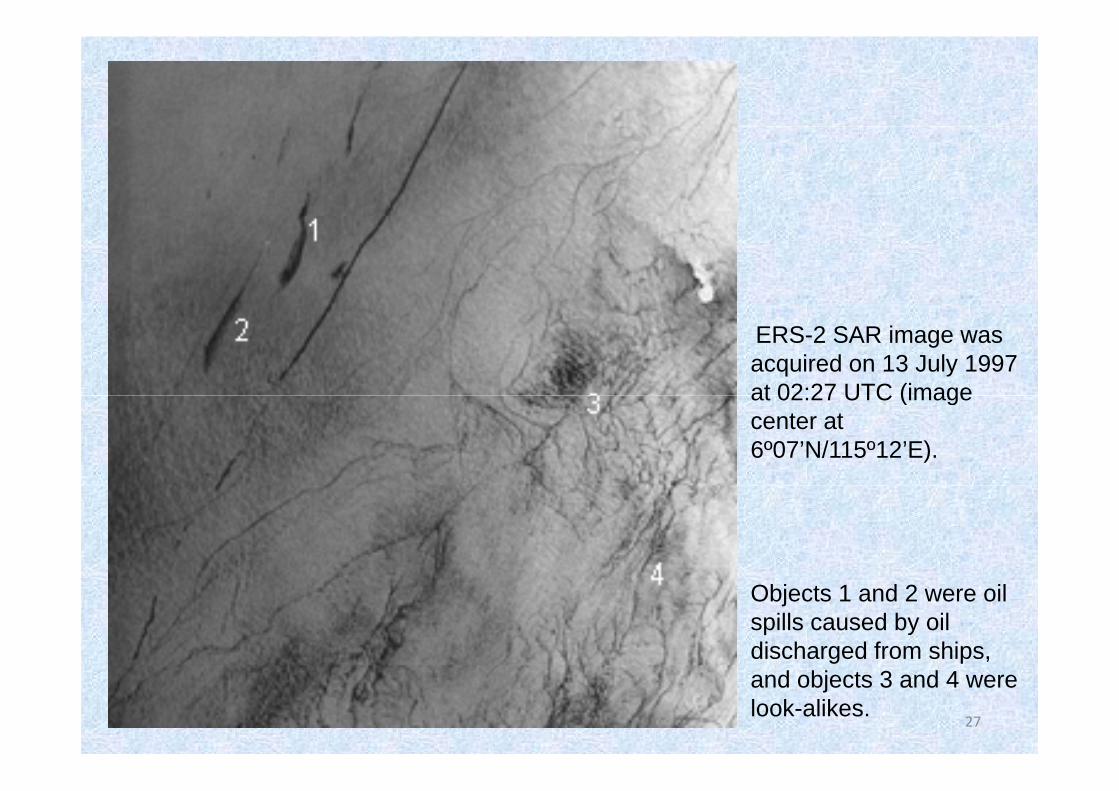
ERS-2 SAR image was acquired on 13 July 1997 at 02:27 UTC (imageat 02:27 UTC (image center at 6º07’N/115º12’E).
Objects 1 and 2 were oil spills caused by oil discharged from ships,
2013‐11‐11 27
and objects 3 and 4 were look-alikes.
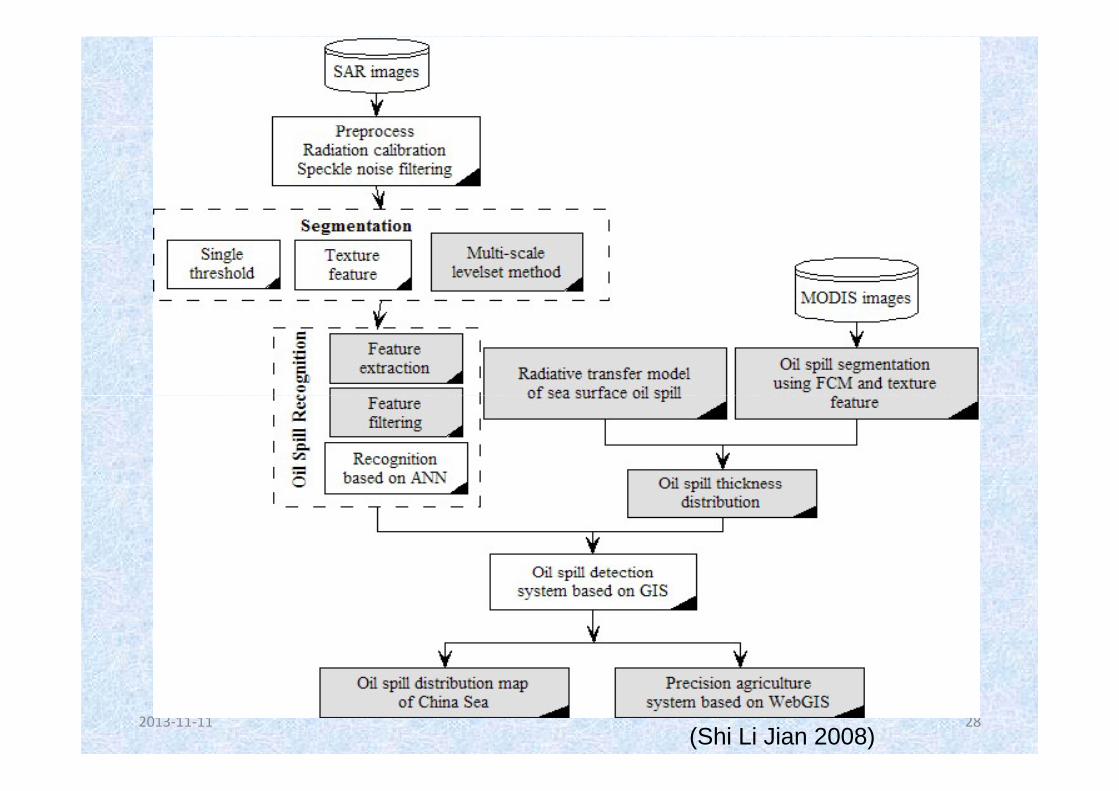
2013‐11‐11 28(Shi Li Jian 2008)
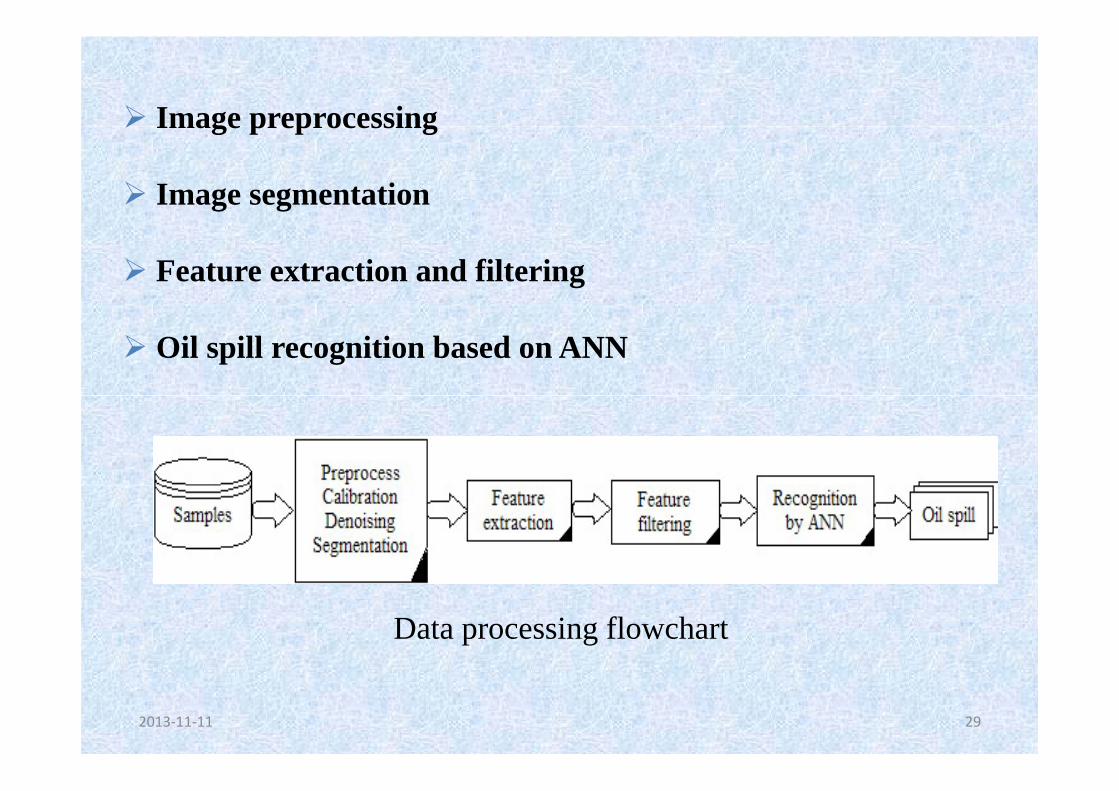
Image preprocessingImage preprocessing
Image segmentation
Feature extraction and filtering
Oil spill recognition based on ANN
Data processing flowchart
2013‐11‐11 29
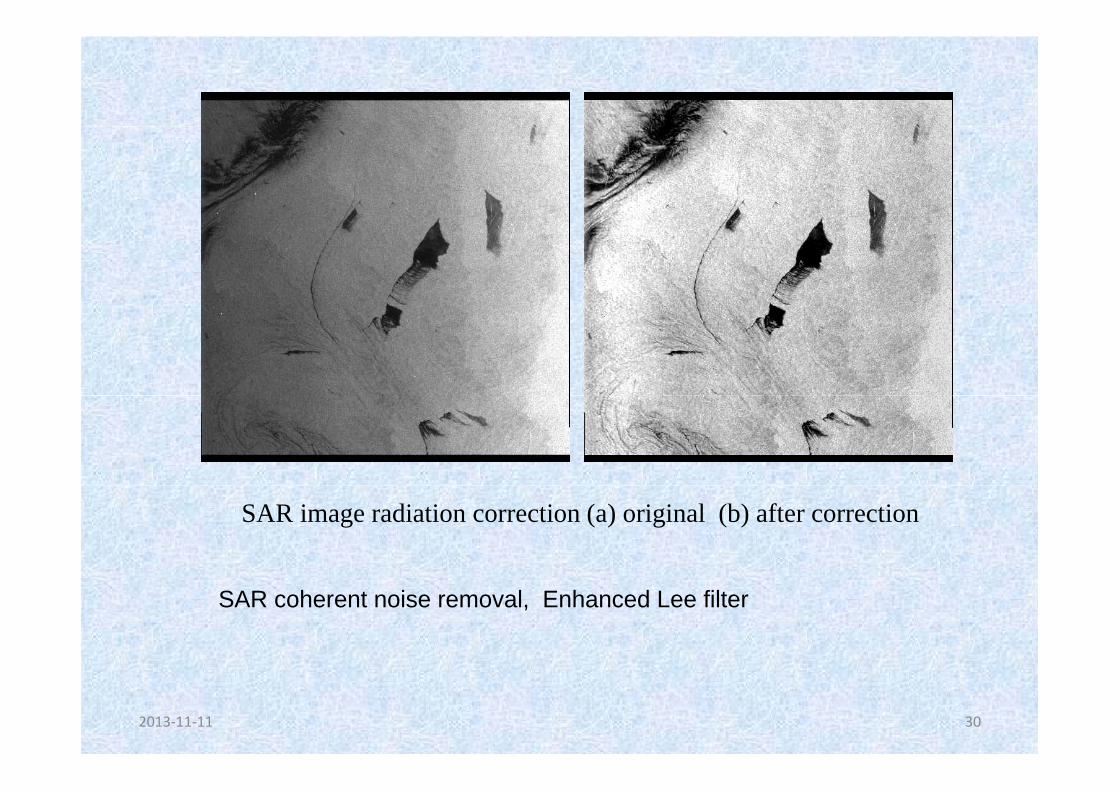
SAR image radiation correction (a) original (b) after correction
SAR coherent noise removal, Enhanced Lee filter
2013‐11‐11 30
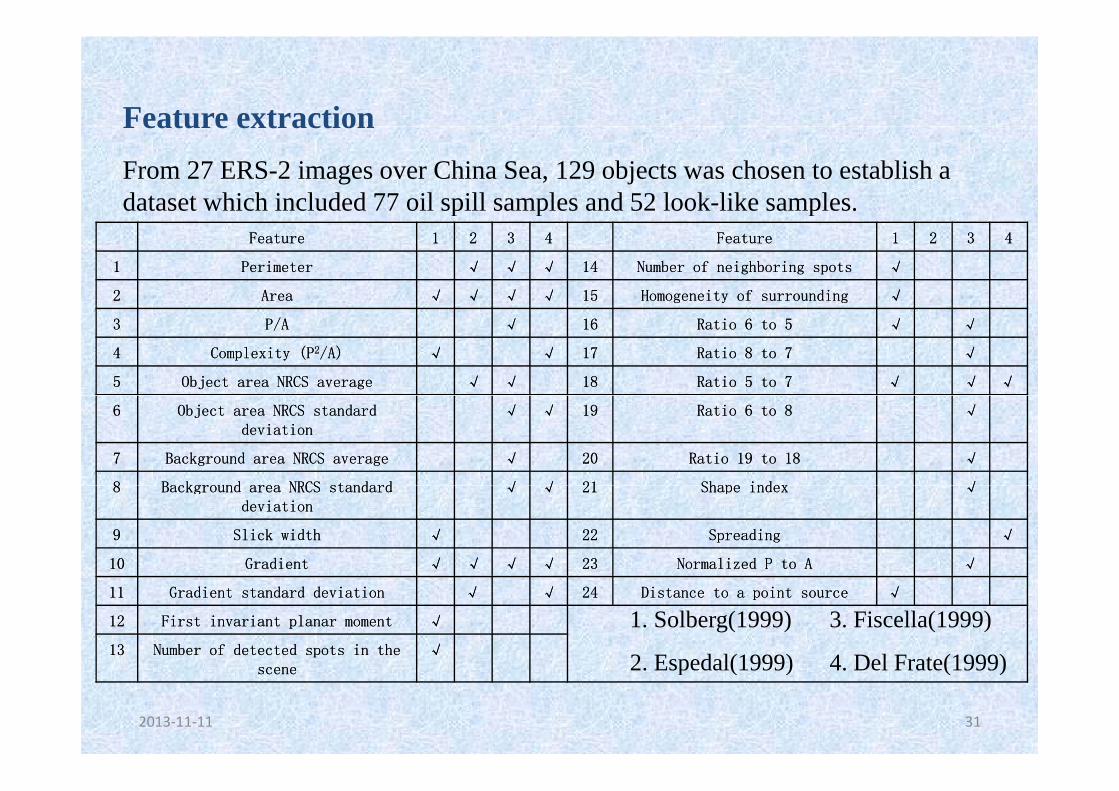
Feature extractionFeature extractionFrom 27 ERS-2 images over China Sea, 129 objects was chosen to establish a dataset which included 77 oil spill samples and 52 look-like samples.
FeatureFeature 11 22 33 44 FeatureFeature 11 22 33 44
11 PerimeterPerimeter √√ √√ √√ 1414 Number of neighboring spotsNumber of neighboring spots √√
22 AreaArea √√ √√ √√ √√ 1515 Homogeneity of surroundingHomogeneity of surrounding √√
p p p
33 P/AP/A √√ 1616 Ratio 6 to 5Ratio 6 to 5 √√ √√
44 Complexity (PComplexity (P22/A)/A) √√ √√ 1717 Ratio 8 to 7Ratio 8 to 7 √√
55 Object area NRCS averageObject area NRCS average √√ √√ 1818 Ratio 5 to 7Ratio 5 to 7 √√ √√ √√
66 Object area NRCS standard Object area NRCS standard deviationdeviation
√√ √√ 1919 Ratio 6 to 8Ratio 6 to 8 √√
77 Background area NRCS averageBackground area NRCS average √√ 2020 Ratio 19 to 18Ratio 19 to 18 √√
88 Background area NRCS standardBackground area NRCS standard √√ √√ 2121 Shape indexShape index √√88 Background area NRCS standard Background area NRCS standard deviationdeviation
√√ √√ 2121 Shape indexShape index √√
99 Slick widthSlick width √√ 2222 SpreadingSpreading √√
1010 GradientGradient √√ √√ √√ √√ 2323 Normalized P to ANormalized P to A √√
1111 Gradient standard deviation Gradient standard deviation √√ √√ 2424 Distance to a point sourceDistance to a point source √√
1212 First invariant planar momentFirst invariant planar moment √√
1313 Number of detected spots in the Number of detected spots in the √√
1. Solberg(1999)
2 Espedal(1999)
3. Fiscella(1999)
4 Del Frate(1999)
2013‐11‐11 31
scenescene 2. Espedal(1999) 4. Del Frate(1999)
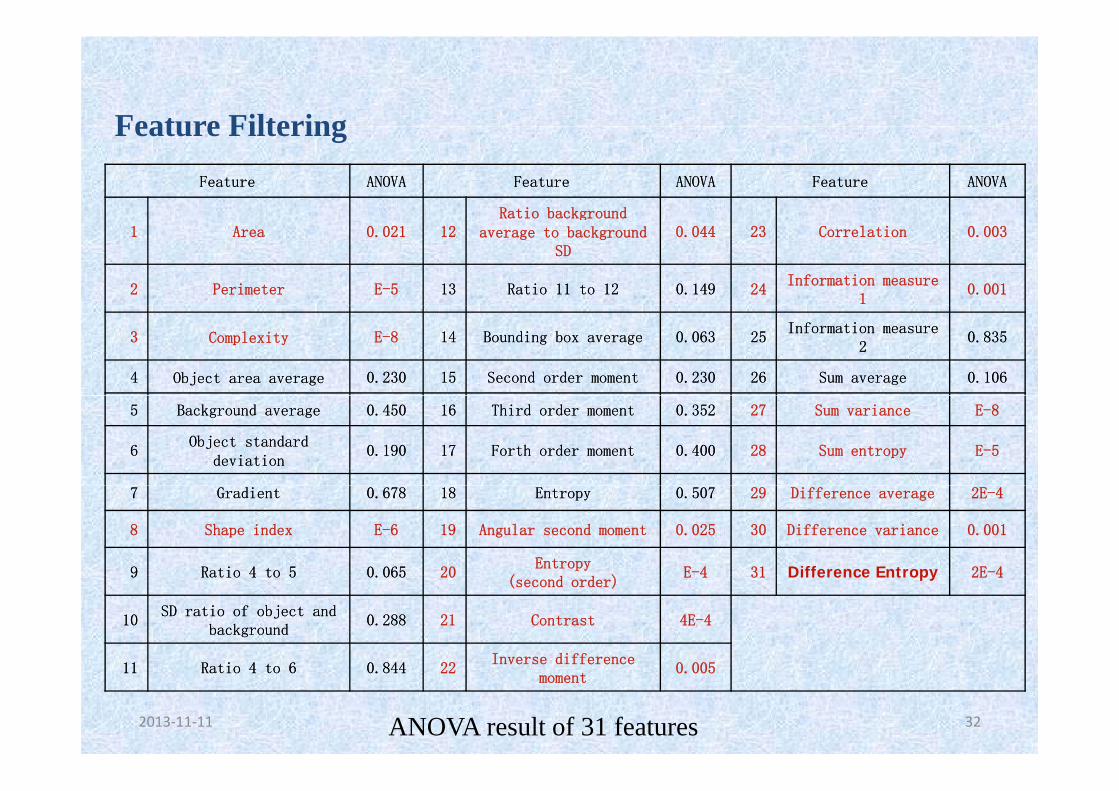
Feature FilteringFeature FilteringFeatureFeature ANOVAANOVA FeatureFeature ANOVAANOVA FeatureFeature ANOVAANOVA
Ratio background1 Area 0.021 12
Ratio background average to background
SD0.044 23 Correlation 0.003
2 Perimeter E-5 1313 Ratio 11 to 12Ratio 11 to 12 0.1490.149 24Information measure
10.001
3 Complexity E-8 1414 Bounding box averageBounding box average 0.0630.063 2525Information measure Information measure
220.8350.835
44 Object area averageObject area average 0.2300.230 1515 Second order momentSecond order moment 0.2300.230 2626 Sum averageSum average 0.1060.106
55 Background averageBackground average 0.4500.450 1616 Third order momentThird order moment 0.3520.352 27 Sum variance E-8
66Object standard Object standard
deviationdeviation0.1900.190 1717 Forth order momentForth order moment 0.4000.400 28 Sum entropy E-5
77 GradientGradient 0.6780.678 1818 EntropyEntropy 0.5070.507 29 Difference average 2E-4
8 Shape index E-6 19 Angular second moment 0.025 30 Difference variance 0.001
99 Ratio 4 to 5Ratio 4 to 5 0 0650 065 20Entropy
( )E-4 31 Difference Entropy 2E-499 Ratio 4 to 5Ratio 4 to 5 0.0650.065 20
(second order)E 4 31 Difference Entropy 2E 4
1010SD ratio of object and SD ratio of object and
backgroundbackground0.2880.288 21 Contrast 4E-4
1111 R ti 4 t 6R ti 4 t 6 0 8440 844 22Inverse difference
0 005
2013‐11‐11 32
1111 Ratio 4 to 6Ratio 4 to 6 0.8440.844 22moment
0.005
ANOVA result of 31 features
Oil spill and the look likes classification using neural network
BP(B k P i ) k
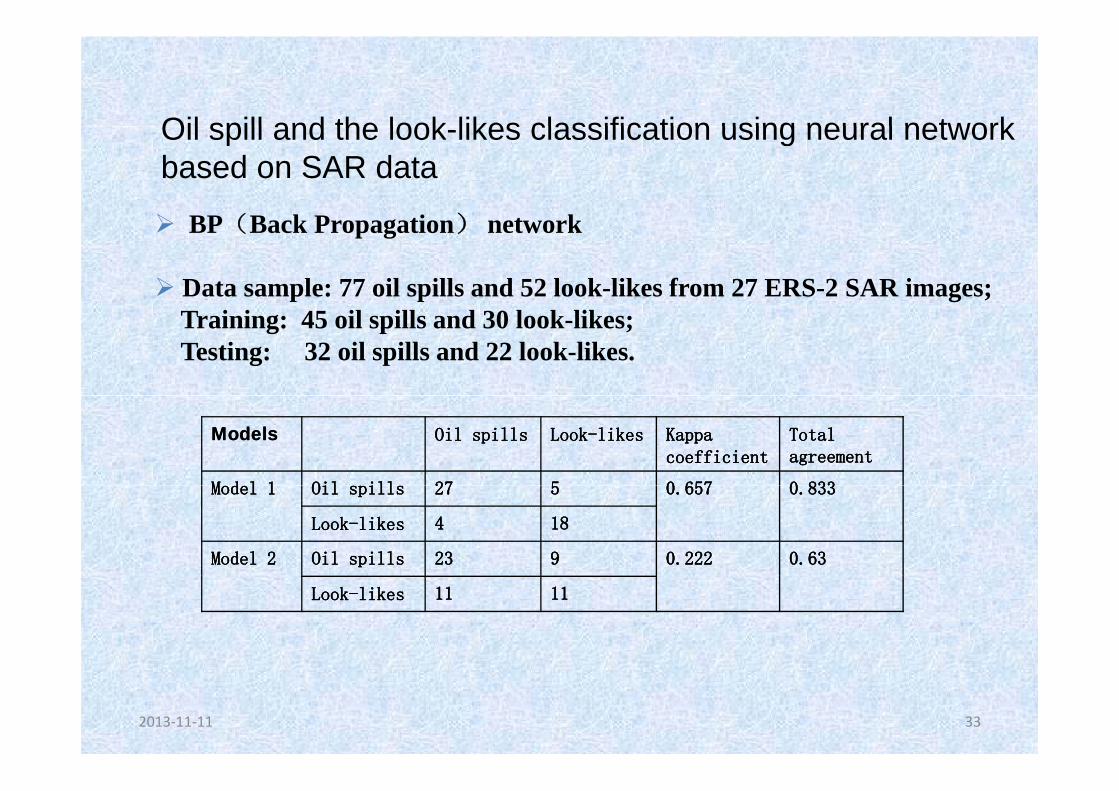
Oil spill and the look-likes classification using neural networkbased on SAR data
BP(Back Propagation) network
Data sample: 77 oil spills and 52 look-likes from 27 ERS-2 SAR images;Training: 45 oil spills and 30 look-likes;Testing: 32 oil spills and 22 look-likes.
ModelsModels Oil spillsOil spills LookLook--likeslikes Kappa Kappa coefficientcoefficient
Total Total agreementagreement
M d l 1M d l 1 Oil illOil ill 2727 55 0 6570 657 0 8330 833Model 1Model 1 Oil spillsOil spills 2727 55 0.6570.657 0.8330.833
LookLook--likeslikes 44 1818
Model 2Model 2 Oil spillsOil spills 2323 99 0.2220.222 0.630.63
LookLook--likeslikes 1111 1111
2013‐11‐11 33
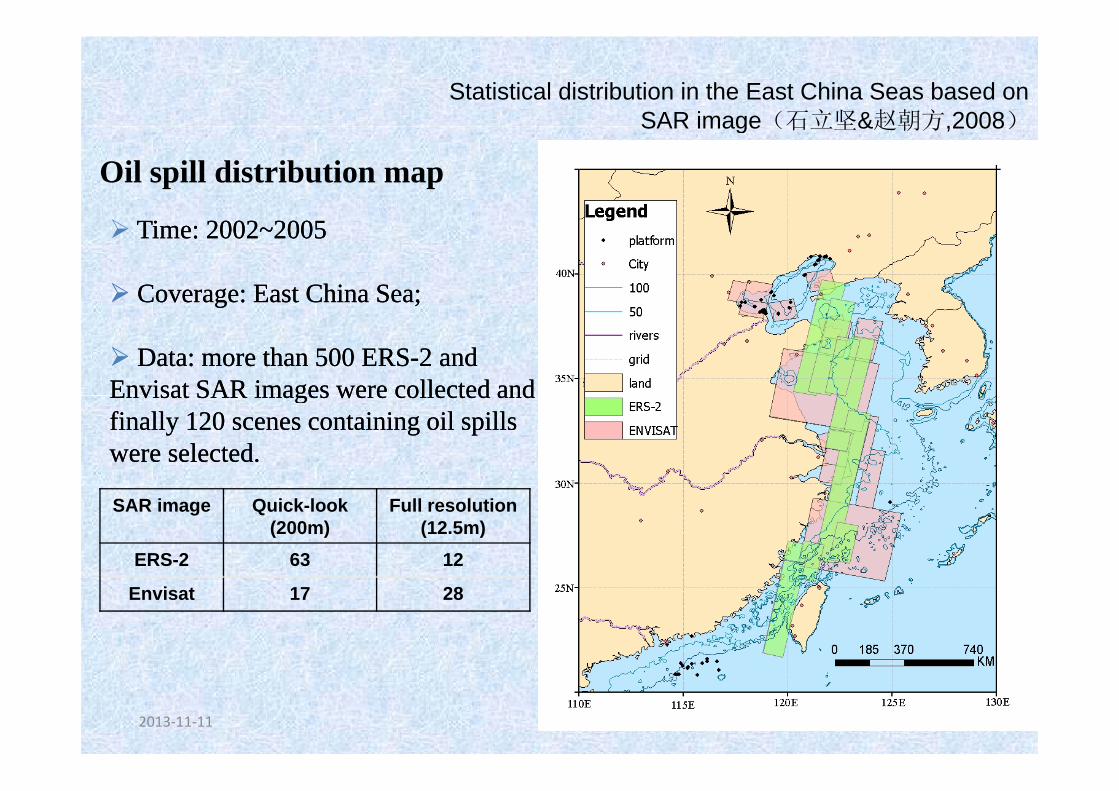
Statistical distribution in the East China Seas based on SAR image(石立坚&赵朝方,2008)
Oil spill distribution map
SAR image(石立坚&赵朝方,2008)
Time: 2002~2005Time: 2002~2005
Coverage: East China Sea;Coverage: East China Sea;g ;g ;
Data: more than 500 ERSData: more than 500 ERS--2 and 2 and Envisat SAR images were collected andEnvisat SAR images were collected andEnvisat SAR images were collected and Envisat SAR images were collected and finally 120 scenes containing oil spills finally 120 scenes containing oil spills were selected.were selected.
SAR image Quick-look(200m)
Full resolution(12.5m)
ERS-2 63 12
Envisat 17 28
2013‐11‐11 34
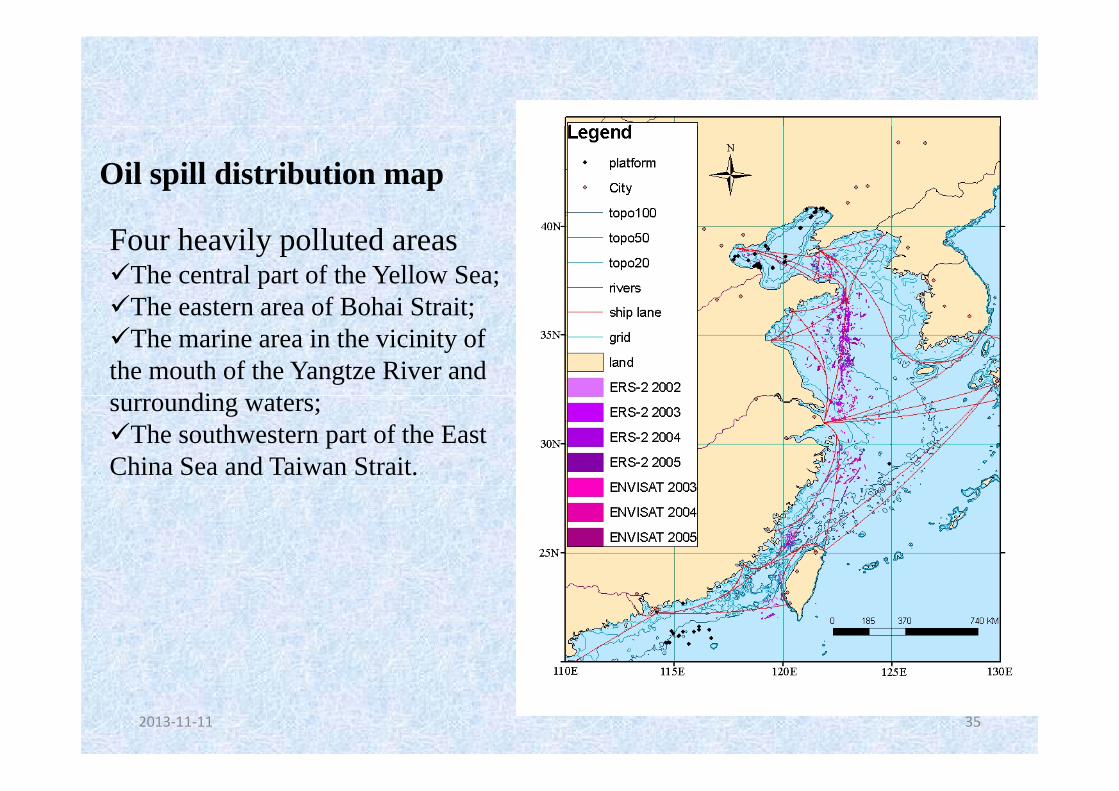
Oil spill distribution map
Four heavily polluted areasThe central part of the Yellow Sea;The eastern area of Bohai Strait;The eastern area of Bohai Strait; The marine area in the vicinity of
the mouth of the Yangtze River and di tsurrounding waters;
The southwestern part of the East China Sea and Taiwan Strait.
2013‐11‐11 35
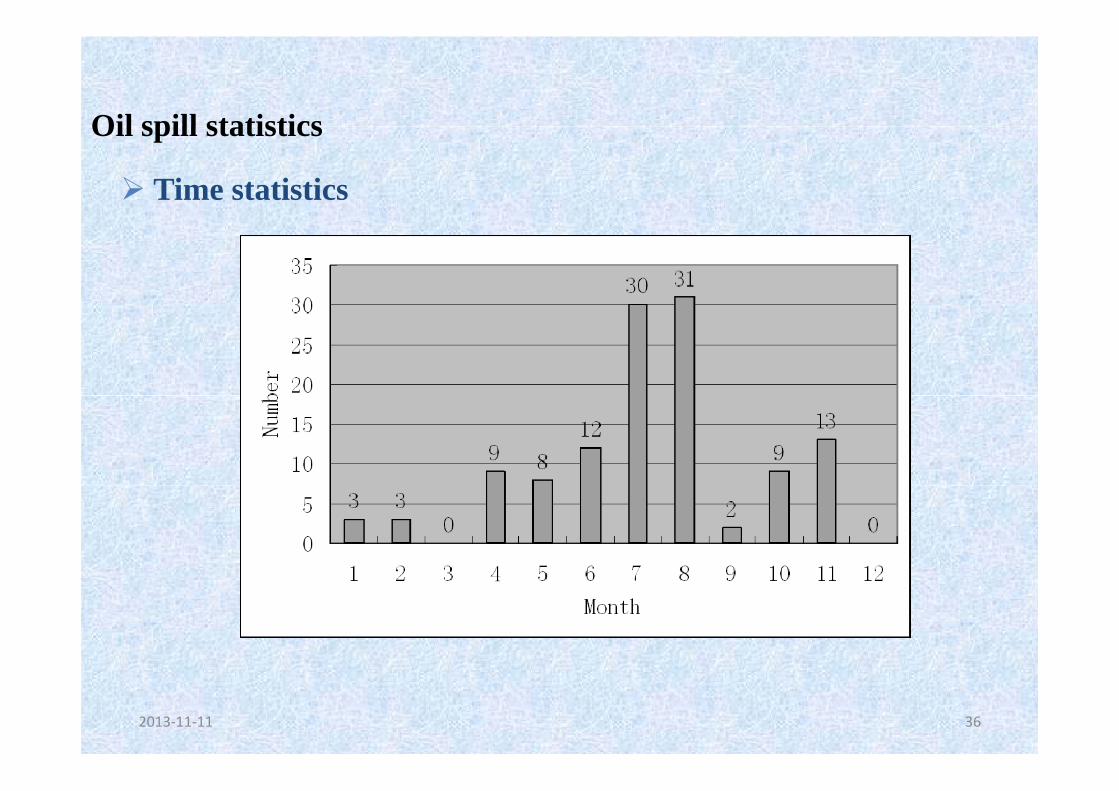
Oil spill statisticsOil spill statistics
Time statistics
2013‐11‐11 36
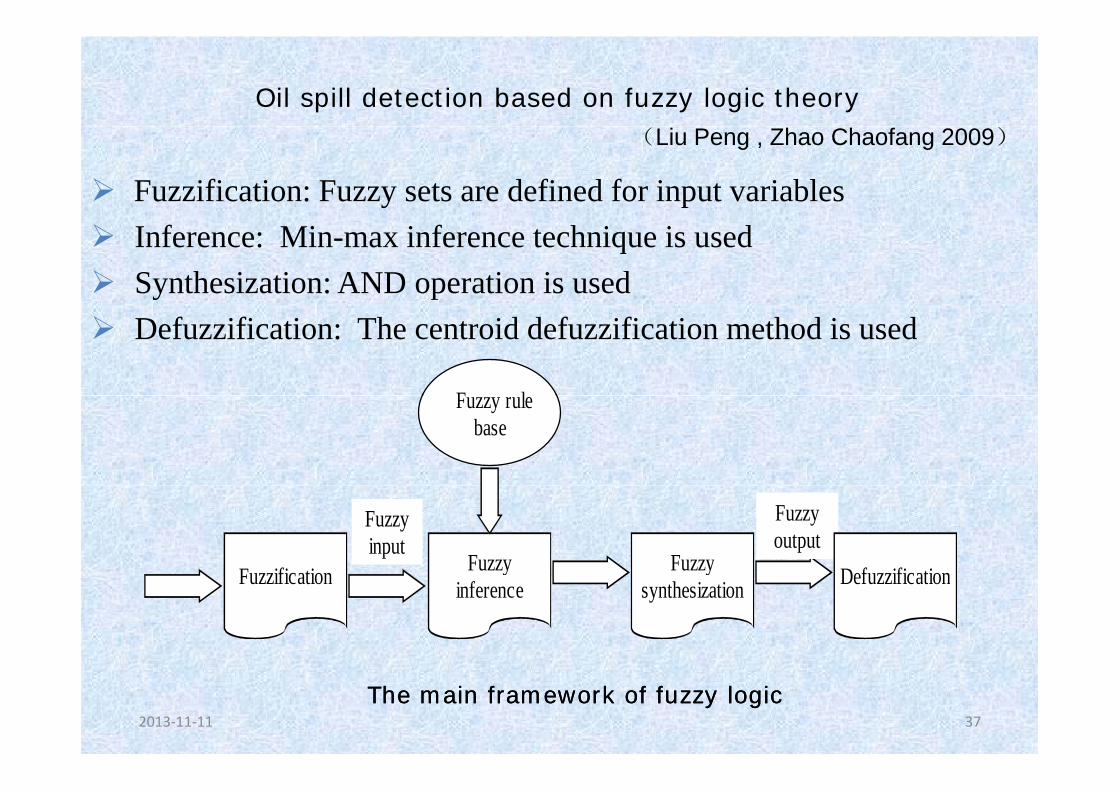
Oil spill detection based on fuzzy logic theory
Fuzzification: Fuzzy sets are defined for input variables
(Liu Peng , Zhao Chaofang 2009)
Inference: Min-max inference technique is usedSynthesization: AND operation is used
F l
Defuzzification: The centroid defuzzification method is used
Fuzzy rulebase
Fuzzification Fuzzy
Fuzzyinput
Fuzzy
Fuzzyoutput
DefuzzificationFuzzification yinference
ysynthesization Defuzzification
2013‐11‐11 37
The main framework of fuzzy logicThe main framework of fuzzy logic
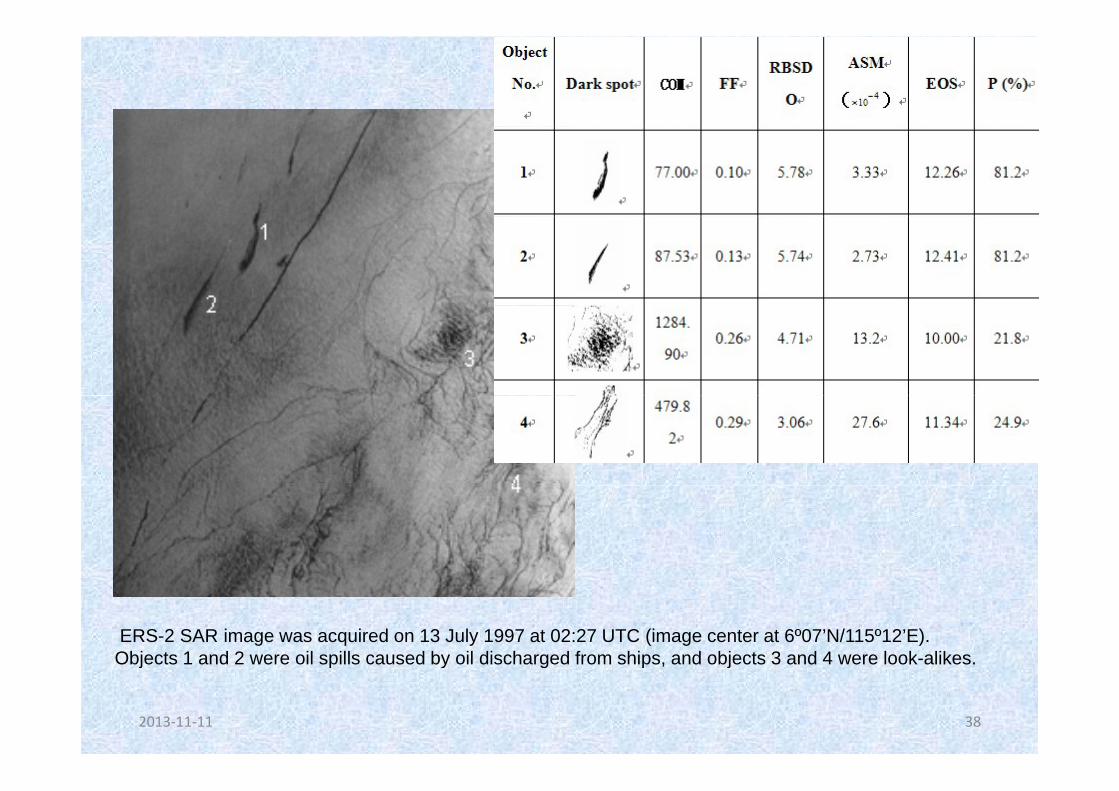
ERS-2 SAR image was acquired on 13 July 1997 at 02:27 UTC (image center at 6º07’N/115º12’E).Objects 1 and 2 were oil spills caused by oil discharged from ships, and objects 3 and 4 were look-alikes.
2013‐11‐11 38
j p y g p , j
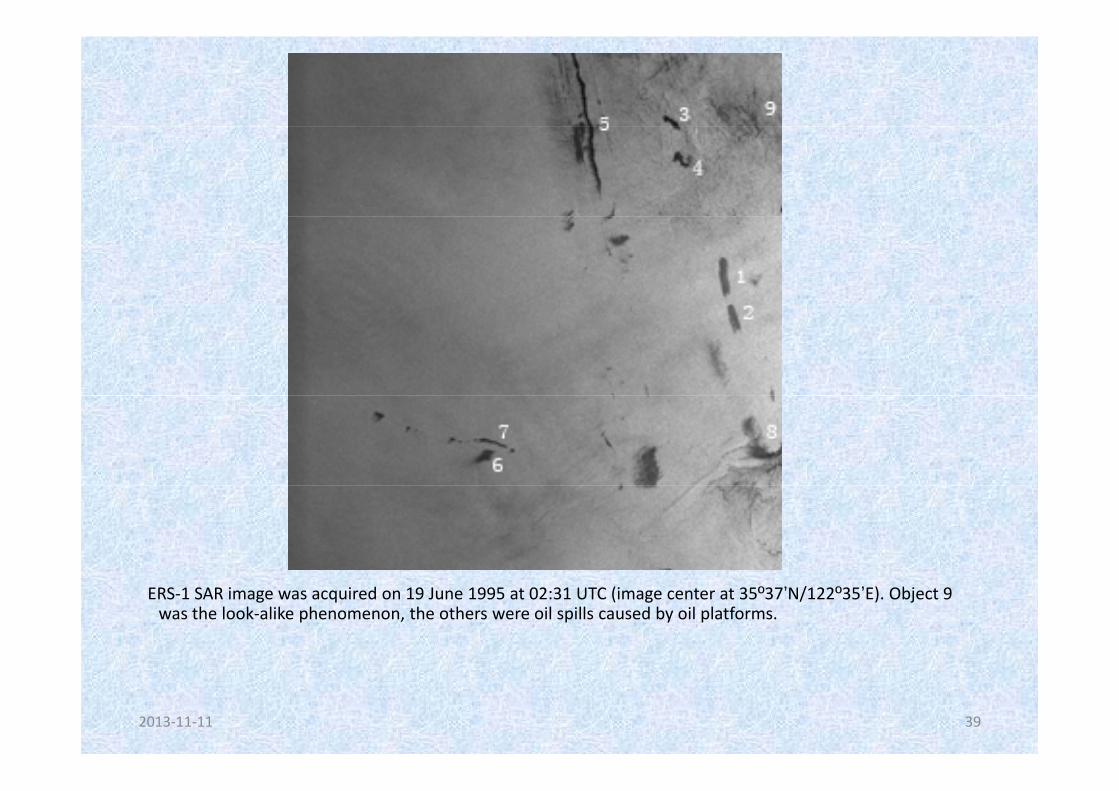
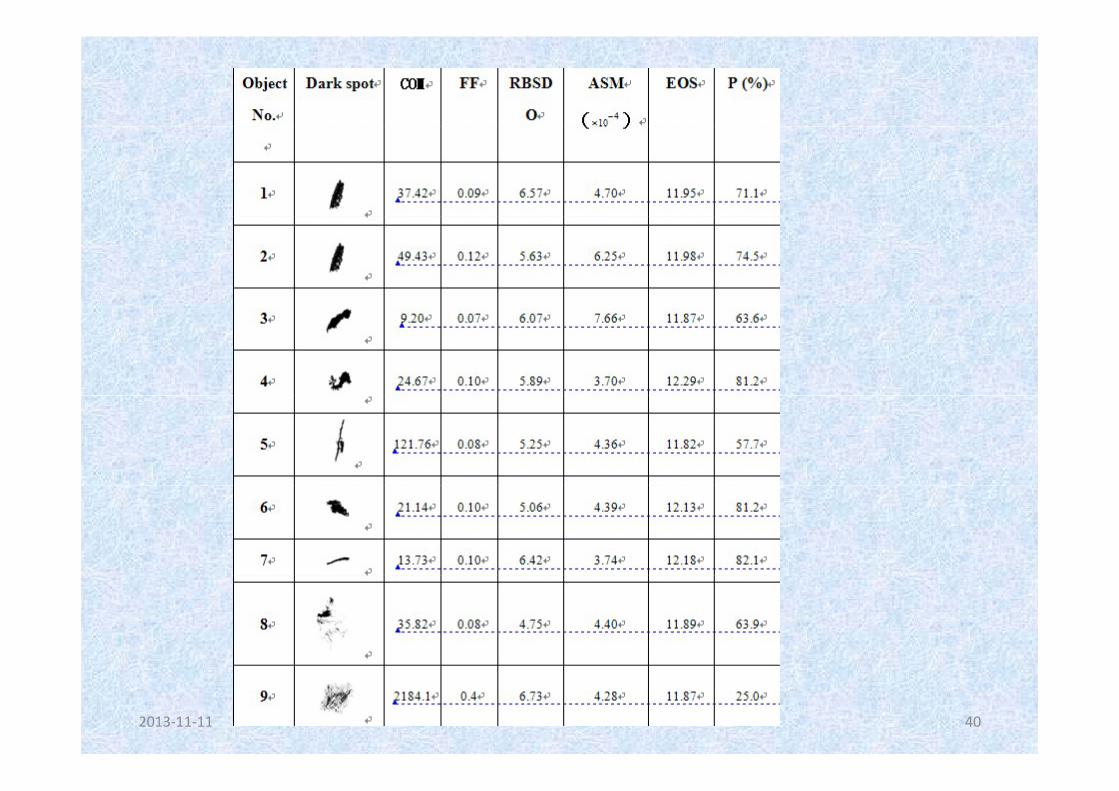
ERS‐1 SAR image was acquired on 19 June 1995 at 02:31 UTC (image center at 35º37’N/122º35’E). Object 9 was the look‐alike phenomenon, the others were oil spills caused by oil platforms.
2013‐11‐11 39
2013‐11‐11 40
The related papersThe related papers::Oil Spill Mapping in the Yellow Sea and East China Sea Using Synthetic Aperture Radar Imagery,International Journal of Remote Sensing by Lijian Shi, Andrei Yu. Ivanov, Mingxia HE and Chaofang Zhao, 2008
Texture feature application in oil spill detection by satellite data, 2008 Congress on Image and Signal Processing(EI) by Lijian Shi, Chaofang Zhao, 2008
基于SAR图像组合特征的海面溢油识别 刘朋 赵朝方 石立坚 2008 仪器仪表学报基于SAR图像组合特征的海面溢油识别,刘朋,赵朝方,石立坚,2008,仪器仪表学报,29(4),747-752
基于纹理分析和人工神经网络的SAR图像中海面溢油识别方法,石立坚,赵朝方,中国海洋大学学报 2009洋大学学报,2009。
基于模糊理论的SAR图像海面油膜识别,李丹,赵朝方,刘朋,海洋湖沼通报,2010。
Identification of ocean oil spills in SAR imagery based on fuzzy logic algorithm,Int, J. Remote Sensing(SCI)by Peng Liu, Chaofang Zhao ,Xiaofeng Li ,and Mingxia He, 2010
Peng Liu Xiaofeng Li John Qu Wenguang Wang Chaofang Zhao and William Pichel 2011Peng Liu, Xiaofeng Li,John Qu, Wenguang Wang , Chaofang Zhao, and William Pichel,2011,Oil spill detection with fully polarimetric UAVSAR data. Mar. Pollut. Bull. (2011), doi:10.1016/j.marpolbul.2011.09.036 (SCI: 2.63)
2013‐11‐11 41
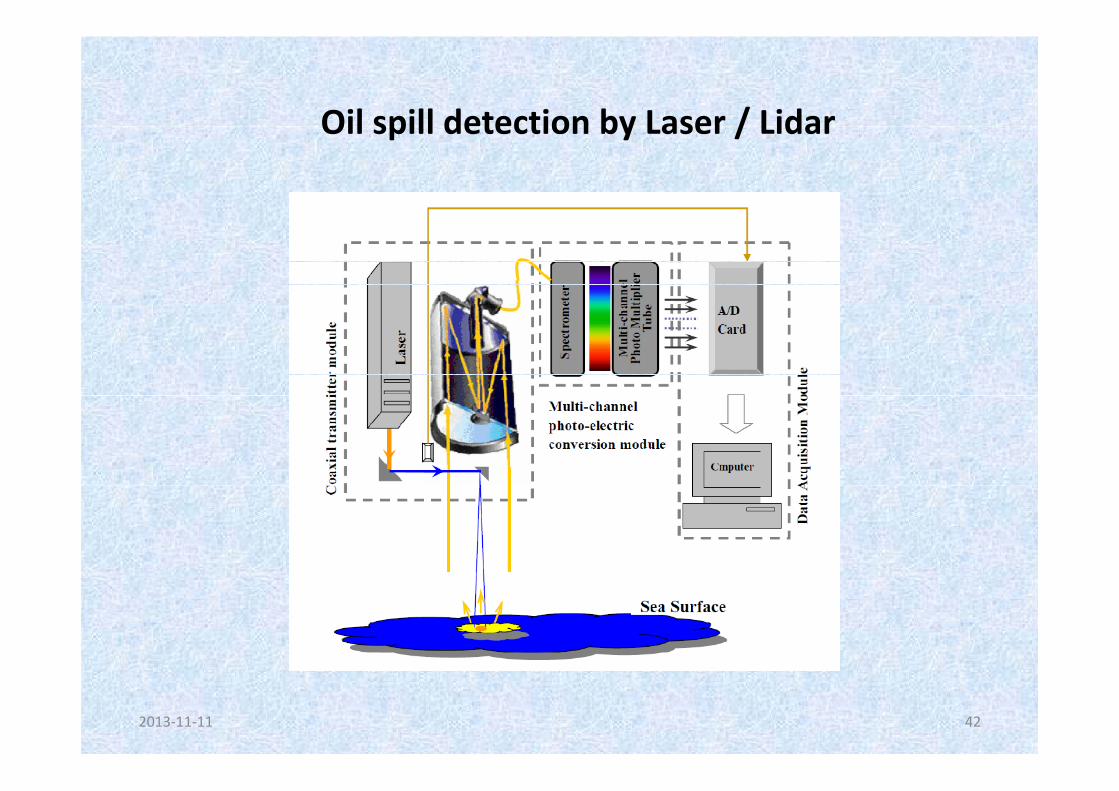
Oil spill detection by Laser / LidarOil spill detection by Laser / Lidar
2013‐11‐11 42
2013‐11‐11 43
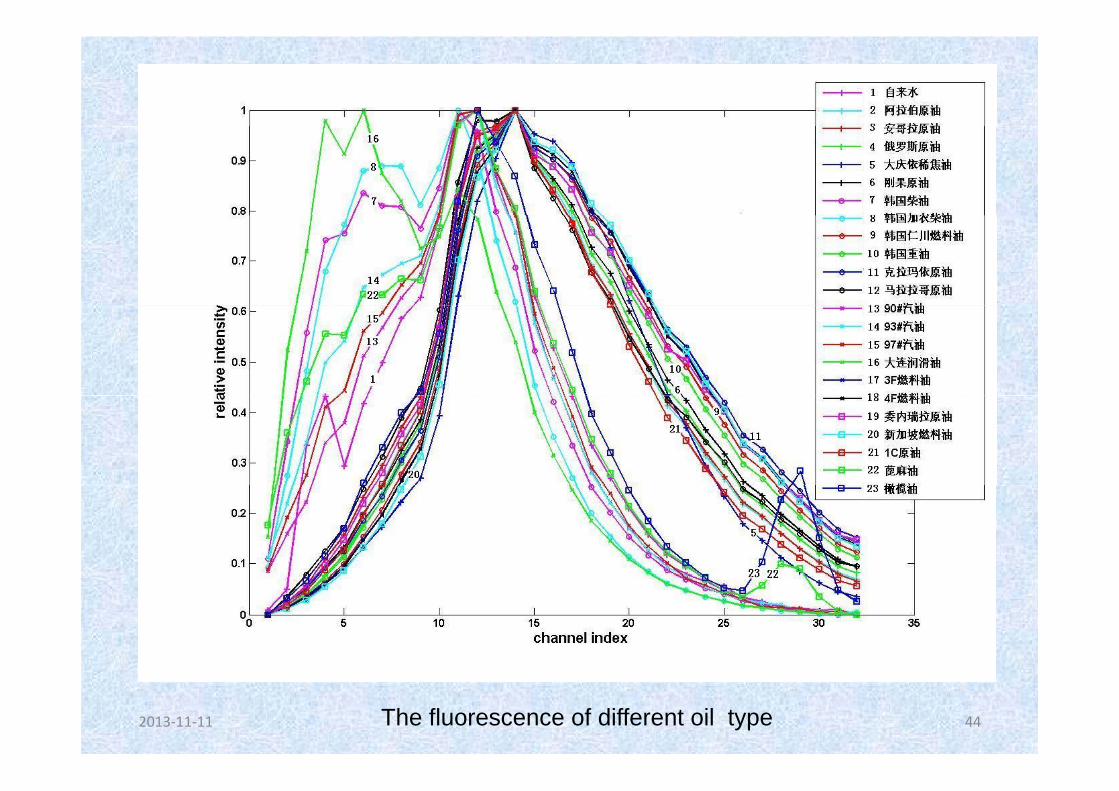
2013‐11‐11 44The fluorescence of different oil type
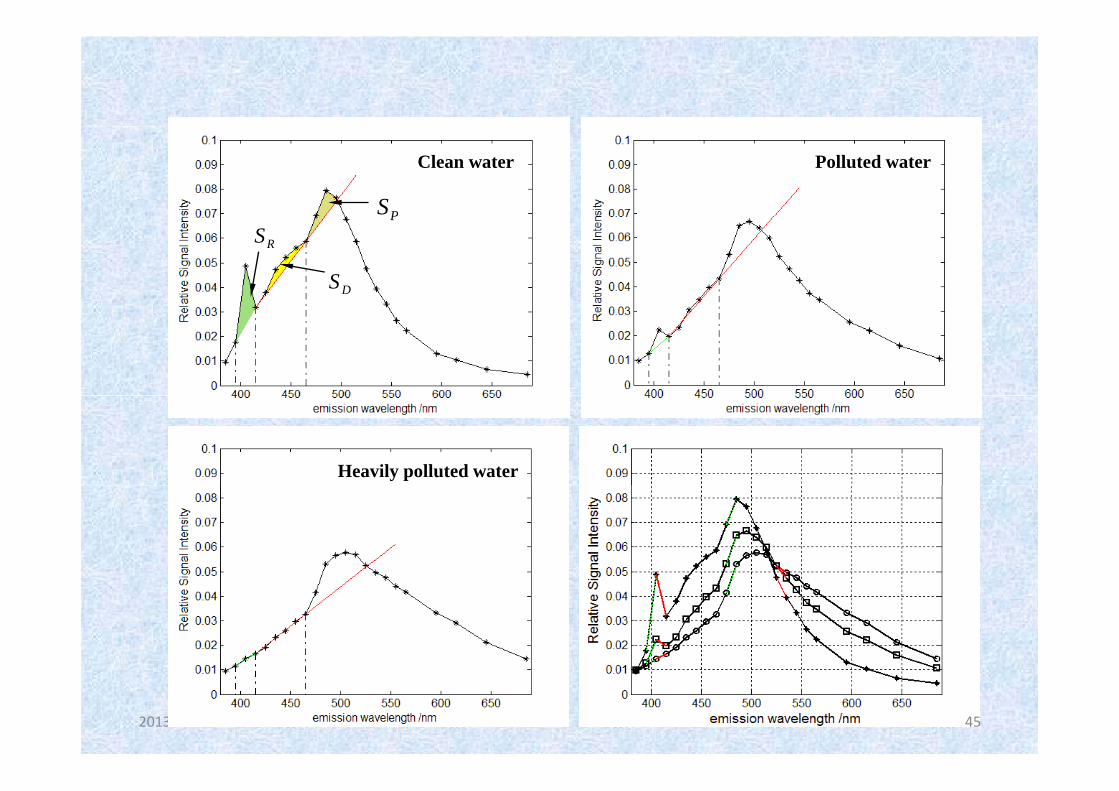
PS
Clean water Polluted water
RS
DS
P
Heavily polluted water
2013‐11‐11 4545
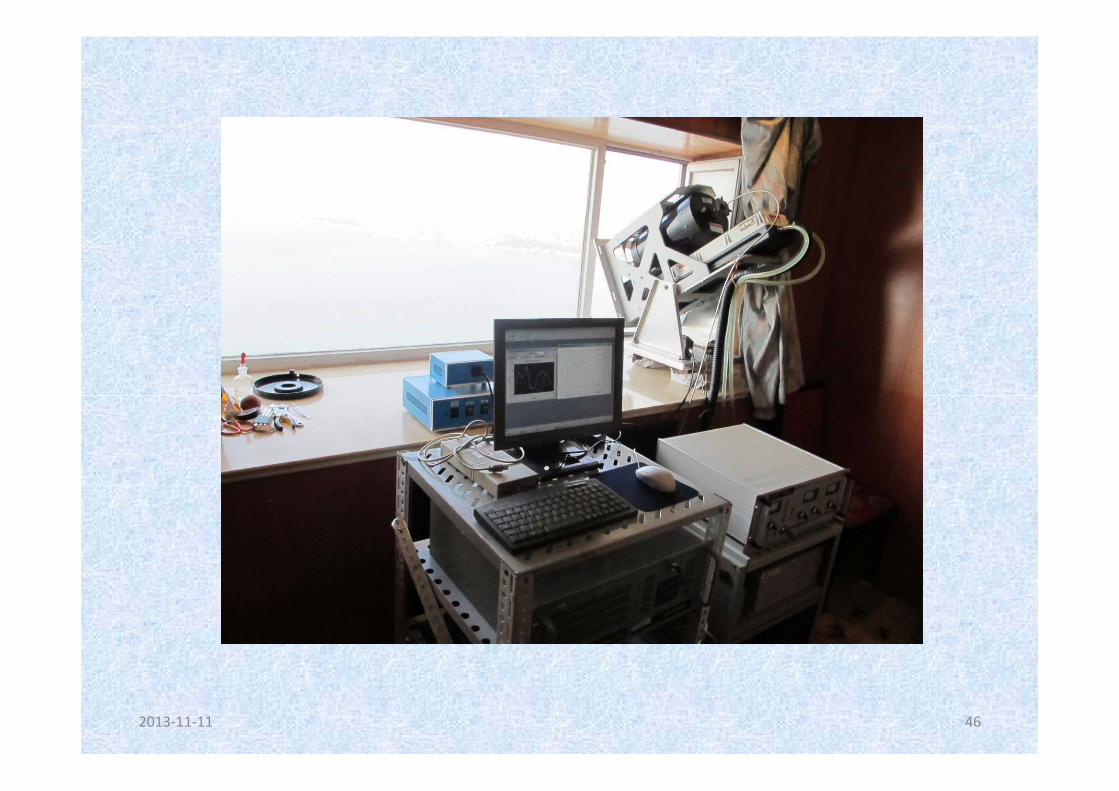
2013‐11‐11 46
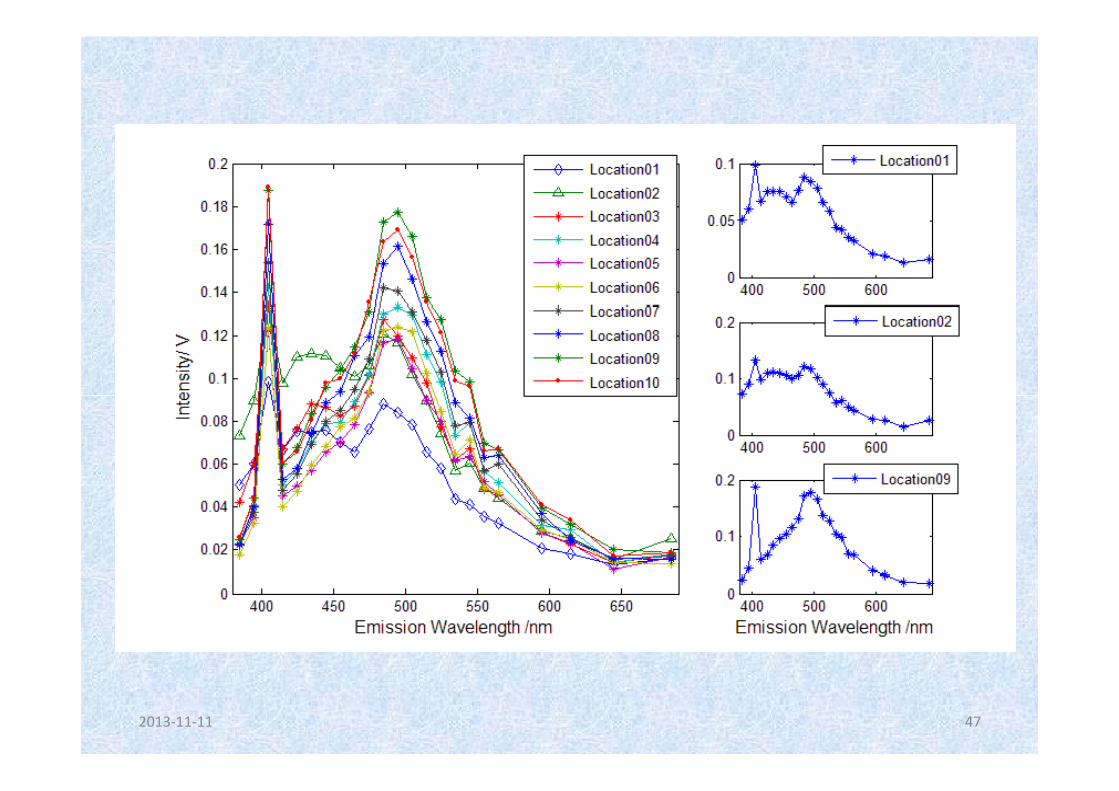
2013‐11‐11 47
Intensityy of Ramm
an Specctra
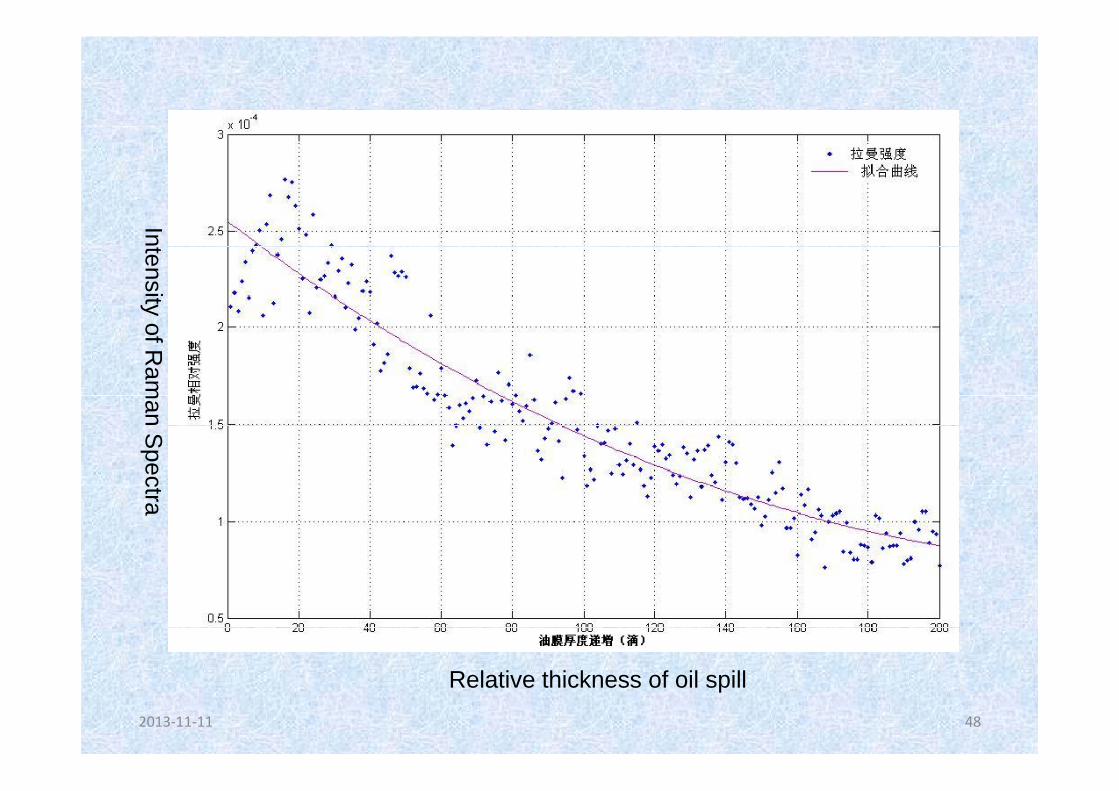
2013‐11‐11 48
Relative thickness of oil spill
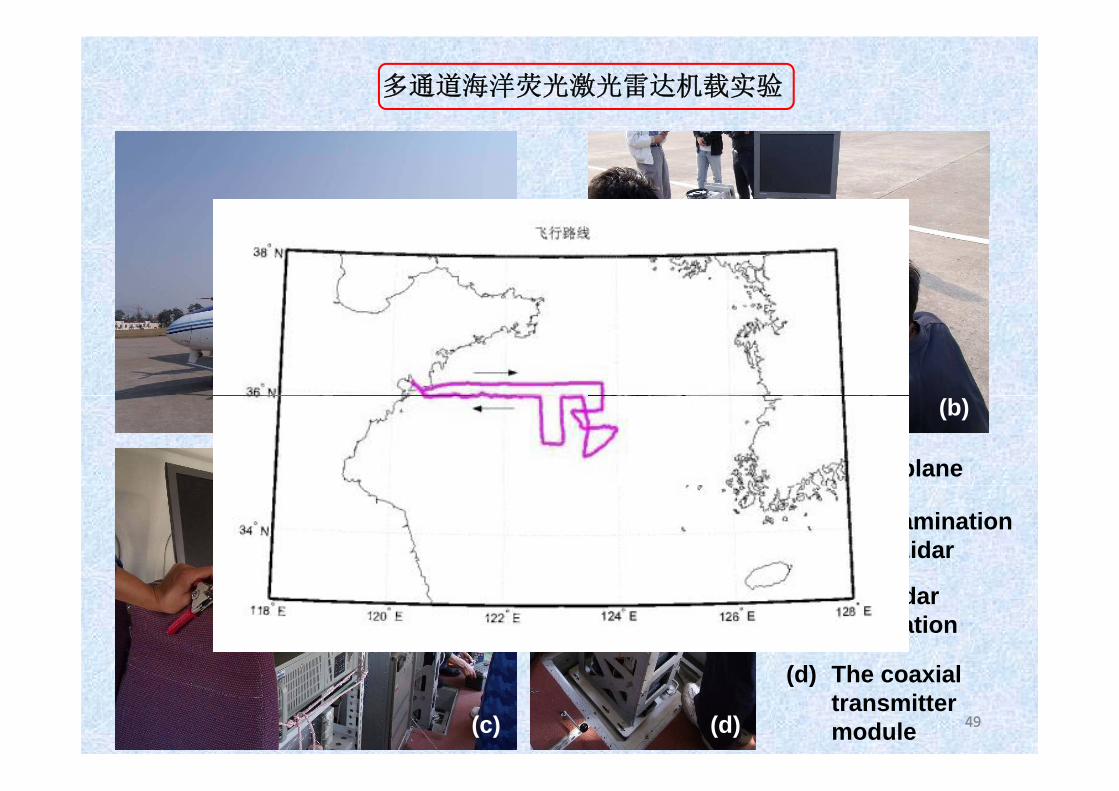
多通道海洋荧光激光雷达机载实验
(b)(a)
(a) The airplane
(b) The examination of the Lidar
(c)
( )
The Lidar Installation
2013‐11‐11 49(c) (d)
(d) The coaxial transmitter module 49
The related published papers:
刘智深,丁宁,赵朝方等. 主成分分析法在油荧光光谱波段选择中的应 用 [J]. 地理空间信息 2009 7(3) 12 15
The related published papers:
空间信息,2009,7(3):12-15
齐敏珺,赵朝方,马佑军等. 机载激光荧光雷达油污染实时监测系统的软件开发[J]. 计算机测量与控制,2010,18(7):1676-1679.
李晓龙,赵朝方,齐敏珺等. 多通道海洋激光雷达溢油监测系统高台实验分析[J].中国海洋大学学报(自然科学版),2010,8(40):145-150.
赵朝方 李晓龙 马佑军 多通道海洋荧光雷达溢油监测系统 红外与激赵朝方,李晓龙,马佑军,2011,多通道海洋荧光雷达溢油监测系统,红外与激光工程,40(7),1263-126
Li Xiaolong et al (2013), The fluorescence of oil spill detected by lidar and its in situg ( ), p yexperiments, JOUC
2013‐11‐11 50
RemarksTh b i f i b t il ill it i i ltiThe brief summaries about oil spill monitoring using multi-sensors carried out in Ocean remote sensing institute, Ocean University of China are introduced. Many problems are still needed to be resolved:
1, Optical sensoroptical features of oil spills show quite different. The
theoretical explanations are still needed to be confirmed Sun glittertheoretical explanations are still needed to be confirmed. Sun glitter, reflectance ratio?
Oil spill thickness?
2, SAR data
oil spill and the look likes classification? Automatically?h t ki d i f ti b t i d f lti l i tiwhat kind information can be retrieved from multi-polarization
SAR data?
3 Lidar detection3, Lidar detection
oil type classification for main 4 to 5 types seems no problems at present time. The possibilities for oil thickness? It is very
2013‐11‐11 51
difficult to measure the thickness of oil spill at the laboratory at the present time.

Thank you for your attentions!.
2013‐11‐11 52